ca cf consumer credit overview in europe in 2015 · austria 20 netherlands 500 1 500 2 500 3 500...
TRANSCRIPT
Overview of the consumer credit marketin Europe in 2015For the ninth consecutive year, Crédit Agricole Consumer Finance has published its annual study on the state of the consumer credit market in Europe.
www.ca-consumerfinance.com [email protected]
2 | STUDY: CONSUMER CREDIT IN EUROPE 2015
Summary
After a period of decline, though its scope has diminished since 2012, 2015 marks a visible recovery in theEuropean consumer credit market
Consumer loans outstanding in the European Union stood at €1.124 trillion, up 3% over 2014. New loan production is very robust, although a significant portion is simple loan repurchases The market is driven by automotive financing, which is profiting from fair weather on the auto market and
the success of leasing packages
Despite increasing regulatory constraints, the market is shored up by two major growth factors
In 2015, the overall better economy is conducive to jobs and the rise in domestic consumption Banking groups' interest in consumer credit is confirmed: they are effectively repositioning on this market
through aggressive trade and tariff policies
Yet this overall trend masks highly divergent regional and national situations
The good health of the market's "heavyweights" (UK, Germany, France, Spain) is enough to increase European outstandings
The Mediterranean countries, most of which are recovering, are still convalescent Nine EU countries still saw their outstandings decline in 2015
Once again, 2015 shows us that the consumer credit market closely correlates to the health of the real economy

3 | STUDY: CONSUMER CREDIT IN EUROPE 2015
European consumer credit is a mixed marketdominated by the UK
Sources: Central banks, Asterès
329United
Kingdom
225Germany
153France
106Italy 67
Spain 34
Poland
Greece 25
21Belgium
20Austria
20Netherlands
500
1 500
2 500
3 500
4 500
5 500
Top 10 European Union markets outstandingsbillions of €Currencies converted to average exchange rate for 2015
Per c
apita
out
stan
ding
s (€)
The top three consumer credit markets inEurope are the UK, Germany and France
The national markets are diverse in size
For example, the British market is twice aslarge as the French market for acomparable population
Appetite for credit turns out to be highlyvariable from one region or one country to thenext
Per capita outstandings are about €5,000 inthe UK, compared to €900 in Poland (#6market in the EU in size of loans outstanding)
4 | STUDY: CONSUMER CREDIT IN EUROPE 2015
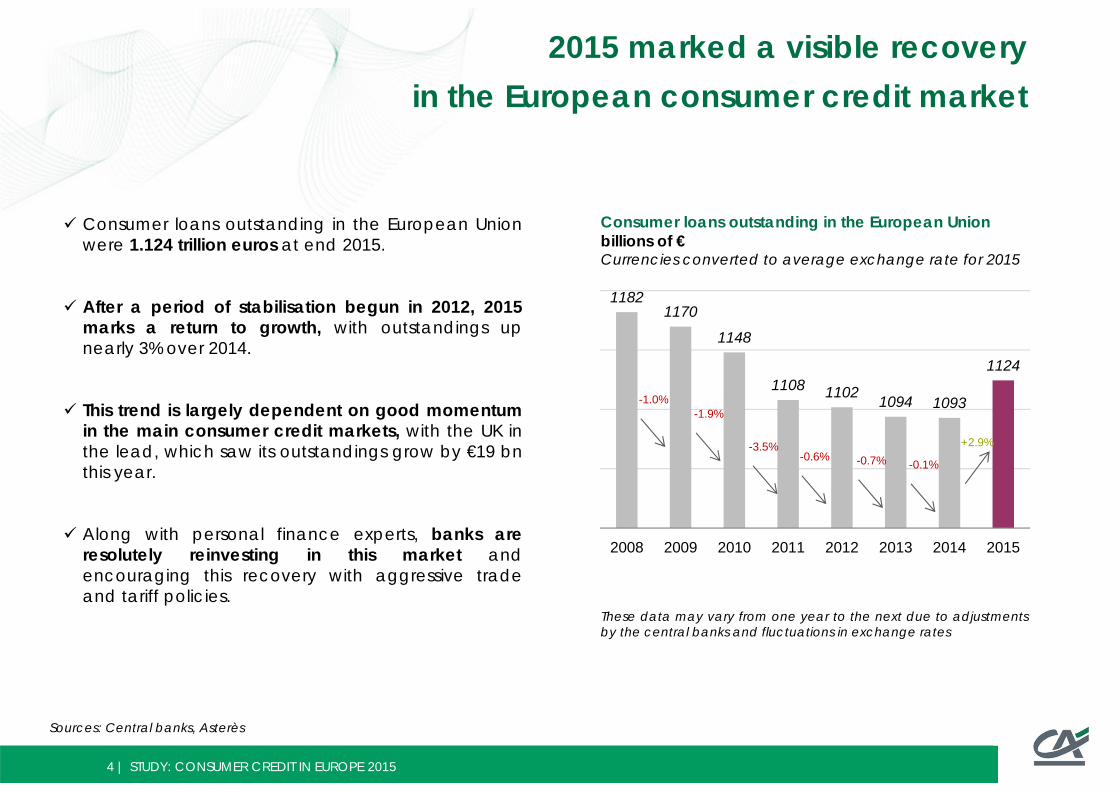
2015 marked a visible recovery in the European consumer credit market
Consumer loans outstanding in the European Unionwere 1.124 trillion euros at end 2015.
After a period of stabilisation begun in 2012, 2015marks a return to growth, with outstandings upnearly 3% over 2014.
This trend is largely dependent on good momentumin the main consumer credit markets, with the UK inthe lead, which saw its outstandings grow by €19 bnthis year.
Along with personal finance experts, banks areresolutely reinvesting in this market andencouraging this recovery with aggressive tradeand tariff policies.
Sources: Central banks, Asterès
Consumer loans outstanding in the European Unionbillions of €Currencies converted to average exchange rate for 2015
These data may vary from one year to the next due to adjustmentsby the central banks and fluctuations in exchange rates
11821170
1148
1108 1102 1094 1093
1124
2008 2009 2010 2011 2012 2013 2014 2015
+2.9%
-1.0%-1.9%
-3.5%-0.6% -0.7% -0.1%
5 | STUDY: CONSUMER CREDIT IN EUROPE 2015
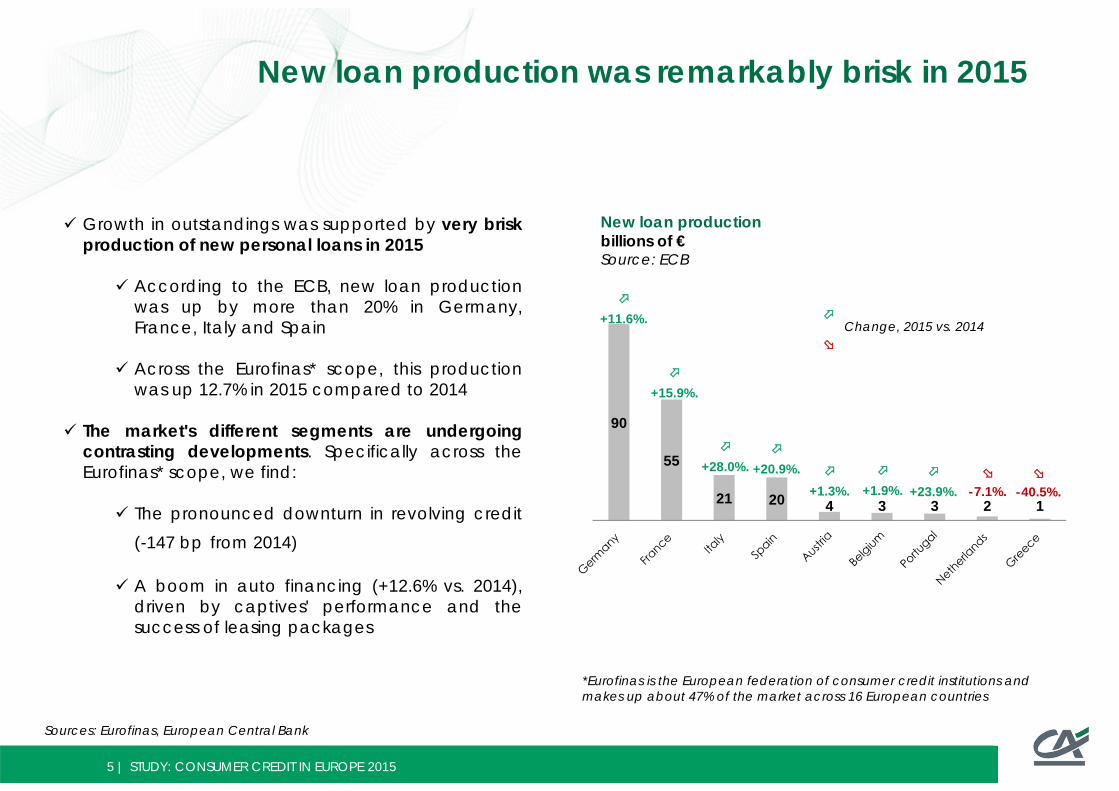
New loan production was remarkably brisk in 2015
Sources: Eurofinas, European Central Bank
Growth in outstandings was supported by very briskproduction of new personal loans in 2015
According to the ECB, new loan productionwas up by more than 20% in Germany,France, Italy and Spain
Across the Eurofinas* scope, this productionwas up 12.7% in 2015 compared to 2014
The market's different segments are undergoingcontrasting developments. Specifically across theEurofinas* scope, we find:
The pronounced downturn in revolving credit(-147 bp from 2014)
A boom in auto financing (+12.6% vs. 2014),driven by captives' performance and thesuccess of leasing packages
New loan productionbillions of €Source: ECB
*Eurofinas is the European federation of consumer credit institutions and makes up about 47% of the market across 16 European countries
90
55
21 20 4 3 3 2 1
+11.6%.
+15.9%.
+28.0%.
+20.9%.
+1.3%.
+1.9%.
+23.9%.
-7.1%.
-40.5%.
Change, 2015 vs. 2014

6 | STUDY: CONSUMER CREDIT IN EUROPE 2015
10% 9% 8% 7% 6% 6% 5% 5% 5% 4% 4% 4% 2% 2% 1% 1%
0% 0% 0% -1% -2% -3% -3% -3% -4% -5% -7%
-17%
Despite the widespread recovery,national situations remained mixed
Sources: Central banks, Astères
The recovery is widespread and not limited to the major markets There are twice as many countries whose outstandings grew by more than 3% as in 2014 (12 vs. 6) We have nine countries with outstandings on the wane (vs. 11 in 2014), and the scale of this downturn is
appreciably more moderate than last year
Yet this overall movement does mask significant disparities between regions and countries Countries that had strong structural adjustments after the sovereign debt crisis are still convalescing
Recent recovery in Spain, Italy, and Portugal, with levels of outstandings that are sometimes worse (Spain) Continued erosion in Ireland and Greece
Certain mature markets are still in a downward trend (Netherlands, Austria) or flat (Germany, Belgium) The sharp downturn in Hungary's outstandings in 2015 is largely due to the foreign currency loan conversion
programme
2015 consumer credit, by EU country
% change in outstandings, 2014-2015

7 | STUDY: CONSUMER CREDIT IN EUROPE 2015
In France, the market's recovery was confirmed
Sources: Asterès, ASF, Observatoire des crédits aux ménages
In a regulatory environment still unfavourable to consumercredit, 2015 confirmed the recovery begun in 2014 in France. Allthe indicators looked good:
outstandings up 4% to €153 bn
per capital outstandings up 3% to €2,305, placing Francewithin the EU average
the holding rate by consumers was up for the first time since2008, standing at 26.0%*
new loan production was brisk: across the ASF** scope,growth was 6.3% in 2015
However, the different products and market segments are indivergent trends:
revolving credit was down, as in previous years: in 2015, itmade up 27% of production, compared to 31% in 2014
lease-to-own options, mainly for autos, were a breakthrough:they made up 12% of production in 2015 vs. 9% in 2014
Consumer loans outstandingFrancein € bn
155
146
153
140 142 144 146 148 150 152 154 156
2008 2009 2010 2011 2012 2013 2014 2015
*Source: Observatoire des crédits aux ménages, March 2016** ASF: Association Française des Sociétés Financières, which makes up about 50% of the total consumer credit market
8 | STUDY: CONSUMER CREDIT IN EUROPE 2015
In Southern Europe, a rebound emerged after a long downturn
Source: Asterès
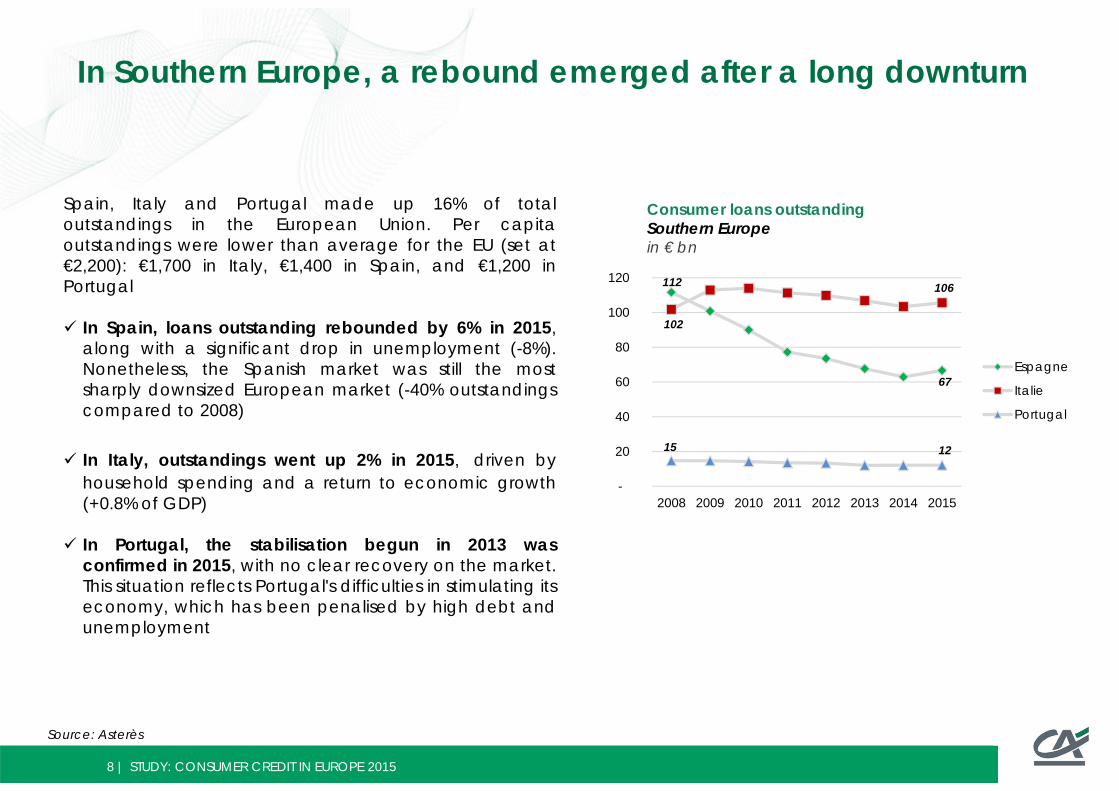
Spain, Italy and Portugal made up 16% of totaloutstandings in the European Union. Per capitaoutstandings were lower than average for the EU (set at€2,200): €1,700 in Italy, €1,400 in Spain, and €1,200 inPortugal
In Spain, loans outstanding rebounded by 6% in 2015,along with a significant drop in unemployment (-8%).Nonetheless, the Spanish market was still the mostsharply downsized European market (-40% outstandingscompared to 2008)
In Italy, outstandings went up 2% in 2015, driven byhousehold spending and a return to economic growth(+0.8% of GDP)
In Portugal, the stabilisation begun in 2013 wasconfirmed in 2015, with no clear recovery on the market.This situation reflects Portugal's difficulties in stimulating itseconomy, which has been penalised by high debt andunemployment
Consumer loans outstandingSouthern Europein € bn
112
67
102
106
15 12
-
20
40
60
80
100
120
2008 2009 2010 2011 2012 2013 2014 2015
Espagne
Italie
Portugal

9 | STUDY: CONSUMER CREDIT IN EUROPE 2015
In Scandinavia, activity stayed strong, except in Denmark
Source: Asterès
With the exception of Sweden, where the savings rate ishistorically high, the Scandinavian countries had much higherper capita outstandings than average for Europe:
€5,000 per capita in Norway (Europe's #1 in per capitaoutstandings), €3,100 per capita in Denmark (#5), and €2,600per capita in Finland (#8)
the outstandings/consumption ratio also reflects contrastingrealities: while outstandings made up nearly 20% of endconsumption in Norwegian households, this ratio fell to 10% forSweden
Overall, activity stayed strong in 2015, except for Denmark,where activity was down, due to a debt-reduction strategybegun in 2009
Consumer loans outstandingScandinaviain € bn
12 14
22
26
-
5
10
15
20
25
30
2008 2009 2010 2011 2012 2013 2014 2015
Finlande
Danemark
Suède
Norvège
10 | STUDY: CONSUMER CREDIT IN EUROPE 2015
In Germany, the market was stable,but distribution models had structural changes
Source: Asterès
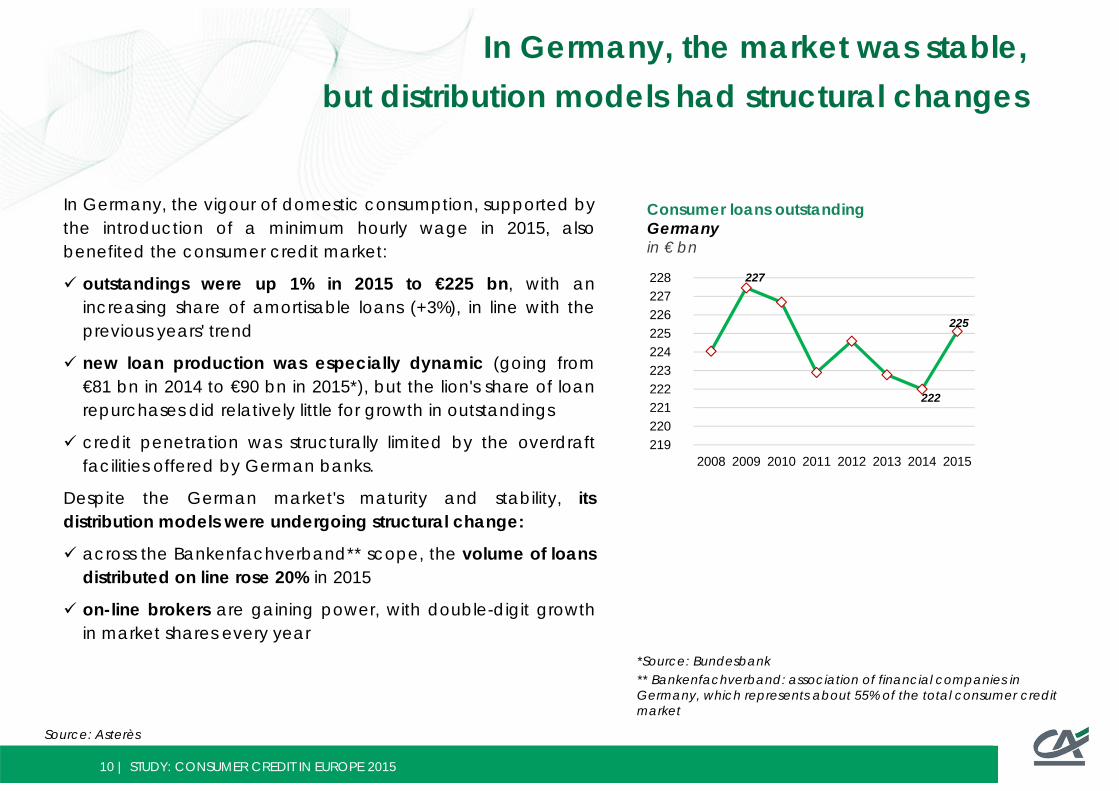
In Germany, the vigour of domestic consumption, supported bythe introduction of a minimum hourly wage in 2015, alsobenefited the consumer credit market:
outstandings were up 1% in 2015 to €225 bn, with anincreasing share of amortisable loans (+3%), in line with theprevious years' trend
new loan production was especially dynamic (going from€81 bn in 2014 to €90 bn in 2015*), but the lion's share of loanrepurchases did relatively little for growth in outstandings
credit penetration was structurally limited by the overdraftfacilities offered by German banks.
Despite the German market's maturity and stability, itsdistribution models were undergoing structural change:
across the Bankenfachverband** scope, the volume of loansdistributed on line rose 20% in 2015
on-line brokers are gaining power, with double-digit growthin market shares every year
Consumer loans outstandingGermanyin € bn
227
222
225
219 220 221 222 223 224 225 226 227 228
2008 2009 2010 2011 2012 2013 2014 2015
*Source: Bundesbank** Bankenfachverband: association of financial companies in Germany, which represents about 55% of the total consumer credit market

11 | STUDY: CONSUMER CREDIT IN EUROPE 2015
In the UK, the market enjoyed sustained growth
Source: Asterès
As the #1 European consumer credit market, making up nearly30% of the European Union market by itself, the UK confirmed itwas still on the path to recovery it had started in 2012.
Despite increased regulatory constraints, 2015 was anexceptionally dynamic year, driven by consumer confidenceand unemployment levels that were back to pre-crisis levels:
outstandings were up 6% to €329 bn, beyond the level ofoutstandings in 2008
new loan production was driven by automotive finance,which grew 10% compared to 2014 across the FLA* scope
per capita loans outstanding were up 5% to stand at €5,067 in2015, positioning the UK in second place after Norway
Consumer loans outstandingUKin € bn
315
277
329
250 260 270 280 290 300 310 320 330 340
2008 2009 2010 2011 2012 2013 2014 2015
*FLA: Finance & Leasing Association, an association of financial companies in the UK, which represents about 25% of the British consumer credit market

12 | STUDY: CONSUMER CREDIT IN EUROPE 2015
Methods and sources for the study
The data on consumer loans outstanding presented in this study come from the central banks or nationalstatistics institutes.
They were collected for CA Consumer Finance by the research and consulting firm Asterès, which strove toadhere to a uniform product and market field:
The data include banking and non-banking actors (i.e. all credit institutions).
They include (to the extent allowed by the source data) bank overdrafts, but exclude mortgages, even forconsumer loans.
To allow a market comparison, the data were converted into euros at the average current exchange ratefor 2014. This may be why there are significant variations in outstandings from one year to the next. As theentire outstandings history was converted at the same rate, growth rates are representative of the marketand not impacted by exchange rate fluctuations.
The data presented in this study should be considered estimates; complete accuracy cannot be guaranteed.
The quality of statistics issued by the primary source (often central banks) is variable. The field of non-bankingoperators is unevenly covered. Finally, these statistics are frequently revised.