c83spe: social psychology of exercise and sport. aims this course aims examine the social...
TRANSCRIPT

C83SPE: Social Psychology of Exercise and Sport

AimsThis course aims examine the
social psychological approaches to the understanding of sport, exercise and health-related behaviour.
Two broad areas:• Social psychology of exercise• Social psychology of sport
Aims• Identify the major social psychological
approaches to understanding exercise behaviour• Identify and evaluate the effectiveness of the
important exercise intervention strategies used by social psychologists
• Identify the major approaches to social psychological processes in sport
• Critically analyse the published research on social psychology applied to sport

Lectures and Tutorials/Labs
Lectures are Fridays 2pm-4pm in the first semester in Pope C17
No lecture 31st October 2008
Compulsory attendance

Information
EMAIL Forum for Q & A between students and lecturer [email protected] Prompt responses to queries
C83SPE Resources on my Website All lecture notes posted here Some key websites Specimen exam papers www.martinhagger.com

Course Textbook
Hagger, M.S. and Chatzisarantis, N. (2005). The social psychology of exercise and sport. Buckingham: Open University Press. (RRP: £20)

Assessment
Written examination in Summer Term (end of second semester)
You will be required to answer 2 essay questions in 2 hours– 1 from a choice of 3 in Section A – Social
Psychology of Exercise– 1 from a choice of 3 in Section B – Social
Psychology of Sport

Stupid Question Policy Please email me if you have a query about the
module ([email protected]) I am more than happy to answer relevant
questions about matters of which you are unsure I will not respond to ‘stupid’ questions Examples of stupid questions:
Where is Pope C17? I missed the last lecture, where can I get the
handout? I’m looking for past exam papers, where can I find
them? I have a new pet hamster, what shall I name it?

Social Psychology, Exercise and Health
Hagger & Chatzisarantis, Chapter 1

Outline The problem of physical inactivity
Cardiovascular disease (CVD) Causes of CVD Benefits of exercise/physical activity Low fitness/physical activity endemic in
populations Prevalence of obesity Relationship between exercise and health Exercise guidelines and recommendations Role of social psychology

Cardiovascular Disease - The Problem Cardiovascular disease (CVD) is the second most commonly
reported chronic illness in Britain What is CVD?
– Myocardial Infarction (aka CHD, ‘heart attack’)– Angina– Stroke– Peripheral Vascular Disease (c.f. DVT)
Prevalence of CHD in England is 7.4% (men) and 4.5% (women) Prevalence rates increase with age, with around 1 in 4 men and
1 in 5 women aged >75 years living with CHD. 1.5 million men in the UK have CHD and about 1.1 million
women, total of around 2.6 million people

The Cost in the UK…
Treating CVD in the NHS costs the government £5.2 billion per year
Costs of treating the problem itself e.g., bypass surgery, drug treatments, rehabilitation
Source: Allender et al. (2006). Journal of Epidemiology and Community Health.

A Further Problem...
CVD and other diseases related to low levels of activity are perceived to be pathological ‘occurring over the passage of time’ rather than linked with behavioural problems

What Causes CVD…? Principle risk factors:
– Hypercholesterolaemia– Hypertension– Smoking– Hereditary Tendency
‘Associated’ risk factors:– Obesity - Interactive– Physical Inactivity - Interactive

Effects of Physical Activity on CVD
Physical inactivity is acknowledged as major risk factor for CVD in UK (Lee and Skerrett, 2001)
Physical activity has been shown to ameliorate levels of the CVD risk factors: hypertension (Hagberg & Seals, 1985)
blood lipoproteins (Raitakari et al., 2001)
obesity (Ross et al., 2000)
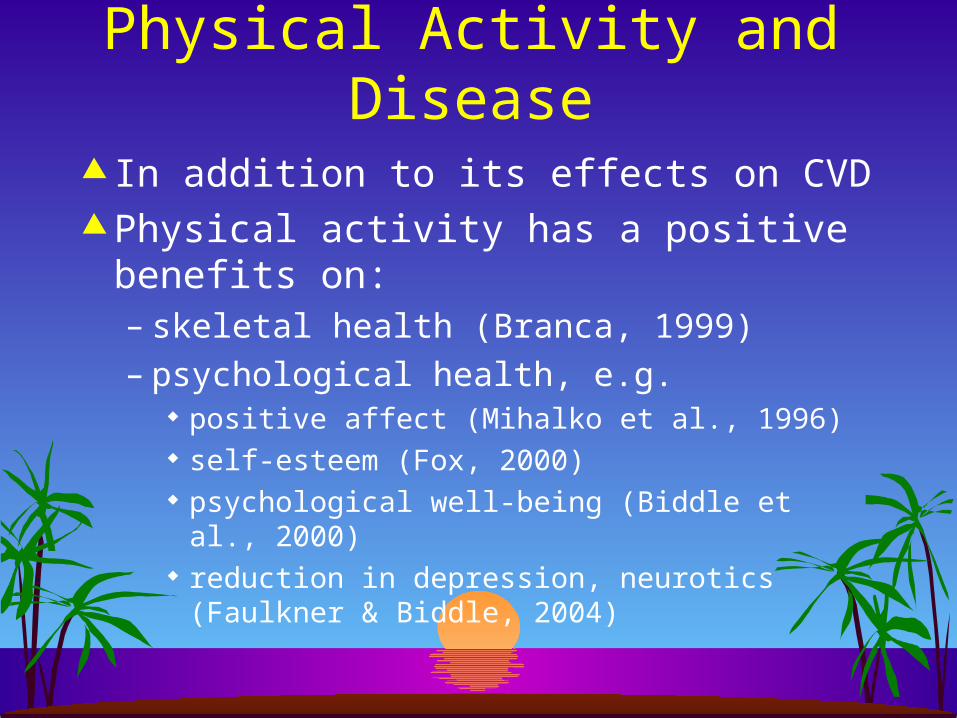
Physical Activity and Disease
In addition to its effects on CVD Physical activity has a positive benefits
on:– skeletal health (Branca, 1999)– psychological health, e.g.
positive affect (Mihalko et al., 1996) self-esteem (Fox, 2000) psychological well-being (Biddle et al., 2000) reduction in depression, neurotics (Faulkner &
Biddle, 2004)

Low Physical Activity and Other Diseases
Low levels of physical activity can increase the risk of certain cancers
Inactive lifestyles account for 5% of all cancer deaths (Colditz et al., 1997)
Studies in Italy and the USA estimated that physical inactivity could cause 13-14% of all bowel cancer cases (La Veccia et al., 1999) and 11% of breast (Mezzetti et al., 1999) cases.
It is estimated that diseases caused by inactivity kill 2M people every year worldwide (Ezzati et al., 2002).

…And Now the Bad News
People in the UK do not participate in enough physical activity of the type, intensity and frequency of physical activity thought to provide health benefits
Biddle, Cavill & Sallis (1999)
7 out of 10 adults in the UK do not take enough regular physical activity
BHF (2006)

Physical Activity Levels in England
0%
20%
40%
60%
80%
100%
16-24 25-34 23-44 45-54 55-64 65-74 75+
High
Med
Low
Source: Department of Health (2005) and Health Survey for England (2004)
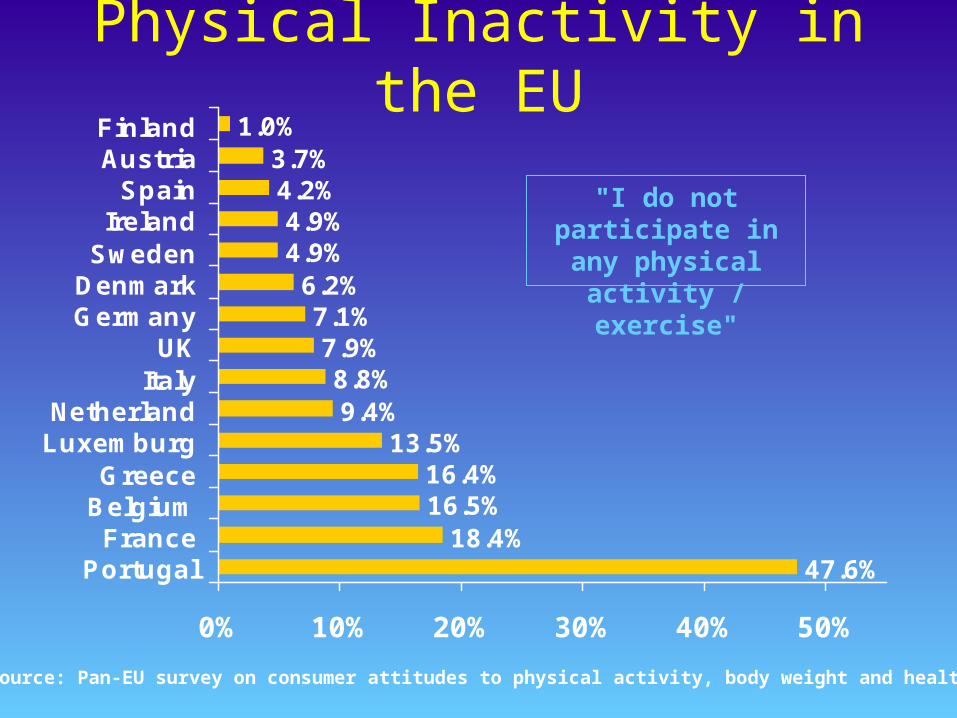
Physical Inactivity in the EU
47.6%18.4%
16.5%16.4%
13.5%9.4%
8.8%7.9%
7.1%6.2%
4.9%4.9%
4.2%3.7%
1.0%
0% 10% 20% 30% 40% 50%
PortugalFrance
BelgiumGreece
LuxemburgNetherland
ItalyUK
GermanyDenmark
SwedenIreland
SpainAustriaFinland
"I do not participate in any physical
activity / exercise"
Source: Pan-EU survey on consumer attitudes to physical activity, body weight and health

Physical Inactivity in the US
0%
5%
10%
15%
20%
25%
30%
35%
40%
1986 1987 1988 1989 1990 1991 1992 1994 2000
Year
No reported leisure-time physical activity,
adults 18 and older
Source: CDC, Behavioral Risk Factors Surveillance System (BRFSS)

16-24 25-34 35-44 45-54 55-64 64-74
Men 0% 0% 0% 0% 30% 45%
Women 0% 15% 20% 40% 51% 79%
16-24 25-34 35-44 45-54 55-64 64-74
Men 5% 16% 23% 44% 75% 84%
Women 37% 50% 70% 84% 90+% 90+%
The Fitness of the Nation
Source: Allied Dunbar National Fitness Survey (ADNFS; 1995)
At 3mph on the level
At 3mph up a 5% gradient

16-24 25-34 35-44 45-54 55-64 64-74
Men 0% 0% 0% 0% 30% 45%
Women 0% 15% 20% 40% 51% 79%
16-24 25-34 35-44 45-54 55-64 64-74
Men 5% 16% 23% 44% 75% 84%
Women 37% 50% 70% 84% 90+% 90+%
The Fitness of the Nation
Source: Allied Dunbar National Fitness Survey (ADNFS; 1995)
At 3mph on the level
At 3mph up a 5% gradient

Obesity – A Further Health Risk
What is obesity? Defined as a Body Mass Index (BMI) of >30 Calculation for BMI: weight (kg)/height (m)2
In addition, a BMI between 25 and 29.9 is considered ‘overweight’
Associated with heightened risks of CV disease, certain cancers, diabetes and associated with back and joint problems and increased risk in surgery

Obesity Among Adults in the EU
0% 10% 20% 30% 40% 50%
Greece
Germany
Spain
Finland
Austria
Portugal
UK
Belgium
Sweden
Denmark
Ireland
Netherlands
Italy
Luxemburg
FranceOverweight
Obese
Source: Pan-EU survey on consumer attitudes to physical activity, body weight and health
EU AveragesOverweight: 31% Obesity: 10%

Obesity Among Adults in the U.S.1985
Source: Behavioral Risk Factor Surveillance System, CDC
15%-19%No Data <10% 10%-14% 20%-24% 25%-29% >30%

Obesity Among Adults in the U.S.1986
Source: Behavioral Risk Factor Surveillance System, CDC
15%-19%No Data <10% 10%-14% 20%-24% 25%-29% >30%

Obesity Among Adults in the U.S.1987
Source: Behavioral Risk Factor Surveillance System, CDC
15%-19%No Data <10% 10%-14% 20%-24% 25%-29% >30%

Obesity Among Adults in the U.S.1988
Source: Behavioral Risk Factor Surveillance System, CDC
15%-19%No Data <10% 10%-14% 20%-24% 25%-29% >30%

Obesity Among Adults in the U.S.1989
Source: Behavioral Risk Factor Surveillance System, CDC
15%-19%No Data <10% 10%-14% 20%-24% 25%-29% >30%
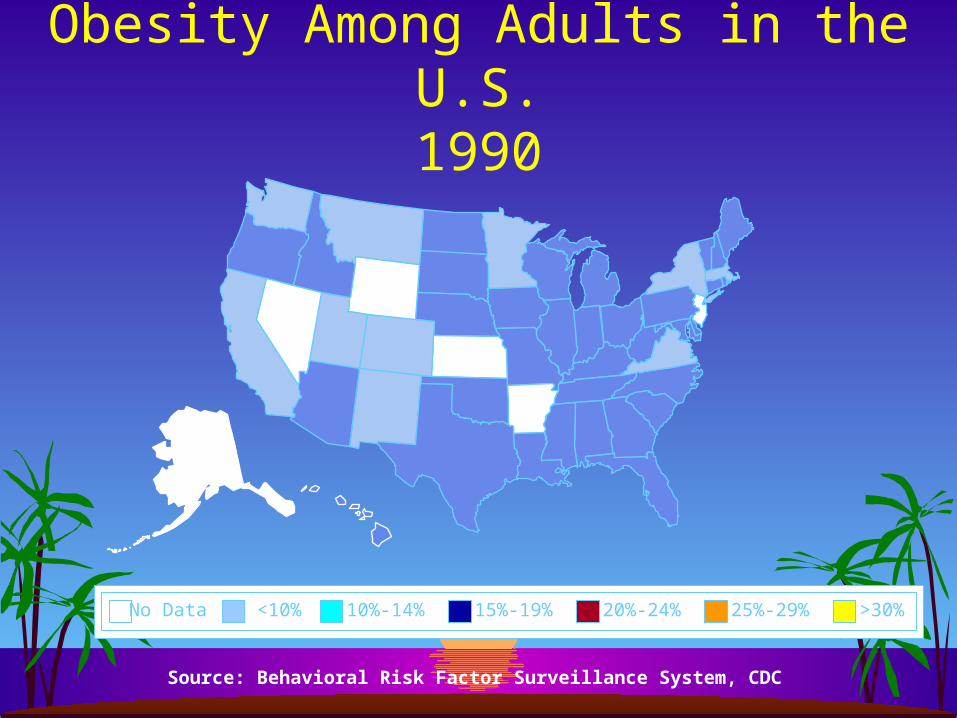
Obesity Among Adults in the U.S.1990
Source: Behavioral Risk Factor Surveillance System, CDC
15%-19%No Data <10% 10%-14% 20%-24% 25%-29% >30%

Obesity Among Adults in the U.S.1991
Source: Behavioral Risk Factor Surveillance System, CDC
15%-19%No Data <10% 10%-14% 20%-24% 25%-29% >30%

Obesity Among Adults in the U.S.1992
Source: Behavioral Risk Factor Surveillance System, CDC
15%-19%No Data <10% 10%-14% 20%-24% 25%-29% >30%
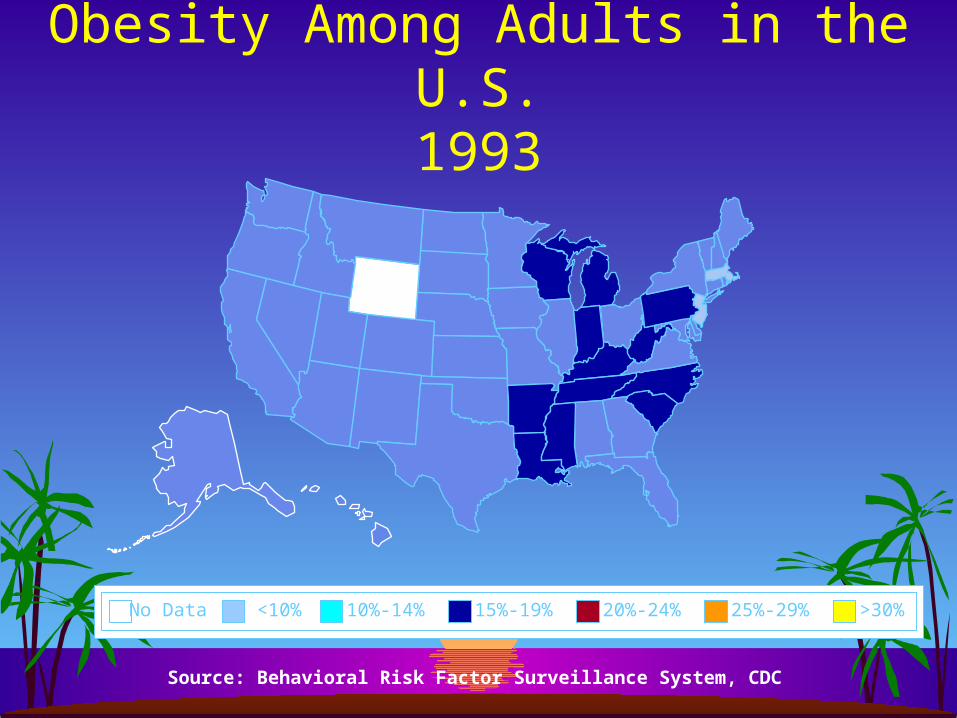
Obesity Among Adults in the U.S.1993
Source: Behavioral Risk Factor Surveillance System, CDC
15%-19%No Data <10% 10%-14% 20%-24% 25%-29% >30%

Obesity Among Adults in the U.S.1994
Source: Behavioral Risk Factor Surveillance System, CDC
15%-19%No Data <10% 10%-14% 20%-24% 25%-29% >30%

Obesity Among Adults in the U.S.1995
Source: Behavioral Risk Factor Surveillance System, CDC
15%-19%No Data <10% 10%-14% 20%-24% 25%-29% >30%

Obesity Among Adults in the U.S.1996
Source: Behavioral Risk Factor Surveillance System, CDC
15%-19%No Data <10% 10%-14% 20%-24% 25%-29% >30%

Obesity Among Adults in the U.S.1997
Source: Behavioral Risk Factor Surveillance System, CDC
15%-19%No Data <10% 10%-14% 20%-24% 25%-29% >30%
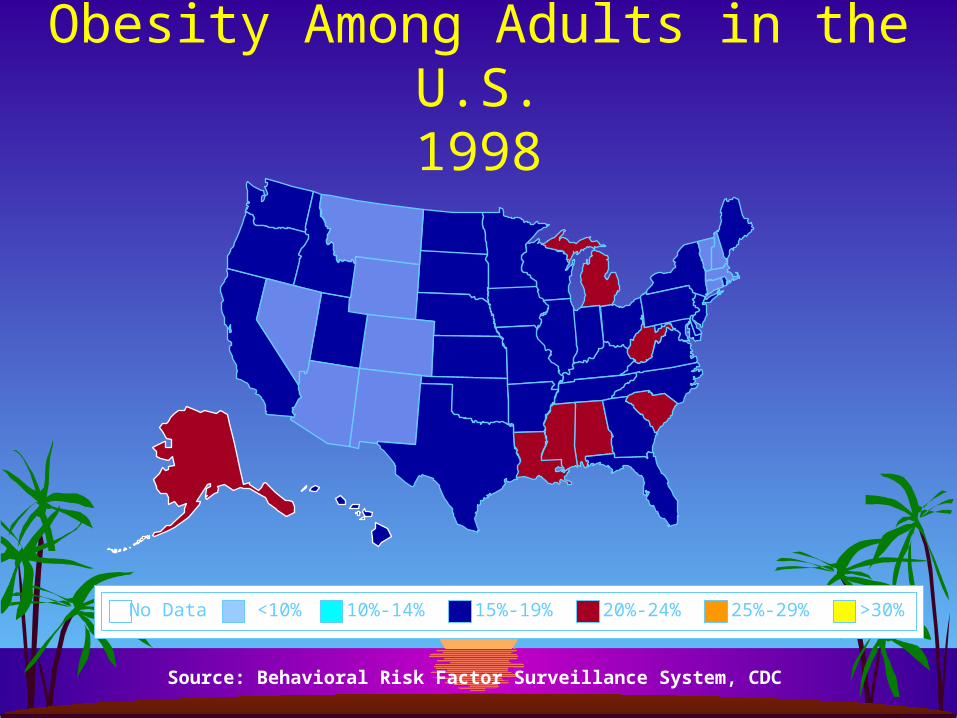
Obesity Among Adults in the U.S.1998
Source: Behavioral Risk Factor Surveillance System, CDC
15%-19%No Data <10% 10%-14% 20%-24% 25%-29% >30%

Obesity Among Adults in the U.S.1999
Source: Behavioral Risk Factor Surveillance System, CDC
15%-19%No Data <10% 10%-14% 20%-24% 25%-29% >30%

Obesity Among Adults in the U.S.2000
Source: Behavioral Risk Factor Surveillance System, CDC
15%-19%No Data <10% 10%-14% 20%-24% 25%-29% >30%

Obesity Among Adults in the U.S.2001
Source: Behavioral Risk Factor Surveillance System, CDC
15%-19%No Data <10% 10%-14% 20%-24% 25%-29% >30%

Obesity Among Adults in the U.S.2004-2006
Source: Behavioral Risk Factor Surveillance System, CDC
15%-19%No Data <10% 10%-14% 20%-24% 25%-29% >30%

The Costs of Obesity in the US…
Obesity is responsible for $100bn (£55bn) in medical costs and 300,000 deaths annually
Throughout the 1990s, the average weight of North Americans increased by 4.5kg (10lb)
The extra weight meant airlines burnt 350m more gallons of fuel in 2000, costing an extra £157m
Source: American Obesity Association (2004)

Obesity is rising throughout the world and affects at least 300 million people worldwide
In the UK, two-thirds of adults are overweight and 22% of men and 23% of women are obese
The level of obesity has tripled in the past 20 years
More than 12m adults will be obese by 2010 33% of men and 28% of women will be obese by
2010 Source: Health Survey for England (2006)
Obesity in the UK – An ‘Epidemic’

Obesity in the UK – An ‘Epidemic’
0
1000
2000
3000
4000
5000
6000
7000
Men Women
2003
2010 (projected)
Source: National Centre for Social Research/Department for Health (2006)
No
. of
Pe
op
le A
ged
16
+ (
‘00
0s)

Percentage of Obese Men by Age Group
0
5
10
15
20
25
30
%
16-24 Yrs
25-34 Yrs
35-44 Yrs
45-54 Yrs
55-64 Yrs
65-74 Yrs
75+ Yrs
Source: Health Survey for England (2003)

Percentage of Obese Women by Age Group
0
5
10
15
20
25
30
35
%
16-24 Yrs
25-34 Yrs
35-44 Yrs
45-54 Yrs
55-64 Yrs
65-74 Yrs
75+ Yrs
Source: Health Survey for England (2003)

Exercise Recommendations and Guidelines
ACSM GUIDELINES
for healthy aerobic activity ...
• Exercise 3 to 5 days each week
• Up to 30 to 45 minutes at a time
• Moderately intense activity using large muscle groups (e.g. walking, swimming, cycling, running)
• This level of activity corresponds to 200 kcals/day
• The level of intensity should be at least 55% to 65% of maximum heart rate
American College of Sports Medicine Position Stand (1998). Med Sci Sports Exerc, 30(6), 975-991.
)
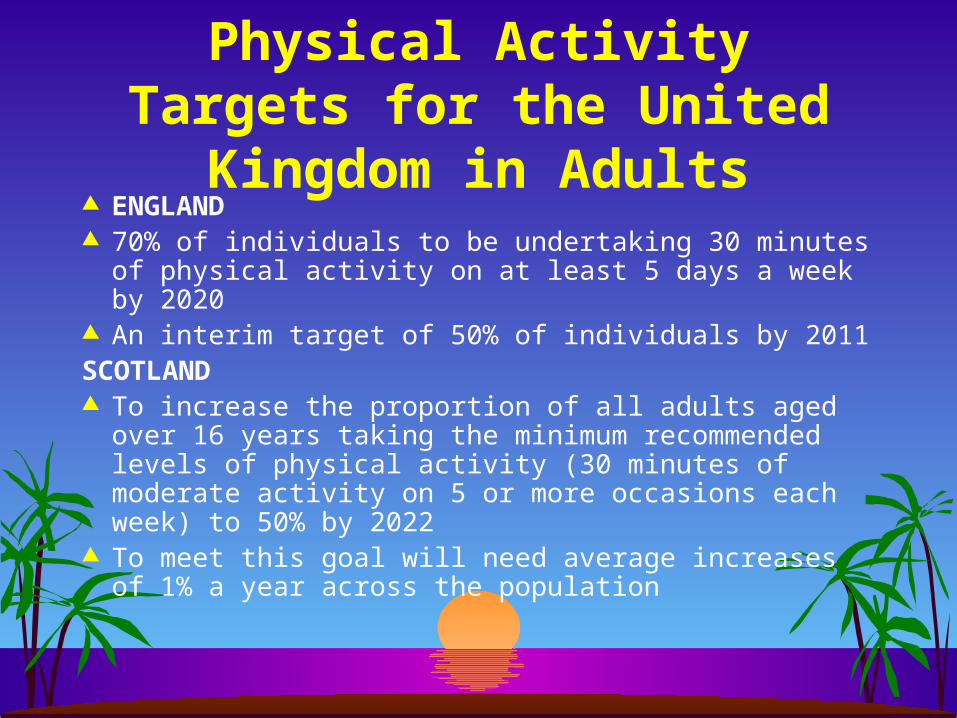
Physical Activity Targets for the United Kingdom in Adults
ENGLAND 70% of individuals to be undertaking 30 minutes of
physical activity on at least 5 days a week by 2020 An interim target of 50% of individuals by 2011 SCOTLAND To increase the proportion of all adults aged over 16
years taking the minimum recommended levels of physical activity (30 minutes of moderate activity on 5 or more occasions each week) to 50% by 2022
To meet this goal will need average increases of 1% a year across the population

Pediatric Origins of CVD
Evidence has suggested that CVD and risk factors have paediatric origins (e.g., Enos et al., 1953; McNamara et al., 1971) Evidence also shows that obesity is increasing in children and children do less exercise than ever before (Ebbling et al., 2002;Flegal, 1999) Physical activity levels in young people and children are not enough to confer health benefits (Cale & Almond, 1992)

Obesity is rising among British children In the past 10 years obesity has doubled in
six-year-olds (to 8.5%) and trebled among 15-year-olds (to 15%)
More than 1m children will be obese by 2010 19% of boys and 22% of girls aged 2- 15 will
be obeseSource: Health Survey for England (2006)
Obesity in the UK – An ‘Epidemic’ in Children

Obesity in the UK – An ‘Epidemic’ in Children
0100200300400500600700800900
1000
Boys Girls
2003
2010 (projected)
Source: National Centre for Social Research/Department for Health (2006)
Nu
mb
er
of C
hild
ren
age
d 2
-15
ye
ars

Exercise Recommendations and Guidelines for Young People
International Consensus Conference on Physical Activity Guidelines for Adolescents
• Adolescents should be active daily or nearly ever day as part of their lifestyles
• Exercise most days each week for 20 continuous minutes at a time
• Moderately-to-vigorous physical activity using large muscle groups (e.g. walking, swimming, cycling, running)
•Intensity of 65% of maximum heart rate
Sallis and Patrick (1994) Pediatric Exercise Science, 6 (4), 302-314.
)

Physical Activity Targets for the United Kingdom in
ChildrenENGLAND To increase the proportion of school children in
England who spend a minimum of two hours each week on high quality sport from 25% in 2002, to 75% by 2006 and 85 per cent in 2008
SCOTLAND To increase the proportion of all children aged 16 and
under taking the minimum recommended levels of physical activity (1 hour a day of moderate activity on 5 or more days a week) to 80% by 2022
To meet this goal will need average increases of 1% a year across the population

Role of Exercise Psychology
Exercise psychologists aim to:– (1) identify the influential variables
(antecedents) that predict physical activity behaviour and
– (2) develop a strategy to manipulate such variables and bring about a behaviour change in levels of physical activity.
Social psychological approaches adopted for use in exercise contexts

What is Social Psychology?What is Social Psychology? The study of human behaviour in social contexts Recognises that behaviour does not occur in a ‘social vacuum’ Most of the research in exercise and sport psychology is ‘applied social
psychology’ Theoretical explanations which can explain social psychological phenomena
in exercise and sport across a number of situations Adopts a hypothesis-testing, empirical approach to understanding behaviour AKA The ‘positivist’ or ‘scientific approach’ Constructs identified and mechanisms studied using experimental and
quantitative research designs

Personality,Trait Anxiety, GoalOrientation
Self-Efficacy,Intentions,State Anxiety
CONSTRUCT
CONTINUUM
LEVEL OFGENERALITY
STABILITY
General, Global Situation specific
Stable, EnduringNot subject to change
Less-stable,Changeable
TRAIT STATE
Trait-like State-like
Types of ‘Constructs’ or Types of ‘Constructs’ or ‘Variables’ in Social Psychology‘Variables’ in Social Psychology

Traits indicate a ‘tendency’ or general ‘disposition’ across many contexts
States account for situational behaviour and outcomes
Information-processing perspective
Types of ‘Constructs’ or Types of ‘Constructs’ or ‘Variables’ in Social Psychology‘Variables’ in Social Psychology

Research Designs I: The Survey Large body of research in exercise and social
psychology use cross-sectional, correlational surveys Examining sets of relationships between psychological
variables and exercise behaviour Advantages:
Large samples Valid measures, powerful effects Generalizable to populations Relatively easy to conduct
Disadvantages Validity of measures (behavioural AND psychological) Inference of causality
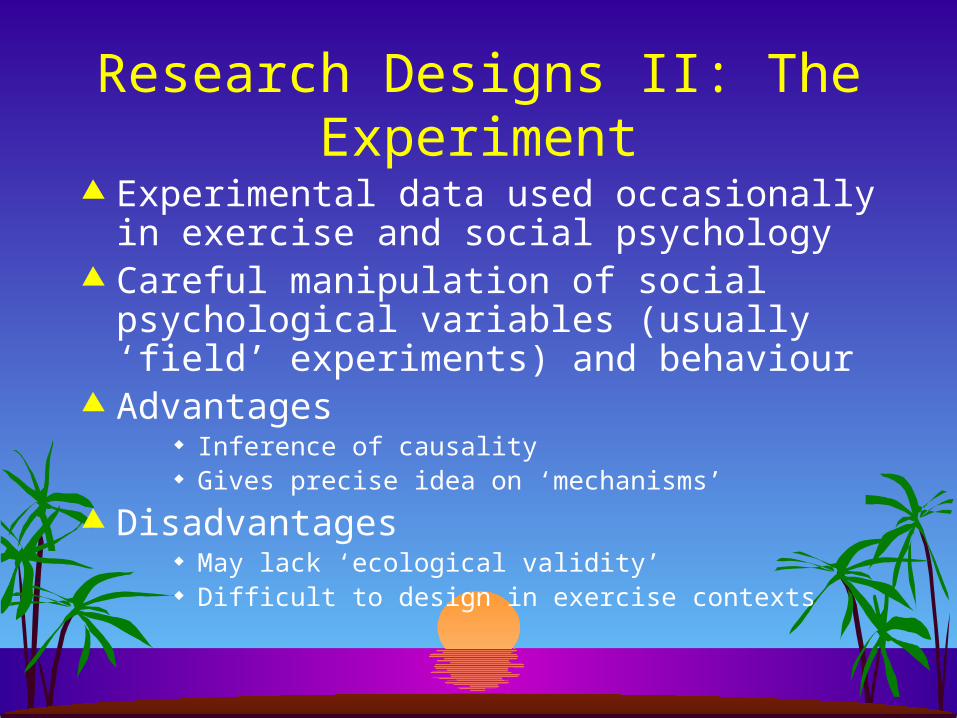
Research Designs II: The Experiment
Experimental data used occasionally in exercise and social psychology
Careful manipulation of social psychological variables (usually ‘field’ experiments) and behaviour
Advantages Inference of causality Gives precise idea on ‘mechanisms’
Disadvantages May lack ‘ecological validity’ Difficult to design in exercise contexts

Research Designs III: The Intervention
Effects of numerous manipulations on exercise behaviour – ‘wholesale’ changes
In ‘real world’ settings Focus on practice and implementation Advantages
Valid in settings in the real world Can infer causality
Disadvantages May be unable to disentangle the ‘true’ effect Effects may be small Data may be ‘noisy’ Need careful design e.g. ‘randomisation’

Academicattainment
.50?
Socioeconomicstatus
Processes in Social PsychologyAn initial example – the 3rd variable problem
Attendance
.60.60
.14
Explains relationship

Psychologicalvariable
Psychologicalvariable
ExerciseBehaviour
.60
.60 .25
Mediation relationships in correlational data
.45
Psychologicalvariable
Processes in Exercise Psychology

Processes in Exercise PsychologyModeration effects
PerceivedCompetence
Intrinsicmotivation
ExerciseBehaviour
Changes nature ofthe relationship

Processes in Exercise PsychologyModeration effects
Intrinsicmotivation
ExerciseBehaviour
Intrinsicmotivation
ExerciseBehaviour
High competence people
Low competence people
++
+