c6 validation report
TRANSCRIPT

GSE ndash PROMOTE 2 C6 Validation Report
REF PROMOTE 2 C6 ISSUE 10 DATE 06062008 PAGE I
DOSSIER COMMON TASK --2--
TITLE
GMES SERVICE ELEMENT PROMOTE 2
C6 Validation Report
DESERT DUST AWARENESS SERVICE Version 2
GSE ndash PROMOTE 2 C6 Validation Report
Desert Dust
REF PROMOTE 2 C6 ISSUE 10 DATE 06062008 PAGE II
DOCUMENT STATUS SHEET
FUNCTION NAME DATE SIGNATURE
LEAD AUTHORS
editor R Delgado
J C Lambert
CONTRIBUTING AUTHORS
Service leader
Service providers
Oacutescar Peacuterez Navarro
W Di Nicolantonio
REVIEWED BY Reviewers
APPROVED BY Technical officer (ESA)
ISSUED BY Project manager
GSE - PROMOTE 2 C6 Validation Report
Desert Dust
REF PROMOTE-2 C6 ISSUE 10 DATE 06062008 PAGE III
DOCUMENT CHANGE RECORD Issue Date Modified Items Reason for Change
Version 1
01 10022007 Draft document created
02 22022007 SLA specifications integrated in raft document Document sent
03 20032007 Document received and updated
04 30042007 Draft template reformatted and distributed
05 15052007 Input GMV Received
06 25052007 Document edited and sent to providers for new iteration
07 06062007 Document received and edited
09 06062007 Document edition finished
10 25062007 Document properties updated
Version 2
105
110 30052008 Template updated and distributed
115 04062008 Update on Italian Subservice by WDN
120 06062008 Update on Iberian Sub service by O Navarro
GSE - PROMOTE 2 C6 Validation Report
Desert Dust
REF PROMOTE-2 C6 ISSUE 10 DATE 06062008 PAGE IV
LIST OF TABLES Table 12-1 Desert Dust Awareness products characterization 2 Table 13-1 Data used for the validation of the Iberian Desert Dust Awareness sub-service 7 Table 13-2 Validation of individual components of the Iberian Service 9 Table 13-3 Validation of the Iberian Sub-service against specifications and against user requirements 23 Table 13-4 Validation of quality assessment and control procedures for the Iberian Sub-service 24 As stated above lidar observations in Tor Vergata (Rome) [see Table 14-5] were employed In particular Figure 14-4 and Figure 14-5 show the time-patterns of dust AOD (AOD due only to the Saharan dust contribution to aerosol extinction) and corresponding minimum and maximum height of the dust layer Significant values of dust AOD are present around March 9 April 10 and May 20 together with layer heights ranging between 200 m to 7 km 28 Table 14-6 Data used for the validation of the Italian Desert Dust Awareness Sub-service 32 Table 14-7 Validation of individual components of the Italian Service 35 Table 14-8 Validation of the Italian Sub-service against specifications and against user requirements 36 Table 14-9 Validation of quality control procedures for the Italian Sub-service 37
GSE - PROMOTE 2 C6 Validation Report
Desert Dust
REF PROMOTE-2 C6 ISSUE 10 DATE 06062008 PAGE V
LIST OF FIGURES
Figure 11-1 Structure and position of the Desert Dust Awareness Service within PROMOTE 2 Air Quality 1 Figure 13-1 Schematic of the Aeronet cloud screening procedure from Smirnov 2000 11 Figure 13-2 Comparison of 087 m Aeronet site measurement with SEVIRI measurements 13 Figure 13-3 Comparison of 055 m Aeronet site measurement with SEVIRI measurements 14 Figure 13-4 Comparison of sea and coastal 087 m Aeronet site measurement with SEVIRI measurements 15 Figure 13-5 Comparison of sea and coastal 055 m Aeronet site measurement with SEVIRI measurements 15 Figure 13-6 Comparison of land 0870nm Aeronet Site measurements with SEVIRI Measurements 16 Figure 13-7 Comparison of land 0550nm Aeronet Site measurements with SEVIRI Measurements 16 Figure 13-8 Amalgamated results for September 2004 1212 UTC The individual aerosol types were combined according to quality control and cost over land and sea 16 Figure 13-9 Amalgamated results for September 2004 1212 UTC The individual aerosol types were combined according to quality control and cost over land and sea 17 Figure 13-10 Amalgamated results for September 2004 1212 UTC The individual aerosol types were combined according to quality control and cost over land and sea 17 Figure 13-11 the right show scatter density distributions of the monthly mean value over sea and land separately ldquo+rdquo symbols indicate the mean over all SEVIRI points within the indicated range of MODIS values Error bars indicate the corresponding standard deviation 18 Figure 13-12 Number of data points in each bin of the of 1 degree gridded monthly statistical 19 Figure 14-13 Desert dust transport highlighted in magenta as detected through the RGB BTD technique applied to SEVIRI IR channels as available for Phase 1 25 Figure 14-14 Example of trispectral diagram of BTD from MSG-1SEVIRI over the Mediterranean area related to July 27 2005 33
GSE - PROMOTE 2 C6 Validation Report
Desert Dust
REF PROMOTE-2 C6 ISSUE 10 DATE 06062008 PAGE VI
LIST OF ACRONYMS
BT Brightness Temperature BTD Brightness Temperatures Difference CGS Carlo Gavazzi Space CNR Consiglio Nazionale delle Ricerche CTM Chemical Transport Model DCW Digital Chart of the World DVB Digital Video Broadcasting GEOS(x) Geostationary projection with sub-satellite point located at x degrees GMV Grupo de Mecaacutenica de Vuelo GRASS Geographical Resources Analisys Support System HRIT High Rate Information Transmission ISAC Institute of Atmospheric and Climatic Sciences MSG Meteosat Second Generation SAF Satellite Application Facility SEVIRI Spinning Enhanced Visible and Infra-Red Imager INM Instituto Nacional de Meteorologiacutea UML Unified Modelling Language TS Technical Specification
NA Not Available na not applicable ns not specified
GSE - PROMOTE 2 C6 Validation Report
Desert Dust
REF PROMOTE-2 C6 ISSUE 10 DATE 06062008 PAGE VII
TABLE OF CONTENTS
DOCUMENT STATUS SHEET II
DOCUMENT CHANGE RECORD III
LIST OF TABLESIV
LIST OF FIGURES V
LIST OF ACRONYMSVI
TABLE OF CONTENTS VII
1 DESERT DUST AWARENESS 1 11 Service Summary 1 12 Product characterization 1 13 Iberian sub-service 4
131 Validation plan and validation data 4 1311 Development and testing of a validation tool 4 1312 Validation by means of the visualization tool 5 1313 Validation of SEVIRI data with AERONET and ADRIEX data 6
132 Validation of individual components 7 1321 SEVIRI cloud screening 7 1322 Screening procedures 10 1323 Fits of Aeronet site measurements to coincident SEVIRI retrievals 12 1324 Results 14 1325 Merging the aerosol types 16 1326 Comparisons with other Satellite Platforms 18 1327 Conclusions 20
133 Validation against specifications and against user requirements 22 134 Service quality assessment and control procedures 23
14 Italian sub-service 25 141 Validation Plan and Validation Data 26 142 Validation of individual components 33 Validation against specifications and against user requirements 35
143 Quality assessment and control procedures 37 15 References 38
151 Electronic references 38 152 Bibliographic references 38
GSE - PROMOTE 2 C6 Validation Report
Desert Dust
REF PROMOTE-2 C6 ISSUE 10 DATE 06062008 PAGE VIII
ltPAGE INTENTIONALLY LEFT BLANKgt
GSE - PROMOTE 2 C6 Validation Report
Desert Dust
REF PROMOTE-2 C6 ISSUE 10 DATE 06062008 PAGE 1 of 36
1 DESERT DUST AWARENESS
11 Service Summary The desert dust awareness service is based on measurements of SEVIRI instrument on board MSG-1 and MSG-2 satellites The service uses infra-red bands and visible bands In particular visible bands can provide quantitative information on parameters such as Aerosol Optical Depth and Angstrom Coefficient Infra-red bands on the other hand can be adopted to enhance the presence of a desert dust transport towards the regions of interest The repetition cycle of SEVIRI measurements allows the tracking of desert dust outbreaks
AQ RECORD SERVICE
INTEGRATED AQ PLATFORM
LOCAL AQ FORECAST
DESERT DUST AWARENESS
URBANREGIONAL AQ ASSESSM ENT SERVICE
POLLEN
SATELLITE BASED PM DEM ONSTRATION SERVICE
REGIONAL AQ FORECAST
Air Quality
Iberian sub-service
Italian sub-service
Figure 11-1 Structure and position of the Desert Dust Awareness Service within PROMOTE 2 Air Quality
GSE - PROMOTE 2 C6 Validation Report
Desert Dust
REF PROMOTE-2 C6 ISSUE 10 DATE 06062008 PAGE 1 of 36
12 Product characterization The products consist of retrieved estimates of aerosol optical depth (AOD) at 055 and 087 microm IGAPs are individual sensor products for each day in which the ldquobestrdquo type has been selected from the 5 types considered by the algorthim (MARITIME URBAN DESERT DUST BIOMASS CONTINENTAL) The Angstroslashm coefficient derived from these two optical depths is also reported
Desert dust indicator
Parameter na
Typical range na
Determination of the typical range (Method criteria)
na
Maximum range na
Units na
Standards na
Speciation
Parameter Speciation
Typical range 0-4
Determination of the typical range (Method criteria)
0 Continental
1 Desert Dust
2 Maritime
3 Urban
4 Biomass
Maximum range na
Units na
Standards ns
Aerosol Optical Thickness 550 nm
Parameter AOD550
Typical range 0-13
GSE - PROMOTE 2 C6 Validation Report
Desert Dust
REF PROMOTE-2 C6 ISSUE 10 DATE 06062008 PAGE 2 of 36
Determination of the typical range (Method criteria)
na
Maximum range na
Units [-]Dimensionless
Standards ns
Aerosol Optical Thickness 870 nm
Parameter AOD870
Typical range 0-13
Determination of the typical range (Method criteria)
na
Maximum range na
Units [-]Dimensionless
Standards ns
Angstrom Coefficient
Parameter Angstrom Coefficient
Typical range 0-1
Determination of the typical range (Method criteria)
na
Maximum range na
Units [-] Dimensionless
Standards ns
Table 12-1 Desert Dust Awareness products characterization
GSE - PROMOTE 2 C6 Validation Report
Desert Dust
REF PROMOTE-2 C6 ISSUE 10 DATE 06062008 PAGE 3 of 36
ltPAGE INTENTIONALLY LEFT BLANKgt
GSE - PROMOTE 2 C6 Validation Report
Desert Dust
REF PROMOTE-2 C6 ISSUE 10 DATE 06062008 PAGE 4 of 36
13 Iberian sub-service Service iswill be operational sinceafter May 2007
Research partners Within validation phase will collaborate Miguel Aacutengel Martiacutenez (INM) Emilio Cuevas (Instituto Izantildea)
Provider(s) GMV
Validation contact Oscar Perez Navarro (e-mail operez at gmvcom)
131 Validation plan and validation data It is important to highlight that the validation has been performed using mainly the thresholds on effective radii and they are set as follows
bull Continental 0 le re le 04microm
bull Desert 01 le re le 8microm
bull Maritime 0 le re le 8microm
bull Biomass 0 le re le 02microm
bull Urban Thresholds are set so this type is never selected (the number of cases where this
bull type is expected to be realistic dominate is too small to attempt to include it in the automatic speciation scheme)
It has to be noted that as much of the comparison are with AERONET data then agreement with AERONET is likely to be poor if the assumed aerosol type is incorrect Results for the merged products therefore depend on the assignment of type which is known to be problematic in many cases
1311 Development and testing of a validation tool This sub-service was validated in 2006 but due to a change in user requirements a new validation plan is currently in progress As a consequence the service is at the moment in an improvement phase (development status)
A visualization tool has been developed allowing the user inspecting data produced defining validation parameters and obtaining graphical displays of validation results The interface developed allows saving test configuration parameters and generation of log files containing all steps followed by the users during the validation process Outputs are saved and can be displayed graphically using a range of colours to designate error ranges allowing users to pick a general idea about the overall quality of the comparison In addition dump parameters can also be defined and invoked by specific dump command lines Dump definitions and outputs can be saved loaded and displayed as well
The performance of this visualization tool is evaluated by means of traceability matrices allowing for the verification of design requirements Each software component (basically objects with associated functions and timing) identified and described in the Design shall be traceable from (forwards traceability) and to (backwards traceability) the requirements of the TS Furthermore UML rules and conventions shall apply to the production and verification of the models
GSE - PROMOTE 2 C6 Validation Report
Desert Dust
REF PROMOTE-2 C6 ISSUE 10 DATE 06062008 PAGE 5 of 36
A set of tests has been defined to verify the suitability of this tool as a guarantee of the coverage of the PROMOTE functionality and to set and verify the validation and quality control procedures to be applied to the products As a first step the test data selected for this purpose is used as an input and as a reference
Therefore a Unit Testing (UT) approach is taken in order to check the conformance of each software operation with its detailed design The expected result is that each individual software module behaves according to its detailed specification and therefore that each operation provides the expected outputs for different sets of inputs calls expected subprograms etc
Unit tests are built following a black box approach (ie the module is tested seeing its interface and not its internals) but assuring a full coverage as in white box testing all code lines of the module under test have been executed at least once and in reasonable combinations
In every validation-test phase it is needed to define Item passfail criteria in order to detect whenever a test is successfully executed Consequently each test procedure will have an outcome which should be clearly identifiable as a pass or a fail
1312 Validation by means of the visualization tool Every time a validation is started a set of risks is assessed Unit testing can be performed independently for each software module so that the risk of global testing suspension is very low ie when an error is found just the suspension of testing for this module would normally be required This allows the possibility of reducing the time spent for unit testing by allocating more people to this task
Making parallel unit and integration testing compatible could also shorten scheduled time Modules used for integration should have been previously tested at unit level so that those modules early required for integration are suggested to be unit tested first The best approach will be to carry out unit tests in the same order as modules are required for integration
Testing tasks have been described in previous sections They can be summarised as follows
bull Test design test cases specification and test procedures determination Document them in this document
bull Review this document for suitability of test cases for their intended purpose
bull Set up necessary files needed for test execution (eg test drivers and simulators scripts makefileshellip)
bull Execute the tests (compile necessary components link to an executable file download it to the target hardware examine test resultshellip) and document test results
bull Updates in sourcetest files and documents due to tests results
bull Execute regression test cases after software updates Regression testing shall be automated as far as possible to minimise effort in repeating tests
bull Progress revisions are planned as both the development (basically coding) and UT evolves to assess the status of activities but not formal reviews are planned until the end of the tests
GSE - PROMOTE 2 C6 Validation Report
Desert Dust
REF PROMOTE-2 C6 ISSUE 10 DATE 06062008 PAGE 6 of 36
Automated testing execution should be achieved in a very high degree This will provide easy execution and repetition of tests especially important for regression testing
1313 Validation of SEVIRI data with AERONET and ADRIEX data The preliminary inter-comparison has been done for the period 26th of August to the 30th of September 2004 for SEVIRI instrument
The SEVIRI data used in this analysis was version 0100 of level 1b and version 0100 of the cloud flag September 2004 has significant biomass burning at southern tropical sites such as central Africa and Southern America It is also within a period of significant desert dust plumes over the Atlantic this data set was used in the Aeronet validation and monthly comparisons The data from August 2004 was used in the case study comparison during the ADRIEX campaign and also to understand the variation of AOD with time All the SEVIRI data presented in this validation report was processed at RAL The data was produced at 10x10km resolution
The September 2004 period was selected to provide over lap with the ADRIEX campaign (27August - 6 September) The complete month of September was analysed for comparison with monthly composites from other satellite sensors This late period in the GAP temporal coverage is also suitable for the preliminary GAP in that (a) in more recent years the coverage of Aeronet data has greatly increased (b) SEVIRI data is routinely available since operation of Meteosat-8 commenced on 29 January 2004 The number of ground-stations receiving data (and hence coverage) has increased Algorithms to improve pointing knowledge have improved with time but the issue may well mean there is little value in validating SEVIRI aerosol from the 2004 preliminary GAP This will be investigated and if geo-location proves to be a severe limiting factor then a second month will be selected as preliminary GAP
The preliminary inter-comparison has been done for the period 26th of August to the 30th of September 2004 for SEVIRI instrument
VALIDATION DATA Ground basedin-situRemote Sensing (ADRIEX) observations AERONET stations Levels 10 15 20 Phase 1+2
httpaeronetgsfcnasagov Data availability and access All AERONET measurements for the given ground station are extracted with time plusmnDT of the satellite overpass The baseline for DT is 30 minutes (which given a typical aerosol transport speed of 50kmhour is consistent with the 50km spatial distance sampled from the service GAP Data (measurements) were provided into binary files Spatial coverage and resolution Pixels are selected within a region on plusmn20 km from each station (from a 10km resolution grid) Temporal coverage and resolution August-September 2004 Location(s) (coordinates) 3648deg lat 3428deg lon Accuracy 002 over ocean and 005 over land
GSE - PROMOTE 2 C6 Validation Report
Desert Dust
REF PROMOTE-2 C6 ISSUE 10 DATE 06062008 PAGE 7 of 36
ADRIEX Campaign Phase 1+2
Data availability and access Data is provided in binary files Spatial coverage and resolution 10 Km resolution grid Temporal coverage and resolution and resolution 27-08-20046-09-2004 Location(s) (coordinates) Northern Italy the Adriatic Sea and between Northern Italy and the West coast of the Black Sea Accuracy 002 over ocean and 005 over land
Model outputs NA
Other EO Data SEVIRI Version 0100 level 01 Version 0100 of cloud flag Phase 1+2
Data availability and access Images at 1012 et 1615 Spatial coverage and resolution 10x10 Km2 Temporal coverage and resolution 26-0830-09 2004 Location(s) (coordinates)computational domain Whole SEVIRI image Accuracy 002 over ocean and 005 over land
MODIS Phase 1+2 Data availability and access NA Spatial coverage and resolution1ordmx1ordm Temporal coverage and resolution September 2004 Location(s) (coordinates)computational domain Full earth coverage Accuracy 002 over ocean and 005 over land
Table 13-1 Data used for the validation of the Iberian Desert Dust Awareness sub-service
132 Validation of individual components
1321 SEVIRI cloud screening The Operational SEVIRI cloud flag was found at an early validation stage to underestimate the real amount of cloud in a pixel Fortunately the technique used to retrieve aerosol optical depth has a number of measures to identify cloud-contaminated pixels The following extra quality control was applied to identify cloudy pixels
bull Retrieval must reach a proper convergence
bull Optical depth is less than 30
bull Cost ie the measure of the fit to the aerosol model is less than 10 over land and less than 5 over sea
bull More than one iteration of the retrieval is performed
bull The effective radius retrieved is less than the maximum defined for the selected aerosol type
The Application of this quality control remove approximately extra 20 of pixels previously deemed clear
GSE - PROMOTE 2 C6 Validation Report
Desert Dust
REF PROMOTE-2 C6 ISSUE 10 DATE 06062008 PAGE 8 of 36
VALIDATION OF INDIVIDUAL COMPONENTS Best stimator ns
Screening procedures Identification of outliers AOD550 AOD870 The way to identify out of range values is
fixing a threshold that has been established on 30 as maximum and 00 as minimum (by definition) So the procedure is comparison against a fixed value
Bad retrievals Parameters checked for bad retrievals are exactly the same ad the ones considered for outliers AOD550 AOD870 We apply the following quality checks Cloud Fraction set to 0 Sun glint Effective radius lt 3Mm Surface albedo lt 012 Cost function lt3 for continental over sea Cost function lt10 for desert over sea Cost function lt30 for maritime over sea Cost function lt1 for biomass over sea Cost function lt30 for continental over land Cost function lt1 for desert over land Cost function lt1 for maritime over land Cost function lt2 for biomass over land
Quality checks Cloud Fraction set to 0 Sun-glint Effective radius lt 3Mm Surface albedo lt 012 Cost function lt3 for continental over sea Cost function lt10 for desert over sea Cost function lt30 for maritime over sea Cost function lt1 for biomass over sea Cost function lt30 for continental over land Cost function lt1 for desert over land Cost function lt1 for maritime over land Cost function lt2 for biomass over land
Accuracyerror 002 Over ocean and 005 over land
GSE - PROMOTE 2 C6 Validation Report
Desert Dust
REF PROMOTE-2 C6 ISSUE 10 DATE 06062008 PAGE 9 of 36
Cross-correlation With Aeronet Cost lt 10 Number of iterations gt 1 AOD lt 3 Cloud fraction = 00
Validation passfail criteria (Regression testing)
002 over ocean and 005 over land
Cloud screening quality control
See figure 13
Aeronet data manual inspection
na
Modelalgorithms SEVIRI Cloud flag needs a correction that can be done for Optical Depths of less than 3 and when the retrieved aerosol effective radius is smaller than 10 over land and smaller than 5 over sea See 1322 and Smirnov 2000
SEVIRI Cloud Screening (SEVIRI Cloud Mask v1)
The validation parameter is the standard deviation See Section 1322 and Smirnov 2000 AERONET Cloud Screening
(v20) See Figure 13-1Only Cloud free data is used for validation SKYNET vs AERONET
() The validation is done by mean of a cross-correlation Only Cloud free data is used for validation DISORT Model ()
The validation is done by mean of a cross-correlation
Sunglint calculated using ECMWF winds using the Cox and Monk formulation and an under light and foam contribution
Sunglint Correction (3rd SEVIRI Slot)
Not final parameter stored It is intermediated data used for the final process
Other
1x1 AOD Monthly averages Creation of Weekly or monthly products containing minimum maximum average and standard deviation of AOD and Angtstrom Coefficient The bin size may be selected for 1 kmX1 Km or 1ordmx1ordm
AOD averaged
Angstrom Coefficient Averaged
Table 13-2 Validation of individual components of the Iberian Service
GSE - PROMOTE 2 C6 Validation Report
Desert Dust
REF PROMOTE-2 C6 ISSUE 10 DATE 06062008 PAGE 10 of 36
1322 Screening procedures
Measurements which are contaminated by cloud are identified by a screening procedure Smirnov 2000 based on the assumption that large rapid variations in retrieved AOD are caused by clouds The flowchart for this screening process is shown in Figure 13-1
Filters are applied to the triplet of observations upon which a single AOD measurement is based and over all observations on a given day Only data which is known to be cloud free will be used for validation of PROMOTE products The screening procedure (which also includes a number of other quality control tests is illustrated schematically in Figure 3) In addition to the automatic cloud screening and quality assurance procedure data are also manually inspected at Aeronet to further ensure a consistent data quality (level 2 data) Only Level 2 data is used in this project
For each daily product a separate rdquocoincidence filerdquo containing all information required to perform the validation was generated as follows
For each of the selected Aeronet stations
bull The closest rdquoground-pixelrdquo (ie 10x10km grid box) is identified
bull AOD and Angstrom coefficient are extracted within a region on plusmnΔP pixels from this pixel The baseline value of ΔP is 2 from Ichoku 2003
GSE - PROMOTE 2 C6 Validation Report
Desert Dust
REF PROMOTE-2 C6 ISSUE 10 DATE 06062008 PAGE 11 of 36
Figure 13-1 Schematic of the Aeronet cloud screening procedure from Smirnov 2000
bull The number of valid PROMOTE retrievals mean and standard deviation of τA and σA from this spatial sample are determined and stored as NG μτG στG μαG σαG respectively The estimated accuracy of the mean quantities is also estimated and stored based on the error diagnostics provided with the retrieval (taking into account approximately whether these errors are expected to be random or systematic over the relevant spatial scale) ΔμτG ΔμαG
bull All Aeronet measurements for the given ground station are extracted with time plusmnΔT of the satellite overpass The baseline for ΔT is 30 minutes (which given a
GSE - PROMOTE 2 C6 Validation Report
Desert Dust
REF PROMOTE-2 C6 ISSUE 10 DATE 06062008 PAGE 12 of 36
typical aerosol transport speed of 50kmhour is consistent with the 50 km spatial distance sampled from the PROMOTE product if ΔP is 2)
bull The number of valid retrievals mean and standard deviation of τA and σA from this temporal sample are determined and stored as NA μτA στA μαA σαA respectively
bull There was no Earlinet lidar data provided that was time coincident with SEVIRI satellite retrievals
bull For SEVIRI a separate file is produced for each time-step
For the extraction of coincident measurements the following validations and inter-comparisons were undertaken
bull Comparison with Daily Aeronet measurements of optical depth at 087nm and 055nm
bull Inter-comparison with MODIS 1x1o monthly averaged optical depth
1323 Fits of Aeronet site measurements to coincident SEVIRI retrievals
SEVIRI optical depths are compared with the Aeronet retrieved optical depths A comparison is made assuming 6 different aerosol types and then with the merged data set which selects the optimal aerosol type based on cost The quality control applied in the first scenario is
1 Cost lt 10
2 Number of iterations gt 1
3 AOD lt 3
4 Cloud fraction = 00
In the merged data set after careful analysis of the data the selection criteria was biased to prefer continental or biomass aerosol over land and maritime or desert over sea The quality criteria applied in this case was
1 Cost lt 3 for continental over sea
2 Cost lt 10 for desert over sea
3 Cost lt 30 for maritime over sea
4 Cost lt 1 for biomass over sea
5 Cost lt 30 for continental over land
6 Cost lt 1 for desert over land
7 Cost lt 1 for maritime over land
8 Cost lt 2 for biomass over land
9 Number of iterations gt 1
10 AOD lt 3
11 Cloud fraction = 00
GSE - PROMOTE 2 C6 Validation Report
Desert Dust
REF PROMOTE-2 C6 ISSUE 10 DATE 06062008 PAGE 13 of 36
It must be noted that before the aerosol types are merged the appropriate bias correction must me made to the aerosol type selected
Figure 13-2 Comparison of 087 m Aeronet site measurement with SEVIRI measurements
Scattering aerosols Most aerosols fall into this category In this category the extinction is mainly a result of molecular (Rayleigh) scattering The aerosol types that fall into this category are the continental desert and maritime aerosols At small effective radius (re) the signal from these aerosols is almost identical only as the effective radius changes do the aerosol properties change
bull Absorbing aerosols The urban and biomass aerosols fall into this category These aerosols which may be composed of soot are strong absorbers and a considerable part of their reddening is due to the increase in their absorption at short wavelengths
bull All the aerosols types in the model used here are spherical
bull Ideally we would like to include many more aerosol types in particular mixed aerosols in the retrievals as theses are probably more realistic than some of the single aerosol types used here this is reserved for future investigations
GSE - PROMOTE 2 C6 Validation Report
Desert Dust
REF PROMOTE-2 C6 ISSUE 10 DATE 06062008 PAGE 14 of 36
Figure 13-3 Comparison of 055 m Aeronet site measurement with SEVIRI measurements and show that most of the retrievals fit a scattering aerosol in preference to an absorbing aerosol type The Aeronet retrievals in these figures are over sea land and coastal areas The 087nm channel has optical depths that are consistently smaller than the 055nm channel optical depths the 087nm AOD shows the best correlation over 80channel so this result is interpolated The comparisons with the 055nm channel show a positive bias at low AOD and a negative bias at high AOD The underestimation of AOD at high values has been noticed before in comparisons of MODIS data with Aeronet site In that paper they comment that the underestimation may be due to insufficient light absorption in aerosol models Perhaps a better channel to measure optical depth for SEVIRI would be the 067nm channel
1324 Results and show the comparison of each individual SEVIRI aerosol type with Aeronet 087 nm and 055nm channels respectively The error bars indicate the standard deviation of the AOD used over the plusmn30 minutes of Aeronet data and plusmn20 km of SEVIRI data to create the match up The line of best fit and correlation coefficient for each graph is calculated using the SEVIRI and Aeronet error bars It should be noted that we do not expect to see good agreement for all the measurements as clearly if the aerosol type used to retrieve the optical depth is the wrong type of aerosol then the optical depth retrieval will be incorrect In the simplest characterisation the aerosol types can in general be divided into 2 separate categories
GSE - PROMOTE 2 C6 Validation Report
Desert Dust
REF PROMOTE-2 C6 ISSUE 10 DATE 06062008 PAGE 15 of 36
Figure 13-4 Comparison of sea and coastal 087 m Aeronet site measurement with SEVIRI measurements
Figure 13-5 Comparison of sea and coastal 055 m Aeronet site measurement with SEVIRI measurements
In and only the Aeronet sites which are sited on the coast are considered ie the SEVIRI retrieval in these cases had a land fraction ranging from 0 to 099 The comparison with Aeronet observations in these cases is much better This reflects that it is generally easier to retrieve the properties of bright aerosols over dark surfaces At low optical depths there is a slight positive bias consistent with that seen by other remote sensing instruments such at MODIS This is most likely due to incorrect modelling of the ocean surface This is particularly a problem in coastal regions where the ocean colour
GSE - PROMOTE 2 C6 Validation Report
Desert Dust
REF PROMOTE-2 C6 ISSUE 10 DATE 06062008 PAGE 16 of 36
can vary substantially from the default Cox and Munk (with wind correction) calculation due to the presence of brighter type 2 coast waters At high optical depths there is a slight negative bias Interestingly for maritime aerosols there is a slight overall positive bias This could also be due to the difference in viewing geometry between the Aeronets cimel photometer and the geostationary SEVIRI instrument The Cimel photometer views pointing straight up while SEVIRI has a view angle that varies with latitude The SEVIRI measurement therefore has a longer path length that will intercept more aerosol The bias is relatively constant in the match ups identified in September 2004 nearly all of the match ups where in the European region
Figure 13-6 Comparison of land 0870nm Aeronet Site measurements with SEVIRI Measurements
Figure 13-7 Comparison of land 0550nm Aeronet Site measurements with SEVIRI Measurements
GSE - PROMOTE 2 C6 Validation Report
Desert Dust
REF PROMOTE-2 C6 ISSUE 10 DATE 06062008 PAGE 16 of 36
The land only matches ups shown in Figures 127 and 128 have considerably worse agreement between satellite and sun photometer retrievals This result suggests problems retrieving aerosol over highly reflective surfaces The worst retrievals were over desert surfaces In the absence of an operational SEVIRI surface reflectance product we have used the MODIS 16 day averaged albedo for the land surface reflectance that correspond to the SEVIRI channels While we allow the retrieval to adapt within errors to a different land surface reflectance this product could be improved
1325 Merging the aerosol types After studying the retrieval accuracy as a function of aerosol type it was decided to amalgamate only the continental maritime desert and biomass retrievals The urban and polluted maritime results gave misleading results when included in the amalgamation The validation plots and maps are still included for completeness and for further future flexibility Figure 129 shows the results of the retrievals that have been selected as the best match on the basis of cost The retrievals show a mix of aerosol types including some absorbing types that would be expected to be associated with urban areas The results are better for the 087nm channel than the 055nm channel There is a positive bias at low optical depth and a negative bias at high optical depths which is consistent with the individual aerosol comparisons This bias and slope will be corrected for in the merging algorithm Figures 1210 and 1211 show the comparison broken into sea and land sites
Figure 13-8 Amalgamated results for September 2004 1212 UTC The individual aerosol types were combined according to quality control and cost over land and sea
GSE - PROMOTE 2 C6 Validation Report
Desert Dust
REF PROMOTE-2 C6 ISSUE 10 DATE 06062008 PAGE 17 of 36
Figure 13-9 Amalgamated results for September 2004 1212 UTC The individual aerosol types were combined according to quality control and cost over land and sea
Figure 13-10 Amalgamated results for September 2004 1212 UTC The individual aerosol types were combined according to quality control and cost over land and sea
GSE - PROMOTE 2 C6 Validation Report
Desert Dust
REF PROMOTE-2 C6 ISSUE 10 DATE 06062008 PAGE 18 of 36
Figure 13-11 the right show scatter density distributions of the monthly mean value over sea
1326 Comparisons with other Satellite Platforms It have been also compared the service retrievals with MODIS and MISR Over sea the correlation with MODIS (061) is better than that between MISR and MODIS (048) Over land the correlation of SEVIRI with MISR (045) is better than that with MODIS (033) though not as good as the correlation between MISR and MODIS (062) It should however be noted that the region of the globe observed by SEVIRI omits Asian regions responsible for much of the global variability (ie there is less variability to be observed over the SEVIRI disk than globally so one might expect less correlation)
The following points relating to the SEVIRI AOD distribution are noted
bull The field is a daily product generated from individual retrievals from radiances observed at 1012 and 1612 UT No-data is acquired off the coast of southern Africa because this region is flagged as sun-glint in the 1012 image and has solar zenith angle greater than 70 at 1612 Apart from this feature however the ldquojoinrdquo between the regions sampled by one or both of the two radiance products is gratifyingly difficult to discern
bull Some of the high AODs off the north coast of South America are due to an underestimation of the spatial extent of sun-glint at 1612 (in turn due to probably erroneously low winds in the ECMWF analyses used to predict the glint area)
bull There appears to be some shift to the north of the high aerosol load over central southern Africa (which is mainly due to biomass burning) as observed by SEVIRI compared to MISR or MODIS (and compared to the associated plume off the east coast) This structure is likely to be due to problems modelling the surface reflectance over land in this region and is connected to the discrepancies found between SEVIRI AODs and those observed at the Mongu station
and land separately ldquo+rdquo symbols indicate the mean over all SEVIRI points within the indicated range of MODIS values Error bars indicate the corresponding standard deviation
GSE - PROMOTE 2 C6 Validation Report
Desert Dust
REF PROMOTE-2 C6 ISSUE 10 DATE 06062008 PAGE 19 of 36
al product and the most common aero l speciation identied
Figure 13-12 Number of data points in each bin of the of 1 degree gridded monthly statistic
so
GSE - PROMOTE 2 C6 Validation Report
Desert Dust
REF PROMOTE-2 C6 ISSUE 10 DATE 06062008 PAGE 20 of 36
1327 Conclusions Before discussing these results further it is worth noting that all aerosol retrieval schemes based on passive nadir visible near-infrared satellite imagery are subject to the following fundamental problems
1 Discrimination of aerosol from cloud The signal from most types of cloud is generally
much stronger than from aerosol Consequently even a relatively small amount of undetected cloud in a scene can cause large biases in retrieved AOD For this reason cloud masks are used to select only radiances which are cloud-free However care is required to avoid wrongly flagging cases of high aerosol load thereby omitting these potentially important events from the retrieved dataset and introducing a low bias into statistical analyses More fundamentally many clouds have aerosol as condensation nuclei and the point at which the ldquoaerosolrdquo becomes ldquocloudrdquo through growth of water droplets around the aerosol particle is ambiguous
2 Unknown aerosol composition The back-scattered signal observed by the satellite depends not only on the amount of aerosol present but crucially also on the phase function and single scatter albedo which in turn are dependent on the aerosol refractive index size distribution and particle shape There is generally insufficient information in remote measurements (even ground-based) to fully constrain the optical properties and as a consequence retrieved optical depths are quite strongly dependent upon a priori assumptions about the aerosol type
3 Surface reflection Over much of the land surface (and glint regions of sea) the signal from direct and diffuse reflection of radiation from the surface is much stronger than that from aerosol The sign of the aerosol effect on measured radiances changes depending on the surface reflectance and aerosol single scattering albedo so conditions exist in which radiances are insensitive to aerosol perturbations Relatively small errors in modelling the interaction of light with the surface can therefore cause significant error in aerosol retrieval For this reason retrieving aerosol over the (dark) ocean is relatively straightforward Retrievals over bright land surfaces are particularly challenging
The validation and inter-comparison results presented here demonstrate that all the products perform well over ocean yielding correlations with AERONET in the region of 08 (despite most stations being near the coast rather than open ocean) and correlations with the MODIS monthly mean distribution which are comparable or better than found between MODIS and MISR
Where problems exist these are almost exclusively related to retrievals over land The most positive results from the current official product set have been obtained for SEVIRI the AERONET correlation over land being 082 at 055microm without significant bias over many regions including Europe This leads to a number of impressive time-series comparisons with individual AERONET stations The SEVIRI agreement with MISR over land is also comparable to that between MISR and MODIS The benefit of geostationary observations in obtaining good sampling of the cloud-free atmosphere is clear from the number of good observations acquired even from the two observations per day that are analysed in the current set of products leading to a relatively large number of AERONET coincidences and a well sampled monthly mean field
The following recommendations are made based on the validation results and the considerations outlined above
GSE - PROMOTE 2 C6 Validation Report
Desert Dust
REF PROMOTE-2 C6 ISSUE 10 DATE 06062008 PAGE 21 of 36
bull There are indications of errors due to modelling of the surface reflectance in the SEVIRI retrieval (eg over central and southern Africa) These may be attributable to channel spectral response function difference compared to MODIS (use to define the a priori BRDF) Methods to correct for such systematic errors are being studied at the moment and could lead to a useful improvement in the short-term It is however noted that in the long-term it would be highly desirable to use surface BRDF information from SEVIRI itself
bull Some residual effect of sun-glint are evident in the SEVIRI product partly due to apparently underestimated wind-speeds in ECMWF Use of a minimum assumed wind speed to remove this effect is being considered
bull It would of course be desirable to process as many SEVIRI scenes in a single day as possible within available computing resource (SEVIRI acquires a scene every 15 minutes) Use of at least one additional time eg 1312 to complement the existing slots of 1012 and 1612 would be particularly desirable to eliminate the current data gap off eastern Africa which is contaminated by glint at 1012 and has too high a solar zenith angle at 1612 As noted above observing aerosol at different scattering angles can yield information on the phase function (and hence type) While multi-time observations cannot yet be directly exploited by the products scheme post analysis of retrievals at as many different time of day could help to improve the speciation (and hence estimated AOD) Multiple-time observations are of course also valuable for tracking the evolution of specific events
bull There is evidence of over-zealous cloud flagging leading to events of high aerosol load being omitted While the long-term aim would be to by-pass this issue altogether using a joint aerosol-cloud scheme for the current products more pragmatic measures to improve the current status would be desirable in the short-term For SEVIRI the cloud mask is not useful as a means of generating cloud-free radiances for partially cloudy scenes all partially cloud scenes are currently flagged as unreliable It would therefore make sense to process all scenes without regard to the Eumetsat cloud mask then rely (as is the case at the moment) on quality control criteria (including the Eumetsat cloud fraction) to screen cloud post-hoc
bull The assumed aerosol models (refractive indices size distribution assumed particle shape) do not of course perfectly represent the true aerosol conditions and improvements additions to the set of models used may well be worthwhile and are the subject of continuing research and development
GSE - PROMOTE 2 C6 Validation Report
Desert Dust
REF PROMOTE-2 C6 ISSUE 10 DATE 060620078 PAGE 22 of 38
133 Validation against specifications and against user requirements Requirements written in Italics are only recommended and not compulsory for Phase 2
VALIDATION AGAINST SERVICE SPECIFICATIONS
No limitationsdelays for compliance between theoretical and actual service specifications reported
VALIDATION AGAINST USER REQUIREMENTS
SPECIFICATION S5 REQUIRED ACTUAL
Parameters Latitude longitude Speciation Aerosol Optical Thickness 550nm Aerosol Optical Thickness 870nm Cloud Pixel Flag Land Sea Flag Sun Zenith Angle Sun Azimuth Angle View Zenith Angle Julian Date Effective Radius Angstrom Coefficient Angstrom Coefficient
Accuracy minimum ns ns
AOD plusmn 002 over ocean and plusmn 005 over
land
Accuracy target ns 15 ns
Spatial coverage South Europe (Spain Portugal and Italy)
South Europe (Spain Portugal
Macaronesia)
South Europe (Spain Portugal Macaronesia)
Horizontal resolution 10x10 Km2 ns 10x10 Km2
Vertical resolution ns ns ns
GridProjection Sinusoidal ns Sinusoidal
Temporal coverage 24 h ns 24 h
Temporal resolution 15 minutes ns 45 min
User Interfaces
PROMOTE Web ns Complete operational
up-to-date
Incomplete no operational not up to
date
ftp ns ns ns
On demand ns ns ns
Data formats and data delivery
Data availability ns Specific test periods in Phase 1 ns
GSE - PROMOTE 2 C6 Validation Report
Desert Dust
REF PROMOTE-2 C6 ISSUE 10 DATE 060620078 PAGE 23 of 38
Data access Online online Online
Delivery Mode
OfflineNRT
Phase 1 NRT for a specific test period to be defined
Phase 2 NRT For the available SEVIRI slots
NRT
Delivery frequency ns Daily Daily
Data Format IDL custom tool NetCDF netCDF HDF netCDF HDF
Historical archive None ns None
Visualization IDL custom tool NetCDF netCDF HDF ns
REMARKS
No Remarks
Requirements written in Italics are only recommended and not compulsory for Phase 1
Table 13-3 Validation of the Iberian Sub-service against specifications and against user requirements
134 Service quality assessment and control procedures
Service delivery start date The service was available from August 2007 but due to some problems found in the last validations the website was disabled due to user request (until products have the quality expected) It has been foreseen to open the site again in August 2008
SPECIFICATION S5 REQUIRED ACTUAL N checksDelivery period
Quality checks See Table 13-2
ns ns NA
Quality flags ns ns ns NA
Product confidence data
ns ns ns NA
Error bar definition and representation
NA NA NA NA
GSE - PROMOTE 2 C6 Validation Report
Desert Dust
REF PROMOTE-2 C6 ISSUE 10 DATE 060620078 PAGE 24 of 38
Representation of missing data
ns ns ns NA
Documentation of process failure
A control function which checks for
the presenceabsence of
implemented productauxiliary data It is split by
input data
ns ns NA
Version control mechanisms and representation
Version control process is enabled Current version is
11 Version number follows S5
upgrades
10-Pahse 1
11- Phase 2
ns ns NA
Requirements written in Italics are not compulsory for Phase 2
Table 13-4 Validation of quality assessment and control procedures for the Iberian Sub-service
GSE - PROMOTE 2 C6 Validation Report
Desert Dust
REF PROMOTE-2 C6 ISSUE 10 DATE 060620078 PAGE 25 of 38
14 Italian sub-service Service iswill be operational sinceafter January 2007
Research partners ISAC-CNR
Provider(s) CGS
Validation contact W Di Nicolantonio
Satellite desert dust detection is based on the radiances and Brightness Temperature (BT) sampled by the imaging radiometer SEVIRI (Spinning Enhanced Visible and InfraRed Imager) on board MSG-1 (Meteosat-8) meteorological satellite The high temporal (15 min) and spatial (about 4x4 km2 over the Mediterranean area) resolutions of MSG images in the IR channels allow to follow the evolution of dust transport towards the Italian region and may permit a link with threshold exceeding of PM concentrations measured in situ Desert Dust indicator maps are obtained by analyzing 87 108 and 120 μm SEVIRI IR channels
Figure 14-13 Desert dust transport highlighted in magenta as detected through the RGB BTD technique applied to SEVIRI IR channels as available for Phase 1
GSE - PROMOTE 2 C6 Validation Report
Desert Dust
REF PROMOTE-2 C6 ISSUE 10 DATE 060620078 PAGE 26 of 38
Figure 14-2 Desert dust transport highlighted in magenta as detected through the RGB BTD technique applied to SEVIRI IR channels for the
Mediterranean area monitored in Phase2 From the IR SEVIRI channels the two Difference of BT (BT120 ndash BT108) and (BT108 ndash BT87) needed to enhance the presence of desert dust are derived For sequence of RGB composite images where R=(BT120 ndash BT108) G=(BT108 ndash BT87) B=BT108 dust appears pink or magenta while for instance thick high-level clouds turn out red-brown and thin high-level clouds appear very dark In Figure 14-13 is reported a snapshot of the dust transport as detected by SEVIRI on 28 July 2005 at 12 am
141 Validation Plan and Validation Data For phase 1 validation dust transport events taking place in summer 2005 and detected by SEVIRMSG were compared to Lidar observation which are routinely carried out in Rome by ISAC-CNR Lidar observations allow detection of events of Saharan dust transport over Italy Dust particles are tipically non-spherical then Aerosol Depolarization level Da from Lidar measurements is a good indicator of the presence of mineral dust in the atmosphere Comparison have been made reporting time evolution of dust Aerosol Optical Depth minimum and maximum heights related to dust particles are recorded in order to classify the magnitude of the dust events as can be seen in Figure 14-
GSE - PROMOTE 2 C6 Validation Report
Desert Dust
REF PROMOTE-2 C6 ISSUE 10 DATE 060620078 PAGE 27 of 38
During the second phase of PROMOTE2 Lidar observations will be again employed for the comparison with time corresponding SEVIRI data for events from 2005 up to now
Figure 14-3 Lidar observations in Rome for three selected events in Summer 2005
A further indirect comparison about the presence of desert dust detected by SEVIRI was planned starting from the second phase of PROMOTE2 taking advantage of the several AERONET routine measurements carried out in the South Italy area In particular time patterns of Aerosol Optical Depth AOD and Aringngstroumlm parameter α in the visible wavelength range will be employed to highlight the presence of dust in terms of small values of parameter α accompanied by significant AOD Measurements since 2005 up to now will be analysed for the sites of Lampedusa (35N12E) Potenza (40N15E) Messina (38N15E) Lecce(40N18E) Tor Vergata (41N12E) Moreover to confirm the dust transport to the northern region of Italy AOD and α from Ispra (45N8E) station will be also examined For Phase 2 validation focus is on Spring 2007 for which 3 main events were detected analysing SEVIRIMSG data in terms of RGB-BTD
1 March 9 2007 2 April 8 ndash 18 2007 3 May 20 2007
and (for the AERONET comparison) on Summer 2005 for which 3 main events were detected analysing SEVIRIMSG data in terms of RGB-BTD
GSE - PROMOTE 2 C6 Validation Report
Desert Dust
REF PROMOTE-2 C6 ISSUE 10 DATE 060620078 PAGE 28 of 38
4 July 22 ndash August 08 2005 5 around August 10 2005 6 September 4 ndash 9 2005
As stated above lidar observations in Tor Vergata (Rome) [see Table 14-5] were employed In particular Figure 14-4 and Figure 14-5 show the time-patterns of dust AOD (AOD due only to the Saharan dust contribution to aerosol extinction) and corresponding minimum and maximum height of the dust layer Significant values of dust AOD are present around March 9 April 10 and May 20 together with layer heights ranging between 200 m to 7 km
0000
0100
0200
0300
0400
0500
0600
0700
270207 090307 190307 290307 080407 180407 280407 080507 180507 280507 070607
Dus
t aod
dust AOD
Figure 14-4 Time-pattern of the Aerosol Optical Depth only due to the saharan dust contribution (dust AOD) in the period March ndash May 2007 as recorded at Roma tor Vergata
0000
2000
4000
6000
8000
10000
270207 090307 190307 290307 080407 180407 280407 080507 180507 280507 070607
Dus
t Hei
ght (
km)
Zmin dust layerZmax dust layer
Figure 14-5 Time-pattern of the minimum and maximum height of the dust layer (Zmin dust layer Zmax dust layer) in the period March ndash May 2007 as recorded at Roma tor Vergata
Furthermore the indirect comparison against AERONET data [see table 14-1] has been made both for the events highlighted in Phase 1 validation (Summer 2005) and Phase2 validation (Spring
GSE - PROMOTE 2 C6 Validation Report
Desert Dust
REF PROMOTE-2 C6 ISSUE 10 DATE 060620078 PAGE 29 of 38
2007) AERONET Level2 data (iequality assured) for the Lampedusa and Lecce sites were available only for July-September 2005 period while Potenza and Messina data were available only for April-May 2007 Time patterns of Aerosol Optical Depth AOD at 440 nm and Angstroumlm parameter α relative to the visible wavelength range [440-870]nm are presented in the Figures below to highlight the presence of dust in terms of small values of parameter α accompanied by significant AOD Concerning Lampedusa site in summer 2005 (see Figure 14-6) an increase in AOD can be seen in correspondance of the decrease in parameter α for 2-4 August (214-216 julian day) AOD presents values lower than 02 at mid-July then undergoes to an increase up to 06 together with a decrease in α from 07 to almost 01 A similar behaviour can be recognized at the end of the event on 12-13 August (225-226 julian day) while in the period before a lack of data prevents further analysis Analysing time-patterns relative to Lecce AERONET site (Figure 14-7 ) AOD and α inversions are present around August 2 (214 julian day) August 12 (224 julian day) and from September 7 to 11 (250 ndash 254 julian day) Dust events in Spring 2007 did not significatively reach Messina and Potenza as can be seen in Figure 14-8 and Figure 14-9
GSE - PROMOTE 2 C6 Validation Report
Desert Dust
REF PROMOTE-2 C6 ISSUE 10 DATE 060620078 PAGE 30 of 38
Figure 14-6 Time-pattern of AOD 440 nm and Aringngstroumlm parameter α for July August and September 2005 at Lampedusa AERONET sites
GSE - PROMOTE 2 C6 Validation Report
Desert Dust
REF PROMOTE-2 C6 ISSUE 10 DATE 060620078 PAGE 31 of 38
Figure 14-7 Time-pattern of AOD 440 nm and Aringngstroumlm parameter α for July August and September 2005 at Lecce AERONET sites
Figure 14-8 Time-pattern of AOD 440 nm and Aringngstroumlm parameter for April and May 2007 at Messina AERONET sites
GSE - PROMOTE 2 C6 Validation Report
Desert Dust
REF PROMOTE-2 C6 ISSUE 10 DATE 060620078 PAGE 32 of 38
Figure 14-9 Time-pattern of AOD 440 nm and Aringngstroumlm parameter α for April and May 2007 at Potenza AERONET sites
VALIDATION DATA Ground basedin-situ observations Name Data availability and access (include access details if data is freely
available)AERONET data are freely available via web aeronetgsfcnasagov
AERONET observations - level 2
Spatial coverage and resolution NA Phase ( 2 ) Temporal coverage and resolution summer 2005 to december 2007 Location(s) (coordinates) Lampedusa (35N12E) Potenza (40N15E) Messina (38N15E) Lecce(40N18E) Uncertainty quantification (eg Accuracy) 002 for AOD
Name Data availability and access (include access details if data is freely available) events since 2005 available through QUITSAT ASI project from ISAC-CNR
Lidar observations Phase (1+2)
Spatial coverage and resolution NA Temporal coverage and resolution events since 2005 Location(s) (coordinates)Roma Tor Vergata (41N12E) Uncertainty quantification (eg Accuracy) TBD
Table 14-6 Data used for the validation of the Italian Desert Dust Awareness Sub-service
GSE - PROMOTE 2 C6 Validation Report
Desert Dust
REF PROMOTE-2 C6 ISSUE 10 DATE 060620078 PAGE 33 of 38
142 Validation of individual components Following Ackermann (1997) the so-called trispectral method is applied to MSG data In this approach brightness temperature differences (BTD) between the 108 and 87 μm channels set against BTD between the 12 and 108 μm channels enables to discriminate dust from the clear-sky over both oceans and lands In Figure 1-3 is reported an example of trispectral diagram applied to SEVIRI BTD Brightness Temperature Difference pertaining to July 27 2005 As can be seen in the figure three different populations can be discriminated relative to clear sky (blue triangles) clouds (brown diamonds) and desert dust (pink squares) pixels BTD SEVIRI data in spatial and temporal coincidences with Lidar andor AERONET sun-photometer observations will be analyzed for events in which all instruments detect dust presence SEVIRI in terms of BTD Lidar and sun-photometers in terms of Depolarization ratio AOD and Aringngstroumlm parameter
Figure 14-14 Example of trispectral diagram of BTD from MSG-1SEVIRI over the Mediterranean area related to July 27 2005
GSE - PROMOTE 2 C6 Validation Report
Desert Dust
REF PROMOTE-2 C6 ISSUE 10 DATE 060620078 PAGE 34 of 38
VALIDATION OF INDIVIDUAL COMPONENTS
Best estimator
ns Detection of the same dust event
Coincidence check Time-pattern diagrams for lidar data (dust AOD and dust layer height)
Quality assessment
Identification of outliers TBD
Quality checks Events detected by both SEVIRI and lidar measurements in terms of
1 Pixel magenta coloured for seviri (small values of the the differences BT(120-108) and positive small values of the differences of BT(108-87) and
2 Significatly high values of dust AOD as measured by the lidar
Accuracyerror no quantitative parameter defined TBD
Cloud screening quality control
Not enabled
Modelalgorithms
BTD technique Brightness Temperature Differences technique applied to 3 SEVIRI infrared bands IR87 IR108 and IR120 (Ackerman 1997)
RGB of BTD as false color composition httpwwweumetsatintendpsmsgchannel_interpindexhtml
Composite RGB
R=BT(IR120) ndashBT(IR108)
G= BT(IR108)-BT(IR87)
B=BT(IR108)
Consistency
MSG data vs LIDAR
in both period selected for validation with lidar measurements (Summer 05 Spring 07) events detected by MSG were detected in correspondance by lidar measurement in Roma Tor Vergata (see figs Figure 14-3 Figure 14-4 and Figure 14-5
GSE - PROMOTE 2 C6 Validation Report
Desert Dust
REF PROMOTE-2 C6 ISSUE 10 DATE 060620078 PAGE 35 of 38
MSG data vs In-situ
For periods selected in Summer 2005 AERONET data shown the typical behaviour of dust aerosol loading (see figs Figure 14-6 and Figure 14-7)
For period in spring 2007 AERONET sites providing level2 data are not reached by the dust transport as can be seen in the product available in the service web site and it is confirmed in figs Figure 14-8 Figure 14-9
Table 14-7 Validation of individual components of the Italian Service
Validation against specifications and against user requirements Requirements written in Italics are only recommended and not compulsory for Phase 1
VALIDATION AGAINST SERVICE SPECIFICATIONS
variation has been made in the processing chain regarding data format conversion in the data import part areas selection and data archiving
SPECIFICATION S5 REQUIRED ACTUAL
Parameters Desert dust indicator
Accuracy minimum NA ns NA
Accuracy target ns ns TBD
Spatial coverage 10degN ndash 50degN lat 20degW ndash 50degE long
Italy Phase 1 Italy
Phase 2 Mediterranean area (see Figure 14-2)
Horizontal resolution 3x3 Km2 (Ground pixel) ns 3x3 km2
Vertical resolution ns ns na
GridProjection MSG perspective ns MSG perspective
Temporal coverage transport events ns Phase 1 selected dust transport events
Phase 2 NRT monitoring with a delay of 24 hour
Temporal resolution 30 minutes ns 15 minutes
User Interfaces
GSE - PROMOTE 2 C6 Validation Report
Desert Dust
REF PROMOTE-2 C6 ISSUE 10 DATE 060620078 PAGE 36 of 38
PROMOTE Web ns Operational complete and up to date
Operational complete and not up to date
Phase 2 operational complete and updated
ftp ns ns on demand
Data formats and data delivery
Data availability
ns
Specific test periods in Phase 1 (agreed with
users)
In Phase 2 data from Saharian sources
towards Italy
Phase1 Dust transport events detected since
Summer 2005
Phase2 2006 since May whole 2007 and NRT monitoring for
2008
Data access Online online Online
Delivery Mode NRT NRT
Phase 1 Offline
Phase 2 through web-page
Delivery frequency 30 minutes ns 60 minutes
Data Format Png image sequences geotiff on demand Png image sequences
Historical archive None ns None
Visualization geoTIFF png and gif viewers geoTIFF png and gif
viewers
REMARKS
] NRT service planned for phase 3 is started during the phase 2
Table 14-8 Validation of the Italian Sub-service against specifications and against user requirements
GSE - PROMOTE 2 C6 Validation Report
Desert Dust
REF PROMOTE-2 C6 ISSUE 10 DATE 060620078 PAGE 37 of 38
143 Quality assessment and control procedures
Service delivery start date ns
SPECIFICATION S5 REQUIRED
ACTUAL N checksDelivery period
Quality checks See Table 14-7
ns detection of the same dust event by SEVIRI and lidar
Once during validation phase for the whole data-set
Quality flags ns ns NA NA
Product confidence data
ns ns NA NA
Error bar definition and representation
NA NA NA NA]
Representation of missing data
ns ns In the NRT chain a log file is generated with the list of days for which no data
are available
Log file during
processing
Documentation of process failure
Not enabled No automatic reporting on process failure
enabled Only screen reporting
available
ns not enabled not enabled
Version control mechanisms and representation
Version control process is enabled Current version is
11 Version number follows S5
upgrades
10-Phase 1
11- Phase 2
ns V 12 related to S5 April 08
ns
Requirements written in Italics are not compulsory for Phase 2
Table 14-9 Validation of quality control procedures for the Italian Sub-service
GSE - PROMOTE 2 C6 Validation Report
Desert Dust
REF PROMOTE-2 C6 ISSUE 10 DATE 060620078 PAGE 38 of 38
15 References
151 Electronic references httpaeronetgsfcnasagov
httpwwweumetsatintendpsmsgchannel_interpindexhtml
152 Bibliographic references Ackerman S 1997 ldquoRemote sensing of aerosols using satellite infrared observationsrdquo JGeophys Res 102 17069-17079 Gobbi G P F Barnaba and L Ammannato 2004 The vertical distribution of aerosols Saharan dust and cirrus clouds in Rome (Italy) in the year 2001 Atmospheric Chemistry and Physics Vol 4 351-359
- DOCUMENT STATUS SHEET
- DOCUMENT CHANGE RECORD
- LIST OF TABLES
- LIST OF FIGURES
- LIST OF ACRONYMS
- TABLE OF CONTENTS
- 1 DESERT DUST AWARENESS
-
- 11 Service Summary
- 11
- 12 Product characterization
- 13 Iberian sub-service
-
- 131 Validation plan and validation data
-
- 1311 Development and testing of a validation tool
- 1312 Validation by means of the visualization tool
- 1313 Validation of SEVIRI data with AERONET and ADRIEX data
-
- 132 Validation of individual components
-
- 1321 SEVIRI cloud screening
- 1322 Screening procedures
- 1323 Fits of Aeronet site measurements to coincident SEVIRI retrievals
- 1324 Results
- 1325 Merging the aerosol types
- 1326 Comparisons with other Satellite Platforms
- 1327 Conclusions
-
- 133 Validation against specifications and against user requirements
- 134 Service quality assessment and control procedures
-
- 14 Italian sub-service
-
- 141 Validation Plan and Validation Data
- 142 Validation of individual components
- sect Validation against specifications and against user requirements
- 143 Quality assessment and control procedures
-
- 15 References
-
- 151 Electronic references
- 152 Bibliographic references
-

GSE - PROMOTE 2 C6 Validation Report
Desert Dust
REF PROMOTE-2 C6 ISSUE 10 DATE 06062008 PAGE VI
LIST OF ACRONYMS
BT Brightness Temperature BTD Brightness Temperatures Difference CGS Carlo Gavazzi Space CNR Consiglio Nazionale delle Ricerche CTM Chemical Transport Model DCW Digital Chart of the World DVB Digital Video Broadcasting GEOS(x) Geostationary projection with sub-satellite point located at x degrees GMV Grupo de Mecaacutenica de Vuelo GRASS Geographical Resources Analisys Support System HRIT High Rate Information Transmission ISAC Institute of Atmospheric and Climatic Sciences MSG Meteosat Second Generation SAF Satellite Application Facility SEVIRI Spinning Enhanced Visible and Infra-Red Imager INM Instituto Nacional de Meteorologiacutea UML Unified Modelling Language TS Technical Specification
NA Not Available na not applicable ns not specified
GSE - PROMOTE 2 C6 Validation Report
Desert Dust
REF PROMOTE-2 C6 ISSUE 10 DATE 06062008 PAGE VII
TABLE OF CONTENTS
DOCUMENT STATUS SHEET II
DOCUMENT CHANGE RECORD III
LIST OF TABLESIV
LIST OF FIGURES V
LIST OF ACRONYMSVI
TABLE OF CONTENTS VII
1 DESERT DUST AWARENESS 1 11 Service Summary 1 12 Product characterization 1 13 Iberian sub-service 4
131 Validation plan and validation data 4 1311 Development and testing of a validation tool 4 1312 Validation by means of the visualization tool 5 1313 Validation of SEVIRI data with AERONET and ADRIEX data 6
132 Validation of individual components 7 1321 SEVIRI cloud screening 7 1322 Screening procedures 10 1323 Fits of Aeronet site measurements to coincident SEVIRI retrievals 12 1324 Results 14 1325 Merging the aerosol types 16 1326 Comparisons with other Satellite Platforms 18 1327 Conclusions 20
133 Validation against specifications and against user requirements 22 134 Service quality assessment and control procedures 23
14 Italian sub-service 25 141 Validation Plan and Validation Data 26 142 Validation of individual components 33 Validation against specifications and against user requirements 35
143 Quality assessment and control procedures 37 15 References 38
151 Electronic references 38 152 Bibliographic references 38
GSE - PROMOTE 2 C6 Validation Report
Desert Dust
REF PROMOTE-2 C6 ISSUE 10 DATE 06062008 PAGE VIII
ltPAGE INTENTIONALLY LEFT BLANKgt
GSE - PROMOTE 2 C6 Validation Report
Desert Dust
REF PROMOTE-2 C6 ISSUE 10 DATE 06062008 PAGE 1 of 36
1 DESERT DUST AWARENESS
11 Service Summary The desert dust awareness service is based on measurements of SEVIRI instrument on board MSG-1 and MSG-2 satellites The service uses infra-red bands and visible bands In particular visible bands can provide quantitative information on parameters such as Aerosol Optical Depth and Angstrom Coefficient Infra-red bands on the other hand can be adopted to enhance the presence of a desert dust transport towards the regions of interest The repetition cycle of SEVIRI measurements allows the tracking of desert dust outbreaks
AQ RECORD SERVICE
INTEGRATED AQ PLATFORM
LOCAL AQ FORECAST
DESERT DUST AWARENESS
URBANREGIONAL AQ ASSESSM ENT SERVICE
POLLEN
SATELLITE BASED PM DEM ONSTRATION SERVICE
REGIONAL AQ FORECAST
Air Quality
Iberian sub-service
Italian sub-service
Figure 11-1 Structure and position of the Desert Dust Awareness Service within PROMOTE 2 Air Quality
GSE - PROMOTE 2 C6 Validation Report
Desert Dust
REF PROMOTE-2 C6 ISSUE 10 DATE 06062008 PAGE 1 of 36
12 Product characterization The products consist of retrieved estimates of aerosol optical depth (AOD) at 055 and 087 microm IGAPs are individual sensor products for each day in which the ldquobestrdquo type has been selected from the 5 types considered by the algorthim (MARITIME URBAN DESERT DUST BIOMASS CONTINENTAL) The Angstroslashm coefficient derived from these two optical depths is also reported
Desert dust indicator
Parameter na
Typical range na
Determination of the typical range (Method criteria)
na
Maximum range na
Units na
Standards na
Speciation
Parameter Speciation
Typical range 0-4
Determination of the typical range (Method criteria)
0 Continental
1 Desert Dust
2 Maritime
3 Urban
4 Biomass
Maximum range na
Units na
Standards ns
Aerosol Optical Thickness 550 nm
Parameter AOD550
Typical range 0-13
GSE - PROMOTE 2 C6 Validation Report
Desert Dust
REF PROMOTE-2 C6 ISSUE 10 DATE 06062008 PAGE 2 of 36
Determination of the typical range (Method criteria)
na
Maximum range na
Units [-]Dimensionless
Standards ns
Aerosol Optical Thickness 870 nm
Parameter AOD870
Typical range 0-13
Determination of the typical range (Method criteria)
na
Maximum range na
Units [-]Dimensionless
Standards ns
Angstrom Coefficient
Parameter Angstrom Coefficient
Typical range 0-1
Determination of the typical range (Method criteria)
na
Maximum range na
Units [-] Dimensionless
Standards ns
Table 12-1 Desert Dust Awareness products characterization
GSE - PROMOTE 2 C6 Validation Report
Desert Dust
REF PROMOTE-2 C6 ISSUE 10 DATE 06062008 PAGE 3 of 36
ltPAGE INTENTIONALLY LEFT BLANKgt
GSE - PROMOTE 2 C6 Validation Report
Desert Dust
REF PROMOTE-2 C6 ISSUE 10 DATE 06062008 PAGE 4 of 36
13 Iberian sub-service Service iswill be operational sinceafter May 2007
Research partners Within validation phase will collaborate Miguel Aacutengel Martiacutenez (INM) Emilio Cuevas (Instituto Izantildea)
Provider(s) GMV
Validation contact Oscar Perez Navarro (e-mail operez at gmvcom)
131 Validation plan and validation data It is important to highlight that the validation has been performed using mainly the thresholds on effective radii and they are set as follows
bull Continental 0 le re le 04microm
bull Desert 01 le re le 8microm
bull Maritime 0 le re le 8microm
bull Biomass 0 le re le 02microm
bull Urban Thresholds are set so this type is never selected (the number of cases where this
bull type is expected to be realistic dominate is too small to attempt to include it in the automatic speciation scheme)
It has to be noted that as much of the comparison are with AERONET data then agreement with AERONET is likely to be poor if the assumed aerosol type is incorrect Results for the merged products therefore depend on the assignment of type which is known to be problematic in many cases
1311 Development and testing of a validation tool This sub-service was validated in 2006 but due to a change in user requirements a new validation plan is currently in progress As a consequence the service is at the moment in an improvement phase (development status)
A visualization tool has been developed allowing the user inspecting data produced defining validation parameters and obtaining graphical displays of validation results The interface developed allows saving test configuration parameters and generation of log files containing all steps followed by the users during the validation process Outputs are saved and can be displayed graphically using a range of colours to designate error ranges allowing users to pick a general idea about the overall quality of the comparison In addition dump parameters can also be defined and invoked by specific dump command lines Dump definitions and outputs can be saved loaded and displayed as well
The performance of this visualization tool is evaluated by means of traceability matrices allowing for the verification of design requirements Each software component (basically objects with associated functions and timing) identified and described in the Design shall be traceable from (forwards traceability) and to (backwards traceability) the requirements of the TS Furthermore UML rules and conventions shall apply to the production and verification of the models
GSE - PROMOTE 2 C6 Validation Report
Desert Dust
REF PROMOTE-2 C6 ISSUE 10 DATE 06062008 PAGE 5 of 36
A set of tests has been defined to verify the suitability of this tool as a guarantee of the coverage of the PROMOTE functionality and to set and verify the validation and quality control procedures to be applied to the products As a first step the test data selected for this purpose is used as an input and as a reference
Therefore a Unit Testing (UT) approach is taken in order to check the conformance of each software operation with its detailed design The expected result is that each individual software module behaves according to its detailed specification and therefore that each operation provides the expected outputs for different sets of inputs calls expected subprograms etc
Unit tests are built following a black box approach (ie the module is tested seeing its interface and not its internals) but assuring a full coverage as in white box testing all code lines of the module under test have been executed at least once and in reasonable combinations
In every validation-test phase it is needed to define Item passfail criteria in order to detect whenever a test is successfully executed Consequently each test procedure will have an outcome which should be clearly identifiable as a pass or a fail
1312 Validation by means of the visualization tool Every time a validation is started a set of risks is assessed Unit testing can be performed independently for each software module so that the risk of global testing suspension is very low ie when an error is found just the suspension of testing for this module would normally be required This allows the possibility of reducing the time spent for unit testing by allocating more people to this task
Making parallel unit and integration testing compatible could also shorten scheduled time Modules used for integration should have been previously tested at unit level so that those modules early required for integration are suggested to be unit tested first The best approach will be to carry out unit tests in the same order as modules are required for integration
Testing tasks have been described in previous sections They can be summarised as follows
bull Test design test cases specification and test procedures determination Document them in this document
bull Review this document for suitability of test cases for their intended purpose
bull Set up necessary files needed for test execution (eg test drivers and simulators scripts makefileshellip)
bull Execute the tests (compile necessary components link to an executable file download it to the target hardware examine test resultshellip) and document test results
bull Updates in sourcetest files and documents due to tests results
bull Execute regression test cases after software updates Regression testing shall be automated as far as possible to minimise effort in repeating tests
bull Progress revisions are planned as both the development (basically coding) and UT evolves to assess the status of activities but not formal reviews are planned until the end of the tests
GSE - PROMOTE 2 C6 Validation Report
Desert Dust
REF PROMOTE-2 C6 ISSUE 10 DATE 06062008 PAGE 6 of 36
Automated testing execution should be achieved in a very high degree This will provide easy execution and repetition of tests especially important for regression testing
1313 Validation of SEVIRI data with AERONET and ADRIEX data The preliminary inter-comparison has been done for the period 26th of August to the 30th of September 2004 for SEVIRI instrument
The SEVIRI data used in this analysis was version 0100 of level 1b and version 0100 of the cloud flag September 2004 has significant biomass burning at southern tropical sites such as central Africa and Southern America It is also within a period of significant desert dust plumes over the Atlantic this data set was used in the Aeronet validation and monthly comparisons The data from August 2004 was used in the case study comparison during the ADRIEX campaign and also to understand the variation of AOD with time All the SEVIRI data presented in this validation report was processed at RAL The data was produced at 10x10km resolution
The September 2004 period was selected to provide over lap with the ADRIEX campaign (27August - 6 September) The complete month of September was analysed for comparison with monthly composites from other satellite sensors This late period in the GAP temporal coverage is also suitable for the preliminary GAP in that (a) in more recent years the coverage of Aeronet data has greatly increased (b) SEVIRI data is routinely available since operation of Meteosat-8 commenced on 29 January 2004 The number of ground-stations receiving data (and hence coverage) has increased Algorithms to improve pointing knowledge have improved with time but the issue may well mean there is little value in validating SEVIRI aerosol from the 2004 preliminary GAP This will be investigated and if geo-location proves to be a severe limiting factor then a second month will be selected as preliminary GAP
The preliminary inter-comparison has been done for the period 26th of August to the 30th of September 2004 for SEVIRI instrument
VALIDATION DATA Ground basedin-situRemote Sensing (ADRIEX) observations AERONET stations Levels 10 15 20 Phase 1+2
httpaeronetgsfcnasagov Data availability and access All AERONET measurements for the given ground station are extracted with time plusmnDT of the satellite overpass The baseline for DT is 30 minutes (which given a typical aerosol transport speed of 50kmhour is consistent with the 50km spatial distance sampled from the service GAP Data (measurements) were provided into binary files Spatial coverage and resolution Pixels are selected within a region on plusmn20 km from each station (from a 10km resolution grid) Temporal coverage and resolution August-September 2004 Location(s) (coordinates) 3648deg lat 3428deg lon Accuracy 002 over ocean and 005 over land
GSE - PROMOTE 2 C6 Validation Report
Desert Dust
REF PROMOTE-2 C6 ISSUE 10 DATE 06062008 PAGE 7 of 36
ADRIEX Campaign Phase 1+2
Data availability and access Data is provided in binary files Spatial coverage and resolution 10 Km resolution grid Temporal coverage and resolution and resolution 27-08-20046-09-2004 Location(s) (coordinates) Northern Italy the Adriatic Sea and between Northern Italy and the West coast of the Black Sea Accuracy 002 over ocean and 005 over land
Model outputs NA
Other EO Data SEVIRI Version 0100 level 01 Version 0100 of cloud flag Phase 1+2
Data availability and access Images at 1012 et 1615 Spatial coverage and resolution 10x10 Km2 Temporal coverage and resolution 26-0830-09 2004 Location(s) (coordinates)computational domain Whole SEVIRI image Accuracy 002 over ocean and 005 over land
MODIS Phase 1+2 Data availability and access NA Spatial coverage and resolution1ordmx1ordm Temporal coverage and resolution September 2004 Location(s) (coordinates)computational domain Full earth coverage Accuracy 002 over ocean and 005 over land
Table 13-1 Data used for the validation of the Iberian Desert Dust Awareness sub-service
132 Validation of individual components
1321 SEVIRI cloud screening The Operational SEVIRI cloud flag was found at an early validation stage to underestimate the real amount of cloud in a pixel Fortunately the technique used to retrieve aerosol optical depth has a number of measures to identify cloud-contaminated pixels The following extra quality control was applied to identify cloudy pixels
bull Retrieval must reach a proper convergence
bull Optical depth is less than 30
bull Cost ie the measure of the fit to the aerosol model is less than 10 over land and less than 5 over sea
bull More than one iteration of the retrieval is performed
bull The effective radius retrieved is less than the maximum defined for the selected aerosol type
The Application of this quality control remove approximately extra 20 of pixels previously deemed clear
GSE - PROMOTE 2 C6 Validation Report
Desert Dust
REF PROMOTE-2 C6 ISSUE 10 DATE 06062008 PAGE 8 of 36
VALIDATION OF INDIVIDUAL COMPONENTS Best stimator ns
Screening procedures Identification of outliers AOD550 AOD870 The way to identify out of range values is
fixing a threshold that has been established on 30 as maximum and 00 as minimum (by definition) So the procedure is comparison against a fixed value
Bad retrievals Parameters checked for bad retrievals are exactly the same ad the ones considered for outliers AOD550 AOD870 We apply the following quality checks Cloud Fraction set to 0 Sun glint Effective radius lt 3Mm Surface albedo lt 012 Cost function lt3 for continental over sea Cost function lt10 for desert over sea Cost function lt30 for maritime over sea Cost function lt1 for biomass over sea Cost function lt30 for continental over land Cost function lt1 for desert over land Cost function lt1 for maritime over land Cost function lt2 for biomass over land
Quality checks Cloud Fraction set to 0 Sun-glint Effective radius lt 3Mm Surface albedo lt 012 Cost function lt3 for continental over sea Cost function lt10 for desert over sea Cost function lt30 for maritime over sea Cost function lt1 for biomass over sea Cost function lt30 for continental over land Cost function lt1 for desert over land Cost function lt1 for maritime over land Cost function lt2 for biomass over land
Accuracyerror 002 Over ocean and 005 over land
GSE - PROMOTE 2 C6 Validation Report
Desert Dust
REF PROMOTE-2 C6 ISSUE 10 DATE 06062008 PAGE 9 of 36
Cross-correlation With Aeronet Cost lt 10 Number of iterations gt 1 AOD lt 3 Cloud fraction = 00
Validation passfail criteria (Regression testing)
002 over ocean and 005 over land
Cloud screening quality control
See figure 13
Aeronet data manual inspection
na
Modelalgorithms SEVIRI Cloud flag needs a correction that can be done for Optical Depths of less than 3 and when the retrieved aerosol effective radius is smaller than 10 over land and smaller than 5 over sea See 1322 and Smirnov 2000
SEVIRI Cloud Screening (SEVIRI Cloud Mask v1)
The validation parameter is the standard deviation See Section 1322 and Smirnov 2000 AERONET Cloud Screening
(v20) See Figure 13-1Only Cloud free data is used for validation SKYNET vs AERONET
() The validation is done by mean of a cross-correlation Only Cloud free data is used for validation DISORT Model ()
The validation is done by mean of a cross-correlation
Sunglint calculated using ECMWF winds using the Cox and Monk formulation and an under light and foam contribution
Sunglint Correction (3rd SEVIRI Slot)
Not final parameter stored It is intermediated data used for the final process
Other
1x1 AOD Monthly averages Creation of Weekly or monthly products containing minimum maximum average and standard deviation of AOD and Angtstrom Coefficient The bin size may be selected for 1 kmX1 Km or 1ordmx1ordm
AOD averaged
Angstrom Coefficient Averaged
Table 13-2 Validation of individual components of the Iberian Service
GSE - PROMOTE 2 C6 Validation Report
Desert Dust
REF PROMOTE-2 C6 ISSUE 10 DATE 06062008 PAGE 10 of 36
1322 Screening procedures
Measurements which are contaminated by cloud are identified by a screening procedure Smirnov 2000 based on the assumption that large rapid variations in retrieved AOD are caused by clouds The flowchart for this screening process is shown in Figure 13-1
Filters are applied to the triplet of observations upon which a single AOD measurement is based and over all observations on a given day Only data which is known to be cloud free will be used for validation of PROMOTE products The screening procedure (which also includes a number of other quality control tests is illustrated schematically in Figure 3) In addition to the automatic cloud screening and quality assurance procedure data are also manually inspected at Aeronet to further ensure a consistent data quality (level 2 data) Only Level 2 data is used in this project
For each daily product a separate rdquocoincidence filerdquo containing all information required to perform the validation was generated as follows
For each of the selected Aeronet stations
bull The closest rdquoground-pixelrdquo (ie 10x10km grid box) is identified
bull AOD and Angstrom coefficient are extracted within a region on plusmnΔP pixels from this pixel The baseline value of ΔP is 2 from Ichoku 2003
GSE - PROMOTE 2 C6 Validation Report
Desert Dust
REF PROMOTE-2 C6 ISSUE 10 DATE 06062008 PAGE 11 of 36
Figure 13-1 Schematic of the Aeronet cloud screening procedure from Smirnov 2000
bull The number of valid PROMOTE retrievals mean and standard deviation of τA and σA from this spatial sample are determined and stored as NG μτG στG μαG σαG respectively The estimated accuracy of the mean quantities is also estimated and stored based on the error diagnostics provided with the retrieval (taking into account approximately whether these errors are expected to be random or systematic over the relevant spatial scale) ΔμτG ΔμαG
bull All Aeronet measurements for the given ground station are extracted with time plusmnΔT of the satellite overpass The baseline for ΔT is 30 minutes (which given a
GSE - PROMOTE 2 C6 Validation Report
Desert Dust
REF PROMOTE-2 C6 ISSUE 10 DATE 06062008 PAGE 12 of 36
typical aerosol transport speed of 50kmhour is consistent with the 50 km spatial distance sampled from the PROMOTE product if ΔP is 2)
bull The number of valid retrievals mean and standard deviation of τA and σA from this temporal sample are determined and stored as NA μτA στA μαA σαA respectively
bull There was no Earlinet lidar data provided that was time coincident with SEVIRI satellite retrievals
bull For SEVIRI a separate file is produced for each time-step
For the extraction of coincident measurements the following validations and inter-comparisons were undertaken
bull Comparison with Daily Aeronet measurements of optical depth at 087nm and 055nm
bull Inter-comparison with MODIS 1x1o monthly averaged optical depth
1323 Fits of Aeronet site measurements to coincident SEVIRI retrievals
SEVIRI optical depths are compared with the Aeronet retrieved optical depths A comparison is made assuming 6 different aerosol types and then with the merged data set which selects the optimal aerosol type based on cost The quality control applied in the first scenario is
1 Cost lt 10
2 Number of iterations gt 1
3 AOD lt 3
4 Cloud fraction = 00
In the merged data set after careful analysis of the data the selection criteria was biased to prefer continental or biomass aerosol over land and maritime or desert over sea The quality criteria applied in this case was
1 Cost lt 3 for continental over sea
2 Cost lt 10 for desert over sea
3 Cost lt 30 for maritime over sea
4 Cost lt 1 for biomass over sea
5 Cost lt 30 for continental over land
6 Cost lt 1 for desert over land
7 Cost lt 1 for maritime over land
8 Cost lt 2 for biomass over land
9 Number of iterations gt 1
10 AOD lt 3
11 Cloud fraction = 00
GSE - PROMOTE 2 C6 Validation Report
Desert Dust
REF PROMOTE-2 C6 ISSUE 10 DATE 06062008 PAGE 13 of 36
It must be noted that before the aerosol types are merged the appropriate bias correction must me made to the aerosol type selected
Figure 13-2 Comparison of 087 m Aeronet site measurement with SEVIRI measurements
Scattering aerosols Most aerosols fall into this category In this category the extinction is mainly a result of molecular (Rayleigh) scattering The aerosol types that fall into this category are the continental desert and maritime aerosols At small effective radius (re) the signal from these aerosols is almost identical only as the effective radius changes do the aerosol properties change
bull Absorbing aerosols The urban and biomass aerosols fall into this category These aerosols which may be composed of soot are strong absorbers and a considerable part of their reddening is due to the increase in their absorption at short wavelengths
bull All the aerosols types in the model used here are spherical
bull Ideally we would like to include many more aerosol types in particular mixed aerosols in the retrievals as theses are probably more realistic than some of the single aerosol types used here this is reserved for future investigations
GSE - PROMOTE 2 C6 Validation Report
Desert Dust
REF PROMOTE-2 C6 ISSUE 10 DATE 06062008 PAGE 14 of 36
Figure 13-3 Comparison of 055 m Aeronet site measurement with SEVIRI measurements and show that most of the retrievals fit a scattering aerosol in preference to an absorbing aerosol type The Aeronet retrievals in these figures are over sea land and coastal areas The 087nm channel has optical depths that are consistently smaller than the 055nm channel optical depths the 087nm AOD shows the best correlation over 80channel so this result is interpolated The comparisons with the 055nm channel show a positive bias at low AOD and a negative bias at high AOD The underestimation of AOD at high values has been noticed before in comparisons of MODIS data with Aeronet site In that paper they comment that the underestimation may be due to insufficient light absorption in aerosol models Perhaps a better channel to measure optical depth for SEVIRI would be the 067nm channel
1324 Results and show the comparison of each individual SEVIRI aerosol type with Aeronet 087 nm and 055nm channels respectively The error bars indicate the standard deviation of the AOD used over the plusmn30 minutes of Aeronet data and plusmn20 km of SEVIRI data to create the match up The line of best fit and correlation coefficient for each graph is calculated using the SEVIRI and Aeronet error bars It should be noted that we do not expect to see good agreement for all the measurements as clearly if the aerosol type used to retrieve the optical depth is the wrong type of aerosol then the optical depth retrieval will be incorrect In the simplest characterisation the aerosol types can in general be divided into 2 separate categories
GSE - PROMOTE 2 C6 Validation Report
Desert Dust
REF PROMOTE-2 C6 ISSUE 10 DATE 06062008 PAGE 15 of 36
Figure 13-4 Comparison of sea and coastal 087 m Aeronet site measurement with SEVIRI measurements
Figure 13-5 Comparison of sea and coastal 055 m Aeronet site measurement with SEVIRI measurements
In and only the Aeronet sites which are sited on the coast are considered ie the SEVIRI retrieval in these cases had a land fraction ranging from 0 to 099 The comparison with Aeronet observations in these cases is much better This reflects that it is generally easier to retrieve the properties of bright aerosols over dark surfaces At low optical depths there is a slight positive bias consistent with that seen by other remote sensing instruments such at MODIS This is most likely due to incorrect modelling of the ocean surface This is particularly a problem in coastal regions where the ocean colour
GSE - PROMOTE 2 C6 Validation Report
Desert Dust
REF PROMOTE-2 C6 ISSUE 10 DATE 06062008 PAGE 16 of 36
can vary substantially from the default Cox and Munk (with wind correction) calculation due to the presence of brighter type 2 coast waters At high optical depths there is a slight negative bias Interestingly for maritime aerosols there is a slight overall positive bias This could also be due to the difference in viewing geometry between the Aeronets cimel photometer and the geostationary SEVIRI instrument The Cimel photometer views pointing straight up while SEVIRI has a view angle that varies with latitude The SEVIRI measurement therefore has a longer path length that will intercept more aerosol The bias is relatively constant in the match ups identified in September 2004 nearly all of the match ups where in the European region
Figure 13-6 Comparison of land 0870nm Aeronet Site measurements with SEVIRI Measurements
Figure 13-7 Comparison of land 0550nm Aeronet Site measurements with SEVIRI Measurements
GSE - PROMOTE 2 C6 Validation Report
Desert Dust
REF PROMOTE-2 C6 ISSUE 10 DATE 06062008 PAGE 16 of 36
The land only matches ups shown in Figures 127 and 128 have considerably worse agreement between satellite and sun photometer retrievals This result suggests problems retrieving aerosol over highly reflective surfaces The worst retrievals were over desert surfaces In the absence of an operational SEVIRI surface reflectance product we have used the MODIS 16 day averaged albedo for the land surface reflectance that correspond to the SEVIRI channels While we allow the retrieval to adapt within errors to a different land surface reflectance this product could be improved
1325 Merging the aerosol types After studying the retrieval accuracy as a function of aerosol type it was decided to amalgamate only the continental maritime desert and biomass retrievals The urban and polluted maritime results gave misleading results when included in the amalgamation The validation plots and maps are still included for completeness and for further future flexibility Figure 129 shows the results of the retrievals that have been selected as the best match on the basis of cost The retrievals show a mix of aerosol types including some absorbing types that would be expected to be associated with urban areas The results are better for the 087nm channel than the 055nm channel There is a positive bias at low optical depth and a negative bias at high optical depths which is consistent with the individual aerosol comparisons This bias and slope will be corrected for in the merging algorithm Figures 1210 and 1211 show the comparison broken into sea and land sites
Figure 13-8 Amalgamated results for September 2004 1212 UTC The individual aerosol types were combined according to quality control and cost over land and sea
GSE - PROMOTE 2 C6 Validation Report
Desert Dust
REF PROMOTE-2 C6 ISSUE 10 DATE 06062008 PAGE 17 of 36
Figure 13-9 Amalgamated results for September 2004 1212 UTC The individual aerosol types were combined according to quality control and cost over land and sea
Figure 13-10 Amalgamated results for September 2004 1212 UTC The individual aerosol types were combined according to quality control and cost over land and sea
GSE - PROMOTE 2 C6 Validation Report
Desert Dust
REF PROMOTE-2 C6 ISSUE 10 DATE 06062008 PAGE 18 of 36
Figure 13-11 the right show scatter density distributions of the monthly mean value over sea
1326 Comparisons with other Satellite Platforms It have been also compared the service retrievals with MODIS and MISR Over sea the correlation with MODIS (061) is better than that between MISR and MODIS (048) Over land the correlation of SEVIRI with MISR (045) is better than that with MODIS (033) though not as good as the correlation between MISR and MODIS (062) It should however be noted that the region of the globe observed by SEVIRI omits Asian regions responsible for much of the global variability (ie there is less variability to be observed over the SEVIRI disk than globally so one might expect less correlation)
The following points relating to the SEVIRI AOD distribution are noted
bull The field is a daily product generated from individual retrievals from radiances observed at 1012 and 1612 UT No-data is acquired off the coast of southern Africa because this region is flagged as sun-glint in the 1012 image and has solar zenith angle greater than 70 at 1612 Apart from this feature however the ldquojoinrdquo between the regions sampled by one or both of the two radiance products is gratifyingly difficult to discern
bull Some of the high AODs off the north coast of South America are due to an underestimation of the spatial extent of sun-glint at 1612 (in turn due to probably erroneously low winds in the ECMWF analyses used to predict the glint area)
bull There appears to be some shift to the north of the high aerosol load over central southern Africa (which is mainly due to biomass burning) as observed by SEVIRI compared to MISR or MODIS (and compared to the associated plume off the east coast) This structure is likely to be due to problems modelling the surface reflectance over land in this region and is connected to the discrepancies found between SEVIRI AODs and those observed at the Mongu station
and land separately ldquo+rdquo symbols indicate the mean over all SEVIRI points within the indicated range of MODIS values Error bars indicate the corresponding standard deviation
GSE - PROMOTE 2 C6 Validation Report
Desert Dust
REF PROMOTE-2 C6 ISSUE 10 DATE 06062008 PAGE 19 of 36
al product and the most common aero l speciation identied
Figure 13-12 Number of data points in each bin of the of 1 degree gridded monthly statistic
so
GSE - PROMOTE 2 C6 Validation Report
Desert Dust
REF PROMOTE-2 C6 ISSUE 10 DATE 06062008 PAGE 20 of 36
1327 Conclusions Before discussing these results further it is worth noting that all aerosol retrieval schemes based on passive nadir visible near-infrared satellite imagery are subject to the following fundamental problems
1 Discrimination of aerosol from cloud The signal from most types of cloud is generally
much stronger than from aerosol Consequently even a relatively small amount of undetected cloud in a scene can cause large biases in retrieved AOD For this reason cloud masks are used to select only radiances which are cloud-free However care is required to avoid wrongly flagging cases of high aerosol load thereby omitting these potentially important events from the retrieved dataset and introducing a low bias into statistical analyses More fundamentally many clouds have aerosol as condensation nuclei and the point at which the ldquoaerosolrdquo becomes ldquocloudrdquo through growth of water droplets around the aerosol particle is ambiguous
2 Unknown aerosol composition The back-scattered signal observed by the satellite depends not only on the amount of aerosol present but crucially also on the phase function and single scatter albedo which in turn are dependent on the aerosol refractive index size distribution and particle shape There is generally insufficient information in remote measurements (even ground-based) to fully constrain the optical properties and as a consequence retrieved optical depths are quite strongly dependent upon a priori assumptions about the aerosol type
3 Surface reflection Over much of the land surface (and glint regions of sea) the signal from direct and diffuse reflection of radiation from the surface is much stronger than that from aerosol The sign of the aerosol effect on measured radiances changes depending on the surface reflectance and aerosol single scattering albedo so conditions exist in which radiances are insensitive to aerosol perturbations Relatively small errors in modelling the interaction of light with the surface can therefore cause significant error in aerosol retrieval For this reason retrieving aerosol over the (dark) ocean is relatively straightforward Retrievals over bright land surfaces are particularly challenging
The validation and inter-comparison results presented here demonstrate that all the products perform well over ocean yielding correlations with AERONET in the region of 08 (despite most stations being near the coast rather than open ocean) and correlations with the MODIS monthly mean distribution which are comparable or better than found between MODIS and MISR
Where problems exist these are almost exclusively related to retrievals over land The most positive results from the current official product set have been obtained for SEVIRI the AERONET correlation over land being 082 at 055microm without significant bias over many regions including Europe This leads to a number of impressive time-series comparisons with individual AERONET stations The SEVIRI agreement with MISR over land is also comparable to that between MISR and MODIS The benefit of geostationary observations in obtaining good sampling of the cloud-free atmosphere is clear from the number of good observations acquired even from the two observations per day that are analysed in the current set of products leading to a relatively large number of AERONET coincidences and a well sampled monthly mean field
The following recommendations are made based on the validation results and the considerations outlined above
GSE - PROMOTE 2 C6 Validation Report
Desert Dust
REF PROMOTE-2 C6 ISSUE 10 DATE 06062008 PAGE 21 of 36
bull There are indications of errors due to modelling of the surface reflectance in the SEVIRI retrieval (eg over central and southern Africa) These may be attributable to channel spectral response function difference compared to MODIS (use to define the a priori BRDF) Methods to correct for such systematic errors are being studied at the moment and could lead to a useful improvement in the short-term It is however noted that in the long-term it would be highly desirable to use surface BRDF information from SEVIRI itself
bull Some residual effect of sun-glint are evident in the SEVIRI product partly due to apparently underestimated wind-speeds in ECMWF Use of a minimum assumed wind speed to remove this effect is being considered
bull It would of course be desirable to process as many SEVIRI scenes in a single day as possible within available computing resource (SEVIRI acquires a scene every 15 minutes) Use of at least one additional time eg 1312 to complement the existing slots of 1012 and 1612 would be particularly desirable to eliminate the current data gap off eastern Africa which is contaminated by glint at 1012 and has too high a solar zenith angle at 1612 As noted above observing aerosol at different scattering angles can yield information on the phase function (and hence type) While multi-time observations cannot yet be directly exploited by the products scheme post analysis of retrievals at as many different time of day could help to improve the speciation (and hence estimated AOD) Multiple-time observations are of course also valuable for tracking the evolution of specific events
bull There is evidence of over-zealous cloud flagging leading to events of high aerosol load being omitted While the long-term aim would be to by-pass this issue altogether using a joint aerosol-cloud scheme for the current products more pragmatic measures to improve the current status would be desirable in the short-term For SEVIRI the cloud mask is not useful as a means of generating cloud-free radiances for partially cloudy scenes all partially cloud scenes are currently flagged as unreliable It would therefore make sense to process all scenes without regard to the Eumetsat cloud mask then rely (as is the case at the moment) on quality control criteria (including the Eumetsat cloud fraction) to screen cloud post-hoc
bull The assumed aerosol models (refractive indices size distribution assumed particle shape) do not of course perfectly represent the true aerosol conditions and improvements additions to the set of models used may well be worthwhile and are the subject of continuing research and development
GSE - PROMOTE 2 C6 Validation Report
Desert Dust
REF PROMOTE-2 C6 ISSUE 10 DATE 060620078 PAGE 22 of 38
133 Validation against specifications and against user requirements Requirements written in Italics are only recommended and not compulsory for Phase 2
VALIDATION AGAINST SERVICE SPECIFICATIONS
No limitationsdelays for compliance between theoretical and actual service specifications reported
VALIDATION AGAINST USER REQUIREMENTS
SPECIFICATION S5 REQUIRED ACTUAL
Parameters Latitude longitude Speciation Aerosol Optical Thickness 550nm Aerosol Optical Thickness 870nm Cloud Pixel Flag Land Sea Flag Sun Zenith Angle Sun Azimuth Angle View Zenith Angle Julian Date Effective Radius Angstrom Coefficient Angstrom Coefficient
Accuracy minimum ns ns
AOD plusmn 002 over ocean and plusmn 005 over
land
Accuracy target ns 15 ns
Spatial coverage South Europe (Spain Portugal and Italy)
South Europe (Spain Portugal
Macaronesia)
South Europe (Spain Portugal Macaronesia)
Horizontal resolution 10x10 Km2 ns 10x10 Km2
Vertical resolution ns ns ns
GridProjection Sinusoidal ns Sinusoidal
Temporal coverage 24 h ns 24 h
Temporal resolution 15 minutes ns 45 min
User Interfaces
PROMOTE Web ns Complete operational
up-to-date
Incomplete no operational not up to
date
ftp ns ns ns
On demand ns ns ns
Data formats and data delivery
Data availability ns Specific test periods in Phase 1 ns
GSE - PROMOTE 2 C6 Validation Report
Desert Dust
REF PROMOTE-2 C6 ISSUE 10 DATE 060620078 PAGE 23 of 38
Data access Online online Online
Delivery Mode
OfflineNRT
Phase 1 NRT for a specific test period to be defined
Phase 2 NRT For the available SEVIRI slots
NRT
Delivery frequency ns Daily Daily
Data Format IDL custom tool NetCDF netCDF HDF netCDF HDF
Historical archive None ns None
Visualization IDL custom tool NetCDF netCDF HDF ns
REMARKS
No Remarks
Requirements written in Italics are only recommended and not compulsory for Phase 1
Table 13-3 Validation of the Iberian Sub-service against specifications and against user requirements
134 Service quality assessment and control procedures
Service delivery start date The service was available from August 2007 but due to some problems found in the last validations the website was disabled due to user request (until products have the quality expected) It has been foreseen to open the site again in August 2008
SPECIFICATION S5 REQUIRED ACTUAL N checksDelivery period
Quality checks See Table 13-2
ns ns NA
Quality flags ns ns ns NA
Product confidence data
ns ns ns NA
Error bar definition and representation
NA NA NA NA
GSE - PROMOTE 2 C6 Validation Report
Desert Dust
REF PROMOTE-2 C6 ISSUE 10 DATE 060620078 PAGE 24 of 38
Representation of missing data
ns ns ns NA
Documentation of process failure
A control function which checks for
the presenceabsence of
implemented productauxiliary data It is split by
input data
ns ns NA
Version control mechanisms and representation
Version control process is enabled Current version is
11 Version number follows S5
upgrades
10-Pahse 1
11- Phase 2
ns ns NA
Requirements written in Italics are not compulsory for Phase 2
Table 13-4 Validation of quality assessment and control procedures for the Iberian Sub-service
GSE - PROMOTE 2 C6 Validation Report
Desert Dust
REF PROMOTE-2 C6 ISSUE 10 DATE 060620078 PAGE 25 of 38
14 Italian sub-service Service iswill be operational sinceafter January 2007
Research partners ISAC-CNR
Provider(s) CGS
Validation contact W Di Nicolantonio
Satellite desert dust detection is based on the radiances and Brightness Temperature (BT) sampled by the imaging radiometer SEVIRI (Spinning Enhanced Visible and InfraRed Imager) on board MSG-1 (Meteosat-8) meteorological satellite The high temporal (15 min) and spatial (about 4x4 km2 over the Mediterranean area) resolutions of MSG images in the IR channels allow to follow the evolution of dust transport towards the Italian region and may permit a link with threshold exceeding of PM concentrations measured in situ Desert Dust indicator maps are obtained by analyzing 87 108 and 120 μm SEVIRI IR channels
Figure 14-13 Desert dust transport highlighted in magenta as detected through the RGB BTD technique applied to SEVIRI IR channels as available for Phase 1
GSE - PROMOTE 2 C6 Validation Report
Desert Dust
REF PROMOTE-2 C6 ISSUE 10 DATE 060620078 PAGE 26 of 38
Figure 14-2 Desert dust transport highlighted in magenta as detected through the RGB BTD technique applied to SEVIRI IR channels for the
Mediterranean area monitored in Phase2 From the IR SEVIRI channels the two Difference of BT (BT120 ndash BT108) and (BT108 ndash BT87) needed to enhance the presence of desert dust are derived For sequence of RGB composite images where R=(BT120 ndash BT108) G=(BT108 ndash BT87) B=BT108 dust appears pink or magenta while for instance thick high-level clouds turn out red-brown and thin high-level clouds appear very dark In Figure 14-13 is reported a snapshot of the dust transport as detected by SEVIRI on 28 July 2005 at 12 am
141 Validation Plan and Validation Data For phase 1 validation dust transport events taking place in summer 2005 and detected by SEVIRMSG were compared to Lidar observation which are routinely carried out in Rome by ISAC-CNR Lidar observations allow detection of events of Saharan dust transport over Italy Dust particles are tipically non-spherical then Aerosol Depolarization level Da from Lidar measurements is a good indicator of the presence of mineral dust in the atmosphere Comparison have been made reporting time evolution of dust Aerosol Optical Depth minimum and maximum heights related to dust particles are recorded in order to classify the magnitude of the dust events as can be seen in Figure 14-
GSE - PROMOTE 2 C6 Validation Report
Desert Dust
REF PROMOTE-2 C6 ISSUE 10 DATE 060620078 PAGE 27 of 38
During the second phase of PROMOTE2 Lidar observations will be again employed for the comparison with time corresponding SEVIRI data for events from 2005 up to now
Figure 14-3 Lidar observations in Rome for three selected events in Summer 2005
A further indirect comparison about the presence of desert dust detected by SEVIRI was planned starting from the second phase of PROMOTE2 taking advantage of the several AERONET routine measurements carried out in the South Italy area In particular time patterns of Aerosol Optical Depth AOD and Aringngstroumlm parameter α in the visible wavelength range will be employed to highlight the presence of dust in terms of small values of parameter α accompanied by significant AOD Measurements since 2005 up to now will be analysed for the sites of Lampedusa (35N12E) Potenza (40N15E) Messina (38N15E) Lecce(40N18E) Tor Vergata (41N12E) Moreover to confirm the dust transport to the northern region of Italy AOD and α from Ispra (45N8E) station will be also examined For Phase 2 validation focus is on Spring 2007 for which 3 main events were detected analysing SEVIRIMSG data in terms of RGB-BTD
1 March 9 2007 2 April 8 ndash 18 2007 3 May 20 2007
and (for the AERONET comparison) on Summer 2005 for which 3 main events were detected analysing SEVIRIMSG data in terms of RGB-BTD
GSE - PROMOTE 2 C6 Validation Report
Desert Dust
REF PROMOTE-2 C6 ISSUE 10 DATE 060620078 PAGE 28 of 38
4 July 22 ndash August 08 2005 5 around August 10 2005 6 September 4 ndash 9 2005
As stated above lidar observations in Tor Vergata (Rome) [see Table 14-5] were employed In particular Figure 14-4 and Figure 14-5 show the time-patterns of dust AOD (AOD due only to the Saharan dust contribution to aerosol extinction) and corresponding minimum and maximum height of the dust layer Significant values of dust AOD are present around March 9 April 10 and May 20 together with layer heights ranging between 200 m to 7 km
0000
0100
0200
0300
0400
0500
0600
0700
270207 090307 190307 290307 080407 180407 280407 080507 180507 280507 070607
Dus
t aod
dust AOD
Figure 14-4 Time-pattern of the Aerosol Optical Depth only due to the saharan dust contribution (dust AOD) in the period March ndash May 2007 as recorded at Roma tor Vergata
0000
2000
4000
6000
8000
10000
270207 090307 190307 290307 080407 180407 280407 080507 180507 280507 070607
Dus
t Hei
ght (
km)
Zmin dust layerZmax dust layer
Figure 14-5 Time-pattern of the minimum and maximum height of the dust layer (Zmin dust layer Zmax dust layer) in the period March ndash May 2007 as recorded at Roma tor Vergata
Furthermore the indirect comparison against AERONET data [see table 14-1] has been made both for the events highlighted in Phase 1 validation (Summer 2005) and Phase2 validation (Spring
GSE - PROMOTE 2 C6 Validation Report
Desert Dust
REF PROMOTE-2 C6 ISSUE 10 DATE 060620078 PAGE 29 of 38
2007) AERONET Level2 data (iequality assured) for the Lampedusa and Lecce sites were available only for July-September 2005 period while Potenza and Messina data were available only for April-May 2007 Time patterns of Aerosol Optical Depth AOD at 440 nm and Angstroumlm parameter α relative to the visible wavelength range [440-870]nm are presented in the Figures below to highlight the presence of dust in terms of small values of parameter α accompanied by significant AOD Concerning Lampedusa site in summer 2005 (see Figure 14-6) an increase in AOD can be seen in correspondance of the decrease in parameter α for 2-4 August (214-216 julian day) AOD presents values lower than 02 at mid-July then undergoes to an increase up to 06 together with a decrease in α from 07 to almost 01 A similar behaviour can be recognized at the end of the event on 12-13 August (225-226 julian day) while in the period before a lack of data prevents further analysis Analysing time-patterns relative to Lecce AERONET site (Figure 14-7 ) AOD and α inversions are present around August 2 (214 julian day) August 12 (224 julian day) and from September 7 to 11 (250 ndash 254 julian day) Dust events in Spring 2007 did not significatively reach Messina and Potenza as can be seen in Figure 14-8 and Figure 14-9
GSE - PROMOTE 2 C6 Validation Report
Desert Dust
REF PROMOTE-2 C6 ISSUE 10 DATE 060620078 PAGE 30 of 38
Figure 14-6 Time-pattern of AOD 440 nm and Aringngstroumlm parameter α for July August and September 2005 at Lampedusa AERONET sites
GSE - PROMOTE 2 C6 Validation Report
Desert Dust
REF PROMOTE-2 C6 ISSUE 10 DATE 060620078 PAGE 31 of 38
Figure 14-7 Time-pattern of AOD 440 nm and Aringngstroumlm parameter α for July August and September 2005 at Lecce AERONET sites
Figure 14-8 Time-pattern of AOD 440 nm and Aringngstroumlm parameter for April and May 2007 at Messina AERONET sites
GSE - PROMOTE 2 C6 Validation Report
Desert Dust
REF PROMOTE-2 C6 ISSUE 10 DATE 060620078 PAGE 32 of 38
Figure 14-9 Time-pattern of AOD 440 nm and Aringngstroumlm parameter α for April and May 2007 at Potenza AERONET sites
VALIDATION DATA Ground basedin-situ observations Name Data availability and access (include access details if data is freely
available)AERONET data are freely available via web aeronetgsfcnasagov
AERONET observations - level 2
Spatial coverage and resolution NA Phase ( 2 ) Temporal coverage and resolution summer 2005 to december 2007 Location(s) (coordinates) Lampedusa (35N12E) Potenza (40N15E) Messina (38N15E) Lecce(40N18E) Uncertainty quantification (eg Accuracy) 002 for AOD
Name Data availability and access (include access details if data is freely available) events since 2005 available through QUITSAT ASI project from ISAC-CNR
Lidar observations Phase (1+2)
Spatial coverage and resolution NA Temporal coverage and resolution events since 2005 Location(s) (coordinates)Roma Tor Vergata (41N12E) Uncertainty quantification (eg Accuracy) TBD
Table 14-6 Data used for the validation of the Italian Desert Dust Awareness Sub-service
GSE - PROMOTE 2 C6 Validation Report
Desert Dust
REF PROMOTE-2 C6 ISSUE 10 DATE 060620078 PAGE 33 of 38
142 Validation of individual components Following Ackermann (1997) the so-called trispectral method is applied to MSG data In this approach brightness temperature differences (BTD) between the 108 and 87 μm channels set against BTD between the 12 and 108 μm channels enables to discriminate dust from the clear-sky over both oceans and lands In Figure 1-3 is reported an example of trispectral diagram applied to SEVIRI BTD Brightness Temperature Difference pertaining to July 27 2005 As can be seen in the figure three different populations can be discriminated relative to clear sky (blue triangles) clouds (brown diamonds) and desert dust (pink squares) pixels BTD SEVIRI data in spatial and temporal coincidences with Lidar andor AERONET sun-photometer observations will be analyzed for events in which all instruments detect dust presence SEVIRI in terms of BTD Lidar and sun-photometers in terms of Depolarization ratio AOD and Aringngstroumlm parameter
Figure 14-14 Example of trispectral diagram of BTD from MSG-1SEVIRI over the Mediterranean area related to July 27 2005
GSE - PROMOTE 2 C6 Validation Report
Desert Dust
REF PROMOTE-2 C6 ISSUE 10 DATE 060620078 PAGE 34 of 38
VALIDATION OF INDIVIDUAL COMPONENTS
Best estimator
ns Detection of the same dust event
Coincidence check Time-pattern diagrams for lidar data (dust AOD and dust layer height)
Quality assessment
Identification of outliers TBD
Quality checks Events detected by both SEVIRI and lidar measurements in terms of
1 Pixel magenta coloured for seviri (small values of the the differences BT(120-108) and positive small values of the differences of BT(108-87) and
2 Significatly high values of dust AOD as measured by the lidar
Accuracyerror no quantitative parameter defined TBD
Cloud screening quality control
Not enabled
Modelalgorithms
BTD technique Brightness Temperature Differences technique applied to 3 SEVIRI infrared bands IR87 IR108 and IR120 (Ackerman 1997)
RGB of BTD as false color composition httpwwweumetsatintendpsmsgchannel_interpindexhtml
Composite RGB
R=BT(IR120) ndashBT(IR108)
G= BT(IR108)-BT(IR87)
B=BT(IR108)
Consistency
MSG data vs LIDAR
in both period selected for validation with lidar measurements (Summer 05 Spring 07) events detected by MSG were detected in correspondance by lidar measurement in Roma Tor Vergata (see figs Figure 14-3 Figure 14-4 and Figure 14-5
GSE - PROMOTE 2 C6 Validation Report
Desert Dust
REF PROMOTE-2 C6 ISSUE 10 DATE 060620078 PAGE 35 of 38
MSG data vs In-situ
For periods selected in Summer 2005 AERONET data shown the typical behaviour of dust aerosol loading (see figs Figure 14-6 and Figure 14-7)
For period in spring 2007 AERONET sites providing level2 data are not reached by the dust transport as can be seen in the product available in the service web site and it is confirmed in figs Figure 14-8 Figure 14-9
Table 14-7 Validation of individual components of the Italian Service
Validation against specifications and against user requirements Requirements written in Italics are only recommended and not compulsory for Phase 1
VALIDATION AGAINST SERVICE SPECIFICATIONS
variation has been made in the processing chain regarding data format conversion in the data import part areas selection and data archiving
SPECIFICATION S5 REQUIRED ACTUAL
Parameters Desert dust indicator
Accuracy minimum NA ns NA
Accuracy target ns ns TBD
Spatial coverage 10degN ndash 50degN lat 20degW ndash 50degE long
Italy Phase 1 Italy
Phase 2 Mediterranean area (see Figure 14-2)
Horizontal resolution 3x3 Km2 (Ground pixel) ns 3x3 km2
Vertical resolution ns ns na
GridProjection MSG perspective ns MSG perspective
Temporal coverage transport events ns Phase 1 selected dust transport events
Phase 2 NRT monitoring with a delay of 24 hour
Temporal resolution 30 minutes ns 15 minutes
User Interfaces
GSE - PROMOTE 2 C6 Validation Report
Desert Dust
REF PROMOTE-2 C6 ISSUE 10 DATE 060620078 PAGE 36 of 38
PROMOTE Web ns Operational complete and up to date
Operational complete and not up to date
Phase 2 operational complete and updated
ftp ns ns on demand
Data formats and data delivery
Data availability
ns
Specific test periods in Phase 1 (agreed with
users)
In Phase 2 data from Saharian sources
towards Italy
Phase1 Dust transport events detected since
Summer 2005
Phase2 2006 since May whole 2007 and NRT monitoring for
2008
Data access Online online Online
Delivery Mode NRT NRT
Phase 1 Offline
Phase 2 through web-page
Delivery frequency 30 minutes ns 60 minutes
Data Format Png image sequences geotiff on demand Png image sequences
Historical archive None ns None
Visualization geoTIFF png and gif viewers geoTIFF png and gif
viewers
REMARKS
] NRT service planned for phase 3 is started during the phase 2
Table 14-8 Validation of the Italian Sub-service against specifications and against user requirements
GSE - PROMOTE 2 C6 Validation Report
Desert Dust
REF PROMOTE-2 C6 ISSUE 10 DATE 060620078 PAGE 37 of 38
143 Quality assessment and control procedures
Service delivery start date ns
SPECIFICATION S5 REQUIRED
ACTUAL N checksDelivery period
Quality checks See Table 14-7
ns detection of the same dust event by SEVIRI and lidar
Once during validation phase for the whole data-set
Quality flags ns ns NA NA
Product confidence data
ns ns NA NA
Error bar definition and representation
NA NA NA NA]
Representation of missing data
ns ns In the NRT chain a log file is generated with the list of days for which no data
are available
Log file during
processing
Documentation of process failure
Not enabled No automatic reporting on process failure
enabled Only screen reporting
available
ns not enabled not enabled
Version control mechanisms and representation
Version control process is enabled Current version is
11 Version number follows S5
upgrades
10-Phase 1
11- Phase 2
ns V 12 related to S5 April 08
ns
Requirements written in Italics are not compulsory for Phase 2
Table 14-9 Validation of quality control procedures for the Italian Sub-service
GSE - PROMOTE 2 C6 Validation Report
Desert Dust
REF PROMOTE-2 C6 ISSUE 10 DATE 060620078 PAGE 38 of 38
15 References
151 Electronic references httpaeronetgsfcnasagov
httpwwweumetsatintendpsmsgchannel_interpindexhtml
152 Bibliographic references Ackerman S 1997 ldquoRemote sensing of aerosols using satellite infrared observationsrdquo JGeophys Res 102 17069-17079 Gobbi G P F Barnaba and L Ammannato 2004 The vertical distribution of aerosols Saharan dust and cirrus clouds in Rome (Italy) in the year 2001 Atmospheric Chemistry and Physics Vol 4 351-359
- DOCUMENT STATUS SHEET
- DOCUMENT CHANGE RECORD
- LIST OF TABLES
- LIST OF FIGURES
- LIST OF ACRONYMS
- TABLE OF CONTENTS
- 1 DESERT DUST AWARENESS
-
- 11 Service Summary
- 11
- 12 Product characterization
- 13 Iberian sub-service
-
- 131 Validation plan and validation data
-
- 1311 Development and testing of a validation tool
- 1312 Validation by means of the visualization tool
- 1313 Validation of SEVIRI data with AERONET and ADRIEX data
-
- 132 Validation of individual components
-
- 1321 SEVIRI cloud screening
- 1322 Screening procedures
- 1323 Fits of Aeronet site measurements to coincident SEVIRI retrievals
- 1324 Results
- 1325 Merging the aerosol types
- 1326 Comparisons with other Satellite Platforms
- 1327 Conclusions
-
- 133 Validation against specifications and against user requirements
- 134 Service quality assessment and control procedures
-
- 14 Italian sub-service
-
- 141 Validation Plan and Validation Data
- 142 Validation of individual components
- sect Validation against specifications and against user requirements
- 143 Quality assessment and control procedures
-
- 15 References
-
- 151 Electronic references
- 152 Bibliographic references
-
GSE - PROMOTE 2 C6 Validation Report
Desert Dust
REF PROMOTE-2 C6 ISSUE 10 DATE 06062008 PAGE VII
TABLE OF CONTENTS
DOCUMENT STATUS SHEET II
DOCUMENT CHANGE RECORD III
LIST OF TABLESIV
LIST OF FIGURES V
LIST OF ACRONYMSVI
TABLE OF CONTENTS VII
1 DESERT DUST AWARENESS 1 11 Service Summary 1 12 Product characterization 1 13 Iberian sub-service 4
131 Validation plan and validation data 4 1311 Development and testing of a validation tool 4 1312 Validation by means of the visualization tool 5 1313 Validation of SEVIRI data with AERONET and ADRIEX data 6
132 Validation of individual components 7 1321 SEVIRI cloud screening 7 1322 Screening procedures 10 1323 Fits of Aeronet site measurements to coincident SEVIRI retrievals 12 1324 Results 14 1325 Merging the aerosol types 16 1326 Comparisons with other Satellite Platforms 18 1327 Conclusions 20
133 Validation against specifications and against user requirements 22 134 Service quality assessment and control procedures 23
14 Italian sub-service 25 141 Validation Plan and Validation Data 26 142 Validation of individual components 33 Validation against specifications and against user requirements 35
143 Quality assessment and control procedures 37 15 References 38
151 Electronic references 38 152 Bibliographic references 38
GSE - PROMOTE 2 C6 Validation Report
Desert Dust
REF PROMOTE-2 C6 ISSUE 10 DATE 06062008 PAGE VIII
ltPAGE INTENTIONALLY LEFT BLANKgt
GSE - PROMOTE 2 C6 Validation Report
Desert Dust
REF PROMOTE-2 C6 ISSUE 10 DATE 06062008 PAGE 1 of 36
1 DESERT DUST AWARENESS
11 Service Summary The desert dust awareness service is based on measurements of SEVIRI instrument on board MSG-1 and MSG-2 satellites The service uses infra-red bands and visible bands In particular visible bands can provide quantitative information on parameters such as Aerosol Optical Depth and Angstrom Coefficient Infra-red bands on the other hand can be adopted to enhance the presence of a desert dust transport towards the regions of interest The repetition cycle of SEVIRI measurements allows the tracking of desert dust outbreaks
AQ RECORD SERVICE
INTEGRATED AQ PLATFORM
LOCAL AQ FORECAST
DESERT DUST AWARENESS
URBANREGIONAL AQ ASSESSM ENT SERVICE
POLLEN
SATELLITE BASED PM DEM ONSTRATION SERVICE
REGIONAL AQ FORECAST
Air Quality
Iberian sub-service
Italian sub-service
Figure 11-1 Structure and position of the Desert Dust Awareness Service within PROMOTE 2 Air Quality
GSE - PROMOTE 2 C6 Validation Report
Desert Dust
REF PROMOTE-2 C6 ISSUE 10 DATE 06062008 PAGE 1 of 36
12 Product characterization The products consist of retrieved estimates of aerosol optical depth (AOD) at 055 and 087 microm IGAPs are individual sensor products for each day in which the ldquobestrdquo type has been selected from the 5 types considered by the algorthim (MARITIME URBAN DESERT DUST BIOMASS CONTINENTAL) The Angstroslashm coefficient derived from these two optical depths is also reported
Desert dust indicator
Parameter na
Typical range na
Determination of the typical range (Method criteria)
na
Maximum range na
Units na
Standards na
Speciation
Parameter Speciation
Typical range 0-4
Determination of the typical range (Method criteria)
0 Continental
1 Desert Dust
2 Maritime
3 Urban
4 Biomass
Maximum range na
Units na
Standards ns
Aerosol Optical Thickness 550 nm
Parameter AOD550
Typical range 0-13
GSE - PROMOTE 2 C6 Validation Report
Desert Dust
REF PROMOTE-2 C6 ISSUE 10 DATE 06062008 PAGE 2 of 36
Determination of the typical range (Method criteria)
na
Maximum range na
Units [-]Dimensionless
Standards ns
Aerosol Optical Thickness 870 nm
Parameter AOD870
Typical range 0-13
Determination of the typical range (Method criteria)
na
Maximum range na
Units [-]Dimensionless
Standards ns
Angstrom Coefficient
Parameter Angstrom Coefficient
Typical range 0-1
Determination of the typical range (Method criteria)
na
Maximum range na
Units [-] Dimensionless
Standards ns
Table 12-1 Desert Dust Awareness products characterization
GSE - PROMOTE 2 C6 Validation Report
Desert Dust
REF PROMOTE-2 C6 ISSUE 10 DATE 06062008 PAGE 3 of 36
ltPAGE INTENTIONALLY LEFT BLANKgt
GSE - PROMOTE 2 C6 Validation Report
Desert Dust
REF PROMOTE-2 C6 ISSUE 10 DATE 06062008 PAGE 4 of 36
13 Iberian sub-service Service iswill be operational sinceafter May 2007
Research partners Within validation phase will collaborate Miguel Aacutengel Martiacutenez (INM) Emilio Cuevas (Instituto Izantildea)
Provider(s) GMV
Validation contact Oscar Perez Navarro (e-mail operez at gmvcom)
131 Validation plan and validation data It is important to highlight that the validation has been performed using mainly the thresholds on effective radii and they are set as follows
bull Continental 0 le re le 04microm
bull Desert 01 le re le 8microm
bull Maritime 0 le re le 8microm
bull Biomass 0 le re le 02microm
bull Urban Thresholds are set so this type is never selected (the number of cases where this
bull type is expected to be realistic dominate is too small to attempt to include it in the automatic speciation scheme)
It has to be noted that as much of the comparison are with AERONET data then agreement with AERONET is likely to be poor if the assumed aerosol type is incorrect Results for the merged products therefore depend on the assignment of type which is known to be problematic in many cases
1311 Development and testing of a validation tool This sub-service was validated in 2006 but due to a change in user requirements a new validation plan is currently in progress As a consequence the service is at the moment in an improvement phase (development status)
A visualization tool has been developed allowing the user inspecting data produced defining validation parameters and obtaining graphical displays of validation results The interface developed allows saving test configuration parameters and generation of log files containing all steps followed by the users during the validation process Outputs are saved and can be displayed graphically using a range of colours to designate error ranges allowing users to pick a general idea about the overall quality of the comparison In addition dump parameters can also be defined and invoked by specific dump command lines Dump definitions and outputs can be saved loaded and displayed as well
The performance of this visualization tool is evaluated by means of traceability matrices allowing for the verification of design requirements Each software component (basically objects with associated functions and timing) identified and described in the Design shall be traceable from (forwards traceability) and to (backwards traceability) the requirements of the TS Furthermore UML rules and conventions shall apply to the production and verification of the models
GSE - PROMOTE 2 C6 Validation Report
Desert Dust
REF PROMOTE-2 C6 ISSUE 10 DATE 06062008 PAGE 5 of 36
A set of tests has been defined to verify the suitability of this tool as a guarantee of the coverage of the PROMOTE functionality and to set and verify the validation and quality control procedures to be applied to the products As a first step the test data selected for this purpose is used as an input and as a reference
Therefore a Unit Testing (UT) approach is taken in order to check the conformance of each software operation with its detailed design The expected result is that each individual software module behaves according to its detailed specification and therefore that each operation provides the expected outputs for different sets of inputs calls expected subprograms etc
Unit tests are built following a black box approach (ie the module is tested seeing its interface and not its internals) but assuring a full coverage as in white box testing all code lines of the module under test have been executed at least once and in reasonable combinations
In every validation-test phase it is needed to define Item passfail criteria in order to detect whenever a test is successfully executed Consequently each test procedure will have an outcome which should be clearly identifiable as a pass or a fail
1312 Validation by means of the visualization tool Every time a validation is started a set of risks is assessed Unit testing can be performed independently for each software module so that the risk of global testing suspension is very low ie when an error is found just the suspension of testing for this module would normally be required This allows the possibility of reducing the time spent for unit testing by allocating more people to this task
Making parallel unit and integration testing compatible could also shorten scheduled time Modules used for integration should have been previously tested at unit level so that those modules early required for integration are suggested to be unit tested first The best approach will be to carry out unit tests in the same order as modules are required for integration
Testing tasks have been described in previous sections They can be summarised as follows
bull Test design test cases specification and test procedures determination Document them in this document
bull Review this document for suitability of test cases for their intended purpose
bull Set up necessary files needed for test execution (eg test drivers and simulators scripts makefileshellip)
bull Execute the tests (compile necessary components link to an executable file download it to the target hardware examine test resultshellip) and document test results
bull Updates in sourcetest files and documents due to tests results
bull Execute regression test cases after software updates Regression testing shall be automated as far as possible to minimise effort in repeating tests
bull Progress revisions are planned as both the development (basically coding) and UT evolves to assess the status of activities but not formal reviews are planned until the end of the tests
GSE - PROMOTE 2 C6 Validation Report
Desert Dust
REF PROMOTE-2 C6 ISSUE 10 DATE 06062008 PAGE 6 of 36
Automated testing execution should be achieved in a very high degree This will provide easy execution and repetition of tests especially important for regression testing
1313 Validation of SEVIRI data with AERONET and ADRIEX data The preliminary inter-comparison has been done for the period 26th of August to the 30th of September 2004 for SEVIRI instrument
The SEVIRI data used in this analysis was version 0100 of level 1b and version 0100 of the cloud flag September 2004 has significant biomass burning at southern tropical sites such as central Africa and Southern America It is also within a period of significant desert dust plumes over the Atlantic this data set was used in the Aeronet validation and monthly comparisons The data from August 2004 was used in the case study comparison during the ADRIEX campaign and also to understand the variation of AOD with time All the SEVIRI data presented in this validation report was processed at RAL The data was produced at 10x10km resolution
The September 2004 period was selected to provide over lap with the ADRIEX campaign (27August - 6 September) The complete month of September was analysed for comparison with monthly composites from other satellite sensors This late period in the GAP temporal coverage is also suitable for the preliminary GAP in that (a) in more recent years the coverage of Aeronet data has greatly increased (b) SEVIRI data is routinely available since operation of Meteosat-8 commenced on 29 January 2004 The number of ground-stations receiving data (and hence coverage) has increased Algorithms to improve pointing knowledge have improved with time but the issue may well mean there is little value in validating SEVIRI aerosol from the 2004 preliminary GAP This will be investigated and if geo-location proves to be a severe limiting factor then a second month will be selected as preliminary GAP
The preliminary inter-comparison has been done for the period 26th of August to the 30th of September 2004 for SEVIRI instrument
VALIDATION DATA Ground basedin-situRemote Sensing (ADRIEX) observations AERONET stations Levels 10 15 20 Phase 1+2
httpaeronetgsfcnasagov Data availability and access All AERONET measurements for the given ground station are extracted with time plusmnDT of the satellite overpass The baseline for DT is 30 minutes (which given a typical aerosol transport speed of 50kmhour is consistent with the 50km spatial distance sampled from the service GAP Data (measurements) were provided into binary files Spatial coverage and resolution Pixels are selected within a region on plusmn20 km from each station (from a 10km resolution grid) Temporal coverage and resolution August-September 2004 Location(s) (coordinates) 3648deg lat 3428deg lon Accuracy 002 over ocean and 005 over land
GSE - PROMOTE 2 C6 Validation Report
Desert Dust
REF PROMOTE-2 C6 ISSUE 10 DATE 06062008 PAGE 7 of 36
ADRIEX Campaign Phase 1+2
Data availability and access Data is provided in binary files Spatial coverage and resolution 10 Km resolution grid Temporal coverage and resolution and resolution 27-08-20046-09-2004 Location(s) (coordinates) Northern Italy the Adriatic Sea and between Northern Italy and the West coast of the Black Sea Accuracy 002 over ocean and 005 over land
Model outputs NA
Other EO Data SEVIRI Version 0100 level 01 Version 0100 of cloud flag Phase 1+2
Data availability and access Images at 1012 et 1615 Spatial coverage and resolution 10x10 Km2 Temporal coverage and resolution 26-0830-09 2004 Location(s) (coordinates)computational domain Whole SEVIRI image Accuracy 002 over ocean and 005 over land
MODIS Phase 1+2 Data availability and access NA Spatial coverage and resolution1ordmx1ordm Temporal coverage and resolution September 2004 Location(s) (coordinates)computational domain Full earth coverage Accuracy 002 over ocean and 005 over land
Table 13-1 Data used for the validation of the Iberian Desert Dust Awareness sub-service
132 Validation of individual components
1321 SEVIRI cloud screening The Operational SEVIRI cloud flag was found at an early validation stage to underestimate the real amount of cloud in a pixel Fortunately the technique used to retrieve aerosol optical depth has a number of measures to identify cloud-contaminated pixels The following extra quality control was applied to identify cloudy pixels
bull Retrieval must reach a proper convergence
bull Optical depth is less than 30
bull Cost ie the measure of the fit to the aerosol model is less than 10 over land and less than 5 over sea
bull More than one iteration of the retrieval is performed
bull The effective radius retrieved is less than the maximum defined for the selected aerosol type
The Application of this quality control remove approximately extra 20 of pixels previously deemed clear
GSE - PROMOTE 2 C6 Validation Report
Desert Dust
REF PROMOTE-2 C6 ISSUE 10 DATE 06062008 PAGE 8 of 36
VALIDATION OF INDIVIDUAL COMPONENTS Best stimator ns
Screening procedures Identification of outliers AOD550 AOD870 The way to identify out of range values is
fixing a threshold that has been established on 30 as maximum and 00 as minimum (by definition) So the procedure is comparison against a fixed value
Bad retrievals Parameters checked for bad retrievals are exactly the same ad the ones considered for outliers AOD550 AOD870 We apply the following quality checks Cloud Fraction set to 0 Sun glint Effective radius lt 3Mm Surface albedo lt 012 Cost function lt3 for continental over sea Cost function lt10 for desert over sea Cost function lt30 for maritime over sea Cost function lt1 for biomass over sea Cost function lt30 for continental over land Cost function lt1 for desert over land Cost function lt1 for maritime over land Cost function lt2 for biomass over land
Quality checks Cloud Fraction set to 0 Sun-glint Effective radius lt 3Mm Surface albedo lt 012 Cost function lt3 for continental over sea Cost function lt10 for desert over sea Cost function lt30 for maritime over sea Cost function lt1 for biomass over sea Cost function lt30 for continental over land Cost function lt1 for desert over land Cost function lt1 for maritime over land Cost function lt2 for biomass over land
Accuracyerror 002 Over ocean and 005 over land
GSE - PROMOTE 2 C6 Validation Report
Desert Dust
REF PROMOTE-2 C6 ISSUE 10 DATE 06062008 PAGE 9 of 36
Cross-correlation With Aeronet Cost lt 10 Number of iterations gt 1 AOD lt 3 Cloud fraction = 00
Validation passfail criteria (Regression testing)
002 over ocean and 005 over land
Cloud screening quality control
See figure 13
Aeronet data manual inspection
na
Modelalgorithms SEVIRI Cloud flag needs a correction that can be done for Optical Depths of less than 3 and when the retrieved aerosol effective radius is smaller than 10 over land and smaller than 5 over sea See 1322 and Smirnov 2000
SEVIRI Cloud Screening (SEVIRI Cloud Mask v1)
The validation parameter is the standard deviation See Section 1322 and Smirnov 2000 AERONET Cloud Screening
(v20) See Figure 13-1Only Cloud free data is used for validation SKYNET vs AERONET
() The validation is done by mean of a cross-correlation Only Cloud free data is used for validation DISORT Model ()
The validation is done by mean of a cross-correlation
Sunglint calculated using ECMWF winds using the Cox and Monk formulation and an under light and foam contribution
Sunglint Correction (3rd SEVIRI Slot)
Not final parameter stored It is intermediated data used for the final process
Other
1x1 AOD Monthly averages Creation of Weekly or monthly products containing minimum maximum average and standard deviation of AOD and Angtstrom Coefficient The bin size may be selected for 1 kmX1 Km or 1ordmx1ordm
AOD averaged
Angstrom Coefficient Averaged
Table 13-2 Validation of individual components of the Iberian Service
GSE - PROMOTE 2 C6 Validation Report
Desert Dust
REF PROMOTE-2 C6 ISSUE 10 DATE 06062008 PAGE 10 of 36
1322 Screening procedures
Measurements which are contaminated by cloud are identified by a screening procedure Smirnov 2000 based on the assumption that large rapid variations in retrieved AOD are caused by clouds The flowchart for this screening process is shown in Figure 13-1
Filters are applied to the triplet of observations upon which a single AOD measurement is based and over all observations on a given day Only data which is known to be cloud free will be used for validation of PROMOTE products The screening procedure (which also includes a number of other quality control tests is illustrated schematically in Figure 3) In addition to the automatic cloud screening and quality assurance procedure data are also manually inspected at Aeronet to further ensure a consistent data quality (level 2 data) Only Level 2 data is used in this project
For each daily product a separate rdquocoincidence filerdquo containing all information required to perform the validation was generated as follows
For each of the selected Aeronet stations
bull The closest rdquoground-pixelrdquo (ie 10x10km grid box) is identified
bull AOD and Angstrom coefficient are extracted within a region on plusmnΔP pixels from this pixel The baseline value of ΔP is 2 from Ichoku 2003
GSE - PROMOTE 2 C6 Validation Report
Desert Dust
REF PROMOTE-2 C6 ISSUE 10 DATE 06062008 PAGE 11 of 36
Figure 13-1 Schematic of the Aeronet cloud screening procedure from Smirnov 2000
bull The number of valid PROMOTE retrievals mean and standard deviation of τA and σA from this spatial sample are determined and stored as NG μτG στG μαG σαG respectively The estimated accuracy of the mean quantities is also estimated and stored based on the error diagnostics provided with the retrieval (taking into account approximately whether these errors are expected to be random or systematic over the relevant spatial scale) ΔμτG ΔμαG
bull All Aeronet measurements for the given ground station are extracted with time plusmnΔT of the satellite overpass The baseline for ΔT is 30 minutes (which given a
GSE - PROMOTE 2 C6 Validation Report
Desert Dust
REF PROMOTE-2 C6 ISSUE 10 DATE 06062008 PAGE 12 of 36
typical aerosol transport speed of 50kmhour is consistent with the 50 km spatial distance sampled from the PROMOTE product if ΔP is 2)
bull The number of valid retrievals mean and standard deviation of τA and σA from this temporal sample are determined and stored as NA μτA στA μαA σαA respectively
bull There was no Earlinet lidar data provided that was time coincident with SEVIRI satellite retrievals
bull For SEVIRI a separate file is produced for each time-step
For the extraction of coincident measurements the following validations and inter-comparisons were undertaken
bull Comparison with Daily Aeronet measurements of optical depth at 087nm and 055nm
bull Inter-comparison with MODIS 1x1o monthly averaged optical depth
1323 Fits of Aeronet site measurements to coincident SEVIRI retrievals
SEVIRI optical depths are compared with the Aeronet retrieved optical depths A comparison is made assuming 6 different aerosol types and then with the merged data set which selects the optimal aerosol type based on cost The quality control applied in the first scenario is
1 Cost lt 10
2 Number of iterations gt 1
3 AOD lt 3
4 Cloud fraction = 00
In the merged data set after careful analysis of the data the selection criteria was biased to prefer continental or biomass aerosol over land and maritime or desert over sea The quality criteria applied in this case was
1 Cost lt 3 for continental over sea
2 Cost lt 10 for desert over sea
3 Cost lt 30 for maritime over sea
4 Cost lt 1 for biomass over sea
5 Cost lt 30 for continental over land
6 Cost lt 1 for desert over land
7 Cost lt 1 for maritime over land
8 Cost lt 2 for biomass over land
9 Number of iterations gt 1
10 AOD lt 3
11 Cloud fraction = 00
GSE - PROMOTE 2 C6 Validation Report
Desert Dust
REF PROMOTE-2 C6 ISSUE 10 DATE 06062008 PAGE 13 of 36
It must be noted that before the aerosol types are merged the appropriate bias correction must me made to the aerosol type selected
Figure 13-2 Comparison of 087 m Aeronet site measurement with SEVIRI measurements
Scattering aerosols Most aerosols fall into this category In this category the extinction is mainly a result of molecular (Rayleigh) scattering The aerosol types that fall into this category are the continental desert and maritime aerosols At small effective radius (re) the signal from these aerosols is almost identical only as the effective radius changes do the aerosol properties change
bull Absorbing aerosols The urban and biomass aerosols fall into this category These aerosols which may be composed of soot are strong absorbers and a considerable part of their reddening is due to the increase in their absorption at short wavelengths
bull All the aerosols types in the model used here are spherical
bull Ideally we would like to include many more aerosol types in particular mixed aerosols in the retrievals as theses are probably more realistic than some of the single aerosol types used here this is reserved for future investigations
GSE - PROMOTE 2 C6 Validation Report
Desert Dust
REF PROMOTE-2 C6 ISSUE 10 DATE 06062008 PAGE 14 of 36
Figure 13-3 Comparison of 055 m Aeronet site measurement with SEVIRI measurements and show that most of the retrievals fit a scattering aerosol in preference to an absorbing aerosol type The Aeronet retrievals in these figures are over sea land and coastal areas The 087nm channel has optical depths that are consistently smaller than the 055nm channel optical depths the 087nm AOD shows the best correlation over 80channel so this result is interpolated The comparisons with the 055nm channel show a positive bias at low AOD and a negative bias at high AOD The underestimation of AOD at high values has been noticed before in comparisons of MODIS data with Aeronet site In that paper they comment that the underestimation may be due to insufficient light absorption in aerosol models Perhaps a better channel to measure optical depth for SEVIRI would be the 067nm channel
1324 Results and show the comparison of each individual SEVIRI aerosol type with Aeronet 087 nm and 055nm channels respectively The error bars indicate the standard deviation of the AOD used over the plusmn30 minutes of Aeronet data and plusmn20 km of SEVIRI data to create the match up The line of best fit and correlation coefficient for each graph is calculated using the SEVIRI and Aeronet error bars It should be noted that we do not expect to see good agreement for all the measurements as clearly if the aerosol type used to retrieve the optical depth is the wrong type of aerosol then the optical depth retrieval will be incorrect In the simplest characterisation the aerosol types can in general be divided into 2 separate categories
GSE - PROMOTE 2 C6 Validation Report
Desert Dust
REF PROMOTE-2 C6 ISSUE 10 DATE 06062008 PAGE 15 of 36
Figure 13-4 Comparison of sea and coastal 087 m Aeronet site measurement with SEVIRI measurements
Figure 13-5 Comparison of sea and coastal 055 m Aeronet site measurement with SEVIRI measurements
In and only the Aeronet sites which are sited on the coast are considered ie the SEVIRI retrieval in these cases had a land fraction ranging from 0 to 099 The comparison with Aeronet observations in these cases is much better This reflects that it is generally easier to retrieve the properties of bright aerosols over dark surfaces At low optical depths there is a slight positive bias consistent with that seen by other remote sensing instruments such at MODIS This is most likely due to incorrect modelling of the ocean surface This is particularly a problem in coastal regions where the ocean colour
GSE - PROMOTE 2 C6 Validation Report
Desert Dust
REF PROMOTE-2 C6 ISSUE 10 DATE 06062008 PAGE 16 of 36
can vary substantially from the default Cox and Munk (with wind correction) calculation due to the presence of brighter type 2 coast waters At high optical depths there is a slight negative bias Interestingly for maritime aerosols there is a slight overall positive bias This could also be due to the difference in viewing geometry between the Aeronets cimel photometer and the geostationary SEVIRI instrument The Cimel photometer views pointing straight up while SEVIRI has a view angle that varies with latitude The SEVIRI measurement therefore has a longer path length that will intercept more aerosol The bias is relatively constant in the match ups identified in September 2004 nearly all of the match ups where in the European region
Figure 13-6 Comparison of land 0870nm Aeronet Site measurements with SEVIRI Measurements
Figure 13-7 Comparison of land 0550nm Aeronet Site measurements with SEVIRI Measurements
GSE - PROMOTE 2 C6 Validation Report
Desert Dust
REF PROMOTE-2 C6 ISSUE 10 DATE 06062008 PAGE 16 of 36
The land only matches ups shown in Figures 127 and 128 have considerably worse agreement between satellite and sun photometer retrievals This result suggests problems retrieving aerosol over highly reflective surfaces The worst retrievals were over desert surfaces In the absence of an operational SEVIRI surface reflectance product we have used the MODIS 16 day averaged albedo for the land surface reflectance that correspond to the SEVIRI channels While we allow the retrieval to adapt within errors to a different land surface reflectance this product could be improved
1325 Merging the aerosol types After studying the retrieval accuracy as a function of aerosol type it was decided to amalgamate only the continental maritime desert and biomass retrievals The urban and polluted maritime results gave misleading results when included in the amalgamation The validation plots and maps are still included for completeness and for further future flexibility Figure 129 shows the results of the retrievals that have been selected as the best match on the basis of cost The retrievals show a mix of aerosol types including some absorbing types that would be expected to be associated with urban areas The results are better for the 087nm channel than the 055nm channel There is a positive bias at low optical depth and a negative bias at high optical depths which is consistent with the individual aerosol comparisons This bias and slope will be corrected for in the merging algorithm Figures 1210 and 1211 show the comparison broken into sea and land sites
Figure 13-8 Amalgamated results for September 2004 1212 UTC The individual aerosol types were combined according to quality control and cost over land and sea
GSE - PROMOTE 2 C6 Validation Report
Desert Dust
REF PROMOTE-2 C6 ISSUE 10 DATE 06062008 PAGE 17 of 36
Figure 13-9 Amalgamated results for September 2004 1212 UTC The individual aerosol types were combined according to quality control and cost over land and sea
Figure 13-10 Amalgamated results for September 2004 1212 UTC The individual aerosol types were combined according to quality control and cost over land and sea
GSE - PROMOTE 2 C6 Validation Report
Desert Dust
REF PROMOTE-2 C6 ISSUE 10 DATE 06062008 PAGE 18 of 36
Figure 13-11 the right show scatter density distributions of the monthly mean value over sea
1326 Comparisons with other Satellite Platforms It have been also compared the service retrievals with MODIS and MISR Over sea the correlation with MODIS (061) is better than that between MISR and MODIS (048) Over land the correlation of SEVIRI with MISR (045) is better than that with MODIS (033) though not as good as the correlation between MISR and MODIS (062) It should however be noted that the region of the globe observed by SEVIRI omits Asian regions responsible for much of the global variability (ie there is less variability to be observed over the SEVIRI disk than globally so one might expect less correlation)
The following points relating to the SEVIRI AOD distribution are noted
bull The field is a daily product generated from individual retrievals from radiances observed at 1012 and 1612 UT No-data is acquired off the coast of southern Africa because this region is flagged as sun-glint in the 1012 image and has solar zenith angle greater than 70 at 1612 Apart from this feature however the ldquojoinrdquo between the regions sampled by one or both of the two radiance products is gratifyingly difficult to discern
bull Some of the high AODs off the north coast of South America are due to an underestimation of the spatial extent of sun-glint at 1612 (in turn due to probably erroneously low winds in the ECMWF analyses used to predict the glint area)
bull There appears to be some shift to the north of the high aerosol load over central southern Africa (which is mainly due to biomass burning) as observed by SEVIRI compared to MISR or MODIS (and compared to the associated plume off the east coast) This structure is likely to be due to problems modelling the surface reflectance over land in this region and is connected to the discrepancies found between SEVIRI AODs and those observed at the Mongu station
and land separately ldquo+rdquo symbols indicate the mean over all SEVIRI points within the indicated range of MODIS values Error bars indicate the corresponding standard deviation
GSE - PROMOTE 2 C6 Validation Report
Desert Dust
REF PROMOTE-2 C6 ISSUE 10 DATE 06062008 PAGE 19 of 36
al product and the most common aero l speciation identied
Figure 13-12 Number of data points in each bin of the of 1 degree gridded monthly statistic
so
GSE - PROMOTE 2 C6 Validation Report
Desert Dust
REF PROMOTE-2 C6 ISSUE 10 DATE 06062008 PAGE 20 of 36
1327 Conclusions Before discussing these results further it is worth noting that all aerosol retrieval schemes based on passive nadir visible near-infrared satellite imagery are subject to the following fundamental problems
1 Discrimination of aerosol from cloud The signal from most types of cloud is generally
much stronger than from aerosol Consequently even a relatively small amount of undetected cloud in a scene can cause large biases in retrieved AOD For this reason cloud masks are used to select only radiances which are cloud-free However care is required to avoid wrongly flagging cases of high aerosol load thereby omitting these potentially important events from the retrieved dataset and introducing a low bias into statistical analyses More fundamentally many clouds have aerosol as condensation nuclei and the point at which the ldquoaerosolrdquo becomes ldquocloudrdquo through growth of water droplets around the aerosol particle is ambiguous
2 Unknown aerosol composition The back-scattered signal observed by the satellite depends not only on the amount of aerosol present but crucially also on the phase function and single scatter albedo which in turn are dependent on the aerosol refractive index size distribution and particle shape There is generally insufficient information in remote measurements (even ground-based) to fully constrain the optical properties and as a consequence retrieved optical depths are quite strongly dependent upon a priori assumptions about the aerosol type
3 Surface reflection Over much of the land surface (and glint regions of sea) the signal from direct and diffuse reflection of radiation from the surface is much stronger than that from aerosol The sign of the aerosol effect on measured radiances changes depending on the surface reflectance and aerosol single scattering albedo so conditions exist in which radiances are insensitive to aerosol perturbations Relatively small errors in modelling the interaction of light with the surface can therefore cause significant error in aerosol retrieval For this reason retrieving aerosol over the (dark) ocean is relatively straightforward Retrievals over bright land surfaces are particularly challenging
The validation and inter-comparison results presented here demonstrate that all the products perform well over ocean yielding correlations with AERONET in the region of 08 (despite most stations being near the coast rather than open ocean) and correlations with the MODIS monthly mean distribution which are comparable or better than found between MODIS and MISR
Where problems exist these are almost exclusively related to retrievals over land The most positive results from the current official product set have been obtained for SEVIRI the AERONET correlation over land being 082 at 055microm without significant bias over many regions including Europe This leads to a number of impressive time-series comparisons with individual AERONET stations The SEVIRI agreement with MISR over land is also comparable to that between MISR and MODIS The benefit of geostationary observations in obtaining good sampling of the cloud-free atmosphere is clear from the number of good observations acquired even from the two observations per day that are analysed in the current set of products leading to a relatively large number of AERONET coincidences and a well sampled monthly mean field
The following recommendations are made based on the validation results and the considerations outlined above
GSE - PROMOTE 2 C6 Validation Report
Desert Dust
REF PROMOTE-2 C6 ISSUE 10 DATE 06062008 PAGE 21 of 36
bull There are indications of errors due to modelling of the surface reflectance in the SEVIRI retrieval (eg over central and southern Africa) These may be attributable to channel spectral response function difference compared to MODIS (use to define the a priori BRDF) Methods to correct for such systematic errors are being studied at the moment and could lead to a useful improvement in the short-term It is however noted that in the long-term it would be highly desirable to use surface BRDF information from SEVIRI itself
bull Some residual effect of sun-glint are evident in the SEVIRI product partly due to apparently underestimated wind-speeds in ECMWF Use of a minimum assumed wind speed to remove this effect is being considered
bull It would of course be desirable to process as many SEVIRI scenes in a single day as possible within available computing resource (SEVIRI acquires a scene every 15 minutes) Use of at least one additional time eg 1312 to complement the existing slots of 1012 and 1612 would be particularly desirable to eliminate the current data gap off eastern Africa which is contaminated by glint at 1012 and has too high a solar zenith angle at 1612 As noted above observing aerosol at different scattering angles can yield information on the phase function (and hence type) While multi-time observations cannot yet be directly exploited by the products scheme post analysis of retrievals at as many different time of day could help to improve the speciation (and hence estimated AOD) Multiple-time observations are of course also valuable for tracking the evolution of specific events
bull There is evidence of over-zealous cloud flagging leading to events of high aerosol load being omitted While the long-term aim would be to by-pass this issue altogether using a joint aerosol-cloud scheme for the current products more pragmatic measures to improve the current status would be desirable in the short-term For SEVIRI the cloud mask is not useful as a means of generating cloud-free radiances for partially cloudy scenes all partially cloud scenes are currently flagged as unreliable It would therefore make sense to process all scenes without regard to the Eumetsat cloud mask then rely (as is the case at the moment) on quality control criteria (including the Eumetsat cloud fraction) to screen cloud post-hoc
bull The assumed aerosol models (refractive indices size distribution assumed particle shape) do not of course perfectly represent the true aerosol conditions and improvements additions to the set of models used may well be worthwhile and are the subject of continuing research and development
GSE - PROMOTE 2 C6 Validation Report
Desert Dust
REF PROMOTE-2 C6 ISSUE 10 DATE 060620078 PAGE 22 of 38
133 Validation against specifications and against user requirements Requirements written in Italics are only recommended and not compulsory for Phase 2
VALIDATION AGAINST SERVICE SPECIFICATIONS
No limitationsdelays for compliance between theoretical and actual service specifications reported
VALIDATION AGAINST USER REQUIREMENTS
SPECIFICATION S5 REQUIRED ACTUAL
Parameters Latitude longitude Speciation Aerosol Optical Thickness 550nm Aerosol Optical Thickness 870nm Cloud Pixel Flag Land Sea Flag Sun Zenith Angle Sun Azimuth Angle View Zenith Angle Julian Date Effective Radius Angstrom Coefficient Angstrom Coefficient
Accuracy minimum ns ns
AOD plusmn 002 over ocean and plusmn 005 over
land
Accuracy target ns 15 ns
Spatial coverage South Europe (Spain Portugal and Italy)
South Europe (Spain Portugal
Macaronesia)
South Europe (Spain Portugal Macaronesia)
Horizontal resolution 10x10 Km2 ns 10x10 Km2
Vertical resolution ns ns ns
GridProjection Sinusoidal ns Sinusoidal
Temporal coverage 24 h ns 24 h
Temporal resolution 15 minutes ns 45 min
User Interfaces
PROMOTE Web ns Complete operational
up-to-date
Incomplete no operational not up to
date
ftp ns ns ns
On demand ns ns ns
Data formats and data delivery
Data availability ns Specific test periods in Phase 1 ns
GSE - PROMOTE 2 C6 Validation Report
Desert Dust
REF PROMOTE-2 C6 ISSUE 10 DATE 060620078 PAGE 23 of 38
Data access Online online Online
Delivery Mode
OfflineNRT
Phase 1 NRT for a specific test period to be defined
Phase 2 NRT For the available SEVIRI slots
NRT
Delivery frequency ns Daily Daily
Data Format IDL custom tool NetCDF netCDF HDF netCDF HDF
Historical archive None ns None
Visualization IDL custom tool NetCDF netCDF HDF ns
REMARKS
No Remarks
Requirements written in Italics are only recommended and not compulsory for Phase 1
Table 13-3 Validation of the Iberian Sub-service against specifications and against user requirements
134 Service quality assessment and control procedures
Service delivery start date The service was available from August 2007 but due to some problems found in the last validations the website was disabled due to user request (until products have the quality expected) It has been foreseen to open the site again in August 2008
SPECIFICATION S5 REQUIRED ACTUAL N checksDelivery period
Quality checks See Table 13-2
ns ns NA
Quality flags ns ns ns NA
Product confidence data
ns ns ns NA
Error bar definition and representation
NA NA NA NA
GSE - PROMOTE 2 C6 Validation Report
Desert Dust
REF PROMOTE-2 C6 ISSUE 10 DATE 060620078 PAGE 24 of 38
Representation of missing data
ns ns ns NA
Documentation of process failure
A control function which checks for
the presenceabsence of
implemented productauxiliary data It is split by
input data
ns ns NA
Version control mechanisms and representation
Version control process is enabled Current version is
11 Version number follows S5
upgrades
10-Pahse 1
11- Phase 2
ns ns NA
Requirements written in Italics are not compulsory for Phase 2
Table 13-4 Validation of quality assessment and control procedures for the Iberian Sub-service
GSE - PROMOTE 2 C6 Validation Report
Desert Dust
REF PROMOTE-2 C6 ISSUE 10 DATE 060620078 PAGE 25 of 38
14 Italian sub-service Service iswill be operational sinceafter January 2007
Research partners ISAC-CNR
Provider(s) CGS
Validation contact W Di Nicolantonio
Satellite desert dust detection is based on the radiances and Brightness Temperature (BT) sampled by the imaging radiometer SEVIRI (Spinning Enhanced Visible and InfraRed Imager) on board MSG-1 (Meteosat-8) meteorological satellite The high temporal (15 min) and spatial (about 4x4 km2 over the Mediterranean area) resolutions of MSG images in the IR channels allow to follow the evolution of dust transport towards the Italian region and may permit a link with threshold exceeding of PM concentrations measured in situ Desert Dust indicator maps are obtained by analyzing 87 108 and 120 μm SEVIRI IR channels
Figure 14-13 Desert dust transport highlighted in magenta as detected through the RGB BTD technique applied to SEVIRI IR channels as available for Phase 1
GSE - PROMOTE 2 C6 Validation Report
Desert Dust
REF PROMOTE-2 C6 ISSUE 10 DATE 060620078 PAGE 26 of 38
Figure 14-2 Desert dust transport highlighted in magenta as detected through the RGB BTD technique applied to SEVIRI IR channels for the
Mediterranean area monitored in Phase2 From the IR SEVIRI channels the two Difference of BT (BT120 ndash BT108) and (BT108 ndash BT87) needed to enhance the presence of desert dust are derived For sequence of RGB composite images where R=(BT120 ndash BT108) G=(BT108 ndash BT87) B=BT108 dust appears pink or magenta while for instance thick high-level clouds turn out red-brown and thin high-level clouds appear very dark In Figure 14-13 is reported a snapshot of the dust transport as detected by SEVIRI on 28 July 2005 at 12 am
141 Validation Plan and Validation Data For phase 1 validation dust transport events taking place in summer 2005 and detected by SEVIRMSG were compared to Lidar observation which are routinely carried out in Rome by ISAC-CNR Lidar observations allow detection of events of Saharan dust transport over Italy Dust particles are tipically non-spherical then Aerosol Depolarization level Da from Lidar measurements is a good indicator of the presence of mineral dust in the atmosphere Comparison have been made reporting time evolution of dust Aerosol Optical Depth minimum and maximum heights related to dust particles are recorded in order to classify the magnitude of the dust events as can be seen in Figure 14-
GSE - PROMOTE 2 C6 Validation Report
Desert Dust
REF PROMOTE-2 C6 ISSUE 10 DATE 060620078 PAGE 27 of 38
During the second phase of PROMOTE2 Lidar observations will be again employed for the comparison with time corresponding SEVIRI data for events from 2005 up to now
Figure 14-3 Lidar observations in Rome for three selected events in Summer 2005
A further indirect comparison about the presence of desert dust detected by SEVIRI was planned starting from the second phase of PROMOTE2 taking advantage of the several AERONET routine measurements carried out in the South Italy area In particular time patterns of Aerosol Optical Depth AOD and Aringngstroumlm parameter α in the visible wavelength range will be employed to highlight the presence of dust in terms of small values of parameter α accompanied by significant AOD Measurements since 2005 up to now will be analysed for the sites of Lampedusa (35N12E) Potenza (40N15E) Messina (38N15E) Lecce(40N18E) Tor Vergata (41N12E) Moreover to confirm the dust transport to the northern region of Italy AOD and α from Ispra (45N8E) station will be also examined For Phase 2 validation focus is on Spring 2007 for which 3 main events were detected analysing SEVIRIMSG data in terms of RGB-BTD
1 March 9 2007 2 April 8 ndash 18 2007 3 May 20 2007
and (for the AERONET comparison) on Summer 2005 for which 3 main events were detected analysing SEVIRIMSG data in terms of RGB-BTD
GSE - PROMOTE 2 C6 Validation Report
Desert Dust
REF PROMOTE-2 C6 ISSUE 10 DATE 060620078 PAGE 28 of 38
4 July 22 ndash August 08 2005 5 around August 10 2005 6 September 4 ndash 9 2005
As stated above lidar observations in Tor Vergata (Rome) [see Table 14-5] were employed In particular Figure 14-4 and Figure 14-5 show the time-patterns of dust AOD (AOD due only to the Saharan dust contribution to aerosol extinction) and corresponding minimum and maximum height of the dust layer Significant values of dust AOD are present around March 9 April 10 and May 20 together with layer heights ranging between 200 m to 7 km
0000
0100
0200
0300
0400
0500
0600
0700
270207 090307 190307 290307 080407 180407 280407 080507 180507 280507 070607
Dus
t aod
dust AOD
Figure 14-4 Time-pattern of the Aerosol Optical Depth only due to the saharan dust contribution (dust AOD) in the period March ndash May 2007 as recorded at Roma tor Vergata
0000
2000
4000
6000
8000
10000
270207 090307 190307 290307 080407 180407 280407 080507 180507 280507 070607
Dus
t Hei
ght (
km)
Zmin dust layerZmax dust layer
Figure 14-5 Time-pattern of the minimum and maximum height of the dust layer (Zmin dust layer Zmax dust layer) in the period March ndash May 2007 as recorded at Roma tor Vergata
Furthermore the indirect comparison against AERONET data [see table 14-1] has been made both for the events highlighted in Phase 1 validation (Summer 2005) and Phase2 validation (Spring
GSE - PROMOTE 2 C6 Validation Report
Desert Dust
REF PROMOTE-2 C6 ISSUE 10 DATE 060620078 PAGE 29 of 38
2007) AERONET Level2 data (iequality assured) for the Lampedusa and Lecce sites were available only for July-September 2005 period while Potenza and Messina data were available only for April-May 2007 Time patterns of Aerosol Optical Depth AOD at 440 nm and Angstroumlm parameter α relative to the visible wavelength range [440-870]nm are presented in the Figures below to highlight the presence of dust in terms of small values of parameter α accompanied by significant AOD Concerning Lampedusa site in summer 2005 (see Figure 14-6) an increase in AOD can be seen in correspondance of the decrease in parameter α for 2-4 August (214-216 julian day) AOD presents values lower than 02 at mid-July then undergoes to an increase up to 06 together with a decrease in α from 07 to almost 01 A similar behaviour can be recognized at the end of the event on 12-13 August (225-226 julian day) while in the period before a lack of data prevents further analysis Analysing time-patterns relative to Lecce AERONET site (Figure 14-7 ) AOD and α inversions are present around August 2 (214 julian day) August 12 (224 julian day) and from September 7 to 11 (250 ndash 254 julian day) Dust events in Spring 2007 did not significatively reach Messina and Potenza as can be seen in Figure 14-8 and Figure 14-9
GSE - PROMOTE 2 C6 Validation Report
Desert Dust
REF PROMOTE-2 C6 ISSUE 10 DATE 060620078 PAGE 30 of 38
Figure 14-6 Time-pattern of AOD 440 nm and Aringngstroumlm parameter α for July August and September 2005 at Lampedusa AERONET sites
GSE - PROMOTE 2 C6 Validation Report
Desert Dust
REF PROMOTE-2 C6 ISSUE 10 DATE 060620078 PAGE 31 of 38
Figure 14-7 Time-pattern of AOD 440 nm and Aringngstroumlm parameter α for July August and September 2005 at Lecce AERONET sites
Figure 14-8 Time-pattern of AOD 440 nm and Aringngstroumlm parameter for April and May 2007 at Messina AERONET sites
GSE - PROMOTE 2 C6 Validation Report
Desert Dust
REF PROMOTE-2 C6 ISSUE 10 DATE 060620078 PAGE 32 of 38
Figure 14-9 Time-pattern of AOD 440 nm and Aringngstroumlm parameter α for April and May 2007 at Potenza AERONET sites
VALIDATION DATA Ground basedin-situ observations Name Data availability and access (include access details if data is freely
available)AERONET data are freely available via web aeronetgsfcnasagov
AERONET observations - level 2
Spatial coverage and resolution NA Phase ( 2 ) Temporal coverage and resolution summer 2005 to december 2007 Location(s) (coordinates) Lampedusa (35N12E) Potenza (40N15E) Messina (38N15E) Lecce(40N18E) Uncertainty quantification (eg Accuracy) 002 for AOD
Name Data availability and access (include access details if data is freely available) events since 2005 available through QUITSAT ASI project from ISAC-CNR
Lidar observations Phase (1+2)
Spatial coverage and resolution NA Temporal coverage and resolution events since 2005 Location(s) (coordinates)Roma Tor Vergata (41N12E) Uncertainty quantification (eg Accuracy) TBD
Table 14-6 Data used for the validation of the Italian Desert Dust Awareness Sub-service
GSE - PROMOTE 2 C6 Validation Report
Desert Dust
REF PROMOTE-2 C6 ISSUE 10 DATE 060620078 PAGE 33 of 38
142 Validation of individual components Following Ackermann (1997) the so-called trispectral method is applied to MSG data In this approach brightness temperature differences (BTD) between the 108 and 87 μm channels set against BTD between the 12 and 108 μm channels enables to discriminate dust from the clear-sky over both oceans and lands In Figure 1-3 is reported an example of trispectral diagram applied to SEVIRI BTD Brightness Temperature Difference pertaining to July 27 2005 As can be seen in the figure three different populations can be discriminated relative to clear sky (blue triangles) clouds (brown diamonds) and desert dust (pink squares) pixels BTD SEVIRI data in spatial and temporal coincidences with Lidar andor AERONET sun-photometer observations will be analyzed for events in which all instruments detect dust presence SEVIRI in terms of BTD Lidar and sun-photometers in terms of Depolarization ratio AOD and Aringngstroumlm parameter
Figure 14-14 Example of trispectral diagram of BTD from MSG-1SEVIRI over the Mediterranean area related to July 27 2005
GSE - PROMOTE 2 C6 Validation Report
Desert Dust
REF PROMOTE-2 C6 ISSUE 10 DATE 060620078 PAGE 34 of 38
VALIDATION OF INDIVIDUAL COMPONENTS
Best estimator
ns Detection of the same dust event
Coincidence check Time-pattern diagrams for lidar data (dust AOD and dust layer height)
Quality assessment
Identification of outliers TBD
Quality checks Events detected by both SEVIRI and lidar measurements in terms of
1 Pixel magenta coloured for seviri (small values of the the differences BT(120-108) and positive small values of the differences of BT(108-87) and
2 Significatly high values of dust AOD as measured by the lidar
Accuracyerror no quantitative parameter defined TBD
Cloud screening quality control
Not enabled
Modelalgorithms
BTD technique Brightness Temperature Differences technique applied to 3 SEVIRI infrared bands IR87 IR108 and IR120 (Ackerman 1997)
RGB of BTD as false color composition httpwwweumetsatintendpsmsgchannel_interpindexhtml
Composite RGB
R=BT(IR120) ndashBT(IR108)
G= BT(IR108)-BT(IR87)
B=BT(IR108)
Consistency
MSG data vs LIDAR
in both period selected for validation with lidar measurements (Summer 05 Spring 07) events detected by MSG were detected in correspondance by lidar measurement in Roma Tor Vergata (see figs Figure 14-3 Figure 14-4 and Figure 14-5
GSE - PROMOTE 2 C6 Validation Report
Desert Dust
REF PROMOTE-2 C6 ISSUE 10 DATE 060620078 PAGE 35 of 38
MSG data vs In-situ
For periods selected in Summer 2005 AERONET data shown the typical behaviour of dust aerosol loading (see figs Figure 14-6 and Figure 14-7)
For period in spring 2007 AERONET sites providing level2 data are not reached by the dust transport as can be seen in the product available in the service web site and it is confirmed in figs Figure 14-8 Figure 14-9
Table 14-7 Validation of individual components of the Italian Service
Validation against specifications and against user requirements Requirements written in Italics are only recommended and not compulsory for Phase 1
VALIDATION AGAINST SERVICE SPECIFICATIONS
variation has been made in the processing chain regarding data format conversion in the data import part areas selection and data archiving
SPECIFICATION S5 REQUIRED ACTUAL
Parameters Desert dust indicator
Accuracy minimum NA ns NA
Accuracy target ns ns TBD
Spatial coverage 10degN ndash 50degN lat 20degW ndash 50degE long
Italy Phase 1 Italy
Phase 2 Mediterranean area (see Figure 14-2)
Horizontal resolution 3x3 Km2 (Ground pixel) ns 3x3 km2
Vertical resolution ns ns na
GridProjection MSG perspective ns MSG perspective
Temporal coverage transport events ns Phase 1 selected dust transport events
Phase 2 NRT monitoring with a delay of 24 hour
Temporal resolution 30 minutes ns 15 minutes
User Interfaces
GSE - PROMOTE 2 C6 Validation Report
Desert Dust
REF PROMOTE-2 C6 ISSUE 10 DATE 060620078 PAGE 36 of 38
PROMOTE Web ns Operational complete and up to date
Operational complete and not up to date
Phase 2 operational complete and updated
ftp ns ns on demand
Data formats and data delivery
Data availability
ns
Specific test periods in Phase 1 (agreed with
users)
In Phase 2 data from Saharian sources
towards Italy
Phase1 Dust transport events detected since
Summer 2005
Phase2 2006 since May whole 2007 and NRT monitoring for
2008
Data access Online online Online
Delivery Mode NRT NRT
Phase 1 Offline
Phase 2 through web-page
Delivery frequency 30 minutes ns 60 minutes
Data Format Png image sequences geotiff on demand Png image sequences
Historical archive None ns None
Visualization geoTIFF png and gif viewers geoTIFF png and gif
viewers
REMARKS
] NRT service planned for phase 3 is started during the phase 2
Table 14-8 Validation of the Italian Sub-service against specifications and against user requirements
GSE - PROMOTE 2 C6 Validation Report
Desert Dust
REF PROMOTE-2 C6 ISSUE 10 DATE 060620078 PAGE 37 of 38
143 Quality assessment and control procedures
Service delivery start date ns
SPECIFICATION S5 REQUIRED
ACTUAL N checksDelivery period
Quality checks See Table 14-7
ns detection of the same dust event by SEVIRI and lidar
Once during validation phase for the whole data-set
Quality flags ns ns NA NA
Product confidence data
ns ns NA NA
Error bar definition and representation
NA NA NA NA]
Representation of missing data
ns ns In the NRT chain a log file is generated with the list of days for which no data
are available
Log file during
processing
Documentation of process failure
Not enabled No automatic reporting on process failure
enabled Only screen reporting
available
ns not enabled not enabled
Version control mechanisms and representation
Version control process is enabled Current version is
11 Version number follows S5
upgrades
10-Phase 1
11- Phase 2
ns V 12 related to S5 April 08
ns
Requirements written in Italics are not compulsory for Phase 2
Table 14-9 Validation of quality control procedures for the Italian Sub-service
GSE - PROMOTE 2 C6 Validation Report
Desert Dust
REF PROMOTE-2 C6 ISSUE 10 DATE 060620078 PAGE 38 of 38
15 References
151 Electronic references httpaeronetgsfcnasagov
httpwwweumetsatintendpsmsgchannel_interpindexhtml
152 Bibliographic references Ackerman S 1997 ldquoRemote sensing of aerosols using satellite infrared observationsrdquo JGeophys Res 102 17069-17079 Gobbi G P F Barnaba and L Ammannato 2004 The vertical distribution of aerosols Saharan dust and cirrus clouds in Rome (Italy) in the year 2001 Atmospheric Chemistry and Physics Vol 4 351-359
- DOCUMENT STATUS SHEET
- DOCUMENT CHANGE RECORD
- LIST OF TABLES
- LIST OF FIGURES
- LIST OF ACRONYMS
- TABLE OF CONTENTS
- 1 DESERT DUST AWARENESS
-
- 11 Service Summary
- 11
- 12 Product characterization
- 13 Iberian sub-service
-
- 131 Validation plan and validation data
-
- 1311 Development and testing of a validation tool
- 1312 Validation by means of the visualization tool
- 1313 Validation of SEVIRI data with AERONET and ADRIEX data
-
- 132 Validation of individual components
-
- 1321 SEVIRI cloud screening
- 1322 Screening procedures
- 1323 Fits of Aeronet site measurements to coincident SEVIRI retrievals
- 1324 Results
- 1325 Merging the aerosol types
- 1326 Comparisons with other Satellite Platforms
- 1327 Conclusions
-
- 133 Validation against specifications and against user requirements
- 134 Service quality assessment and control procedures
-
- 14 Italian sub-service
-
- 141 Validation Plan and Validation Data
- 142 Validation of individual components
- sect Validation against specifications and against user requirements
- 143 Quality assessment and control procedures
-
- 15 References
-
- 151 Electronic references
- 152 Bibliographic references
-

GSE - PROMOTE 2 C6 Validation Report
Desert Dust
REF PROMOTE-2 C6 ISSUE 10 DATE 06062008 PAGE 1 of 36
12 Product characterization The products consist of retrieved estimates of aerosol optical depth (AOD) at 055 and 087 microm IGAPs are individual sensor products for each day in which the ldquobestrdquo type has been selected from the 5 types considered by the algorthim (MARITIME URBAN DESERT DUST BIOMASS CONTINENTAL) The Angstroslashm coefficient derived from these two optical depths is also reported
Desert dust indicator
Parameter na
Typical range na
Determination of the typical range (Method criteria)
na
Maximum range na
Units na
Standards na
Speciation
Parameter Speciation
Typical range 0-4
Determination of the typical range (Method criteria)
0 Continental
1 Desert Dust
2 Maritime
3 Urban
4 Biomass
Maximum range na
Units na
Standards ns
Aerosol Optical Thickness 550 nm
Parameter AOD550
Typical range 0-13
GSE - PROMOTE 2 C6 Validation Report
Desert Dust
REF PROMOTE-2 C6 ISSUE 10 DATE 06062008 PAGE 2 of 36
Determination of the typical range (Method criteria)
na
Maximum range na
Units [-]Dimensionless
Standards ns
Aerosol Optical Thickness 870 nm
Parameter AOD870
Typical range 0-13
Determination of the typical range (Method criteria)
na
Maximum range na
Units [-]Dimensionless
Standards ns
Angstrom Coefficient
Parameter Angstrom Coefficient
Typical range 0-1
Determination of the typical range (Method criteria)
na
Maximum range na
Units [-] Dimensionless
Standards ns
Table 12-1 Desert Dust Awareness products characterization
GSE - PROMOTE 2 C6 Validation Report
Desert Dust
REF PROMOTE-2 C6 ISSUE 10 DATE 06062008 PAGE 3 of 36
ltPAGE INTENTIONALLY LEFT BLANKgt
GSE - PROMOTE 2 C6 Validation Report
Desert Dust
REF PROMOTE-2 C6 ISSUE 10 DATE 06062008 PAGE 4 of 36
13 Iberian sub-service Service iswill be operational sinceafter May 2007
Research partners Within validation phase will collaborate Miguel Aacutengel Martiacutenez (INM) Emilio Cuevas (Instituto Izantildea)
Provider(s) GMV
Validation contact Oscar Perez Navarro (e-mail operez at gmvcom)
131 Validation plan and validation data It is important to highlight that the validation has been performed using mainly the thresholds on effective radii and they are set as follows
bull Continental 0 le re le 04microm
bull Desert 01 le re le 8microm
bull Maritime 0 le re le 8microm
bull Biomass 0 le re le 02microm
bull Urban Thresholds are set so this type is never selected (the number of cases where this
bull type is expected to be realistic dominate is too small to attempt to include it in the automatic speciation scheme)
It has to be noted that as much of the comparison are with AERONET data then agreement with AERONET is likely to be poor if the assumed aerosol type is incorrect Results for the merged products therefore depend on the assignment of type which is known to be problematic in many cases
1311 Development and testing of a validation tool This sub-service was validated in 2006 but due to a change in user requirements a new validation plan is currently in progress As a consequence the service is at the moment in an improvement phase (development status)
A visualization tool has been developed allowing the user inspecting data produced defining validation parameters and obtaining graphical displays of validation results The interface developed allows saving test configuration parameters and generation of log files containing all steps followed by the users during the validation process Outputs are saved and can be displayed graphically using a range of colours to designate error ranges allowing users to pick a general idea about the overall quality of the comparison In addition dump parameters can also be defined and invoked by specific dump command lines Dump definitions and outputs can be saved loaded and displayed as well
The performance of this visualization tool is evaluated by means of traceability matrices allowing for the verification of design requirements Each software component (basically objects with associated functions and timing) identified and described in the Design shall be traceable from (forwards traceability) and to (backwards traceability) the requirements of the TS Furthermore UML rules and conventions shall apply to the production and verification of the models
GSE - PROMOTE 2 C6 Validation Report
Desert Dust
REF PROMOTE-2 C6 ISSUE 10 DATE 06062008 PAGE 5 of 36
A set of tests has been defined to verify the suitability of this tool as a guarantee of the coverage of the PROMOTE functionality and to set and verify the validation and quality control procedures to be applied to the products As a first step the test data selected for this purpose is used as an input and as a reference
Therefore a Unit Testing (UT) approach is taken in order to check the conformance of each software operation with its detailed design The expected result is that each individual software module behaves according to its detailed specification and therefore that each operation provides the expected outputs for different sets of inputs calls expected subprograms etc
Unit tests are built following a black box approach (ie the module is tested seeing its interface and not its internals) but assuring a full coverage as in white box testing all code lines of the module under test have been executed at least once and in reasonable combinations
In every validation-test phase it is needed to define Item passfail criteria in order to detect whenever a test is successfully executed Consequently each test procedure will have an outcome which should be clearly identifiable as a pass or a fail
1312 Validation by means of the visualization tool Every time a validation is started a set of risks is assessed Unit testing can be performed independently for each software module so that the risk of global testing suspension is very low ie when an error is found just the suspension of testing for this module would normally be required This allows the possibility of reducing the time spent for unit testing by allocating more people to this task
Making parallel unit and integration testing compatible could also shorten scheduled time Modules used for integration should have been previously tested at unit level so that those modules early required for integration are suggested to be unit tested first The best approach will be to carry out unit tests in the same order as modules are required for integration
Testing tasks have been described in previous sections They can be summarised as follows
bull Test design test cases specification and test procedures determination Document them in this document
bull Review this document for suitability of test cases for their intended purpose
bull Set up necessary files needed for test execution (eg test drivers and simulators scripts makefileshellip)
bull Execute the tests (compile necessary components link to an executable file download it to the target hardware examine test resultshellip) and document test results
bull Updates in sourcetest files and documents due to tests results
bull Execute regression test cases after software updates Regression testing shall be automated as far as possible to minimise effort in repeating tests
bull Progress revisions are planned as both the development (basically coding) and UT evolves to assess the status of activities but not formal reviews are planned until the end of the tests
GSE - PROMOTE 2 C6 Validation Report
Desert Dust
REF PROMOTE-2 C6 ISSUE 10 DATE 06062008 PAGE 6 of 36
Automated testing execution should be achieved in a very high degree This will provide easy execution and repetition of tests especially important for regression testing
1313 Validation of SEVIRI data with AERONET and ADRIEX data The preliminary inter-comparison has been done for the period 26th of August to the 30th of September 2004 for SEVIRI instrument
The SEVIRI data used in this analysis was version 0100 of level 1b and version 0100 of the cloud flag September 2004 has significant biomass burning at southern tropical sites such as central Africa and Southern America It is also within a period of significant desert dust plumes over the Atlantic this data set was used in the Aeronet validation and monthly comparisons The data from August 2004 was used in the case study comparison during the ADRIEX campaign and also to understand the variation of AOD with time All the SEVIRI data presented in this validation report was processed at RAL The data was produced at 10x10km resolution
The September 2004 period was selected to provide over lap with the ADRIEX campaign (27August - 6 September) The complete month of September was analysed for comparison with monthly composites from other satellite sensors This late period in the GAP temporal coverage is also suitable for the preliminary GAP in that (a) in more recent years the coverage of Aeronet data has greatly increased (b) SEVIRI data is routinely available since operation of Meteosat-8 commenced on 29 January 2004 The number of ground-stations receiving data (and hence coverage) has increased Algorithms to improve pointing knowledge have improved with time but the issue may well mean there is little value in validating SEVIRI aerosol from the 2004 preliminary GAP This will be investigated and if geo-location proves to be a severe limiting factor then a second month will be selected as preliminary GAP
The preliminary inter-comparison has been done for the period 26th of August to the 30th of September 2004 for SEVIRI instrument
VALIDATION DATA Ground basedin-situRemote Sensing (ADRIEX) observations AERONET stations Levels 10 15 20 Phase 1+2
httpaeronetgsfcnasagov Data availability and access All AERONET measurements for the given ground station are extracted with time plusmnDT of the satellite overpass The baseline for DT is 30 minutes (which given a typical aerosol transport speed of 50kmhour is consistent with the 50km spatial distance sampled from the service GAP Data (measurements) were provided into binary files Spatial coverage and resolution Pixels are selected within a region on plusmn20 km from each station (from a 10km resolution grid) Temporal coverage and resolution August-September 2004 Location(s) (coordinates) 3648deg lat 3428deg lon Accuracy 002 over ocean and 005 over land
GSE - PROMOTE 2 C6 Validation Report
Desert Dust
REF PROMOTE-2 C6 ISSUE 10 DATE 06062008 PAGE 7 of 36
ADRIEX Campaign Phase 1+2
Data availability and access Data is provided in binary files Spatial coverage and resolution 10 Km resolution grid Temporal coverage and resolution and resolution 27-08-20046-09-2004 Location(s) (coordinates) Northern Italy the Adriatic Sea and between Northern Italy and the West coast of the Black Sea Accuracy 002 over ocean and 005 over land
Model outputs NA
Other EO Data SEVIRI Version 0100 level 01 Version 0100 of cloud flag Phase 1+2
Data availability and access Images at 1012 et 1615 Spatial coverage and resolution 10x10 Km2 Temporal coverage and resolution 26-0830-09 2004 Location(s) (coordinates)computational domain Whole SEVIRI image Accuracy 002 over ocean and 005 over land
MODIS Phase 1+2 Data availability and access NA Spatial coverage and resolution1ordmx1ordm Temporal coverage and resolution September 2004 Location(s) (coordinates)computational domain Full earth coverage Accuracy 002 over ocean and 005 over land
Table 13-1 Data used for the validation of the Iberian Desert Dust Awareness sub-service
132 Validation of individual components
1321 SEVIRI cloud screening The Operational SEVIRI cloud flag was found at an early validation stage to underestimate the real amount of cloud in a pixel Fortunately the technique used to retrieve aerosol optical depth has a number of measures to identify cloud-contaminated pixels The following extra quality control was applied to identify cloudy pixels
bull Retrieval must reach a proper convergence
bull Optical depth is less than 30
bull Cost ie the measure of the fit to the aerosol model is less than 10 over land and less than 5 over sea
bull More than one iteration of the retrieval is performed
bull The effective radius retrieved is less than the maximum defined for the selected aerosol type
The Application of this quality control remove approximately extra 20 of pixels previously deemed clear
GSE - PROMOTE 2 C6 Validation Report
Desert Dust
REF PROMOTE-2 C6 ISSUE 10 DATE 06062008 PAGE 8 of 36
VALIDATION OF INDIVIDUAL COMPONENTS Best stimator ns
Screening procedures Identification of outliers AOD550 AOD870 The way to identify out of range values is
fixing a threshold that has been established on 30 as maximum and 00 as minimum (by definition) So the procedure is comparison against a fixed value
Bad retrievals Parameters checked for bad retrievals are exactly the same ad the ones considered for outliers AOD550 AOD870 We apply the following quality checks Cloud Fraction set to 0 Sun glint Effective radius lt 3Mm Surface albedo lt 012 Cost function lt3 for continental over sea Cost function lt10 for desert over sea Cost function lt30 for maritime over sea Cost function lt1 for biomass over sea Cost function lt30 for continental over land Cost function lt1 for desert over land Cost function lt1 for maritime over land Cost function lt2 for biomass over land
Quality checks Cloud Fraction set to 0 Sun-glint Effective radius lt 3Mm Surface albedo lt 012 Cost function lt3 for continental over sea Cost function lt10 for desert over sea Cost function lt30 for maritime over sea Cost function lt1 for biomass over sea Cost function lt30 for continental over land Cost function lt1 for desert over land Cost function lt1 for maritime over land Cost function lt2 for biomass over land
Accuracyerror 002 Over ocean and 005 over land
GSE - PROMOTE 2 C6 Validation Report
Desert Dust
REF PROMOTE-2 C6 ISSUE 10 DATE 06062008 PAGE 9 of 36
Cross-correlation With Aeronet Cost lt 10 Number of iterations gt 1 AOD lt 3 Cloud fraction = 00
Validation passfail criteria (Regression testing)
002 over ocean and 005 over land
Cloud screening quality control
See figure 13
Aeronet data manual inspection
na
Modelalgorithms SEVIRI Cloud flag needs a correction that can be done for Optical Depths of less than 3 and when the retrieved aerosol effective radius is smaller than 10 over land and smaller than 5 over sea See 1322 and Smirnov 2000
SEVIRI Cloud Screening (SEVIRI Cloud Mask v1)
The validation parameter is the standard deviation See Section 1322 and Smirnov 2000 AERONET Cloud Screening
(v20) See Figure 13-1Only Cloud free data is used for validation SKYNET vs AERONET
() The validation is done by mean of a cross-correlation Only Cloud free data is used for validation DISORT Model ()
The validation is done by mean of a cross-correlation
Sunglint calculated using ECMWF winds using the Cox and Monk formulation and an under light and foam contribution
Sunglint Correction (3rd SEVIRI Slot)
Not final parameter stored It is intermediated data used for the final process
Other
1x1 AOD Monthly averages Creation of Weekly or monthly products containing minimum maximum average and standard deviation of AOD and Angtstrom Coefficient The bin size may be selected for 1 kmX1 Km or 1ordmx1ordm
AOD averaged
Angstrom Coefficient Averaged
Table 13-2 Validation of individual components of the Iberian Service
GSE - PROMOTE 2 C6 Validation Report
Desert Dust
REF PROMOTE-2 C6 ISSUE 10 DATE 06062008 PAGE 10 of 36
1322 Screening procedures
Measurements which are contaminated by cloud are identified by a screening procedure Smirnov 2000 based on the assumption that large rapid variations in retrieved AOD are caused by clouds The flowchart for this screening process is shown in Figure 13-1
Filters are applied to the triplet of observations upon which a single AOD measurement is based and over all observations on a given day Only data which is known to be cloud free will be used for validation of PROMOTE products The screening procedure (which also includes a number of other quality control tests is illustrated schematically in Figure 3) In addition to the automatic cloud screening and quality assurance procedure data are also manually inspected at Aeronet to further ensure a consistent data quality (level 2 data) Only Level 2 data is used in this project
For each daily product a separate rdquocoincidence filerdquo containing all information required to perform the validation was generated as follows
For each of the selected Aeronet stations
bull The closest rdquoground-pixelrdquo (ie 10x10km grid box) is identified
bull AOD and Angstrom coefficient are extracted within a region on plusmnΔP pixels from this pixel The baseline value of ΔP is 2 from Ichoku 2003
GSE - PROMOTE 2 C6 Validation Report
Desert Dust
REF PROMOTE-2 C6 ISSUE 10 DATE 06062008 PAGE 11 of 36
Figure 13-1 Schematic of the Aeronet cloud screening procedure from Smirnov 2000
bull The number of valid PROMOTE retrievals mean and standard deviation of τA and σA from this spatial sample are determined and stored as NG μτG στG μαG σαG respectively The estimated accuracy of the mean quantities is also estimated and stored based on the error diagnostics provided with the retrieval (taking into account approximately whether these errors are expected to be random or systematic over the relevant spatial scale) ΔμτG ΔμαG
bull All Aeronet measurements for the given ground station are extracted with time plusmnΔT of the satellite overpass The baseline for ΔT is 30 minutes (which given a
GSE - PROMOTE 2 C6 Validation Report
Desert Dust
REF PROMOTE-2 C6 ISSUE 10 DATE 06062008 PAGE 12 of 36
typical aerosol transport speed of 50kmhour is consistent with the 50 km spatial distance sampled from the PROMOTE product if ΔP is 2)
bull The number of valid retrievals mean and standard deviation of τA and σA from this temporal sample are determined and stored as NA μτA στA μαA σαA respectively
bull There was no Earlinet lidar data provided that was time coincident with SEVIRI satellite retrievals
bull For SEVIRI a separate file is produced for each time-step
For the extraction of coincident measurements the following validations and inter-comparisons were undertaken
bull Comparison with Daily Aeronet measurements of optical depth at 087nm and 055nm
bull Inter-comparison with MODIS 1x1o monthly averaged optical depth
1323 Fits of Aeronet site measurements to coincident SEVIRI retrievals
SEVIRI optical depths are compared with the Aeronet retrieved optical depths A comparison is made assuming 6 different aerosol types and then with the merged data set which selects the optimal aerosol type based on cost The quality control applied in the first scenario is
1 Cost lt 10
2 Number of iterations gt 1
3 AOD lt 3
4 Cloud fraction = 00
In the merged data set after careful analysis of the data the selection criteria was biased to prefer continental or biomass aerosol over land and maritime or desert over sea The quality criteria applied in this case was
1 Cost lt 3 for continental over sea
2 Cost lt 10 for desert over sea
3 Cost lt 30 for maritime over sea
4 Cost lt 1 for biomass over sea
5 Cost lt 30 for continental over land
6 Cost lt 1 for desert over land
7 Cost lt 1 for maritime over land
8 Cost lt 2 for biomass over land
9 Number of iterations gt 1
10 AOD lt 3
11 Cloud fraction = 00
GSE - PROMOTE 2 C6 Validation Report
Desert Dust
REF PROMOTE-2 C6 ISSUE 10 DATE 06062008 PAGE 13 of 36
It must be noted that before the aerosol types are merged the appropriate bias correction must me made to the aerosol type selected
Figure 13-2 Comparison of 087 m Aeronet site measurement with SEVIRI measurements
Scattering aerosols Most aerosols fall into this category In this category the extinction is mainly a result of molecular (Rayleigh) scattering The aerosol types that fall into this category are the continental desert and maritime aerosols At small effective radius (re) the signal from these aerosols is almost identical only as the effective radius changes do the aerosol properties change
bull Absorbing aerosols The urban and biomass aerosols fall into this category These aerosols which may be composed of soot are strong absorbers and a considerable part of their reddening is due to the increase in their absorption at short wavelengths
bull All the aerosols types in the model used here are spherical
bull Ideally we would like to include many more aerosol types in particular mixed aerosols in the retrievals as theses are probably more realistic than some of the single aerosol types used here this is reserved for future investigations
GSE - PROMOTE 2 C6 Validation Report
Desert Dust
REF PROMOTE-2 C6 ISSUE 10 DATE 06062008 PAGE 14 of 36
Figure 13-3 Comparison of 055 m Aeronet site measurement with SEVIRI measurements and show that most of the retrievals fit a scattering aerosol in preference to an absorbing aerosol type The Aeronet retrievals in these figures are over sea land and coastal areas The 087nm channel has optical depths that are consistently smaller than the 055nm channel optical depths the 087nm AOD shows the best correlation over 80channel so this result is interpolated The comparisons with the 055nm channel show a positive bias at low AOD and a negative bias at high AOD The underestimation of AOD at high values has been noticed before in comparisons of MODIS data with Aeronet site In that paper they comment that the underestimation may be due to insufficient light absorption in aerosol models Perhaps a better channel to measure optical depth for SEVIRI would be the 067nm channel
1324 Results and show the comparison of each individual SEVIRI aerosol type with Aeronet 087 nm and 055nm channels respectively The error bars indicate the standard deviation of the AOD used over the plusmn30 minutes of Aeronet data and plusmn20 km of SEVIRI data to create the match up The line of best fit and correlation coefficient for each graph is calculated using the SEVIRI and Aeronet error bars It should be noted that we do not expect to see good agreement for all the measurements as clearly if the aerosol type used to retrieve the optical depth is the wrong type of aerosol then the optical depth retrieval will be incorrect In the simplest characterisation the aerosol types can in general be divided into 2 separate categories
GSE - PROMOTE 2 C6 Validation Report
Desert Dust
REF PROMOTE-2 C6 ISSUE 10 DATE 06062008 PAGE 15 of 36
Figure 13-4 Comparison of sea and coastal 087 m Aeronet site measurement with SEVIRI measurements
Figure 13-5 Comparison of sea and coastal 055 m Aeronet site measurement with SEVIRI measurements
In and only the Aeronet sites which are sited on the coast are considered ie the SEVIRI retrieval in these cases had a land fraction ranging from 0 to 099 The comparison with Aeronet observations in these cases is much better This reflects that it is generally easier to retrieve the properties of bright aerosols over dark surfaces At low optical depths there is a slight positive bias consistent with that seen by other remote sensing instruments such at MODIS This is most likely due to incorrect modelling of the ocean surface This is particularly a problem in coastal regions where the ocean colour
GSE - PROMOTE 2 C6 Validation Report
Desert Dust
REF PROMOTE-2 C6 ISSUE 10 DATE 06062008 PAGE 16 of 36
can vary substantially from the default Cox and Munk (with wind correction) calculation due to the presence of brighter type 2 coast waters At high optical depths there is a slight negative bias Interestingly for maritime aerosols there is a slight overall positive bias This could also be due to the difference in viewing geometry between the Aeronets cimel photometer and the geostationary SEVIRI instrument The Cimel photometer views pointing straight up while SEVIRI has a view angle that varies with latitude The SEVIRI measurement therefore has a longer path length that will intercept more aerosol The bias is relatively constant in the match ups identified in September 2004 nearly all of the match ups where in the European region
Figure 13-6 Comparison of land 0870nm Aeronet Site measurements with SEVIRI Measurements
Figure 13-7 Comparison of land 0550nm Aeronet Site measurements with SEVIRI Measurements
GSE - PROMOTE 2 C6 Validation Report
Desert Dust
REF PROMOTE-2 C6 ISSUE 10 DATE 06062008 PAGE 16 of 36
The land only matches ups shown in Figures 127 and 128 have considerably worse agreement between satellite and sun photometer retrievals This result suggests problems retrieving aerosol over highly reflective surfaces The worst retrievals were over desert surfaces In the absence of an operational SEVIRI surface reflectance product we have used the MODIS 16 day averaged albedo for the land surface reflectance that correspond to the SEVIRI channels While we allow the retrieval to adapt within errors to a different land surface reflectance this product could be improved
1325 Merging the aerosol types After studying the retrieval accuracy as a function of aerosol type it was decided to amalgamate only the continental maritime desert and biomass retrievals The urban and polluted maritime results gave misleading results when included in the amalgamation The validation plots and maps are still included for completeness and for further future flexibility Figure 129 shows the results of the retrievals that have been selected as the best match on the basis of cost The retrievals show a mix of aerosol types including some absorbing types that would be expected to be associated with urban areas The results are better for the 087nm channel than the 055nm channel There is a positive bias at low optical depth and a negative bias at high optical depths which is consistent with the individual aerosol comparisons This bias and slope will be corrected for in the merging algorithm Figures 1210 and 1211 show the comparison broken into sea and land sites
Figure 13-8 Amalgamated results for September 2004 1212 UTC The individual aerosol types were combined according to quality control and cost over land and sea
GSE - PROMOTE 2 C6 Validation Report
Desert Dust
REF PROMOTE-2 C6 ISSUE 10 DATE 06062008 PAGE 17 of 36
Figure 13-9 Amalgamated results for September 2004 1212 UTC The individual aerosol types were combined according to quality control and cost over land and sea
Figure 13-10 Amalgamated results for September 2004 1212 UTC The individual aerosol types were combined according to quality control and cost over land and sea
GSE - PROMOTE 2 C6 Validation Report
Desert Dust
REF PROMOTE-2 C6 ISSUE 10 DATE 06062008 PAGE 18 of 36
Figure 13-11 the right show scatter density distributions of the monthly mean value over sea
1326 Comparisons with other Satellite Platforms It have been also compared the service retrievals with MODIS and MISR Over sea the correlation with MODIS (061) is better than that between MISR and MODIS (048) Over land the correlation of SEVIRI with MISR (045) is better than that with MODIS (033) though not as good as the correlation between MISR and MODIS (062) It should however be noted that the region of the globe observed by SEVIRI omits Asian regions responsible for much of the global variability (ie there is less variability to be observed over the SEVIRI disk than globally so one might expect less correlation)
The following points relating to the SEVIRI AOD distribution are noted
bull The field is a daily product generated from individual retrievals from radiances observed at 1012 and 1612 UT No-data is acquired off the coast of southern Africa because this region is flagged as sun-glint in the 1012 image and has solar zenith angle greater than 70 at 1612 Apart from this feature however the ldquojoinrdquo between the regions sampled by one or both of the two radiance products is gratifyingly difficult to discern
bull Some of the high AODs off the north coast of South America are due to an underestimation of the spatial extent of sun-glint at 1612 (in turn due to probably erroneously low winds in the ECMWF analyses used to predict the glint area)
bull There appears to be some shift to the north of the high aerosol load over central southern Africa (which is mainly due to biomass burning) as observed by SEVIRI compared to MISR or MODIS (and compared to the associated plume off the east coast) This structure is likely to be due to problems modelling the surface reflectance over land in this region and is connected to the discrepancies found between SEVIRI AODs and those observed at the Mongu station
and land separately ldquo+rdquo symbols indicate the mean over all SEVIRI points within the indicated range of MODIS values Error bars indicate the corresponding standard deviation
GSE - PROMOTE 2 C6 Validation Report
Desert Dust
REF PROMOTE-2 C6 ISSUE 10 DATE 06062008 PAGE 19 of 36
al product and the most common aero l speciation identied
Figure 13-12 Number of data points in each bin of the of 1 degree gridded monthly statistic
so
GSE - PROMOTE 2 C6 Validation Report
Desert Dust
REF PROMOTE-2 C6 ISSUE 10 DATE 06062008 PAGE 20 of 36
1327 Conclusions Before discussing these results further it is worth noting that all aerosol retrieval schemes based on passive nadir visible near-infrared satellite imagery are subject to the following fundamental problems
1 Discrimination of aerosol from cloud The signal from most types of cloud is generally
much stronger than from aerosol Consequently even a relatively small amount of undetected cloud in a scene can cause large biases in retrieved AOD For this reason cloud masks are used to select only radiances which are cloud-free However care is required to avoid wrongly flagging cases of high aerosol load thereby omitting these potentially important events from the retrieved dataset and introducing a low bias into statistical analyses More fundamentally many clouds have aerosol as condensation nuclei and the point at which the ldquoaerosolrdquo becomes ldquocloudrdquo through growth of water droplets around the aerosol particle is ambiguous
2 Unknown aerosol composition The back-scattered signal observed by the satellite depends not only on the amount of aerosol present but crucially also on the phase function and single scatter albedo which in turn are dependent on the aerosol refractive index size distribution and particle shape There is generally insufficient information in remote measurements (even ground-based) to fully constrain the optical properties and as a consequence retrieved optical depths are quite strongly dependent upon a priori assumptions about the aerosol type
3 Surface reflection Over much of the land surface (and glint regions of sea) the signal from direct and diffuse reflection of radiation from the surface is much stronger than that from aerosol The sign of the aerosol effect on measured radiances changes depending on the surface reflectance and aerosol single scattering albedo so conditions exist in which radiances are insensitive to aerosol perturbations Relatively small errors in modelling the interaction of light with the surface can therefore cause significant error in aerosol retrieval For this reason retrieving aerosol over the (dark) ocean is relatively straightforward Retrievals over bright land surfaces are particularly challenging
The validation and inter-comparison results presented here demonstrate that all the products perform well over ocean yielding correlations with AERONET in the region of 08 (despite most stations being near the coast rather than open ocean) and correlations with the MODIS monthly mean distribution which are comparable or better than found between MODIS and MISR
Where problems exist these are almost exclusively related to retrievals over land The most positive results from the current official product set have been obtained for SEVIRI the AERONET correlation over land being 082 at 055microm without significant bias over many regions including Europe This leads to a number of impressive time-series comparisons with individual AERONET stations The SEVIRI agreement with MISR over land is also comparable to that between MISR and MODIS The benefit of geostationary observations in obtaining good sampling of the cloud-free atmosphere is clear from the number of good observations acquired even from the two observations per day that are analysed in the current set of products leading to a relatively large number of AERONET coincidences and a well sampled monthly mean field
The following recommendations are made based on the validation results and the considerations outlined above
GSE - PROMOTE 2 C6 Validation Report
Desert Dust
REF PROMOTE-2 C6 ISSUE 10 DATE 06062008 PAGE 21 of 36
bull There are indications of errors due to modelling of the surface reflectance in the SEVIRI retrieval (eg over central and southern Africa) These may be attributable to channel spectral response function difference compared to MODIS (use to define the a priori BRDF) Methods to correct for such systematic errors are being studied at the moment and could lead to a useful improvement in the short-term It is however noted that in the long-term it would be highly desirable to use surface BRDF information from SEVIRI itself
bull Some residual effect of sun-glint are evident in the SEVIRI product partly due to apparently underestimated wind-speeds in ECMWF Use of a minimum assumed wind speed to remove this effect is being considered
bull It would of course be desirable to process as many SEVIRI scenes in a single day as possible within available computing resource (SEVIRI acquires a scene every 15 minutes) Use of at least one additional time eg 1312 to complement the existing slots of 1012 and 1612 would be particularly desirable to eliminate the current data gap off eastern Africa which is contaminated by glint at 1012 and has too high a solar zenith angle at 1612 As noted above observing aerosol at different scattering angles can yield information on the phase function (and hence type) While multi-time observations cannot yet be directly exploited by the products scheme post analysis of retrievals at as many different time of day could help to improve the speciation (and hence estimated AOD) Multiple-time observations are of course also valuable for tracking the evolution of specific events
bull There is evidence of over-zealous cloud flagging leading to events of high aerosol load being omitted While the long-term aim would be to by-pass this issue altogether using a joint aerosol-cloud scheme for the current products more pragmatic measures to improve the current status would be desirable in the short-term For SEVIRI the cloud mask is not useful as a means of generating cloud-free radiances for partially cloudy scenes all partially cloud scenes are currently flagged as unreliable It would therefore make sense to process all scenes without regard to the Eumetsat cloud mask then rely (as is the case at the moment) on quality control criteria (including the Eumetsat cloud fraction) to screen cloud post-hoc
bull The assumed aerosol models (refractive indices size distribution assumed particle shape) do not of course perfectly represent the true aerosol conditions and improvements additions to the set of models used may well be worthwhile and are the subject of continuing research and development
GSE - PROMOTE 2 C6 Validation Report
Desert Dust
REF PROMOTE-2 C6 ISSUE 10 DATE 060620078 PAGE 22 of 38
133 Validation against specifications and against user requirements Requirements written in Italics are only recommended and not compulsory for Phase 2
VALIDATION AGAINST SERVICE SPECIFICATIONS
No limitationsdelays for compliance between theoretical and actual service specifications reported
VALIDATION AGAINST USER REQUIREMENTS
SPECIFICATION S5 REQUIRED ACTUAL
Parameters Latitude longitude Speciation Aerosol Optical Thickness 550nm Aerosol Optical Thickness 870nm Cloud Pixel Flag Land Sea Flag Sun Zenith Angle Sun Azimuth Angle View Zenith Angle Julian Date Effective Radius Angstrom Coefficient Angstrom Coefficient
Accuracy minimum ns ns
AOD plusmn 002 over ocean and plusmn 005 over
land
Accuracy target ns 15 ns
Spatial coverage South Europe (Spain Portugal and Italy)
South Europe (Spain Portugal
Macaronesia)
South Europe (Spain Portugal Macaronesia)
Horizontal resolution 10x10 Km2 ns 10x10 Km2
Vertical resolution ns ns ns
GridProjection Sinusoidal ns Sinusoidal
Temporal coverage 24 h ns 24 h
Temporal resolution 15 minutes ns 45 min
User Interfaces
PROMOTE Web ns Complete operational
up-to-date
Incomplete no operational not up to
date
ftp ns ns ns
On demand ns ns ns
Data formats and data delivery
Data availability ns Specific test periods in Phase 1 ns
GSE - PROMOTE 2 C6 Validation Report
Desert Dust
REF PROMOTE-2 C6 ISSUE 10 DATE 060620078 PAGE 23 of 38
Data access Online online Online
Delivery Mode
OfflineNRT
Phase 1 NRT for a specific test period to be defined
Phase 2 NRT For the available SEVIRI slots
NRT
Delivery frequency ns Daily Daily
Data Format IDL custom tool NetCDF netCDF HDF netCDF HDF
Historical archive None ns None
Visualization IDL custom tool NetCDF netCDF HDF ns
REMARKS
No Remarks
Requirements written in Italics are only recommended and not compulsory for Phase 1
Table 13-3 Validation of the Iberian Sub-service against specifications and against user requirements
134 Service quality assessment and control procedures
Service delivery start date The service was available from August 2007 but due to some problems found in the last validations the website was disabled due to user request (until products have the quality expected) It has been foreseen to open the site again in August 2008
SPECIFICATION S5 REQUIRED ACTUAL N checksDelivery period
Quality checks See Table 13-2
ns ns NA
Quality flags ns ns ns NA
Product confidence data
ns ns ns NA
Error bar definition and representation
NA NA NA NA
GSE - PROMOTE 2 C6 Validation Report
Desert Dust
REF PROMOTE-2 C6 ISSUE 10 DATE 060620078 PAGE 24 of 38
Representation of missing data
ns ns ns NA
Documentation of process failure
A control function which checks for
the presenceabsence of
implemented productauxiliary data It is split by
input data
ns ns NA
Version control mechanisms and representation
Version control process is enabled Current version is
11 Version number follows S5
upgrades
10-Pahse 1
11- Phase 2
ns ns NA
Requirements written in Italics are not compulsory for Phase 2
Table 13-4 Validation of quality assessment and control procedures for the Iberian Sub-service
GSE - PROMOTE 2 C6 Validation Report
Desert Dust
REF PROMOTE-2 C6 ISSUE 10 DATE 060620078 PAGE 25 of 38
14 Italian sub-service Service iswill be operational sinceafter January 2007
Research partners ISAC-CNR
Provider(s) CGS
Validation contact W Di Nicolantonio
Satellite desert dust detection is based on the radiances and Brightness Temperature (BT) sampled by the imaging radiometer SEVIRI (Spinning Enhanced Visible and InfraRed Imager) on board MSG-1 (Meteosat-8) meteorological satellite The high temporal (15 min) and spatial (about 4x4 km2 over the Mediterranean area) resolutions of MSG images in the IR channels allow to follow the evolution of dust transport towards the Italian region and may permit a link with threshold exceeding of PM concentrations measured in situ Desert Dust indicator maps are obtained by analyzing 87 108 and 120 μm SEVIRI IR channels
Figure 14-13 Desert dust transport highlighted in magenta as detected through the RGB BTD technique applied to SEVIRI IR channels as available for Phase 1
GSE - PROMOTE 2 C6 Validation Report
Desert Dust
REF PROMOTE-2 C6 ISSUE 10 DATE 060620078 PAGE 26 of 38
Figure 14-2 Desert dust transport highlighted in magenta as detected through the RGB BTD technique applied to SEVIRI IR channels for the
Mediterranean area monitored in Phase2 From the IR SEVIRI channels the two Difference of BT (BT120 ndash BT108) and (BT108 ndash BT87) needed to enhance the presence of desert dust are derived For sequence of RGB composite images where R=(BT120 ndash BT108) G=(BT108 ndash BT87) B=BT108 dust appears pink or magenta while for instance thick high-level clouds turn out red-brown and thin high-level clouds appear very dark In Figure 14-13 is reported a snapshot of the dust transport as detected by SEVIRI on 28 July 2005 at 12 am
141 Validation Plan and Validation Data For phase 1 validation dust transport events taking place in summer 2005 and detected by SEVIRMSG were compared to Lidar observation which are routinely carried out in Rome by ISAC-CNR Lidar observations allow detection of events of Saharan dust transport over Italy Dust particles are tipically non-spherical then Aerosol Depolarization level Da from Lidar measurements is a good indicator of the presence of mineral dust in the atmosphere Comparison have been made reporting time evolution of dust Aerosol Optical Depth minimum and maximum heights related to dust particles are recorded in order to classify the magnitude of the dust events as can be seen in Figure 14-
GSE - PROMOTE 2 C6 Validation Report
Desert Dust
REF PROMOTE-2 C6 ISSUE 10 DATE 060620078 PAGE 27 of 38
During the second phase of PROMOTE2 Lidar observations will be again employed for the comparison with time corresponding SEVIRI data for events from 2005 up to now
Figure 14-3 Lidar observations in Rome for three selected events in Summer 2005
A further indirect comparison about the presence of desert dust detected by SEVIRI was planned starting from the second phase of PROMOTE2 taking advantage of the several AERONET routine measurements carried out in the South Italy area In particular time patterns of Aerosol Optical Depth AOD and Aringngstroumlm parameter α in the visible wavelength range will be employed to highlight the presence of dust in terms of small values of parameter α accompanied by significant AOD Measurements since 2005 up to now will be analysed for the sites of Lampedusa (35N12E) Potenza (40N15E) Messina (38N15E) Lecce(40N18E) Tor Vergata (41N12E) Moreover to confirm the dust transport to the northern region of Italy AOD and α from Ispra (45N8E) station will be also examined For Phase 2 validation focus is on Spring 2007 for which 3 main events were detected analysing SEVIRIMSG data in terms of RGB-BTD
1 March 9 2007 2 April 8 ndash 18 2007 3 May 20 2007
and (for the AERONET comparison) on Summer 2005 for which 3 main events were detected analysing SEVIRIMSG data in terms of RGB-BTD
GSE - PROMOTE 2 C6 Validation Report
Desert Dust
REF PROMOTE-2 C6 ISSUE 10 DATE 060620078 PAGE 28 of 38
4 July 22 ndash August 08 2005 5 around August 10 2005 6 September 4 ndash 9 2005
As stated above lidar observations in Tor Vergata (Rome) [see Table 14-5] were employed In particular Figure 14-4 and Figure 14-5 show the time-patterns of dust AOD (AOD due only to the Saharan dust contribution to aerosol extinction) and corresponding minimum and maximum height of the dust layer Significant values of dust AOD are present around March 9 April 10 and May 20 together with layer heights ranging between 200 m to 7 km
0000
0100
0200
0300
0400
0500
0600
0700
270207 090307 190307 290307 080407 180407 280407 080507 180507 280507 070607
Dus
t aod
dust AOD
Figure 14-4 Time-pattern of the Aerosol Optical Depth only due to the saharan dust contribution (dust AOD) in the period March ndash May 2007 as recorded at Roma tor Vergata
0000
2000
4000
6000
8000
10000
270207 090307 190307 290307 080407 180407 280407 080507 180507 280507 070607
Dus
t Hei
ght (
km)
Zmin dust layerZmax dust layer
Figure 14-5 Time-pattern of the minimum and maximum height of the dust layer (Zmin dust layer Zmax dust layer) in the period March ndash May 2007 as recorded at Roma tor Vergata
Furthermore the indirect comparison against AERONET data [see table 14-1] has been made both for the events highlighted in Phase 1 validation (Summer 2005) and Phase2 validation (Spring
GSE - PROMOTE 2 C6 Validation Report
Desert Dust
REF PROMOTE-2 C6 ISSUE 10 DATE 060620078 PAGE 29 of 38
2007) AERONET Level2 data (iequality assured) for the Lampedusa and Lecce sites were available only for July-September 2005 period while Potenza and Messina data were available only for April-May 2007 Time patterns of Aerosol Optical Depth AOD at 440 nm and Angstroumlm parameter α relative to the visible wavelength range [440-870]nm are presented in the Figures below to highlight the presence of dust in terms of small values of parameter α accompanied by significant AOD Concerning Lampedusa site in summer 2005 (see Figure 14-6) an increase in AOD can be seen in correspondance of the decrease in parameter α for 2-4 August (214-216 julian day) AOD presents values lower than 02 at mid-July then undergoes to an increase up to 06 together with a decrease in α from 07 to almost 01 A similar behaviour can be recognized at the end of the event on 12-13 August (225-226 julian day) while in the period before a lack of data prevents further analysis Analysing time-patterns relative to Lecce AERONET site (Figure 14-7 ) AOD and α inversions are present around August 2 (214 julian day) August 12 (224 julian day) and from September 7 to 11 (250 ndash 254 julian day) Dust events in Spring 2007 did not significatively reach Messina and Potenza as can be seen in Figure 14-8 and Figure 14-9
GSE - PROMOTE 2 C6 Validation Report
Desert Dust
REF PROMOTE-2 C6 ISSUE 10 DATE 060620078 PAGE 30 of 38
Figure 14-6 Time-pattern of AOD 440 nm and Aringngstroumlm parameter α for July August and September 2005 at Lampedusa AERONET sites
GSE - PROMOTE 2 C6 Validation Report
Desert Dust
REF PROMOTE-2 C6 ISSUE 10 DATE 060620078 PAGE 31 of 38
Figure 14-7 Time-pattern of AOD 440 nm and Aringngstroumlm parameter α for July August and September 2005 at Lecce AERONET sites
Figure 14-8 Time-pattern of AOD 440 nm and Aringngstroumlm parameter for April and May 2007 at Messina AERONET sites
GSE - PROMOTE 2 C6 Validation Report
Desert Dust
REF PROMOTE-2 C6 ISSUE 10 DATE 060620078 PAGE 32 of 38
Figure 14-9 Time-pattern of AOD 440 nm and Aringngstroumlm parameter α for April and May 2007 at Potenza AERONET sites
VALIDATION DATA Ground basedin-situ observations Name Data availability and access (include access details if data is freely
available)AERONET data are freely available via web aeronetgsfcnasagov
AERONET observations - level 2
Spatial coverage and resolution NA Phase ( 2 ) Temporal coverage and resolution summer 2005 to december 2007 Location(s) (coordinates) Lampedusa (35N12E) Potenza (40N15E) Messina (38N15E) Lecce(40N18E) Uncertainty quantification (eg Accuracy) 002 for AOD
Name Data availability and access (include access details if data is freely available) events since 2005 available through QUITSAT ASI project from ISAC-CNR
Lidar observations Phase (1+2)
Spatial coverage and resolution NA Temporal coverage and resolution events since 2005 Location(s) (coordinates)Roma Tor Vergata (41N12E) Uncertainty quantification (eg Accuracy) TBD
Table 14-6 Data used for the validation of the Italian Desert Dust Awareness Sub-service
GSE - PROMOTE 2 C6 Validation Report
Desert Dust
REF PROMOTE-2 C6 ISSUE 10 DATE 060620078 PAGE 33 of 38
142 Validation of individual components Following Ackermann (1997) the so-called trispectral method is applied to MSG data In this approach brightness temperature differences (BTD) between the 108 and 87 μm channels set against BTD between the 12 and 108 μm channels enables to discriminate dust from the clear-sky over both oceans and lands In Figure 1-3 is reported an example of trispectral diagram applied to SEVIRI BTD Brightness Temperature Difference pertaining to July 27 2005 As can be seen in the figure three different populations can be discriminated relative to clear sky (blue triangles) clouds (brown diamonds) and desert dust (pink squares) pixels BTD SEVIRI data in spatial and temporal coincidences with Lidar andor AERONET sun-photometer observations will be analyzed for events in which all instruments detect dust presence SEVIRI in terms of BTD Lidar and sun-photometers in terms of Depolarization ratio AOD and Aringngstroumlm parameter
Figure 14-14 Example of trispectral diagram of BTD from MSG-1SEVIRI over the Mediterranean area related to July 27 2005
GSE - PROMOTE 2 C6 Validation Report
Desert Dust
REF PROMOTE-2 C6 ISSUE 10 DATE 060620078 PAGE 34 of 38
VALIDATION OF INDIVIDUAL COMPONENTS
Best estimator
ns Detection of the same dust event
Coincidence check Time-pattern diagrams for lidar data (dust AOD and dust layer height)
Quality assessment
Identification of outliers TBD
Quality checks Events detected by both SEVIRI and lidar measurements in terms of
1 Pixel magenta coloured for seviri (small values of the the differences BT(120-108) and positive small values of the differences of BT(108-87) and
2 Significatly high values of dust AOD as measured by the lidar
Accuracyerror no quantitative parameter defined TBD
Cloud screening quality control
Not enabled
Modelalgorithms
BTD technique Brightness Temperature Differences technique applied to 3 SEVIRI infrared bands IR87 IR108 and IR120 (Ackerman 1997)
RGB of BTD as false color composition httpwwweumetsatintendpsmsgchannel_interpindexhtml
Composite RGB
R=BT(IR120) ndashBT(IR108)
G= BT(IR108)-BT(IR87)
B=BT(IR108)
Consistency
MSG data vs LIDAR
in both period selected for validation with lidar measurements (Summer 05 Spring 07) events detected by MSG were detected in correspondance by lidar measurement in Roma Tor Vergata (see figs Figure 14-3 Figure 14-4 and Figure 14-5
GSE - PROMOTE 2 C6 Validation Report
Desert Dust
REF PROMOTE-2 C6 ISSUE 10 DATE 060620078 PAGE 35 of 38
MSG data vs In-situ
For periods selected in Summer 2005 AERONET data shown the typical behaviour of dust aerosol loading (see figs Figure 14-6 and Figure 14-7)
For period in spring 2007 AERONET sites providing level2 data are not reached by the dust transport as can be seen in the product available in the service web site and it is confirmed in figs Figure 14-8 Figure 14-9
Table 14-7 Validation of individual components of the Italian Service
Validation against specifications and against user requirements Requirements written in Italics are only recommended and not compulsory for Phase 1
VALIDATION AGAINST SERVICE SPECIFICATIONS
variation has been made in the processing chain regarding data format conversion in the data import part areas selection and data archiving
SPECIFICATION S5 REQUIRED ACTUAL
Parameters Desert dust indicator
Accuracy minimum NA ns NA
Accuracy target ns ns TBD
Spatial coverage 10degN ndash 50degN lat 20degW ndash 50degE long
Italy Phase 1 Italy
Phase 2 Mediterranean area (see Figure 14-2)
Horizontal resolution 3x3 Km2 (Ground pixel) ns 3x3 km2
Vertical resolution ns ns na
GridProjection MSG perspective ns MSG perspective
Temporal coverage transport events ns Phase 1 selected dust transport events
Phase 2 NRT monitoring with a delay of 24 hour
Temporal resolution 30 minutes ns 15 minutes
User Interfaces
GSE - PROMOTE 2 C6 Validation Report
Desert Dust
REF PROMOTE-2 C6 ISSUE 10 DATE 060620078 PAGE 36 of 38
PROMOTE Web ns Operational complete and up to date
Operational complete and not up to date
Phase 2 operational complete and updated
ftp ns ns on demand
Data formats and data delivery
Data availability
ns
Specific test periods in Phase 1 (agreed with
users)
In Phase 2 data from Saharian sources
towards Italy
Phase1 Dust transport events detected since
Summer 2005
Phase2 2006 since May whole 2007 and NRT monitoring for
2008
Data access Online online Online
Delivery Mode NRT NRT
Phase 1 Offline
Phase 2 through web-page
Delivery frequency 30 minutes ns 60 minutes
Data Format Png image sequences geotiff on demand Png image sequences
Historical archive None ns None
Visualization geoTIFF png and gif viewers geoTIFF png and gif
viewers
REMARKS
] NRT service planned for phase 3 is started during the phase 2
Table 14-8 Validation of the Italian Sub-service against specifications and against user requirements
GSE - PROMOTE 2 C6 Validation Report
Desert Dust
REF PROMOTE-2 C6 ISSUE 10 DATE 060620078 PAGE 37 of 38
143 Quality assessment and control procedures
Service delivery start date ns
SPECIFICATION S5 REQUIRED
ACTUAL N checksDelivery period
Quality checks See Table 14-7
ns detection of the same dust event by SEVIRI and lidar
Once during validation phase for the whole data-set
Quality flags ns ns NA NA
Product confidence data
ns ns NA NA
Error bar definition and representation
NA NA NA NA]
Representation of missing data
ns ns In the NRT chain a log file is generated with the list of days for which no data
are available
Log file during
processing
Documentation of process failure
Not enabled No automatic reporting on process failure
enabled Only screen reporting
available
ns not enabled not enabled
Version control mechanisms and representation
Version control process is enabled Current version is
11 Version number follows S5
upgrades
10-Phase 1
11- Phase 2
ns V 12 related to S5 April 08
ns
Requirements written in Italics are not compulsory for Phase 2
Table 14-9 Validation of quality control procedures for the Italian Sub-service
GSE - PROMOTE 2 C6 Validation Report
Desert Dust
REF PROMOTE-2 C6 ISSUE 10 DATE 060620078 PAGE 38 of 38
15 References
151 Electronic references httpaeronetgsfcnasagov
httpwwweumetsatintendpsmsgchannel_interpindexhtml
152 Bibliographic references Ackerman S 1997 ldquoRemote sensing of aerosols using satellite infrared observationsrdquo JGeophys Res 102 17069-17079 Gobbi G P F Barnaba and L Ammannato 2004 The vertical distribution of aerosols Saharan dust and cirrus clouds in Rome (Italy) in the year 2001 Atmospheric Chemistry and Physics Vol 4 351-359
- DOCUMENT STATUS SHEET
- DOCUMENT CHANGE RECORD
- LIST OF TABLES
- LIST OF FIGURES
- LIST OF ACRONYMS
- TABLE OF CONTENTS
- 1 DESERT DUST AWARENESS
-
- 11 Service Summary
- 11
- 12 Product characterization
- 13 Iberian sub-service
-
- 131 Validation plan and validation data
-
- 1311 Development and testing of a validation tool
- 1312 Validation by means of the visualization tool
- 1313 Validation of SEVIRI data with AERONET and ADRIEX data
-
- 132 Validation of individual components
-
- 1321 SEVIRI cloud screening
- 1322 Screening procedures
- 1323 Fits of Aeronet site measurements to coincident SEVIRI retrievals
- 1324 Results
- 1325 Merging the aerosol types
- 1326 Comparisons with other Satellite Platforms
- 1327 Conclusions
-
- 133 Validation against specifications and against user requirements
- 134 Service quality assessment and control procedures
-
- 14 Italian sub-service
-
- 141 Validation Plan and Validation Data
- 142 Validation of individual components
- sect Validation against specifications and against user requirements
- 143 Quality assessment and control procedures
-
- 15 References
-
- 151 Electronic references
- 152 Bibliographic references
-
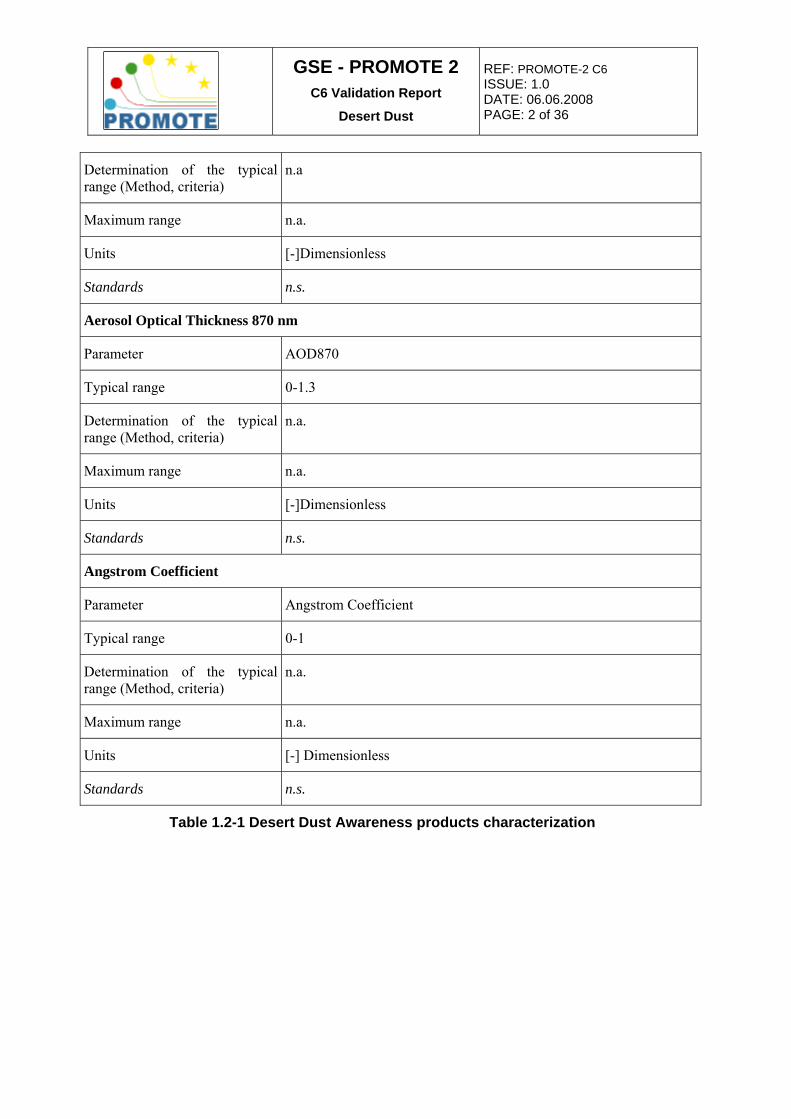
GSE - PROMOTE 2 C6 Validation Report
Desert Dust
REF PROMOTE-2 C6 ISSUE 10 DATE 06062008 PAGE 7 of 36
ADRIEX Campaign Phase 1+2
Data availability and access Data is provided in binary files Spatial coverage and resolution 10 Km resolution grid Temporal coverage and resolution and resolution 27-08-20046-09-2004 Location(s) (coordinates) Northern Italy the Adriatic Sea and between Northern Italy and the West coast of the Black Sea Accuracy 002 over ocean and 005 over land
Model outputs NA
Other EO Data SEVIRI Version 0100 level 01 Version 0100 of cloud flag Phase 1+2
Data availability and access Images at 1012 et 1615 Spatial coverage and resolution 10x10 Km2 Temporal coverage and resolution 26-0830-09 2004 Location(s) (coordinates)computational domain Whole SEVIRI image Accuracy 002 over ocean and 005 over land
MODIS Phase 1+2 Data availability and access NA Spatial coverage and resolution1ordmx1ordm Temporal coverage and resolution September 2004 Location(s) (coordinates)computational domain Full earth coverage Accuracy 002 over ocean and 005 over land
Table 13-1 Data used for the validation of the Iberian Desert Dust Awareness sub-service
132 Validation of individual components
1321 SEVIRI cloud screening The Operational SEVIRI cloud flag was found at an early validation stage to underestimate the real amount of cloud in a pixel Fortunately the technique used to retrieve aerosol optical depth has a number of measures to identify cloud-contaminated pixels The following extra quality control was applied to identify cloudy pixels
bull Retrieval must reach a proper convergence
bull Optical depth is less than 30
bull Cost ie the measure of the fit to the aerosol model is less than 10 over land and less than 5 over sea
bull More than one iteration of the retrieval is performed
bull The effective radius retrieved is less than the maximum defined for the selected aerosol type
The Application of this quality control remove approximately extra 20 of pixels previously deemed clear
GSE - PROMOTE 2 C6 Validation Report
Desert Dust
REF PROMOTE-2 C6 ISSUE 10 DATE 06062008 PAGE 8 of 36
VALIDATION OF INDIVIDUAL COMPONENTS Best stimator ns
Screening procedures Identification of outliers AOD550 AOD870 The way to identify out of range values is
fixing a threshold that has been established on 30 as maximum and 00 as minimum (by definition) So the procedure is comparison against a fixed value
Bad retrievals Parameters checked for bad retrievals are exactly the same ad the ones considered for outliers AOD550 AOD870 We apply the following quality checks Cloud Fraction set to 0 Sun glint Effective radius lt 3Mm Surface albedo lt 012 Cost function lt3 for continental over sea Cost function lt10 for desert over sea Cost function lt30 for maritime over sea Cost function lt1 for biomass over sea Cost function lt30 for continental over land Cost function lt1 for desert over land Cost function lt1 for maritime over land Cost function lt2 for biomass over land
Quality checks Cloud Fraction set to 0 Sun-glint Effective radius lt 3Mm Surface albedo lt 012 Cost function lt3 for continental over sea Cost function lt10 for desert over sea Cost function lt30 for maritime over sea Cost function lt1 for biomass over sea Cost function lt30 for continental over land Cost function lt1 for desert over land Cost function lt1 for maritime over land Cost function lt2 for biomass over land
Accuracyerror 002 Over ocean and 005 over land
GSE - PROMOTE 2 C6 Validation Report
Desert Dust
REF PROMOTE-2 C6 ISSUE 10 DATE 06062008 PAGE 9 of 36
Cross-correlation With Aeronet Cost lt 10 Number of iterations gt 1 AOD lt 3 Cloud fraction = 00
Validation passfail criteria (Regression testing)
002 over ocean and 005 over land
Cloud screening quality control
See figure 13
Aeronet data manual inspection
na
Modelalgorithms SEVIRI Cloud flag needs a correction that can be done for Optical Depths of less than 3 and when the retrieved aerosol effective radius is smaller than 10 over land and smaller than 5 over sea See 1322 and Smirnov 2000
SEVIRI Cloud Screening (SEVIRI Cloud Mask v1)
The validation parameter is the standard deviation See Section 1322 and Smirnov 2000 AERONET Cloud Screening
(v20) See Figure 13-1Only Cloud free data is used for validation SKYNET vs AERONET
() The validation is done by mean of a cross-correlation Only Cloud free data is used for validation DISORT Model ()
The validation is done by mean of a cross-correlation
Sunglint calculated using ECMWF winds using the Cox and Monk formulation and an under light and foam contribution
Sunglint Correction (3rd SEVIRI Slot)
Not final parameter stored It is intermediated data used for the final process
Other
1x1 AOD Monthly averages Creation of Weekly or monthly products containing minimum maximum average and standard deviation of AOD and Angtstrom Coefficient The bin size may be selected for 1 kmX1 Km or 1ordmx1ordm
AOD averaged
Angstrom Coefficient Averaged
Table 13-2 Validation of individual components of the Iberian Service
GSE - PROMOTE 2 C6 Validation Report
Desert Dust
REF PROMOTE-2 C6 ISSUE 10 DATE 06062008 PAGE 10 of 36
1322 Screening procedures
Measurements which are contaminated by cloud are identified by a screening procedure Smirnov 2000 based on the assumption that large rapid variations in retrieved AOD are caused by clouds The flowchart for this screening process is shown in Figure 13-1
Filters are applied to the triplet of observations upon which a single AOD measurement is based and over all observations on a given day Only data which is known to be cloud free will be used for validation of PROMOTE products The screening procedure (which also includes a number of other quality control tests is illustrated schematically in Figure 3) In addition to the automatic cloud screening and quality assurance procedure data are also manually inspected at Aeronet to further ensure a consistent data quality (level 2 data) Only Level 2 data is used in this project
For each daily product a separate rdquocoincidence filerdquo containing all information required to perform the validation was generated as follows
For each of the selected Aeronet stations
bull The closest rdquoground-pixelrdquo (ie 10x10km grid box) is identified
bull AOD and Angstrom coefficient are extracted within a region on plusmnΔP pixels from this pixel The baseline value of ΔP is 2 from Ichoku 2003
GSE - PROMOTE 2 C6 Validation Report
Desert Dust
REF PROMOTE-2 C6 ISSUE 10 DATE 06062008 PAGE 11 of 36
Figure 13-1 Schematic of the Aeronet cloud screening procedure from Smirnov 2000
bull The number of valid PROMOTE retrievals mean and standard deviation of τA and σA from this spatial sample are determined and stored as NG μτG στG μαG σαG respectively The estimated accuracy of the mean quantities is also estimated and stored based on the error diagnostics provided with the retrieval (taking into account approximately whether these errors are expected to be random or systematic over the relevant spatial scale) ΔμτG ΔμαG
bull All Aeronet measurements for the given ground station are extracted with time plusmnΔT of the satellite overpass The baseline for ΔT is 30 minutes (which given a
GSE - PROMOTE 2 C6 Validation Report
Desert Dust
REF PROMOTE-2 C6 ISSUE 10 DATE 06062008 PAGE 12 of 36
typical aerosol transport speed of 50kmhour is consistent with the 50 km spatial distance sampled from the PROMOTE product if ΔP is 2)
bull The number of valid retrievals mean and standard deviation of τA and σA from this temporal sample are determined and stored as NA μτA στA μαA σαA respectively
bull There was no Earlinet lidar data provided that was time coincident with SEVIRI satellite retrievals
bull For SEVIRI a separate file is produced for each time-step
For the extraction of coincident measurements the following validations and inter-comparisons were undertaken
bull Comparison with Daily Aeronet measurements of optical depth at 087nm and 055nm
bull Inter-comparison with MODIS 1x1o monthly averaged optical depth
1323 Fits of Aeronet site measurements to coincident SEVIRI retrievals
SEVIRI optical depths are compared with the Aeronet retrieved optical depths A comparison is made assuming 6 different aerosol types and then with the merged data set which selects the optimal aerosol type based on cost The quality control applied in the first scenario is
1 Cost lt 10
2 Number of iterations gt 1
3 AOD lt 3
4 Cloud fraction = 00
In the merged data set after careful analysis of the data the selection criteria was biased to prefer continental or biomass aerosol over land and maritime or desert over sea The quality criteria applied in this case was
1 Cost lt 3 for continental over sea
2 Cost lt 10 for desert over sea
3 Cost lt 30 for maritime over sea
4 Cost lt 1 for biomass over sea
5 Cost lt 30 for continental over land
6 Cost lt 1 for desert over land
7 Cost lt 1 for maritime over land
8 Cost lt 2 for biomass over land
9 Number of iterations gt 1
10 AOD lt 3
11 Cloud fraction = 00
GSE - PROMOTE 2 C6 Validation Report
Desert Dust
REF PROMOTE-2 C6 ISSUE 10 DATE 06062008 PAGE 13 of 36
It must be noted that before the aerosol types are merged the appropriate bias correction must me made to the aerosol type selected
Figure 13-2 Comparison of 087 m Aeronet site measurement with SEVIRI measurements
Scattering aerosols Most aerosols fall into this category In this category the extinction is mainly a result of molecular (Rayleigh) scattering The aerosol types that fall into this category are the continental desert and maritime aerosols At small effective radius (re) the signal from these aerosols is almost identical only as the effective radius changes do the aerosol properties change
bull Absorbing aerosols The urban and biomass aerosols fall into this category These aerosols which may be composed of soot are strong absorbers and a considerable part of their reddening is due to the increase in their absorption at short wavelengths
bull All the aerosols types in the model used here are spherical
bull Ideally we would like to include many more aerosol types in particular mixed aerosols in the retrievals as theses are probably more realistic than some of the single aerosol types used here this is reserved for future investigations
GSE - PROMOTE 2 C6 Validation Report
Desert Dust
REF PROMOTE-2 C6 ISSUE 10 DATE 06062008 PAGE 14 of 36
Figure 13-3 Comparison of 055 m Aeronet site measurement with SEVIRI measurements and show that most of the retrievals fit a scattering aerosol in preference to an absorbing aerosol type The Aeronet retrievals in these figures are over sea land and coastal areas The 087nm channel has optical depths that are consistently smaller than the 055nm channel optical depths the 087nm AOD shows the best correlation over 80channel so this result is interpolated The comparisons with the 055nm channel show a positive bias at low AOD and a negative bias at high AOD The underestimation of AOD at high values has been noticed before in comparisons of MODIS data with Aeronet site In that paper they comment that the underestimation may be due to insufficient light absorption in aerosol models Perhaps a better channel to measure optical depth for SEVIRI would be the 067nm channel
1324 Results and show the comparison of each individual SEVIRI aerosol type with Aeronet 087 nm and 055nm channels respectively The error bars indicate the standard deviation of the AOD used over the plusmn30 minutes of Aeronet data and plusmn20 km of SEVIRI data to create the match up The line of best fit and correlation coefficient for each graph is calculated using the SEVIRI and Aeronet error bars It should be noted that we do not expect to see good agreement for all the measurements as clearly if the aerosol type used to retrieve the optical depth is the wrong type of aerosol then the optical depth retrieval will be incorrect In the simplest characterisation the aerosol types can in general be divided into 2 separate categories
GSE - PROMOTE 2 C6 Validation Report
Desert Dust
REF PROMOTE-2 C6 ISSUE 10 DATE 06062008 PAGE 15 of 36
Figure 13-4 Comparison of sea and coastal 087 m Aeronet site measurement with SEVIRI measurements
Figure 13-5 Comparison of sea and coastal 055 m Aeronet site measurement with SEVIRI measurements
In and only the Aeronet sites which are sited on the coast are considered ie the SEVIRI retrieval in these cases had a land fraction ranging from 0 to 099 The comparison with Aeronet observations in these cases is much better This reflects that it is generally easier to retrieve the properties of bright aerosols over dark surfaces At low optical depths there is a slight positive bias consistent with that seen by other remote sensing instruments such at MODIS This is most likely due to incorrect modelling of the ocean surface This is particularly a problem in coastal regions where the ocean colour
GSE - PROMOTE 2 C6 Validation Report
Desert Dust
REF PROMOTE-2 C6 ISSUE 10 DATE 06062008 PAGE 16 of 36
can vary substantially from the default Cox and Munk (with wind correction) calculation due to the presence of brighter type 2 coast waters At high optical depths there is a slight negative bias Interestingly for maritime aerosols there is a slight overall positive bias This could also be due to the difference in viewing geometry between the Aeronets cimel photometer and the geostationary SEVIRI instrument The Cimel photometer views pointing straight up while SEVIRI has a view angle that varies with latitude The SEVIRI measurement therefore has a longer path length that will intercept more aerosol The bias is relatively constant in the match ups identified in September 2004 nearly all of the match ups where in the European region
Figure 13-6 Comparison of land 0870nm Aeronet Site measurements with SEVIRI Measurements
Figure 13-7 Comparison of land 0550nm Aeronet Site measurements with SEVIRI Measurements
GSE - PROMOTE 2 C6 Validation Report
Desert Dust
REF PROMOTE-2 C6 ISSUE 10 DATE 06062008 PAGE 16 of 36
The land only matches ups shown in Figures 127 and 128 have considerably worse agreement between satellite and sun photometer retrievals This result suggests problems retrieving aerosol over highly reflective surfaces The worst retrievals were over desert surfaces In the absence of an operational SEVIRI surface reflectance product we have used the MODIS 16 day averaged albedo for the land surface reflectance that correspond to the SEVIRI channels While we allow the retrieval to adapt within errors to a different land surface reflectance this product could be improved
1325 Merging the aerosol types After studying the retrieval accuracy as a function of aerosol type it was decided to amalgamate only the continental maritime desert and biomass retrievals The urban and polluted maritime results gave misleading results when included in the amalgamation The validation plots and maps are still included for completeness and for further future flexibility Figure 129 shows the results of the retrievals that have been selected as the best match on the basis of cost The retrievals show a mix of aerosol types including some absorbing types that would be expected to be associated with urban areas The results are better for the 087nm channel than the 055nm channel There is a positive bias at low optical depth and a negative bias at high optical depths which is consistent with the individual aerosol comparisons This bias and slope will be corrected for in the merging algorithm Figures 1210 and 1211 show the comparison broken into sea and land sites
Figure 13-8 Amalgamated results for September 2004 1212 UTC The individual aerosol types were combined according to quality control and cost over land and sea
GSE - PROMOTE 2 C6 Validation Report
Desert Dust
REF PROMOTE-2 C6 ISSUE 10 DATE 06062008 PAGE 17 of 36
Figure 13-9 Amalgamated results for September 2004 1212 UTC The individual aerosol types were combined according to quality control and cost over land and sea
Figure 13-10 Amalgamated results for September 2004 1212 UTC The individual aerosol types were combined according to quality control and cost over land and sea
GSE - PROMOTE 2 C6 Validation Report
Desert Dust
REF PROMOTE-2 C6 ISSUE 10 DATE 06062008 PAGE 18 of 36
Figure 13-11 the right show scatter density distributions of the monthly mean value over sea
1326 Comparisons with other Satellite Platforms It have been also compared the service retrievals with MODIS and MISR Over sea the correlation with MODIS (061) is better than that between MISR and MODIS (048) Over land the correlation of SEVIRI with MISR (045) is better than that with MODIS (033) though not as good as the correlation between MISR and MODIS (062) It should however be noted that the region of the globe observed by SEVIRI omits Asian regions responsible for much of the global variability (ie there is less variability to be observed over the SEVIRI disk than globally so one might expect less correlation)
The following points relating to the SEVIRI AOD distribution are noted
bull The field is a daily product generated from individual retrievals from radiances observed at 1012 and 1612 UT No-data is acquired off the coast of southern Africa because this region is flagged as sun-glint in the 1012 image and has solar zenith angle greater than 70 at 1612 Apart from this feature however the ldquojoinrdquo between the regions sampled by one or both of the two radiance products is gratifyingly difficult to discern
bull Some of the high AODs off the north coast of South America are due to an underestimation of the spatial extent of sun-glint at 1612 (in turn due to probably erroneously low winds in the ECMWF analyses used to predict the glint area)
bull There appears to be some shift to the north of the high aerosol load over central southern Africa (which is mainly due to biomass burning) as observed by SEVIRI compared to MISR or MODIS (and compared to the associated plume off the east coast) This structure is likely to be due to problems modelling the surface reflectance over land in this region and is connected to the discrepancies found between SEVIRI AODs and those observed at the Mongu station
and land separately ldquo+rdquo symbols indicate the mean over all SEVIRI points within the indicated range of MODIS values Error bars indicate the corresponding standard deviation
GSE - PROMOTE 2 C6 Validation Report
Desert Dust
REF PROMOTE-2 C6 ISSUE 10 DATE 06062008 PAGE 19 of 36
al product and the most common aero l speciation identied
Figure 13-12 Number of data points in each bin of the of 1 degree gridded monthly statistic
so
GSE - PROMOTE 2 C6 Validation Report
Desert Dust
REF PROMOTE-2 C6 ISSUE 10 DATE 06062008 PAGE 20 of 36
1327 Conclusions Before discussing these results further it is worth noting that all aerosol retrieval schemes based on passive nadir visible near-infrared satellite imagery are subject to the following fundamental problems
1 Discrimination of aerosol from cloud The signal from most types of cloud is generally
much stronger than from aerosol Consequently even a relatively small amount of undetected cloud in a scene can cause large biases in retrieved AOD For this reason cloud masks are used to select only radiances which are cloud-free However care is required to avoid wrongly flagging cases of high aerosol load thereby omitting these potentially important events from the retrieved dataset and introducing a low bias into statistical analyses More fundamentally many clouds have aerosol as condensation nuclei and the point at which the ldquoaerosolrdquo becomes ldquocloudrdquo through growth of water droplets around the aerosol particle is ambiguous
2 Unknown aerosol composition The back-scattered signal observed by the satellite depends not only on the amount of aerosol present but crucially also on the phase function and single scatter albedo which in turn are dependent on the aerosol refractive index size distribution and particle shape There is generally insufficient information in remote measurements (even ground-based) to fully constrain the optical properties and as a consequence retrieved optical depths are quite strongly dependent upon a priori assumptions about the aerosol type
3 Surface reflection Over much of the land surface (and glint regions of sea) the signal from direct and diffuse reflection of radiation from the surface is much stronger than that from aerosol The sign of the aerosol effect on measured radiances changes depending on the surface reflectance and aerosol single scattering albedo so conditions exist in which radiances are insensitive to aerosol perturbations Relatively small errors in modelling the interaction of light with the surface can therefore cause significant error in aerosol retrieval For this reason retrieving aerosol over the (dark) ocean is relatively straightforward Retrievals over bright land surfaces are particularly challenging
The validation and inter-comparison results presented here demonstrate that all the products perform well over ocean yielding correlations with AERONET in the region of 08 (despite most stations being near the coast rather than open ocean) and correlations with the MODIS monthly mean distribution which are comparable or better than found between MODIS and MISR
Where problems exist these are almost exclusively related to retrievals over land The most positive results from the current official product set have been obtained for SEVIRI the AERONET correlation over land being 082 at 055microm without significant bias over many regions including Europe This leads to a number of impressive time-series comparisons with individual AERONET stations The SEVIRI agreement with MISR over land is also comparable to that between MISR and MODIS The benefit of geostationary observations in obtaining good sampling of the cloud-free atmosphere is clear from the number of good observations acquired even from the two observations per day that are analysed in the current set of products leading to a relatively large number of AERONET coincidences and a well sampled monthly mean field
The following recommendations are made based on the validation results and the considerations outlined above
GSE - PROMOTE 2 C6 Validation Report
Desert Dust
REF PROMOTE-2 C6 ISSUE 10 DATE 06062008 PAGE 21 of 36
bull There are indications of errors due to modelling of the surface reflectance in the SEVIRI retrieval (eg over central and southern Africa) These may be attributable to channel spectral response function difference compared to MODIS (use to define the a priori BRDF) Methods to correct for such systematic errors are being studied at the moment and could lead to a useful improvement in the short-term It is however noted that in the long-term it would be highly desirable to use surface BRDF information from SEVIRI itself
bull Some residual effect of sun-glint are evident in the SEVIRI product partly due to apparently underestimated wind-speeds in ECMWF Use of a minimum assumed wind speed to remove this effect is being considered
bull It would of course be desirable to process as many SEVIRI scenes in a single day as possible within available computing resource (SEVIRI acquires a scene every 15 minutes) Use of at least one additional time eg 1312 to complement the existing slots of 1012 and 1612 would be particularly desirable to eliminate the current data gap off eastern Africa which is contaminated by glint at 1012 and has too high a solar zenith angle at 1612 As noted above observing aerosol at different scattering angles can yield information on the phase function (and hence type) While multi-time observations cannot yet be directly exploited by the products scheme post analysis of retrievals at as many different time of day could help to improve the speciation (and hence estimated AOD) Multiple-time observations are of course also valuable for tracking the evolution of specific events
bull There is evidence of over-zealous cloud flagging leading to events of high aerosol load being omitted While the long-term aim would be to by-pass this issue altogether using a joint aerosol-cloud scheme for the current products more pragmatic measures to improve the current status would be desirable in the short-term For SEVIRI the cloud mask is not useful as a means of generating cloud-free radiances for partially cloudy scenes all partially cloud scenes are currently flagged as unreliable It would therefore make sense to process all scenes without regard to the Eumetsat cloud mask then rely (as is the case at the moment) on quality control criteria (including the Eumetsat cloud fraction) to screen cloud post-hoc
bull The assumed aerosol models (refractive indices size distribution assumed particle shape) do not of course perfectly represent the true aerosol conditions and improvements additions to the set of models used may well be worthwhile and are the subject of continuing research and development
GSE - PROMOTE 2 C6 Validation Report
Desert Dust
REF PROMOTE-2 C6 ISSUE 10 DATE 060620078 PAGE 22 of 38
133 Validation against specifications and against user requirements Requirements written in Italics are only recommended and not compulsory for Phase 2
VALIDATION AGAINST SERVICE SPECIFICATIONS
No limitationsdelays for compliance between theoretical and actual service specifications reported
VALIDATION AGAINST USER REQUIREMENTS
SPECIFICATION S5 REQUIRED ACTUAL
Parameters Latitude longitude Speciation Aerosol Optical Thickness 550nm Aerosol Optical Thickness 870nm Cloud Pixel Flag Land Sea Flag Sun Zenith Angle Sun Azimuth Angle View Zenith Angle Julian Date Effective Radius Angstrom Coefficient Angstrom Coefficient
Accuracy minimum ns ns
AOD plusmn 002 over ocean and plusmn 005 over
land
Accuracy target ns 15 ns
Spatial coverage South Europe (Spain Portugal and Italy)
South Europe (Spain Portugal
Macaronesia)
South Europe (Spain Portugal Macaronesia)
Horizontal resolution 10x10 Km2 ns 10x10 Km2
Vertical resolution ns ns ns
GridProjection Sinusoidal ns Sinusoidal
Temporal coverage 24 h ns 24 h
Temporal resolution 15 minutes ns 45 min
User Interfaces
PROMOTE Web ns Complete operational
up-to-date
Incomplete no operational not up to
date
ftp ns ns ns
On demand ns ns ns
Data formats and data delivery
Data availability ns Specific test periods in Phase 1 ns
GSE - PROMOTE 2 C6 Validation Report
Desert Dust
REF PROMOTE-2 C6 ISSUE 10 DATE 060620078 PAGE 23 of 38
Data access Online online Online
Delivery Mode
OfflineNRT
Phase 1 NRT for a specific test period to be defined
Phase 2 NRT For the available SEVIRI slots
NRT
Delivery frequency ns Daily Daily
Data Format IDL custom tool NetCDF netCDF HDF netCDF HDF
Historical archive None ns None
Visualization IDL custom tool NetCDF netCDF HDF ns
REMARKS
No Remarks
Requirements written in Italics are only recommended and not compulsory for Phase 1
Table 13-3 Validation of the Iberian Sub-service against specifications and against user requirements
134 Service quality assessment and control procedures
Service delivery start date The service was available from August 2007 but due to some problems found in the last validations the website was disabled due to user request (until products have the quality expected) It has been foreseen to open the site again in August 2008
SPECIFICATION S5 REQUIRED ACTUAL N checksDelivery period
Quality checks See Table 13-2
ns ns NA
Quality flags ns ns ns NA
Product confidence data
ns ns ns NA
Error bar definition and representation
NA NA NA NA
GSE - PROMOTE 2 C6 Validation Report
Desert Dust
REF PROMOTE-2 C6 ISSUE 10 DATE 060620078 PAGE 24 of 38
Representation of missing data
ns ns ns NA
Documentation of process failure
A control function which checks for
the presenceabsence of
implemented productauxiliary data It is split by
input data
ns ns NA
Version control mechanisms and representation
Version control process is enabled Current version is
11 Version number follows S5
upgrades
10-Pahse 1
11- Phase 2
ns ns NA
Requirements written in Italics are not compulsory for Phase 2
Table 13-4 Validation of quality assessment and control procedures for the Iberian Sub-service
GSE - PROMOTE 2 C6 Validation Report
Desert Dust
REF PROMOTE-2 C6 ISSUE 10 DATE 060620078 PAGE 25 of 38
14 Italian sub-service Service iswill be operational sinceafter January 2007
Research partners ISAC-CNR
Provider(s) CGS
Validation contact W Di Nicolantonio
Satellite desert dust detection is based on the radiances and Brightness Temperature (BT) sampled by the imaging radiometer SEVIRI (Spinning Enhanced Visible and InfraRed Imager) on board MSG-1 (Meteosat-8) meteorological satellite The high temporal (15 min) and spatial (about 4x4 km2 over the Mediterranean area) resolutions of MSG images in the IR channels allow to follow the evolution of dust transport towards the Italian region and may permit a link with threshold exceeding of PM concentrations measured in situ Desert Dust indicator maps are obtained by analyzing 87 108 and 120 μm SEVIRI IR channels
Figure 14-13 Desert dust transport highlighted in magenta as detected through the RGB BTD technique applied to SEVIRI IR channels as available for Phase 1
GSE - PROMOTE 2 C6 Validation Report
Desert Dust
REF PROMOTE-2 C6 ISSUE 10 DATE 060620078 PAGE 26 of 38
Figure 14-2 Desert dust transport highlighted in magenta as detected through the RGB BTD technique applied to SEVIRI IR channels for the
Mediterranean area monitored in Phase2 From the IR SEVIRI channels the two Difference of BT (BT120 ndash BT108) and (BT108 ndash BT87) needed to enhance the presence of desert dust are derived For sequence of RGB composite images where R=(BT120 ndash BT108) G=(BT108 ndash BT87) B=BT108 dust appears pink or magenta while for instance thick high-level clouds turn out red-brown and thin high-level clouds appear very dark In Figure 14-13 is reported a snapshot of the dust transport as detected by SEVIRI on 28 July 2005 at 12 am
141 Validation Plan and Validation Data For phase 1 validation dust transport events taking place in summer 2005 and detected by SEVIRMSG were compared to Lidar observation which are routinely carried out in Rome by ISAC-CNR Lidar observations allow detection of events of Saharan dust transport over Italy Dust particles are tipically non-spherical then Aerosol Depolarization level Da from Lidar measurements is a good indicator of the presence of mineral dust in the atmosphere Comparison have been made reporting time evolution of dust Aerosol Optical Depth minimum and maximum heights related to dust particles are recorded in order to classify the magnitude of the dust events as can be seen in Figure 14-
GSE - PROMOTE 2 C6 Validation Report
Desert Dust
REF PROMOTE-2 C6 ISSUE 10 DATE 060620078 PAGE 27 of 38
During the second phase of PROMOTE2 Lidar observations will be again employed for the comparison with time corresponding SEVIRI data for events from 2005 up to now
Figure 14-3 Lidar observations in Rome for three selected events in Summer 2005
A further indirect comparison about the presence of desert dust detected by SEVIRI was planned starting from the second phase of PROMOTE2 taking advantage of the several AERONET routine measurements carried out in the South Italy area In particular time patterns of Aerosol Optical Depth AOD and Aringngstroumlm parameter α in the visible wavelength range will be employed to highlight the presence of dust in terms of small values of parameter α accompanied by significant AOD Measurements since 2005 up to now will be analysed for the sites of Lampedusa (35N12E) Potenza (40N15E) Messina (38N15E) Lecce(40N18E) Tor Vergata (41N12E) Moreover to confirm the dust transport to the northern region of Italy AOD and α from Ispra (45N8E) station will be also examined For Phase 2 validation focus is on Spring 2007 for which 3 main events were detected analysing SEVIRIMSG data in terms of RGB-BTD
1 March 9 2007 2 April 8 ndash 18 2007 3 May 20 2007
and (for the AERONET comparison) on Summer 2005 for which 3 main events were detected analysing SEVIRIMSG data in terms of RGB-BTD
GSE - PROMOTE 2 C6 Validation Report
Desert Dust
REF PROMOTE-2 C6 ISSUE 10 DATE 060620078 PAGE 28 of 38
4 July 22 ndash August 08 2005 5 around August 10 2005 6 September 4 ndash 9 2005
As stated above lidar observations in Tor Vergata (Rome) [see Table 14-5] were employed In particular Figure 14-4 and Figure 14-5 show the time-patterns of dust AOD (AOD due only to the Saharan dust contribution to aerosol extinction) and corresponding minimum and maximum height of the dust layer Significant values of dust AOD are present around March 9 April 10 and May 20 together with layer heights ranging between 200 m to 7 km
0000
0100
0200
0300
0400
0500
0600
0700
270207 090307 190307 290307 080407 180407 280407 080507 180507 280507 070607
Dus
t aod
dust AOD
Figure 14-4 Time-pattern of the Aerosol Optical Depth only due to the saharan dust contribution (dust AOD) in the period March ndash May 2007 as recorded at Roma tor Vergata
0000
2000
4000
6000
8000
10000
270207 090307 190307 290307 080407 180407 280407 080507 180507 280507 070607
Dus
t Hei
ght (
km)
Zmin dust layerZmax dust layer
Figure 14-5 Time-pattern of the minimum and maximum height of the dust layer (Zmin dust layer Zmax dust layer) in the period March ndash May 2007 as recorded at Roma tor Vergata
Furthermore the indirect comparison against AERONET data [see table 14-1] has been made both for the events highlighted in Phase 1 validation (Summer 2005) and Phase2 validation (Spring
GSE - PROMOTE 2 C6 Validation Report
Desert Dust
REF PROMOTE-2 C6 ISSUE 10 DATE 060620078 PAGE 29 of 38
2007) AERONET Level2 data (iequality assured) for the Lampedusa and Lecce sites were available only for July-September 2005 period while Potenza and Messina data were available only for April-May 2007 Time patterns of Aerosol Optical Depth AOD at 440 nm and Angstroumlm parameter α relative to the visible wavelength range [440-870]nm are presented in the Figures below to highlight the presence of dust in terms of small values of parameter α accompanied by significant AOD Concerning Lampedusa site in summer 2005 (see Figure 14-6) an increase in AOD can be seen in correspondance of the decrease in parameter α for 2-4 August (214-216 julian day) AOD presents values lower than 02 at mid-July then undergoes to an increase up to 06 together with a decrease in α from 07 to almost 01 A similar behaviour can be recognized at the end of the event on 12-13 August (225-226 julian day) while in the period before a lack of data prevents further analysis Analysing time-patterns relative to Lecce AERONET site (Figure 14-7 ) AOD and α inversions are present around August 2 (214 julian day) August 12 (224 julian day) and from September 7 to 11 (250 ndash 254 julian day) Dust events in Spring 2007 did not significatively reach Messina and Potenza as can be seen in Figure 14-8 and Figure 14-9
GSE - PROMOTE 2 C6 Validation Report
Desert Dust
REF PROMOTE-2 C6 ISSUE 10 DATE 060620078 PAGE 30 of 38
Figure 14-6 Time-pattern of AOD 440 nm and Aringngstroumlm parameter α for July August and September 2005 at Lampedusa AERONET sites
GSE - PROMOTE 2 C6 Validation Report
Desert Dust
REF PROMOTE-2 C6 ISSUE 10 DATE 060620078 PAGE 31 of 38
Figure 14-7 Time-pattern of AOD 440 nm and Aringngstroumlm parameter α for July August and September 2005 at Lecce AERONET sites
Figure 14-8 Time-pattern of AOD 440 nm and Aringngstroumlm parameter for April and May 2007 at Messina AERONET sites
GSE - PROMOTE 2 C6 Validation Report
Desert Dust
REF PROMOTE-2 C6 ISSUE 10 DATE 060620078 PAGE 32 of 38
Figure 14-9 Time-pattern of AOD 440 nm and Aringngstroumlm parameter α for April and May 2007 at Potenza AERONET sites
VALIDATION DATA Ground basedin-situ observations Name Data availability and access (include access details if data is freely
available)AERONET data are freely available via web aeronetgsfcnasagov
AERONET observations - level 2
Spatial coverage and resolution NA Phase ( 2 ) Temporal coverage and resolution summer 2005 to december 2007 Location(s) (coordinates) Lampedusa (35N12E) Potenza (40N15E) Messina (38N15E) Lecce(40N18E) Uncertainty quantification (eg Accuracy) 002 for AOD
Name Data availability and access (include access details if data is freely available) events since 2005 available through QUITSAT ASI project from ISAC-CNR
Lidar observations Phase (1+2)
Spatial coverage and resolution NA Temporal coverage and resolution events since 2005 Location(s) (coordinates)Roma Tor Vergata (41N12E) Uncertainty quantification (eg Accuracy) TBD
Table 14-6 Data used for the validation of the Italian Desert Dust Awareness Sub-service
GSE - PROMOTE 2 C6 Validation Report
Desert Dust
REF PROMOTE-2 C6 ISSUE 10 DATE 060620078 PAGE 33 of 38
142 Validation of individual components Following Ackermann (1997) the so-called trispectral method is applied to MSG data In this approach brightness temperature differences (BTD) between the 108 and 87 μm channels set against BTD between the 12 and 108 μm channels enables to discriminate dust from the clear-sky over both oceans and lands In Figure 1-3 is reported an example of trispectral diagram applied to SEVIRI BTD Brightness Temperature Difference pertaining to July 27 2005 As can be seen in the figure three different populations can be discriminated relative to clear sky (blue triangles) clouds (brown diamonds) and desert dust (pink squares) pixels BTD SEVIRI data in spatial and temporal coincidences with Lidar andor AERONET sun-photometer observations will be analyzed for events in which all instruments detect dust presence SEVIRI in terms of BTD Lidar and sun-photometers in terms of Depolarization ratio AOD and Aringngstroumlm parameter
Figure 14-14 Example of trispectral diagram of BTD from MSG-1SEVIRI over the Mediterranean area related to July 27 2005
GSE - PROMOTE 2 C6 Validation Report
Desert Dust
REF PROMOTE-2 C6 ISSUE 10 DATE 060620078 PAGE 34 of 38
VALIDATION OF INDIVIDUAL COMPONENTS
Best estimator
ns Detection of the same dust event
Coincidence check Time-pattern diagrams for lidar data (dust AOD and dust layer height)
Quality assessment
Identification of outliers TBD
Quality checks Events detected by both SEVIRI and lidar measurements in terms of
1 Pixel magenta coloured for seviri (small values of the the differences BT(120-108) and positive small values of the differences of BT(108-87) and
2 Significatly high values of dust AOD as measured by the lidar
Accuracyerror no quantitative parameter defined TBD
Cloud screening quality control
Not enabled
Modelalgorithms
BTD technique Brightness Temperature Differences technique applied to 3 SEVIRI infrared bands IR87 IR108 and IR120 (Ackerman 1997)
RGB of BTD as false color composition httpwwweumetsatintendpsmsgchannel_interpindexhtml
Composite RGB
R=BT(IR120) ndashBT(IR108)
G= BT(IR108)-BT(IR87)
B=BT(IR108)
Consistency
MSG data vs LIDAR
in both period selected for validation with lidar measurements (Summer 05 Spring 07) events detected by MSG were detected in correspondance by lidar measurement in Roma Tor Vergata (see figs Figure 14-3 Figure 14-4 and Figure 14-5
GSE - PROMOTE 2 C6 Validation Report
Desert Dust
REF PROMOTE-2 C6 ISSUE 10 DATE 060620078 PAGE 35 of 38
MSG data vs In-situ
For periods selected in Summer 2005 AERONET data shown the typical behaviour of dust aerosol loading (see figs Figure 14-6 and Figure 14-7)
For period in spring 2007 AERONET sites providing level2 data are not reached by the dust transport as can be seen in the product available in the service web site and it is confirmed in figs Figure 14-8 Figure 14-9
Table 14-7 Validation of individual components of the Italian Service
Validation against specifications and against user requirements Requirements written in Italics are only recommended and not compulsory for Phase 1
VALIDATION AGAINST SERVICE SPECIFICATIONS
variation has been made in the processing chain regarding data format conversion in the data import part areas selection and data archiving
SPECIFICATION S5 REQUIRED ACTUAL
Parameters Desert dust indicator
Accuracy minimum NA ns NA
Accuracy target ns ns TBD
Spatial coverage 10degN ndash 50degN lat 20degW ndash 50degE long
Italy Phase 1 Italy
Phase 2 Mediterranean area (see Figure 14-2)
Horizontal resolution 3x3 Km2 (Ground pixel) ns 3x3 km2
Vertical resolution ns ns na
GridProjection MSG perspective ns MSG perspective
Temporal coverage transport events ns Phase 1 selected dust transport events
Phase 2 NRT monitoring with a delay of 24 hour
Temporal resolution 30 minutes ns 15 minutes
User Interfaces
GSE - PROMOTE 2 C6 Validation Report
Desert Dust
REF PROMOTE-2 C6 ISSUE 10 DATE 060620078 PAGE 36 of 38
PROMOTE Web ns Operational complete and up to date
Operational complete and not up to date
Phase 2 operational complete and updated
ftp ns ns on demand
Data formats and data delivery
Data availability
ns
Specific test periods in Phase 1 (agreed with
users)
In Phase 2 data from Saharian sources
towards Italy
Phase1 Dust transport events detected since
Summer 2005
Phase2 2006 since May whole 2007 and NRT monitoring for
2008
Data access Online online Online
Delivery Mode NRT NRT
Phase 1 Offline
Phase 2 through web-page
Delivery frequency 30 minutes ns 60 minutes
Data Format Png image sequences geotiff on demand Png image sequences
Historical archive None ns None
Visualization geoTIFF png and gif viewers geoTIFF png and gif
viewers
REMARKS
] NRT service planned for phase 3 is started during the phase 2
Table 14-8 Validation of the Italian Sub-service against specifications and against user requirements
GSE - PROMOTE 2 C6 Validation Report
Desert Dust
REF PROMOTE-2 C6 ISSUE 10 DATE 060620078 PAGE 37 of 38
143 Quality assessment and control procedures
Service delivery start date ns
SPECIFICATION S5 REQUIRED
ACTUAL N checksDelivery period
Quality checks See Table 14-7
ns detection of the same dust event by SEVIRI and lidar
Once during validation phase for the whole data-set
Quality flags ns ns NA NA
Product confidence data
ns ns NA NA
Error bar definition and representation
NA NA NA NA]
Representation of missing data
ns ns In the NRT chain a log file is generated with the list of days for which no data
are available
Log file during
processing
Documentation of process failure
Not enabled No automatic reporting on process failure
enabled Only screen reporting
available
ns not enabled not enabled
Version control mechanisms and representation
Version control process is enabled Current version is
11 Version number follows S5
upgrades
10-Phase 1
11- Phase 2
ns V 12 related to S5 April 08
ns
Requirements written in Italics are not compulsory for Phase 2
Table 14-9 Validation of quality control procedures for the Italian Sub-service
GSE - PROMOTE 2 C6 Validation Report
Desert Dust
REF PROMOTE-2 C6 ISSUE 10 DATE 060620078 PAGE 38 of 38
15 References
151 Electronic references httpaeronetgsfcnasagov
httpwwweumetsatintendpsmsgchannel_interpindexhtml
152 Bibliographic references Ackerman S 1997 ldquoRemote sensing of aerosols using satellite infrared observationsrdquo JGeophys Res 102 17069-17079 Gobbi G P F Barnaba and L Ammannato 2004 The vertical distribution of aerosols Saharan dust and cirrus clouds in Rome (Italy) in the year 2001 Atmospheric Chemistry and Physics Vol 4 351-359
- DOCUMENT STATUS SHEET
- DOCUMENT CHANGE RECORD
- LIST OF TABLES
- LIST OF FIGURES
- LIST OF ACRONYMS
- TABLE OF CONTENTS
- 1 DESERT DUST AWARENESS
-
- 11 Service Summary
- 11
- 12 Product characterization
- 13 Iberian sub-service
-
- 131 Validation plan and validation data
-
- 1311 Development and testing of a validation tool
- 1312 Validation by means of the visualization tool
- 1313 Validation of SEVIRI data with AERONET and ADRIEX data
-
- 132 Validation of individual components
-
- 1321 SEVIRI cloud screening
- 1322 Screening procedures
- 1323 Fits of Aeronet site measurements to coincident SEVIRI retrievals
- 1324 Results
- 1325 Merging the aerosol types
- 1326 Comparisons with other Satellite Platforms
- 1327 Conclusions
-
- 133 Validation against specifications and against user requirements
- 134 Service quality assessment and control procedures
-
- 14 Italian sub-service
-
- 141 Validation Plan and Validation Data
- 142 Validation of individual components
- sect Validation against specifications and against user requirements
- 143 Quality assessment and control procedures
-
- 15 References
-
- 151 Electronic references
- 152 Bibliographic references
-
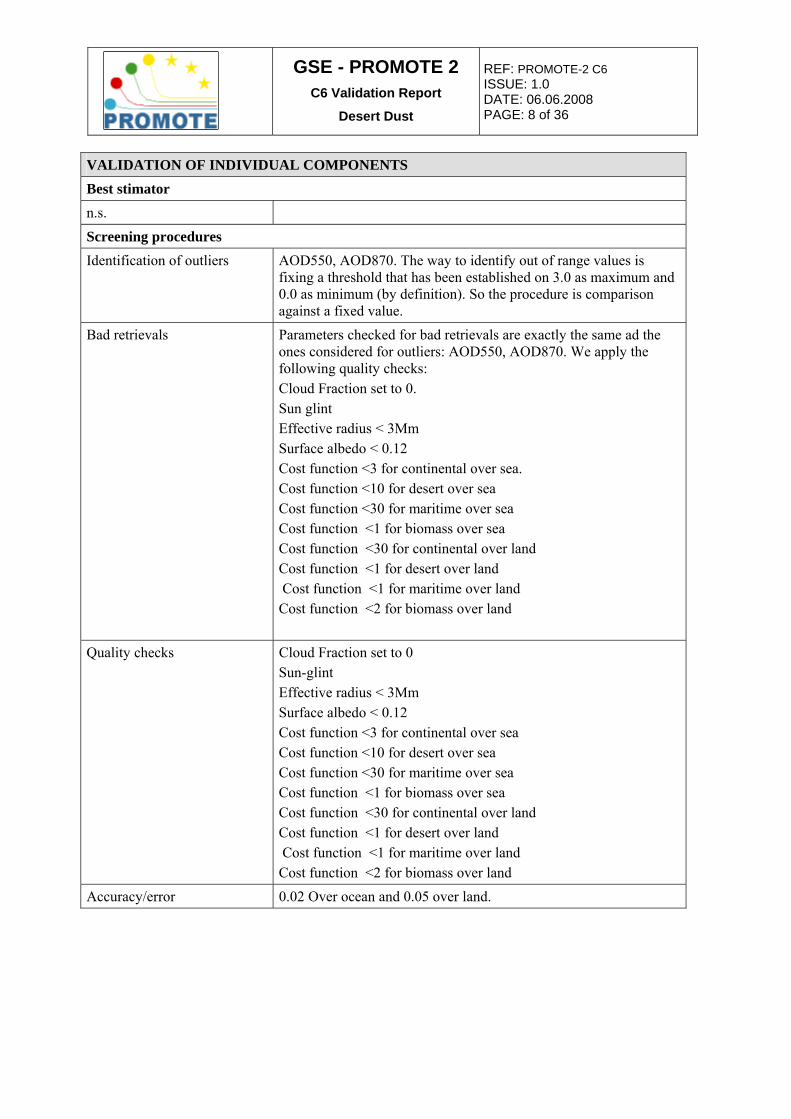
GSE - PROMOTE 2 C6 Validation Report
Desert Dust
REF PROMOTE-2 C6 ISSUE 10 DATE 06062008 PAGE 16 of 36
The land only matches ups shown in Figures 127 and 128 have considerably worse agreement between satellite and sun photometer retrievals This result suggests problems retrieving aerosol over highly reflective surfaces The worst retrievals were over desert surfaces In the absence of an operational SEVIRI surface reflectance product we have used the MODIS 16 day averaged albedo for the land surface reflectance that correspond to the SEVIRI channels While we allow the retrieval to adapt within errors to a different land surface reflectance this product could be improved
1325 Merging the aerosol types After studying the retrieval accuracy as a function of aerosol type it was decided to amalgamate only the continental maritime desert and biomass retrievals The urban and polluted maritime results gave misleading results when included in the amalgamation The validation plots and maps are still included for completeness and for further future flexibility Figure 129 shows the results of the retrievals that have been selected as the best match on the basis of cost The retrievals show a mix of aerosol types including some absorbing types that would be expected to be associated with urban areas The results are better for the 087nm channel than the 055nm channel There is a positive bias at low optical depth and a negative bias at high optical depths which is consistent with the individual aerosol comparisons This bias and slope will be corrected for in the merging algorithm Figures 1210 and 1211 show the comparison broken into sea and land sites
Figure 13-8 Amalgamated results for September 2004 1212 UTC The individual aerosol types were combined according to quality control and cost over land and sea
GSE - PROMOTE 2 C6 Validation Report
Desert Dust
REF PROMOTE-2 C6 ISSUE 10 DATE 06062008 PAGE 17 of 36
Figure 13-9 Amalgamated results for September 2004 1212 UTC The individual aerosol types were combined according to quality control and cost over land and sea
Figure 13-10 Amalgamated results for September 2004 1212 UTC The individual aerosol types were combined according to quality control and cost over land and sea
GSE - PROMOTE 2 C6 Validation Report
Desert Dust
REF PROMOTE-2 C6 ISSUE 10 DATE 06062008 PAGE 18 of 36
Figure 13-11 the right show scatter density distributions of the monthly mean value over sea
1326 Comparisons with other Satellite Platforms It have been also compared the service retrievals with MODIS and MISR Over sea the correlation with MODIS (061) is better than that between MISR and MODIS (048) Over land the correlation of SEVIRI with MISR (045) is better than that with MODIS (033) though not as good as the correlation between MISR and MODIS (062) It should however be noted that the region of the globe observed by SEVIRI omits Asian regions responsible for much of the global variability (ie there is less variability to be observed over the SEVIRI disk than globally so one might expect less correlation)
The following points relating to the SEVIRI AOD distribution are noted
bull The field is a daily product generated from individual retrievals from radiances observed at 1012 and 1612 UT No-data is acquired off the coast of southern Africa because this region is flagged as sun-glint in the 1012 image and has solar zenith angle greater than 70 at 1612 Apart from this feature however the ldquojoinrdquo between the regions sampled by one or both of the two radiance products is gratifyingly difficult to discern
bull Some of the high AODs off the north coast of South America are due to an underestimation of the spatial extent of sun-glint at 1612 (in turn due to probably erroneously low winds in the ECMWF analyses used to predict the glint area)
bull There appears to be some shift to the north of the high aerosol load over central southern Africa (which is mainly due to biomass burning) as observed by SEVIRI compared to MISR or MODIS (and compared to the associated plume off the east coast) This structure is likely to be due to problems modelling the surface reflectance over land in this region and is connected to the discrepancies found between SEVIRI AODs and those observed at the Mongu station
and land separately ldquo+rdquo symbols indicate the mean over all SEVIRI points within the indicated range of MODIS values Error bars indicate the corresponding standard deviation
GSE - PROMOTE 2 C6 Validation Report
Desert Dust
REF PROMOTE-2 C6 ISSUE 10 DATE 06062008 PAGE 19 of 36
al product and the most common aero l speciation identied
Figure 13-12 Number of data points in each bin of the of 1 degree gridded monthly statistic
so
GSE - PROMOTE 2 C6 Validation Report
Desert Dust
REF PROMOTE-2 C6 ISSUE 10 DATE 06062008 PAGE 20 of 36
1327 Conclusions Before discussing these results further it is worth noting that all aerosol retrieval schemes based on passive nadir visible near-infrared satellite imagery are subject to the following fundamental problems
1 Discrimination of aerosol from cloud The signal from most types of cloud is generally
much stronger than from aerosol Consequently even a relatively small amount of undetected cloud in a scene can cause large biases in retrieved AOD For this reason cloud masks are used to select only radiances which are cloud-free However care is required to avoid wrongly flagging cases of high aerosol load thereby omitting these potentially important events from the retrieved dataset and introducing a low bias into statistical analyses More fundamentally many clouds have aerosol as condensation nuclei and the point at which the ldquoaerosolrdquo becomes ldquocloudrdquo through growth of water droplets around the aerosol particle is ambiguous
2 Unknown aerosol composition The back-scattered signal observed by the satellite depends not only on the amount of aerosol present but crucially also on the phase function and single scatter albedo which in turn are dependent on the aerosol refractive index size distribution and particle shape There is generally insufficient information in remote measurements (even ground-based) to fully constrain the optical properties and as a consequence retrieved optical depths are quite strongly dependent upon a priori assumptions about the aerosol type
3 Surface reflection Over much of the land surface (and glint regions of sea) the signal from direct and diffuse reflection of radiation from the surface is much stronger than that from aerosol The sign of the aerosol effect on measured radiances changes depending on the surface reflectance and aerosol single scattering albedo so conditions exist in which radiances are insensitive to aerosol perturbations Relatively small errors in modelling the interaction of light with the surface can therefore cause significant error in aerosol retrieval For this reason retrieving aerosol over the (dark) ocean is relatively straightforward Retrievals over bright land surfaces are particularly challenging
The validation and inter-comparison results presented here demonstrate that all the products perform well over ocean yielding correlations with AERONET in the region of 08 (despite most stations being near the coast rather than open ocean) and correlations with the MODIS monthly mean distribution which are comparable or better than found between MODIS and MISR
Where problems exist these are almost exclusively related to retrievals over land The most positive results from the current official product set have been obtained for SEVIRI the AERONET correlation over land being 082 at 055microm without significant bias over many regions including Europe This leads to a number of impressive time-series comparisons with individual AERONET stations The SEVIRI agreement with MISR over land is also comparable to that between MISR and MODIS The benefit of geostationary observations in obtaining good sampling of the cloud-free atmosphere is clear from the number of good observations acquired even from the two observations per day that are analysed in the current set of products leading to a relatively large number of AERONET coincidences and a well sampled monthly mean field
The following recommendations are made based on the validation results and the considerations outlined above
GSE - PROMOTE 2 C6 Validation Report
Desert Dust
REF PROMOTE-2 C6 ISSUE 10 DATE 06062008 PAGE 21 of 36
bull There are indications of errors due to modelling of the surface reflectance in the SEVIRI retrieval (eg over central and southern Africa) These may be attributable to channel spectral response function difference compared to MODIS (use to define the a priori BRDF) Methods to correct for such systematic errors are being studied at the moment and could lead to a useful improvement in the short-term It is however noted that in the long-term it would be highly desirable to use surface BRDF information from SEVIRI itself
bull Some residual effect of sun-glint are evident in the SEVIRI product partly due to apparently underestimated wind-speeds in ECMWF Use of a minimum assumed wind speed to remove this effect is being considered
bull It would of course be desirable to process as many SEVIRI scenes in a single day as possible within available computing resource (SEVIRI acquires a scene every 15 minutes) Use of at least one additional time eg 1312 to complement the existing slots of 1012 and 1612 would be particularly desirable to eliminate the current data gap off eastern Africa which is contaminated by glint at 1012 and has too high a solar zenith angle at 1612 As noted above observing aerosol at different scattering angles can yield information on the phase function (and hence type) While multi-time observations cannot yet be directly exploited by the products scheme post analysis of retrievals at as many different time of day could help to improve the speciation (and hence estimated AOD) Multiple-time observations are of course also valuable for tracking the evolution of specific events
bull There is evidence of over-zealous cloud flagging leading to events of high aerosol load being omitted While the long-term aim would be to by-pass this issue altogether using a joint aerosol-cloud scheme for the current products more pragmatic measures to improve the current status would be desirable in the short-term For SEVIRI the cloud mask is not useful as a means of generating cloud-free radiances for partially cloudy scenes all partially cloud scenes are currently flagged as unreliable It would therefore make sense to process all scenes without regard to the Eumetsat cloud mask then rely (as is the case at the moment) on quality control criteria (including the Eumetsat cloud fraction) to screen cloud post-hoc
bull The assumed aerosol models (refractive indices size distribution assumed particle shape) do not of course perfectly represent the true aerosol conditions and improvements additions to the set of models used may well be worthwhile and are the subject of continuing research and development
GSE - PROMOTE 2 C6 Validation Report
Desert Dust
REF PROMOTE-2 C6 ISSUE 10 DATE 060620078 PAGE 22 of 38
133 Validation against specifications and against user requirements Requirements written in Italics are only recommended and not compulsory for Phase 2
VALIDATION AGAINST SERVICE SPECIFICATIONS
No limitationsdelays for compliance between theoretical and actual service specifications reported
VALIDATION AGAINST USER REQUIREMENTS
SPECIFICATION S5 REQUIRED ACTUAL
Parameters Latitude longitude Speciation Aerosol Optical Thickness 550nm Aerosol Optical Thickness 870nm Cloud Pixel Flag Land Sea Flag Sun Zenith Angle Sun Azimuth Angle View Zenith Angle Julian Date Effective Radius Angstrom Coefficient Angstrom Coefficient
Accuracy minimum ns ns
AOD plusmn 002 over ocean and plusmn 005 over
land
Accuracy target ns 15 ns
Spatial coverage South Europe (Spain Portugal and Italy)
South Europe (Spain Portugal
Macaronesia)
South Europe (Spain Portugal Macaronesia)
Horizontal resolution 10x10 Km2 ns 10x10 Km2
Vertical resolution ns ns ns
GridProjection Sinusoidal ns Sinusoidal
Temporal coverage 24 h ns 24 h
Temporal resolution 15 minutes ns 45 min
User Interfaces
PROMOTE Web ns Complete operational
up-to-date
Incomplete no operational not up to
date
ftp ns ns ns
On demand ns ns ns
Data formats and data delivery
Data availability ns Specific test periods in Phase 1 ns
GSE - PROMOTE 2 C6 Validation Report
Desert Dust
REF PROMOTE-2 C6 ISSUE 10 DATE 060620078 PAGE 23 of 38
Data access Online online Online
Delivery Mode
OfflineNRT
Phase 1 NRT for a specific test period to be defined
Phase 2 NRT For the available SEVIRI slots
NRT
Delivery frequency ns Daily Daily
Data Format IDL custom tool NetCDF netCDF HDF netCDF HDF
Historical archive None ns None
Visualization IDL custom tool NetCDF netCDF HDF ns
REMARKS
No Remarks
Requirements written in Italics are only recommended and not compulsory for Phase 1
Table 13-3 Validation of the Iberian Sub-service against specifications and against user requirements
134 Service quality assessment and control procedures
Service delivery start date The service was available from August 2007 but due to some problems found in the last validations the website was disabled due to user request (until products have the quality expected) It has been foreseen to open the site again in August 2008
SPECIFICATION S5 REQUIRED ACTUAL N checksDelivery period
Quality checks See Table 13-2
ns ns NA
Quality flags ns ns ns NA
Product confidence data
ns ns ns NA
Error bar definition and representation
NA NA NA NA
GSE - PROMOTE 2 C6 Validation Report
Desert Dust
REF PROMOTE-2 C6 ISSUE 10 DATE 060620078 PAGE 24 of 38
Representation of missing data
ns ns ns NA
Documentation of process failure
A control function which checks for
the presenceabsence of
implemented productauxiliary data It is split by
input data
ns ns NA
Version control mechanisms and representation
Version control process is enabled Current version is
11 Version number follows S5
upgrades
10-Pahse 1
11- Phase 2
ns ns NA
Requirements written in Italics are not compulsory for Phase 2
Table 13-4 Validation of quality assessment and control procedures for the Iberian Sub-service
GSE - PROMOTE 2 C6 Validation Report
Desert Dust
REF PROMOTE-2 C6 ISSUE 10 DATE 060620078 PAGE 25 of 38
14 Italian sub-service Service iswill be operational sinceafter January 2007
Research partners ISAC-CNR
Provider(s) CGS
Validation contact W Di Nicolantonio
Satellite desert dust detection is based on the radiances and Brightness Temperature (BT) sampled by the imaging radiometer SEVIRI (Spinning Enhanced Visible and InfraRed Imager) on board MSG-1 (Meteosat-8) meteorological satellite The high temporal (15 min) and spatial (about 4x4 km2 over the Mediterranean area) resolutions of MSG images in the IR channels allow to follow the evolution of dust transport towards the Italian region and may permit a link with threshold exceeding of PM concentrations measured in situ Desert Dust indicator maps are obtained by analyzing 87 108 and 120 μm SEVIRI IR channels
Figure 14-13 Desert dust transport highlighted in magenta as detected through the RGB BTD technique applied to SEVIRI IR channels as available for Phase 1
GSE - PROMOTE 2 C6 Validation Report
Desert Dust
REF PROMOTE-2 C6 ISSUE 10 DATE 060620078 PAGE 26 of 38
Figure 14-2 Desert dust transport highlighted in magenta as detected through the RGB BTD technique applied to SEVIRI IR channels for the
Mediterranean area monitored in Phase2 From the IR SEVIRI channels the two Difference of BT (BT120 ndash BT108) and (BT108 ndash BT87) needed to enhance the presence of desert dust are derived For sequence of RGB composite images where R=(BT120 ndash BT108) G=(BT108 ndash BT87) B=BT108 dust appears pink or magenta while for instance thick high-level clouds turn out red-brown and thin high-level clouds appear very dark In Figure 14-13 is reported a snapshot of the dust transport as detected by SEVIRI on 28 July 2005 at 12 am
141 Validation Plan and Validation Data For phase 1 validation dust transport events taking place in summer 2005 and detected by SEVIRMSG were compared to Lidar observation which are routinely carried out in Rome by ISAC-CNR Lidar observations allow detection of events of Saharan dust transport over Italy Dust particles are tipically non-spherical then Aerosol Depolarization level Da from Lidar measurements is a good indicator of the presence of mineral dust in the atmosphere Comparison have been made reporting time evolution of dust Aerosol Optical Depth minimum and maximum heights related to dust particles are recorded in order to classify the magnitude of the dust events as can be seen in Figure 14-
GSE - PROMOTE 2 C6 Validation Report
Desert Dust
REF PROMOTE-2 C6 ISSUE 10 DATE 060620078 PAGE 27 of 38
During the second phase of PROMOTE2 Lidar observations will be again employed for the comparison with time corresponding SEVIRI data for events from 2005 up to now
Figure 14-3 Lidar observations in Rome for three selected events in Summer 2005
A further indirect comparison about the presence of desert dust detected by SEVIRI was planned starting from the second phase of PROMOTE2 taking advantage of the several AERONET routine measurements carried out in the South Italy area In particular time patterns of Aerosol Optical Depth AOD and Aringngstroumlm parameter α in the visible wavelength range will be employed to highlight the presence of dust in terms of small values of parameter α accompanied by significant AOD Measurements since 2005 up to now will be analysed for the sites of Lampedusa (35N12E) Potenza (40N15E) Messina (38N15E) Lecce(40N18E) Tor Vergata (41N12E) Moreover to confirm the dust transport to the northern region of Italy AOD and α from Ispra (45N8E) station will be also examined For Phase 2 validation focus is on Spring 2007 for which 3 main events were detected analysing SEVIRIMSG data in terms of RGB-BTD
1 March 9 2007 2 April 8 ndash 18 2007 3 May 20 2007
and (for the AERONET comparison) on Summer 2005 for which 3 main events were detected analysing SEVIRIMSG data in terms of RGB-BTD
GSE - PROMOTE 2 C6 Validation Report
Desert Dust
REF PROMOTE-2 C6 ISSUE 10 DATE 060620078 PAGE 28 of 38
4 July 22 ndash August 08 2005 5 around August 10 2005 6 September 4 ndash 9 2005
As stated above lidar observations in Tor Vergata (Rome) [see Table 14-5] were employed In particular Figure 14-4 and Figure 14-5 show the time-patterns of dust AOD (AOD due only to the Saharan dust contribution to aerosol extinction) and corresponding minimum and maximum height of the dust layer Significant values of dust AOD are present around March 9 April 10 and May 20 together with layer heights ranging between 200 m to 7 km
0000
0100
0200
0300
0400
0500
0600
0700
270207 090307 190307 290307 080407 180407 280407 080507 180507 280507 070607
Dus
t aod
dust AOD
Figure 14-4 Time-pattern of the Aerosol Optical Depth only due to the saharan dust contribution (dust AOD) in the period March ndash May 2007 as recorded at Roma tor Vergata
0000
2000
4000
6000
8000
10000
270207 090307 190307 290307 080407 180407 280407 080507 180507 280507 070607
Dus
t Hei
ght (
km)
Zmin dust layerZmax dust layer
Figure 14-5 Time-pattern of the minimum and maximum height of the dust layer (Zmin dust layer Zmax dust layer) in the period March ndash May 2007 as recorded at Roma tor Vergata
Furthermore the indirect comparison against AERONET data [see table 14-1] has been made both for the events highlighted in Phase 1 validation (Summer 2005) and Phase2 validation (Spring
GSE - PROMOTE 2 C6 Validation Report
Desert Dust
REF PROMOTE-2 C6 ISSUE 10 DATE 060620078 PAGE 29 of 38
2007) AERONET Level2 data (iequality assured) for the Lampedusa and Lecce sites were available only for July-September 2005 period while Potenza and Messina data were available only for April-May 2007 Time patterns of Aerosol Optical Depth AOD at 440 nm and Angstroumlm parameter α relative to the visible wavelength range [440-870]nm are presented in the Figures below to highlight the presence of dust in terms of small values of parameter α accompanied by significant AOD Concerning Lampedusa site in summer 2005 (see Figure 14-6) an increase in AOD can be seen in correspondance of the decrease in parameter α for 2-4 August (214-216 julian day) AOD presents values lower than 02 at mid-July then undergoes to an increase up to 06 together with a decrease in α from 07 to almost 01 A similar behaviour can be recognized at the end of the event on 12-13 August (225-226 julian day) while in the period before a lack of data prevents further analysis Analysing time-patterns relative to Lecce AERONET site (Figure 14-7 ) AOD and α inversions are present around August 2 (214 julian day) August 12 (224 julian day) and from September 7 to 11 (250 ndash 254 julian day) Dust events in Spring 2007 did not significatively reach Messina and Potenza as can be seen in Figure 14-8 and Figure 14-9
GSE - PROMOTE 2 C6 Validation Report
Desert Dust
REF PROMOTE-2 C6 ISSUE 10 DATE 060620078 PAGE 30 of 38
Figure 14-6 Time-pattern of AOD 440 nm and Aringngstroumlm parameter α for July August and September 2005 at Lampedusa AERONET sites
GSE - PROMOTE 2 C6 Validation Report
Desert Dust
REF PROMOTE-2 C6 ISSUE 10 DATE 060620078 PAGE 31 of 38
Figure 14-7 Time-pattern of AOD 440 nm and Aringngstroumlm parameter α for July August and September 2005 at Lecce AERONET sites
Figure 14-8 Time-pattern of AOD 440 nm and Aringngstroumlm parameter for April and May 2007 at Messina AERONET sites
GSE - PROMOTE 2 C6 Validation Report
Desert Dust
REF PROMOTE-2 C6 ISSUE 10 DATE 060620078 PAGE 32 of 38
Figure 14-9 Time-pattern of AOD 440 nm and Aringngstroumlm parameter α for April and May 2007 at Potenza AERONET sites
VALIDATION DATA Ground basedin-situ observations Name Data availability and access (include access details if data is freely
available)AERONET data are freely available via web aeronetgsfcnasagov
AERONET observations - level 2
Spatial coverage and resolution NA Phase ( 2 ) Temporal coverage and resolution summer 2005 to december 2007 Location(s) (coordinates) Lampedusa (35N12E) Potenza (40N15E) Messina (38N15E) Lecce(40N18E) Uncertainty quantification (eg Accuracy) 002 for AOD
Name Data availability and access (include access details if data is freely available) events since 2005 available through QUITSAT ASI project from ISAC-CNR
Lidar observations Phase (1+2)
Spatial coverage and resolution NA Temporal coverage and resolution events since 2005 Location(s) (coordinates)Roma Tor Vergata (41N12E) Uncertainty quantification (eg Accuracy) TBD
Table 14-6 Data used for the validation of the Italian Desert Dust Awareness Sub-service
GSE - PROMOTE 2 C6 Validation Report
Desert Dust
REF PROMOTE-2 C6 ISSUE 10 DATE 060620078 PAGE 33 of 38
142 Validation of individual components Following Ackermann (1997) the so-called trispectral method is applied to MSG data In this approach brightness temperature differences (BTD) between the 108 and 87 μm channels set against BTD between the 12 and 108 μm channels enables to discriminate dust from the clear-sky over both oceans and lands In Figure 1-3 is reported an example of trispectral diagram applied to SEVIRI BTD Brightness Temperature Difference pertaining to July 27 2005 As can be seen in the figure three different populations can be discriminated relative to clear sky (blue triangles) clouds (brown diamonds) and desert dust (pink squares) pixels BTD SEVIRI data in spatial and temporal coincidences with Lidar andor AERONET sun-photometer observations will be analyzed for events in which all instruments detect dust presence SEVIRI in terms of BTD Lidar and sun-photometers in terms of Depolarization ratio AOD and Aringngstroumlm parameter
Figure 14-14 Example of trispectral diagram of BTD from MSG-1SEVIRI over the Mediterranean area related to July 27 2005
GSE - PROMOTE 2 C6 Validation Report
Desert Dust
REF PROMOTE-2 C6 ISSUE 10 DATE 060620078 PAGE 34 of 38
VALIDATION OF INDIVIDUAL COMPONENTS
Best estimator
ns Detection of the same dust event
Coincidence check Time-pattern diagrams for lidar data (dust AOD and dust layer height)
Quality assessment
Identification of outliers TBD
Quality checks Events detected by both SEVIRI and lidar measurements in terms of
1 Pixel magenta coloured for seviri (small values of the the differences BT(120-108) and positive small values of the differences of BT(108-87) and
2 Significatly high values of dust AOD as measured by the lidar
Accuracyerror no quantitative parameter defined TBD
Cloud screening quality control
Not enabled
Modelalgorithms
BTD technique Brightness Temperature Differences technique applied to 3 SEVIRI infrared bands IR87 IR108 and IR120 (Ackerman 1997)
RGB of BTD as false color composition httpwwweumetsatintendpsmsgchannel_interpindexhtml
Composite RGB
R=BT(IR120) ndashBT(IR108)
G= BT(IR108)-BT(IR87)
B=BT(IR108)
Consistency
MSG data vs LIDAR
in both period selected for validation with lidar measurements (Summer 05 Spring 07) events detected by MSG were detected in correspondance by lidar measurement in Roma Tor Vergata (see figs Figure 14-3 Figure 14-4 and Figure 14-5
GSE - PROMOTE 2 C6 Validation Report
Desert Dust
REF PROMOTE-2 C6 ISSUE 10 DATE 060620078 PAGE 35 of 38
MSG data vs In-situ
For periods selected in Summer 2005 AERONET data shown the typical behaviour of dust aerosol loading (see figs Figure 14-6 and Figure 14-7)
For period in spring 2007 AERONET sites providing level2 data are not reached by the dust transport as can be seen in the product available in the service web site and it is confirmed in figs Figure 14-8 Figure 14-9
Table 14-7 Validation of individual components of the Italian Service
Validation against specifications and against user requirements Requirements written in Italics are only recommended and not compulsory for Phase 1
VALIDATION AGAINST SERVICE SPECIFICATIONS
variation has been made in the processing chain regarding data format conversion in the data import part areas selection and data archiving
SPECIFICATION S5 REQUIRED ACTUAL
Parameters Desert dust indicator
Accuracy minimum NA ns NA
Accuracy target ns ns TBD
Spatial coverage 10degN ndash 50degN lat 20degW ndash 50degE long
Italy Phase 1 Italy
Phase 2 Mediterranean area (see Figure 14-2)
Horizontal resolution 3x3 Km2 (Ground pixel) ns 3x3 km2
Vertical resolution ns ns na
GridProjection MSG perspective ns MSG perspective
Temporal coverage transport events ns Phase 1 selected dust transport events
Phase 2 NRT monitoring with a delay of 24 hour
Temporal resolution 30 minutes ns 15 minutes
User Interfaces
GSE - PROMOTE 2 C6 Validation Report
Desert Dust
REF PROMOTE-2 C6 ISSUE 10 DATE 060620078 PAGE 36 of 38
PROMOTE Web ns Operational complete and up to date
Operational complete and not up to date
Phase 2 operational complete and updated
ftp ns ns on demand
Data formats and data delivery
Data availability
ns
Specific test periods in Phase 1 (agreed with
users)
In Phase 2 data from Saharian sources
towards Italy
Phase1 Dust transport events detected since
Summer 2005
Phase2 2006 since May whole 2007 and NRT monitoring for
2008
Data access Online online Online
Delivery Mode NRT NRT
Phase 1 Offline
Phase 2 through web-page
Delivery frequency 30 minutes ns 60 minutes
Data Format Png image sequences geotiff on demand Png image sequences
Historical archive None ns None
Visualization geoTIFF png and gif viewers geoTIFF png and gif
viewers
REMARKS
] NRT service planned for phase 3 is started during the phase 2
Table 14-8 Validation of the Italian Sub-service against specifications and against user requirements
GSE - PROMOTE 2 C6 Validation Report
Desert Dust
REF PROMOTE-2 C6 ISSUE 10 DATE 060620078 PAGE 37 of 38
143 Quality assessment and control procedures
Service delivery start date ns
SPECIFICATION S5 REQUIRED
ACTUAL N checksDelivery period
Quality checks See Table 14-7
ns detection of the same dust event by SEVIRI and lidar
Once during validation phase for the whole data-set
Quality flags ns ns NA NA
Product confidence data
ns ns NA NA
Error bar definition and representation
NA NA NA NA]
Representation of missing data
ns ns In the NRT chain a log file is generated with the list of days for which no data
are available
Log file during
processing
Documentation of process failure
Not enabled No automatic reporting on process failure
enabled Only screen reporting
available
ns not enabled not enabled
Version control mechanisms and representation
Version control process is enabled Current version is
11 Version number follows S5
upgrades
10-Phase 1
11- Phase 2
ns V 12 related to S5 April 08
ns
Requirements written in Italics are not compulsory for Phase 2
Table 14-9 Validation of quality control procedures for the Italian Sub-service
GSE - PROMOTE 2 C6 Validation Report
Desert Dust
REF PROMOTE-2 C6 ISSUE 10 DATE 060620078 PAGE 38 of 38
15 References
151 Electronic references httpaeronetgsfcnasagov
httpwwweumetsatintendpsmsgchannel_interpindexhtml
152 Bibliographic references Ackerman S 1997 ldquoRemote sensing of aerosols using satellite infrared observationsrdquo JGeophys Res 102 17069-17079 Gobbi G P F Barnaba and L Ammannato 2004 The vertical distribution of aerosols Saharan dust and cirrus clouds in Rome (Italy) in the year 2001 Atmospheric Chemistry and Physics Vol 4 351-359
- DOCUMENT STATUS SHEET
- DOCUMENT CHANGE RECORD
- LIST OF TABLES
- LIST OF FIGURES
- LIST OF ACRONYMS
- TABLE OF CONTENTS
- 1 DESERT DUST AWARENESS
-
- 11 Service Summary
- 11
- 12 Product characterization
- 13 Iberian sub-service
-
- 131 Validation plan and validation data
-
- 1311 Development and testing of a validation tool
- 1312 Validation by means of the visualization tool
- 1313 Validation of SEVIRI data with AERONET and ADRIEX data
-
- 132 Validation of individual components
-
- 1321 SEVIRI cloud screening
- 1322 Screening procedures
- 1323 Fits of Aeronet site measurements to coincident SEVIRI retrievals
- 1324 Results
- 1325 Merging the aerosol types
- 1326 Comparisons with other Satellite Platforms
- 1327 Conclusions
-
- 133 Validation against specifications and against user requirements
- 134 Service quality assessment and control procedures
-
- 14 Italian sub-service
-
- 141 Validation Plan and Validation Data
- 142 Validation of individual components
- sect Validation against specifications and against user requirements
- 143 Quality assessment and control procedures
-
- 15 References
-
- 151 Electronic references
- 152 Bibliographic references
-

GSE - PROMOTE 2 C6 Validation Report
Desert Dust
REF PROMOTE-2 C6 ISSUE 10 DATE 060620078 PAGE 24 of 38
Representation of missing data
ns ns ns NA
Documentation of process failure
A control function which checks for
the presenceabsence of
implemented productauxiliary data It is split by
input data
ns ns NA
Version control mechanisms and representation
Version control process is enabled Current version is
11 Version number follows S5
upgrades
10-Pahse 1
11- Phase 2
ns ns NA
Requirements written in Italics are not compulsory for Phase 2
Table 13-4 Validation of quality assessment and control procedures for the Iberian Sub-service
GSE - PROMOTE 2 C6 Validation Report
Desert Dust
REF PROMOTE-2 C6 ISSUE 10 DATE 060620078 PAGE 25 of 38
14 Italian sub-service Service iswill be operational sinceafter January 2007
Research partners ISAC-CNR
Provider(s) CGS
Validation contact W Di Nicolantonio
Satellite desert dust detection is based on the radiances and Brightness Temperature (BT) sampled by the imaging radiometer SEVIRI (Spinning Enhanced Visible and InfraRed Imager) on board MSG-1 (Meteosat-8) meteorological satellite The high temporal (15 min) and spatial (about 4x4 km2 over the Mediterranean area) resolutions of MSG images in the IR channels allow to follow the evolution of dust transport towards the Italian region and may permit a link with threshold exceeding of PM concentrations measured in situ Desert Dust indicator maps are obtained by analyzing 87 108 and 120 μm SEVIRI IR channels
Figure 14-13 Desert dust transport highlighted in magenta as detected through the RGB BTD technique applied to SEVIRI IR channels as available for Phase 1
GSE - PROMOTE 2 C6 Validation Report
Desert Dust
REF PROMOTE-2 C6 ISSUE 10 DATE 060620078 PAGE 26 of 38
Figure 14-2 Desert dust transport highlighted in magenta as detected through the RGB BTD technique applied to SEVIRI IR channels for the
Mediterranean area monitored in Phase2 From the IR SEVIRI channels the two Difference of BT (BT120 ndash BT108) and (BT108 ndash BT87) needed to enhance the presence of desert dust are derived For sequence of RGB composite images where R=(BT120 ndash BT108) G=(BT108 ndash BT87) B=BT108 dust appears pink or magenta while for instance thick high-level clouds turn out red-brown and thin high-level clouds appear very dark In Figure 14-13 is reported a snapshot of the dust transport as detected by SEVIRI on 28 July 2005 at 12 am
141 Validation Plan and Validation Data For phase 1 validation dust transport events taking place in summer 2005 and detected by SEVIRMSG were compared to Lidar observation which are routinely carried out in Rome by ISAC-CNR Lidar observations allow detection of events of Saharan dust transport over Italy Dust particles are tipically non-spherical then Aerosol Depolarization level Da from Lidar measurements is a good indicator of the presence of mineral dust in the atmosphere Comparison have been made reporting time evolution of dust Aerosol Optical Depth minimum and maximum heights related to dust particles are recorded in order to classify the magnitude of the dust events as can be seen in Figure 14-
GSE - PROMOTE 2 C6 Validation Report
Desert Dust
REF PROMOTE-2 C6 ISSUE 10 DATE 060620078 PAGE 27 of 38
During the second phase of PROMOTE2 Lidar observations will be again employed for the comparison with time corresponding SEVIRI data for events from 2005 up to now
Figure 14-3 Lidar observations in Rome for three selected events in Summer 2005
A further indirect comparison about the presence of desert dust detected by SEVIRI was planned starting from the second phase of PROMOTE2 taking advantage of the several AERONET routine measurements carried out in the South Italy area In particular time patterns of Aerosol Optical Depth AOD and Aringngstroumlm parameter α in the visible wavelength range will be employed to highlight the presence of dust in terms of small values of parameter α accompanied by significant AOD Measurements since 2005 up to now will be analysed for the sites of Lampedusa (35N12E) Potenza (40N15E) Messina (38N15E) Lecce(40N18E) Tor Vergata (41N12E) Moreover to confirm the dust transport to the northern region of Italy AOD and α from Ispra (45N8E) station will be also examined For Phase 2 validation focus is on Spring 2007 for which 3 main events were detected analysing SEVIRIMSG data in terms of RGB-BTD
1 March 9 2007 2 April 8 ndash 18 2007 3 May 20 2007
and (for the AERONET comparison) on Summer 2005 for which 3 main events were detected analysing SEVIRIMSG data in terms of RGB-BTD
GSE - PROMOTE 2 C6 Validation Report
Desert Dust
REF PROMOTE-2 C6 ISSUE 10 DATE 060620078 PAGE 28 of 38
4 July 22 ndash August 08 2005 5 around August 10 2005 6 September 4 ndash 9 2005
As stated above lidar observations in Tor Vergata (Rome) [see Table 14-5] were employed In particular Figure 14-4 and Figure 14-5 show the time-patterns of dust AOD (AOD due only to the Saharan dust contribution to aerosol extinction) and corresponding minimum and maximum height of the dust layer Significant values of dust AOD are present around March 9 April 10 and May 20 together with layer heights ranging between 200 m to 7 km
0000
0100
0200
0300
0400
0500
0600
0700
270207 090307 190307 290307 080407 180407 280407 080507 180507 280507 070607
Dus
t aod
dust AOD
Figure 14-4 Time-pattern of the Aerosol Optical Depth only due to the saharan dust contribution (dust AOD) in the period March ndash May 2007 as recorded at Roma tor Vergata
0000
2000
4000
6000
8000
10000
270207 090307 190307 290307 080407 180407 280407 080507 180507 280507 070607
Dus
t Hei
ght (
km)
Zmin dust layerZmax dust layer
Figure 14-5 Time-pattern of the minimum and maximum height of the dust layer (Zmin dust layer Zmax dust layer) in the period March ndash May 2007 as recorded at Roma tor Vergata
Furthermore the indirect comparison against AERONET data [see table 14-1] has been made both for the events highlighted in Phase 1 validation (Summer 2005) and Phase2 validation (Spring
GSE - PROMOTE 2 C6 Validation Report
Desert Dust
REF PROMOTE-2 C6 ISSUE 10 DATE 060620078 PAGE 29 of 38
2007) AERONET Level2 data (iequality assured) for the Lampedusa and Lecce sites were available only for July-September 2005 period while Potenza and Messina data were available only for April-May 2007 Time patterns of Aerosol Optical Depth AOD at 440 nm and Angstroumlm parameter α relative to the visible wavelength range [440-870]nm are presented in the Figures below to highlight the presence of dust in terms of small values of parameter α accompanied by significant AOD Concerning Lampedusa site in summer 2005 (see Figure 14-6) an increase in AOD can be seen in correspondance of the decrease in parameter α for 2-4 August (214-216 julian day) AOD presents values lower than 02 at mid-July then undergoes to an increase up to 06 together with a decrease in α from 07 to almost 01 A similar behaviour can be recognized at the end of the event on 12-13 August (225-226 julian day) while in the period before a lack of data prevents further analysis Analysing time-patterns relative to Lecce AERONET site (Figure 14-7 ) AOD and α inversions are present around August 2 (214 julian day) August 12 (224 julian day) and from September 7 to 11 (250 ndash 254 julian day) Dust events in Spring 2007 did not significatively reach Messina and Potenza as can be seen in Figure 14-8 and Figure 14-9
GSE - PROMOTE 2 C6 Validation Report
Desert Dust
REF PROMOTE-2 C6 ISSUE 10 DATE 060620078 PAGE 30 of 38
Figure 14-6 Time-pattern of AOD 440 nm and Aringngstroumlm parameter α for July August and September 2005 at Lampedusa AERONET sites
GSE - PROMOTE 2 C6 Validation Report
Desert Dust
REF PROMOTE-2 C6 ISSUE 10 DATE 060620078 PAGE 31 of 38
Figure 14-7 Time-pattern of AOD 440 nm and Aringngstroumlm parameter α for July August and September 2005 at Lecce AERONET sites
Figure 14-8 Time-pattern of AOD 440 nm and Aringngstroumlm parameter for April and May 2007 at Messina AERONET sites
GSE - PROMOTE 2 C6 Validation Report
Desert Dust
REF PROMOTE-2 C6 ISSUE 10 DATE 060620078 PAGE 32 of 38
Figure 14-9 Time-pattern of AOD 440 nm and Aringngstroumlm parameter α for April and May 2007 at Potenza AERONET sites
VALIDATION DATA Ground basedin-situ observations Name Data availability and access (include access details if data is freely
available)AERONET data are freely available via web aeronetgsfcnasagov
AERONET observations - level 2
Spatial coverage and resolution NA Phase ( 2 ) Temporal coverage and resolution summer 2005 to december 2007 Location(s) (coordinates) Lampedusa (35N12E) Potenza (40N15E) Messina (38N15E) Lecce(40N18E) Uncertainty quantification (eg Accuracy) 002 for AOD
Name Data availability and access (include access details if data is freely available) events since 2005 available through QUITSAT ASI project from ISAC-CNR
Lidar observations Phase (1+2)
Spatial coverage and resolution NA Temporal coverage and resolution events since 2005 Location(s) (coordinates)Roma Tor Vergata (41N12E) Uncertainty quantification (eg Accuracy) TBD
Table 14-6 Data used for the validation of the Italian Desert Dust Awareness Sub-service
GSE - PROMOTE 2 C6 Validation Report
Desert Dust
REF PROMOTE-2 C6 ISSUE 10 DATE 060620078 PAGE 33 of 38
142 Validation of individual components Following Ackermann (1997) the so-called trispectral method is applied to MSG data In this approach brightness temperature differences (BTD) between the 108 and 87 μm channels set against BTD between the 12 and 108 μm channels enables to discriminate dust from the clear-sky over both oceans and lands In Figure 1-3 is reported an example of trispectral diagram applied to SEVIRI BTD Brightness Temperature Difference pertaining to July 27 2005 As can be seen in the figure three different populations can be discriminated relative to clear sky (blue triangles) clouds (brown diamonds) and desert dust (pink squares) pixels BTD SEVIRI data in spatial and temporal coincidences with Lidar andor AERONET sun-photometer observations will be analyzed for events in which all instruments detect dust presence SEVIRI in terms of BTD Lidar and sun-photometers in terms of Depolarization ratio AOD and Aringngstroumlm parameter
Figure 14-14 Example of trispectral diagram of BTD from MSG-1SEVIRI over the Mediterranean area related to July 27 2005
GSE - PROMOTE 2 C6 Validation Report
Desert Dust
REF PROMOTE-2 C6 ISSUE 10 DATE 060620078 PAGE 34 of 38
VALIDATION OF INDIVIDUAL COMPONENTS
Best estimator
ns Detection of the same dust event
Coincidence check Time-pattern diagrams for lidar data (dust AOD and dust layer height)
Quality assessment
Identification of outliers TBD
Quality checks Events detected by both SEVIRI and lidar measurements in terms of
1 Pixel magenta coloured for seviri (small values of the the differences BT(120-108) and positive small values of the differences of BT(108-87) and
2 Significatly high values of dust AOD as measured by the lidar
Accuracyerror no quantitative parameter defined TBD
Cloud screening quality control
Not enabled
Modelalgorithms
BTD technique Brightness Temperature Differences technique applied to 3 SEVIRI infrared bands IR87 IR108 and IR120 (Ackerman 1997)
RGB of BTD as false color composition httpwwweumetsatintendpsmsgchannel_interpindexhtml
Composite RGB
R=BT(IR120) ndashBT(IR108)
G= BT(IR108)-BT(IR87)
B=BT(IR108)
Consistency
MSG data vs LIDAR
in both period selected for validation with lidar measurements (Summer 05 Spring 07) events detected by MSG were detected in correspondance by lidar measurement in Roma Tor Vergata (see figs Figure 14-3 Figure 14-4 and Figure 14-5
GSE - PROMOTE 2 C6 Validation Report
Desert Dust
REF PROMOTE-2 C6 ISSUE 10 DATE 060620078 PAGE 35 of 38
MSG data vs In-situ
For periods selected in Summer 2005 AERONET data shown the typical behaviour of dust aerosol loading (see figs Figure 14-6 and Figure 14-7)
For period in spring 2007 AERONET sites providing level2 data are not reached by the dust transport as can be seen in the product available in the service web site and it is confirmed in figs Figure 14-8 Figure 14-9
Table 14-7 Validation of individual components of the Italian Service
Validation against specifications and against user requirements Requirements written in Italics are only recommended and not compulsory for Phase 1
VALIDATION AGAINST SERVICE SPECIFICATIONS
variation has been made in the processing chain regarding data format conversion in the data import part areas selection and data archiving
SPECIFICATION S5 REQUIRED ACTUAL
Parameters Desert dust indicator
Accuracy minimum NA ns NA
Accuracy target ns ns TBD
Spatial coverage 10degN ndash 50degN lat 20degW ndash 50degE long
Italy Phase 1 Italy
Phase 2 Mediterranean area (see Figure 14-2)
Horizontal resolution 3x3 Km2 (Ground pixel) ns 3x3 km2
Vertical resolution ns ns na
GridProjection MSG perspective ns MSG perspective
Temporal coverage transport events ns Phase 1 selected dust transport events
Phase 2 NRT monitoring with a delay of 24 hour
Temporal resolution 30 minutes ns 15 minutes
User Interfaces
GSE - PROMOTE 2 C6 Validation Report
Desert Dust
REF PROMOTE-2 C6 ISSUE 10 DATE 060620078 PAGE 36 of 38
PROMOTE Web ns Operational complete and up to date
Operational complete and not up to date
Phase 2 operational complete and updated
ftp ns ns on demand
Data formats and data delivery
Data availability
ns
Specific test periods in Phase 1 (agreed with
users)
In Phase 2 data from Saharian sources
towards Italy
Phase1 Dust transport events detected since
Summer 2005
Phase2 2006 since May whole 2007 and NRT monitoring for
2008
Data access Online online Online
Delivery Mode NRT NRT
Phase 1 Offline
Phase 2 through web-page
Delivery frequency 30 minutes ns 60 minutes
Data Format Png image sequences geotiff on demand Png image sequences
Historical archive None ns None
Visualization geoTIFF png and gif viewers geoTIFF png and gif
viewers
REMARKS
] NRT service planned for phase 3 is started during the phase 2
Table 14-8 Validation of the Italian Sub-service against specifications and against user requirements
GSE - PROMOTE 2 C6 Validation Report
Desert Dust
REF PROMOTE-2 C6 ISSUE 10 DATE 060620078 PAGE 37 of 38
143 Quality assessment and control procedures
Service delivery start date ns
SPECIFICATION S5 REQUIRED
ACTUAL N checksDelivery period
Quality checks See Table 14-7
ns detection of the same dust event by SEVIRI and lidar
Once during validation phase for the whole data-set
Quality flags ns ns NA NA
Product confidence data
ns ns NA NA
Error bar definition and representation
NA NA NA NA]
Representation of missing data
ns ns In the NRT chain a log file is generated with the list of days for which no data
are available
Log file during
processing
Documentation of process failure
Not enabled No automatic reporting on process failure
enabled Only screen reporting
available
ns not enabled not enabled
Version control mechanisms and representation
Version control process is enabled Current version is
11 Version number follows S5
upgrades
10-Phase 1
11- Phase 2
ns V 12 related to S5 April 08
ns
Requirements written in Italics are not compulsory for Phase 2
Table 14-9 Validation of quality control procedures for the Italian Sub-service
GSE - PROMOTE 2 C6 Validation Report
Desert Dust
REF PROMOTE-2 C6 ISSUE 10 DATE 060620078 PAGE 38 of 38
15 References
151 Electronic references httpaeronetgsfcnasagov
httpwwweumetsatintendpsmsgchannel_interpindexhtml
152 Bibliographic references Ackerman S 1997 ldquoRemote sensing of aerosols using satellite infrared observationsrdquo JGeophys Res 102 17069-17079 Gobbi G P F Barnaba and L Ammannato 2004 The vertical distribution of aerosols Saharan dust and cirrus clouds in Rome (Italy) in the year 2001 Atmospheric Chemistry and Physics Vol 4 351-359
- DOCUMENT STATUS SHEET
- DOCUMENT CHANGE RECORD
- LIST OF TABLES
- LIST OF FIGURES
- LIST OF ACRONYMS
- TABLE OF CONTENTS
- 1 DESERT DUST AWARENESS
-
- 11 Service Summary
- 11
- 12 Product characterization
- 13 Iberian sub-service
-
- 131 Validation plan and validation data
-
- 1311 Development and testing of a validation tool
- 1312 Validation by means of the visualization tool
- 1313 Validation of SEVIRI data with AERONET and ADRIEX data
-
- 132 Validation of individual components
-
- 1321 SEVIRI cloud screening
- 1322 Screening procedures
- 1323 Fits of Aeronet site measurements to coincident SEVIRI retrievals
- 1324 Results
- 1325 Merging the aerosol types
- 1326 Comparisons with other Satellite Platforms
- 1327 Conclusions
-
- 133 Validation against specifications and against user requirements
- 134 Service quality assessment and control procedures
-
- 14 Italian sub-service
-
- 141 Validation Plan and Validation Data
- 142 Validation of individual components
- sect Validation against specifications and against user requirements
- 143 Quality assessment and control procedures
-
- 15 References
-
- 151 Electronic references
- 152 Bibliographic references
-
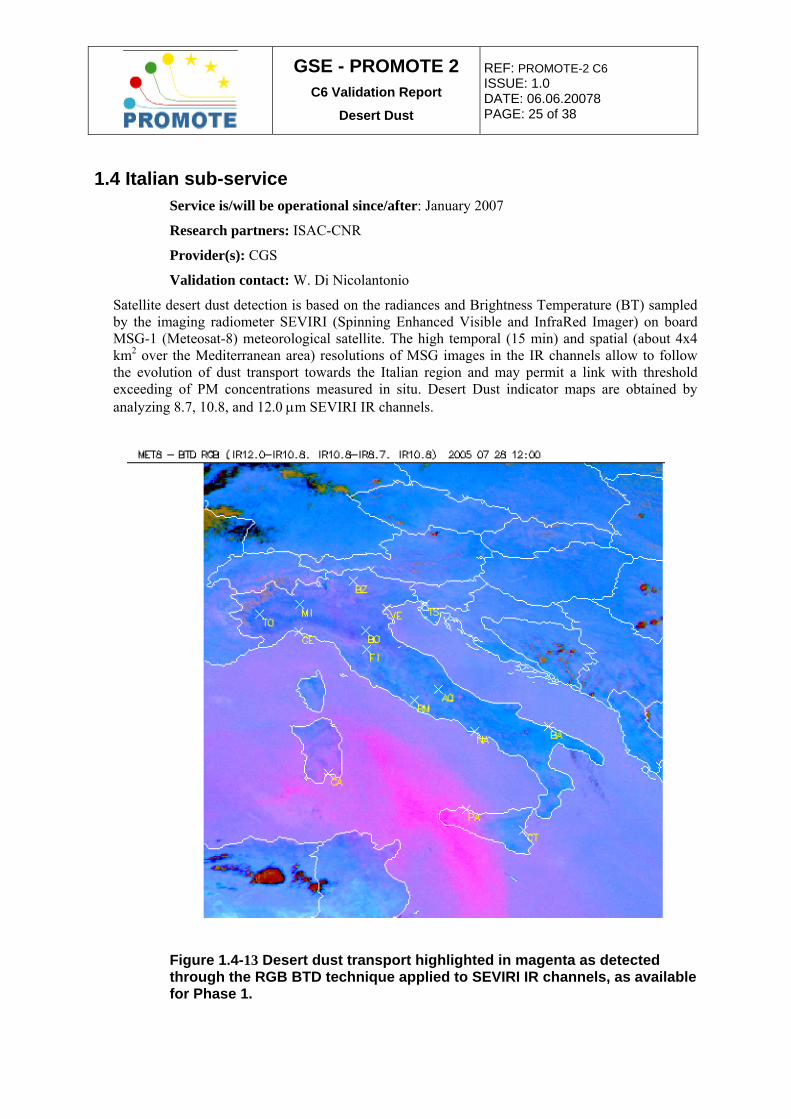
GSE - PROMOTE 2 C6 Validation Report
Desert Dust
REF PROMOTE-2 C6 ISSUE 10 DATE 060620078 PAGE 28 of 38
4 July 22 ndash August 08 2005 5 around August 10 2005 6 September 4 ndash 9 2005
As stated above lidar observations in Tor Vergata (Rome) [see Table 14-5] were employed In particular Figure 14-4 and Figure 14-5 show the time-patterns of dust AOD (AOD due only to the Saharan dust contribution to aerosol extinction) and corresponding minimum and maximum height of the dust layer Significant values of dust AOD are present around March 9 April 10 and May 20 together with layer heights ranging between 200 m to 7 km
0000
0100
0200
0300
0400
0500
0600
0700
270207 090307 190307 290307 080407 180407 280407 080507 180507 280507 070607
Dus
t aod
dust AOD
Figure 14-4 Time-pattern of the Aerosol Optical Depth only due to the saharan dust contribution (dust AOD) in the period March ndash May 2007 as recorded at Roma tor Vergata
0000
2000
4000
6000
8000
10000
270207 090307 190307 290307 080407 180407 280407 080507 180507 280507 070607
Dus
t Hei
ght (
km)
Zmin dust layerZmax dust layer
Figure 14-5 Time-pattern of the minimum and maximum height of the dust layer (Zmin dust layer Zmax dust layer) in the period March ndash May 2007 as recorded at Roma tor Vergata
Furthermore the indirect comparison against AERONET data [see table 14-1] has been made both for the events highlighted in Phase 1 validation (Summer 2005) and Phase2 validation (Spring
GSE - PROMOTE 2 C6 Validation Report
Desert Dust
REF PROMOTE-2 C6 ISSUE 10 DATE 060620078 PAGE 29 of 38
2007) AERONET Level2 data (iequality assured) for the Lampedusa and Lecce sites were available only for July-September 2005 period while Potenza and Messina data were available only for April-May 2007 Time patterns of Aerosol Optical Depth AOD at 440 nm and Angstroumlm parameter α relative to the visible wavelength range [440-870]nm are presented in the Figures below to highlight the presence of dust in terms of small values of parameter α accompanied by significant AOD Concerning Lampedusa site in summer 2005 (see Figure 14-6) an increase in AOD can be seen in correspondance of the decrease in parameter α for 2-4 August (214-216 julian day) AOD presents values lower than 02 at mid-July then undergoes to an increase up to 06 together with a decrease in α from 07 to almost 01 A similar behaviour can be recognized at the end of the event on 12-13 August (225-226 julian day) while in the period before a lack of data prevents further analysis Analysing time-patterns relative to Lecce AERONET site (Figure 14-7 ) AOD and α inversions are present around August 2 (214 julian day) August 12 (224 julian day) and from September 7 to 11 (250 ndash 254 julian day) Dust events in Spring 2007 did not significatively reach Messina and Potenza as can be seen in Figure 14-8 and Figure 14-9
GSE - PROMOTE 2 C6 Validation Report
Desert Dust
REF PROMOTE-2 C6 ISSUE 10 DATE 060620078 PAGE 30 of 38
Figure 14-6 Time-pattern of AOD 440 nm and Aringngstroumlm parameter α for July August and September 2005 at Lampedusa AERONET sites
GSE - PROMOTE 2 C6 Validation Report
Desert Dust
REF PROMOTE-2 C6 ISSUE 10 DATE 060620078 PAGE 31 of 38
Figure 14-7 Time-pattern of AOD 440 nm and Aringngstroumlm parameter α for July August and September 2005 at Lecce AERONET sites
Figure 14-8 Time-pattern of AOD 440 nm and Aringngstroumlm parameter for April and May 2007 at Messina AERONET sites
GSE - PROMOTE 2 C6 Validation Report
Desert Dust
REF PROMOTE-2 C6 ISSUE 10 DATE 060620078 PAGE 32 of 38
Figure 14-9 Time-pattern of AOD 440 nm and Aringngstroumlm parameter α for April and May 2007 at Potenza AERONET sites
VALIDATION DATA Ground basedin-situ observations Name Data availability and access (include access details if data is freely
available)AERONET data are freely available via web aeronetgsfcnasagov
AERONET observations - level 2
Spatial coverage and resolution NA Phase ( 2 ) Temporal coverage and resolution summer 2005 to december 2007 Location(s) (coordinates) Lampedusa (35N12E) Potenza (40N15E) Messina (38N15E) Lecce(40N18E) Uncertainty quantification (eg Accuracy) 002 for AOD
Name Data availability and access (include access details if data is freely available) events since 2005 available through QUITSAT ASI project from ISAC-CNR
Lidar observations Phase (1+2)
Spatial coverage and resolution NA Temporal coverage and resolution events since 2005 Location(s) (coordinates)Roma Tor Vergata (41N12E) Uncertainty quantification (eg Accuracy) TBD
Table 14-6 Data used for the validation of the Italian Desert Dust Awareness Sub-service
GSE - PROMOTE 2 C6 Validation Report
Desert Dust
REF PROMOTE-2 C6 ISSUE 10 DATE 060620078 PAGE 33 of 38
142 Validation of individual components Following Ackermann (1997) the so-called trispectral method is applied to MSG data In this approach brightness temperature differences (BTD) between the 108 and 87 μm channels set against BTD between the 12 and 108 μm channels enables to discriminate dust from the clear-sky over both oceans and lands In Figure 1-3 is reported an example of trispectral diagram applied to SEVIRI BTD Brightness Temperature Difference pertaining to July 27 2005 As can be seen in the figure three different populations can be discriminated relative to clear sky (blue triangles) clouds (brown diamonds) and desert dust (pink squares) pixels BTD SEVIRI data in spatial and temporal coincidences with Lidar andor AERONET sun-photometer observations will be analyzed for events in which all instruments detect dust presence SEVIRI in terms of BTD Lidar and sun-photometers in terms of Depolarization ratio AOD and Aringngstroumlm parameter
Figure 14-14 Example of trispectral diagram of BTD from MSG-1SEVIRI over the Mediterranean area related to July 27 2005
GSE - PROMOTE 2 C6 Validation Report
Desert Dust
REF PROMOTE-2 C6 ISSUE 10 DATE 060620078 PAGE 34 of 38
VALIDATION OF INDIVIDUAL COMPONENTS
Best estimator
ns Detection of the same dust event
Coincidence check Time-pattern diagrams for lidar data (dust AOD and dust layer height)
Quality assessment
Identification of outliers TBD
Quality checks Events detected by both SEVIRI and lidar measurements in terms of
1 Pixel magenta coloured for seviri (small values of the the differences BT(120-108) and positive small values of the differences of BT(108-87) and
2 Significatly high values of dust AOD as measured by the lidar
Accuracyerror no quantitative parameter defined TBD
Cloud screening quality control
Not enabled
Modelalgorithms
BTD technique Brightness Temperature Differences technique applied to 3 SEVIRI infrared bands IR87 IR108 and IR120 (Ackerman 1997)
RGB of BTD as false color composition httpwwweumetsatintendpsmsgchannel_interpindexhtml
Composite RGB
R=BT(IR120) ndashBT(IR108)
G= BT(IR108)-BT(IR87)
B=BT(IR108)
Consistency
MSG data vs LIDAR
in both period selected for validation with lidar measurements (Summer 05 Spring 07) events detected by MSG were detected in correspondance by lidar measurement in Roma Tor Vergata (see figs Figure 14-3 Figure 14-4 and Figure 14-5
GSE - PROMOTE 2 C6 Validation Report
Desert Dust
REF PROMOTE-2 C6 ISSUE 10 DATE 060620078 PAGE 35 of 38
MSG data vs In-situ
For periods selected in Summer 2005 AERONET data shown the typical behaviour of dust aerosol loading (see figs Figure 14-6 and Figure 14-7)
For period in spring 2007 AERONET sites providing level2 data are not reached by the dust transport as can be seen in the product available in the service web site and it is confirmed in figs Figure 14-8 Figure 14-9
Table 14-7 Validation of individual components of the Italian Service
Validation against specifications and against user requirements Requirements written in Italics are only recommended and not compulsory for Phase 1
VALIDATION AGAINST SERVICE SPECIFICATIONS
variation has been made in the processing chain regarding data format conversion in the data import part areas selection and data archiving
SPECIFICATION S5 REQUIRED ACTUAL
Parameters Desert dust indicator
Accuracy minimum NA ns NA
Accuracy target ns ns TBD
Spatial coverage 10degN ndash 50degN lat 20degW ndash 50degE long
Italy Phase 1 Italy
Phase 2 Mediterranean area (see Figure 14-2)
Horizontal resolution 3x3 Km2 (Ground pixel) ns 3x3 km2
Vertical resolution ns ns na
GridProjection MSG perspective ns MSG perspective
Temporal coverage transport events ns Phase 1 selected dust transport events
Phase 2 NRT monitoring with a delay of 24 hour
Temporal resolution 30 minutes ns 15 minutes
User Interfaces
GSE - PROMOTE 2 C6 Validation Report
Desert Dust
REF PROMOTE-2 C6 ISSUE 10 DATE 060620078 PAGE 36 of 38
PROMOTE Web ns Operational complete and up to date
Operational complete and not up to date
Phase 2 operational complete and updated
ftp ns ns on demand
Data formats and data delivery
Data availability
ns
Specific test periods in Phase 1 (agreed with
users)
In Phase 2 data from Saharian sources
towards Italy
Phase1 Dust transport events detected since
Summer 2005
Phase2 2006 since May whole 2007 and NRT monitoring for
2008
Data access Online online Online
Delivery Mode NRT NRT
Phase 1 Offline
Phase 2 through web-page
Delivery frequency 30 minutes ns 60 minutes
Data Format Png image sequences geotiff on demand Png image sequences
Historical archive None ns None
Visualization geoTIFF png and gif viewers geoTIFF png and gif
viewers
REMARKS
] NRT service planned for phase 3 is started during the phase 2
Table 14-8 Validation of the Italian Sub-service against specifications and against user requirements
GSE - PROMOTE 2 C6 Validation Report
Desert Dust
REF PROMOTE-2 C6 ISSUE 10 DATE 060620078 PAGE 37 of 38
143 Quality assessment and control procedures
Service delivery start date ns
SPECIFICATION S5 REQUIRED
ACTUAL N checksDelivery period
Quality checks See Table 14-7
ns detection of the same dust event by SEVIRI and lidar
Once during validation phase for the whole data-set
Quality flags ns ns NA NA
Product confidence data
ns ns NA NA
Error bar definition and representation
NA NA NA NA]
Representation of missing data
ns ns In the NRT chain a log file is generated with the list of days for which no data
are available
Log file during
processing
Documentation of process failure
Not enabled No automatic reporting on process failure
enabled Only screen reporting
available
ns not enabled not enabled
Version control mechanisms and representation
Version control process is enabled Current version is
11 Version number follows S5
upgrades
10-Phase 1
11- Phase 2
ns V 12 related to S5 April 08
ns
Requirements written in Italics are not compulsory for Phase 2
Table 14-9 Validation of quality control procedures for the Italian Sub-service
GSE - PROMOTE 2 C6 Validation Report
Desert Dust
REF PROMOTE-2 C6 ISSUE 10 DATE 060620078 PAGE 38 of 38
15 References
151 Electronic references httpaeronetgsfcnasagov
httpwwweumetsatintendpsmsgchannel_interpindexhtml
152 Bibliographic references Ackerman S 1997 ldquoRemote sensing of aerosols using satellite infrared observationsrdquo JGeophys Res 102 17069-17079 Gobbi G P F Barnaba and L Ammannato 2004 The vertical distribution of aerosols Saharan dust and cirrus clouds in Rome (Italy) in the year 2001 Atmospheric Chemistry and Physics Vol 4 351-359
- DOCUMENT STATUS SHEET
- DOCUMENT CHANGE RECORD
- LIST OF TABLES
- LIST OF FIGURES
- LIST OF ACRONYMS
- TABLE OF CONTENTS
- 1 DESERT DUST AWARENESS
-
- 11 Service Summary
- 11
- 12 Product characterization
- 13 Iberian sub-service
-
- 131 Validation plan and validation data
-
- 1311 Development and testing of a validation tool
- 1312 Validation by means of the visualization tool
- 1313 Validation of SEVIRI data with AERONET and ADRIEX data
-
- 132 Validation of individual components
-
- 1321 SEVIRI cloud screening
- 1322 Screening procedures
- 1323 Fits of Aeronet site measurements to coincident SEVIRI retrievals
- 1324 Results
- 1325 Merging the aerosol types
- 1326 Comparisons with other Satellite Platforms
- 1327 Conclusions
-
- 133 Validation against specifications and against user requirements
- 134 Service quality assessment and control procedures
-
- 14 Italian sub-service
-
- 141 Validation Plan and Validation Data
- 142 Validation of individual components
- sect Validation against specifications and against user requirements
- 143 Quality assessment and control procedures
-
- 15 References
-
- 151 Electronic references
- 152 Bibliographic references
-
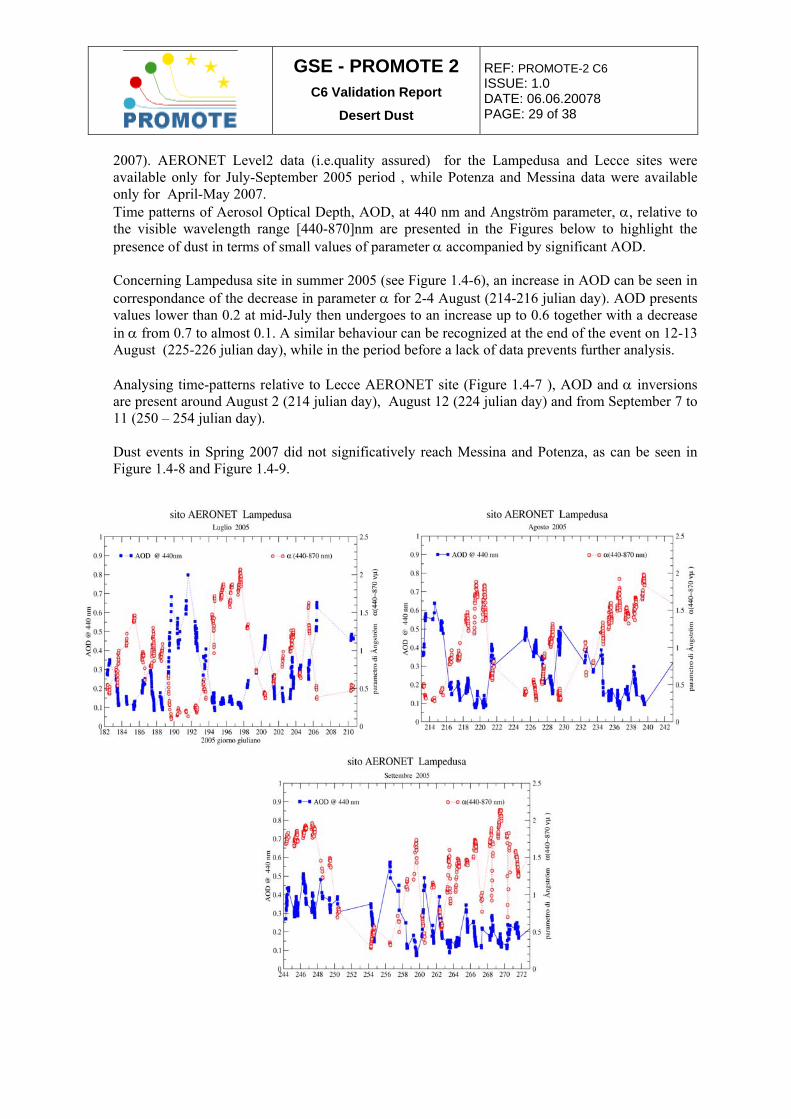
GSE - PROMOTE 2 C6 Validation Report
Desert Dust
REF PROMOTE-2 C6 ISSUE 10 DATE 060620078 PAGE 38 of 38
15 References
151 Electronic references httpaeronetgsfcnasagov
httpwwweumetsatintendpsmsgchannel_interpindexhtml
152 Bibliographic references Ackerman S 1997 ldquoRemote sensing of aerosols using satellite infrared observationsrdquo JGeophys Res 102 17069-17079 Gobbi G P F Barnaba and L Ammannato 2004 The vertical distribution of aerosols Saharan dust and cirrus clouds in Rome (Italy) in the year 2001 Atmospheric Chemistry and Physics Vol 4 351-359
- DOCUMENT STATUS SHEET
- DOCUMENT CHANGE RECORD
- LIST OF TABLES
- LIST OF FIGURES
- LIST OF ACRONYMS
- TABLE OF CONTENTS
- 1 DESERT DUST AWARENESS
-
- 11 Service Summary
- 11
- 12 Product characterization
- 13 Iberian sub-service
-
- 131 Validation plan and validation data
-
- 1311 Development and testing of a validation tool
- 1312 Validation by means of the visualization tool
- 1313 Validation of SEVIRI data with AERONET and ADRIEX data
-
- 132 Validation of individual components
-
- 1321 SEVIRI cloud screening
- 1322 Screening procedures
- 1323 Fits of Aeronet site measurements to coincident SEVIRI retrievals
- 1324 Results
- 1325 Merging the aerosol types
- 1326 Comparisons with other Satellite Platforms
- 1327 Conclusions
-
- 133 Validation against specifications and against user requirements
- 134 Service quality assessment and control procedures
-
- 14 Italian sub-service
-
- 141 Validation Plan and Validation Data
- 142 Validation of individual components
- sect Validation against specifications and against user requirements
- 143 Quality assessment and control procedures
-
- 15 References
-
- 151 Electronic references
- 152 Bibliographic references
-