c56 regional aquifer-system analysis—midwestern basins … · basins and arches aquifer system to...
TRANSCRIPT
REGIONAL AQUIFER-SYSTEM ANALYSIS—MIDWESTERN BASINS AND ARCHESC56
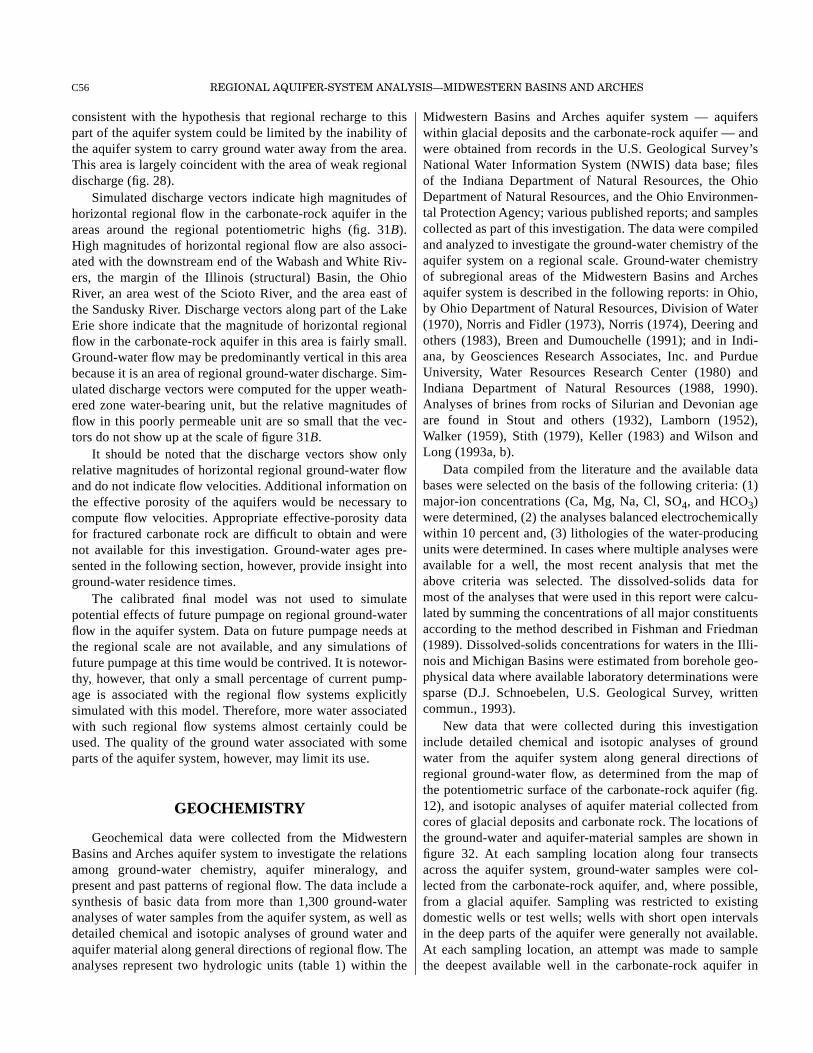
consistent with the hypothesis that regional recharge to thispart of the aquifer system could be limited by the inability ofthe aquifer system to carry ground water away from the area.This area is largely coincident with the area of weak regionaldischarge (fig. 28).
Simulated discharge vectors indicate high magnitudes ofhorizontal regional flow in the carbonate-rock aquifer in theareas around the regional potentiometric highs (fig. 31B).High magnitudes of horizontal regional flow are also associ-ated with the downstream end of the Wabash and White Riv-ers, the margin of the Illinois (structural) Basin, the OhioRiver, an area west of the Scioto River, and the area east ofthe Sandusky River. Discharge vectors along part of the LakeErie shore indicate that the magnitude of horizontal regionalflow in the carbonate-rock aquifer in this area is fairly small.Ground-water flow may be predominantly vertical in this areabecause it is an area of regional ground-water discharge. Sim-ulated discharge vectors were computed for the upper weath-ered zone water-bearing unit, but the relative magnitudes offlow in this poorly permeable unit are so small that the vec-tors do not show up at the scale of figure 31B.
It should be noted that the discharge vectors show onlyrelative magnitudes of horizontal regional ground-water flowand do not indicate flow velocities. Additional information onthe effective porosity of the aquifers would be necessary tocompute flow velocities. Appropriate effective-porosity datafor fractured carbonate rock are difficult to obtain and werenot available for this investigation. Ground-water ages pre-sented in the following section, however, provide insight intoground-water residence times.
The calibrated final model was not used to simulatepotential effects of future pumpage on regional ground-waterflow in the aquifer system. Data on future pumpage needs atthe regional scale are not available, and any simulations offuture pumpage at this time would be contrived. It is notewor-thy, however, that only a small percentage of current pump-age is associated with the regional flow systems explicitlysimulated with this model. Therefore, more water associatedwith such regional flow systems almost certainly could beused. The quality of the ground water associated with someparts of the aquifer system, however, may limit its use.
GEOCHEMISTRY
Geochemical data were collected from the MidwesternBasins and Arches aquifer system to investigate the relationsamong ground-water chemistry, aquifer mineralogy, andpresent and past patterns of regional flow. The data include asynthesis of basic data from more than 1,300 ground-wateranalyses of water samples from the aquifer system, as well asdetailed chemical and isotopic analyses of ground water andaquifer material along general directions of regional flow. Theanalyses represent two hydrologic units (table 1) within the
Midwestern Basins and Arches aquifer system — aquiferswithin glacial deposits and the carbonate-rock aquifer — andwere obtained from records in the U.S. Geological Survey’sNational Water Information System (NWIS) data base; filesof the Indiana Department of Natural Resources, the OhioDepartment of Natural Resources, and the Ohio Environmen-tal Protection Agency; various published reports; and samplescollected as part of this investigation. The data were compiledand analyzed to investigate the ground-water chemistry of theaquifer system on a regional scale. Ground-water chemistryof subregional areas of the Midwestern Basins and Archesaquifer system is described in the following reports: in Ohio,by Ohio Department of Natural Resources, Division of Water(1970), Norris and Fidler (1973), Norris (1974), Deering andothers (1983), Breen and Dumouchelle (1991); and in Indi-ana, by Geosciences Research Associates, Inc. and PurdueUniversity, Water Resources Research Center (1980) andIndiana Department of Natural Resources (1988, 1990).Analyses of brines from rocks of Silurian and Devonian ageare found in Stout and others (1932), Lamborn (1952),Walker (1959), Stith (1979), Keller (1983) and Wilson andLong (1993a, b).
Data compiled from the literature and the available databases were selected on the basis of the following criteria: (1)major-ion concentrations (Ca, Mg, Na, Cl, SO4, and HCO3)were determined, (2) the analyses balanced electrochemicallywithin 10 percent and, (3) lithologies of the water-producingunits were determined. In cases where multiple analyses wereavailable for a well, the most recent analysis that met theabove criteria was selected. The dissolved-solids data formost of the analyses that were used in this report were calcu-lated by summing the concentrations of all major constituentsaccording to the method described in Fishman and Friedman(1989). Dissolved-solids concentrations for waters in the Illi-nois and Michigan Basins were estimated from borehole geo-physical data where available laboratory determinations weresparse (D.J. Schnoebelen, U.S. Geological Survey, writtencommun., 1993).
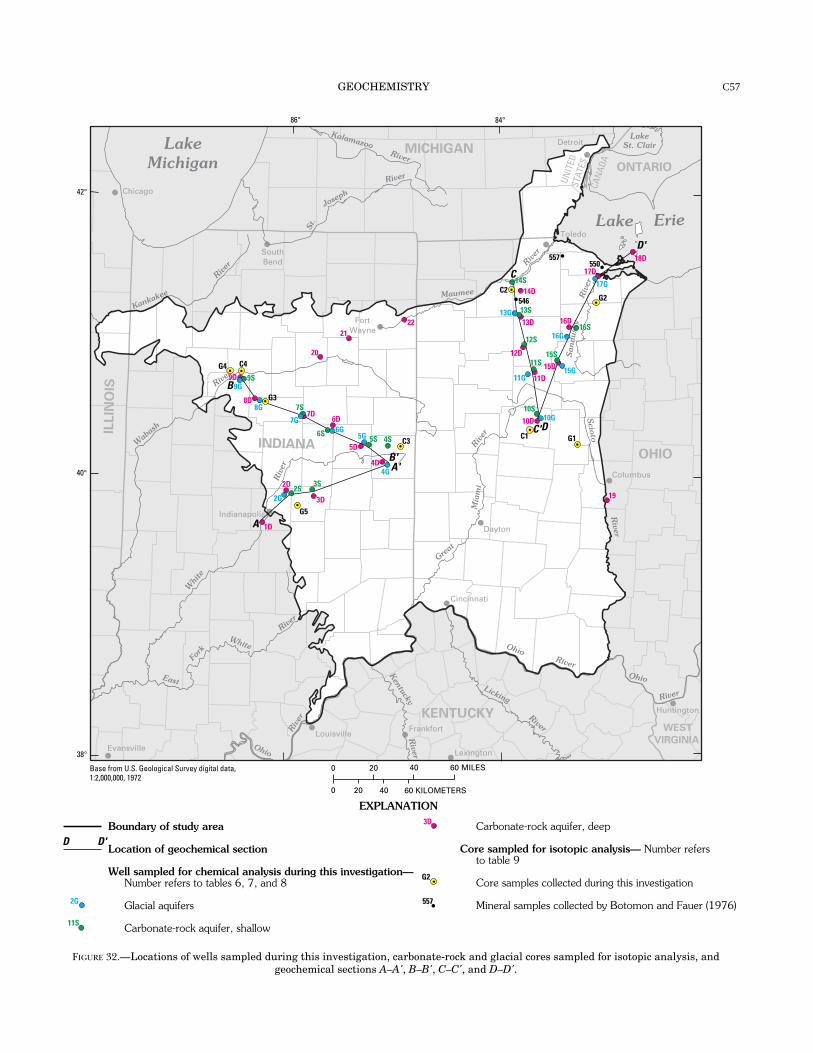
New data that were collected during this investigationinclude detailed chemical and isotopic analyses of groundwater from the aquifer system along general directions ofregional ground-water flow, as determined from the map ofthe potentiometric surface of the carbonate-rock aquifer (fig.12), and isotopic analyses of aquifer material collected fromcores of glacial deposits and carbonate rock. The locations ofthe ground-water and aquifer-material samples are shown infigure 32. At each sampling location along four transectsacross the aquifer system, ground-water samples were col-lected from the carbonate-rock aquifer, and, where possible,from a glacial aquifer. Sampling was restricted to existingdomestic wells or test wells; wells with short open intervalsin the deep parts of the aquifer were generally not available.At each sampling location, an attempt was made to samplethe deepest available well in the carbonate-rock aquifer in
GEOCHEMISTRY C57
84°86°
42°
40°
38°
Base from U.S. Geological Survey digital data,1:2,000,000, 1972
0 20
0 20 40 60 KILOMETERS
40 60 MILES
Lake Erie
Maumee
River
KalamazooRiver
St.
Joseph
River
San
dusk
yR
iver
Scio
to
River
Great
Mia
mi
Rive
r
OhioRiver
Ohio
Riv
er
Ohio
River
East
Fork
White
Whi
te
Riv
er
Wab
ash
River
Kankakee
River
River
Kentucky
River
Licking
River
LakeMichigan
LakeSt. Clair
Chicago
Indianapolis
Detroit
Columbus
Cincinnati
Toledo
Dayton
Evansville
Louisville
FortWayne
SouthBend
Frankfort
Lexington
Huntington
ILLIN
OIS
MICHIGAN
INDIANAOHIO
WEST
VIRGINIA
KENTUCKY
ONTARIO
UNIT
EDST
ATES
CAN
ADA
1D
2G
2D 2S
G53D
3S4G
4D
4S C35G 5S
5D
6D6G6S
7S7D
7G
G3
C4G49D
9G9S
20
2122
557550
18D
17D
17G
16D
16G16S
15S15D 15G
G2
14SC2 14D
54613S
13D13G
12S
12D11S
11D11G
10S
10D 10G
C1 G1
19
D'
DC'
C
B
B'A'
A
8G8D
EXPLANATION
Boundary of study area
Location of geochemical section
Well sampled for chemical analysis during this investigation— Number refers to tables 6, 7, and 8
Glacial aquifers
Carbonate-rock aquifer, shallow
Carbonate-rock aquifer, deep
Core sampled for isotopic analysis— Number refers to table 9
Core samples collected during this investigation
Mineral samples collected by Botomon and Fauer (1976)
D'D
2G
3D
11S
G2
557
FIGURE 32.—Locations of wells sampled during this investigation, carbonate-rock and glacial cores sampled for isotopic analysis, andgeochemical sections A–A', B–B', C–C', and D–D'.

REGIONAL AQUIFER-SYSTEM ANALYSIS—MIDWESTERN BASINS AND ARCHESC58
order to intersect the dominant regional ground-water flowpaths in the aquifer system. The deep bedrock wells are com-pleted from 100 to nearly 450 ft into the carbonate-rock aqui-fer. To evaluate the effects of sampling the deep wells withlong open intervals, RASA investigators also sampled anearby well with a short open interval. These wells were shal-low and completed in the top 5 to 50 ft of the carbonate-rockaquifer. Well depth and length of open interval for each wellsampled are listed in table 6. Deep bedrock wells that arecased through the top part of the carbonate-rock aquifer arealso noted in table 6. Where possible, a glacial well, a shallowbedrock well, and a deep bedrock well within several miles ofeach other were identified and grouped as a sample site.
Ground-water samples were collected during 1991-92 andanalyzed for major and minor constituents according to themethods described in Fishman and Friedman (1989). Fielddeterminations were made for pH, temperature, and alkalinityaccording to methods described in Wood (1976). Dissolvedsulfide was determined in the field with a Hach DR-2000spectrophotometer according to the procedure described inthe instrument manual (Hach Chemical Company, 1989).
Samples were collected and analyzed for dissolved gasconcentrations; stable isotope ratios of oxygen, hydrogen,carbon and sulfur; and the radioactive isotopes tritium (3H)and carbon-14 (14C) by use of standard methods. Samples ofaquifer material were collected from cores in the core reposi-tories of the Indiana Geological Survey and the Ohio Geolog-ical Survey. The samples were analyzed for carbon and sulfurisotopes by use of standard methods. By convention, stableisotope ratios are expressed in delta units (δ) as per mil (partsper thousand, or per mil) differences relative to the appropri-ate standard: Standard Mean Ocean Water (SMOW) for oxy-gen (δ18O) and hydrogen (δD), Pee Dee Formation belemnitefor carbon (δ13C), and Canyon Diablo troilite for sulfur(δ34S). Tritium concentrations are expressed in tritium units(TU), and 14C values are presented in percent modern carbon(pmc). The chemical and isotopic data are listed in tables 7-9.
SPATIAL DISTRIBUTION OF DISSOLVED-SOLIDS CONCENTRATIONS
AND HYDROCHEMICAL FACIES
Knowledge of the spatial distribution of dissolved-solidsconcentrations and hydrochemical facies can help in distin-guishing recharge and discharge areas, identifying areas ofground-water mixing, and estimating relative rates of ground-water flow. Water chemistry in the glacial and carbonate-rockaquifers was classified by calculating the dissolved-solidsconcentrations and the percentages of major cations andanions composing the total dissolved cations and anions,respectively. Maps were prepared showing the areal distribu-tion of dissolved solids and hydrochemical facies indicatedby the predominant cations and anions. These maps were
used to delimit zones of potable water in the carbonate-rockaquifer, to examine the relation between the glacial aquifersand the carbonate-rock aquifer, and to evaluate possiblegeochemical and hydrological processes that control the dis-tribution of major dissolved solutes.
Generally, dissolved-solids concentrations in groundwater increase along flow paths — from the surface to the sat-urated zone and through the aquifer — because of dissolutionof minerals (Freeze and Cherry, 1979). Additional processessuch as evaporation or evapotranspiration can increase con-centrations of dissolved solutes. Some ground waters, notablybrines, contain extremely high concentrations of dissolvedsolids because of combined effects of mineral dissolution andevaporation. Thus, dissolved-solids concentrations generallycan be used as an indicator of the degree of chemical evolu-tion of ground water in an aquifer system.
The predominant major ions in ground water can also beused as indicators of the important chemical and hydrologicprocesses in an aquifer system. Chebotarev (1955) character-ized regional changes in the dominant anion species inground water. The general evolutionary sequence that heobserved for the dominant anions was HCO3 to SO4 to Cl,which correlated with increasing distance along the flow pathand an increasing age of water. This anion sequence also cor-responded to an increase in dissolved-solids concentration.Water containing predominantly bicarbonate is generallypresent in areas of active ground-water flushing, water con-taining predominantly sulfate is present where ground-watercirculation is less active, and water containing predominantlychloride is generally present where ground-water flow is verysluggish and flushing of the aquifer is minimal. Back (1960)introduced the concept of hydrochemical facies based on thedominance of cations and anions. Using hydrochemical faciesand dissolved-solids concentrations, he inferred the generalsequence of reactions and hence the general directions ofregional ground-water flow.
DISSOLVED-SOLIDS CONCENTRATIONS
Dissolved-solids concentrations of ground water from theMidwestern Basins and Arches aquifer system are shown infigures 33 and 34. Dissolved-solids concentrations in waterfrom the glacial aquifers (fig. 33) range from less than 100 togreater than 2,600 mg/L; the median is 378 mg/L. In morethan 80 percent of available water analyses for the glacialaquifers, dissolved-solids concentrations are less than 500mg/L. Ground water with dissolved-solids concentrations lessthan 500 mg/L is found in the glacial aquifers across most ofthe study area, as is ground water with concentrations rangingfrom 500 to 1,000 mg/L. Concentrations greater than 1,000mg/L, however, are restricted primarily to the northeasternpart of the study area. Few analyses of water from the glacialaquifers are available for this area because many of the wellsare completed in the underlying carbonate-rock aquifer rather

GEOCHEMISTRY C59
a
b
d
e
c
Well is cased through the top 83 ft of bedrock.Well is cased through the top 110 ft of bedrock.Well is cased through the top 31 ft of bedrock.Well is cased through the top 345 ft of bedrock.Well is open to the New Albany Shale (upper confining unit) from 88 to 204 ft below land surface.
a
b
c
d
e
Well name Mapnumber
Welldepth (ft)
Depth tobedrock (ft)
Depth to top ofopen interval (ft)
Depth to bottom ofopen interval (ft)
Length of openinterval (ft) Aquifer
RossBirtBen Logan H.S.SearfossRifeSchoenbergerBeasleyHillGilligLamalieS-18FinneganWilsonSpencerStairFrancisAugustineRichardKernAuckermanRiceCity of WestonHartmanLacyHummelJonesHarrisonMartinLockhartMattinglyMerchantGatesBickfordBartlettDesoto SubstationStaggsIceUnderwoodCoheeEllisHarmonFoxSkilesJusticeLeeStarbuckGeradotStenzelRees
10 G10 S10 D15 G15 S15 D16 G16 S16 D17 G17 D18 D11 G11 S11 D12 S12 D13 G13 S13 D14 S14 D194 G4 S4 D3 S3 D2 G2 S2 D1 D5 G5 S5 D6 G6 S6 D7 G7 S7 D8 G8 D9 G9 S9 D222120
10286
3406039
2408180
31075
3401855043
25062
32081
10240035
50014467
12120111720014015031032045
10626511611030299
10229389
20262
113182260260230
--7697--
3433--
5245--
702--
1618406--
73783265
114--
88119108135
--14017088--
7488--
92161
--4951--
63--
657672
170160
N.A.80
160N.A.
343661635571
18026
N.A.2221439
N.A.75
10932
4101146490
12210813813614017088417491
11392
162845553846459677970
170160
N.A.86
340N.A.
392408180
31075
340185
N.A.43
25062
320N.A.10240035
50014467
12120111720014015031032045
10626511611030289
10229389
20262
113182260260230
N.A.6
180N.A.
52052017
2554
160159
N.A.21
22920
311N.A.
27291
390303
31799
624
10140232
432
1743
18140
547
2405
1383
461031909070
GC-RC-R
GC-RC-R
GC-RC-R
GC-RC-R
GC-RC-RC-RC-R
GC-RC-RC-RC-RC-R
GC-RC-RC-RC-R
GC-RC-RC-R
GC-RC-R
GC-RC-R
GC-RC-R
GC-R
GC-RC-R
G, C-RC-RC-R
[Map number is location in figure 32; ft, feet; --, not applicable; N.A., data not available; G, glacial aquifer; C-R, carbonate-rock aquifer;all depth data are in feet below land surface]
TABLE 6.—Well construction information for wells sampled during investigation of the Midwestern Basins and Archesaquifer system, 1991–92

REGIONAL AQUIFER-SYSTEM ANALYSIS—MIDWESTERN BASINS AND ARCHESC60
Well name Mapnumber
Date ofcollection
Specificconductance
(µS/cm)
pH(standard
units)
Eh(millivolts)
Temperature(degreesCelsius)
Dissolvedoxygen(mg/L)
Calcium(mg/L)
Magnesium(mg/L)
Sodium(mg/L)
Potassium(mg/L)
RossBirtBen Logan H.S.SearfossRifeSchoenbergerBeasleyHillGilligLamalieS-18FinneganWilsonSpencerStairFrancisAugustineRichardKernAuckermanRiceCity of WestonHartmanLacyHummelJonesHarrisonMartinLockhartMattinglyMerchantGatesBickfordBartlettDesoto SubstationStaggsIceUnderwoodCoheeEllisHarmonFoxSkilesJusticeLeeStarbuckGeradotStenzelRees
10 G10 S10 D15 G15 S15 D16 G16 S16 D17 G17 D18 D11 G11 S11 D12 S12 D13 G13 S13 D14 S14 D194 G4 S4 D3 S3 D2 G2 S2 D1 D5 G5 S5 D6 G6 S6 D7 G7 S7 D8 G8 D9 G9 S9 D222120
08-06-9108-07-9107-28-9208-15-9108-12-9108-14-9108-19-9108-20-9108-21-9108-22-9108-27-9106-13-9208-03-9207-29-9208-04-9208-05-9208-06-9207-30-9208-07-9208-13-9208-12-9208-11-9209-10-9209-06-9109-05-9109-03-9110-07-9109-04-9109-09-9109-11-9109-10-9110-08-9109-03-9209-01-9208-19-9208-20-9209-02-9208-21-9209-04-9208-24-9208-25-9208-29-9208-26-9208-27-9208-28-9205-29-9208-28-9208-30-9108-29-91
2,3601,010
7072,4002,4002,720
7721,7601,6602,4502,690
7651,4701,0101,070
9911,2602,0801,6101,6901,1803,2501,330
670953695595570
1,1401,060
9081,210
958765738723713653673746711683782736834655942588603
121512397145585270
126102723
8235
176153–36–7967
127–132–88–96
--7295
1267756
10470--
–8497
14314912813212476
12387
124–1
113125–287630
–68
12.111.513.811.511.111.210.511.511.612.112.611.811.312.811.412.111.311.512.312.412.812.913.57.4
11.311.312.213.512.412.113.213.713.012.013.011.412.611.712.512.012.311.913.312.411.611.313.311.812.1
0.14.5.9
<.1.1
<.1.1.1
<.1<.1<.1-- <.1
.1
.1-- <.1
.1
.1<.1
.1<.1-- <.1
.1<.1
.2<.1<.1
.1-- <.1<.1
.1
.2
.1<.1
.1<.1<.1<.1
.1<.1
.1
.1
.1<.1<.1<.1
29012087
49049054088
20022040049010019014014012014025017019013054010086
110987677
11011010044
11010096
10088799596987592
10010075
1106259
2005534756979347566
14016047725056486288577362
180673658352626354643274442373235323234312934323935472922
38161362465315716540271.4
4716211941
1201206945745311228.8
1416874331
17032
8.51010121910137.1
18176.2
1311262245
4.52.41.63.94.65.01.44.04.04.24.61.43.52.43.03.63.84.13.27.02.83.79.11.22.01.81.31.03.42.52.38.21.91.51.51.33.22.12.12.21.51.40.901.02.93.43.02.05.1
6.837.107.357.086.936.957.327.377.407.186.997.157.387.027.217.307.347.857.757.207.417.257.007.427.227.197.497.407.237.327.307.417.177.267.267.377.317.447.357.347.317.157.447.207.317.227.247.407.48
[Map number is location in figure 32; µS/cm, microsiemens per centimeter at 25 degrees Celsius; mg/L, milligrams per liter; µg/L,micrograms per liter; --, data not collected]
TABLE 7.—Chemical analyses of selected constituents in water from wells sampled during investigation of the MidwesternBasins and Arches aquifer system, 1991–92

GEOCHEMISTRY C61
Well name Mapnumber
RossBirtBen Logan H.S.SearfossRifeSchoenbergerBeasleyHillGilligLamalieS-18FinneganWilsonSpencerStairFrancisAugustineRichardKernAuckermanRiceCity of WestonHartmanLacyHummelJonesHarrisonMartinLockhartMattinglyMerchantGatesBickfordBartlettDesoto SubstationStaggsIceUnderwoodCoheeEllisHarmonFoxSkilesJusticeLeeStarbuckGeradotStenzelRees
10 G10 S10 D15 G15 S15 D16 G16 S16 D17 G17 D18 D11 G11 S11 D12 S12 D13 G13 S13 D14 S14 D194 G4 S4 D3 S3 D2 G2 S2 D1 D5 G5 S5 D6 G6 S6 D7 G7 S7 D8 G8 D9 G9 S9 D222120
Bicarbonate,as HCO (mg/L)
3
Sulfate,as SO (mg/L)
4Sulfide(mg/L)
Chloride(mg/L)
Bromide(mg/L)
Silica(mg/L)
Dissolvedsolids,sum of
constituents(mg/L)
Iron(µg/L)
Strontium(µg/L)
Dissolvedorganiccarbon(mg/L)
53339738322426622934616817922228052828546349045447889
144283227196472432536466390397427410395407439476420412439441401421376472371377388440395371384
1,20024060
1,6001,6001,500
120850860
1,5001,600
19610180190170180
1,100750530440
1,9006533
1306.50.10<.10
4940281983437448425.0
406565
.404371856.9
1903016
<0.01<.01<.01
.02<.01
.01
.01<.01<.01
.020.351.1 .04.02
<.01.28
3.3 .02
<.0123.3 2.3 7.4 --
.03<.01<.01
.01
.01<.01
.02<.014.1 .02.02
<.01<.01
.03
.03
.02
.01<.01<.01
.11<.01<.011.8 .01.03.13
7.07.2
20 23 6.3
17 6.4
16 15 37 44 2.2
10 28 13 27
100 34 35
110 12 45
100 9.59.24.45.55.6
150 140 85
210 61 6.04.9
21 5.48.65.1
12 14 5.3
54 26 39 7.6
35 1.92.9
0.12.04.04.08.08.15.05.19.25.45.36.02.09.08.07.12.16.32.31.51.09.38
-- .06.09.04.10.04.09.20.06
1.20.04.02.02.03.03.04.02.01.03.03.06.04.07.05.05.02.04
22 11 10 17 17 16 13 12 12 17 12 7.2
15 15 20 16 16 11 8.46.5
13 9.09.5
19 20 15 16 20 12 14 14 7.0
15 18 15 20 17 16 17 16 16 19 17 18 15 10 15 16 11
1,930665427
2,4002,4302,340
4541,3301,3502,2702,490
4391,110
668702656784
1,6701,2401,150
8362,860
826416630402334344658603501694566459453439426383403452421393445442489368628357355
9,00043
5,2003,1002,100
5201,5002,2002,600
78012
2,700720
3,10077014
1,7009901352
350180
2,8002,2001,2001,4001,0001,6002,700
647
2,2002,3001,6001,9001,100
8902,0002,0001,8004,0002,1002,3001,700
81,500
370250
16,00013,0008,900
12,00012,00011,0004,400
14,00012,00013,00012,000
20017,0005,000
13,00027,0004,700
14,00022,00018,00017,00010,0007,1003,200
11,0001,300
620530220
1,1001,1001,800
4303,0005,2001,5004,8001,5001,6003,000
860930510190
1,5001,1005,3009,7002,400
2.0 1.0 .60
1.3 1.2 1.3 1.1 1.6 1.6 1.3 1.6 2.4 1.0 1.5 1.1 1.3 1.3 1.1 .80.90
1.5 1.0 3.8 1.1 1.7 1.3 1.7 1.6 1.0 1.0 1.1 1.4 .90
1.4 1.2 1.2 1.2 1.5 1.1 1.2 1.2 3.6 1.7 1.2 .90
1.0 1.8 1.3 1.6
[Map number is location in figure 32; µS/cm, microsiemens per centimeter at 25 degrees Celsius; mg/L, milligrams per liter; µg/L,micrograms per liter; --, data not collected]
TABLE 7.—Chemical analyses of selected constituents in water from wells sampled during investigation of the MidwesternBasins and Arches aquifer system, 1991–92—Continued

REGIONAL AQUIFER-SYSTEM ANALYSIS—MIDWESTERN BASINS AND ARCHESC62
Well name Mapnumber
RossBirtBen Logan H.S.SearfossRifeSchoenbergerBeasleyHillGilligLamalieS-18FinneganWilsonSpencerStairFrancisAugustineRichardKernAuckermanRiceCity of WestonHartmanLacyHummelJonesHarrisonMartinLockhartMattinglyMerchantGatesBickfordBartlettDesoto SubstationStaggsIceUnderwoodCoheeEllisHarmonFoxSkilesJusticeLeeStarbuckGeradotStenzelRees
10 G10 S10 D15 G15 S15 D16 G16 S16 D17 G17 D18 D11 G11 S11 D12 S12 D13 G13 S13 D14 S14 D194 G4 S4 D3 S3 D2 G2 S2 D1 D5 G5 S5 D6 G6 S6 D7 G7 S7 D8 G8 D9 G9 S9 D222120
δD(per mil)
Tritium(TU)
Carbon-14(percentmodern)
δ O(per mil)
18 δ C(per mil)
13 δ S,sulfate
(per mil)
34 δ S,sulfide
(per mil)
34
–8.35–8.60–8.55–8.10–8.00–8.10–8.55–7.90–7.85–8.40–8.45–9.05–7.95–8.15–8.15–8.20–8.05–9.65–9.90
–14.35–8.40
–10.05–8.45–7.85–7.70–7.90–7.15–7.40–7.50–7.40–7.40–6.95–7.70–7.60–7.75–7.75–7.45–7.40–7.65–7.65–7.65–7.25–7.75–7.65–7.75–7.40–7.75–7.60–7.50
–51.5–54.0–54.5–51.0–50.0–50.0–56.5–48.5–49.0–54.5–54.5–59.0–50.0–51.0–50.5–51.5–51.0–65.5–67.5–99.5–55.0–67.5–55.5–47.5–46.5–49.0–44.5–46.0–45.5–46.0–45.0–43.5–47.0–47.5–47.5–46.5–46.5–44.5–47.5–46.5–46.5–45.0–47.0–48.5–47.5–45.5–49.0–47.5–46.5
–14.9–14.2–14.1–16.6–15.4–15.7–13.2–14.7–13.7–10.8–8.5
–10.0–15.4–13.8–15.0–14.1–15.3–17.2–13.3–10.7–14.1–7.1–1.2
–14.6–14.9–14.3–12.7–14.4–14.1–13.8–13.8–11.0–14.9–14.4–13.8–14.5–15.0–15.6–14.7–15.1–14.2–8.8
–13.7–13.8–14.2–3.1
–16.2–14.9–17.9
–10.40–5.804.804.003.203.20
–9.60–7.60–9.6023.3026.70–3.20–9.20–9.80–7.701.50
–1.80.30
6.6029.004.40
25.9020.503.10
–7.90.40
-- -- 2.402.502.00-- –.80
–7.90–10.00–2.10–2.20--
–5.90–5.50–3.90-- 1.90–.203.00--
–8.109.405.50
-- -- -- -- -- -- -- -- -- --
–42.40–22.90
-- -- --
–53.20–51.50
-- --
–27.80–33.00–42.50
-- -- -- -- -- -- -- -- -- 2.2 -- -- -- -- --
–43.40-- -- -- --
–37.80-- --
–12.20-- --
–27.60
1.79.1
11.23.4<.1<.1<.1<.1<.1<.1<.1
.5<.1
10.96.2
11.610.6
.5<.1<.1<.1<.1
.63.0<.1<.1<.1<.1
16.919.114.1<.1
20.6.3.2
7.8.7
<.1.4
1.610.9<.1
20.018.115.0<.1
12.2<.1<.1
49.158.969.537.930.324.554.66.28.63.94.7
47.718.558.155.745.062.0-- 1.30.28.81.45.5
60.656.156.943.445.6
100.078.167.51.2
78.361.842.366.861.835.758.056.968.044.251.372.365.328.174.335.120.8
[Map number is location in figure 32; delta notation (δ) explained on p. C92; TU, tritium units; --, data not available]
TABLE 8.—Analyses of isotopes in water from wells sampled during investigation of the Midwestern Basins and Archesaquifer system, 1991–92

GEOCHEMISTRY C63
than the less productive glacial deposits, which were derivedfrom clay-rich lacustrine sediments.
Water from the carbonate-rock aquifer (fig. 34) ranges indissolved-solids concentration from 170 to more than350,000 mg/L. Where the carbonate-rock aquifer does notunderlie the upper confining unit, dissolved-solids concentra-tions range from 170 to 3,830 mg/L; the median is 560 mg/L.Ground water with dissolved-solids concentrations less than500 mg/L is present in many areas of the carbonate-rockaquifer where it is does not underlie the upper confining unit;however, it is found only locally in the northeastern part ofthe study area. Ground water with dissolved-solids concentra-tions between 500 and 1,000 mg/L is present primarily in thenortheastern part of the area. Water with dissolved-solidsconcentrations greater than 1,000 mg/L in the carbonate-rockaquifer where the upper confining unit is not present isrestricted to the northeastern part of the study area.
Dissolved-solids concentrations for the carbonate-rockaquifer where it underlies the upper confining unit also areshown in figure 34. Lines of equal dissolved-solids concen-tration are drawn for those areas in the basins where dis-
solved-solids concentrations are greater than 10,000 mg/L.The dissolved-solids concentration data for water in the struc-tural basins are from wells completed in oil- and gas-produc-ing zones within the carbonate rocks of Silurian andDevonian age. Dissolved-solids concentrations were com-puted either from chemical data of brines that were reportedin the literature or calculated from borehole geophysical data(D.J. Schnoebelen, U.S. Geological Survey, written com-mun., 1993).
The distribution of dissolved-solids concentrations in thecarbonate rocks differs greatly among the three structuralbasins (Appalachian, Michigan, and Illinois) in the Midwest-ern Basins and Arches Region:
Appalachian Basin—Dissolved-solids concentrationswithin the Appalachian Basin range from less than 10,000 togreater than 350,000 mg/L; all but two reported brine analy-ses list dissolved-solids concentrations greater than 200,000mg/L. The few analyses that are available from the Appala-chian Basin where the dissolved-solids concentrations areless than 100,000 mg/L indicate that the zone of transitionfrom freshwater to saltwater is narrow. Chloride concentra-
Data from Botoman and Faure (1976).a
a
a
a
Corenumber
Interval sampled(feet below land
surface)
546550557
G1G2G3G4G5
C1
C2
C3
C4
Geologic unitδ C
(per mil)
13δ S,sulfide
(per mil)
34δ S,sulfate
(per mil)
34
Detroit River Group-pyriteSalina Group-anhydriteLockport dolomite-pyrite
Glacial depositsGlacial depositsGlacial depositsGlacial depositsGlacial deposits
Columbus LimestoneSalina GroupSalina Group
Detroit River GroupSalina GroupSalina GroupSalina GroupSalina GroupSalina Group-bedded gypsumLockport Dolomite
Salamonie Dolomite
Salina GroupSalina Group-pyrite
------
3 – 255 – 60
18 – 7010 – 18012 – 130
235273 – 375425 – 575
35100150301350
320 – 465650
105
20 – 173173
-- 24.9--
–14.8–9.8–9.8–9.9–8.2
9.6–1.08.2
26.46.5–.7
28.39.2
28.714.6
18.3
–2.3--
–21.9-- 7.0
–13.1–14.6–12.8–8.0
–14.0
–24.9–7.8–1.9
–14.0–8.8–7.1–9.9
–10.0-- 2.4
3.6
–6.8–19.4
-- -- --
-- –.45–.05–.55.00
1.45-- --
-- .10
–3.20-- –.25-- 1.30
1.35
-- --
[Core locations shown in figure 32; delta notation (δ) explained on p. C92; --, data not available]
TABLE 9.—Analyses of sulfur and carbon isotopes in carbonate rocks and glacial deposits from the Midwestern Basins andArches Region

REGIONAL AQUIFER-SYSTEM ANALYSIS—MIDWESTERN BASINS AND ARCHESC64
84°86°
42°
40°
38°
Base from U.S. Geological Survey digital data,1:2,000,000, 1972
0 20
0 20 40 60 KILOMETERS
40 60 MILES
Lake Erie
Maumee
River
KalamazooRiver
St.
Joseph
River
San
dusk
yR
iver
Scio
to
River
Great
Mia
mi
Rive
r
OhioRiver
Ohio
Riv
er
Ohio
River
East
Fork
White
Whi
te
Riv
er
Wab
ash
River
Kankakee
River
River
Kentucky
River
Licking
River
LakeMichigan
LakeSt. Clair
Chicago
Indianapolis
Detroit
Columbus
Cincinnati
Toledo
Dayton
Evansville
Louisville
FortWayne
SouthBend
Frankfort
Lexington
Huntington
ILLIN
OIS
MICHIGAN
INDIANAOHIO
WEST
VIRGINIA
KENTUCKY
ONTARIO
UNIT
EDST
ATES
CAN
ADA
JJJJJJJJJJ
JJ
JJ
JJJJ JJJJJJJJJJ
JJ JJJJ
JJJJJJJJJJ
JJ
JJJJJJ
JJ JJJJ
JJJJ JJJJ JJ JJJJJJ JJJJ
JJ JJJJ
JJJJ JJJJJJJJJJ
JJ
JJ
JJJJJJJJ JJ JJJJJJ JJJJ JJJJ JJJJ JJJJJJ JJ JJ JJJJJJ JJJJ JJ
JJJJ JJJJ JJJJ JJJJ JJ
JJ
JJJJ JJJJ
JJJJ
JJ JJJJJJ
JJ JJ JJJJ JJ JJ
JJJJ
JJJJ
JJ
JJ JJ
JJJJ JJ
JJJJ
JJJJ
JJ
JJJJ
JJ
JJ
JJJJ
JJJJ
JJ
JJJJJJJJJJ
JJJJ JJJJ JJ
JJJJ JJ JJ
JJ JJJJJJJJJJ JJJJ JJJJ
JJ JJJJJJJJ JJJJ JJJJJJ JJJJ JJJJ JJ JJJJJJ JJJJJJ JJJJ JJJJ JJ JJJJJJ JJJJ JJJJJJ JJJJJJ JJ JJ JJJJ
JJJJ JJ JJJJ JJJJJJJJ JJ JJJJ JJ JJJJJJ JJ JJJJ JJ JJ JJJJJJJJJJ JJJJJJ JJJJ JJJJJJ JJJJ JJJJJJ JJJJ JJJJ JJ JJJJ JJJJ JJ JJJJ JJ JJJJJJ JJJJ JJJJ JJJJJJ JJJJ JJ JJJJ JJJJ JJJJJJ JJJJJJJJ JJJJ JJJJ JJJJ JJ JJJJ JJJJ JJ JJJJJJ JJ JJ JJ JJJJ JJJJ JJJJ JJ JJJJ JJJJ JJJJ JJJJ JJ JJJJ JJ JJJJJJ JJJJ
JJ JJJJJJJJ JJJJ
JJJJJJJJJJJJ JJJJ
JJJJJJ
JJJJ JJ JJ
JJJJJJJJ JJ JJ
JJJJ JJ JJ JJ
JJ JJJJ JJJJ
JJJJ JJ JJJJ JJJJJJJJJJ JJJJ JJJJ
JJJJJJ
JJ JJJJ JJ JJJJ JJJJJJ JJJJJJ JJJJ JJJJJJ JJJJ
JJJJ JJ JJJJ JJJJ JJJJJJJJ
JJJJ JJ JJJJJJ JJJJJJJJ JJJJ JJJJ JJ JJJJJJ JJ JJJJ JJ JJJJJJ JJJJ JJJJ
JJJJ JJJJJJ JJJJJJ JJ
JJ JJJJ JJ JJ JJJJ JJ JJJJ JJ JJ
JJJJJJ JJJJJJJJ JJJJ JJJJJJ JJ JJJJ JJJJ JJ JJJJ JJ
JJJJJJJJJJJJ JJ
JJ JJJJ JJ JJ JJ JJJJJJJJ JJJJ JJ JJJJJJ JJ JJJJJJ JJJJJJ JJ JJJJ JJJJ JJJJJJ JJJJJJJJ JJJJJJ JJJJ JJJJ
JJ JJ JJJJ JJJJ JJJJ JJJJJJ JJJJ JJJJJJJJ JJJJ JJJJJJ JJ JJJJJJ JJJJ JJJJ JJJJ JJ
JJ JJ
JJ
JJ
JJJJJJ
JJJJ JJJJ JJ JJJJ
JJJJJJ
JJJJ JJJJJJJJ
JJ JJJJJJJJJJJJJJ
JJJJJJJJJJ JJ JJJJ
JJJJ JJ JJJJJJJJJJJJ JJJJ JJJJJJJJ JJJJ JJJJ JJJJ
JJJJ
JJJJ JJ JJ
JJJJJJ
JJJJ
JJJJ
JJJJ
JJ
JJ JJ
JJ
JJ
JJ JJ JJJJ
JJJJJJ JJ
JJJJ
JJJJJJ
EXPLANATION
Dissolved solids concentration, in milligrams per liter
Less than or equal to 500
Greater than 500 and less than or equal to 1,000
Greater than 1,000JJJJ
JJ
FIGURE 33.—Dissolved-solids distribution in ground water from the glacial aquifers in the Midwestern Basins and Arches aquifer system.

GEOCHEMISTRY C65
84°86°
42°
40°
38°
Base from U.S. Geological Survey digital data,1:2,000,000, 1972
0 20
0 20 40 60 KILOMETERS
40 60 MILES
Lake Erie
Maumee
River
KalamazooRiver
St.
Joseph
River
San
dusk
yR
iver
Scio
to
River
Great
Mia
mi
Rive
r
OhioRiver
Ohio
Riv
er
Ohio
River
East
Fork
White
Whi
te
Riv
er
Wab
ash
River
Kankakee
River
River
Kentucky
River
Licking
River
LakeMichigan
LakeSt. Clair
Chicago
Indianapolis
Detroit
Columbus
Cincinnati
Toledo
Dayton
Evansville
Louisville
FortWayne
SouthBend
Frankfort
Lexington
Huntington
ILLIN
OIS
MICHIGAN
INDIANAOHIO
WEST
VIRGINIA
KENTUCKY
ONTARIO
UNIT
EDST
ATES
CAN
ADA
JJ
JJJJJJ
JJJJJJJJJJJJJJJJ JJJJJJ
JJJJ
JJJJ
JJJJ
JJJJJJJJJJ
JJ
JJJJJJJJJJJJJJJJJJJJJJJJJJJJJJJJJJ
JJ
JJJJJJJJJJ
JJ
JJJJ JJ JJ JJ
JJ
JJ
JJJJJJJJJJJJ
JJ
JJJJJJJJ JJJJJJJJJJJJJJJJJJJJJJJJJJJJJJ
JJJJJJJJJJJJJJJJJJJJJJJJJJJJJJJJJJJJJJJJJJJJ JJ
JJJJJJJJJJJJ JJ
JJJJ
JJ
JJJJ
JJJJ
JJ
JJ
JJ
JJ
JJJJJJJJJJJJJJJJ JJJJJJJJJJJJJJ
JJJJJJJJ
JJJJJJ
JJ
JJJJJJ
JJ
JJJJ
JJJJ JJ
JJJJJJJJJJJJ
JJJJJJ JJJJJJJJ JJ
JJ JJ
JJ JJ
JJJJ
JJ JJJJ
JJ JJJJ
JJJJ
JJJJJJJJJJJJ
JJ
JJJJJJJJ JJJJJJJJJJJJJJJJ
JJJJJJ
JJ JJJJ
JJJJ
JJ
JJ
JJJJJJ JJJJJJ JJJJJJJJJJ
JJJJJJ
JJJJ
JJ
JJJJJJ JJJJ
JJ
JJJJJJJJ
JJJJ
JJJJ
JJ JJJJJJJJJJJJ
JJJJJJJJJJJJ JJJJJJJJ
JJJJJJJJJJ
JJ
JJ
JJJJJJ
JJ
JJ
JJ
JJ
JJ
JJ
JJ
JJ
JJ
JJ
JJ
JJ
JJ JJJJ
JJ
JJ
JJJJJJ
JJ
JJ
JJ
JJ
JJ
JJ
JJJJ
JJJJ
JJJJJJ
JJJJ
JJJJJJ
JJ JJ JJJJ JJJJJJJJ
JJ
JJJJ JJ
JJJJ
JJJJ
JJJJ
JJJJ
JJ
JJ
JJ
JJ
JJ JJ JJ
JJ
JJ
JJJJ
JJJJ
JJJJ
JJ
JJ
JJ
JJJJ
JJJJ
JJJJJJ
JJJJ
JJJJ
JJJJJJ JJ
JJ
JJJJJJ
JJ
JJJJ
JJ
JJ
JJ
JJ JJJJJJ
JJ
JJ
JJJJ
JJJJ
JJ
JJ
JJ
JJJJJJ
JJ
JJ
JJJJ JJJJJJJJJJJJJJ
JJJJJJJJ
JJJJ
JJ
JJ JJ
JJJJ
JJ
JJJJ
JJ
JJ JJ
JJ
JJJJJJJJJJJJ
JJJJJJJJ
JJJJJJJJ JJ
JJJJ
JJJJJJ
JJJJ JJJJJJJJ JJ
JJ
JJ
JJ
JJ
JJ
JJ
JJ
JJ JJJJJJ
JJ JJJJ JJ
JJ
JJ
JJ JJJJ
JJ
JJ
JJ
JJ
JJ
JJ
JJ JJ
JJ
JJ
JJ
JJ
JJ
JJ
JJ
JJJJ
JJ
JJJJ
JJJJJJ JJ
JJ JJ JJ
JJJJ
JJ JJJJJJ
JJJJ
JJ
JJ
JJ
JJ
JJ
JJJJ
JJ
JJJJ
JJ
JJ
JJJJJJJJJJJJJJ
JJJJ
JJ
JJ
JJ
JJ
JJ
JJ
JJ
JJ JJ
JJJJJJ JJ
JJ
JJ
JJ
JJJJ
JJ
JJ
JJJJ
JJ
JJ JJJJ
JJJJJJ
JJ
JJ
JJ
JJJJ JJ
JJJJ
JJ
JJ
JJ
JJ
JJJJ
JJJJJJ
JJJJ JJJJ
JJJJ
JJ
JJ
JJ
JJ
JJ
JJ
JJ
JJ
JJ
JJJJ
JJJJ
JJ
JJ
JJ
JJ
JJ
JJ
JJJJ
JJJJ
JJ
JJ
JJJJ
JJ JJJJJJ
JJ
JJJJ
JJJJ
JJ
JJ JJJJ JJJJJJ JJ
JJ
JJJJ
JJJJ
JJ
JJ
JJJJ
JJJJJJ
JJJJ JJJJJJJJJJ
JJ
JJ JJJJ
JJ
JJ
JJ
JJ
JJ
JJJJJJ JJJJ
JJ
JJ
JJ
JJ
JJ JJ
JJ
JJJJJJ
JJJJJJ
JJ JJ
JJ
JJ
JJ JJ JJJJ
JJ JJJJJJJJJJ
JJJJ
JJJJJJ
JJJJ
JJ
JJ
JJ
JJ
JJJJ
JJ
JJ
JJ
300,000
100,000
10,000
10,000
100,00
0
10,0
00
100,
000
300,0
00
EXPLANATION
Dissolved solids concentration, in milligrams per liter
Less than or equal to 500
Greater than 500 and less than or equal to 1,000
Greater than 1,000 and less than or equal to 3,000
Greater than 3,000 and less than or equal to 10,000
Greater than 10,000
Subcrop area of the carbonate- rock aquifer
Line of equal dissolved-solids concentration— Dashed where approximately located. Interval, in milligrams per liter, is variable
10,000
JJJJJJJJ
JJ
FIGURE 34.—Dissolved-solids distribution in ground water from the carbonate-rock aquiferin the Midwestern Basins and Arches aquifer system.

REGIONAL AQUIFER-SYSTEM ANALYSIS—MIDWESTERN BASINS AND ARCHESC66
tions increase from less than 50 to greater than 9,300 mg/Lwithin approximately 7 mi downbasin from where the car-bonate-rock aquifer becomes confined above by the upperconfining unit (Schmidt, 1979).
Michigan Basin—In the Michigan Basin, dissolved-solidsconcentrations of water from carbonate rocks of Devonianand Silurian age range from less than 10,000 to greater than350,000 mg/L. The transition zone from freshwater to highlyconcentrated brine is comparatively wider than in the Appala-chian Basin. Brines with dissolved-solids concentrationsgreater than 350,000 mg/L in the Michigan Basin are firstnoted more than 75 mi downbasin from the contact betweenthe carbonate-rock aquifer and the upper confining unit,where it is exposed at the bedrock surface, whereas similarlyconcentrated brines in the Appalachian Basin are found lessthan 50 mi downbasin from where the carbonate rocks areconfined.
Illinois Basin—Dissolved-solids concentrations of waterfrom carbonate rocks of Devonian and Silurian age in the Illi-nois Basin range from less than 3,000 to greater than 100,000mg/L. The contrast in the distribution of dissolved-solids con-centrations between the Illinois Basin and the Appalachianand Michigan Basins is striking. The largest dissolved-solidsconcentrations in the Illinois Basin are approximately150,000 mg/L, much lower than in the other two basins.Water with dissolved-solids concentrations less than 10,000mg/L is found more than 70 mi downbasin from where thecarbonate-rock aquifer dips beneath the upper confining unit.
Generally, the dissolved-solids concentration of water instructural basins increases with depth. In the MidwesternBasins and Arches aquifer system, dissolved-solids concen-trations increase as the carbonate rocks dip toward the centerof each structural basin (fig. 34). However, the relationbetween dissolved-solids concentration and depth is not con-sistent among the three basins. In the Appalachian and Michi-gan Basins, water with dissolved-solids concentrations ofapproximately 10,000 mg/L is first noted where the carbonaterocks are about 300 to 800 ft below land surface; in the Illi-nois Basin, water with dissolved-solids concentrations ofapproximately 10,000 mg/L is first noted where the carbonaterocks are more than 2,000 ft below land surface. The presenceof dilute water at such depths in the Illinois Basin is unusualand has been investigated by various researchers (Clayton andothers, 1966; Rupp and Pennington, 1987; Stueber and oth-ers, 1987; and Stueber and Walter, 1991). Several hypotheseshave been advanced to explain the presence of the dilute for-mation water at the margins of the Illinois Basin and include(1) dilution of formation water by meteoric water of Pleis-tocene age, (2) precipitation of solid phases during mixing offormation water with meteoric water, and (3) increased infil-tration through fracture systems within the carbonate rocks.The origin of dilute formation water in the carbonate rocks ofDevonian and Silurian age is unclear, and further research isnecessary to explain more fully the chemical and hydrologi-
cal processes that have occurred in the Illinois Basin.Although water with dissolved-solids concentrations less than10,000 mg/L is potentially potable (U.S. Environmental Pro-tection Agency, 1984), the dilute formation water is producedas a by-product of oil and gas production and is not used as asource of drinking water.
The only regionally extensive areas of water with dis-solved-solids concentrations greater than 10,000 mg/L in theMidwestern Basins and Arches aquifer system are beneaththe upper confining unit in the structural basins. However, ina small area along Lake Erie near the mouth of the SanduskyRiver, ground water from the carbonate-rock aquifer containsdissolved-solids concentrations ranging from 10,000 togreater than 70,000 mg/L (Breen and Dumouchelle, 1991).Breen and Dumouchelle (1991) evaluated bromide and chlo-ride data and concluded that the source of salinity in this areais halite dissolution. Although Janssens (1977) states that theextensive halite beds found in the Salina Group in easternOhio disappear more than 50 mi east of where the salinewater is present, the data indicate that perhaps an isolatedremnant of bedded halite may be present in the carbonaterocks in this area. All other available data indicate that waterwith dissolved-solids concentrations less than 10,000 mg/L isfound throughout the total thickness of the carbonate-rockaquifer where it does not underlie the upper confining unit.Data are not available, however, in the northern part of thestudy area where the thickness of the carbonate-rock aquiferincreases to more than 2,500 ft. Dilute ground water may notbe present at depth in this area.
HYDROCHEMICAL FACIES
Identification of hydrochemical facies in the MidwesternBasins and Arches aquifer system was based on the distribu-tion of water types in the glacial and carbonate-rock aquifers.Water types were defined by use of the trilinear plotting tech-nique (Piper, 1944); the trilinear diagrams are shown in fig-ures 35 and 36.
The seven water types that were identified in the Mid-western Basins and Arches aquifer system and their abun-dance are listed in table 10. The two most abundant watertypes in the glacial aquifers and in the carbonate-rock aquiferwhere it does not underlie the upper confining unit areCa-Mg-HCO3 and Ca-Mg-SO4 types. Nearly 80 percent of allavailable ground-water analyses from the glacial and carbon-ate-rock aquifers would be classified as either of these twowater types. The next most common ground-water types areCa-Mg-Na-HCO3 and Ca-Mg-Na-SO4 and are distinguishedfrom the more common Ca-Mg-HCO3 and Ca-Mg-SO4waters by an increased percentage of dissolved sodium. TheCl-influenced ground-water type, present in small but notablequantities, is distinguished by chloride percentages that rangefrom at least 20 percent to no more than 60 percent of thetotal anion milliequivalents. Na-Cl or Ca-Na-Cl type water

GEOCHEMISTRY C67
100
80
60
40
20
0
80
60
40
20
0
20
40
60
80
100
80
60
40
20
0
20
40
60
80
100
0 20 40 60 80 100
0
20
40
60
80
100
020406080100
0
20
40
60
80
100
0
20
40
60
80
100
CALCIUM
PERCENT OF TOTAL MILLIEQUIVALENTS PER LITER
SODIUM + POTASSIUM
CARB
ONAT
E +
BICA
RBON
ATE
CHLORIDE
MAG
NESIU
M
SULF
ATE
+ CH
LORI
DECALCIUM
+ MAGNESIUM
SULFATE
A
EXPLANATION
Dissolved-solids concentration, in milligrams per liter
Less than or equal to 500
Greater than 500 and less than or equal to 1,000
Greater than 1,000
FIGURE 35.—Trilinear diagram of water chemistry of the Midwestern Basins and Arches aquifer system, categorized by dissolved-solidsconcentration: (A) glacial aquifers.

REGIONAL AQUIFER-SYSTEM ANALYSIS—MIDWESTERN BASINS AND ARCHESC68
100
80
60
40
20
0
80
60
40
20
0
20
40
60
80
100
80
60
40
20
0
20
40
60
80
100
0 20 40 60 80 100
0
20
40
60
80
100020406080100
0
20
40
60
80
100
0
20
40
60
80
100
CALCIUM
PERCENT OF TOTAL MILLIEQUIVALENTS PER LITER
SODIUM + POTASSIUM
CARB
ONAT
E +
BICA
RBON
ATE
CHLORIDE
MAG
NESIU
M
SULF
ATE
+ CH
LORI
DECALCIUM
+ MAGNESIUM
SULFATE
B
EXPLANATION
Dissolved-solids concentration, in milligrams per liter
Less than or equal to 500
Greater than 500 and less than or equal to 1,000
Greater than 1,000 and less than or equal to 3,000
Greater than 3,000 and less than or equal to 10,000
Greater than 10,000
FIGURE 35.—CONTINUED. Trilinear diagram of water chemistry of the Midwestern Basins and Arches aquifer system, categorized bydissolved-solids concentration: (B) carbonate-rock aquifer where it does not underlie the upper confining unit.

GEOCHEMISTRY C69
100
80
60
40
20
0
80
60
40
20
0
20
40
60
80
100
80
60
40
20
0
20
40
60
80
100
0 20 40 60 80 100
0
20
40
60
80
100
020406080100
0
20
40
60
80
100
0
20
40
60
80
100
CALCIUM
PERCENT OF TOTAL MILLIEQUIVALENTS PER LITER
SODIUM + POTASSIUM
CARB
ONAT
E +
BICA
RBON
ATE
CHLORIDE
MAG
NESIU
M
SULF
ATE
+ CH
LORI
DE
CALCIUM + M
AGNESIUM
SULFATE
EXPLANATION
Appalachian basin
Michigan basin
Illinois basin
FIGURE 36.—Trilinear diagram of water chemistry in the carbonate-rock aquifer of the Midwestern Basins and Arches aquifer systemwhere it underlies the upper confining unit, categorized by structural basin.

REGIONAL AQUIFER-SYSTEM ANALYSIS—MIDWESTERN BASINS AND ARCHESC70
predominates in the carbonate-rock aquifer where it underliesthe upper confining unit; however, this water type is rare inother parts of the carbonate-rock aquifer and in the glacialaquifers. Na-HCO3 water is uncommon in the aquifer system.
Hydrochemical facies (figs. 37 and 38) were identified forthe glacial and carbonate-rock aquifers on the basis of thespatial distribution of water types in table 10. Large areas ofthe Midwestern Basins and Arches aquifer system are charac-terized by the presence of either the Ca-Mg-HCO3 or the Ca-Mg-SO4 type; these areas are called Ca-Mg-HCO3 facies andCa-Mg-SO4 facies, respectively. The remaining areas of theaquifer system are not characterized by a single water type;rather, they are distinguished by the presence of either Ca-Mg-HCO3 water or Ca-Mg-SO4 water or both types, alongwith water types with increased percentages of sodium (Ca-Mg-Na-HCO3, Ca-Mg-Na-SO4, and Na-HCO3 waters) and,in some places, sodium and chloride (Na-Cl and Cl-influ-enced waters). These areas where several different watertypes are present together are called multiple-water-typefacies.
Hydrochemical facies of water from glacial aquifers areshown in figure 37. A Ca-Mg-HCO3 facies in the glacial aqui-
fers extends throughout much of the Midwestern Basins andArches Region. A facies of Ca-Mg-SO4 water is present inthe northeastern part of the aquifer system. Multiple-water-type facies are present in the glacial aquifers along the northand northwest boundaries between the underlying carbonate-rock aquifer and the upper confining unit. Another multiple-water-type facies is present in the south-central part of thestudy area where the glacial deposits are directly underlain byOrdovician-age shales and limestones (the upper weatheredzone water-bearing unit).
Hydrochemical facies of water from the carbonate-rockaquifer are shown on figure 38. Ca-Mg-HCO3 water ispresent in the carbonate-rock aquifer throughout much of theMidwestern Basins and Arches aquifer system except in thenortheastern part, where it is highly localized. The predomi-nant water type in the northeastern part of the study area isCa-Mg-SO4. Multiple-water-type facies are present in thecarbonate-rock aquifer along the north boundary between thecarbonate-rock aquifer and the upper confining unit. Anothermultiple water-type facies is present along a part of the westcontact between the carbonate-rock aquifer and the upperconfining unit.
Total number of samples from the glacial aquifers is 637.Total number of samples from the carbonate-rock aquifer where it does not underlie the upper confining unit is 539.Total number of samples from the carbonate-rock aquifer where it underlies the upper confining unit is 85.
1
2
3
1
2 3
Water type Cation types Anion types Glacialaquifers
Carbonate-rock aquifer
Number (percentage) of samples, by aquifer
Does not underlie theupper confining unit
Underlies the upperconfining unit
Ca,Ca-Mg
Ca, Ca-Mg
Ca-Mg-Na,Ca-Na
Ca-Mg-Na,Ca-Na
Na
Na, Ca-Na,Ca-Mg-Na
All cation types
479(75%)
69(11%)
55(9%)
11(2%)
3(<1%)
2(<1%)
18(3%)
215(40%)
207(38%)
44(8%)
41(8%)
9(2%)
3(<1%)
20(4%)
1(1%)
2(2%)
2(2%)
--
--
79(93%)
1(1%)
Ca-Mg-HCO
Ca-Mg-SO
Ca-Mg-Na-HCO
Ca-Mg-Na-SO
Na-HCO
Na-Clor Ca-Na-Cl
Cl-influenced
3
4
3
4
3
HCO
HCO -SOSO
HCO
HCO -SO , SO
HCO
Cl
HCO -SO -Cl,HCO -Cl,
SO -Cl4
3
43
3
3 4 4
3
4
43
3
[%, percent; --, data not available]
TABLE 10.—Major water types, their specific cation and anion compositions, and their abundance in the glacial andcarbonate-rock aquifers in the Midwestern Basins and Arches aquifer system

GEOCHEMISTRY C71
84°86°
42°
40°
38°
Base from U.S. Geological Survey digital data,1:2,000,000, 1972
0 20
0 20 40 60 KILOMETERS
40 60 MILES
Lake Erie
Maumee
River
KalamazooRiver
St.
Joseph
River
San
dusk
yR
iver
Scio
to
River
Great
Mia
mi
Rive
r
OhioRiver
Ohio
Riv
er
Ohio
River
East
Fork
White
Whi
te
Riv
er
Wab
ash
River
Kankakee
River
River
Kentucky
River
Licking
River
LakeMichigan
LakeSt. Clair
Chicago
Indianapolis
Detroit
Columbus
Cincinnati
Toledo
Dayton
Evansville
Louisville
FortWayne
SouthBend
Frankfort
Lexington
Huntington
ILLIN
OIS
MICHIGAN
INDIANAOHIO
WEST
VIRGINIA
KENTUCKY
ONTARIO
UNIT
EDST
ATES
CAN
ADA
JJJJJJJJ JJ
JJ
JJ
JJJJ
JJJJ
JJ
JJJJ JJJJJJJJJJ JJJJ JJ JJJJ JJ JJ
JJ JJJJJJJJJJ JJJJ JJJJ JJ JJ JJ JJJJJJJJ JJJJ JJJJJJ JJJJ JJJJJJ JJ JJJJJJ JJJJJJ JJJJ JJJJ JJ JJJJJJJJ JJJJ JJJJJJ JJJJJJJJ JJ JJ JJJJJJ JJJJJJ JJ JJJJ JJJJJJJJ JJ JJJJ JJ JJJJJJ JJJJ JJJJ JJ JJ JJJJJJJJ JJJJJJ JJJJJJ JJ JJJJJJ JJJJJJ JJJJ JJJJJJ JJJJ JJJJ JJ JJJJ JJJJ JJ JJJJ JJ JJJJJJ JJJJ JJJJ JJJJJJ JJJJ JJ JJJJ JJJJ JJJJ JJJJ JJJJJJJJ JJJJ JJJJ JJJJJJ JJJJ JJJJ JJ JJJJJJ JJ JJ JJ JJJJ JJJJ JJJJJJ JJJJ JJJJJJ JJJJ JJJJ JJ JJJJJJ
JJ JJ JJJJJJ JJJJ JJ JJJJJJJJ JJJJJJJJJJJJJJ JJJJ JJJJ JJJJJJJJ JJJJJJ
JJJJ JJJJ JJJJJJ JJ JJ
JJ JJJJJJJJJJ JJ JJJJJJ JJ JJ JJJJJJ JJ
JJ JJ JJ JJJJJJJJ JJJJJJ JJJJJJ JJJJJJ JJJJJJ JJJJJJ JJ JJJJ JJ JJJJJJ JJJJJJ JJJJJJ JJ JJJJ JJ JJJJJJJJ JJJJ JJJJ JJJJ JJJJJJ JJJJJJ JJJJ JJJJ JJJJ JJ JJJJ JJJJ JJJJJJJJ JJJJJJ JJ JJJJJJ JJJJJJJJ JJJJ JJJJ JJ JJJJJJ JJ JJJJ JJ JJJJ JJJJJJ JJJJ JJJJJJ JJ JJJJJJJJ JJJJJJ JJ JJJJ JJ JJJJ JJ JJ JJJJ JJJJJJ JJJJJJ JJJJ JJJJ JJJJJJJJ JJ JJJJ JJJJJJ JJ JJJJ JJ JJJJ JJ JJJJ JJJJ JJJJJJJJJJ JJJJ JJJJ JJ JJJJ JJ JJJJJJ JJJJ JJ JJJJ JJ JJJJJJ JJ JJJJJJ JJ JJJJJJ JJ JJJJ JJJJ JJ JJJJJJ JJJJJJJJ JJJJJJ JJJJ JJJJJJ JJ JJJJ JJJJ JJJJ JJJJJJ JJJJ JJJJJJJJ JJ JJJJ JJJJJJ JJ JJJJJJ JJJJ JJJJ JJJJ JJ
JJJJJJ
JJ
JJJJ
JJJJJJJJ JJJJ JJJJ JJ JJJJJJJJJJ
JJJJJJ JJJJJJ JJJJ JJ JJJJJJJJ JJJJJJJJJJJJJJ JJJJ JJ JJJJJJ JJJJJJJJ JJ JJJJJJJJ JJJJJJ JJJJ JJJJ JJJJJJJJJJ JJ JJJJ JJJJ JJ JJJJJJ JJ
JJJJ JJ JJJJJJ
JJ JJJJJJ JJJJJJJJJJJJ JJJJ JJ
JJ JJJJ JJJJ
JJJJ JJJJJJ
JJ JJJJ JJ
JJ
JJJJ
JJ JJ JJJJJJJJ JJ JJJJJJ JJ
JJJJ JJJJJJ JJ JJJJJJ
JJ JJ
JJ
JJJJJJ
Multi
ple wate
r-
type fa
cies
Ca–Mg–HCO
facies
Multi
plew
ate
r-ty
pe
faci
es
Ca–Mg–SO
facies
Multiple
water-type
facies
3
4
EXPLANATION
JJ
Subcrop area of the carbonate-rock aquifer
Hydrochemical-facies boundary—Dashed where approximately located
Well for which chemical analysis is available
FIGURE 37.—Hydrochemical facies of ground water from the glacial aquifers in the Midwestern Basins and Arches aquifer system.

REGIONAL AQUIFER-SYSTEM ANALYSIS—MIDWESTERN BASINS AND ARCHESC72
84°86°
42°
40°
38°
Base from U.S. Geological Survey digital data,1:2,000,000, 1972
0 20
0 20 40 60 KILOMETERS
40 60 MILES
Lake Erie
Maumee
River
KalamazooRiver
St.
Joseph
River
San
dusk
yR
iver
Scio
to
River
Great
Mia
mi
Rive
r
OhioRiver
Ohio
Riv
er
Ohio
River
East
Fork
White
Whi
te
Riv
er
Wab
ash
River
Kankakee
River
River
Kentucky
River
Licking
River
LakeMichigan
LakeSt. Clair
Chicago
Indianapolis
Detroit
Columbus
Cincinnati
Toledo
Dayton
Evansville
Louisville
FortWayne
SouthBend
Frankfort
Lexington
Huntington
ILLIN
OIS
MICHIGAN
INDIANAOHIO
WEST
VIRGINIA
KENTUCKY
ONTARIO
UNIT
EDST
ATES
CAN
ADA
JJJJ
JJJJ
JJ
JJ
JJ
JJJJ
JJ
JJJJJJ JJJJ
JJ JJJJ
JJJJJJ JJ JJJJ JJ
JJJJJJJJJJ
JJ
JJ
JJJJ
JJ
JJ
JJJJ
JJ
JJ
JJ
JJ
JJ
JJ
JJJJ
JJ
JJ
JJJJ
JJ
JJ
JJ
JJJJJJJJ
JJJJ
JJ
JJ JJ
JJ
JJ
JJ
JJ
JJJJ
JJJJ
JJ
JJJJ
JJ
JJJJ
JJ
JJ
JJ
JJJJ
JJ JJ
JJ
JJ
JJ
JJ
JJ
JJJJ
JJ JJ
JJ
JJJJ
JJ
JJ JJJJ
JJJJJJ JJ
JJJJ JJJJJJJJ
JJJJ JJ
JJJJJJJJ
JJJJJJ
JJ
JJ
JJ
JJ
JJ
JJJJJJJJ
JJ
JJJJ JJJJ
JJJJJJ
JJ
JJJJ
JJ
JJ
JJ
JJ
JJJJJJJJJJJJJJ
JJJJ
JJ
JJ
JJ
JJ
JJ
JJ
JJ
JJ
JJ JJ
JJ
JJJJ
JJ
JJJJJJJJJJ
JJJJJJJJJJ
JJJJJJ JJJJ
JJ
JJ
JJ
JJ
JJ
JJJJ
JJ JJ JJ JJ JJJJJJ
JJJJ
JJ
JJJJ JJ JJ
JJJJ
JJJJ JJ
JJ
JJ
JJJJJJ
JJ
JJ JJ
JJJJ
JJJJJJJJJJJJJJ
JJ
JJ
JJJJ
JJ JJ
JJJJ
JJ
JJ
JJ
JJ
JJJJ
JJ
JJJJ JJ
JJJJJJ
JJ
JJ
JJJJ JJ JJ
JJJJJJJJ
JJ
JJJJ JJ
JJJJ
JJJJ
JJ
JJ
JJ
JJJJ
JJJJJJ
JJJJJJ JJJJ
JJJJ
JJ JJ
JJ
JJJJ
JJJJ JJ
JJ
JJ
JJ
JJ
JJJJ
JJ
JJJJ
JJJJ
JJJJJJJJ JJJJJJ JJJJJJ
JJJJJJ
JJJJ
JJJJJJJJJJJJ JJ JJ JJJJJJJJJJJJ
JJ
JJJJ
JJJJ
JJJJ JJJJ
JJ
JJ
JJJJ
JJJJ
JJJJ
JJ
JJJJ
JJ
JJ
JJ JJJJ
JJJJJJJJ JJ
JJ
JJ JJ
JJ
JJJJJJJJ JJJJJJ
JJ
JJ
JJJJ
JJ
JJJJJJJJ
JJJJJJ
JJ
JJ
JJ
JJ
JJ JJJJ JJ
JJ
JJJJ JJJJ
JJJJ
JJJJJJ
JJJJ
JJJJ
JJ
JJJJJJ
JJ JJJJJJJJJJJJJJ JJ
JJJJJJJJJJJJJJ
JJ JJJJJJJJJJJJJJ
JJJJJJJJ
JJJJJJJJJJJJJJ
JJJJ
JJ
JJJJJJ
JJ
JJ
JJ
JJ JJJJJJ
JJJJ
JJ
JJJJ
JJ
JJ
JJJJ
JJJJ
JJJJJJ JJJJJJJJ
JJ
JJJJ
JJ JJ
JJ
JJJJ
JJ
JJ
JJ
JJJJJJ
JJ
JJJJ
JJ
JJ
JJ
JJ
JJJJJJJJJJ
JJJJJJ
JJ
JJJJJJ JJ
JJJJ JJJJJJJJ
JJJJJJ
JJJJJJJJ
JJJJ
JJJJ JJJJJJ
JJ
JJJJJJ JJJJ
JJ
JJ
JJ
JJJJ
JJ
JJ
JJJJJJ
JJJJ JJJJ
JJ
JJ JJ
JJ
JJJJ JJJJJJJJ JJJJJJJJ JJJJ JJJJJJ JJJJJJJJJJ
JJJJJJ JJJJJJ JJJJ JJJJ JJJJJJ JJJJJJ JJ JJ
JJ
JJ
JJJJ JJ
JJ
JJ
JJ
JJJJJJJJJJ
JJJJ
JJ
JJJJ
JJ
JJ
JJ
JJJJ
JJ
Na–Cl and Ca–Na–Cl facies
Multiple water-type facies
Multi
ple
wate
r-type
faci
es
C
a–M
g–SO
facies
Na–Cl
facies
Na–Ca–Cl
facies
Ca–Mg–
HCO
facies
Ca–Mg–HCO
facies
4
Ca–Mg–HCO
facies
3
3
3
EXPLANATION
Subcrop area of the carbonate-rock aquifer
Hydrochemical-facies boundary—Dashed where approximately located
Well for which chemical analysis is available
FIGURE 38.—Hydrochemical facies of ground water from the carbonate-rock aquifer in the Midwestern Basins and Arches aquifer system.

GEOCHEMISTRY C73
Water in the carbonate-rock aquifer in the AppalachianBasin is predominantly the Na-Ca-Cl type with nearly equalmilliequivalent percentages of Na and Ca. In the MichiganBasin, water is either a Na-Cl or Ca-Na-Cl type, dependingon the specific bedrock unit within the carbonate rocks fromwhich the water is produced. The predominant water type inthe Illinois Basin is Na-Cl; however, an area of Ca-Mg-Na-HCO3 water is present in the basin as far as 15 miles downdipfrom where the carbonate-rock aquifer becomes confined.
RELATION BETWEEN DISSOLVED-SOLIDS CONCENTRATIONS AND HYDROCHEMICAL FACIES
Examination of figures 33, 34, 37, and 38 indicates astrong relation between the distribution of dissolved-solidsconcentrations and the distribution of hydrochemical facies inthe glacial and carbonate-rock aquifers. The trilinear dia-grams (figs. 35 and 36) of water from the glacial aquifers andthe carbonate-rock aquifer, where it is does not underlie theupper confining unit, also show that water type changes asdissolved-solids concentrations change. The Ca-Mg-HCO3water found throughout the aquifer system is characterized bydissolved-solids concentrations that are generally less than500 mg/L. Ca-Mg-SO4 water has dissolved-solids concentra-tions that range from about 500 to more than 3,000 mg/L. Asfigure 35 shows, dissolved-solids concentrations increase asthe percentage of sulfate in water increases. The dissolved-solids concentrations of ground water in the multiple-water-type facies are varied, as one would expect given the variabil-ity in water types in such facies.
Water type and dissolved-solids concentrations are alsorelated in the carbonate-rock aquifer where it underlies theupper confining unit. Ground water from the carbonate-rockaquifer in each of the surrounding structural basins is catego-rized by basin on the trilinear diagram in figure 36. Based onthe available analyses, waters from the Appalachian Basinhave dissolved-solids concentrations that are generallygreater than 200,000 mg/L and are Na-Ca-Cl type waters.Waters from the Michigan Basin range in dissolved-solidsconcentration from around 10,000 mg/L to more than300,000 mg/L; water type changes from a Na-Cl to a Ca-Na-Cl as dissolved-solids concentrations increase. The dissolved-solids concentration in waters from the Illinois Basin is gen-erally less than 100,000 mg/L, and the waters are primarily ofthe Na-Cl type.
Examination of figures 33, 34, 37, and 38 indicates thatthe spatial distribution of dissolved-solids concentrations andhydrochemical facies in the glacial and carbonate-rock aqui-fers is similar. The similarity likely reflects the hydraulic con-nection between the units. Ground water can flow through theglacial deposits and into the bedrock, then can discharge tostreams and lakes back through the glacial deposits. More-over, the source rock of the glacial deposits in the region isprimarily the underlying bedrock (Strobel and Faure, 1987).Thus, the similarity in chemistry is also likely due to the pres-
ence of the same reacting mineral phases in the glacial andcarbonate-rock aquifers.
GEOCHEMICAL AND HYDROLOGICAL PROCESSES, BY WATER TYPE
The trends in major-ion chemistry in the MidwesternBasins and Arches aquifer system are controlled, in a largepart, by interactions between ground water and minerals thatcompose the aquifers. Important geochemical reactions thatcan affect solute concentrations in ground-water systemsinclude mineral dissolution and precipitation, oxidation andreduction, and ion exchange. Additional processes such asevaporation and mixing of water from various sources canalso be important controls of solute concentrations. Theextent to which these processes control ground-water chemis-try is affected by the paths and rates of ground-water flow andthe sequence of reactions in an aquifer system. The geochem-ical and hydrologic processes responsible for the variouswater types in the Midwestern Basins and Arches aquifer sys-tem are discussed in the following sections.
CALCIUM-MAGNESIUM-BICARBONATE WATER
Ca-Mg-HCO3 water, the predominant type in the glacialand carbonate-rock aquifers, is generally produced by disso-lution of the carbonate minerals calcite and dolomite. Thereaction of calcite and dolomite with water and carbon diox-ide can be written as follows:
CaCO3 + H2O + CO2 <--> Ca2+ + 2HCO3- (4)
(calcite)
CaMg(CO3)2 + 2H2O + 2CO2 <--> Ca2+ + Mg2+ + 4HCO3- (5)
(dolomite)
Typically, CO2 is derived from the oxidation of organic mat-ter and root respiration in the soil zone and is dissolved byrecharge water. Dolomite is more abundant than calcite in theaquifer system (Harrison, 1960; Steiger and Holowaychuk,1971; Wilding and others, 1971; Casey, 1994); if dolomitedissolves according to equation 5, the molar proportions of[Ca+Mg] to [HCO3] should be linear, with a slope of 0.5. Afairly strong relation exists between [Ca+Mg] and [HCO3]for Ca-Mg-HCO3 type water from the glacial and carbonate-rock aquifers (figs. 39 and 40); however, the Ca-Mg-SO4 andCa-Mg-Na-SO4 water types do not follow the trend predictedby the dolomite dissolution model and are highly enriched incalcium and magnesium relative to bicarbonate ([Ca+Mg]/[HCO3] > 0.5). The Ca-Mg-Na-HCO3 waters plot slightlybelow the line and are depleted in calcium and magnesiumrelative to bicarbonate ([Ca+Mg]/[HCO3] < 0.5). (The mech-anism by which calcium and magnesium are depleted is ion

REGIONAL AQUIFER-SYSTEM ANALYSIS—MIDWESTERN BASINS AND ARCHESC74
exchange of calcium and magnesium for sodium and is dis-cussed in the section on “Sodium-Enriched Water.”)
The state of equilibrium between ground water and cal-cite, dolomite, and other minerals in the aquifer system canbe evaluated by the computation of saturation indices (SI),expressed as
SI mineral = log (IAP/KT), (6)
where IAP is the ion-activity product of the mineral calcu-lated from analytical data, and KT is the thermodynamic equi-librium constant at the measured temperature of the watersample (Plummer and others, 1976). If the saturation index isnegative, the water is undersaturated with respect to the par-ticular mineral, and dissolution of the mineral is possible. Ifthe saturation index is positive, the water is oversaturatedwith respect to the mineral, and precipitation of the mineral inthe aquifer is possible. A saturation index of zero indicatesthat the mineral is in equilibrium with the water and that thetendency or rates of dissolution and precipitation should beequal. Thermodynamics can only indicate the potential for
such phase transfers. In reality, various kinetic factors maycause systems to behave differently than predicted (Nord-strom and Ball, 1989; Busby and others, 1991).
Saturation indices were calculated for calcite and dolo-mite (and other mineral phases discussed later in this report)by use of the computer model WATEQF (Plummer and oth-ers, 1976) and chemical data for the water collected as part ofthis investigation. The accuracy of the saturation index forpredicting equilibrium of carbonate minerals depends largelyon the accuracy of the field measurements of pH and alkalin-ity. Uncertainty in these and other analytical data produces anuncertainty estimate in the saturation index of + 0.1 for cal-cite and + 0.2 for dolomite (Nordstrom and Ball, 1989; Busbyand others, 1991). Because the accuracy of the pH measure-ments could not be verified for much of the historical ground-water-chemistry data, saturation indices were not calculatedfor historical samples.
The saturation indices for calcite and dolomite generallydo not correlate with dissolved-solids concentrations (fig.41). Nearly all the Ca-Mg-HCO3 water is in equilibrium oroversaturated with respect to calcite and dolomite, an indica-
0
2
4
6
8
10
12
14
16
18
20
0 2 4 6 8 10 12 14BICARBONATE, IN MILLIMOLES PER LITER
CALC
IUM
PLU
S M
AGN
ESIU
M, I
N M
ILLI
MOL
ES P
ER L
ITER
Theoretical dolomitedissolution line
EXPLANATION
Major water type
Ca-Mg-HCO water
Ca-Mg-SO water
Ca-Mg-Na-HCO water
Ca-Mg-Na-SO water
3
4
3
4
FIGURE 39.—Concentration of calcium plus magnesium as a function of bicarbonate concentration in ground water from the glacialaquifers in the Midwestern Basins and Arches aquifer system.

GEOCHEMISTRY C75
tion that carbonate mineral equilibria could be controllingconcentrations of calcium, magnesium, and bicarbonate inCa-Mg-HCO3 water in the aquifer system. The tendencytoward oversaturation with respect to calcite has been notedin other aquifers by Nordstrom and Ball (1989), who con-clude that kinetic effects may inhibit calcite precipitation.Reactions that add calcium, magnesium, and bicarbonate orthat consume carbon dioxide can promote oversaturation withcalcite and dolomite. For example, dissolution of gypsummay add calcium at a rate that exceeds calcium removal bycalcite precipitation, causing oversaturation with calcite. Sev-eral Ca-Mg-SO4-type waters are saturated with calcite but aresignificantly undersaturated with respect to dolomite. Under-saturation with respect to dolomite is an important factor indedolomitization, a process that can promote the formation ofCa-Mg-SO4-type water. (Dedolomitization is discussed fur-ther in the next section.)
Ca-Mg-HCO3 water is the predominant water type in theglacial and carbonate-rock aquifers because calcite and dolo-mite are abundant in these aquifers (Harrison, 1960; Steiger
and Holowaychuk, 1971; Wilding and others, 1971; Casey,1994) and recharge takes place across most of the study area.A steady supply of CO2 is available for carbonate dissolutionin the glacial aquifers because ground-water recharge gener-ally takes place through the organic-rich soils overlying thesedeposits. Dissolved CO2 and other solutes are also rechargedto the underlying bedrock because the glacial aquifers pro-vide most of the recharge to the carbonate-rock aquifer at theregional scale.
CALCIUM-MAGNESIUM-SULFATE WATER
The predominant water type in the northeastern part of theMidwestern Basins and Arches aquifer system is Ca-Mg-SO4.This water is characterized by high concentrations of dis-solved solids, calcium, magnesium, and sulfate. The predom-inance of sulfate over bicarbonate and the lack of agreementof the Ca-Mg-SO4 water with the simple dolomite dissolutionmodel (figs. 39 and 40) indicates that other processes are con-trolling the chemistry of this water type. Two reactions canproduce this type of water: (1) dedolomitization, which
0
5
10
15
20
25
0 2 4 6 8 10BICARBONATE, IN MILLIMOLES PER LITER
CALC
IUM
PLU
S M
AGN
ESIU
M, I
N M
ILLI
MOL
ES P
ER L
ITER
Theoretical dolomitedissolution line
EXPLANATION
Major water type
Ca-Mg-HCO water
Ca-Mg-SO water
Ca-Mg-Na-HCO water
Ca-Mg-Na-SO water
3
4
3
4
FIGURE 40.—Concentration of calcium plus magnesium as a function of bicarbonate concentration in ground water from the carbonate-rock aquifer in the Midwestern Basins and Arches aquifer system.

REGIONAL AQUIFER-SYSTEM ANALYSIS—MIDWESTERN BASINS AND ARCHESC76
–0.2
0
–0.1
0.2
0.1
0.3
0.4
0 1,000 2,000 3,000DISSOLVED-SOLIDS CONCENTRATION, IN MILLIGRAMS PER LITER
SATU
RATI
ON IN
DEX
–0.8
–0.4
–0.6
0
–0.2
0.2
0.4
0 1,000 2,000 3,000DISSOLVED-SOLIDS CONCENTRATION, IN MILLIGRAMS PER LITER
SATU
RATI
ON IN
DEX
Upper error limit
Equilibrium
Lower error limit
Upper error limit
Equilibrium
Lower error limit
DOLOMITE
CALCITE
EXPLANATION
Major water type
Ca-Mg-HCO water
Ca-Mg-SO water
Ca-Mg-Na-HCO water
Ca-Mg-Na-SO water
3
4
3
4
FIGURE 41.—Saturation indices of calcite and dolomite as a function of dissolved-solids concentration for water from wells in theMidwestern Basins and Arches aquifer system. (Error limits are due to analytical and thermodynamic data uncertainties.
Points plotting within these lines are considered to be in equilibrium with the given mineral.)

GEOCHEMISTRY C77
involves dissolution reactions with carbonate minerals andgypsum, and (2) sulfuric acid neutralization, which involvesdissolution of carbonate minerals with sulfuric acid generatedby the oxidation of pyrite.
The results of investigations of other regional carbonate-rock aquifers show that dedolomitization may be a control-ling process (Pearson and Rightmire, 1980; Back and others,1983; Busby and others, 1991). Ground water that movesthrough the aquifer initially dissolves calcite, dolomite andgypsum (or anhydrite). Once calcite and dolomite reach satu-ration, gypsum is still undersaturated and continues to dis-solve, adding calcium and sulfate to the water. Consequently,calcite becomes oversaturated and, as it precipitates, thebicarbonate concentration decreases. The decrease in bicar-bonate concentration causes the water to be undersaturatedwith respect to dolomite and promotes dissolution of dolo-mite. Dissolution of dolomite causes increases in the concen-
tration of magnesium in the water. The overall reaction can bewritten as:
CaMg(CO3)2(s) + CaSO4 . 2H2O(s) + H+ ↔
(dolomite) (gypsum)
CaCO3(s) + Ca2+ + Mg2+ + SO42- + HCO3
- + 2H2O. (7) (calcite)
As the reaction proceeds, Ca:Mg ratios in the water decreaseto 1.0, and sulfate concentrations increase. The ratio of[Ca+Mg]/[HCO3] is 1:1, in contrast to reaction 5, in whichthe ratio of [Ca+Mg]/[HCO3] is 1:2 or 0.5. On a plot of[Ca+Mg] as a function of [SO4 + 0.5HCO3], the dedolomiti-zation reaction yields a straight line with a slope of 1. Plots ofthe water-chemistry data for the glacial aquifers (fig. 42) andthe carbonate-rock aquifer (fig. 43) show very close agree-
0
4
2
8
6
10
12
18
14
0 2 4 12 14 16 18 20 24SULFATE PLUS ONE-HALF BICARBONATE, IN MILLIGRAMS PER LITER
CALC
IUM
PLU
S M
AGN
ESIU
M, I
N M
ILLI
MOL
ES P
ER L
ITER
Theoretical dedolomitizationtrend line
16
20
6 8 10
EXPLANATION
Major water type
Ca-Mg-HCO water
Ca-Mg-SO water
Ca-Mg-Na-HCO water
Ca-Mg-Na-SO water
3
4
3
4
FIGURE 42.—Concentration of calcium plus magnesium as a function of concentration of sulfate plus one-half bicarbonate in ground waterfrom the glacial aquifers in the Midwestern Basins and Arches aquifer system.

REGIONAL AQUIFER-SYSTEM ANALYSIS—MIDWESTERN BASINS AND ARCHESC78
ment between the theoretical trend for the dedolomitizationmodel and the trends for the Ca-Mg-HCO3- and the Ca-Mg-SO4-type waters. The Ca-Mg-Na-HCO3- and Ca-Mg-Na-SO4-type waters tend to plot below the 1:1 line.
Gypsum saturation indices for ground water collected aspart of this investigation (fig. 44) increase with increasingsulfate concentrations. A value of + 0.2 is used as the estimateof uncertainty in the saturation index of gypsum. Saturationwith respect to gypsum generally is indicated for a few sam-ples in which sulfate concentrations are greater than about1,500 mg/L. Gypsum would tend to dissolve in water that isundersaturated with respect to gypsum.
Dedolomitization is not the only process, however, thatyields the relation between Ca, Mg, SO4, and HCO3 shown infigures 42 and 43. An alternative model involves dissolution
of dolomite by sulfuric acid (H2SO4) produced by the oxida-tion of pyrite (FeS2):
FeS2 + 15/4 O2 + 7/2 H2O ↔ Fe(OH)3(s) 2H2SO4 (8)
(Nordstrom and others, 1979). The sulfuric acid reacts withdolomite:
CaMg(CO3)2(s) + H2SO4 ↔ Ca2+ + Mg2+ + SO42- + 2HCO3
-. (9)
The overall stoichiometry of the dissolved products in reac-tion 9 is identical to that of the dedolomitization reaction (7).Thus, either model could produce the trends shown in figures42 and 43, and gypsum and (or) pyrite could be the sources ofsulfate in the Ca-Mg-SO4 water in the northeastern part of theaquifer system.
0
5
10
15
0 5 15 20 25SULFATE PLUS ONE-HALF BICARBONATE, IN MILLIGRAMS PER LITER
CALC
IUM
PLU
S M
AGN
ESIU
M, I
N M
ILLI
MOL
ES P
ER L
ITER
20
25
10
Theoretical dedolomitizationtrend line
EXPLANATION
Major water type
Ca-Mg-HCO water
Ca-Mg-SO water
Ca-Mg-Na-HCO water
Ca-Mg-Na-SO water
3
4
3
4
FIGURE 43.—Concentration of calcium plus magnesium as a function of concentration of sulfate plus one-half bicarbonate in ground waterfrom the carbonate-rock aquifer in the Midwestern Basins and Arches aquifer system.
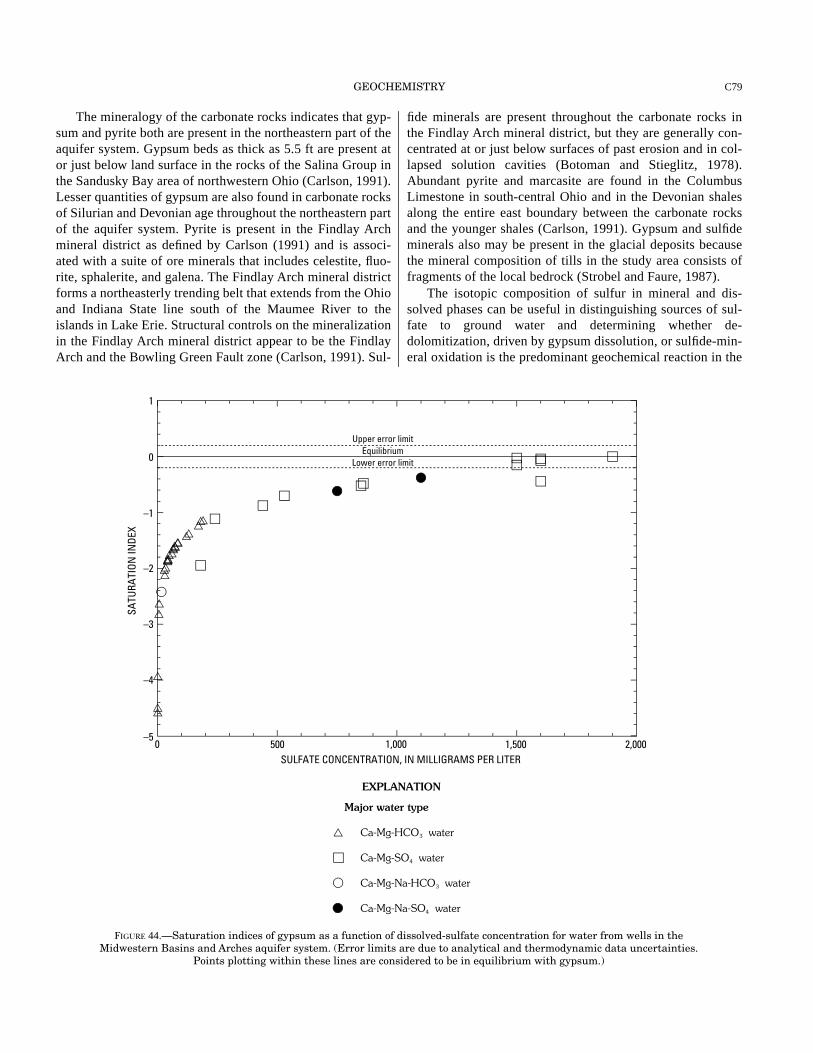
GEOCHEMISTRY C79
The mineralogy of the carbonate rocks indicates that gyp-sum and pyrite both are present in the northeastern part of theaquifer system. Gypsum beds as thick as 5.5 ft are present ator just below land surface in the rocks of the Salina Group inthe Sandusky Bay area of northwestern Ohio (Carlson, 1991).Lesser quantities of gypsum are also found in carbonate rocksof Silurian and Devonian age throughout the northeastern partof the aquifer system. Pyrite is present in the Findlay Archmineral district as defined by Carlson (1991) and is associ-ated with a suite of ore minerals that includes celestite, fluo-rite, sphalerite, and galena. The Findlay Arch mineral districtforms a northeasterly trending belt that extends from the Ohioand Indiana State line south of the Maumee River to theislands in Lake Erie. Structural controls on the mineralizationin the Findlay Arch mineral district appear to be the FindlayArch and the Bowling Green Fault zone (Carlson, 1991). Sul-
fide minerals are present throughout the carbonate rocks inthe Findlay Arch mineral district, but they are generally con-centrated at or just below surfaces of past erosion and in col-lapsed solution cavities (Botoman and Stieglitz, 1978).Abundant pyrite and marcasite are found in the ColumbusLimestone in south-central Ohio and in the Devonian shalesalong the entire east boundary between the carbonate rocksand the younger shales (Carlson, 1991). Gypsum and sulfideminerals also may be present in the glacial deposits becausethe mineral composition of tills in the study area consists offragments of the local bedrock (Strobel and Faure, 1987).
The isotopic composition of sulfur in mineral and dis-solved phases can be useful in distinguishing sources of sul-fate to ground water and determining whether de-dolomitization, driven by gypsum dissolution, or sulfide-min-eral oxidation is the predominant geochemical reaction in the
–4
–5
–2
–3
–1
0
1
0 500 1,000 1,500 2,000SULFATE CONCENTRATION, IN MILLIGRAMS PER LITER
SATU
RATI
ON IN
DEX
Upper error limitEquilibrium
Lower error limit
EXPLANATION
Major water type
Ca-Mg-HCO water
Ca-Mg-SO water
Ca-Mg-Na-HCO water
Ca-Mg-Na-SO water
3
4
3
4
FIGURE 44.—Saturation indices of gypsum as a function of dissolved-sulfate concentration for water from wells in theMidwestern Basins and Arches aquifer system. (Error limits are due to analytical and thermodynamic data uncertainties.
Points plotting within these lines are considered to be in equilibrium with gypsum.)

REGIONAL AQUIFER-SYSTEM ANALYSIS—MIDWESTERN BASINS AND ARCHESC80
aquifer system (Pearson and Rightmire, 1980). The sulfurisotope data presented in tables 8 and 9 and discussed morefully in the section “Sulfur Isotopes” indicate that pyrite isthe primary sulfate source for the glacial and carbonate-rockaquifers in most of the aquifer system; however, both pyriteand gypsum contribute sulfate to the Ca-Mg-SO4-type groundwater in the northeastern part of the aquifer system.
Deering and others (1988) noted that the chemistry ofground water in the carbonate-rock aquifer in northwesternOhio is established chiefly by the mineralogy of the carbonaterocks. Other researchers (Norris and Fidler, 1973; Norris,1974) have discussed the distribution of water types in west-ern Ohio in the context of chemical evolution of bicarbonate-dominated water to sulfate-dominated water as ground waterflows down the potentiometric gradient from the potentiomet-ric high near the Bellefontaine Outlier to Lake Erie and to theOhio River. The results of the ground-water flow model pre-sented in the “Numerical Model” section, however, indicatethat water in the aquifer system does not follow long, contin-uous paths from the highest potentiometric levels to LakeErie or the Ohio River. Rather, ground-water recharge anddischarge areas alternate across western Ohio. Thus, it islikely that the distribution of Ca-Mg-SO4 water in the north-eastern part of the aquifer system is primarily controlled bythe mineralogy of the aquifer material.
The relatively large area of Ca-Mg-HCO3 water withinthe Ca-Mg-SO4 facies in the carbonate-rock aquifer in north-western Ohio corresponds to an area of thin or absent glacialdeposits where the Lockport dolomite, a relatively pure dolo-mite (Janssens, 1977), crops out at the surface (fig. 5). TheCa-Mg-HCO3 water also generally corresponds to areas ofactive ground-water recharge (fig. 28). Breen andDumouchelle (1991) showed that, in northwestern Ohio,water in the carbonate-rock aquifer where the glacial depositsare thin or absent has tritium concentrations indicative ofrecharge since the 1950’s. Thus, active ground-water flushingfavors the formation of Ca-Mg-HCO3 water in the carbonate-rock aquifer in the northeastern part of the study area where itis at or near the surface and recharge to the aquifer systemoccurs.
SODIUM-ENRICHED WATER
Multiple-water-type facies described in the preceding sec-tion (figs. 37 and 38), are characterized by the presence ofone or more of the following ground-water types: Ca-Mg-Na-HCO3, Ca-Mg-Na-SO4, and Na-HCO3. Many researchershave shown that an increase in sodium concentration inground water without an associated increase in chloride canbe caused by cation exchange of Ca2+ and Mg2+ ions for Na+
ions on clay minerals (Foster, 1950; Back, 1966; Freeze andCherry, 1979; Thorstenson and others, 1979; Chapelle andKnobel, 1983). In an aquifer system with abundant carbonate
minerals, cation exchange may be accompanied by the disso-lution of calcite and dolomite.
Na-HCO3 water can be produced from Ca-Mg-HCO3waters by cation exchange on clay minerals according to thereaction:
(1-x) Ca2+ + x Mg2+ + Na2 . Ex ---> 2Na+ + (Ca1-xMgx)
. Ex,(10)
where 0 < x < 1. By combining reactions 4, 5, and 10, theoverall stoichiometry of dissolution of calcite and dolomiteand cation exchange may be represented as:
(Ca1-xMgx)CO3 + H2O + CO2 + Na2 . Ex ---> 2Na+ +2HCO3
-
+ (Ca1-xMgx) . Ex. (11)
As Ca2+ and Mg2+ are removed from solution and arereplaced with Na+ by cation exchange, the solution becomesundersaturated with respect to calcite and dolomite. The car-bonate minerals dissolve, providing more Ca2+ and Mg2+ insolution to exchange with Na+ and causing HCO3
- concentra-tions to increase. The Ca-Mg-Na-HCO3 water in figures 39and 40 plots below the line predicted by the dolomite-dissolu-tion model; this pattern, which indicates that the water isenriched in bicarbonate and depleted in calcium and magne-sium relative to the dolomite dissolution model, is consistentwith cation-exchange reactions. Ca-Mg-Na-SO4 water isassociated with Ca-Mg-SO4 water in the glacial and carbon-ate-rock aquifers and is likely formed by the mixing of Na-HCO3 and Ca-Mg-SO4 waters or incomplete cation exchangeof the Ca-Mg-SO4 waters. The Ca-Mg-Na-SO4 water doesnot plot with the Ca-Mg-Na-HCO3 water in figures 39 and 40because of the additional calcium and magnesium from dedo-lomitization (7) or sulfuric acid neutralization (9).
Eberts and others (1990) and Lesney (1992) describe thepresence of water ranging in composition from Ca-Mg-Na-HCO3 to Na-HCO3 in bedrock units underlying shales andsiltstones of Mississippian age in northeastern Ohio. Theirresearch attributes this chemistry to mixing of Na-HCO3water, produced by cation exchange in the shales and silt-stones, with water in the underlying aquifers. A similar watercomposition of Ca-Mg-Na-HCO3 to Na-HCO3 is present inthe carbonate-rock aquifer in the Midwestern Basins andArches aquifer system where the carbonate-rock aquifer isoverlain by Devonian shales (upper confining unit) along themargins of the Michigan Basin. This similarity indicates thatNa- and HCO3-enriched water produced by cation exchangein the shales is mixing with water in the underlying carbon-ate-rock aquifer. However, significant areas of Ca-Mg-Na-HCO3 water, associated with some Na-HCO3 water, arepresent in the carbonate-rock aquifer and the glacial aquiferswhere shales do not overlie the carbonate-rock aquifer southof the boundary between the aquifer and the upper confiningunit. If Na-HCO3 water from the upper confining unit is thesource of Na-enriched water south of this boundary, then it

GEOCHEMISTRY C81
must have flowed in an updip direction out of the shales andinto the adjacent carbonate-rock aquifer and associated gla-cial deposits.
Research on regional aquifers in the northern Midwest(Siegel and Mandle, 1984; Siegel, 1989, 1991) suggests amechanism by which Na-HCO3 water produced by cationexchange in the shales at the margin of the Michigan Basinmay have moved into the carbonate-rock aquifer. On the basisof distributions of solutes and isotopes in water from theCambrian-Ordovician aquifer in eastern Wisconsin, Siegel(1989, 1991) proposed that loading of glacial ice duringPleistocene glaciation may have reversed ground-water flowgradients and caused ground water from within the MichiganBasin to discharge at the west margin of the Michigan Basinin eastern Wisconsin. A numerical model that simulatedground-water flow during Late Wisconsinan glaciation innorthern Illinois (Filley, 1985) showed that increased porepressures may have caused water from within the MichiganBasin to discharge at the basin margins. Panno and Bourcier(1990) proposed that the formation of karst features in car-bonate rocks adjacent to the Appalachian, Michigan, and Illi-nois Basins was caused by mixing of ground water and deep-basin saline water that was flushed from the basins duringPleistocene glaciation. A similar flow of ground water out ofthe Michigan Basin during the Pleistocene may have occurredat its southern margin, pushing through the Devonian shalesand emplacing Na-HCO3 water in the carbonate-rock aquiferand overlying glacial aquifers.
An alternative hypothesis for the presence of multiple-water-type facies along the northern boundary of the carbon-ate-rock aquifer and upper confining unit is cation exchangewithin the glacial and carbonate-rock aquifers. Some bedrockunits within the Salina Group and carbonate rocks of Devo-nian age in northern Indiana and northwestern Ohio containnumerous thin shales (Janssens, 1977; Turner, 1977; Dohenyand others, 1975). Cation exchange within these shale-richcarbonate rocks may result in the formation of Na-enrichedwater. Mazor and others (1993) suggest that significant differ-ences in water composition in an area indicate that water maybe stored in distinct pockets within an aquifer and that suchpockets are caused by changes in lithology. Thus, the pres-ence of multiple-water-type facies may be the result of a tran-sitional bedrock lithology in the aquifer along the subcropboundaries.
The Ca-Mg-Na-HCO3 water found along the west sub-crop boundary of the carbonate-rock aquifer is not associatedwith Na-HCO3 water, nor is it as enriched in sodium as theCa-Mg-Na-HCO3 water along the north subcrop boundary ofthe carbonate-rock aquifer. The Ca-Mg-Na-HCO3 waterfound in the carbonate-rock aquifer beyond the west bound-ary of the carbonate-rock aquifer and upper confining unitincreases in chloride concentration in a downdip directionand most likely results from mixing of Ca-Mg-HCO3 waterwith Na-Cl water from the Illinois Basin.
The multiple-water-type facies in the glacial aquifers inthe south-central part of the study area is associated with thearea where Ordovician shales and limestones (the upperweathered zone water-bearing unit) directly underlie the gla-cial deposits. Most of the water in this facies is the Ca-Mg-HCO3 type; however, some ground water that is enriched insodium or chloride or both is present in this area. Research onglacial buried-valley aquifers in the Great Miami River Valley(Dumouchelle and others, 1993) indicates two potentialsources of sodium and chloride to the glacial aquifers. In theGreat Miami River Valley, shallow ground water in highlypermeable outwash valleys contains elevated concentrationsof sodium and chloride that are related to human activities.Moreover, small amounts of moderately saline Na-Cl waterdischarges from the shale bedrock to the glacial aquifers inthe Great Miami River Valley. Thus, sodium and chloridefrom both sources may be affecting the chemistry of water inthe glacial aquifers in the south-central part of the aquifersystem.
Water with elevated percentages of sodium and chloride isalso present in the carbonate-rock aquifer where it is notoverlain by the upper confining unit. Na-Cl or Cl-influencedground water is uncommon in the carbonate-rock aquifer;most of the few areas of such water are within the multiple-water-type facies that borders the Michigan Basin. Possiblesources of sodium and chloride to these ground watersinclude the dissolution of halite from the carbonate rocks,mixing with small amounts of formation brine from deeperbedrock units, or surface contamination by water affected byroad-deicing salts or formation brine associated with petro-leum exploration and production activities (Breen andDumouchelle, 1991). The presence of Na-Cl water in the car-bonate-rock aquifer along the margin of the Michigan Basinmay also be related to the hydrodynamic displacement ofbrine by Pleistocene glaciation.
In summary, the exact geochemical and hydrologic pro-cesses responsible for the multiple-water-type facies areunknown, especially along the north boundary of the Mid-western Basins and Arches aquifer system. The distributionof water types in the multiple-water-type facies however, isclearly related to the change in lithology, from carbonaterocks to shales, at the boundaries of the carbonate-rock aqui-fer. The multiple-water-type facies along the margin of theMichigan Basin may also be related to changes in the ground-water flow regime during Pleistocene glaciation.
SODIUM-CHLORIDE AND CALCIUM-SODIUM-CHLORIDE WATER
Na-Cl type water with dissolved-solids concentrationsless than 10,000 mg/L is present in the carbonate-rock aquiferbeneath the upper confining unit at the margins of the struc-tural basins. Its presence likely results from mixing of fresh-water with brines from within the basins. Processesresponsible for the chemistry of brines in the Illinois, Michi-
REGIONAL AQUIFER-SYSTEM ANALYSIS—MIDWESTERN BASINS AND ARCHESC82
gan, and Appalachian Basins are complex (Stueber and oth-ers, 1987; Lowry and others, 1988; Walter and others, 1990;Stueber and Walter, 1991; Stueber and others, 1993; Wilsonand Long, 1993a, b) and are beyond the scope of this report.Na-Cl, Na-Ca-Cl and Ca-Na-Cl type waters with dissolved-solids concentrations greater than 10,000 mg/L are presentjust beyond the boundary between the carbonate-rock aquiferand the upper confining unit in the Michigan and AppalachianBasins, an indication that the upper confining unit preventswater from recharging the carbonate-rock aquifer in theseareas. The presence of water with dissolved-solids concentra-tions less than 10,000 mg/L in the Illinois Basin more than 70mi downdip from the boundary of the carbonate-rock aquiferand the upper confining unit may be related to present or pastpatterns of flow in the carbonate-rock aquifer. Results of theregional ground-water flow model show that a small percent-age of water may flow from the subcrop area down into theIllinois Basin. Such water could contribute to the current dis-tribution of solutes. Other research on Illinois Basin brines(Clayton and others, 1966; Rupp and Pennington, 1987; Stue-ber and Walter, 1991) suggests that dilution of the brines mayhave occurred as a result of increased infiltration throughfracture systems in the carbonate rocks or from meltwaterthat recharged the carbonate-rock aquifer during the Pleis-tocene. The origin of low dissolved-solids water deep in theIllinois Basin is uncertain, and more research would beneeded for a full understanding of this part of the aquifer sys-tem.
INSIGHTS INTO REGIONAL FLOW PROVIDED BY GEOCHEMICAL DATA
Ground-water samples were collected from the glacialand carbonate-rock aquifers along four general directions ofregional ground-water flow, as determined from the potentio-metric surface map of the carbonate-rock aquifer (fig. 12).The locations of the sampling points are shown in figure 32.The data are listed in tables 7 and 8. Although the regionalground-water flow model indicates that ground water in theMidwestern Basins and Arches aquifer system does not fol-low long paths from the highest regional potentiometric lev-els to the lowest regional potentiometric levels, it is useful toevaluate the differences in ground-water chemistry along thegeneral directions of regional ground-water flow.
MAJOR SOLUTES
Dissolved-solids and sulfate concentrations have beenused as indicators of chemical evolution of ground water invarious regional-scale carbonate-rock aquifers, such as theFloridan aquifer in Florida, the Edwards aquifer in Texas, andthe Madison aquifer in parts of Montana, South Dakota andWyoming (Plummer, 1977; Rye and others, 1981; and Busbyand others, 1991). In these aquifers, concentrations of dis-
solved solids and sulfate generally increase along the princi-pal directions of regional ground-water flow. Figures 45 and46 show dissolved-solids and sulfate concentrations alonggeochemical sections A-A’, B-B’, C-C’ and D-D’ in the Mid-western Basins and Arches aquifer system. In general, noconsistent systematic change in dissolved-solids and sulfateconcentrations is evident along the geochemical sections. Thedeep bedrock wells along section C-C’ are the only subset ofthe data indicating consistent increases in dissolved-solidsand sulfate concentrations in the direction of regional flow.This general absence of systematic trends in chemistry alongthe general directions of regional ground-water flow indicatesthat the aquifer system is not characterized by long flow pathsthat are isolated from additions of recharge, as have been pos-tulated for regional carbonate-rock aquifers in other parts ofthe United States.
Figures 45 and 46 also can be used to compare the chem-istry of ground water from the glacial aquifers and the car-bonate-rock aquifer. In general, dissolved-solids and sulfateconcentrations in the glacial and carbonate-rock aquifers aresimilar. The only notable exception to this is sample 10G (fig.32) from a glacial aquifer, which has considerably higher dis-solved-solids and sulfate concentrations than samples 10Sand 10D from the carbonate-rock aquifer.
In addition, figures 45 and 46 show the relation of chem-istry between ground water from the shallow bedrock wellsand ground water from the deep bedrock wells. In general,the dissolved-solids and sulfate concentrations in groundwater from shallow bedrock wells were similar to those inground water from deep bedrock wells. The exceptions arewells 4S and 4D and wells 14S and 14D. Of all the wellsshown in figure 32, the wells that show the largest variationsin ground-water chemistry with aquifer type or depth at a sin-gle sampling location (well groups 4, 10, and 14) are in thegroups that have the greatest distance between the wells.Apparent variations with depth may be more related to spatialvariability than to specific differences with depth.
ISOTOPES
Interpretation of isotopic data can often provide moreinsight into chemical and hydrologic processes than can beprovided by interpretation of chemical data alone. The isoto-pic composition of ground water can be used to distinguishbetween competing reactions that contribute dissolved sulfurand carbon to water, to examine the possibility of differentwater masses mixing in an aquifer, and to estimate the rela-tive or absolute ages of ground water in different parts of anaquifer system. Consequently, isotopic data can provide anindependent confirmation of the interpretations made fromthe hydrologic and chemical data.
In this investigation, the stable isotopes δ34S (for the sul-fate and sulfide phases), δ18O, δD, δ13C and the radioactiveisotopes 14C and tritium were measured in ground water

GEOCHEMISTRY C83
0 10 20 30 40 50 60 70 80 90 100APPROXIMATE DISTANCE FROM REGIONAL POTENTIOMETRIC HIGH, IN MILES
0
1,000
2,000
3,000
0
1,000
2,000
3,000
300
400
500
600
700
200
400
600
800
DISS
OLVE
D-SO
LIDS
CON
CEN
TRAT
ION
, IN
MIL
LIGR
AMS
PER
LITE
R
0 10 20 30 40 50 60 70 80 90
0 10 20 30 40 50 60 70 80
0 10 20 30 40 50 60 70 80
A' A
B' B
C' C
D D'
EXPLANATION
Glacial aquifers—Points not connected if data are missing
Carbonate-rock aquifer
Shallow
Deep
FIGURE 45.—Dissolved-solids concentration in water from wells in the Midwestern Basins and Arches aquifer system along geochemicalsections A–A', B–B', C–C', and D–D' (locations of wells shown in fig. 32).

REGIONAL AQUIFER-SYSTEM ANALYSIS—MIDWESTERN BASINS AND ARCHESC84
0 10 20 30 40 50 60 70 80 90 100APPROXIMATE DISTANCE FROM REGIONAL POTENTIOMETRIC HIGH, IN MILES
0
1,000
500
1,500
2,000
0
1,000
500
1,500
2,000
0
50
100
150
0
50
100
150
SULF
ATE
CON
CEN
TRAT
ION
, IN
MIL
LIGR
AMS
PER
LITE
R
0 10 20 30 40 50 60 70 80 90
0 10 20 30 40 50 60 70 80
0 10 20 30 40 50 60 70 80
A' A
B' B
C' C
D D'
EXPLANATION
Glacial aquifers—Points not connected if data are missing
Carbonate-rock aquifer
Shallow
Deep
FIGURE 46.—Sulfate concentration in water from wells in the Midwestern Basins and Arches aquifer system along geochemicalsections A–A', B–B', C–C', and D–D' (locations of wells shown in fig. 32).

GEOCHEMISTRY C85
along the four selected directions of regional ground-waterflow. In addition, δ34S (for the sulfate and sulfide phases) andδ13C values for aquifer material, including glacial depositsand carbonate rocks, were determined at several locationswithin the study area. The isotopic data are summarized intables 8 and 9 and are discussed in the sections that follow.
SULFUR ISOTOPES
Aquifer-material and ground-water samples were ana-lyzed for sulfur isotopes to determine the origin of dissolvedsulfate and sulfide and to assist in the identification of thegeochemical processes that affect ground-water chemistry inthe Midwestern Basins and Arches aquifer system. Becausevarious geochemical processes such as sulfate reduction ordedolomitization can affect the ground-water ages calculatedfrom the carbon isotope data, as well as the associated inter-pretations made about regional ground-water flow, it isimportant to be able to distinguish the sources of sulfur in theground water.
The most abundant sulfur-containing minerals in thestudy area include pyrite and, in the northeastern part of thearea, gypsum. Sedimentary sulfide minerals such as pyritecan exhibit a wide range in δ34S values, from -70 to +70 permil; however, δ34S normally ranges from -30 to 10 per mil(Ohmoto and Rye, 1979). In gypsum derived from marineevaporites, δ34S values reflect the isotopic composition ofdissolved sulfate in the ocean at the time that the gypsum wasdeposited. Gypsum of Silurian and Devonian age has δ34Svalues that range from about +16 to +30 per mil (Holser andKaplan, 1966; Krouse, 1980).
Because such a wide range of δ34S values is possible forsources of sulfur, samples of aquifer material, including gla-cial deposits and carbonate rocks, and samples of pyrite andgypsum from the carbonate rocks were analyzed for δ34S ofthe sulfate and sulfide fractions to constrain the variability insulfur isotope values of the aquifer material. The data areshown in table 9, along with sulfur isotope data on pyrite andanhydrite samples from Ohio first given in Botoman andFaure (1976).
The δ34S(sulfate) values for gypsum and anhydrite sam-ples, 28.7 per mil and 24.9 per mil, are in close agreementwith those expected for marine sulfates of Silurian and Devo-nian age. The δ34S(sulfide) values of the pyrite samples, -21.9per mil, -19.4 per mil, and 7.0 per mil, fall within theexpected range for sedimentary sulfides. Organic sulfur,which has δ34S(sulfide) values similar to those of pyrite, wasnot specifically analyzed for, but it may be an additionalsource of reduced sulfur in the aquifer system.
The δ34S(sulfate) values for the glacial deposits fall withina fairly narrow range, from -14.8 to -8.2 per mil, which isnearly identical to the range in δ34S(sulfide) values for thesame material, -14.0 to -8.0 per mil. These δ34S(sulfide) valuesare within the same range as the δ34S(sulfide) values deter-
mined for the pyrite samples collected in the area and indicatethat pyrite is a likely source of solid-phase sulfide in the gla-cial deposits. A likely explanation for the similarity in theδ34S(sulfate) and δ34S(sulfide) values for the glacial deposits isthat sulfide (pyrite) in the glacial deposits oxidized to sulfateand, in the presence of dissolved calcium from the dissolutionof carbonate minerals, precipitated as gypsum. This processhas been shown to occur in the tills of the Interior PlainsRegion in Canada (Hendry and others, 1986; Keller and VanDer Kamp, 1988). These researchers based their conclusionson the similarity in sulfur isotope values between reducedorganic sulfur in unoxidized tills and the sulfate from gypsumcrystals found in the oxidized tills. They suggest that a large-scale lowering of the water table during an extended dry cli-matic episode in western North America from 11,000 to3,000 years before present produced geochemical changes inthe till that resulted in the formation of the gypsum and thesubsequent development of fractures in the oxidized till. Sim-ilar secondary gypsum has also been found in glacial depositsnear the Great Lakes. Desaulniers and others (1981) note thatsecondary gypsum usually is found in fractures of clayey tillsand glaciolacustrine clays in southwestern Ontario near LakeErie. Authigenic gypsum crystals have been found in lacus-trine clays within Wisconsinan glacial deposits in northeast-ern Ohio (Carlson, 1991). Possible gypsum crystallizationhas been noted by Strobel (1990) along fractures in clayey tillin northwestern Ohio. Therefore, given the similarity inδ34S(sulfate) and δ34S(sulfide) values in the glacial deposits inthe Midwestern Basins and Arches aquifer system, processessimilar to those in the Interior Plains Region of Canada mayhave resulted in the formation of gypsum in the glacial depos-its with an isotopically light sulfur signature.
The δ34S(sulfate) values of the carbonate rocks are highlyvariable. The δ34S(sulfate) values of core C3 and various inter-vals of core C2 range from 18.3 to 28.7 per mil and clearlyreflect sulfate from marine evaporates of Silurian and Devo-nian age. However, δ34S(sulfate) values of all other samples ofthe carbonate rocks range from -2.3 to 14.6 per mil and do notindicate a clearly defined sulfur source. The wide range inδ34S(sulfate) values of the carbonate rocks may reflect post-depositional processes, such as cementation, recrystalliza-tion, dolomitization, and weathering, that affected thecarbonate rocks in the study area (Casey, 1994). The range inδ34S(sulfide) values of the carbonate rocks, from -24.9 to 3.6per mil, is consistent with the δ34S(sulfide) values of the pyritesamples from the study area.
Sulfur isotope ratios in ground water in the MidwesternBasins and Arches aquifer system (fig. 47) are highly varied;δ34S(sulfate) values range from -10.4 to +44.1 per mil, andδ34S(sulfide) values range from -53.2 to -12.2 per mil. Variabil-ity in sulfur isotope values of the aquifer material is a majorcontrol on the distribution of sulfur isotope values in groundwater from the aquifer system. For example, in the westernpart of the study area where little or no gypsum is contained

REGIONAL AQUIFER-SYSTEM ANALYSIS—MIDWESTERN BASINS AND ARCHESC86
84°86°
42°
40°
38°
Base from U.S. Geological Survey digital data,1:2,000,000, 1972
0 20
0 20 40 60 KILOMETERS
40 60 MILES
Lake Erie
Maumee
River
KalamazooRiver
St.
Joseph
River
San
dusk
yR
iver
Scio
to
River
Great
Mia
mi
Rive
r
OhioRiver
Ohio
Riv
er
Ohio
River
East
Fork
White
Whi
te
Riv
er
Wab
ash
River
Kankakee
River
River
Kentucky
River
Licking
River
LakeMichigan
LakeSt. Clair
Chicago
Indianapolis
Detroit
Columbus
Cincinnati
Toledo
Dayton
Evansville
Louisville
FortWayne
SouthBend
Frankfort
Lexington
Huntington
ILLIN
OIS
MICHIGAN
INDIANAOHIO
WEST
VIRGINIA
KENTUCKY
ONTARIO
UNIT
EDST
ATES
CAN
ADA
--/2.2/--
2.4/--/--2.5/--/--2.0/--/--
--/--/----/--/--
3.1/--/--–7.9/--/--0.4/--/--
–0.8/--/--–7.9/--/--
–10.0/--/--
–5.9/--/--–5.5/--/--–3.9/--/--
–2.1/--/--–2.2/--/----/43.4/--
–0.2/--/--3.0/--/--
--/–12.2/--5.5/–27.6/33.1
9.4/--/--
–8.1/--/--
29.1
–3.2/–22.9/19.728.3/--/--
26.7/–42.4/69.1
–9.6/--/--–7.6/--/--–9.6/--/--
4.0/--/--3.2/--/--3.2/--/--
13.0/–33.0/46.025.9/–42.5/68.4
0.3/--/--6.6/--/--
29.0/–27.8/56.8
1.5/–53.2/54.7–1.8/–51.5/49.7
–9.2/--/--–9.8/--/--–7.7/--/--
–10.4/--/--–5.8/--/--4.8/--/--
20.5/--/--
--/--/--1.9/–37.8/39.7
21.9
44.15.5
EXPLANATION
Boundary of study area
Well sampled for chemical analysis during this investigation— Numbers represent , , and values ( = – ). -- indicates data not available or not applicable
Sample locations from other studies
Carbonate-rock aquifer. Data from Nichols and others (1996). Number is value
44.1
0.3/--/--6.6/--/--
29.0/–27.8/56.8
Glacial aquifersCarbonate-rock aquifer, shallow
Carbonate-rock aquifer, deep
δ S34sulfate δ S34
sulfide ∆ S34
Group of wellsin close proximity
δ S34sulfate δ S34
sulfateδ S34sulfide ∆ S34
δ S34sulfate δ S34
sulfide∆ S34
FIGURE 47.—δ S and ∆ S values in water from wells in the Midwestern Basins and Arches aquifer system.34 34

GEOCHEMISTRY C87
in the carbonate-rock aquifer, the highest δ34S(sulfate) valuein ground water is 9.4 per mil, an indication that the primarysource of sulfate to ground water is from the oxidation of sul-fide minerals or from the dissolution of gypsum formed bythe oxidation of sulfide minerals. Ground water with δ34S(sul-
fate) values consistent with the dissolution of marine gypsumor anhydrite of Silurian and Devonian age are found only inthe northeastern part of the study area, coincident with thelocation of the only significant deposits of gypsum and anhy-drite.
Sulfur isotope values in ground water reflect the δ34S val-ues of the sulfur source but are also dependent on chemicalreactions that can cause isotopic fractionation. For example,sulfate reduction can affect the isotopic composition of dis-solved sulfate in ground water. Sulfate reduction is mediatedby bacteria, which reduce sulfate to sulfide and oxidizeorganic carbon to CO2 under anaerobic conditions. The sul-fate-reduction reaction can be written as
SO42- + Corganic + 2H2O <--> H2S + 2HCO3
-. (12)
If the pH is greater than 7, HS- will predominate over H2S asthe sulfide product (Garrels and Christ, 1990). Bacterial sul-fate reduction preferentially incorporates 32S into the sulfideproduct, causing the residual sulfate to be enriched in theheavier isotope, 34S. Thus, as sulfate reduction progresses,δ34S of sulfide will be less than that of sulfate, and δ34S(sul-
fate) will increase relative to the original composition. Bacterial sulfate reduction is the likely source of the dis-
solved sulfide in the Midwestern Basins and Arches aquifersystem as indicated by the values of δ34S(sulfide) in groundwater from the aquifers, which range from -53.2 to -12.2 permil (fig. 47). Sulfate reduction has probably produced theextensive areas of the carbonate-rock aquifer in northwesternOhio that are characterized by dissolved sulfide concentra-tions exceeding 3.0 mg/L (Ohio Department of NaturalResources, 1970); sulfide concentrations as high as 70 mg/Lwere noted in this area. Dissolved sulfide is less abundant inother parts of the aquifer system.
The differences between the δ34S(sulfate) values and theδ34S(sulfide) values, ∆34, are also shown in figure 47. The ∆34
values range from 19.7 to 69.1 per mil. The largest ∆34 valuesin the aquifer system, 69.1 and 68.4 per mil, were found forwater from the deep bedrock wells near the Maumee Riverand Sandusky Bay. Equilibrium fractionation between sulfateand sulfide is estimated to be between 65 and 74 per mil(Pearson and Rightmire, 1980). Thus, the large ∆34 values inthe northeastern part of the study area may indicate isotopicequilibrium between dissolved sulfate and sulfide. In addi-tion, the large ∆34 values in ground water near the MaumeeRiver and Sandusky Bay may indicate a long residence timein the aquifer; in the Floridan aquifer of central and southernFlorida, for example, ∆34 values were reported to be directlyrelated to ground-water residence time in the aquifer. In addi-
tion, the largest ∆34 values were found in the areas of theFloridan aquifer farthest from the recharge area (Rye and oth-ers, 1981).
The sulfur isotope data were also used to evaluate the pro-cesses responsible for the elevated concentrations of dis-solved sulfate in much of the northeastern part of the studyarea. Ground waters with sulfate concentrations greater than1,000 mg/L were found along geochemical sections C-C’ andD-D’. These ground waters are saturated or nearly saturatedwith respect to gypsum, but their δ34S(sulfate) values indicateseveral different sources of sulfate. The δ34S(sulfate) values of25.9, 26.7, and 28.3 per mil in ground water from wells 14D,17D, and 17G (sulfate concentrations of 1,900, 1,600, and1,500 mg/L, respectively) are consistent with the dissolutionof Silurian-Devonian-age gypsum (or anhydrite). However,ground water with similar sulfate concentrations but δ34S(sul-
fate) values that range from -10.4 to 4.0 per mil (wells 10G,13G, 15G, 15S, and 15D) cannot be explained by the dissolu-tion of Silurian-Devonian age gypsum (or anhydrite) but areconsistent with pyrite as the sulfur source. The limit on theamount of sulfate that can be produced in ground water bypyrite oxidation (reaction 8) in a closed system is less than 25mg/L owing to solubility constraints on dissolved-oxygenconcentrations. Thus, closed-system pyrite oxidation couldnot generate the high sulfate concentrations that are found inthe northeastern part of the aquifer system. Closed-systemconditions are unlikely in much of the aquifer system, how-ever, because the glacial aquifers are generally water-tableaquifers, and the carbonate-rock aquifer is generally onlysemiconfined by the overlying glacial deposits. Thus, wherepyrite is abundant in the glacial deposits, sulfate produced bythe oxidation of pyrite (or other sources of reduced sulfur) inthe glacial deposits may be continually added to the groundwater as the water table rises and falls. Alternatively, high sul-fate concentrations and isotopically light δ34S(sulfate) valuesin ground water in the northeastern part of the aquifer systemcan be explained by the dissolution of gypsum composed ofisotopically light sulfate, such has been noted in tills in Can-ada (Hendry and others, 1986; Keller and Van Der Kamp,1988).
The sulfur isotope data include a wide range in sulfur iso-tope signatures of sulfur sources in the Midwestern Basinsand Arches aquifer system. In addition, sulfur isotope valuesfor ground water in the aquifer system are highly varied, andthe geochemical and hydrological processes affecting sulfurisotope values are not completely understood. As a conse-quence, use of the sulfur isotope data to help constrain thepossible mass balance reactions may not be particularlyeffective, and large uncertainties in the 14C ages estimated forground water in the aquifer system may result.

REGIONAL AQUIFER-SYSTEM ANALYSIS—MIDWESTERN BASINS AND ARCHESC88
OXYGEN AND HYDROGEN ISOTOPES
Variation in the isotope ratios of 18O/16O and 2H/1H(deuterium/hydrogen) in meteoric water (water that originatesin the Earth’s atmosphere) results from a combination ofphysical and chemical processes that change the isotopiccomposition from that of seawater. By definition, the isotopiccomposition of seawater, Standard Mean Ocean Water(SMOW), is 0 per mil for both δ18O and δD (Fritz and Fon-tes, 1980). Meteoric water is depleted in δ18O and δD relativeto seawater because of isotopic fractionation; the lighter iso-topes, 16O and 1H, evaporate preferentially, whereas theheavier isotopes, 18O and 2H, are concentrated in seawater.The distribution of δ18O and δD in modern precipitation isrelated to mean annual temperature and latitude (Dansgaard,1964). Generally, a greater amount of fractionation takesplace at colder temperatures than at warmer temperatures;hence, δ18O and δD values decrease with a decrease in tem-perature, which corresponds to an increase in latitude or alti-tude. This covariance of δ18O and δD is reflected by thecomposition of meteoric water throughout the world anddefines an average meteoric water line (Craig, 1961) definedas
δD = 8 δ18O + 10. (13)
Ground water recharged under present-day climatic condi-tions should have an isotopic composition similar to that ofpresent-day meteoric water. However, if ground water wasrecharged during a colder climate, its isotopic compositionshould be lighter than that of present-day precipitation butshould still plot on the meteoric water line.
Values for the stable isotopes of oxygen and hydrogen inground water samples that were collected as part of thisinvestigation are listed in table 8; δ18O values are shown spa-tially in figure 48. All the data plot on or slightly above themeteoric water line (fig. 49), an indication that the groundwater in the Midwestern Basins and Arches aquifer systemoriginated as atmospheric precipitation. Surface-water sam-ples collected at U.S. Geological Survey Benchmark Stationsin Indiana, Michigan and Ohio (Tyler Coplen, U.S. Geologi-cal Survey, written commun., 1992) were used to determinethe isotopic composition of present-day recharge in the area.Most of the ground water in the aquifer system has an isoto-pic composition similar to surface water in the study area andtherefore was most likely recharged under similar climaticconditions as the present. A few ground-water samples col-lected from the northeastern part of the study area are isotopi-cally light relative to the rest of the ground-water samples andpresent-day recharge. These relatively light waters probablyrecharged the aquifer system during a climate colder than thepresent.
Ground water with isotopically light δ18O values mayrepresent either water that recharged aquifers beneath Wis-consinan-age ice sheets or meltwater from those ice sheets.
Estimates of the δ18O value of Wisconsinan-age ice sheetsrange from -20 to -12 per mil (Yapp and Epstein, 1977;Desaulniers and others, 1981). Isotopically light groundwater in areas around the Great Lakes has been previouslyfound in east-central Michigan near Lake Michigan (Longand others, 1988) and southwestern Ontario near Lake Erie(Desaulniers and others, 1981; Clayton and others, 1966).The δ18O values from these studies range from -18.5 to -7 permil in Michigan and -17 to -9 per mil in southwesternOntario.
The areas of isotopically light ground water in the Mid-western Basins and Arches aquifer system and in the areasdiscussed above are all associated with lowlands that wereonce occupied by late Wisconsinan glacial lakes (Wayne andZumberge, 1965). The glacial deposits in these areas are typi-cally lacustrine clays or clay-rich tills derived from the lacus-trine sediments. The presence of clay-rich deposits in theareas once occupied by glacial lakes may inhibit ground-water recharge. In addition, glaciolacustrine clays in areasclose to the Great Lakes are typically found near the baselevel of the various aquifer systems and are generally coinci-dent with regional ground-water discharge areas. Verticalground-water flow velocities through glaciolacustrine claysand clayey tills in southwestern Ontario (Desaulniers and oth-ers, 1981) were determined to be on the order of 40 to 80 ft in10,000 years. Pore waters in these deposits exhibit a distinctregular shift in δ18O values with depth from δ18O valuescharacteristic of present-day recharge at the water table tovalues between -14 to -17 per mil at depths of 60 to 100 ft. Asimilar decrease in δ18O values with depth is seen in the Mid-western Basins and Arches aquifer system in well groups 13and 14 and in the data presented by de Roche and Breen(1989). This decrease indicates that a lack of substantialrecharge has likely preserved Pleistocene-age water in deeperparts of the aquifer system beneath the Maumee River Basin.
TRITIUM AND CARBON ISOTOPES
Tritium (3H) and carbon-14 (14C) are radioactive isotopeswhose concentrations in ground water can be used as a guideto ground-water age. Estimated ground-water ages can helpvalidate or refute interpretations made about ground-waterflow based on other chemical and isotopic data or results ofground-water-flow modeling.
Because large quantities of tritium were introduced intothe atmosphere during atmospheric testing of nuclear bombsfrom 1953 to the mid-1960’s, tritium is a useful indicator ofpost-1953 recharge to ground water. Tritium concentrationsin precipitation peaked at several thousand tritium units (TU;1 TU is equal to 1 tritium atom in 1018 hydrogen atoms or3.24 picocuries per liter, pCi/L) during 1963-64 (Michel,1989). Since the signing of the nuclear test ban treaty in thelate 1960’s, tritium concentrations in present-day precipita-tion have been decreasing to the pre-bomb levels of 2 to 8 tri-

GEOCHEMISTRY C89
84°86°
42°
40°
38°
Base from U.S. Geological Survey digital data,1:2,000,000, 1972
0 20
0 20 40 60 KILOMETERS
40 60 MILES
Lake Erie
Maumee
River
KalamazooRiver
St.
Joseph
River
San
dusk
yR
iver
Scio
to
River
Great
Mia
mi
Rive
r
OhioRiver
Ohio
Riv
er
Ohio
River
East
Fork
White
Whi
te
Riv
er
Wab
ash
River
Kankakee
River
River
Kentucky
River
Licking
River
LakeMichigan
LakeSt. Clair
Chicago
Indianapolis
Detroit
Columbus
Cincinnati
Toledo
Dayton
Evansville
Louisville
FortWayne
SouthBend
Frankfort
Lexington
Huntington
ILLIN
OIS
MICHIGAN
INDIANAOHIO
WEST
VIRGINIA
KENTUCKY
ONTARIO
UNIT
EDST
ATES
CAN
ADA
–6.95
–7.50–7.40–7.40
–7.15–7.40
–7.85–7.70–7.90
–7.70–7.60–7.75
–7.65–7.65–7.65
–7.75–7.45–7.40
–7.65–7.75–7.40
–7.50
–7.60–7.75
–9.05–8.40–8.45
–8.55–7.90–7.85
–8.10–8.00–8.10
–8.40–10.05
–9.65–9.90
–14.35
–8.20–8.05
–7.95–8.15–8.15
–8.35–8.60–8.55
–8.45
–7.25–7.75
–10.15
–8.10
–8.95–13.70
–9.50
–8.90–8.00
–12.2through
–7.8
EXPLANATION
Boundary of study area
Well sampled for chemical analysis during this investigation— Numbers is δ O value, in per mil
Sample locations from other studies
Nicholas and others (1996). Number is δ O value, in per mil
de Roche and Breen (1989). Numbers represent the range in δ O values from 14 wells
–9.65–9.90
–14.35
Glacial aquifersCarbonate-rock aquifer, shallow
Carbonate-rock aquifer, deep
Group of wellsin close proximity
18
–8.10
–12.2through
–7.8
18
18
FIGURE 48.—δ O values in water from wells in the Midwestern Basins and Arches aquifer system.18
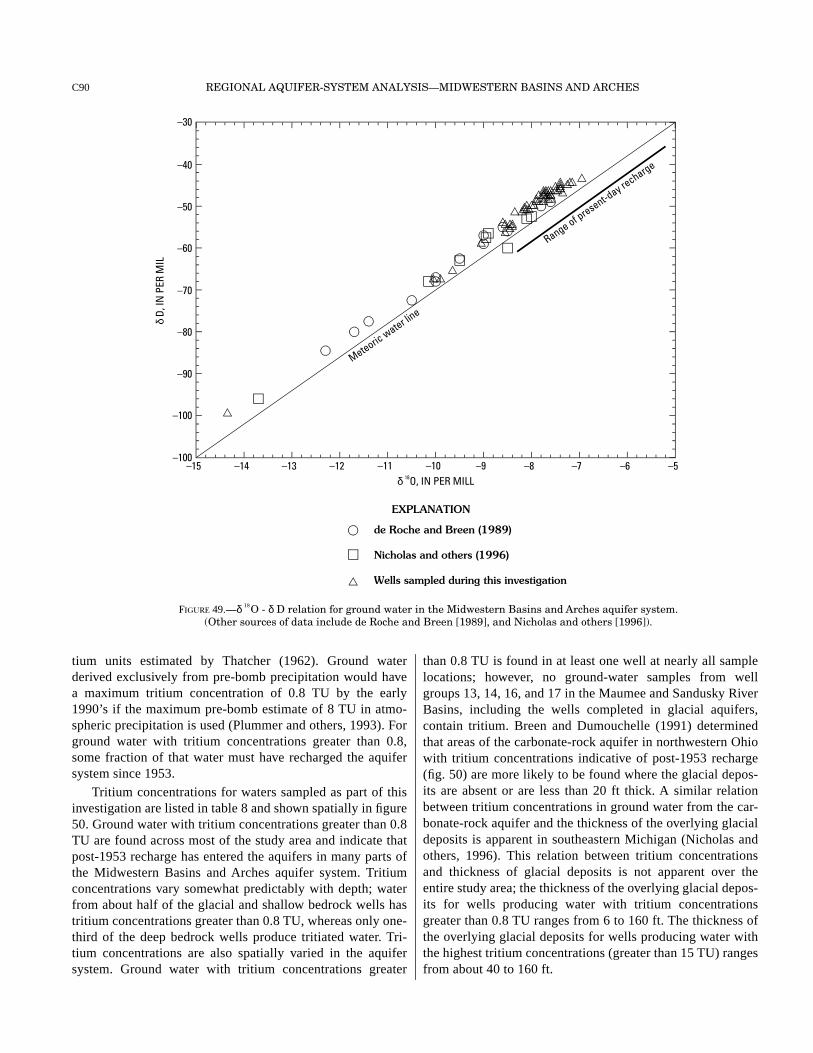
REGIONAL AQUIFER-SYSTEM ANALYSIS—MIDWESTERN BASINS AND ARCHESC90
tium units estimated by Thatcher (1962). Ground waterderived exclusively from pre-bomb precipitation would havea maximum tritium concentration of 0.8 TU by the early1990’s if the maximum pre-bomb estimate of 8 TU in atmo-spheric precipitation is used (Plummer and others, 1993). Forground water with tritium concentrations greater than 0.8,some fraction of that water must have recharged the aquifersystem since 1953.
Tritium concentrations for waters sampled as part of thisinvestigation are listed in table 8 and shown spatially in figure50. Ground water with tritium concentrations greater than 0.8TU are found across most of the study area and indicate thatpost-1953 recharge has entered the aquifers in many parts ofthe Midwestern Basins and Arches aquifer system. Tritiumconcentrations vary somewhat predictably with depth; waterfrom about half of the glacial and shallow bedrock wells hastritium concentrations greater than 0.8 TU, whereas only one-third of the deep bedrock wells produce tritiated water. Tri-tium concentrations are also spatially varied in the aquifersystem. Ground water with tritium concentrations greater
than 0.8 TU is found in at least one well at nearly all samplelocations; however, no ground-water samples from wellgroups 13, 14, 16, and 17 in the Maumee and Sandusky RiverBasins, including the wells completed in glacial aquifers,contain tritium. Breen and Dumouchelle (1991) determinedthat areas of the carbonate-rock aquifer in northwestern Ohiowith tritium concentrations indicative of post-1953 recharge(fig. 50) are more likely to be found where the glacial depos-its are absent or are less than 20 ft thick. A similar relationbetween tritium concentrations in ground water from the car-bonate-rock aquifer and the thickness of the overlying glacialdeposits is apparent in southeastern Michigan (Nicholas andothers, 1996). This relation between tritium concentrationsand thickness of glacial deposits is not apparent over theentire study area; the thickness of the overlying glacial depos-its for wells producing water with tritium concentrationsgreater than 0.8 TU ranges from 6 to 160 ft. The thickness ofthe overlying glacial deposits for wells producing water withthe highest tritium concentrations (greater than 15 TU) rangesfrom about 40 to 160 ft.
–15 –14 –13 –12 –11 –10 –9 –8 –7 –6 –5δ O, IN PER MILL
–100
–100
–90
–80
–70
–60
–50
–40
–30
δ D,
IN P
ER M
IL
18
Meteoric water line
Range of present-day recharge
EXPLANATION
de Roche and Breen (1989)
Nicholas and others (1996)
Wells sampled during this investigation
FIGURE 49.—δ O - δ D relation for ground water in the Midwestern Basins and Arches aquifer system.(Other sources of data include de Roche and Breen [1989], and Nicholas and others [1996]).
18

GEOCHEMISTRY C91
84°86°
42°
40°
38°
Base from U.S. Geological Survey digital data,1:2,000,000, 1972
0 20
0 20 40 60 KILOMETERS
40 60 MILES
Lake Erie
Maumee
River
KalamazooRiver
St.
Joseph
River
San
dusk
yR
iver
Scio
to
River
Great
Mia
mi
Rive
r
OhioRiver
Ohio
Riv
er
Ohio
River
East
Fork
White
Whi
te
Riv
er
Wab
ash
River
Kankakee
River
River
Kentucky
River
Licking
River
LakeMichigan
LakeSt. Clair
Chicago
Indianapolis
Detroit
Columbus
Cincinnati
Toledo
Dayton
Evansville
Louisville
FortWayne
SouthBend
Frankfort
Lexington
Huntington
ILLIN
OIS
MICHIGAN
INDIANAOHIO
WEST
VIRGINIA
KENTUCKY
ONTARIO
UNIT
EDST
ATES
CAN
ADA
<0.1/1.2
16.9/10019.1/78.114.1/67.5
<0.1/43.4<0.1/45.6
3.0/60.6<0.1/56.1<0.1/56.9
20.6/78.30.3/61.80.2/42.3
0.4/58.01.6/56.9
10.9/68.0
7.8/66.80.7/61.8
<0.1/35.7
18.1/72.315.0/65.3<0.1/28.1
<0.1/20.8
<0.1/35.112.2/74.3
0.5/47.7<0.1/3.9<0.1/4.7
<0.1/54.6<0.1/6.2<0.1/8.6
3.4/37.9<0.1/30.3<0.1/24.5
<0.1/8.8<0.1/1.4
0.5/--<0.1/1.3<0.1/0.2
11.6/45.010.6/62.0
<0.1/18.510.9/58.16.2/55.7
1.7/49.19.1/58.9
11.2/69.5
0.6/5.5
<0.1/44.220.0/51.3
EXPLANATION
Areas of the carbonate-rock aquifer where tritium concentrations in ground water (Breen and Dumouchelle, 1991) indicate post-1953 recharge
Boundary of study area0.5/--
<0.1/1.3<0.1/0.2
Glacial aquifersCarbonate-rock aquifer, shallow
Carbonate-rock aquifer, deep
Group of wellsin close proximity
Tritium concentration Carbon-14 activity
Well sampled for chemical analysis during this investigation— Numbers represent tritium concentrations, in tritium units, and carbon-14 activities, in percent modern carbon. -- indicates data not available
FIGURE 50.—Tritium concentrations and carbon-14 activities in water from wells in the Midwestern Basins and Arches aquifer system.

REGIONAL AQUIFER-SYSTEM ANALYSIS—MIDWESTERN BASINS AND ARCHESC92
Tritium data can help in making qualitative estimates ofground-water ages on the order of tens of years. Alternatively,14C data can help date ground water that is thousands of yearsold. The maximum age that can be dated using 14C is about50,000 years given the isotope’s half-life of 5,730 years(Freeze and Cherry, 1979). Ground-water samples were col-lected in the study area for 14C analysis to help constrainground-water ages and to help describe regional ground-water flow in the Midwestern Basins and Arches aquifer sys-tem. Values for δ13C were also determined to provide infor-mation regarding the sources of dissolved inorganic carbon inthe ground water and to help correct the measured 14C valuesfor the dilutional effects caused by various geochemical pro-cesses. The data are listed in table 8, plotted in figure 50 anddiscussed below.
The radioactive decay expression for 14C can beexpressed as
t = -8270 ln (R), (14)
where t equals the decay age of the carbon, in years, and Requals the measured 14C activity of the sample expressed asa percentage of the 14C activity of modern carbon (Mook,1980). This equation indicates the time, in years, since thewater was in contact with CO2 in the soil zone; use of theequation requires the assumption that there have been noother inputs of dissolved inorganic carbon. However, dissolu-tion of carbonate minerals or oxidation of organic matter cancontribute nonradioactive carbon to ground water, dilutingthe amount of 14C originally in the water and yielding anunadjusted age that is too old. To correct for nonradioactivecarbon, an adjustment factor is added to the decay equation:
t = -8,270 ln (R) + 8,270 ln (Q). (15)
For waters in which all the inorganic carbon is produced bythe dissolution of carbonate minerals in the soil zone, the Qvalue is 1.0. The Q value will become some fraction of 1.0 ifdissolution continues below the water table where exchangewith soil-gas CO2 cannot occur. Wigley (1975) has shownthat in aquifers where CO2 is not produced below the watertable, the minimum Q value will not be less than 0.5. Wheregypsum dissolution or the exchange of Ca2+ and Mg2+ forNa+ drives the incongruent dissolution of dolomite underclosed-system conditions (dedolomitization), or where CO2 isproduced by the oxidation of old organic matter during bacte-rially mediated sulfate reduction, Q values may be quite smallbecause of the introduction of significant amounts of 14C withzero activity. The Q values for ground water in the MadisonLimestone in parts of Montana, South Dakota, and Wyoming,range from about 0.5, where minor dedolomitization hasoccurred, to less than 0.1, where ground waters have beenaffected by dedolomitization, cation exchange, and substan-tial sulfate reduction (Busby and others,1991).
To produce accurate estimates of Q, one must usegeochemical models that incorporate the effects of dedolo-mitization, sulfate-reduction, cation exchange, and isotopicexchange. This type of analysis, however, was beyond thescope of this investigation. As a first approximation, 14C ageswere estimated from Q values that were selected somewhatarbitrarily. The raw-age estimates (Q=1.0) were corrected byuse of Q values of 0.5, 0.3, and in some cases, 0.2 (table 11).A Q value of 0.5 is expected for closed-system dissolution ofcarbonate minerals where no additional source of CO2 isadded and where no secondary mineral precipitates (Wigley,1975). Thus, a Q value of 0.5 can overestimate the age ofground water that has undergone dedolomitization or sulfatereduction. A Q value of 0.3 was used in this investigation toaccount for geochemical reactions that produce additionalsources of nonradioactive carbon to the ground water system.A Q value of 0.2 was used for ground waters with small 14Cactivities and δ13C values that are isotopically heavy. Muchof the ground water in the aquifer system has δ13C values ofaround -14 or -15 per mil; however, ground water from wells1D, 13D, 14D, 17G, and 17D has δ13C values that range from-11.0 to -7.1 per mil, an indication that a greater proportion ofthe dissolved inorganic carbon in these waters was derivedfrom the dissolution of carbonate rocks with δ13C values ofabout 0 per mil than in the waters with δ13C values of around-14 or -15 per mil. Samples 8G, 9D, and 19 also have heavierδ13C values (-8.8, -3.1, and -1.3 per mil) than do most othersamples. These waters, however, have likely been affected bymethanogenesis, a reaction in which organic matter is metab-olized by methanogenic bacteria to produce CO2, methane(CH4), and dissolved organic compounds. The concentrationof dissolved methane in well 8G was 18.65 mg/L (EurybiadesBusenberg, U.S. Geological Survey, written commun., 1992).Ground water from wells 9D and 19 were not analyzed fordissolved methane, but these samples had elevated concentra-tions of dissolved organic carbon and (or) little or no dis-solved sulfate, a composition consistent with methano-genesis. The age of these waters cannot be accurately deter-mined without measuring the δ13C value of the dissolvedmethane.
Also listed in table 11 are ages calculated by use of themethod proposed by Pearson and White (1967), in whichδ13C values are used to correct for isotopic dilution due tocongruent carbonate dissolution according to the equation
(16)C adjusted( )14
C measured( )14 δ C13
soil δ C13
carbonate–
δ C13
water δ C13
carbonate–-------------------------------------------------------------×
˙̇
,
=
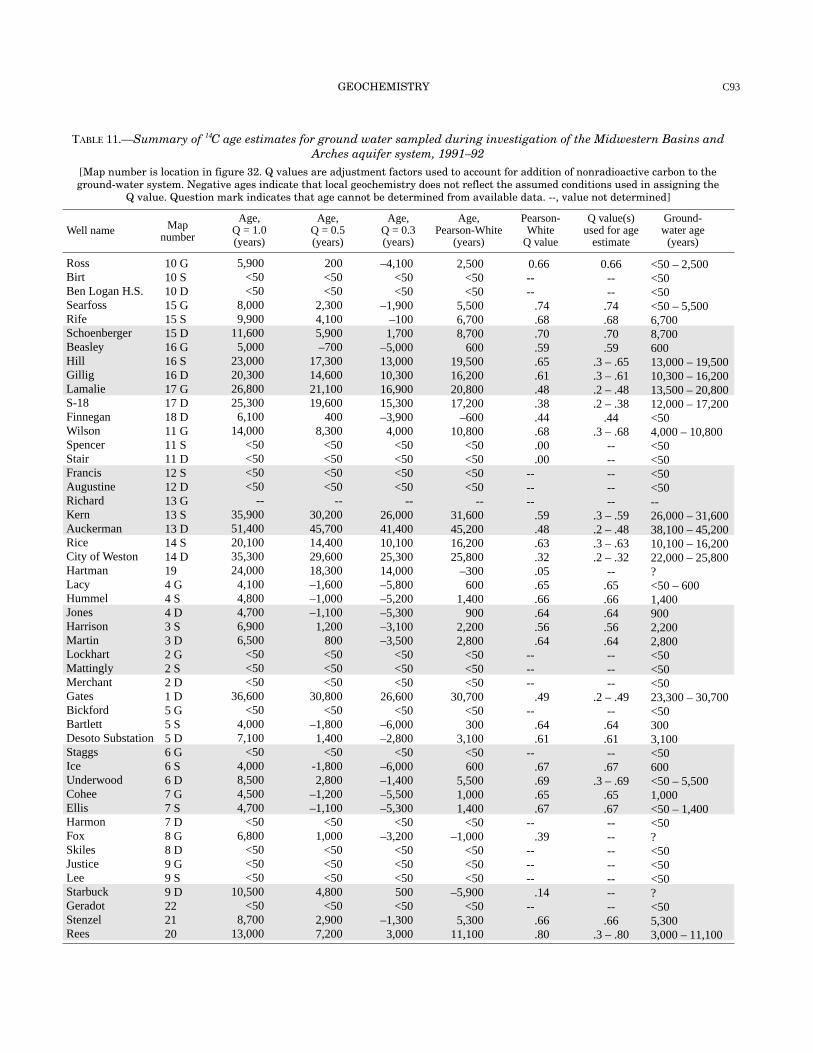
GEOCHEMISTRY C93
Well name Mapnumber
RossBirtBen Logan H.S.SearfossRifeSchoenbergerBeasleyHillGilligLamalieS-18FinneganWilsonSpencerStairFrancisAugustineRichardKernAuckermanRiceCity of WestonHartmanLacyHummelJonesHarrisonMartinLockhartMattinglyMerchantGatesBickfordBartlettDesoto SubstationStaggsIceUnderwoodCoheeEllisHarmonFoxSkilesJusticeLeeStarbuckGeradotStenzelRees
10 G10 S10 D15 G15 S15 D16 G16 S16 D17 G17 D18 D11 G11 S11 D12 S12 D13 G13 S13 D14 S14 D194 G4 S4 D3 S3 D2 G2 S2 D1 D5 G5 S5 D6 G6 S6 D7 G7 S7 D8 G8 D9 G9 S9 D222120
Age,Q = 1.0(years)
Age,Q = 0.5(years)
Age,Q = 0.3(years)
Age,Pearson-White
(years)
Pearson-White
Q value
Q value(s)used for age
estimate
Ground-water age
(years)
5,900<50<50
8,0009,900
11,6005,000
23,00020,30026,80025,3006,100
14,000<50<50<50<50
--35,90051,40020,10035,30024,0004,1004,8004,7006,9006,500
<50<50<50
36,600<50
4,0007,100
<504,0008,5004,5004,700
<506,800
<50<50<50
10,500<50
8,70013,000
200<50<50
2,3004,1005,900–700
17,30014,60021,10019,600
4008,300
<50<50<50<50
--30,20045,70014,40029,60018,300–1,600–1,000–1,1001,200
800<50<50<50
30,800<50
–1,8001,400
<50-1,8002,800
–1,200–1,100
<501,000
<50<50<50
4,800<50
2,9007,200
–4,100<50<50
–1,900–1001,700
–5,00013,00010,30016,90015,300–3,9004,000
<50<50<50<50
--26,00041,40010,10025,30014,000–5,800–5,200–5,300–3,100–3,500
<50<50<50
26,600<50
–6,000–2,800
<50–6,000–1,400–5,500–5,300
<50–3,200
<50<50<50500<50
–1,3003,000
2,500<50<50
5,5006,7008,700
60019,50016,20020,80017,200
–60010,800
<50<50<50<50
--31,60045,20016,20025,800
–300600
1,400900
2,2002,800
<50<50<50
30,700<50300
3,100<50600
5,5001,0001,400
<50–1,000
<50<50<50
–5,900<50
5,30011,100
0.66-- --
.74
.68
.70
.59
.65
.61
.48
.38
.44
.68
.00
.00-- -- --
.59
.48
.63
.32
.05
.65
.66
.64
.56
.64-- -- --
.49--
.64
.61--
.67
.69
.65
.67--
.39-- -- --
.14--
.66
.80
0.66----
.74
.68
.70
.59.3 – .65.3 – .61.2 – .48.2 – .38
.44.3 – .68
----------
.3 – .59
.2 – .48
.3 – .63
.2 – .32--
.65
.66
.64
.56
.64------
.2 – .49--
.64
.61--
.67.3 – .69
.65
.67--------------
.66.3 – .80
<50 – 2,500<50<50<50 – 5,5006,7008,70060013,000 – 19,50010,300 – 16,20013,500 – 20,80012,000 – 17,200<504,000 – 10,800<50<50<50<50--26,000 – 31,60038,100 – 45,20010,100 – 16,20022,000 – 25,800?<50 – 6001,4009002,2002,800<50<50<5023,300 – 30,700<503003,100<50600<50 – 5,5001,000<50 – 1,400<50?<50<50<50?<505,3003,000 – 11,100
[Map number is location in figure 32. Q values are adjustment factors used to account for addition of nonradioactive carbon to theground-water system. Negative ages indicate that local geochemistry does not reflect the assumed conditions used in assigning the
Q value. Question mark indicates that age cannot be determined from available data. --, value not determined]
TABLE 11.—Summary of C age estimates for ground water sampled during investigation of the Midwestern Basins andArches aquifer system, 1991–92
14

REGIONAL AQUIFER-SYSTEM ANALYSIS—MIDWESTERN BASINS AND ARCHESC94
where 14C (adjusted) is the 14C activity adjusted for dissolu-tion of carbonate rocks with known δ13C values, 14C (mea-sured) is the measured activity in the water sample, δ13C soilis the isotopic composition of soil-gas CO2, δ13Ccarbonate isthe isotopic composition of the carbonate minerals in thestudy area, and δ13Cwater is the isotopic composition of thedissolved inorganic carbon in the water sample. Values ofδ13C soil in temperate climates vary from -25 to -18 per mil(Mook, 1980; Back and others, 1983); a value of -22.5 permil was used in equation 16 for this investigation. Values ofδ13Ccarbonate from samples of the carbonate-rock aquifer andthe glacial aquifers are listed in table 9. The averageδ13Ccarbonate value of the 10 samples, 0.0 per mil, was used inequation 16.
A summary of ages calculated from equations 15 and 16is given in table 11. Ages were not calculated for the sampleswith tritium concentrations greater than 6 TU because suchwaters may contain a significant component of recentrecharge with unknown amounts of bomb-derived 14C. Onthe basis of the range of calculated ages and the chemical andisotopic data, each ground water sample was assigned anapproximate age. In some ground water samples, tritium con-centrations are between 0.8 and 3 TU and may represent amixture of old water and recent recharge. Such waters wereassigned an age ranging from less than 50 years to the agecalculated by use of equation 16. Waters that are saturatedwith respect to calcite and dolomite and apparently unaf-fected by dedolomitization or sulfate reduction were assignedthe age estimated from equation 16. The range of adjustmentfactors (Pearson-White Q value) for these waters is 0.56 to0.67, which is in close agreement with the Q values calcu-lated by Wigley (1975) for ground water that is undergoingcongruent dissolution of calcite and dolomite in the soil zoneand below the water table. Waters that have undergone dedo-lomitization or sulfate reduction were assigned a range ofages that bracket those calculated with a Q value of 0.3, or forwaters with heavy δ13C values, 0.2, and ages that were calcu-lated by use of equation 16 (Pearson-White method).
The ground-water ages in the aquifer system are consis-tent with a conceptual model of regional ground-water flow inwhich the aquifer system alternately receives recharge anddischarges across most of the study area except in the north-eastern part, where the aquifer system does not receive anotable amount of recharge. Ground-water ages across mostof the study area range from less than 50 years to severalthousand years and generally do not follow any spatial trends.This pattern is consistent with a ground-water flow regimethat is largely dominated by local flow systems that haveshort flow paths relative to the areal extent of the aquifer sys-tem. The oldest ground waters in the aquifer system range inage from at least 3,000 to possibly more than 40,000 yearsand are in the discharge areas in the northeastern part of thestudy area near the Maumee and Sandusky Rivers and LakeErie. Relatively old waters were also found near the Wabash
River in northern Indiana and at the margin of the IllinoisBasin where the upper confining unit overlies the carbonate-rock aquifer.
Ground water from wells 13S, 13D, and 14D ranges inage from about 22,000 to more than 45,000 years and hasδ18O and δD values expected for water recharged during thePleistocene. The age ranges of ground water from wells 14S,16S, 16D, 17G, and 17D are also Pleistocene; however, theδ18O values are similar to those for present-day recharge. Theretreat of Late-Wisconsinan glaciers in the Great Lakes areabegan about 13,300 years ago and was nearly complete by10,000 years ago (Barry, 1983). Isotopic data presented byYapp and Epstein (1977) indicate that the δ18O and δD valuesof precipitation during the interval between 10,000 and 9,500years before present were similar to those of present-day pre-cipitation. Data on δ18O values in mollusk shells from sedi-ment cores in Lake Erie (Fritz and others, 1975) indicate arapid increase in δ18O values in water in Lake Erie after13,000 years before present because of a rapid rise in averageland temperatures. The lower ages presented in table 11 forground water from wells 14S, 16S, 16D, 17G, and 17D rangefrom 10,300 to 13,500 years. Because the isotopic composi-tion of precipitation during this time period may have beensimilar to that of today, the δ18O and δD data for theseground waters indicates that the lower age limits listed intable 11 for these waters may be the more reasonable. Thus,ground water from wells 13S, 13D, and 14D may representwater that recharged the aquifer system from beneath the gla-cial ice, whereas ground water from wells 14S, 16S, 16D,17G, and 17D may represent precipitation that entered theaquifer system at the end of glaciation. Alternatively, Siegel(1991) observed a similar disparity between δ18O values andestimated 14C ages for Pleistocene-age ground water in thenorthern Midwest. He suggested that the calculated ground-water ages may be too great if δ13C values of soil gasincreased because of a reduction of the amount of organicmatter that was present in the soil during the colder climate.As a result, the actual ages of ground water recharged duringthe Pleistocene may be less than those listed in table 11.Although considerable uncertainty is inherent in the absoluteages of ground water because of assumptions used in the cal-culations, the ages given in table 11 are helpful for evaluatingthe relative age of ground waters in the Midwestern Basinsand Arches aquifer system.
VARIATION IN GROUND-WATER CHEMISTRY WITH DEPTH
The sampling methodology for this investigation, dis-cussed earlier in this report, was designed to use existingwells to obtain as much information as possible on the varia-tion in ground-water chemistry with depth in the MidwesternBasins and Arches aquifer system. Two types of deep bedrockwells were sampled: those that were open hole through theentire length of the well and those that were cased through

SUMMARY AND CONCLUSIONS C95
various lengths of the top section of the carbonate-rock aqui-fer (table 6). Data from these deep bedrock wells were com-pared to data from nearby shallow bedrock wells to assist inunderstanding the ground-water chemistry at depths as greatas 450 ft below the top of the carbonate-rock aquifer.
A comparison of the chemical and isotopic data and theestimated ground water ages (tables 7, 8, and 11) between theshallow bedrock wells and the deep bedrock wells that areopen hole through the entire length of the well shows that thechemistry and the ground-water ages between these wells aregenerally similar. The differences in ground-water ages in allthese wells ranges from several hundred to less than 3,000years. Of the pairs of shallow and deep bedrock wells thathave ages greater than 50 years, ground water in the deepbedrock well is older than in the shallow bedrock well in wellgroups 3, 5, and 15; whereas ground water in the shallow bed-rock well is older than in the deep bedrock well in wellgroups 4 and 16. The similarity between ground water fromwells that are open only to the shallow part of the carbonate-rock aquifer and ground water from wells that are open to amuch greater part of the carbonate-rock aquifer indicates thateither (1) the chemistry and age of the ground water is similarthroughout the sampled thickness of the carbonate-rock aqui-fer or (2) if ground water at depth has a distinctly differentchemistry or older age, then the carbonate rocks are not trans-missive enough at the greater depths to contribute signifi-cantly to the overall chemistry of the sampled water, and mostground water is produced from the upper part of the carbon-ate-rock aquifer.
Data from a shallow interval (less than 50 ft below the topof the aquifer) and an isolated deeper interval (as great as 450ft below the top of the aquifer) within the carbonate-rockaquifer are available for well groups 10, 13, 14, and 17. Acomparison of ground-water chemistry and ages between theshallow and deep bedrock wells at well groups 13 and 14shows a systematic change in chemistry with depth and a dis-tinctly different ground water in the deeper part of the car-bonate-rock aquifer than in the shallow part. The chemicaland isotopic data from these two well groups indicate that, inthis area of the aquifer system, some recharge water entersthe glacial aquifers and the shallow zones of the carbonate-rock aquifer but does not penetrate deeply into the aquifersystem. In contrast, a comparison of ground-water chemistryand ages at well groups 10 and 17 shows little differencebetween the shallow and deeper parts of the aquifer system.At well group 10, tritium concentrations indicative of post-1953 recharge are found throughout the entire sampled thick-ness of the carbonate-rock aquifer. These wells are located atthe highest potentiometric level in the aquifer system, whererecharge rates to the deepest parts of the aquifer systemshould be relatively high. The chemical and isotopic data forground water from wells 17G and 17D, located near theSandusky River and Lake Erie, is quite similar. The age of thewater in the overlying glacial aquifer is slightly older than
water from deeper within the carbonate-rock aquifer (13,500years compared to 12,000 years, using the lower age limit asdiscussed in the previous section). This slight decrease in agewith depth may reflect an upward flow of ground water as itdischarges the aquifer system.
Chemical and isotopic data are also available for groundwater that was sampled from specific intervals in three deepwells that penetrate the entire thickness of the carbonate-rockaquifer in northwestern Indiana (D.J. Schnoebelen, U.S. Geo-logical Survey, written commun., 1993). Ground water wassampled from various 10-ft intervals of the carbonate-rockaquifer by use of an inflatable packer system. Hydrogeologicdata for these three wells and a description of the packer tech-nology are given in Arihood (1994). The chemical and isoto-pic data from all the sampled intervals in each well are verysimilar, an indication that there is no stratification of ground-water chemistry with depth in this part of the aquifer system;however, the samples do not represent water from the deepestpart of the carbonate-rock aquifer because the rocks in thebottom 60 to 400 ft of the wells are not necessarily transmis-sive (Arihood, 1994).
SUMMARY AND CONCLUSIONS
Aquifers in Quaternary glacial deposits and underlyingSilurian and Devonian carbonate rock in parts of Indiana,Ohio, Michigan, and Illinois compose an integrated regional-scale water-table aquifer system. This aquifer system gener-ally lies between the Appalachian, the Illinois, and the Michi-gan (structural) Basins and is located along the axes of theCincinnati, the Findlay, and the Kankakee Arches.
Glacial deposits within the study area are the result ofmultiple glacial advances and directly overlie the carbonaterocks along the axes of the structural arches in the central partof the study area. These glacial deposits mask the ancientbedrock topography and bury numerous valleys in the bed-rock surface. The glacial deposits and the carbonate rocks areseparated by a shale sequence along the margins of andwithin the surrounding structural basins.
The water table within the Midwestern Basins and Archesaquifer system generally is within the glacial deposits. Gla-cial aquifers typically consist of sands and gravels in outwashdeposits or as discontinuous lenses within ground or endmoraines. Because such lenses are not necessarily areallyextensive, the glacial aquifers can supply large yields ofground water only locally.
An areally extensive aquifer is present in the carbonaterocks that underlie the glacial deposits. At the regional scale,the carbonate-rock aquifer is semiconfined by the finergrained glacial deposits where the aquifer directly underliesthese deposits (subcrop area of the carbonate-rock aquifer)but is confined where the aquifer underlies the interveningshale sequence, called the upper confining unit, along the