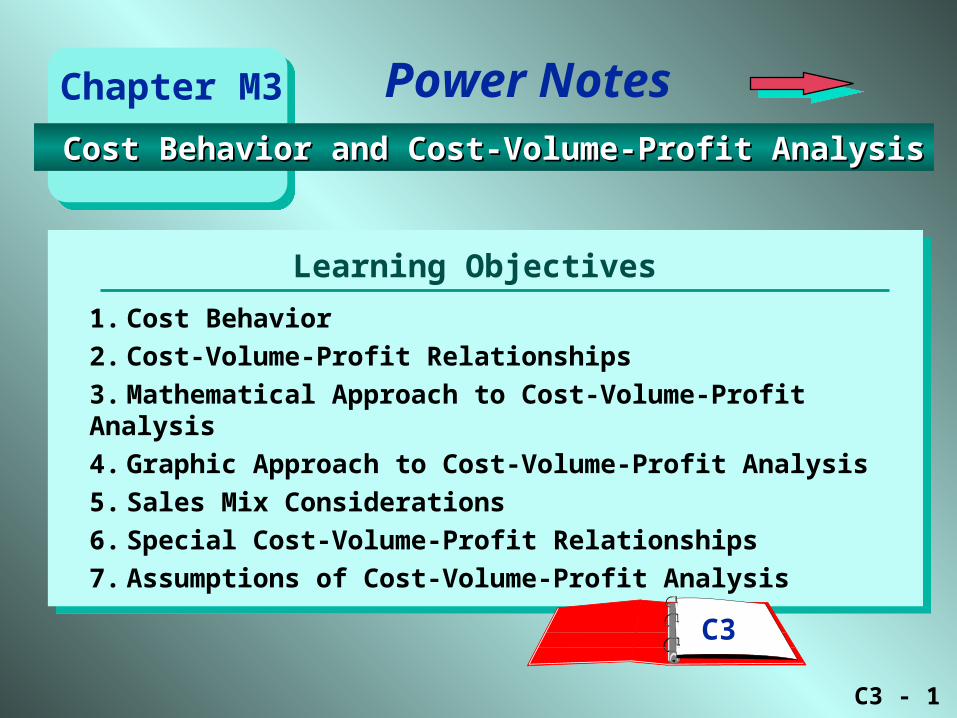
c3 - 1 learning objectives power notes 1.cost behavior 2.cost-volume-profit relationships...
TRANSCRIPT
C3 - 1
Learning Objectives
Power Notes
1. Cost Behavior
2. Cost-Volume-Profit Relationships
3. Mathematical Approach to Cost-Volume-Profit Analysis
4. Graphic Approach to Cost-Volume-Profit Analysis
5. Sales Mix Considerations
6. Special Cost-Volume-Profit Relationships
7. Assumptions of Cost-Volume-Profit Analysis
Chapter M3
C3
Cost Behavior and Cost-Volume-Profit AnalysisCost Behavior and Cost-Volume-Profit Analysis
C3 - 2
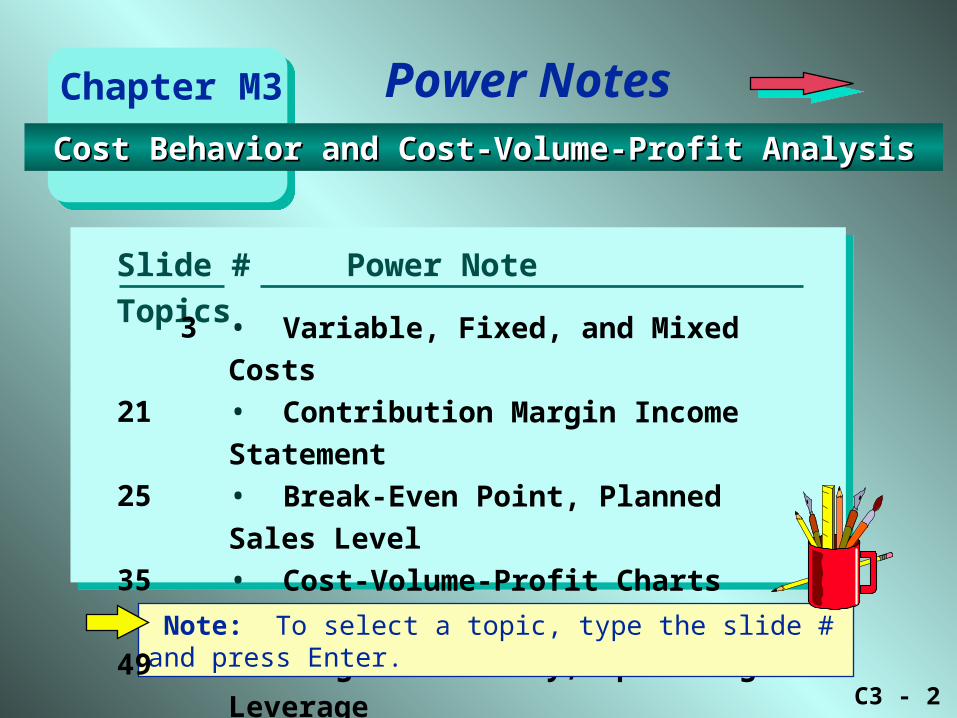
• Variable, Fixed, and Mixed Costs
• Contribution Margin Income Statement
• Break-Even Point, Planned Sales Level
• Cost-Volume-Profit Charts
• Sales Mix Considerations
• Margin of Safety, Operating Leverage
Slide # Power Note Topics
Note: To select a topic, type the slide # and press Enter.
Power Notes
3
21
25
35
49
55
Chapter M3
Cost Behavior and Cost-Volume-Profit Analysis Cost Behavior and Cost-Volume-Profit Analysis
C3 - 3
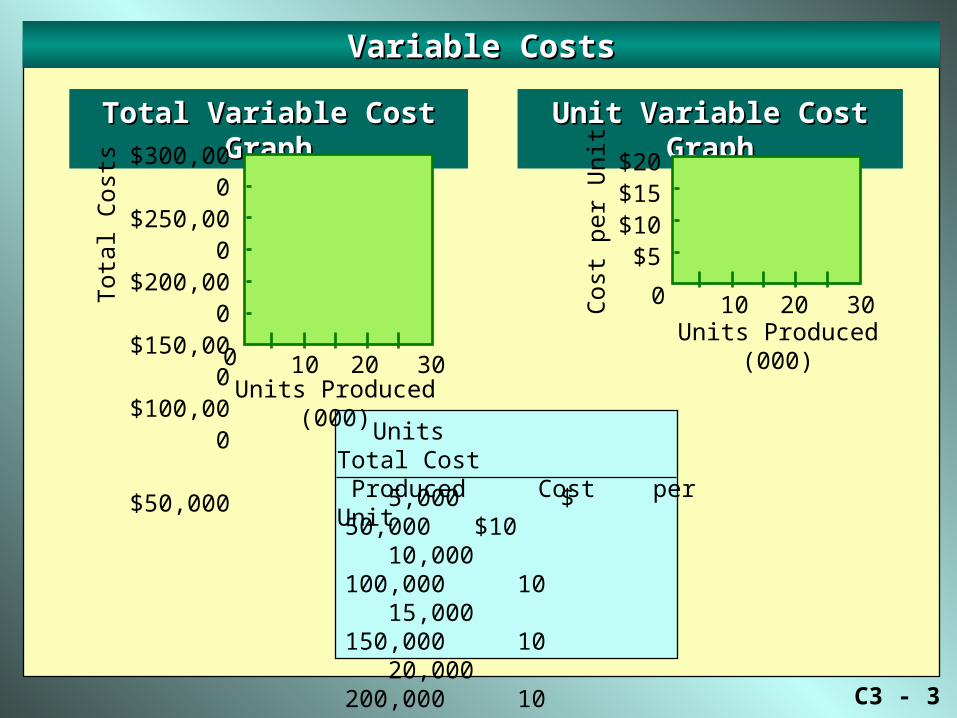
Variable CostsVariable Costs
Total Variable Cost GraphTotal Variable Cost GraphT
otal
Cos
ts
$300,000$250,000$200,000$150,000$100,000 $50,000
10 20 300
Unit Variable Cost GraphUnit Variable Cost Graph
$20$15$10$5
0Cos
t pe
r U
nit
10 20 30
5,000 $ 50,000 $10 10,000 100,000 10 15,000 150,000 10 20,000 200,000 10 25,000 250,000 10 30,000 300,000 10
Units Total CostProduced Cost per Unit
Units Produced (000)
Units Produced (000)

C3 - 4
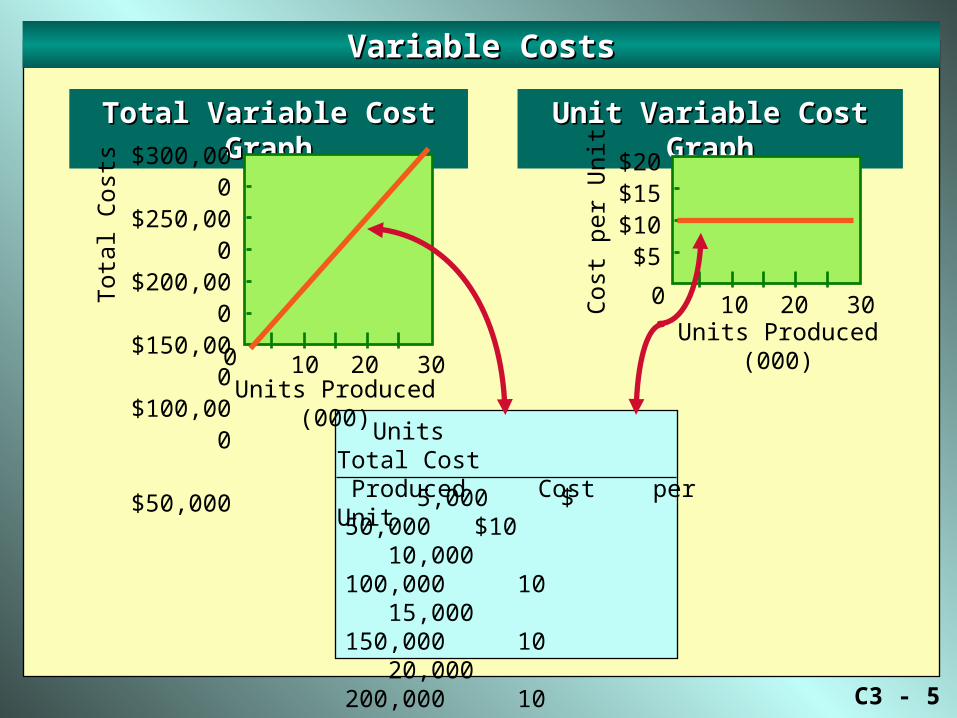
Variable CostsVariable Costs
Total Variable Cost GraphTotal Variable Cost GraphT
otal
Cos
ts
$300,000$250,000$200,000$150,000$100,000 $50,000
10 20 300
Unit Variable Cost GraphUnit Variable Cost Graph
$20$15$10$5
0Cos
t pe
r U
nit
10 20 30
5,000 $ 50,000 $10 10,000 100,000 10 15,000 150,000 10 20,000 200,000 10 25,000 250,000 10 30,000 300,000 10
Units Total CostProduced Cost per Unit
Units Produced (000)
Units Produced (000)
C3 - 5
Variable CostsVariable Costs
Total Variable Cost GraphTotal Variable Cost GraphT
otal
Cos
ts
$300,000$250,000$200,000$150,000$100,000 $50,000
10 20 300
Unit Variable Cost GraphUnit Variable Cost Graph
$20$15$10$5
0Cos
t pe
r U
nit
10 20 30
5,000 $ 50,000 $10 10,000 100,000 10 15,000 150,000 10 20,000 200,000 10 25,000 250,000 10 30,000 300,000 10
Units Total CostProduced Cost per Unit
Units Produced (000)
Units Produced (000)

C3 - 6
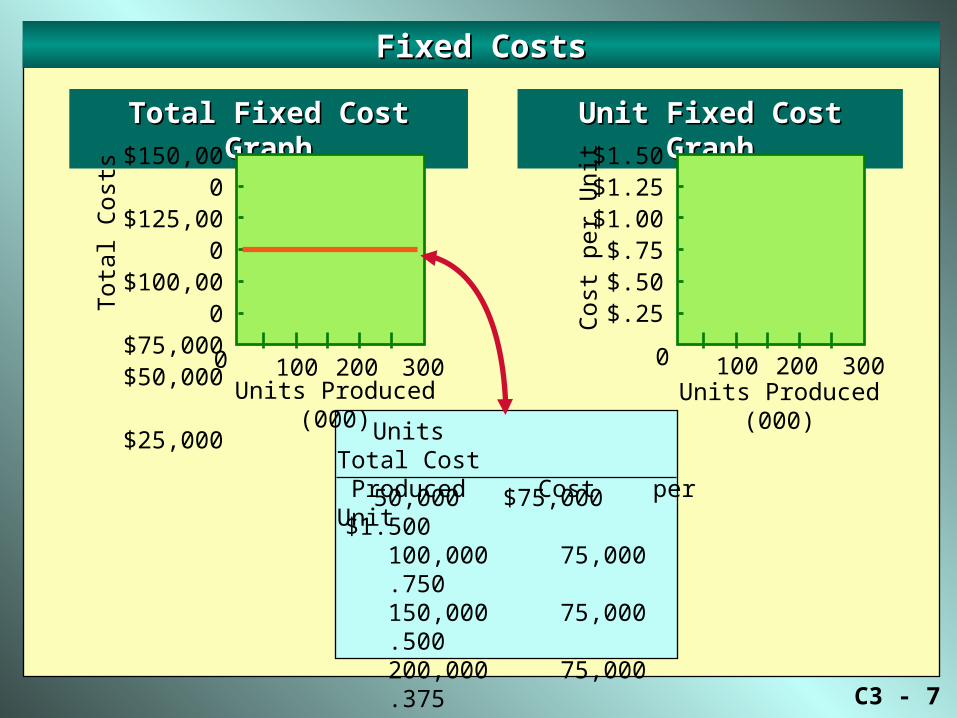
Fixed CostsFixed Costs
Total Fixed Cost GraphTotal Fixed Cost GraphT
otal
Cos
ts
0
Unit Fixed Cost GraphUnit Fixed Cost Graph
Cos
t pe
r U
nit
50,000 $75,000 $1.500 100,000 75,000 .750 150,000 75,000 .500 200,000 75,000 .375 250,000 75,000 .300 300,000 75,000 .250
Units Total CostProduced Cost per Unit
Units Produced (000) Units Produced (000)
$150,000$125,000$100,000$75,000$50,000
$25,000
100 200 300
$1.50$1.25$1.00$.75$.50
$.25
100 200 3000
C3 - 7
Fixed CostsFixed Costs
Total Fixed Cost GraphTotal Fixed Cost GraphT
otal
Cos
ts
0
Unit Fixed Cost GraphUnit Fixed Cost Graph
Cos
t pe
r U
nit
50,000 $75,000 $1.500 100,000 75,000 .750 150,000 75,000 .500 200,000 75,000 .375 250,000 75,000 .300 300,000 75,000 .250
Units Total CostProduced Cost per Unit
$150,000$125,000$100,000$75,000$50,000
$25,000
100 200 300
$1.50$1.25$1.00$.75$.50
$.25
100 200 3000
Units Produced (000) Units Produced (000)

C3 - 8
Fixed CostsFixed Costs
Total Fixed Cost GraphTotal Fixed Cost GraphT
otal
Cos
ts
0
Unit Fixed Cost GraphUnit Fixed Cost Graph
Cos
t pe
r U
nit
50,000 $75,000 $1.500 100,000 75,000 .750 150,000 75,000 .500 200,000 75,000 .375 250,000 75,000 .300 300,000 75,000 .250
Units Total CostProduced Cost per Unit
$150,000$125,000$100,000$75,000$50,000
$25,000
100 200 300
$1.50$1.25$1.00$.75$.50
$.25
100 200 3000
Units Produced (000) Units Produced (000)
C3 - 9
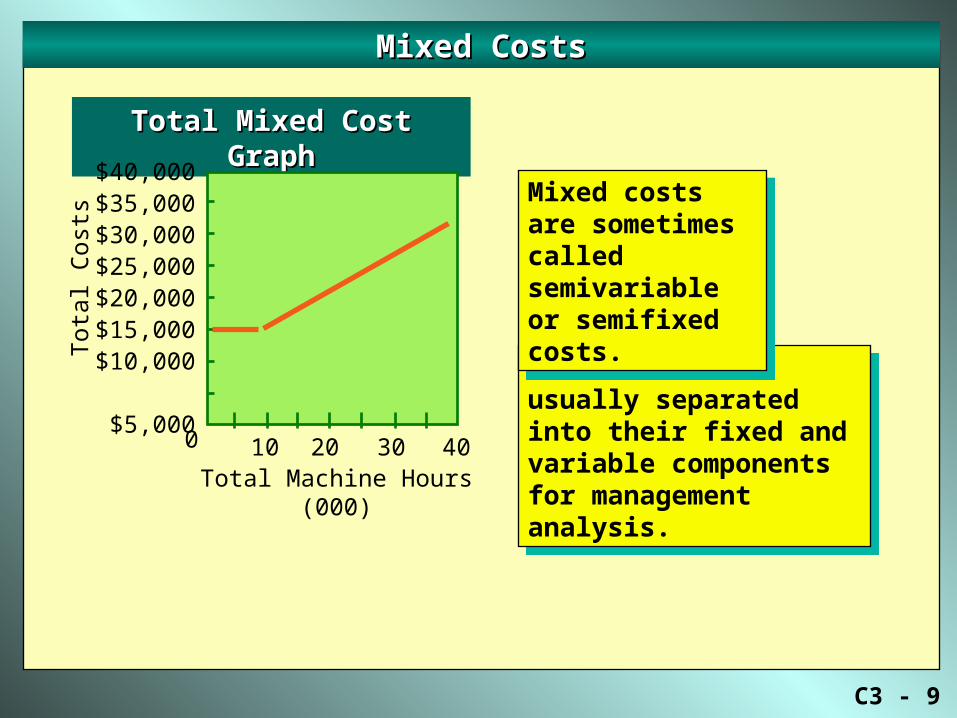
Mixed CostsMixed Costs
Total Mixed Cost GraphTotal Mixed Cost Graph
Tot
al C
osts
0
Total Machine Hours (000)
$40,000$35,000$30,000$25,000$20,000$15,000$10,000 $5,000
10 20 30 40
Mixed costs are usually separated into their fixed and variable components for management analysis.
Mixed costs are usually separated into their fixed and variable components for management analysis.
Mixed costs are sometimes called semivariable or semifixed costs.
Mixed costs are sometimes called semivariable or semifixed costs.
C3 - 10
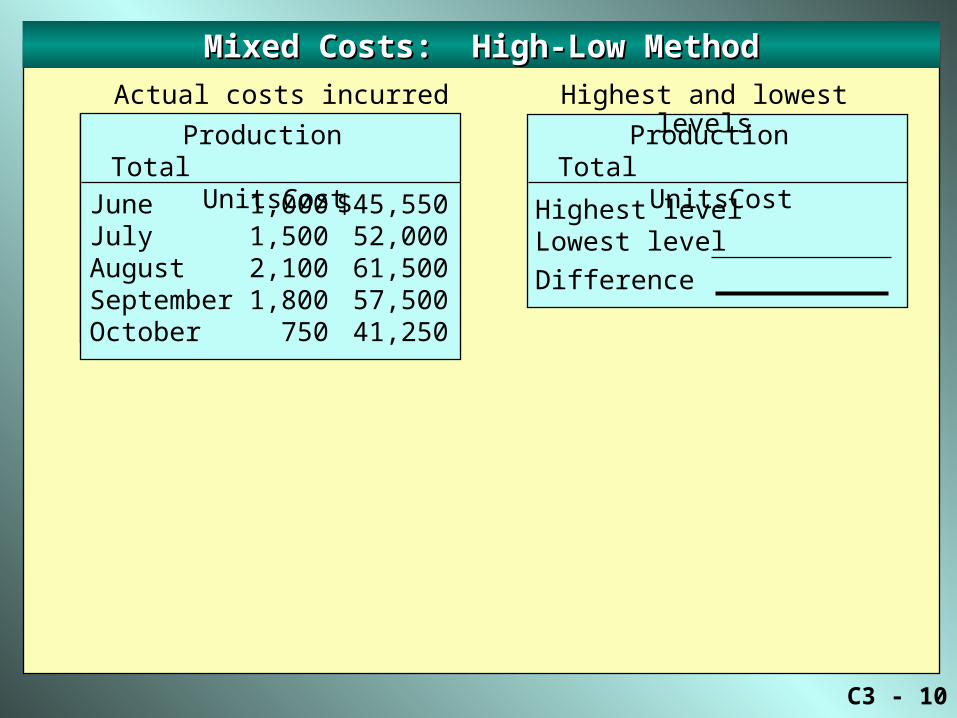
Mixed Costs: High-Low MethodMixed Costs: High-Low Method
Actual costs incurred
June 1,000 $45,550July 1,500 52,000August 2,100 61,500September 1,800 57,500October 750 41,250
Production TotalUnits Cost
Highest level Lowest level
Difference
Production TotalUnits Cost
Highest and lowest levels

C3 - 11
Mixed Costs: High-Low MethodMixed Costs: High-Low Method
Actual costs incurred
Production TotalUnits Cost
Highest level 2,100 $61,500Lowest level
Difference
Production TotalUnits Cost
Highest and lowest levels
June 1,000 $45,550July 1,500 52,000August 2,100 61,500September 1,800 57,500October 750 41,250

C3 - 12
Mixed Costs: High-Low MethodMixed Costs: High-Low Method
Actual costs incurred
Production TotalUnits Cost
Highest level 2,100 $61,500Lowest level 750 41,250
Difference
Production TotalUnits Cost
Highest and lowest levels
June 1,000 $45,550July 1,500 52,000August 2,100 61,500September 1,800 57,500October 750 41,250

C3 - 13
Mixed Costs: High-Low MethodMixed Costs: High-Low Method
Actual costs incurred
Production TotalUnits Cost
Variable costper unit
Difference in total costDifference in production
=
Highest level 2,100 $61,500Lowest level 750 41,250
Difference 1,350 $20,250
Production TotalUnits Cost
Highest and lowest levels
11
June 1,000 $45,550July 1,500 52,000August 2,100 61,500September 1,800 57,500October 750 41,250

C3 - 14
Mixed Costs: High-Low MethodMixed Costs: High-Low Method
Actual costs incurred
June 1,000 $45,550July 1,500 52,000August 2,100 61,500September 1,800 57,500October 750 41,250
Production TotalUnits Cost
Variable costper unit
Difference in total costDifference in production
$20,2501,350 units
= = =
Production TotalUnits Cost
Highest and lowest levels
11 $15
Highest level 2,100 $61,500Lowest level 750 41,250
Difference 1,350 $20,250
C3 - 15
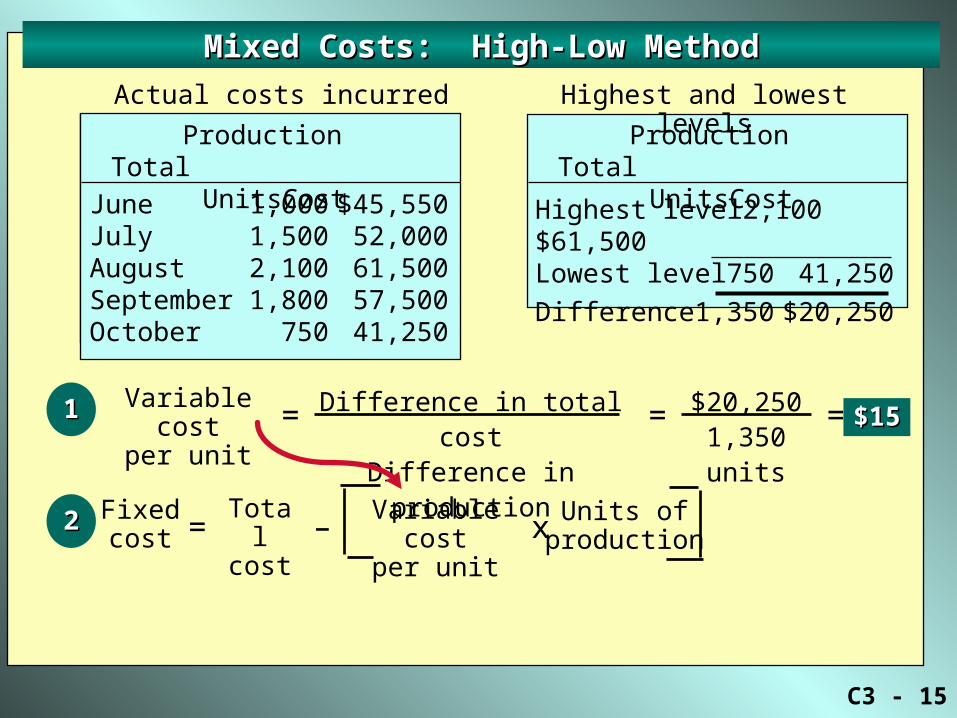
Mixed Costs: High-Low MethodMixed Costs: High-Low Method
Actual costs incurred
June 1,000 $45,550July 1,500 52,000August 2,100 61,500September 1,800 57,500October 750 41,250
Production TotalUnits Cost
Variable costper unit
Difference in total costDifference in production
$20,2501,350 units
$15$15= = =
Totalcost= –
Fixedcost
Highest level 2,100 $61,500Lowest level 750 41,250
Difference 1,350 $20,250
Production TotalUnits Cost
Highest and lowest levels
Variable costper unit x
Units ofproduction
11
22
C3 - 16
Mixed Costs: High-Low MethodMixed Costs: High-Low Method
Actual costs incurred
June 1,000 $45,550July 1,500 52,000August 2,100 61,500September 1,800 57,500October 750 41,250
Production TotalUnits Cost
Variable costper unit
Difference in total costDifference in production
$20,2501,350 units
$15$15= = =
Totalcost= –
Fixedcost
Highest level 2,100 $61,500Lowest level 750 41,250
Difference 1,350 $20,250
Production TotalUnits Cost
Highest and lowest levels
Variable costper unit x
Units ofproduction
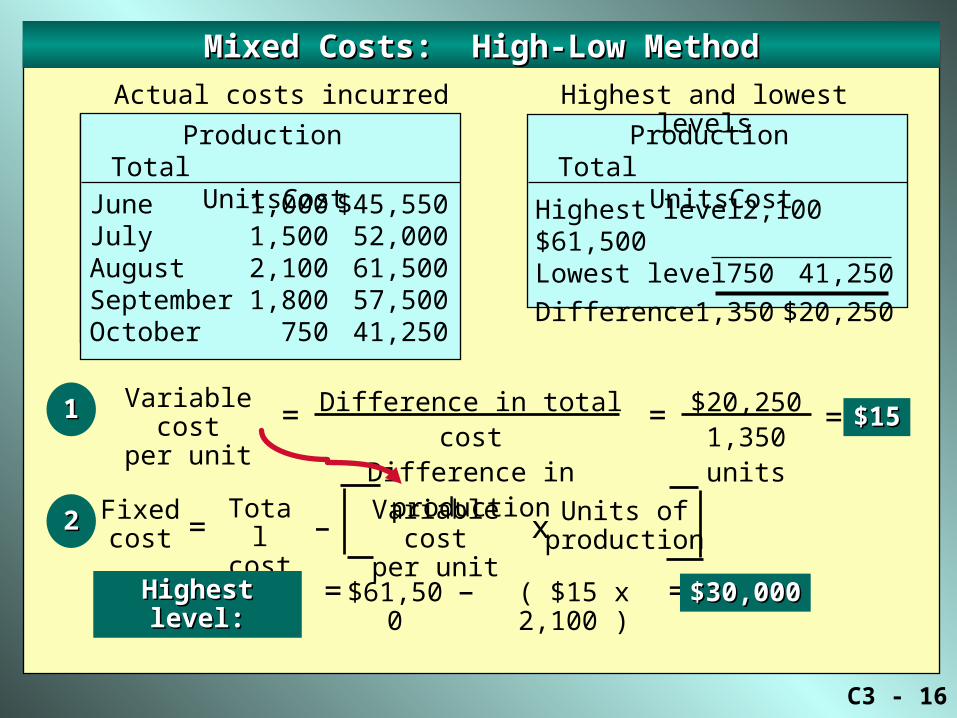
Highest level:Highest level: $61,500= – ( $15 x 2,100 ) = $30,000$30,000
11
22
C3 - 17
Mixed Costs: High-Low MethodMixed Costs: High-Low Method
Actual costs incurred
June 1,000 $45,550July 1,500 52,000August 2,100 61,500September 1,800 57,500October 750 41,250
Production TotalUnits Cost
Variable costper unit
Difference in total costDifference in production
$20,2501,350 units
$15$15= = =
Totalcost= –
Fixedcost
Highest level 2,100 $61,500Lowest level 750 41,250
Difference 1,350 $20,250
Production TotalUnits Cost
Highest and lowest levels
Variable costper unit x
Units ofproduction
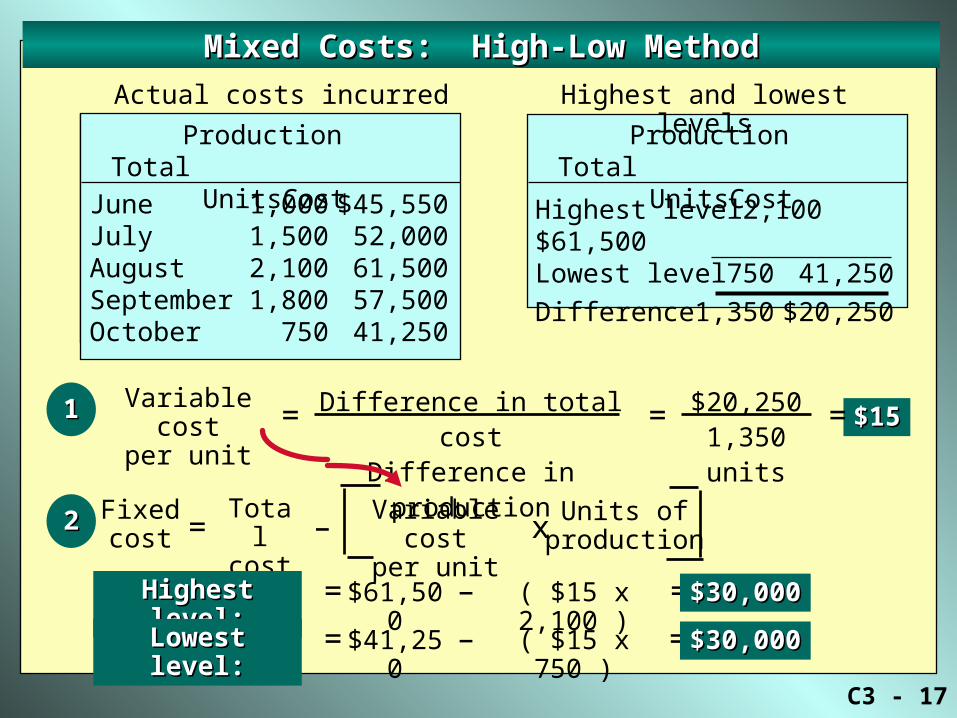
Highest level:Highest level: $61,500= – ( $15 x 2,100 ) = $30,000$30,000
Lowest level:Lowest level: $41,250= – ( $15 x 750 ) = $30,000$30,000
11
22
C3 - 18
Mixed Costs: High-Low MethodMixed Costs: High-Low Method
Actual costs incurred
June 1,000 $45,550July 1,500 52,000August 2,100 61,500September 1,800 57,500October 750 41,250
Production TotalUnits Cost
Variable costper unit
Difference in total costDifference in production
$20,2501,350 units
$15= = =
Totalcost= –
Fixedcost
Highest level 2,100 $61,500Lowest level 750 41,250
Difference 1,350 $20,250
Production TotalUnits Cost
Highest and lowest levels
Variable costper unit x
Units ofproduction
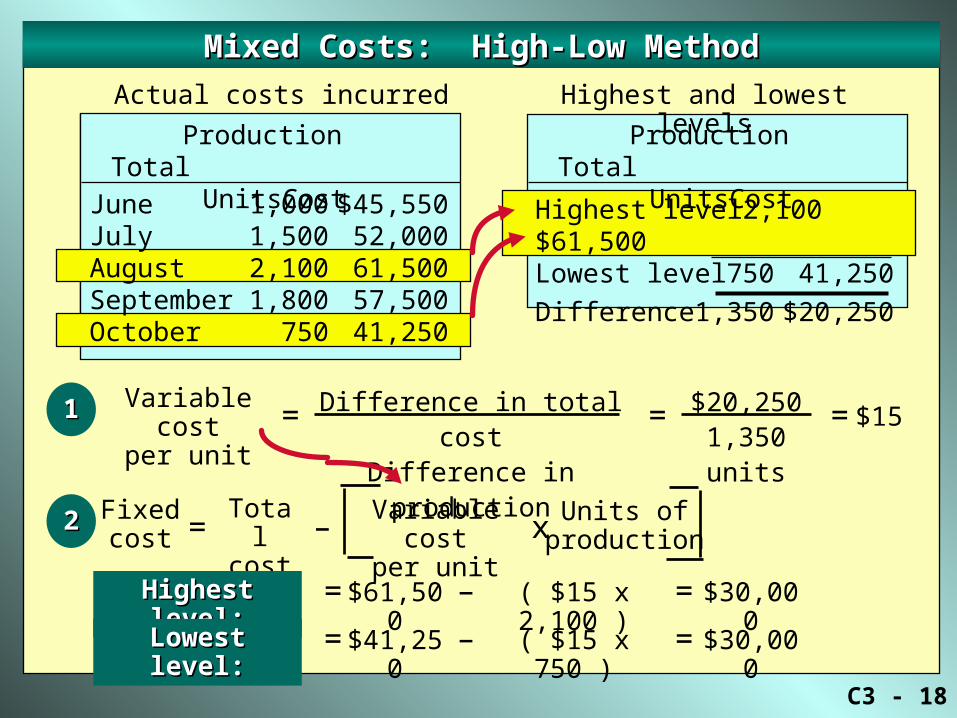
Highest level:Highest level: $61,500= – ( $15 x 2,100 ) = $30,000
Lowest level:Lowest level: $41,250= – ( $15 x 750 ) = $30,000
11
22

C3 - 19
Variable CostsVariable Costs
Total Fixed Costs
Total Units Produced
Tot
al C
osts
Unit Fixed Costs
Total Units ProducedP
er U
nit
Cos
t
Total Variable Costs
Total Units Produced
Unit Variable Costs
Total Units Produced
Tot
al C
osts
Per
Uni
t C
ost
Fixed CostsFixed Costs

C3 - 20
Variable CostsVariable Costs
Total Fixed Costs
Total Units Produced
Tot
al C
osts
Unit Fixed Costs
Total Units ProducedP
er U
nit
Cos
t
Total Variable Costs
Total Units Produced
Unit Variable Costs
Total Units Produced
Tot
al C
osts
Per
Uni
t C
ost
Fixed CostsFixed Costs
Used for planning.Remains the same
regardless of activity
level.
$10 per unit
$75,000total

C3 - 21
Sales (50,000 units) $1,000,000Variable costs 600,000Contribution margin $400,000 Fixed costs 300,000Income from operations $100,000
Contribution Margin Income StatementContribution Margin Income Statement
Total The contribution
margin is available to
cover the fixed costs and
income from operations.
The contribution
margin is available to
cover the fixed costs and
income from operations.
SalesSales
Variable costsVariable costs
Fixed costsFixed costs
Income from operationsIncome from operations
C3 - 22
Contribution Margin Income StatementContribution Margin Income Statement
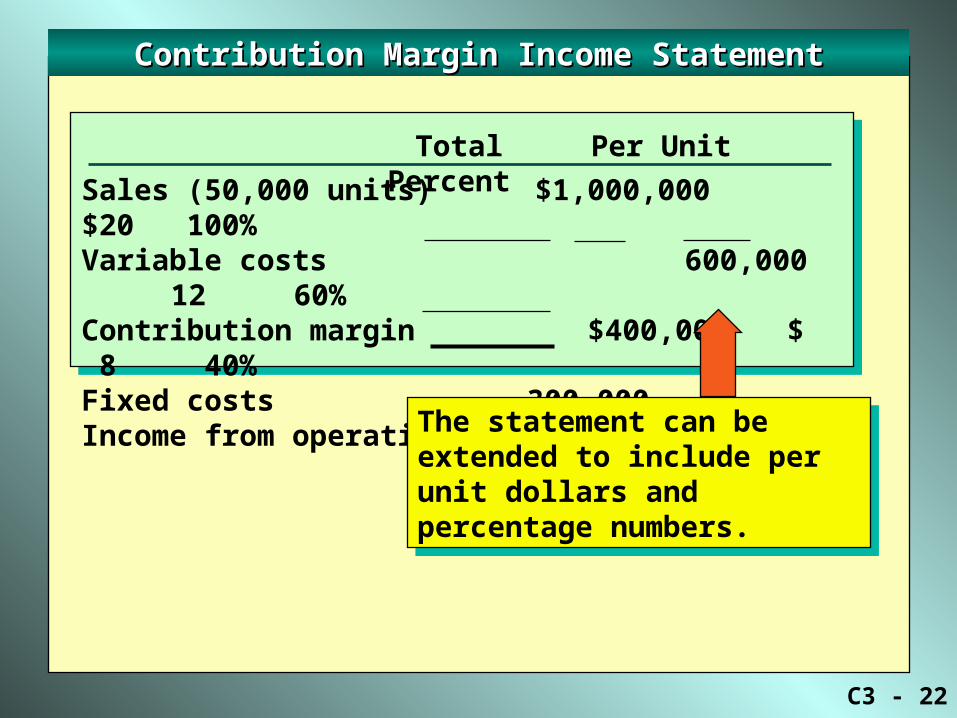
Sales (50,000 units) $1,000,000 $20 100%Variable costs 600,000 12 60%Contribution margin $400,000 $ 8 40%Fixed costs 300,000Income from operations $100,000
Total Per Unit Percent
The statement can be extended to include per unit dollars and percentage numbers.
The statement can be extended to include per unit dollars and percentage numbers.

C3 - 23
Sales (50,000 units) $1,000,000 $20 100%Variable costs 600,000 12 60%Contribution margin $400,000 $ 8 40%Fixed costs 300,000Income from operations $100,000
Contribution Margin Income StatementContribution Margin Income Statement
Total Per Unit Percent
Sales Sales VariableVariablecosts costs
FixedFixedcosts costs
Income Income fromfrom
operations operations = + +
Sales Sales VariableVariablecosts costs
ContributionContributionmarginmargin
– =
C3 - 24
Contribution Margin Income StatementContribution Margin Income Statement
Total Per Unit Percent
Unit Contribution MarginUnit Contribution Margin
Contribution Margin RatioContribution Margin Ratio
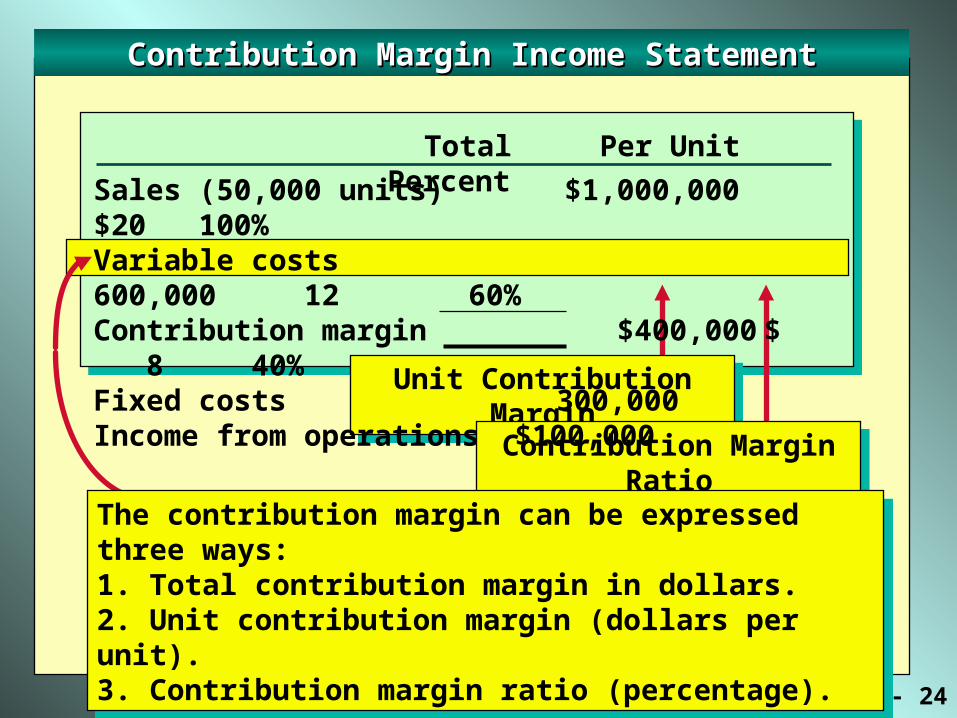
Sales (50,000 units) $1,000,000 $20 100%Variable costs 600,000 12 60%Contribution margin $400,000 $ 8 40%Fixed costs 300,000Income from operations $100,000
The contribution margin can be expressed three ways:1. Total contribution margin in dollars.2. Unit contribution margin (dollars per unit).3. Contribution margin ratio (percentage).
The contribution margin can be expressed three ways:1. Total contribution margin in dollars.2. Unit contribution margin (dollars per unit).3. Contribution margin ratio (percentage).
C3 - 25
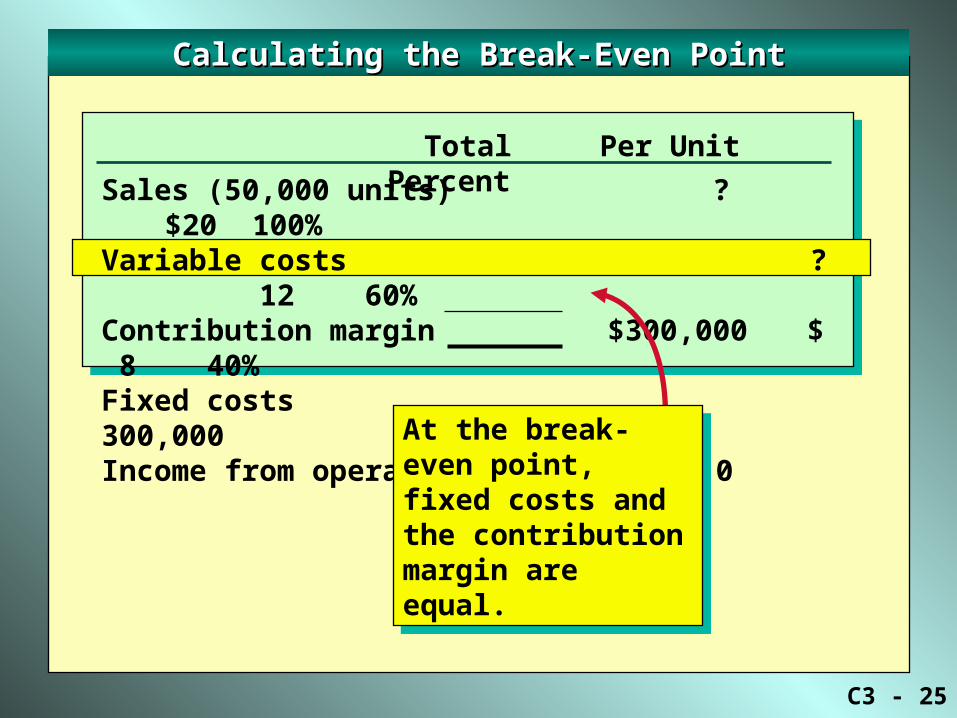
Sales (50,000 units) ? $20 100%Variable costs ? 12 60%Contribution margin $300,000 $ 8 40%Fixed costs 300,000Income from operations $ 0
Calculating the Break-Even PointCalculating the Break-Even Point
Total Per Unit Percent
At the break-even point, fixed costs and the contribution margin are equal.
At the break-even point, fixed costs and the contribution margin are equal.

C3 - 26
Calculating the Break-Even PointCalculating the Break-Even Point
Total Per Unit Percent
Break-evenBreak-evensales sales FixedFixed
costs costs = /
ContributionContributionmarginmargin
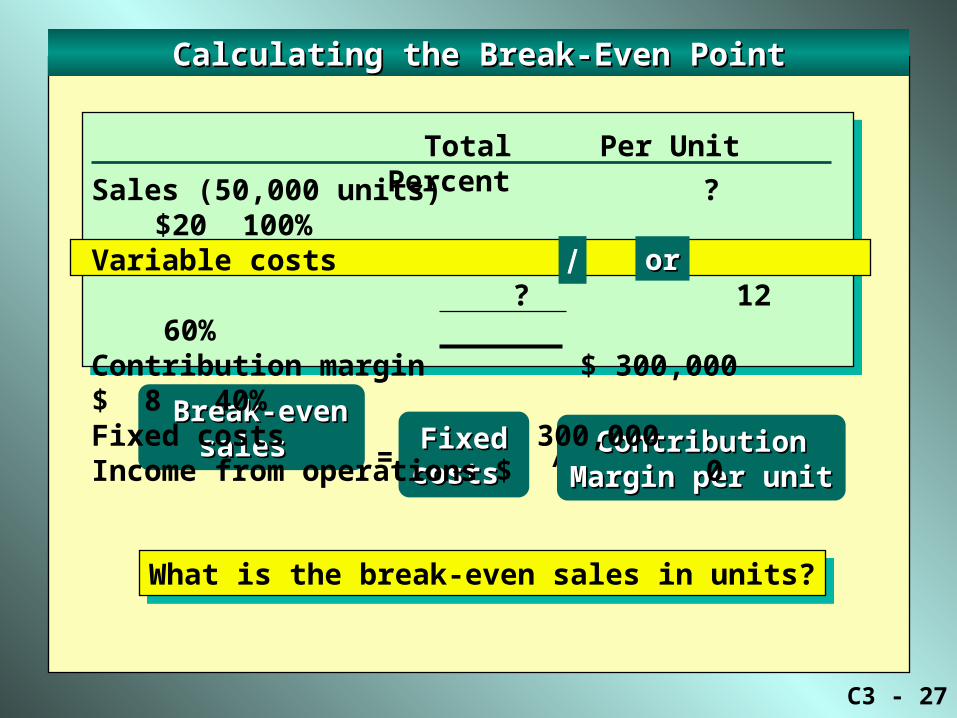
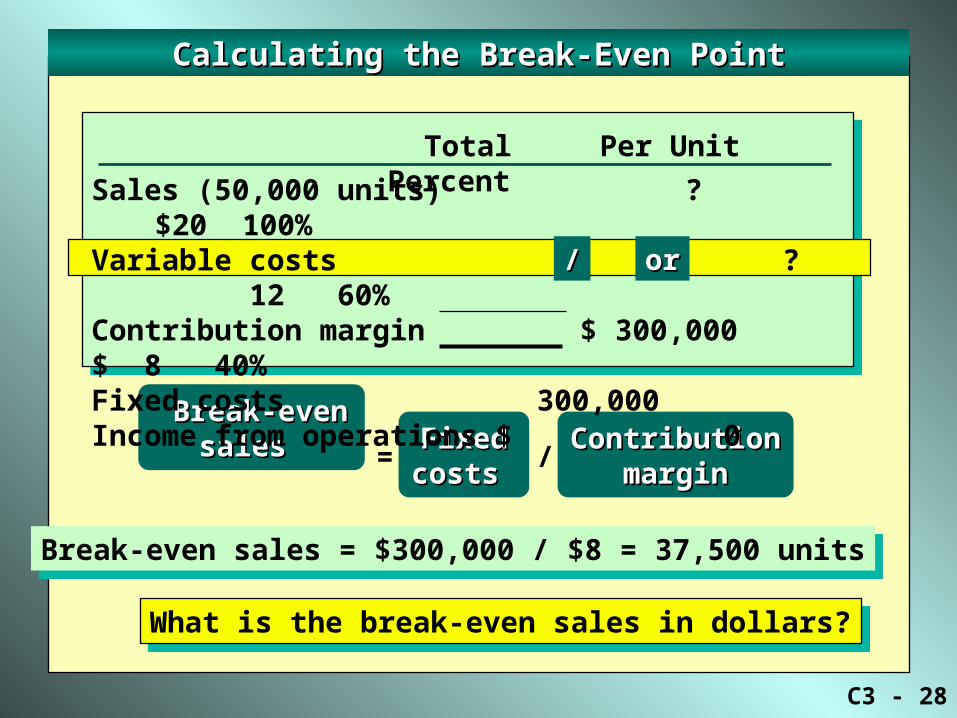
Sales (50,000 units) ? $20 100%Variable costs ? 12 60%Contribution margin $ 300,000 $ 8 40%Fixed costs 300,000Income from operations $ 0
// oror
Divide by either: $8 per unit or 40%
C3 - 27
Calculating the Break-Even PointCalculating the Break-Even Point
Total Per Unit Percent
Break-evenBreak-evensales sales FixedFixed
costs costs = / ContributionContribution
Margin per unitMargin per unit
Sales (50,000 units) ? $20 100%Variable costs ? 12 60%Contribution margin $ 300,000 $ 8 40%Fixed costs 300,000Income from operations $ 0
oror
What is the break-even sales in units?What is the break-even sales in units?
C3 - 28
Calculating the Break-Even PointCalculating the Break-Even Point
Total Per Unit Percent
Break-evenBreak-evensales sales FixedFixed
costs costs = /
ContributionContributionmarginmargin
Break-even sales = $300,000 / $8 = 37,500 unitsBreak-even sales = $300,000 / $8 = 37,500 units
Sales (50,000 units) ? $20 100%Variable costs ? 12 60%Contribution margin $ 300,000 $ 8 40%Fixed costs 300,000Income from operations $ 0
What is the break-even sales in dollars?What is the break-even sales in dollars?
// oror

C3 - 29
Calculating the Break-Even PointCalculating the Break-Even Point
Total Per Unit Percent
Break-evenBreak-evensales sales FixedFixed
costs costs = /
ContributionContributionmarginmargin
Break-even sales = $300,000 / $8 = 37,500 unitsBreak-even sales = $300,000 / $8 = 37,500 units
Break-even sales = $300,000 / 40% = $750,000Break-even sales = $300,000 / 40% = $750,000
Sales (50,000 units) ? $20 100%Variable costs ? 12 60%Contribution margin $ 300,000 $ 8 40%Fixed costs 300,000Income from operations $ 0
// oror
C3 - 30
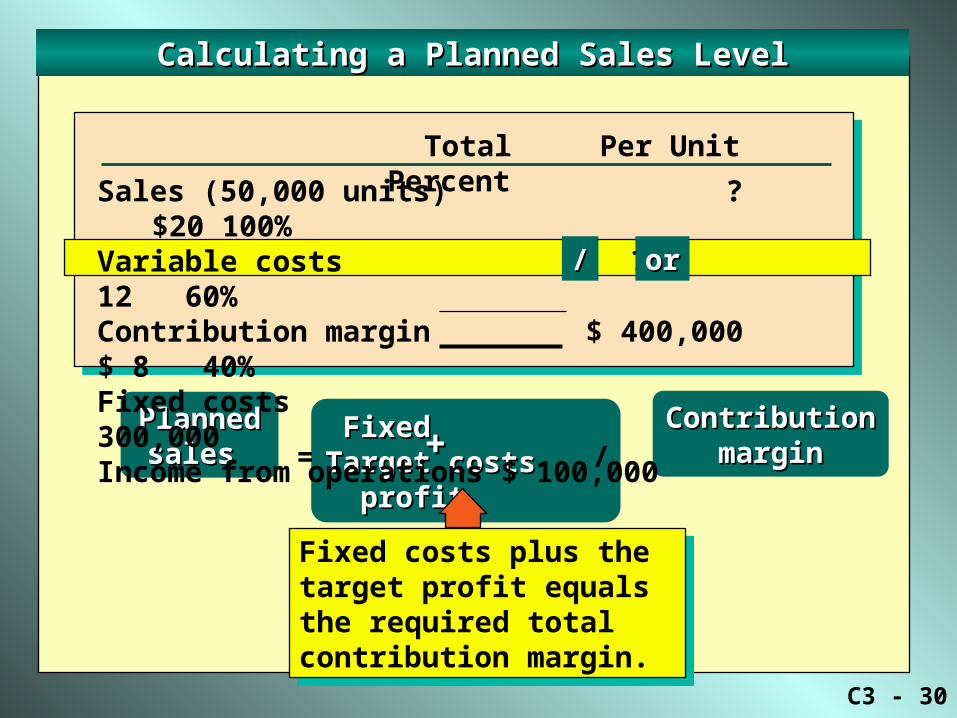
Calculating a Planned Sales LevelCalculating a Planned Sales Level
Total Per Unit Percent
PlannedPlannedsales sales
Fixed Fixed Target Target costs profit costs profit = /
ContributionContributionmarginmargin
Sales (50,000 units) ? $20 100%Variable costs ? 12 60%Contribution margin $ 400,000 $ 8 40%Fixed costs 300,000Income from operations $ 100,000
++
// oror
Fixed costs plus the target profit equals the required total contribution margin.
Fixed costs plus the target profit equals the required total contribution margin.

C3 - 31
Calculating a Planned Sales LevelCalculating a Planned Sales Level
Total Per Unit Percent
PlannedPlannedsales sales
Fixed TargetFixed Targetcosts profit costs profit = /
ContributionContributionmarginmargin
Sales (50,000 units) ? $20 100%Variable costs ? 12 60%Contribution margin $ 400,000 $ 8 40%Fixed costs 300,000Income from operations $ 100,000
++
// oror
$8 per unit or 40% $8 per unit or 40%

C3 - 32
Sales (50,000 units) ? $20 100%Variable costs ? 12 60%Contribution margin $ 400,000 $ 8 40%Fixed costs 300,000Income from operations $ 100,000
Calculating a Planned Sales LevelCalculating a Planned Sales Level
Total Per Unit Percent
PlannedPlannedsales sales
Fixed TargetFixed Targetcosts profit costs profit = /
ContributionContributionmarginmargin++
// oror
What is the planned sales level in units?What is the planned sales level in units?
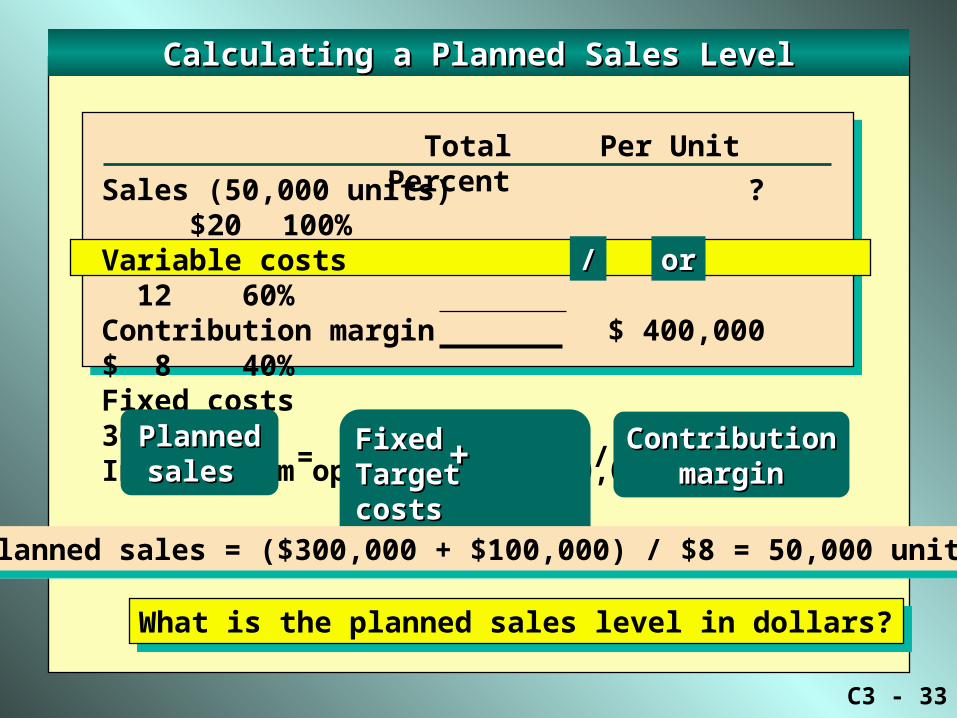
C3 - 33
Sales (50,000 units) ? $20 100%Variable costs ? 12 60%Contribution margin $ 400,000 $ 8 40%Fixed costs 300,000Income from operations $ 100,000
Calculating a Planned Sales LevelCalculating a Planned Sales Level
PlannedPlannedsales sales
Fixed TargetFixed Targetcosts profit costs profit = /
ContributionContributionmarginmargin
Planned sales = ($300,000 + $100,000) / $8 = 50,000 unitsPlanned sales = ($300,000 + $100,000) / $8 = 50,000 units
++
What is the planned sales level in dollars?What is the planned sales level in dollars?
Total Per Unit Percent
// oror

C3 - 34
Calculating a Planned Sales LevelCalculating a Planned Sales Level
Total Per Unit Percent
PlannedPlannedsales sales
Fixed TargetFixed Targetcosts profit costs profit = /
ContributionContributionmarginmargin
Planned sales = ($300,000 + $100,000) / $8 = 50,000 unitsPlanned sales = ($300,000 + $100,000) / $8 = 50,000 units
++
Planned sales = ($300,000 + $100,000) / 40% = $1,000,000Planned sales = ($300,000 + $100,000) / 40% = $1,000,000
// oror
$1,000,000$1,000,000
Sales (50,000 units) $1,000,000 $20 100%Variable costs 600,000 12 60%Contribution margin $ 400,000 $ 8 40%Fixed costs 300,000Income from operations $ 100,000

C3 - 35
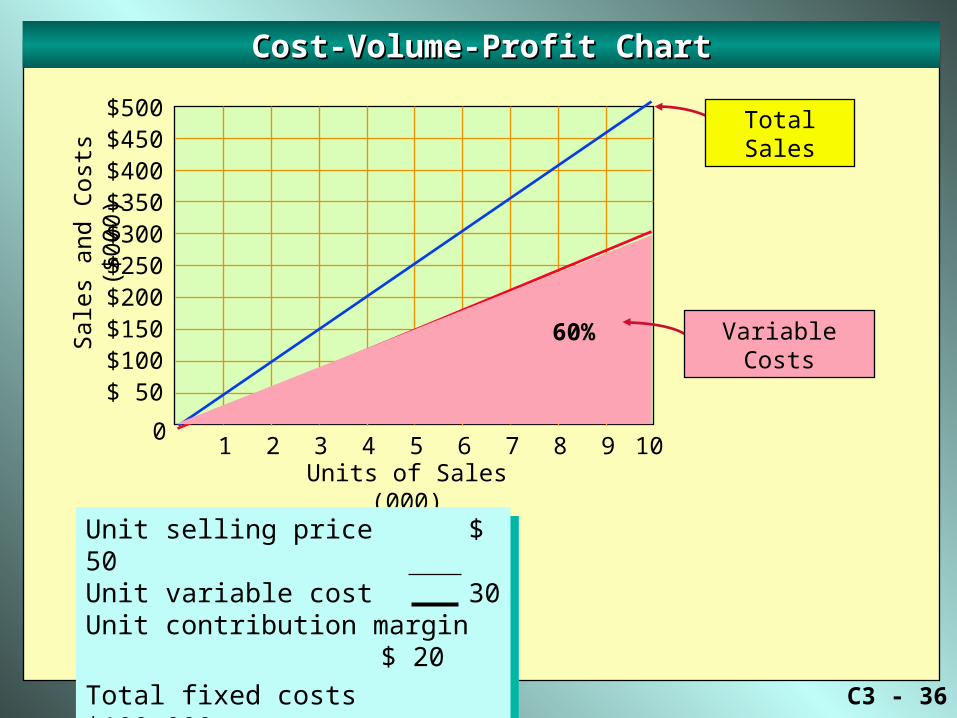
Cost-Volume-Profit ChartCost-Volume-Profit ChartS
ales
and
Cos
ts (
$000
)
0
Units of Sales (000)
$500$450$400$350$300$250$200$150$100$ 50
Unit selling price $ 50Unit variable cost 30Unit contribution margin $ 20
Total fixed costs $100,000
Unit selling price $ 50Unit variable cost 30Unit contribution margin $ 20
Total fixed costs $100,000
Total Sales
1 2 3 4 5 6 7 8 9 10
C3 - 36
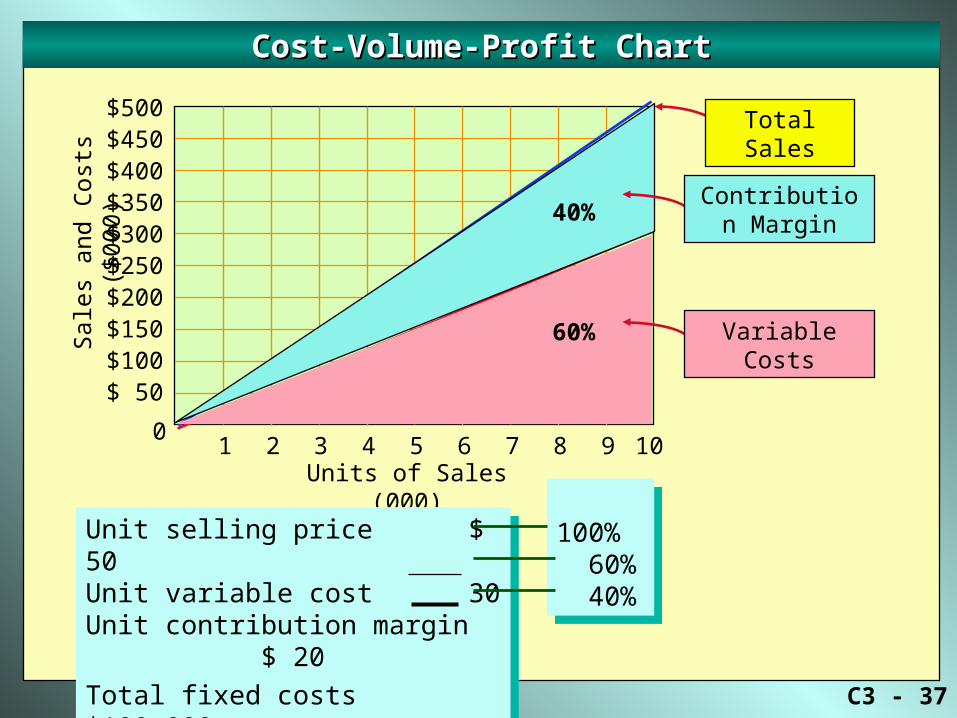
Cost-Volume-Profit ChartCost-Volume-Profit ChartS
ales
and
Cos
ts (
$000
)
0
Units of Sales (000)
$500$450$400$350$300$250$200$150$100$ 50
1 2 3 4 5 6 7 8 9 10
Unit selling price $ 50Unit variable cost 30Unit contribution margin $ 20
Total fixed costs $100,000
Unit selling price $ 50Unit variable cost 30Unit contribution margin $ 20
Total fixed costs $100,000
Total Sales
Variable Costs60%
C3 - 37
100% 60% 40%
100% 60% 40%
Cost-Volume-Profit ChartCost-Volume-Profit ChartS
ales
and
Cos
ts (
$000
)
0
Units of Sales (000)
$500$450$400$350$300$250$200$150$100$ 50
1 2 3 4 5 6 7 8 9 10
Unit selling price $ 50Unit variable cost 30Unit contribution margin $ 20
Total fixed costs $100,000
Unit selling price $ 50Unit variable cost 30Unit contribution margin $ 20
Total fixed costs $100,000
Total Sales
Variable Costs
Contribution Margin40%
60%
C3 - 38
Cost-Volume-Profit ChartCost-Volume-Profit ChartS
ales
and
Cos
ts (
$000
)
0
Units of Sales (000)
$500$450$400$350$300$250$200$150$100$ 50
1 2 3 4 5 6 7 8 9 10
Unit selling price $ 50Unit variable cost 30Unit contribution margin $ 20
Total fixed costs $100,000
Unit selling price $ 50Unit variable cost 30Unit contribution margin $ 20
Total fixed costs $100,000
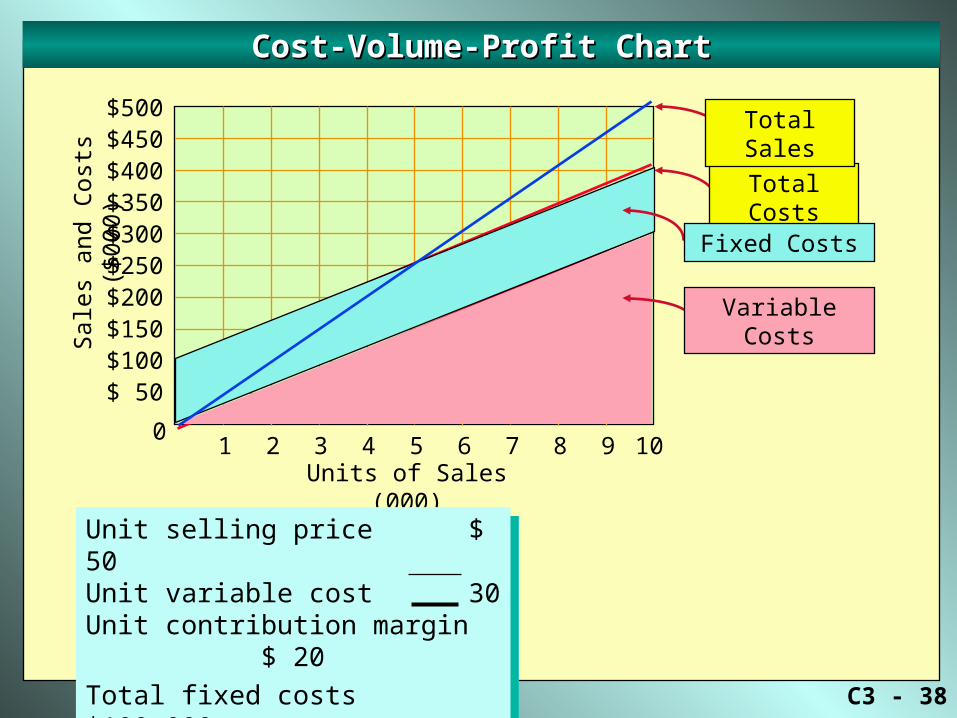
Total Costs
Total Sales
Fixed Costs
Variable Costs
C3 - 39
Cost-Volume-Profit ChartCost-Volume-Profit ChartS
ales
and
Cos
ts (
$000
)
0
Units of Sales (000)
$500$450$400$350$300$250$200$150$100$ 50
1 2 3 4 5 6 7 8 9 10
Unit selling price $ 50Unit variable cost 30Unit contribution margin $ 20
Total fixed costs $100,000
Unit selling price $ 50Unit variable cost 30Unit contribution margin $ 20
Total fixed costs $100,000
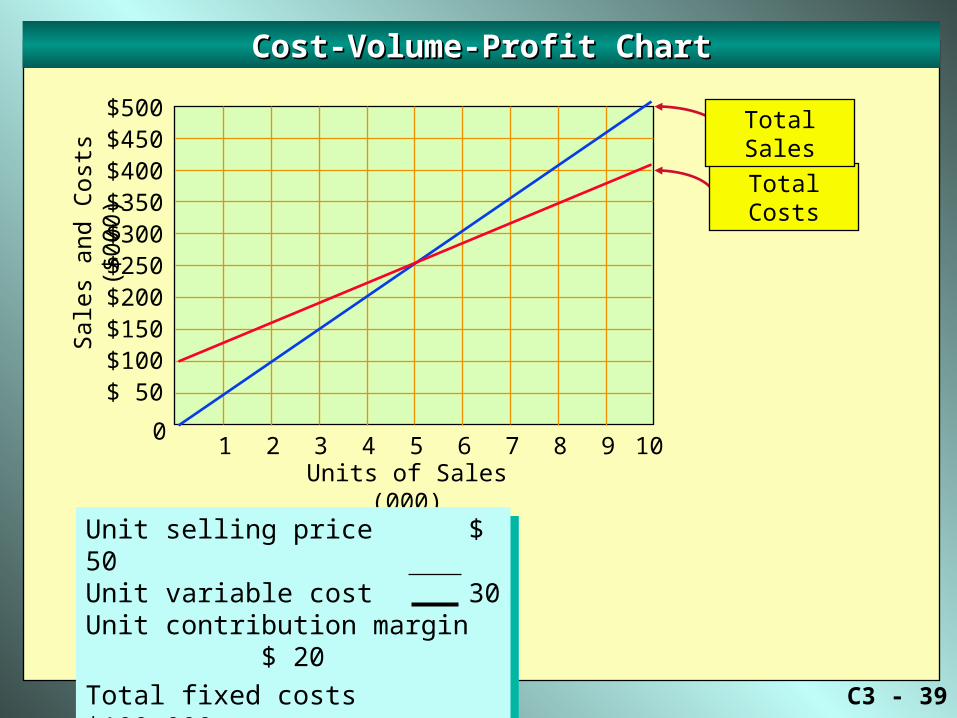
Total Costs
Total Sales

C3 - 40
Cost-Volume-Profit ChartCost-Volume-Profit ChartS
ales
and
Cos
ts (
$000
)
0
Units of Sales (000)
$500$450$400$350$300$250$200$150$100$ 50
1 2 3 4 5 6 7 8 9 10
Unit selling price $ 50Unit variable cost 30Unit contribution margin $ 20
Total fixed costs $100,000
Unit selling price $ 50Unit variable cost 30Unit contribution margin $ 20
Total fixed costs $100,000
Operating Loss Area
Operating Profit AreaTotal Costs
Total Sales
C3 - 41
Cost-Volume-Profit ChartCost-Volume-Profit ChartS
ales
and
Cos
ts (
$000
)
0
Units of Sales (000)
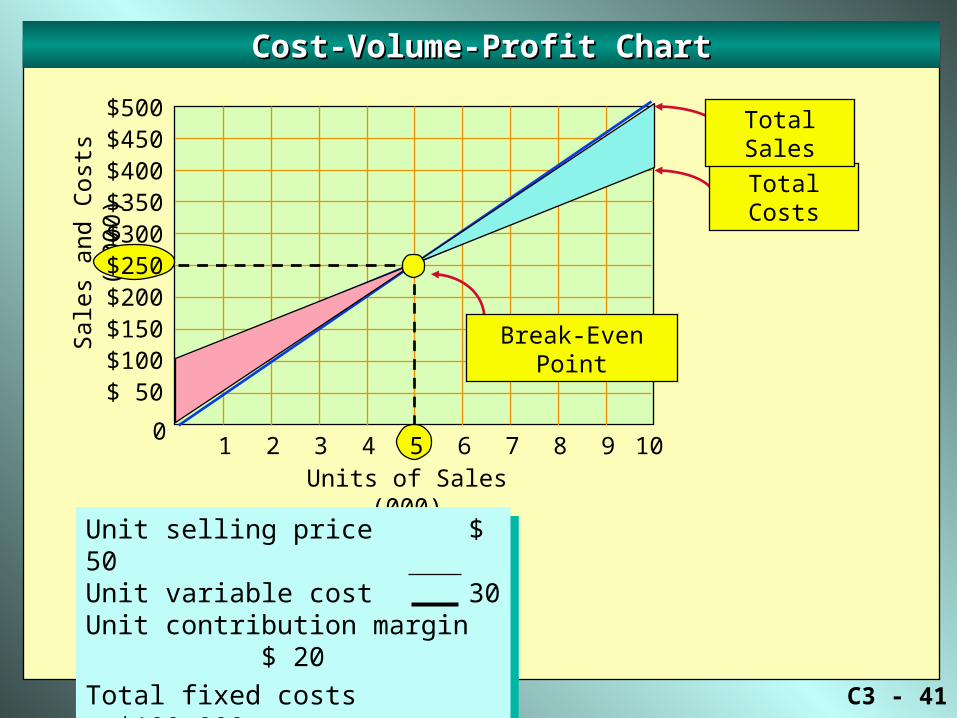
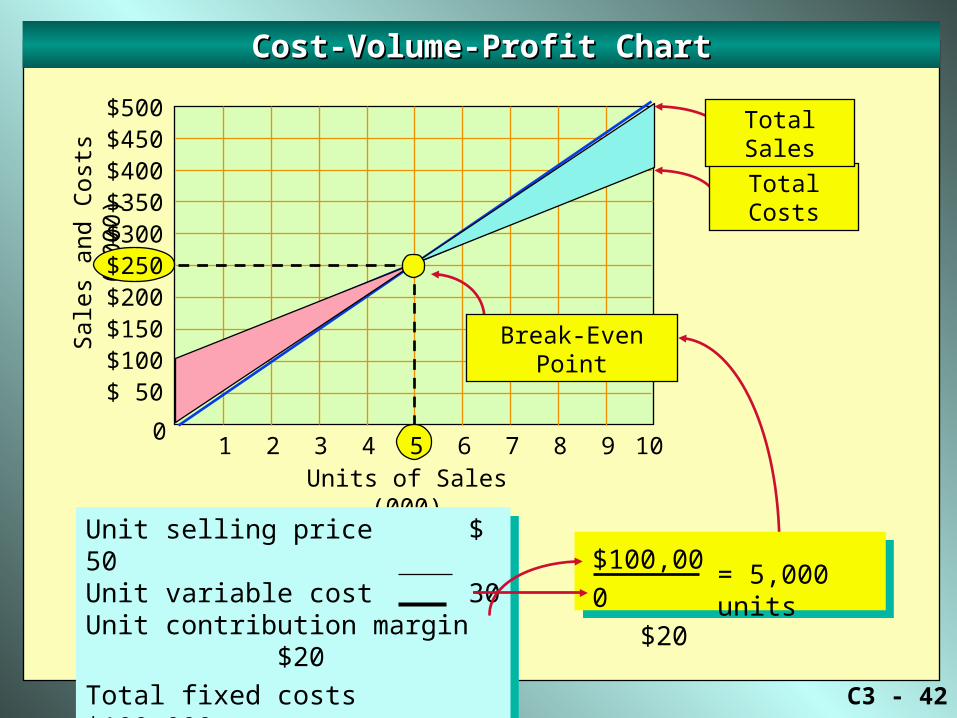
Break-Even Point
Unit selling price $ 50Unit variable cost 30Unit contribution margin $ 20
Total fixed costs $100,000
Unit selling price $ 50Unit variable cost 30Unit contribution margin $ 20
Total fixed costs $100,000
Total Costs
Total Sales
1 2 3 4 5 6 7 8 9 10
$500$450$400$350$300$250$200$150$100$ 50
C3 - 42
Cost-Volume-Profit ChartCost-Volume-Profit ChartS
ales
and
Cos
ts (
$000
)
0
Units of Sales (000)
Break-Even Point
Unit selling price $ 50Unit variable cost 30Unit contribution margin $20
Total fixed costs $100,000
Unit selling price $ 50Unit variable cost 30Unit contribution margin $20
Total fixed costs $100,000
Total Costs
Total Sales
$100,000
$20= 5,000 units
1 2 3 4 5 6 7 8 9 10
$500$450$400$350$300$250$200$150$100$ 50
C3 - 43
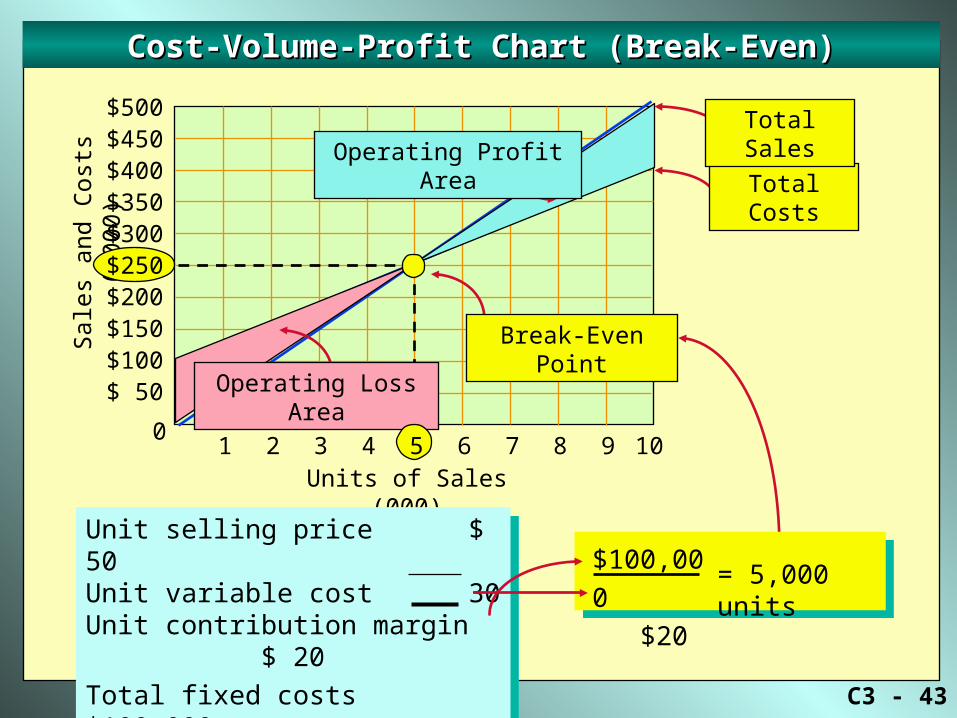
Cost-Volume-Profit Chart (Break-Even)Cost-Volume-Profit Chart (Break-Even)S
ales
and
Cos
ts (
$000
)
0
Units of Sales (000)
Break-Even Point
Unit selling price $ 50Unit variable cost 30Unit contribution margin $ 20
Total fixed costs $100,000
Unit selling price $ 50Unit variable cost 30Unit contribution margin $ 20
Total fixed costs $100,000
Operating Loss Area
Operating Profit AreaTotal Costs
Total Sales
$100,000
$20= 5,000 units
1 2 3 4 5 6 7 8 9 10
$500$450$400$350$300$250$200$150$100$ 50

C3 - 44
Revised Cost-Volume-Profit ChartRevised Cost-Volume-Profit ChartS
ales
and
Cos
ts (
$000
)
0
Units of Sales (000)
Revised Break-Even Point
Unit selling price $ 50Unit variable cost 30Unit contribution margin $ 20
Total fixed costs $80,000
Unit selling price $ 50Unit variable cost 30Unit contribution margin $ 20
Total fixed costs $80,000
Operating Loss Area
Operating Profit Area
Total Costs
Total Sales
$80,000
$20= 4,000 units
1 2 3 4 5 6 7 8 9 10
$500$450$400$350$300$250$200$150$100$ 50

C3 - 45
Profit-Volume ChartProfit-Volume ChartO
pera
ting
Pro
fit(L
oss)
$00
0’s
$100$75$50$25$ 0
$(25)$(50)$(75)
$(100)
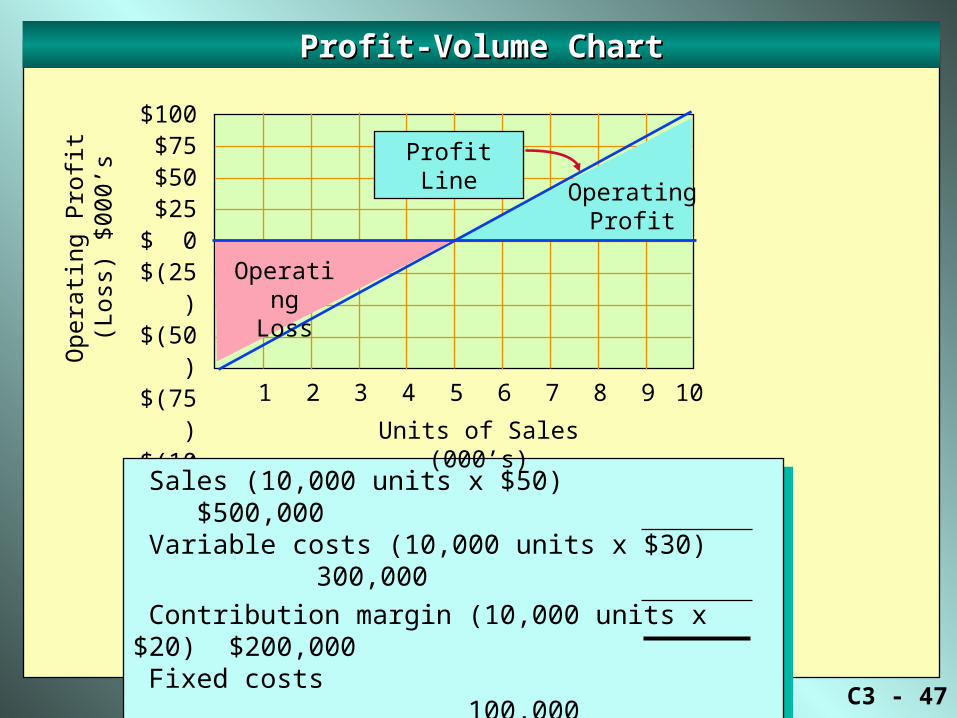
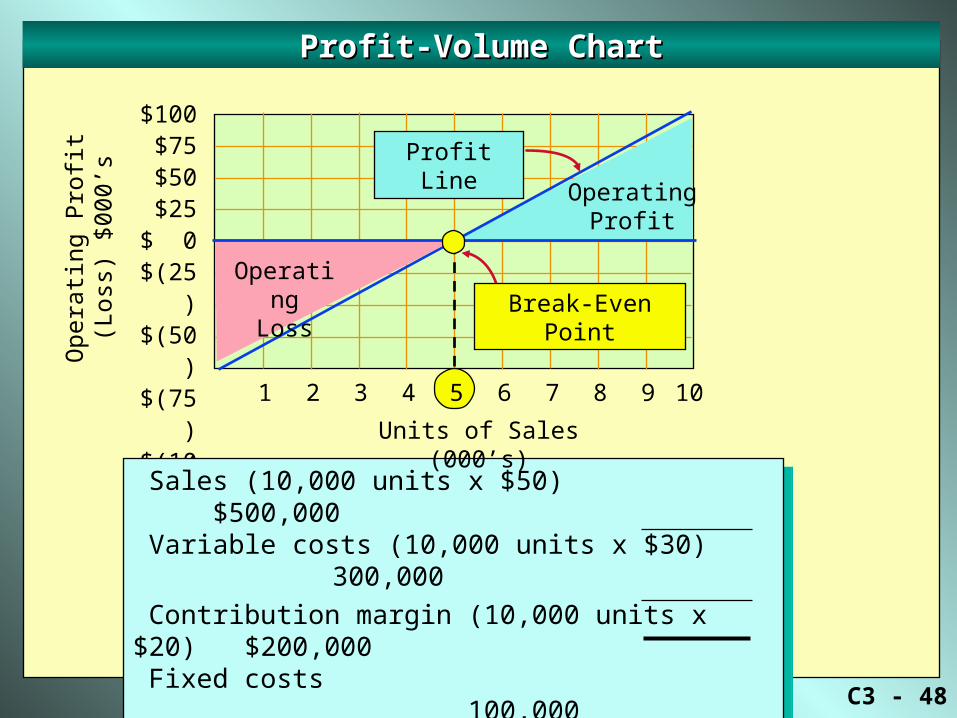
Sales (10,000 units x $50) $500,000 Variable costs (10,000 units x $30) 300,000
Contribution margin (10,000 units x $20) $200,000 Fixed costs 100,000
Operating profit $100,000
Sales (10,000 units x $50) $500,000 Variable costs (10,000 units x $30) 300,000
Contribution margin (10,000 units x $20) $200,000 Fixed costs 100,000
Operating profit $100,000
Units of Sales (000’s)
1 2 3 4 5 6 7 8 9 10
Relevant range is 10,000 units.
Relevant range is 10,000 units.
C3 - 46
Profit-Volume ChartProfit-Volume ChartO
pera
ting
Pro
fit(L
oss)
$00
0’s
$100$75$50$25$ 0
$(25)$(50)$(75)
$(100)
Sales (10,000 units x $50) $500,000 Variable costs (10,000 units x $30) 300,000
Contribution margin (10,000 units x $20) $200,000 Fixed costs 100,000
Operating profit $100,000
Sales (10,000 units x $50) $500,000 Variable costs (10,000 units x $30) 300,000
Contribution margin (10,000 units x $20) $200,000 Fixed costs 100,000
Operating profit $100,000
Units of Sales (000’s)
1 2 3 4 5 6 7 8 9 10
Maximum profit within the relevant range.
Maximum profit within the relevant range.
Maximum loss is equal to the total fixed costs.
Maximum loss is equal to the total fixed costs.
C3 - 47
Profit-Volume ChartProfit-Volume ChartO
pera
ting
Pro
fit(L
oss)
$00
0’s
$100$75$50$25$ 0
$(25)$(50)$(75)
$(100)
Sales (10,000 units x $50) $500,000 Variable costs (10,000 units x $30) 300,000
Contribution margin (10,000 units x $20) $200,000 Fixed costs 100,000
Operating profit $100,000
Sales (10,000 units x $50) $500,000 Variable costs (10,000 units x $30) 300,000
Contribution margin (10,000 units x $20) $200,000 Fixed costs 100,000
Operating profit $100,000
Profit Line
Units of Sales (000’s)
OperatingProfit
OperatingLoss
1 2 3 4 5 6 7 8 9 10
C3 - 48
Profit-Volume ChartProfit-Volume ChartO
pera
ting
Pro
fit(L
oss)
$00
0’s
$100$75$50$25$ 0
$(25)$(50)$(75)
$(100)
Sales (10,000 units x $50) $500,000 Variable costs (10,000 units x $30) 300,000
Contribution margin (10,000 units x $20) $200,000 Fixed costs 100,000
Operating profit $100,000
Sales (10,000 units x $50) $500,000 Variable costs (10,000 units x $30) 300,000
Contribution margin (10,000 units x $20) $200,000 Fixed costs 100,000
Operating profit $100,000
Profit Line
Units of Sales (000’s)
OperatingProfit
OperatingLoss Break-Even Point
1 2 3 4 5 6 7 8 9 10

C3 - 49
Sales Mix ConsiderationsSales Mix Considerations
Sales $ 90 $140 Variable costs 70 95 Contribution margin $ 20 $ 45 Sales mix 80% 20%
Contribution marginContribution margin Products A B
What is the average contribution for each product?
What is the average contribution for each product?
C3 - 50
Sales Mix ConsiderationsSales Mix Considerations
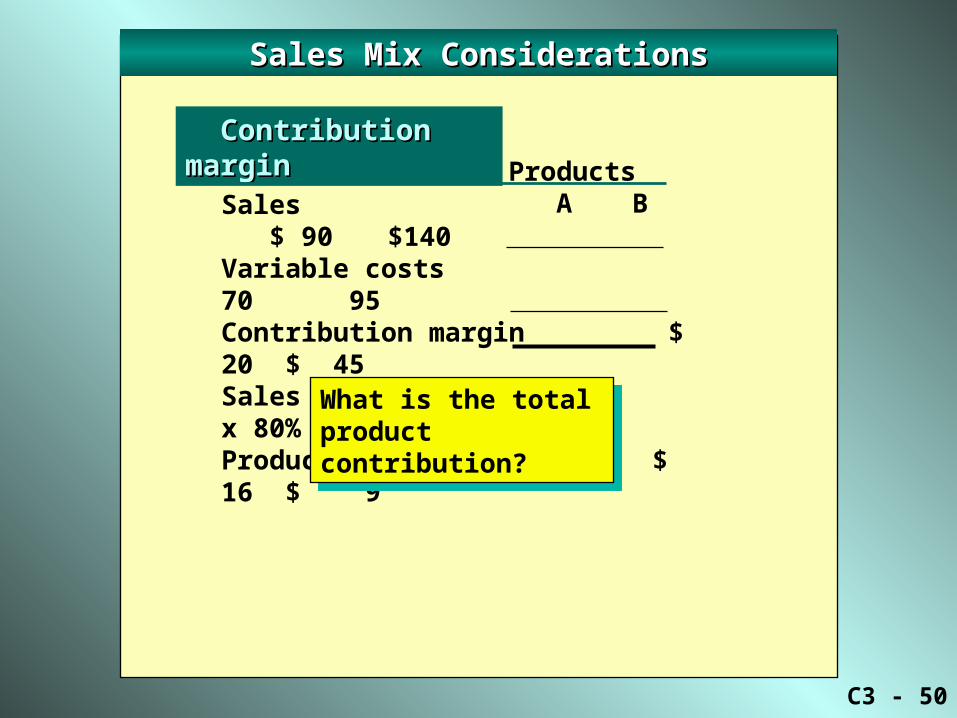
Sales $ 90 $140Variable costs 70 95Contribution margin $ 20 $ 45Sales mix x 80% x 20%Product contribution $ 16 $ 9
Contribution marginContribution margin Products A B
What is the total product contribution?
What is the total product contribution?

C3 - 51
Sales Mix ConsiderationsSales Mix Considerations
Sales $ 90 $140Variable costs 70 95Contribution margin $ 20 $ 45Sales mix x 80% x 20%Product contribution $ 16 $ 9
Total product contribution $ 25
Contribution marginContribution margin
Break-even sales unitsBreak-even sales units
Products A B
Total fixed costs $200,000
Product contribution $25
What is the break-even sales units?What is the break-even sales units?
C3 - 52
Sales Mix ConsiderationsSales Mix Considerations
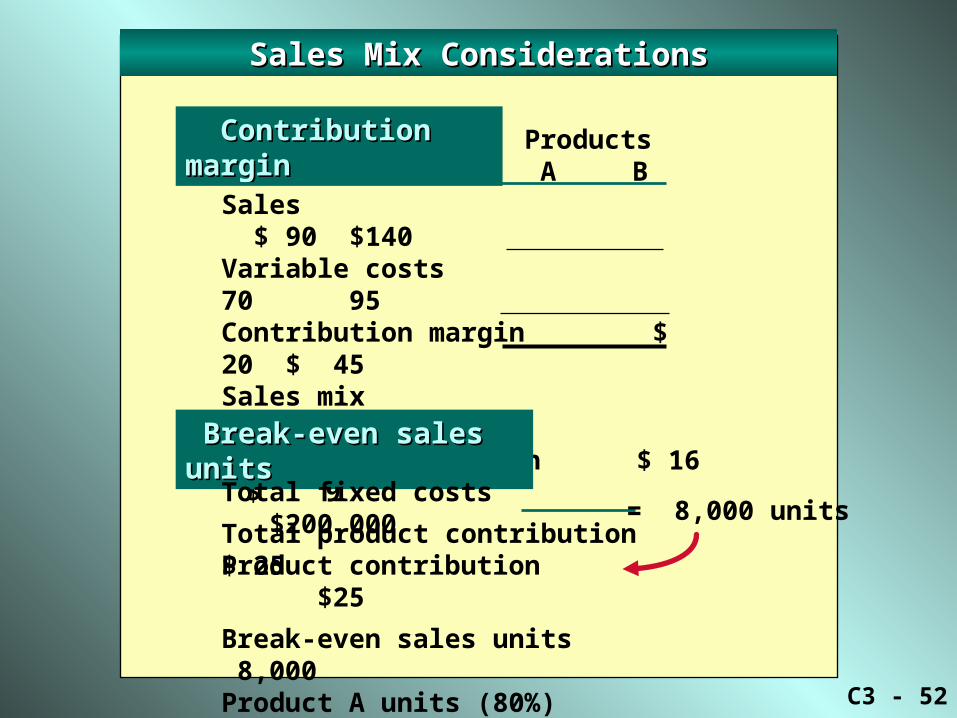
Sales $ 90 $140Variable costs 70 95Contribution margin $ 20 $ 45Sales mix x 80% x 20%Product contribution $ 16 $ 9
Total product contribution $ 25
Contribution marginContribution margin
Break-even sales unitsBreak-even sales units
Products A B
Total fixed costs $200,000
Product contribution $25
Break-even sales units 8,000Product A units (80%) 6,400Product B units (20%) 1,600
= 8,000 units
C3 - 53
Sales Mix ConsiderationsSales Mix Considerations
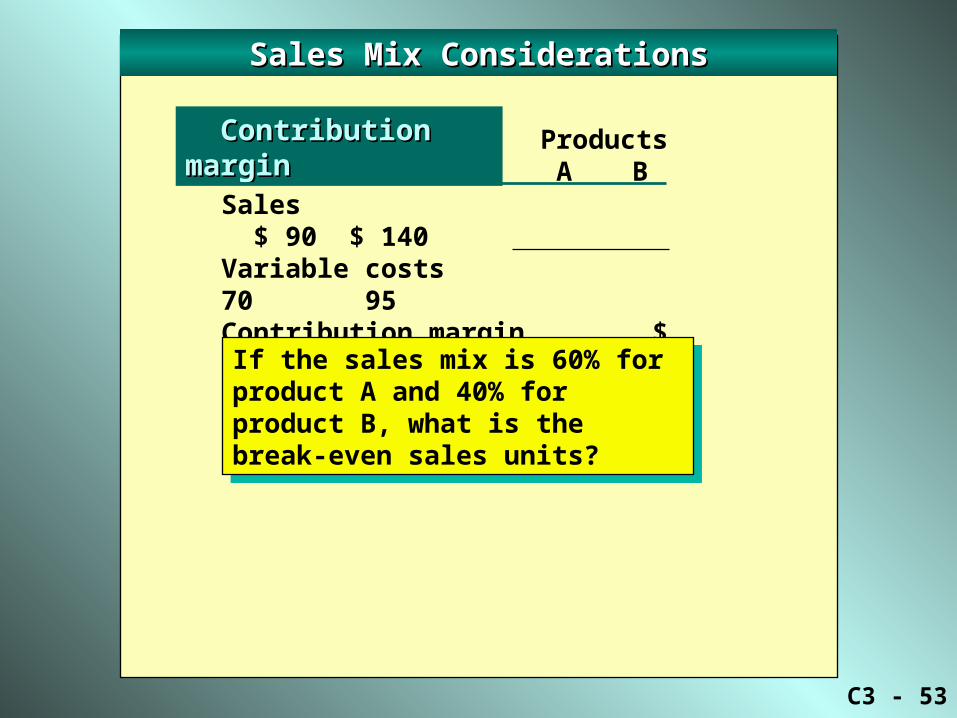
Sales $ 90 $ 140 Variable costs 70 95 Contribution margin $ 20 $ 45 Sales mix 60% 40%
Contribution marginContribution margin Products A B
If the sales mix is 60% for product A and 40% for product B, what is the break-even sales units?
If the sales mix is 60% for product A and 40% for product B, what is the break-even sales units?
C3 - 54
Sales Mix ConsiderationsSales Mix Considerations
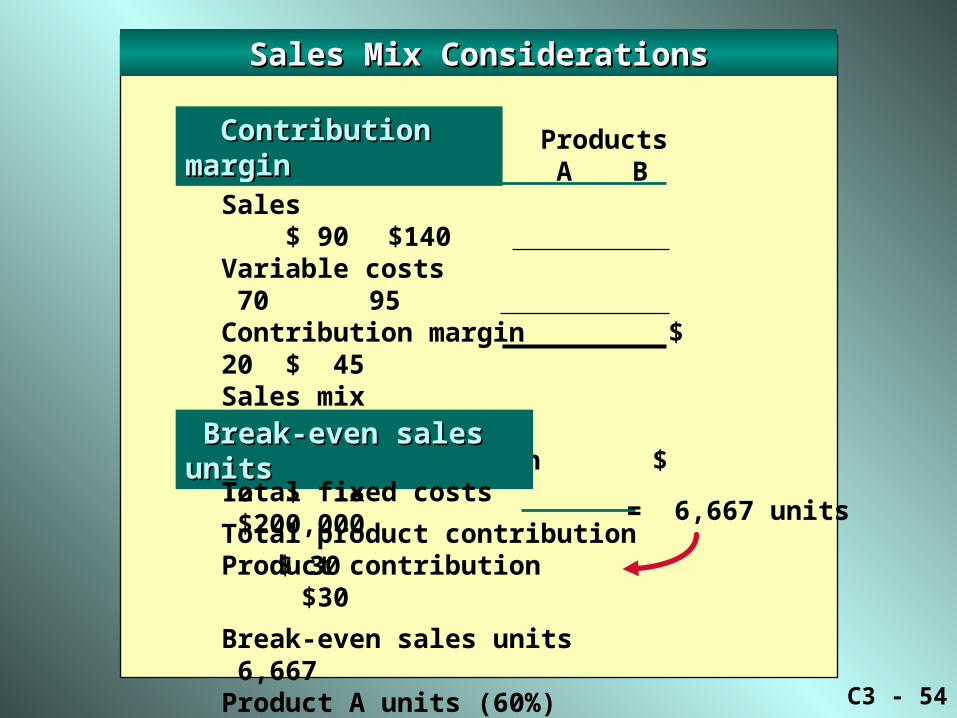
Sales $ 90 $140Variable costs 70 95Contribution margin $ 20 $ 45Sales mix x 60% x 40%Product contribution $ 12 $ 18
Total product contribution $ 30
Contribution marginContribution margin
Break-even sales unitsBreak-even sales units
Products A B
Total fixed costs $200,000
Product contribution $30
Break-even sales units 6,667Product A units (60%) 4,000Product B units (40%) 2,667
= 6,667 units

C3 - 55
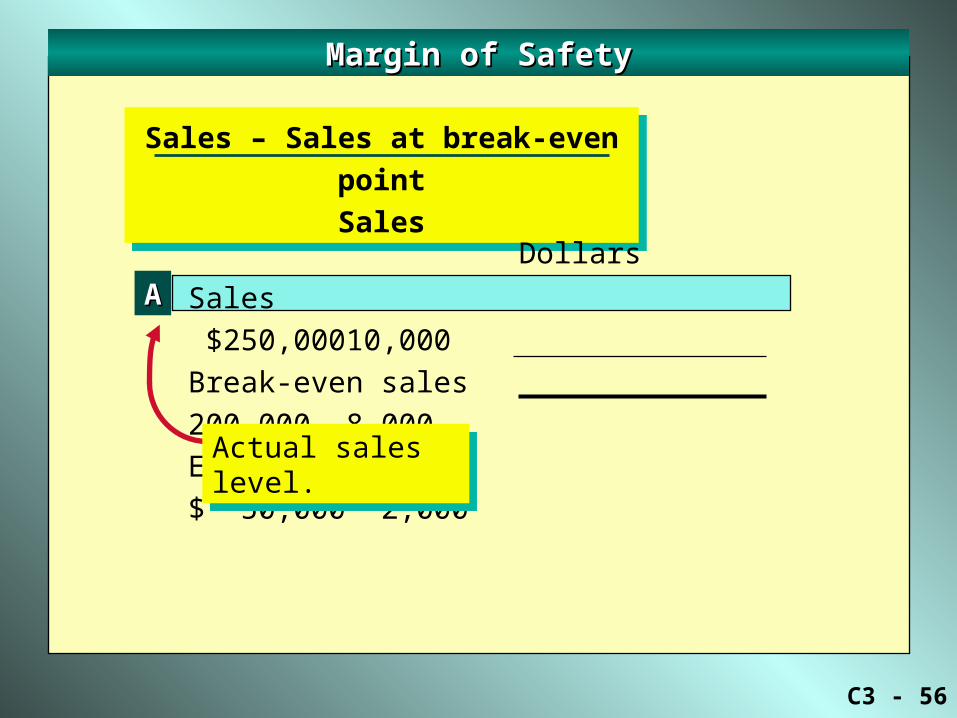
Margin of SafetyMargin of Safety
Sales – Sales at break-even point
Sales
Sales – Sales at break-even point
Sales
Dollars Units
Sales $250,000 10,000
Break-even sales 200,000 8,000
Excess $ 50,000 2,000
C3 - 56
Margin of SafetyMargin of Safety
Sales – Sales at break-even point
Sales
Sales – Sales at break-even point
Sales
Dollars Units
AA Sales $250,000 10,000
Break-even sales 200,000 8,000
Excess $ 50,000 2,000
Actual sales level.Actual sales level.

C3 - 57
Margin of SafetyMargin of Safety
Sales – Sales at break-even point
Sales
Sales – Sales at break-even point
Sales
Dollars Units
AA
BB
Sales $250,000 10,000
Break-even sales 200,000 8,000
Excess $ 50,000 2,000
Margin of safety (B/A)
Excess of actual sales over the break-even sales.
Excess of actual sales over the break-even sales.
What is the margin of safety as a percentage?
What is the margin of safety as a percentage?

C3 - 58
Margin of SafetyMargin of Safety
Sales – Sales at break-even point
Sales
Sales – Sales at break-even point
Sales
Margin of safety indicates the decrease in sales that may occur before an operating loss results.
Margin of safety indicates the decrease in sales that may occur before an operating loss results.
Dollars Units
AA
BB
Sales $250,000 10,000
Break-even sales 200,000 8,000
Excess $ 50,000 2,000
Margin of safety (B/A) 20%
Margin of safety
expressed in units.
Margin of safety
expressed in units.

C3 - 59
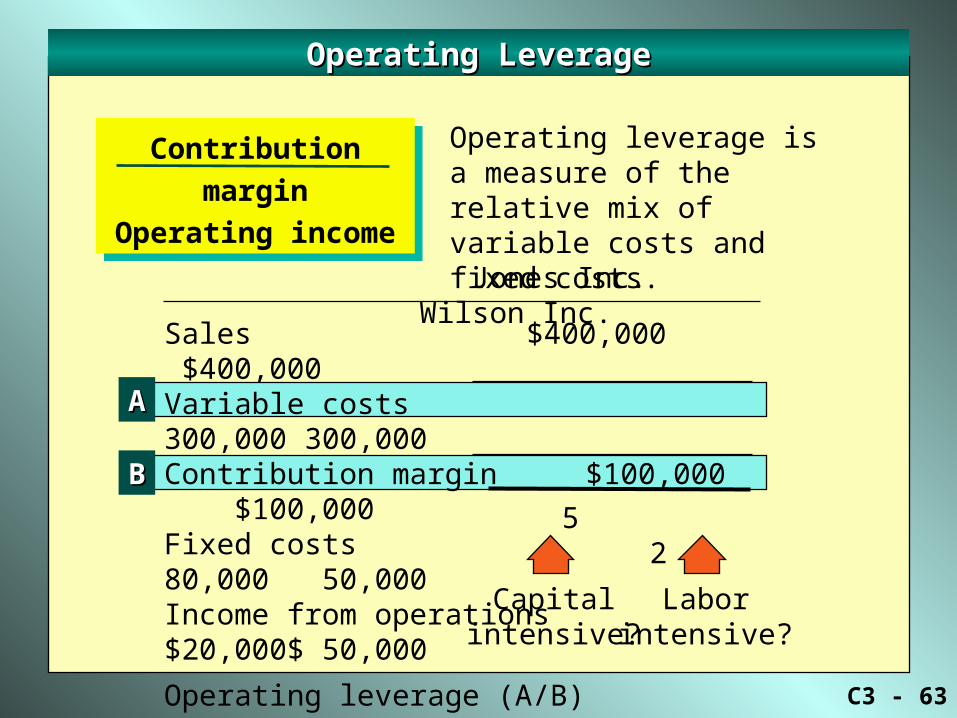
Operating LeverageOperating Leverage
Contribution margin
Operating income
Contribution margin
Operating income
Sales $400,000 $400,000Variable costs 300,000 300,000Contribution margin $100,000 $100,000Fixed costs 80,000 50,000Income from operations $20,000 $ 50,000
Jones Inc. Wilson Inc.
Operating leverage is a measure of the relative mix of variable costs and fixed costs.

C3 - 60
Operating LeverageOperating Leverage
Contribution margin
Operating income
Contribution margin
Operating income
Sales $400,000 $400,000Variable costs 300,000 300,000Contribution margin $100,000 $100,000Fixed costs 80,000 50,000Income from operations $20,000 $ 50,000
Jones Inc. Wilson Inc.
AA
Operating leverage is a measure of the relative mix of variable costs and fixed costs.
Both companies have the same contribution margin.Both companies have the same contribution margin.

C3 - 61
Operating LeverageOperating Leverage
Contribution margin
Operating income
Contribution margin
Operating income
Sales $400,000 $400,000Variable costs 300,000 300,000Contribution margin $100,000 $100,000Fixed costs 80,000 50,000Income from operations $20,000 $ 50,000
Operating leverage (A/B)
Jones Inc. Wilson Inc.
AA
BB
Operating leverage is a measure of the relative mix of variable costs and fixed costs.
What is the operating leverage?What is the operating leverage?
C3 - 62
Operating LeverageOperating Leverage
Contribution margin
Operating income
Contribution margin
Operating income
Sales $400,000 $400,000Variable costs 300,000 300,000Contribution margin $100,000 $100,000Fixed costs 80,000 50,000Income from operations $20,000 $ 50,000
Operating leverage (A/B)
Jones Inc. Wilson Inc.
AA
BB
Operating leverage is a measure of the relative mix of variable costs and fixed costs.
What do these numbers mean?What do these numbers mean?
5 2
C3 - 63
Operating LeverageOperating Leverage
Contribution margin
Operating income
Contribution margin
Operating income
Sales $400,000 $400,000Variable costs 300,000 300,000Contribution margin $100,000 $100,000Fixed costs 80,000 50,000Income from operations $20,000 $ 50,000
Operating leverage (A/B)
Jones Inc. Wilson Inc.
AA
BB
Operating leverage is a measure of the relative mix of variable costs and fixed costs.
Capitalintensive?
Laborintensive?
5 2
C3 - 64
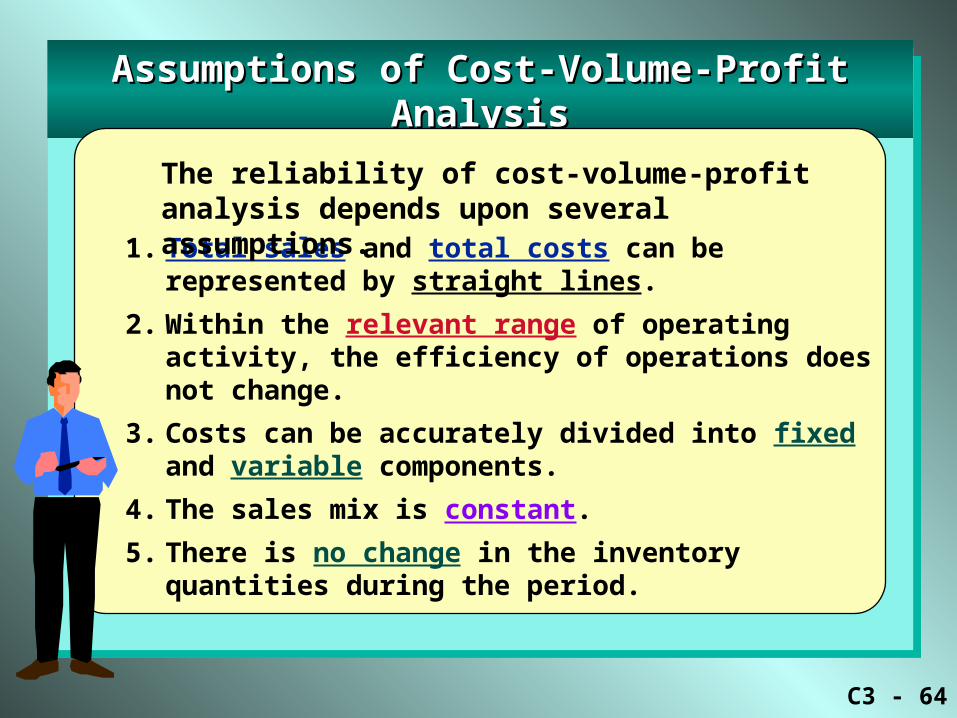
Assumptions of Cost-Volume-Profit AnalysisAssumptions of Cost-Volume-Profit Analysis
1. Total sales and total costs can be represented by straight lines.
2. Within the relevant range of operating activity, the efficiency of operations does not change.
3. Costs can be accurately divided into fixed and variable components.
4. The sales mix is constant.
5. There is no change in the inventory quantities during the period.
The reliability of cost-volume-profit analysis depends upon several assumptions.
C3 - 65
Note: To see the topic slide, type 2 and press Enter.
This is the last slide in Chapter M3. This is the last slide in Chapter M3.
Power NotesChapter M3
Cost Behavior and Cost-Volume-Profit AnalysisCost Behavior and Cost-Volume-Profit Analysis