c1si / c1plus
TRANSCRIPT
C1si / C1plus
Modular Confocal Laser Microscope System
Modular Confocal Laser Microscope System C1 Series

State-of-the-Art Resolution, Contrast, and Image Brightness
Nikon has fused its first-class optics and electronics technology to develop the Eclipse C1 series
modular confocal microscope systems that provide the highest-quality digital imaging with an
ultra-compact and lightweight design. With basic C1plus and spectral imaging C1si, Nikon now
has a confocal solution to suit a broad range of advanced research needs.
High-resolution image acquisitionIncorporating Nikon’s renowned optical technologies—including VCobjectives—in a confocal mechanism to eliminate flare from fluorescenceimages, the sophisticated C1 series allows high-resolution image capture. Thesystem also supports multi-dimensional acquisition including XYZ imaging,time-lapse imaging, spectral imaging, and multi-point imaging.
Spectral image acquisition (C1si)The C1si true spectral imaging confocal laser scanning microscope system isthe powerful solution to autofluorescence, which is a problem whenobserving live specimens as it is difficult to distinguish autofluorescence fromthe target fluorescence. The spectral detector can acquire a broadwavelength range up to 320nm with a single scan to provide high-resolutionimages. The dedicated software allows unmixing of target fluorescencesignals and autofluorescence. Also, the short scan time reduces damage tocells and improves time resolution.
Molecule dynamics with optical stimulationThe C1 series can handle a variety of the latest optical stimulationapplications, including observation of photoconversion fluorescence proteinsthat change fluorescence characteristics when exposed to laser light, andobservation of FRAP (fluorescence recovery after photobleaching) in the ROI(region of interest).
Powerful image analysis functionNikon appreciates that the nalysis of captured images is an important task.The latest analysis functions that the C1 series offers include analysis overtime of intensity and spectra changes in ROI (region of interest), andcolocalization analysis for studying intensity data between channels.
Colocalization analysis
2 3
Modular confocal laser microscope system
DIGITAL ECLIPSE C1plusEmploys high resolving power to capture images for spatial information—3D data, forexample—and high-speed scanning for time-lapse information. Simultaneous 3-channelfluorescence, 3-channel plus DIC, and other advanced imaging is possible.
True spectral imaging confocal laser scanning microscope system
DIGITAL ECLIPSE C1siSupports the latest optical stimulation applications through the acquisition of spatial,time-lapse and spectral information. Enables the simultaneous acquisition of 32-channelsof fluorescence spectra, and the wavelength resolution can be switched between 2.5, 5,and 10nm. Changeover of the spectral detector and the 3-channel PMT detector is a snap.

DIC image
Actin/Mitochondria/DAPI
Conventional objective lens VC objective lens
Fluorescence image of actin (green: Alexa 488, excitation: 488nm), mitochondria(red: Mito Tracker Organe, excitation: 543nm) and nucleus (blue: DAPI, excitation:408nm) of HeLa cell. Consecutive cross-sectional XY and XZ images acquired witha confocal laser microscope and CFI Plan Apo VC 100x oil objective lens.
Overlay of DIC and fluorescence images
Precision objectives for aberration-free confocal microscopy
CFI Plan Apo VC 100x oil/1.40 (left)CFI Plan Apo VC 60x oil/1.40 (middle)CFI Plan Apo VC 60x WI/1.20 (right)
CFI Apo TIRF 60x oil/1.49 (left)CFI Apo TIRF 100x oil/1.49 (right)
Unprecedented brightness and contrastThe Eclipse C1 series—the culmination of Nikon’s many years of dedicationas an optical equipment manufacturer—delivers optical performance of thehighest level in this class of confocal systems. With the Eclipse C1 series,fluorescence images are rendered with unprecedented brightness, while DICimages are pin-sharp and of the highest possible contrast.
Compact modular design• Modular Components: Expansion and
maintenance are easy.
• Pre-calibrated Modules: No need for calibration during set-up.
• Compact Design: Does not fill up bench space. The C1plus features the world’s smallest and lightest scanning head.
Advanced scanning features• Up to 1000x optical zoomThe desired area can be optically zoomed. The GUI can beused to specify the area to be zoomed and rotate it.
Leveraging the latest PC functionsBecause image processing is conducted with the controller instead of the PC,the user has greater freedom in selecting a PC. This makes it easy to upgradethe PC depending on requirements. Also, handling large amounts of data ofup to four terabytes in size is possible, allowing large-size data acquisition,such as 3D time-lapse imaging.
Broad selection of laser optionsThe C1 series accommodates a greater variety of lasers with wavelengthsranging from 405 to 640nm. It also supports solid-state lasers.
CFI Apochromat TIRF seriesAmong Nikon objectives, this series has the highest resolution. It boasts anunprecedented NA of 1.49 even when a standard coverslip and immersion oilare used.
Excitation of all areas Excitation of all but specific areas Excitation of specific areas only
2x
4x
8x
• ROI scanning with AOM/AOTFFree shape scanning is possible with AOTF*(Acousto OpticalTunable Filter) and AOM** (Acousto Optical Modulator). Itis effective for bleaching specific areas in FRAP/FLIPexperiments or optical stimulation with a 405nm laser.*Comes standard with the 4-laser unit**Optional with the 3-laser unit
Specimen: Cerebellum Purkinje cell with mouse monoclonal anti-calbindinantibody stained with FITCSpecimen courtesy of Assistant Prof. Kazunori Toida, Department of Anatomy andCell Biology, Institute of Health Biosciences, the University of Tokushima GraduateSchool
The highest quality optical performance
C1si true spectral imaging confocal laser scanning microscopesystem configured with a 4-laser unit
•Corrected shift in Z-axis direction with VC objective lensWith the conventional objective, DAPI fluorescence (blue) mayshift in the Z-axis direction due to axial chromatic aberration.However, because the VC objective lens’ axial chromaticaberration has been corrected up to the violet range, the DAPIfluorescence (blue) shift in the Z-axis direction is also corrected.The VC objective lens sample image on the right clearly showsthat the DAPI-stained nucleus is positioned within the cell.
XY
XZ
XY
XZ
CFI Plan Apochromat VC seriesThese objectives correct axial chromatic aberration on the whole visible lightspectrum including 405nm (h line), making this series perfect for multi-stained confocal observations
4 5

XYZ imageWith precise Z-axis information of a specimen—a feat not possible withordinary fluorescence microscopy—clear cross section images are possible.
Easy to use software for seamless image acquisition Versatile multi-dimensional imaging functions
At-a-glance setting panel
1Simple GUI Available for easy image capture.
2Microscope setting Nikon motorized microscopes can be operated with the intuitive GUI.
3Thumbnail display/Parameter resetting Thumbnails and parameters of captured images can be displayed. It is easy to reset thesame parameters while confirming the images.
Brightness windowAdjusting the brightness of each laser.
Navigation windowAdjusting zoom magnification and Z position in preview image.
Acquisition windowImage acquisition settings.
Simple tool bar
Configuration window(basic)Selecting laser andobjective lens types.
Image capture area
1Simple GUI 2Microscope setting 3Thumbnail display
Scan speeds
Pixel size
PMT amplification
Digital zoom
Pan
Scan start/stop
Color display setting
Volume renderingAngles of 3D images can be freely changed.
3D tiled imageImages with different depths can be viewed simultaneously on a single screen.
3D orthogonal displayXZ (cross section)
Initial state
9 sec 86 sec
16 sec 110 sec
YZ (cross section)
Specimen: mouse’s whole brain stained with mCB (mouse monoclonal anti-calbindin: green), rPV (rabbitpolyclonal anti-parvalbumin: red) and nucleus (Hoechst: blue)Specimen courtesy of Assistant Prof. Kazunori Toida, Department of Anatomy and Cell Biology, Instituteof Health Biosciences, the University of Tokushima Graduate School
Specimen: respective expression of GFP, YFP and RFP in the nucleus of HeLa cellCells courtesy of Dr. Yoshihiro Yoneda and Dr. Takuya Saiwaki, Faculty of Medicine, Osaka University
Specimen: visualized changes of calcium in cultured cells loaded with Fluo-4 AM
XYZT images of HeLa cells stained with Hoechst33342 are captured at 15-minute intervals.
Time-lapse (XYT) imageChanges over time can be analyzed using images with high spatial resolution.Intensity change analysis, ratio analysis and real time graph display duringimage acquisition is possible.
Time-lapse (XYZT) imageTwo-dimensional (XY) or three-dimensional (XYZ) time-lapse images can becaptured. The C1 series allows flexible interval time settings.
Multi-point imaging within the field of viewTime-lapse, Z-stack images of multiple points within the objective’s field ofview can be captured.
All settings and procedures required for live image capture—fundamentals inconfocal microscopy—can be viewed in a single window, eliminating the needfor the operator to switch between many windows. The operation panel givesyou an at-a-glance picture of all important settings including scan speed, pixel
size, zoom/pan, PMT settings, pinhole, shutter, and color image look-uptable. Scanning modes range from 2D (XY, XT), to 3D (XYZ, XYT), and evenfurther to 4-dimensional (XYZT) scans.
Spectral (XYλ) image (C1si)By using a spectral detector, spectral images with high spatial resolution canbe captured with a single scan.
Optical pathDisplaying information such as laser wavelength in use, 1stdichroic mirror, 2nd dichroic mirror and detector.
C1plus C1si
3
2
1
6 7
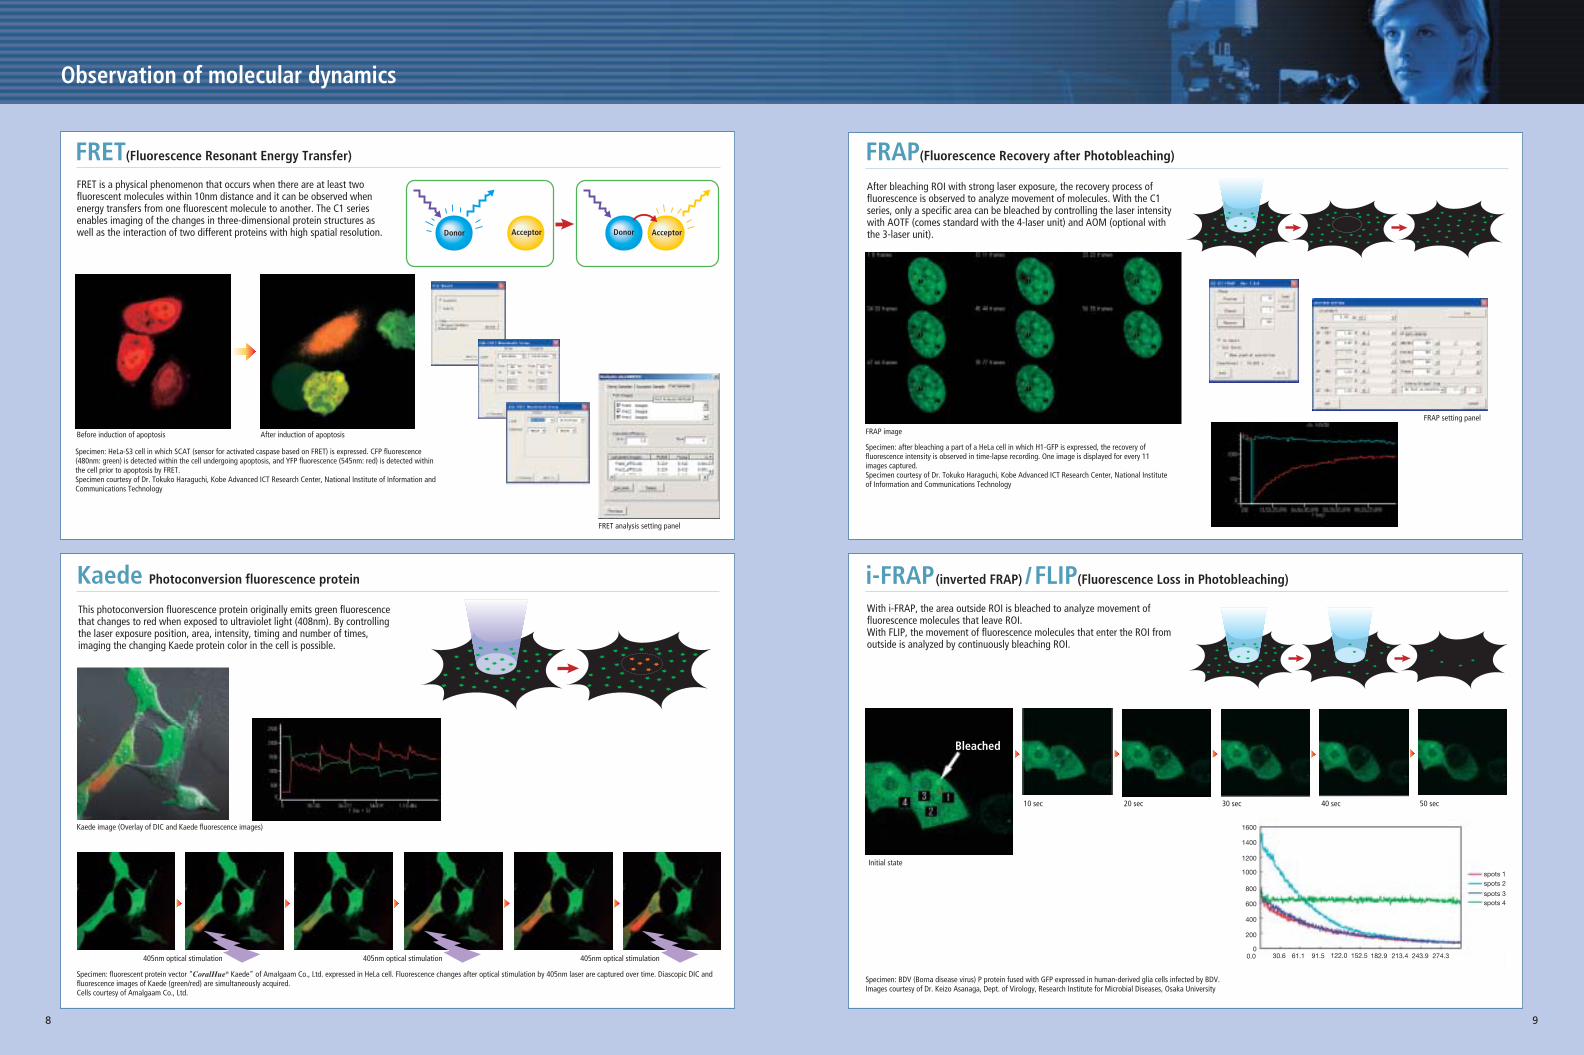
FRET(Fluorescence Resonant Energy Transfer) FRAP(Fluorescence Recovery after Photobleaching)
Kaede Photoconversion fluorescence protein i-FRAP(inverted FRAP) /FLIP(Fluorescence Loss in Photobleaching)
FRET is a physical phenomenon that occurs when there are at least twofluorescent molecules within 10nm distance and it can be observed whenenergy transfers from one fluorescent molecule to another. The C1 seriesenables imaging of the changes in three-dimensional protein structures aswell as the interaction of two different proteins with high spatial resolution.
After bleaching ROI with strong laser exposure, the recovery process offluorescence is observed to analyze movement of molecules. With the C1series, only a specific area can be bleached by controlling the laser intensitywith AOTF (comes standard with the 4-laser unit) and AOM (optional withthe 3-laser unit).
This photoconversion fluorescence protein originally emits green fluorescencethat changes to red when exposed to ultraviolet light (408nm). By controllingthe laser exposure position, area, intensity, timing and number of times,imaging the changing Kaede protein color in the cell is possible.
With i-FRAP, the area outside ROI is bleached to analyze movement offluorescence molecules that leave ROI. With FLIP, the movement of fluorescence molecules that enter the ROI fromoutside is analyzed by continuously bleaching ROI.
Specimen: BDV (Borna disease virus) P protein fused with GFP expressed in human-derived glia cells infected by BDV.Images courtesy of Dr. Keizo Asanaga, Dept. of Virology, Research Institute for Microbial Diseases, Osaka University
Specimen: HeLa-S3 cell in which SCAT (sensor for activated caspase based on FRET) is expressed. CFP fluorescence(480nm: green) is detected within the cell undergoing apoptosis, and YFP fluorescence (545nm: red) is detected withinthe cell prior to apoptosis by FRET. Specimen courtesy of Dr. Tokuko Haraguchi, Kobe Advanced ICT Research Center, National Institute of Information andCommunications Technology
Specimen: after bleaching a part of a HeLa cell in which H1-GFP is expressed, the recovery offluorescence intensity is observed in time-lapse recording. One image is displayed for every 11images captured. Specimen courtesy of Dr. Tokuko Haraguchi, Kobe Advanced ICT Research Center, National Instituteof Information and Communications Technology
Specimen: fluorescent protein vector “CoralHue® Kaede” of Amalgaam Co., Ltd. expressed in HeLa cell. Fluorescence changes after optical stimulation by 405nm laser are captured over time. Diascopic DIC andfluorescence images of Kaede (green/red) are simultaneously acquired.Cells courtesy of Amalgaam Co., Ltd.
30.60.0
1600
1400
1200
1000
800
600
400
200
061.1 91.5 122.0 152.5 182.9 213.4 243.9 274.3
spots 1spots 2
spots 3spots 4
10 sec 20 sec 30 sec 40 sec 50 sec
Initial state
Before induction of apoptosis After induction of apoptosis
FRET analysis setting panel
FRAP setting panel
405nm optical stimulation 405nm optical stimulation 405nm optical stimulation
Kaede image (Overlay of DIC and Kaede fluorescence images)
FRAP image
Observation of molecular dynamics
Donor Acceptor Donor Acceptor
Bleached
8 9

0
400 750
10
20
30
40
50
60
70
80
90
100
Wavelength (nm)
S-polarizingP-polarizing
Dif
frac
tio
n r
atio
(%
)
S-polarizing
P-polarizing
True spectral imaging
(Brightness)
(Channel)
0
500
1000
1500
2000
2500
3000
3500
4000
1 4 7 10 13 16 19 22 25 28 31
Pre-correction (Brightness)
(Channel)
0
500
1000
1500
2000
2500
3000
3500
4000
1 4 7 10 13 16 19 22 25 28 31
Post-correction
Multi-anode PMT sensitivity correction
Multi-anode PMTThe spectral imaging detectorutilizes a newly developed lasershielding mechanism. Coupled witha wavelength resolutionindependent of pinhole diameter,this mechanism successfully shutsout the reflected laser beam. Theblocking mechanism can be movedfreely with software, allowing usersto block any laser wavelength,making the C1si compatible withvirtually any laser selection.
Optical fiber
Unpolarized light
Polarized beam splitter
S1
P
S1
S2
S2
Polarization rotatorMultiple gratings (2.5/5/10nm)
Spectral detector with polarization control technologyNikon’s proprietary DEES (Diffraction Efficiency Enhancement System) for polarizationcorrection is employed in the C1si’s spectral detector to maximize brightness. By co-aligning the direction of polarization of fluorescent light, efficiency of the diffractiongrating is optimized, resulting in exceptionally bright images.In particular, increasing the diffraction efficiency in the long wavelength range leads toimproved brightness over the whole visible range from blue to red.
Grating properties
Overview of DEES(internal structure of spectral detector)
Superb error and deviation correction Accuracy of spectra is maintained with highly precise correction technologies,including wavelength correction using emission lines and luminositycorrection utilizing a NIST (Nation Institutes of Standards and Technology)traceable light source.Also, multi-anode PMT sensitivity correction technology allows correction ofsensitivity error and wavelength transmittance properties on a per-channelbasis, allowing researchers to minimize measurement errors and deviationsamong different equipment.
High-efficiency fluorescence transmissiontechnologyThe ends of the fluorescence fibers and detector surfaces use a proprietaryanti-reflective coating to reduce signal loss to a minimum, achieving highoptical transmission.
Dual integration signal processing Newly developed DISP (Dual Integration Signal Processing) technology hasbeen implemented in the image processing circuitry to improve electricalefficiency, preventing signal loss while the digitizer processes pixel data andresets. The signal is monitored for the entire pixel time resulting in anextremely high S/N ratio.
Integrator (1)
Integration Hold ResetPixel time
Integrator (2)
DISP
Two integrators work in parallel when the optical signal is read to ensure there are no discrepancies.
In addition to the conventional fluorescence detector, the C1si true spectral imaging confocallaser scanning microscope is equipped with a dedicated spectral detector. By switchingbetween these detectors, accurate spectral data of fluorescence signals can be obtained. TheC1si captures minute changes of wavelength in true color and unmixes even overlappingspectra. Moreover, it has the capability to acquire spectra over a 320nm-wide wavelengthrange in a single scan, minimizing damage to living cells.
Nikon original
Nikon original Nikon original
Nikon original
Effortless fluorescence unmixingEven without a given reference spectrum, simply specifying a ROI within theimage and clicking the Simple Unmixing button allows separation offluorescence spectra. The C1si contains a built-in database of given spectral
Fluorescence labels with closely overlapping spectra can be unmixed cleanly with no crosstalk.
Intensity
Wavelength
f f
λ
1 1
n
P nS 2 2P nS
The spectrum obtained by actual measurement is a mix of spectral elements with a certain proportion. An imagingalgorithm is used to compare the spectra of each pixel with reference curves for each spectral element. Each fluorescentprobe in the specimen is displayed in a unique color in the final unmixed image.
Reference wave pattern (S) is selected from the following three depending on the experiment.1 Spectrum obtained by actual measurement of the zone with less crosstalk in the captured image2 Data obtained by another actual measurement using only one probe3 Spectral data provided by probe maker
What is spectral unmixing?
fn = Sn*P
fn =Wave pattern of spectrum obtained by actual measurement
Sn=Wave pattern of individual reference spectrum
P =Ratio of elements for each wave pattern
Fluorescenceunmixing
Specimen: HeLa cell in which GFP (Tubulin) and YFP (Golgi) are expressed. Spectral image captured with a 488nm laser (left). After fluorescence unmixing,GFP is indicated in green and YFP is indicated in red (right). The graph at left shows the spectral curve in the ROI.Specimen courtesy of Dr. Sheng-Chung Lee, Dr. Han-Yi E. Chou, National Taiwan University College of Medicine, Institute of Molecular Medicine
data provided by manufacturers of fluorescence dyes that can be specified asreference spectra for fluorescence unmixing. Users may also add spectralinformation for new labels to the database.
10 11

Segmentation
Frame lambda
By spectral imaging with C1si, wavelength information of the entire range can beobtained in a single scan. Therefore, it is no longer necessary to acquire only thelimited wavelength range or reshoot other ranges during the imaging session.Consequently, there is minimized photo-toxicity to the specimen.After spectral imaging, images that are filtered (segmented) with any desiredwavelength range easily displayed.
Using this function allows the user to acquire either wide continuous or bands of spectra bysequentially acquiring individual narrower spectra regions. The laser and the spectral rangeacquired can be individually set for each sequence in the series, the final single spectra is aresult of combining all spectra in the sequence.
Confirmation of GFP expressionIn conventional confocal observation, fluorescence is visualized as fluorescence intensityin a certain wavelength range. The spectral detector allows the confirmation of detailedwavelength characteristics of the fluorescence. The C1si’s spectral detector enables theslight color differences to be confirmed as wavelengths through sensitivity correction.
Unmixing autofluorescence of multi-stained samplesFluorescence unmixing makes it possible not only to separate closely overlappingfluorescence spectra such as CFP and YFP but also to eliminate autofluorescence of cells,which until now was difficult.
Specimen: actin of HeLa cell that has RFP expressed in the nucleus is stained with Rhodamine. Spectral image in the 550-630nm wavelength range captured at 2.5nm wavelength resolution with 543nm laser exposure (left). RFP indicated in red andRhodamine indicated in green (right) in the image after fluorescence unmixing.Specimen courtesy of Dr. Yoshihiro Yoneda and Dr. Takuya Saiwaki, Faculty of Medicine, Osaka University
Specimen: HeLa cell in which nucleus is labeled with CFP, actin-related protein (Fascin) labeled with GFP, Golgi body labeledwith YFP, and mitochondria labeled with DsRed. Spectral image captured with 408nm and 488nm laser exposure (left). Thefluorescence spectra of the captured image are unmixed using reference spectra (right).Specimen courtesy of Dr. Kaoru Kato and Dr. Masamitsu Kanada, Neuroscience Research Institute, The National Institute ofAdvanced Industrial Science and Technology (AIST)
Specimen: Zebrafish egg stained with cadherin-GFP and DAPI. Spectral image captured with 408nm and 488nm laser exposure(left). After unmixing using reference spectra for autofluorescence (ROI1), GFP and DAPI, the autofluorescence in the image iseliminated (right).Specimen courtesy of Dr. Tohru Murakami, Neuromuscular and Developmental Anatomy, Gunma University Graduate School ofMedicine
Specimen: Arabidopsis proteoglycan and fused protein of GFP. Spectral image captured with 488nm laser exposure (left). Oncethe image is unmixed using reference spectra for autofluorescence (ROI1) and GFP, GFP is indicated in green andautofluorescence is indicated in red (right).Specimen courtesy of Assistant Prof. Toshihisa Kotake, Laboratory of Developmental Biology, Department of Life Science,Graduate School of Science and Engineering, Saitama University
The spectral image of stained actin (Alexa 488), mitochondria (Mito Tracker Organe) and nucleus (DAPI) ofHeLa cell, captured with the frame lambda function, is post-acquired in the three wavelength ranges of 420-480nm, 500-530nm, and 570nm and longer using the segmentation function.
Segmented image of the spectral image obtained with the frame lambda function
Image and spectral curve obtained with frame lambda function. 410-740nm spectral range captured with408nm, 488nm and 561nm lasers is used.
Segmentation setting panel
Frame lambda setting panel
Unmixing red fluorochromesRed fluorochromes, which had previously posed a challenge, are now simple to unmix.
Specimen courtesy of Dr. Yoshihiro Yoneda and Dr. Takuya Saiwaki, Faculty of Medicine, Osaka University
Spectra for ROI 1 and 2 corresponding to the image on the rightRhodamine’s fluorescence spectral peak is at approximately 579nm,while that for RFP is approximately 600nm. RFP’s fluorescence isweaker than Rhodamine’s, but their spectra are cleanly unmixed.
Unmixing of multiple fluorescenceBecause wavelength resolution and range are freely selectable, scanning of a fluorescenceprotein with a wide wavelength range from blue to red such as CFP/GFP/YFP/Ds Red ispossible at one time. Reference data allows unmixing and display of each color.
Fluorescenceunmixing
Fluorescenceunmixing
Fluorescenceunmixing
Fluorescenceunmixing
Reprint from Cell Imaging Press Vol. 3
The correspondence of the spectral curve (blue) of ROI2 in theimage and the reference curve (green) of eGFP proves thatGFP is expressed in ROI2
12 13

What is CLEM?The CLEM system senses the existence of fluorescence in a specimen andexposes the laser in areas with fluorescence by controlling the laser pixel bypixel. Because the laser is not used where excitation light is not needed,laser exposure is minimized and live cell phototoxicity is drastically reduced.
Features• Because the laser is switched off in areas that do not emit fluorescence,
exposure light is reduced and the fading speed of fluorescence labels isdecreased twofold to fourfold. Phototoxicity of cells is also reduced. (Seediagram below )
• CLEM switches off the laser in areas with sufficient fluorescence andcalculates pixel brightness. This extends the apparent dynamic range offluorescence intensity, allowing an image with both extremely weak andbright fluorescence to be displayed without saturation.
xy
xz
yz
xy
xz
yz
FRET (Fluorescence Resonance Energy Transfer) analysis using true spectralimaging allows three dimensional analysis with high S/N ratio and highspatial resolution as well as easy determination of FRET by real-timedetection of spectral changes derived by FRET.
Time-lapse acquisition of spectral images
Spectral image in the 460-620nm range captured at 5nm wavelengthresolution using a spectral detector enables observation of fluorescencewavelength changes.
True color image and spectral analysis of CFP and YFP. Spectral curve in ROI. Leftpeak indicates CFP and right peak indicates YFP respectively. After ATP stimulation,peak of CFP drops and peak of YFP rises due to FRET.
Before ATP stimulationTrue color image
Spectral analysis
8 sec after ATP stimulation
Spectral FRET analysis is possible by unmixing using reference data of CFP and YFP. Two-dimensional change (FRET) of intracellular Ca2+ concentration is easily determined fromspectral data without acceptor bleaching.
FRET image after spectral unmixing. CFP is indicated in blue and YPF indicated in green.
Extending dynamic range
Reducing phototoxicity
CLEM onCLEM off
Before 405nm optical stimulation After 405nm optical stimulation
Time-lapse changes (T) and spectra (λ) in three-dimensional space (XYZ) canbe analyzed.
Before ATP stimulation 8 sec after ATP stimulation
Changes of Kaede fluorescence protein over time can be recorded as spectralchanges. Not only color change from green to red but also slight spectralchanges can be captured.
Use of optional motorized stage enables easy multi-point observation including multi-point time-lapse, multi-point XYZ and multi-point four-dimensional (XYZT)observations.
HeLa cell
Multi-point setting panel
CLEM on
CLEM off
CLEM on
0 720
100%
50%
0%3000
CLEM off
Time (sec)
Fluorescence intensity
CLEM (Controlled Light Exposure Microscopy) system
Multi-point observation system
ScanLaser off Laser off
Laser on
Fluorescent sample
Also, even when spectra of donor and acceptor are overlapped like CFP andYFP, unmixing using reference data enables detection of detailed intensitychanges and ratio analysis of fluorescence signals (YFP/CFP) without bleedthrough.
Acquisition of spectral image (XYTλ) Fluorescence unmixing
Five-dimensional analysis (XYZTλ)
True spectral FRET analysis
True spectral Kaede analysis
The system expandability of the C1 series meets the needsof today’s research
To meet the requirements of constantly evolving live cell imaging, Nikon provides a wide arrayof microscopes, accessories and software. Outstanding expandability of the C1 series deliversoptimal solutions for live cell observation.
Reprint from Cell Imaging Press Vol. 1
Basic concept of multi-point XYZ imaging
Specimen: fluorescent protein vector “CoralHue® Kaede” of Amalgaam Co., Ltd. expressed in HeLa cell. Fluorescence in the 500-660nm range isobtained at 5nm wavelength resolution using the real-time spectral method. During this process, ROI1 is optically stimulated by 405nm laser. Spectralgraphs show photoconversion of fluorescence from 520nm before optical stimulation to 580nm after stimulation. Specimen courtesy of Amalgaam Co., Ltd.
Specimen: HeLa cells loaded with Rhodamine 123 are observed with CLEM on and off. The graph shows thefluorescence intensity change and scan time, and the reduction of fading by CLEM.Images courtesy of Dr. Takashi Sakurai, Photon Medical Research Center, Hamamatsu University School ofMedicine
Specimen: three-dimensional reconstruction image of juxtaglomerular cell of mouse olfactory bulbshows diversity of three-dimensional structure captured with confocal laser microscope. 50mm-thickcoronal section is multiply immunostained with anti-calbindin antibody (mouse monoclonal antibody,FITC label, green) and anti-tyrosine hydroxylase antibody (mouse monoclonal antibody, Cy3 label, red).The image captured with CLEM on allows volume rendering without saturation even if the image hasfluorescence intensity difference. In the image captured with CLEM off, saturation occurs in the volumerendering process.Specimen courtesy of Assistant Prof. Kazunori Toida, Department of Anatomy and Cell Biology, Instituteof Health Biosciences, the University of Tokushima Graduate School
ReferenceR.A. Hoebe, C.H. Van Oven, T.W.J. Gadella Jr, P.B. Dhonukshe1, C.J.F. Van Noorden & E.M.M. Manders, “Controlled light-exposure microscopy reduces photobleaching and phototoxicity in fluorescence live-cell imaging.” Nature Biotechnology P1-5 (2007)
14 15
Perfect Focus System with motorized sextuple DIC nosepiece (Ti-E)
Digital camera is an option.
FN1-C1
Operation panel
Intensity distribution measurement
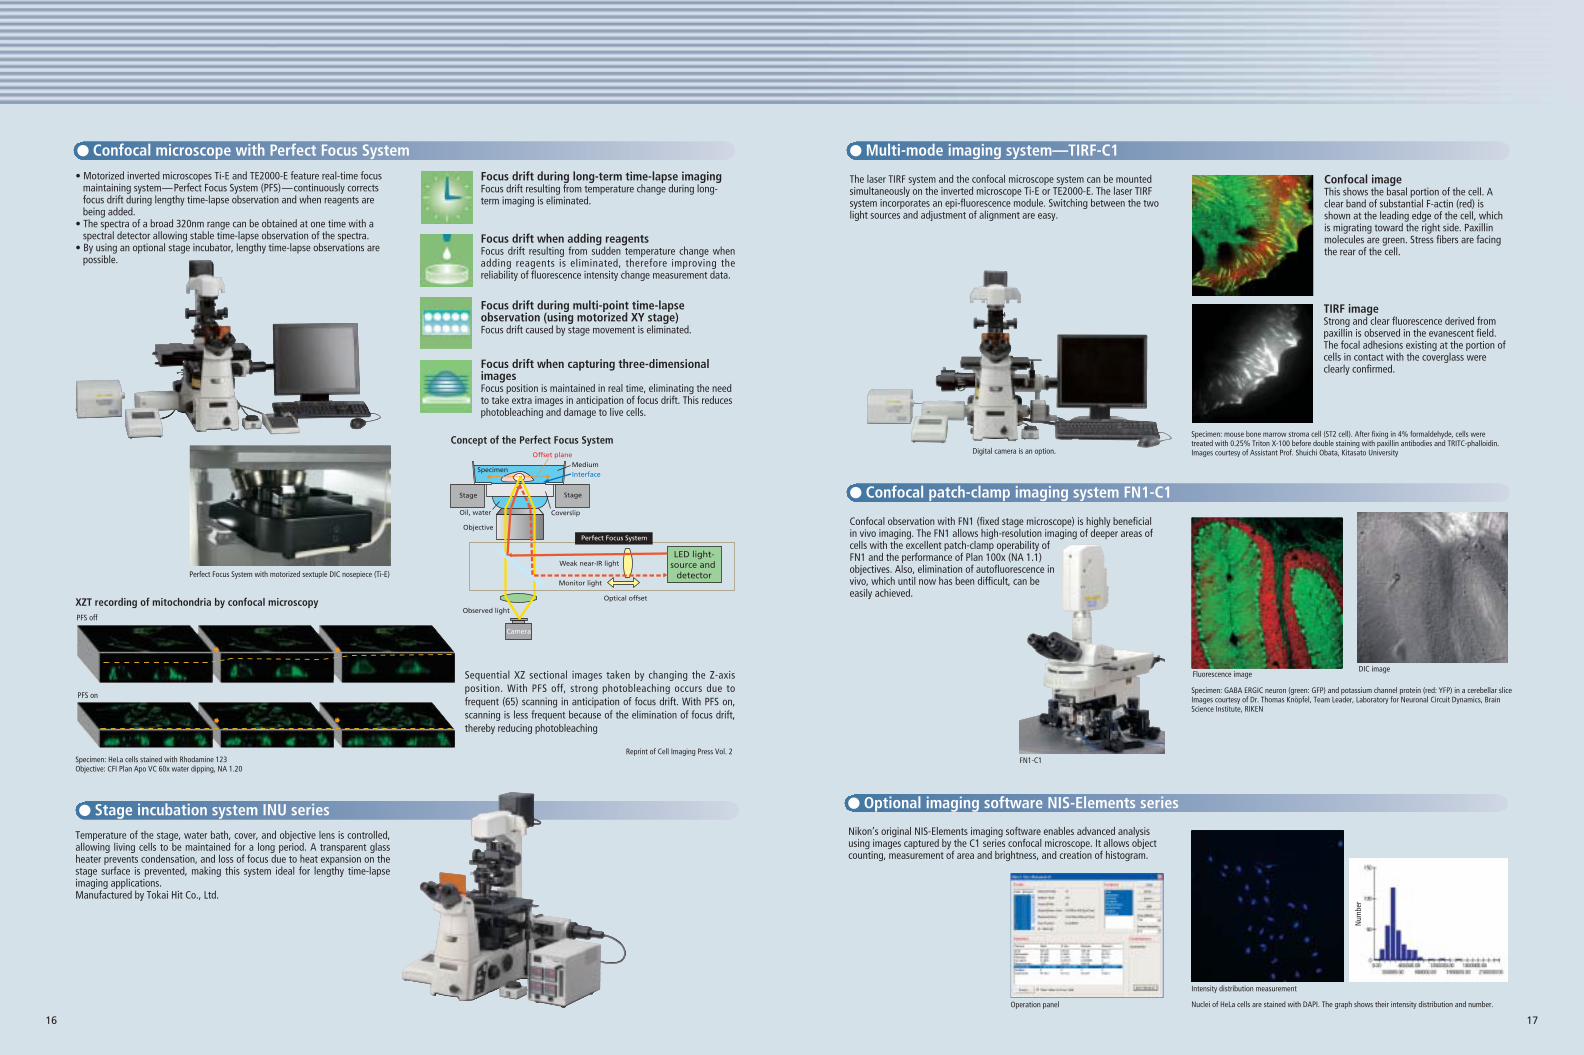
• Motorized inverted microscopes Ti-E and TE2000-E feature real-time focusmaintaining system—Perfect Focus System (PFS)—continuously correctsfocus drift during lengthy time-lapse observation and when reagents arebeing added.
• The spectra of a broad 320nm range can be obtained at one time with aspectral detector allowing stable time-lapse observation of the spectra.
• By using an optional stage incubator, lengthy time-lapse observations arepossible.
Temperature of the stage, water bath, cover, and objective lens is controlled,allowing living cells to be maintained for a long period. A transparent glassheater prevents condensation, and loss of focus due to heat expansion on thestage surface is prevented, making this system ideal for lengthy time-lapseimaging applications.Manufactured by Tokai Hit Co., Ltd.
Focus drift during long-term time-lapse imagingFocus drift resulting from temperature change during long-term imaging is eliminated.
Focus drift when adding reagentsFocus drift resulting from sudden temperature change whenadding reagents is eliminated, therefore improving thereliability of fluorescence intensity change measurement data.
Focus drift during multi-point time-lapseobservation (using motorized XY stage)Focus drift caused by stage movement is eliminated.
Focus drift when capturing three-dimensionalimagesFocus position is maintained in real time, eliminating the needto take extra images in anticipation of focus drift. This reducesphotobleaching and damage to live cells.
Specimen
Coverslip
Offset plane
Oil, water
Objective
Interface
Weak near-IR light
Optical offset
Observed light
Camera
LED light-source and
detector
Perfect Focus System
StageStage
Medium
Monitor light
Confocal imageThis shows the basal portion of the cell. Aclear band of substantial F-actin (red) isshown at the leading edge of the cell, whichis migrating toward the right side. Paxillinmolecules are green. Stress fibers are facingthe rear of the cell.
Specimen: mouse bone marrow stroma cell (ST2 cell). After fixing in 4% formaldehyde, cells weretreated with 0.25% Triton X-100 before double staining with paxillin antibodies and TRITC-phalloidin.Images courtesy of Assistant Prof. Shuichi Obata, Kitasato University
Specimen: GABA ERGIC neuron (green: GFP) and potassium channel protein (red: YFP) in a cerebellar sliceImages courtesy of Dr. Thomas Knöpfel, Team Leader, Laboratory for Neuronal Circuit Dynamics, BrainScience Institute, RIKEN
Nuclei of HeLa cells are stained with DAPI. The graph shows their intensity distribution and number.
TIRF imageStrong and clear fluorescence derived frompaxillin is observed in the evanescent field.The focal adhesions existing at the portion ofcells in contact with the coverglass wereclearly confirmed.
Multi-mode imaging system—TIRF-C1Confocal microscope with Perfect Focus System
Stage incubation system INU series
Confocal patch-clamp imaging system FN1-C1
Optional imaging software NIS-Elements series
PFS on
PFS off
Specimen: HeLa cells stained with Rhodamine 123Objective: CFI Plan Apo VC 60x water dipping, NA 1.20
The laser TIRF system and the confocal microscope system can be mountedsimultaneously on the inverted microscope Ti-E or TE2000-E. The laser TIRFsystem incorporates an epi-fluorescence module. Switching between the twolight sources and adjustment of alignment are easy.
Confocal observation with FN1 (fixed stage microscope) is highly beneficialin vivo imaging. The FN1 allows high-resolution imaging of deeper areas ofcells with the excellent patch-clamp operability of FN1 and the performance of Plan 100x (NA 1.1) objectives. Also, elimination of autofluorescence in vivo, which until now has been difficult, can be easily achieved.
Nikon’s original NIS-Elements imaging software enables advanced analysisusing images captured by the C1 series confocal microscope. It allows objectcounting, measurement of area and brightness, and creation of histogram.
Sequential XZ sectional images taken by changing the Z-axisposition. With PFS off, strong photobleaching occurs due tofrequent (65) scanning in anticipation of focus drift. With PFS on,scanning is less frequent because of the elimination of focus drift,thereby reducing photobleaching
Concept of the Perfect Focus System
XZT recording of mitochondria by confocal microscopy
Reprint of Cell Imaging Press Vol. 2
Fluorescence imageDIC image
16 17
Num
ber

Confocal image gallery
Three-dimensional reconstruction image of nerve through volumerendering after unmixing spectra of nerve (GFP) and peripheral tissue(autofluorescence) of the 188µm-thick sliced hippocampus image(spectral imaging with 5nm wavelength resolution, 500-660nm)Specimen courtesy of Professor Shigeo Okabe and Tatsuya Umeda,Department of Cell Biology, School of Medicine, Tokyo Medical andDental University
Cells of an onion root, Hoechst33258, OregonGreen488Image courtesy of Dr. Yoshinobu Mineyuki, Department of LifeScience, Graduate School of Life Science, University of Hyogo
Kaede expression localized to the mitochondria within Arabidopsis leafTop: true color image before (left) and after (right) optical stimulationBottom: Kaede-green and Kaede-red after unmixing the above image using reference dataof autofluorescence, Kaede-green and Kaede-red. Image before (left) and after (right)optical stimulationSpecimen courtesy of Assistant Professor Shinichi Arimura, Graduate School of Agriculturaland Life Sciences, The University of Tokyo
Autofluorescence of thrips, 408nm/488nm/543nm excitationImage courtesy of Dr. Steve Cody, Ludwig Institute for Cancer Research
Three-dimensional reconstruction image of mouse hippocampus (GFP:inhibitory neurons, green, YFP: excitatory neurons, magenta) throughvolume rendering after spectra unmixingImage courtesy of Dr. Masayuki Sekiguchi, Department ofDegenerative Neurological Diseases, National Institute ofNeuroscience, National Center of Neurology and Psychiatry, Japan
Sliced hippocampus of a transgenic rat (image of a nerve in the spine)Image courtesy of Dr. Hu Qian, Chinese Academy of Science
Living mouse egg, stained with Hoechst3342 (nucleus) andMitoTrakerOrange (mitochondria) and overlaid with DIC imageImage courtesy of Dr. Atsuo Ogura and Dr. Hiromi Miki, RIKEN TsukubaInstitute, RIKEN BioResource Center, BioResource Engineering Division
Actin of HeLa cell that has YFP expressed in nucleus isstained with Alexa 488. Alexa 488 is indicated in greenand YFP is indicated in red after unmixing usingfluorescence reference data.Specimen courtesy of Dr. Yoshihiro Yoneda and Dr.Takuya Saiwaki, Faculty of Medicine, Osaka University
DAPI, Alexa 488, Alexa 546Specimen courtesy of Dr. Ulf Ahlgren, Umea University,Sweden
Comparison before (left) and after (right) exposure of anticancer agent to T47D breast cancer cell. Blue: nucleus, green:actin, red: mitochondriaSpecimen courtesy of Dr. Mitsuhiro Kudo, Department of Pathology, Integrative Oncological Pathology, Nippon Medical School
64-celled (32 cells) embryo of Branchiostoma belcheri stained withanti α tubulin antibody and DAPIImage courtesy of Prof. Kinya Yasui, Assistant Prof. Kunifumi Tagawa,Marine Biological Laboratory, Hiroshima University Graduate Schoolof Science
Fungus sporeSpecimen courtesy of Prof. Rudi Verhoeven, Department of PlantSciences, University of the Free State Bloemfontein, South Africa
GFP expressed in the whole tail of drosophila sperm. Anterior pole of theegg is indicated in red (pseudo color) and GFP indicated in green afterunmixing the autofluorescence spectrum of the egg and spectrum of sperm(GFP).Images courtesy of Director and Professor Masatoshi Yamamoto, DrosophilaGenetic Resource Center, Kyoto Institute of Technology
Argulus acetabulumSpecimen courtesy of School of Environmental Sciences and Development,North-West University, South Africa
18 19

L1L2L3L4
Monitor
Diascopic Detector (Manual/Motorized)
Fixed Stage Microscope FN1 with Laser-safe Trinocular Tube
4-laser Unit(Equipped with AOTF)
PC
Spectral Detector
Laser Fiber
Optical FiberOptical Fiber
Standard Epi-fl Detector (2-PMT or 3-PMT)
Scanning Head
1st Dichroic Mirror
Fluorescence Filter Block
C1 Adapter C1 Adapter
Controller
AOM Controller
Z-focus Module (for Ti-U) Z-focus Module Z-focus Module
Software
Ring Adapter L/S
3-laser Unit
CLEM Control Unit
Inverted Microscope Ti-E/U 90i Microscope with Digital Imaging Head
80i Microscope with Laser-safe Trinocular Tube
Motorized PFS nosepiece
(C1plus/C1si-Ready/C1si)
(C1si only)
System diagram
20 21

C1 plus C1si with 3-laser unit C1si with 4-laser unit
Laser light source Laser wavelength BD laser (405nm, 36mW, variable) BD laser (405nm, 36mW, variable)Laser diode (440nm, 20mW, variable) Laser diode (440nm, 20mW, variable)Ar laser (488nm, 10mW) Ar laser (488nm, 10mW)Ar laser (488nm, 25mW) Ar laser (488nm, 25mW)Ar laser (488nm/514nm, 40mW) Ar laser (457nm/477nm/488nm/514nm, 40mW)Solid-state laser (488nm, 20mW) Solid-state laser (488nm, 20mW)G-HeNe laser (543nm, 2mW random polarization) G-HeNe laser (543nm, 1mW)Solid-state laser (561nm, 10mW) Solid-state laser (561nm, 10mW)Y-HeNe laser (594nm, 2mW) Semiconductor laser (640nm, 10mW)R-HeNe laser (633nm, 5mW)
Maximum loading number 4 3 4Laser control AOM/AOTF/Halving laser controller AOM AOTFLaser shutter Motorized mechanical shutter (each laser)
Confocal pinhole Variable Motorized switchingStandard fluorescence Number of channels 2 channels/3 channels 3 channels 3 channelsdetector 457(440), 408/514, 405/488, 457(440)/514, 488/543, 457(440), 408/514, 405/488, 457(440)/514, 488/543, 457(440), 405/488, 408/514, 457(440)/514, 488/543,
488/594, 408/488/543, 405/488/561, 488/543/633 488/594, 408/488/543, 405/488/561, 488/543/633 408/488/543, 405/488/561, 405/488/543/640, 405/488/561/640, BS20/80
457(440), 488, 405/488, 408/514, 457(440)/514, 488/543, 457(440), 488, 405/488, 408/514, 457(440)/514, 488/543, 457(440), 488, 405/488, 408/514, 457(440)/514, 488/543, 488/594, 408/488/543, 408/488/561, 488/543/633 488/594, 408/488/543, 408/488/561, 488/543/633 405/488/543, 405/488/561, 488/543/640, 488/561/640,
405/488/543/640, 405/488/561/640Scanning specifications Display mode 160x16 to 2048x2048 pixelsfor a standard fluorescence Scanning speed Standard: 1fps (512x512 pixels)detector Bi-directional scanning: 1.4fps (512x512 pixels)
Scanning mode 2D: X-Y, X-T3D: X-Y-Z, X-Y-T4D: X-Y-Z-TROI scan (AOM necessary)Multi-point time-lapse within single screen (X-Y-Z-T-Point)Multi-point time-lapse (X-Y-Z-T-Point, motorized YX stage necessary)Point scanScan rotation (-90 to 90°, 1° step)
Data acquisition for applications FRET, FLAP, FLIPCLEM compatibility Compatible (when laser is controlled by optional AOM) Compatible Not compatible
Spectral detector Number of channels — 32 channels
1st dichroic mirror — 20/80 Beam SplitterCorresponding wavelength — 400-750nmWavelength resolution — 2.5/5/10nm (switchable)Minimum wavelength step — 0.2nm
Scanning specifications Display mode — 160x160 to 1024x1024 pixelsfor a spectral detector Scanning speed — Standard: 0.5fps (512x512 pixels, 32-channel simultaneous recording)
Scanning mode — 3D: X-Y-λ4D: X-Y-Z-λ, X-Y-t-λ5D: X-Y-Z-t-λMulti-point time-lapse within single screen (X-Y-Z-T-λ-Point)Multi-point time-lapse scan (X-Y-Z-T-λ-Point, motorized YX stage necessary)ROI scan (AOTF or AOM necessary)Point scanScan rotation (-90 to 90°, 1° step)
Data acquisition for applications — FRET, FLAP, FLIP, etc.Diascopic detector 1 channel (motorized or manual)Optical zoom 1x-1000x (continuous variable)FOV Square inscribed in a ∅18mm circleImage bit depth 12 bitsCompatible microscopes Upright type ECLIPSE 80i/90i
Inverted type ECLIPSE Ti-E/U, ECLIPSE TE2000-E/U/PFSFixed stage type ECLIPSE FN1
Z-axis control Built-in microscope motor ECLIPSE 90i, ECLIPSE Ti-E, ECLIPSE TE2000-E/PFSExternal motor Stepping motor, 50nm step
Control computer OS Windows® XP ProfessionalInterface Ethernet
Analysis functions 2D, 3D, 4D, time-lapse, etc. Spectra, Fluorescence unmixing, 2D, 3D, 4D, time-lapse, etc.Power BD laser (408nm, 38mW/440nm, 15mW) 15W (single phase AC 100V, 0.15A, with earth)
Ar laser 1500W (single phase AC 100V, 15A, with earth)Solid-state laser (488nm, 20mW) 140W (single phase AC 100V, 1.4A, with earth)G-HeNe laser (543nm, 1/2mW) 40W (single phase AC 100V, 0.4A, with earth)Y-HeNe laser (594nm, 2mW) 40W (single phase AC 100V, 0.4A, with earth)Solid-state laser (561nm, 10mW) 40W (single phase AC 100V, 0.4A, with earth)R-HeNe laser (633nm, 10mW) 40W (single phase AC 100V, 0.4A, with earth)LD laser (640nm, 10mW) 15W (single phase AC 100V, 0.15A, with earth)Confocal system 830W (single phase AC 100V, 8.3A, with earth) 910W (single phase AC 100V, 9.1A, with earth)
(PC, monitor, C1 controller, AOM controller) (PC, monitor, C1 controller, 4-laser unit )Fluorescence microscope 630W (Ti-E)
Installation condition Temperature 5-35°C, humidity 65% (RH) or less (non-condensing)Please ask Nikon or your local distributor about combining laser types.
Recommended layout
380
700
650
(785
)43
0
200 510 W
(142
0)
700
(2400 or 2900)
Controller
レーザユニット Scanning Head
Spectral Detector
Standard Epi-fl Detector
4-laser Unit
W=1500mm (two 19-inch monitors)W=1000mm (24-inch monitor)
Note 1) Computer table size is for reference only.Note 2) Spectral detector is unnecessary for C1plus and C1si-Ready.
L1L2L3L4
L1 POWERL2L3L4
852
380
700
650
(820
)43
0
200 510 852 W
(149
0)
700
(2400 or 2900)
W=1500mm (two 19-inch monitors)W=1000mm (24-inch monitor)
Controller
AOM Controller
3-laser Unit
Scanning Head
Spectral detector
Standard Epi-fl Detector
Note 1) Computer table size is for reference only.Note 2) Spectral detector is unnecessary for C1plus and C1si-Ready.
Combination with the Inverted Microscope Ti-E/U with 4-laser Unit
Combination with the Upright Microscope ECLIPSE 80i/90i with 3-laser Unit
Specifications
22 23

EnPrinted in Japan (0806-00)T Code No. 2CE-SBRH-1
Detector
Pinhole
Laser Dichroic Mirror
Objective
Scanning Mirror
Specimen
Focal Plane
YX
•Extremely high resolving power in the Z-axis direction (depth) makes confocal observation ideal for observing thick specimens such as embryos and eggs.
•Fluorescent-dyed specimens can be rendered in 3D.•Extremely high S/N ratio images are obtainable.
Basic Principle of Confocal Microscopy
Non-confocal microscope image Confocal microscope image
With confocal pinhole observation, high S/N ratio images can be captured that have superior Z-axis resolution compared to that of ordinary fluorescence (non-confocal) observation. Minutestructures deep within a thick specimen are clearly visible.
This brochure is printed on recycled paper made from 40% used material.
Specifications and equipment are subject to change without any notice or obligationon the part of the manufacturer. June 2008 ©2008 NIKON CORPORATION
* Monitor images are simulated.Company names and product names appearing in this brochure are their registered trademarks or trademarks.
WARNINGTO ENSURE CORRECT USAGE, READ THE CORRESPONDINGMANUALS CAREFULLY BEFORE USING YOUR EQUIPMENT.
NIKON CORPORATION6-3, Nishiohi 1-chome, Shinagawa-ku, Tokyo 140-8601, Japanphone: +81-3-3773-8973 fax: +81-3-3773-8986 http://www.nikon-instruments.jp/eng/
NIKON INSTRUMENTS INC.1300 Walt Whitman Road, Melville, N.Y. 11747-3064, U.S.A.phone: +1-631-547-8500; +1-800-52-NIKON (within the U.S.A.only) fax: +1-631-547-0306http://www.nikoninstruments.com/
NIKON INSTRUMENTS EUROPE B.V.Laan van Kronenburg 2, 1183 AS Amstelveen, The Netherlandsphone: +31-20-44-96-222 fax: +31-20-44-96-298http://www.nikoninstruments.eu/
NIKON INSTRUMENTS (SHANGHAI) CO., LTD.CHINA phone: +86-21-5836-0050 fax: +86-21-5836-0030(Beijing branch) phone: +86-10-5869-2255 fax: +86-10-5869-2277(Guangzhou branch) phone: +86-20-3882-0552 fax: +86-20-3882-0580
NIKON SINGAPORE PTE LTDSINGAPORE phone: +65-6559-3618 fax: +65-6559-3668
NIKON MALAYSIA SDN. BHD.MALAYSIA phone: +60-3-7809-3688 fax: +60-3-7809-3633
NIKON INSTRUMENTS KOREA CO., LTD.KOREA phone: +82-2-2186-8410 fax: +82-2-555-4415
NIKON CANADA INC.CANADA phone: +1-905-625-9910 fax: +1-905-625-0103
NIKON FRANCE S.A.S.FRANCE phone: +33-1-45-16-45-16 fax: +33-1-45-16-00-33
NIKON GMBHGERMANY phone: +49-211-9414-0 fax: +49-211-9414-322
NIKON INSTRUMENTS S.p.A.ITALY phone: +39-55-3009601 fax: +39-55-300993
NIKON AGSWITZERLAND phone: +41-43-277-2860 fax: +41-43-277-2861
NIKON UK LTD. UNITED KINGDOM phone: +44-20-8541-4440 fax: +44-20-8541-4584
NIKON GMBH AUSTRIA AUSTRIA phone: +43-1-972-6111-00 fax: +43-1-972-6111-40
NIKON BELUXBELGIUM phone: +32-2-705-56-65 fax: +32-2-726-66-45
The AOTF incorporated into the 4-laser unit and theAOM optionally incorporated into the 3-laser unit areclassified as controlled products (including provisionsapplicable to controlled technology) under foreignexchange and trade control laws. You must obtaingovernment permission and complete all requiredprocedures before exporting this system.
Images and specimens courtesy of:
Cover image (top): Mouse’s whole brain stained with mCB (mouse monoclonal anti-calbindin: green), rPV (rabbit polyclonalanti-parvalbumin: red) and nucleus (Hoechst: blue)—Assistant Prof. Kazunori Toida, Department of Anatomy and Cell Biology,Institute of Health Biosciences, the University of Tokushima Graduate School
Cover image (middle): Three-dimensional reconstruction image of mouse hippocampus (GFP: inhibitory neurons, green, YFP: excitatory neurons, magenta) through volume rendering after spectra unmixing—Dr. Masayuki Sekiguchi, Department ofDegenerative Neurological Diseases, National Institute of Neuroscience, National Center of Neurology and Psychiatry, Japan
Cover image (bottom): HepG2 cells infected with dengue virus. Fluorescence reagent: Dengue virus (FITC), Nuclei (DAPI),Clathrin (Texas Red)—Ang Firzan and Dr. Justin Chu, Department of Microbiology, National University of Singapore.