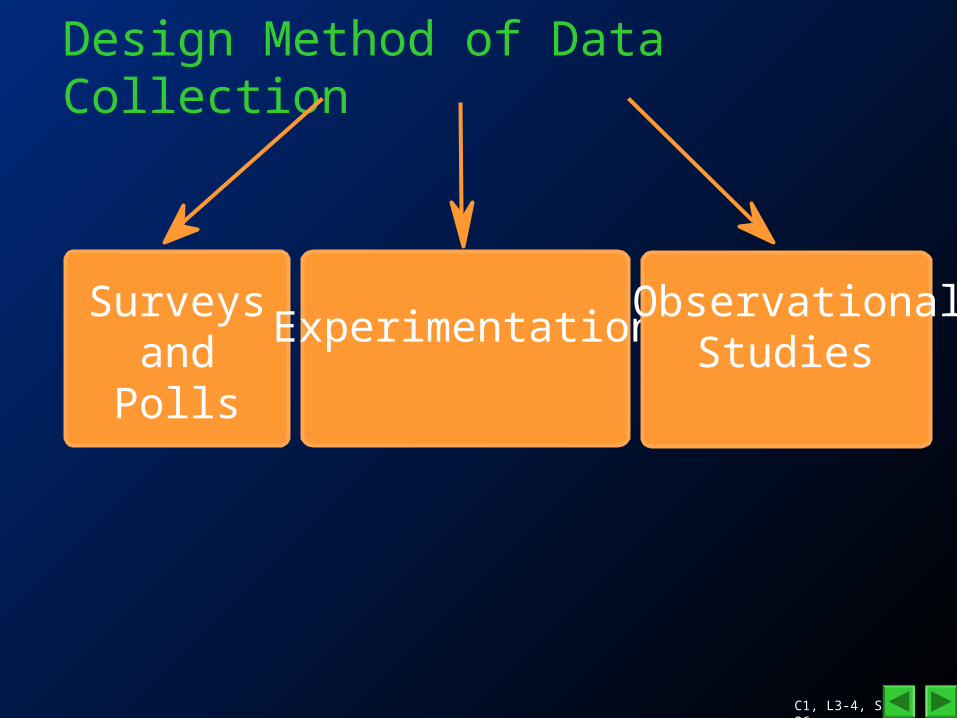
c1, l3-4, s1 design method of data collection surveys and polls experimentation observational...
TRANSCRIPT

C1, L3-4, S1
Design Method of Data Collection
Surveys and Polls
Experimentation Observational
Studies

C1, L3-4, S2
Experiments & Observational Studies
Two other basic types of statistical study used for collecting data are experimental studies and observational studies.
We use these when we are interested in studying the effect of a treatment on individuals or experimental units.
C1, L3-4, S3
Experiments & Observational Studies
We conduct an experiment when it is (ethically, physically etc) possible for the experimenter to determine which experimental units receive which treatment.

C1, L3-4, S4
Experiments & Observational StudiesExperiment Terminology
Experimental Unit Treatment Response
patient drug cholesterol
car gasoline knocking
tomatoes fertilizer yield
mouse radiation mortality

C1, L3-4, S5
Experiments & Observational Studies
In an observational study, we compare the units that happen to have received each of the treatments.

C1, L3-4, S6
e.g. You cannot set up a control (non-smoking) group and treatment (smoking) group.
Observational Study
patient smoking lung cancer
potatoes weather yieldhuman radiation mortality
Experiments & Observational Studies
Unit Treatment Response
C1, L3-4, S7
Experiments & Observational Studies
Note:
Only a well-designed and well-executed experiment can reliably establish causation.
An observational study is useful for identifying possible causes of effects, but it cannot reliably establish causation.

C1, L3-4, S8
ExperimentationGuiding Principle:
Make comparisons fair – try to make
treatment groups as similar as possible
except for treatments being used.

C1, L3-4, S9
1. Completely Randomized Design
The treatments are allocated entirely by
chance to the experimental units.
C1, L3-4, S10
1. Completely Randomized Design
Example:
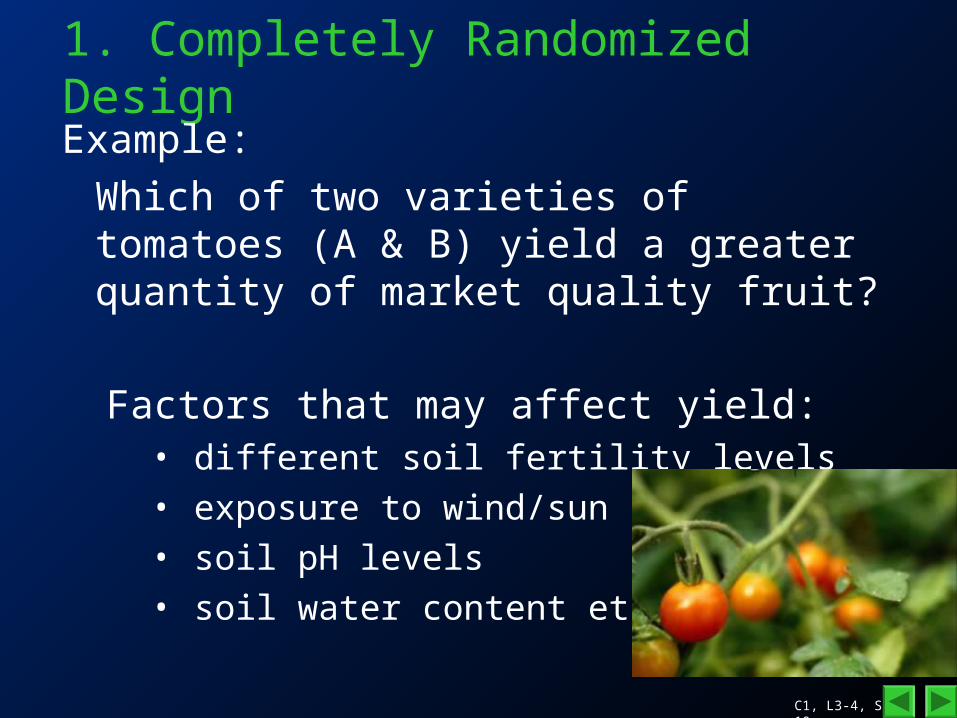
Which of two varieties of tomatoes (A & B) yield a greater quantity of market quality fruit?
Factors that may affect yield:• different soil fertility levels• exposure to wind/sun• soil pH levels• soil water content etc.

C1, L3-4, S11
Divide the field into plots and randomly allocate the tomato varieties (treatments) to each plot (unit).
8 plots – 4 get variety A
(A) (A) (A)
(A)(B) (B)
(B)
(B)
1. Completely Randomized Design
What if the field sloped upward from left to right?
UPHILL
Discuss for ½ Minute

C1, L3-4, S12
1. Completely Randomized Design
Note:
Randomization is an attempt to make the treatment groups as similar as possible — we can only expect to achieve this when there is a large number of plots.

C1, L3-4, S13
2. BlockingGroup (block) experimental units by some known factor and then randomize within each block in an attempt to balance out the unknown factors.
Use:•blocking for known factors
(e.g. slope of field in previous example)
and•randomization for unknown factors to try to “balance things out”.

C1, L3-4, S14
2. Blocking
Example continued:
It is recognized that there are two areas in the field – well drained and poorly drained.
Partition the field into two blocks and then randomly allocate the tomato varieties to plots within each block.

C1, L3-4, S15
Well drained Poorly drained
2. Blocking
How should we allocate varieties to plots?
Discuss in groups for 1/2 minute.
7 (B)
2 (A)
3 (A)
5 (A) 6 (A)
1 (A)
2 (B)3 (A)
4 (B)
8 (B)
4 (B)
1 (B)
Randomly assign types to 4 well drained plots and then to the 8 poorly drained plots.

C1, L3-4, S16
3. People as Experimental Units
Example: Cholesterol Drug Study – Suppose we wish to determine whether a drug will help lower the cholesterol level of patients who take it.
How should we design our study?
Discuss for two minutes in groups.
C1, L3-4, S17
Polio Vaccine Example

C1, L3-4, S18
Polio Vaccine Example
Dr. Jonas Salk, vaccine pioneer 1914-95
Iron Lung

C1, L3-4, S19
The Salk Vaccine Field Trial
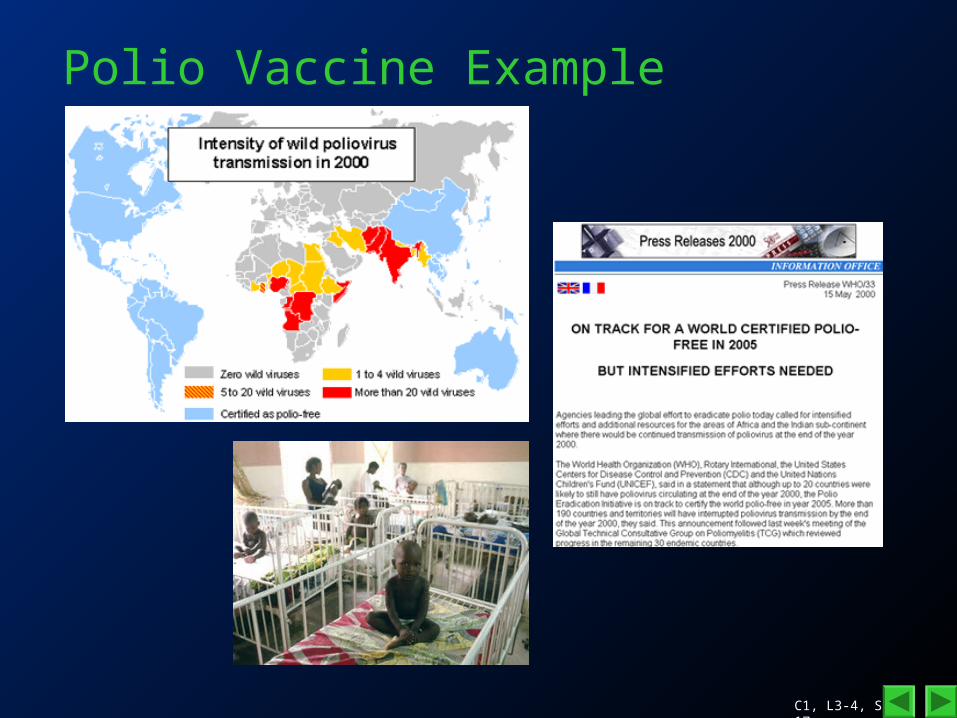
• 1954 Public Health Service organized an experiment to test the effectiveness of Salk’s vaccine.
• Need for experiment:– Polio, an epidemic disease with cases
varying considerably from year to year. A drop in polio after vaccination could mean either:• Vaccine effective• No epidemic that year

C1, L3-4, S20
The Salk Vaccine Field Trial
Subjects: 2 million, Grades 1, 2, and 3
• 500,000 were vaccinated– (Treatment Group)
• 1 million deliberately not vaccinated– (Control Group)
• 500,000 not vaccinated - parental permission denied

C1, L3-4, S21
The Salk Vaccine Field TrialNFIP Design
• Treatment Group: Grade 2
• Control Group: Grades 1 and 3 + No Permission
Flaws ? Discuss for 30 seconds.• Polio contagious, spreading through contact.
i.e. incidence could be greater in Grade 2 (bias against vaccine), or vice-versa.
• Control group included children without parental permission (usually children from lower income families) whereas Treatment group could not (bias against the vaccine).

C1, L3-4, S22
The Salk Vaccine Field TrialDouble-Blinded Randomized Controlled Experimental Design• Control group only chosen from those with
parental permission for vaccination• Random assignment to treatment or control
group• Use of placebo (control group given injection of
salted water)• Diagnosticians not told which group the subject
came from (polio can be difficult to diagnose)• i.e., a double-blind randomized controlled
experiment

C1, L3-4, S23
(NFIP rate)
(25) Grade 2
(54) Grade 1/3
(44) Grade 2
The Salk Vaccine Field Trial
The double-blind randomized controlled experiment (and NFIP) results
Size ofgroup
Rate per 100,000
Treatment 200,000 28
Control 200,000 71
No consent 350,000 46

C1, L3-4, S24
3. People as Experimental Units• control group:
– Receive no treatment or an existing treatment
• blinding: – Subjects don’t know which
treatment they receive• double blind:
– Subjects and administers / diagnosticians are blinded
• placebo: – Inert dummy treatment

C1, L3-4, S25
3. People as Experimental Units
• placebo effect:– A common response in humans
when they believe they have been treated.
– Approximately 35% of people respond positively to dummy treatments - the placebo effect
C1, L3-4, S26
Design Method of Data Collection
Surveys and Polls
Experimentation Observational
Studies

C1, L3-4, S27
Observational Studies
• There are two major types of observational studies:
prospective and retrospective studies

C1, L3-4, S28
Observational Studies
1. Prospective Studies– (looking forward)
– Choose samples now, measure variables and follow up in the future.
– E.g., choose a group of smokers and non-smokers now and observe their health in the future.

C1, L3-4, S29
Observational Studies
– Looks back at the past.– E.g., a case-control study
• Separate samples for cases and controls (non-cases).
• Look back into the past and compare histories.
• E.g. choose two groups: lung cancer patients and non-lung cancer patients. Compare their smoking histories.
2. Retrospective Studies – (looking back)

C1, L3-4, S30
Observational Studies
Note:
1. Observational studies should use some form of random sampling to obtain representative samples.
2. Observational studies cannot reliably establish causation.

C1, L3-4, S31
Controlling for various factors
• A prospective study was carried out over 11 years on a group of smokers and non-smokers showed that there were 7 lung cancer deaths per 100,000 in the non-smoker sample, but 166 lung cancer deaths per 100,000 in the smoker sample.
• This still does not show smoking causes lung cancer because it could be that smokers smoke because of stress and that this stress causes lung cancer.

C1, L3-4, S32
Controlling for various factors
• To control for this factor we might divide our samples into different stress categories. We then compare smokers and non-smokers who are in the same stress category.
• This is called controlling for a confounding factor.

C1, L3-4, S34
Example 1• “Home births give babies a good chance”
NZ Herald, 1990– An Australian report was stated to have said that
babies are twice as likely to die during or soon after a hospital delivery than those from a home birth.
– The report was based upon simple random samples of home births and hospital births.
Q: Does this mean hospitals are dangerous places to have babies in Australia? Why or why not? Discuss for 1 minute in groups.

C1, L3-4, S35
Example 2
• “Lead Exposure Linked to Bad Teeth in Children” ~ USA Today
The study involved 24,901 children ages 2 and older. It showed that the greater the child’s exposure to lead, the more decayed or missing teeth.
Q: Does this show lead exposure causes tooth decay in children? Why or why not?
Discuss for 1 minute.

C1, L3-4, S36
Example 2 ~ cont’d
• “Lead Exposure Linked to Bad Teeth in Children” ~ USA Today
Researcher:
“We controlled for income level, the proportion of diet due to carbohydrates, calcium in the diet and the number of days since the last dental visit.”