c , t nvestor relations presentation -...
TRANSCRIPT

INVESTOR RELATIONS PRESENTATIONJUNE 2018
CORPUS CHRISTI, TEXAS

FORWARD LOOKING STATEMENTS
2
“This presentation contains forward-looking statements about the business, financial condition and prospects of FirstCash, Inc. and its wholly owned subsidiaries (together, the “Company”). Forward-looking statements, as that term is defined in the Private Securities Litigation Reform Act of 1995, can be identified by the use of forward-looking terminology such as “believes,” “projects,” “expects,” “may,” “estimates,” “should,” “plans,” “targets,” “intends,” “could,” “would,” “anticipates,” “potential,” “confident,” “optimistic,” or the negative thereof, or other variations thereon, or comparable terminology, or by discussions ofstrategy, objectives, estimates, guidance, expectations and future plans. Forward-looking statements can also be identified by the fact these statements do not relate strictly to historical or current matters. Rather, forward-looking statements relate to anticipated or expected events, activities, trends or results. Because forward-looking statements relate to matters that have not yet occurred, these statements are inherently subject to risks and uncertainties.
These forward-looking statements are made to provide the public with management’s current assessment of the Company’s business. Although the Company believes the expectations reflected in forward-looking statements are reasonable, there can be no assurances such expectations will prove to be accurate. Security holders are cautioned such forward-looking statements involve risks and uncertainties. Certain factors may cause results to differ materially from those anticipated by the forward-looking statements made in this presentation. Such factors may include, without limitation, the risks, uncertainties and regulatory developments discussed and described in (i) the Company’s 2017 annual report on Form 10-K filed with the Securities and Exchange Commission (the “SEC”) on February 20, 2018, including the risks described in Part 1, Item 1A, “Risk Factors” thereof, and (ii) other reports filed with the SEC, including the Company’s First Quarter 2018 report on Form 10-Q. Many of these risks and uncertainties are beyond the ability of the Company to control, nor can the Company predict, in many cases, all of the risks and uncertainties that could cause its actual results to differ materially from those indicated by the forward-looking statements. The forward-looking statements contained in this presentation speak only as of the date of this presentation, and the Company expressly disclaims any obligation or undertaking to report any updates or revisions to any such statement to reflect any change in the Company’s expectations or any change in events, conditions or circumstances on which any such statement is based, except as required by law.”

3
$132 $180
$273
2015 2016 2017
$705
$1,088
$1,780
2015 2016 2017
ADJUSTED EBITDA(1)
OVERVIEW REVENUE
1 See “Non-GAAP Financial Information” and “Reconciliation of Net Income to EBITDA and Adjusted EBITDA in the Appendix.
Source: Company filings.
($ IN MILLIONS)• Leading pawn operator with over 2,200 store
locations in 25 U.S. states and Latin America,
including Mexico, Guatemala, El Salvador and
Colombia.
• Retailer of pre-owned consumer products including:
– Consumer electronics & appliances
– Jewelry, diamonds & watches
– Power tools, musical instruments & sporting
goods
• Source of small, short-term pawn loans
– Fully collateralized
– No collections / credit reporting
• Attractive industry dynamics
– Steady demand across economic cycles –
recession resistant
– Customer base is underserved – most
lenders don’t offer loans of $150 or less
– Stable regulatory environment
($ IN MILLIONS)
AT A GLANCE

LARGEST PAWN OPERATOR IN THE AMERICASOVER 2,200 STORES IN FIVE COUNTRIES
4
MEXICO OPERATIONS – 1,088 STORES IN 32 STATESU.S. OPERATIONS – 1,110 STORES IN 25 STATES
CENTRAL AND SOUTH AMERICA OPERATIONS – 48 STORES
33
27
6
34
7
409
18
25
25 34119
26
5341
27468
75
26
2
30
1
6 29
3
WA
ID
CA
NV
OR
AZ
CO
MT
NM
UTWY
TX
KS
OK
IL IN
IA
MN
NE
ND
SD WI
MSAL
AR
KY
LA
MO
FL
GA
NC
SC
VA
OH
CT
ME
MI
NHNY
PA
VT
MA
NJ
MDWV
RI
DE
TN
AK
DC
HI
Baja California
Baja California SurSinaloa
Sonora Chihuahua Coahuila
Nuevo Leon
Tamaulipas
Quintana Roo
Yucatan
San Luis Potosi
CampecheChiapas
Tabasco
Oaxaca
Morelos
Estado de Mexico
Guerrero
Durango
NayaritZacatecas
AguascalientesJaliscoColima
Michoacán
Guanajuato
Puebla
1,088
Estado de Ciudad de Mexico
Veracruz
Queretaro
TlaxcalaHidalgo
Note: As of Press Release 4/26/2018
Guatemala
34El Salvador
13
1Colombia
IDENTIFIES NEW COUNTRY

PAWN-FOCUSED PRODUCT MIXTRAILING TWELVE MONTHS (TTM)
5
TOTAL REVENUE
$1.8 BILLION
NET REVENUE$0.9 BILLION
59%
29%
4%8%
39%54%
6% 1%
Note: As of 3/31/2018
PAWN STORE
RETAIL SALESPAWN FEES
SCRAP JEWELRY
SALES
CONSUMER LOAN/SERVICE FEES
CONSOLIDATED GROSS MARGIN BY PRODUCT TYPE
35% 100% 5% 73%

TYPICAL PAWN TRANSACTION CYCLETOTAL TRANSACTION TIME LESS THAN 15 MINUTES
6
~20% ~80%
PAWN SERVICE FEESMONTHLY YIELD = 12% - 13%
CUSTOMER REPAYS LOAN & PAWN SERVICE FEE
~25% ~75%
SELLS ASSET TO COMPANY
RETAIL SALESTYPICAL MARGIN = 35%
CUSTOMER DOES NOT REPAY
LOAN OR FEE
PAWN LOAN(COLLATERALIZED WITH ASSET)
CUSTOMER ENTERS STORE WITH
PERSONAL ASSET

LIMITED CREDIT RISK FOR PAWN LENDING
7
• PAWN LOANS ARE SMALL AND
AFFORDABLE WITH A SHORT DURATION
– 30 TO 60 DAYS
• APPROXIMATELY 75% OR MORE OF
PAWN LOANS ARE REPAID
• ALL LOANS FULLY COLLATERALIZED WITH
PERSONAL PROPERTY HELD BY THE PAWN
STORE
– RAPID LIQUIDATION THROUGH ON-SITE
PAWN RETAIL OPERATIONS
– TYPICAL RETAIL MARGIN OF 35% TO
40% ON FORFEITED COLLATERAL
$164
$67
$0
$40
$80
$120
$160
U.S. LatAm
AVERAGE PAWN LOAN1
(COLLATERALIZED WITH ASSET)
1 As of 3/31/2018
IN USD $

LATIN AMERICA OVERVIEWMEXICO, GUATEMALA, EL SALVADOR
AND COLOMBIA
AGUASCALIENTES, MEXICO
TIJUANA, MEXICO

OVER 1,100 LATIN AMERICA LOCATIONS
9
705
909 953
1,088
32
46 46
48
4 29 60
100 130
157 207
269 329
386 447
538 597
674 737
955 999
1,136
2001 2002 2003 2004 2005 2006 2007 2008 2009 2010 2011 2012 2013 2014 2015 2016 2017 As of4/26/2018
MEXICO CENTRAL & SOUTH AMERICA
51% OF TOTAL
STORE BASE
TOTAL LATIN AMERICA LOCATIONS, END OF PERIOD10 YEAR CAGR
18%

10
MAJORITY OF STORES & EMPLOYEES BASED IN LATAM;ALMOST 80% OF STORE INVESTMENTS IN LATAM
LatAm U.S.
7,743 46%
9,039 54%
EMPLOYEES3
1,110 49%
1,136 51%
STORES1
$233,079 65%
$123,085 35%
SEGMENT
CONTRIBUTION4
$8,357 21%
$30,643 79%
STORE
INVESTMENTS2
1 As of Press Release 4/26/2018 2 TTM 3/31/2018 Store CapEx and Acquisitions 3 As of 3/31/2018
4 Segment Contribution as of TTM 3/31/2018; Segment Contribution defined as Gross Profit less Store Operating Expenses and Store D&A
LATAM OPERATING TRENDS: Q1-2018
11
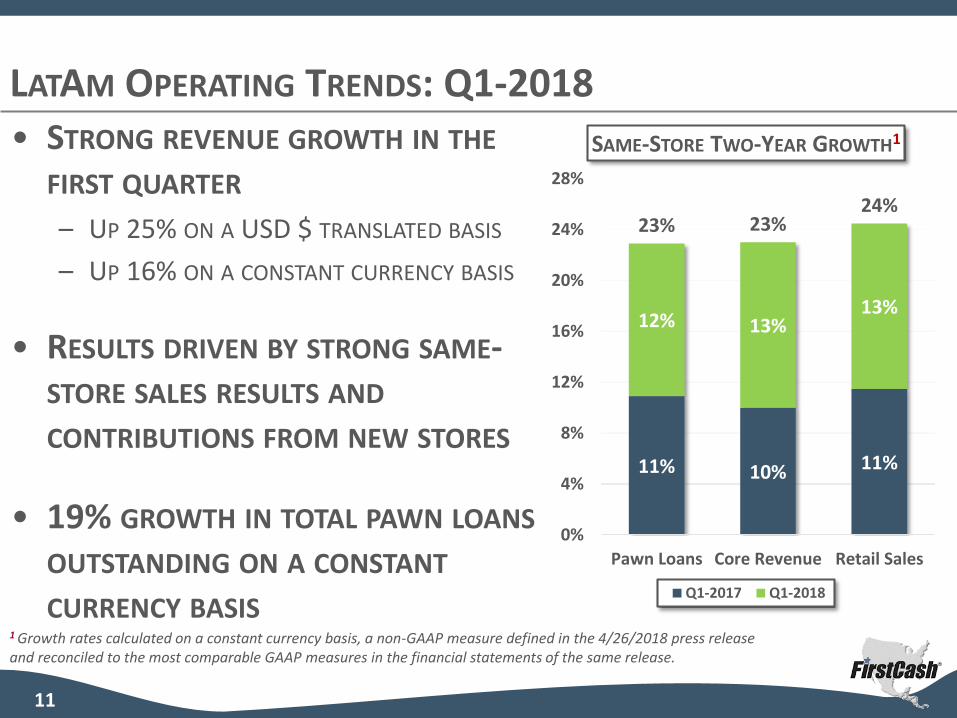
• STRONG REVENUE GROWTH IN THE
FIRST QUARTER
– UP 25% ON A USD $ TRANSLATED BASIS
– UP 16% ON A CONSTANT CURRENCY BASIS
• RESULTS DRIVEN BY STRONG SAME-STORE SALES RESULTS AND
CONTRIBUTIONS FROM NEW STORES
• 19% GROWTH IN TOTAL PAWN LOANS
OUTSTANDING ON A CONSTANT
CURRENCY BASIS
11% 10% 11%
12% 13%13%
23% 23%24%
0%
4%
8%
12%
16%
20%
24%
28%
Pawn Loans Core Revenue Retail Sales
SAME-STORE TWO-YEAR GROWTH1
Q1-2017 Q1-2018
1 Growth rates calculated on a constant currency basis, a non-GAAP measure defined in the 4/26/2018 press release and reconciled to the most comparable GAAP measures in the financial statements of the same release.

LATAM PAWN AND INVENTORY COMPOSITION
12
LATAM OPERATIONS SEGMENT
19%
64%
11%
2%2%
2%
25%
60%
10%
1%2%
2%
PAWN COLLATERAL INVENTORY
Note: As of 3/31/2018
JEWELRY ELECTRONICS TOOLS SPORTING GOODS MUSICAL INSTRUMENTS OTHER
PRENDAMEX ACQUISITION
13
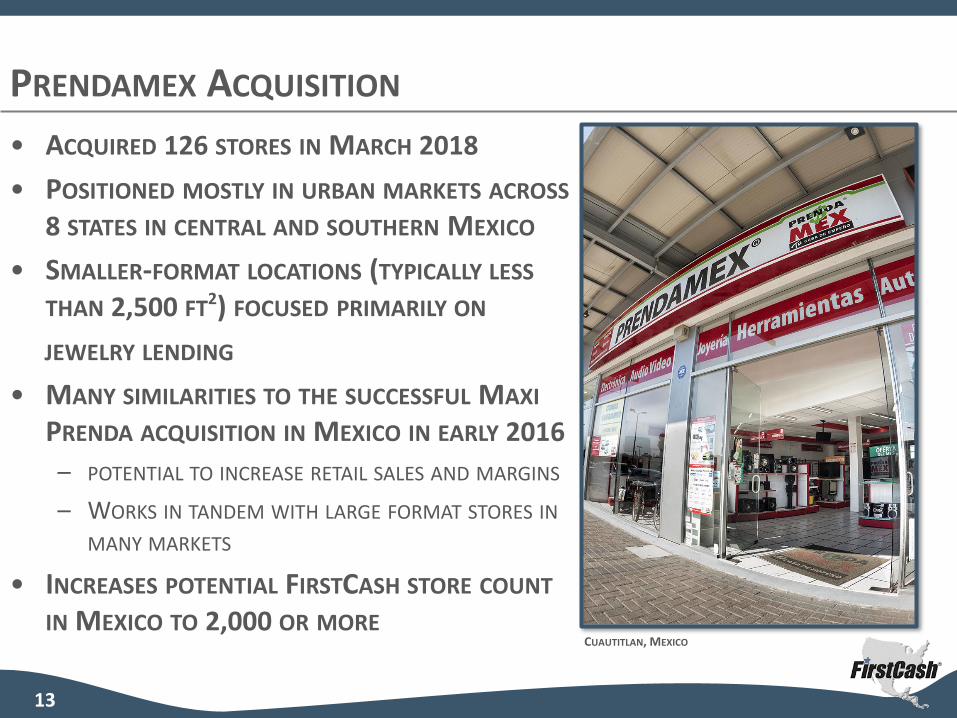
• ACQUIRED 126 STORES IN MARCH 2018
• POSITIONED MOSTLY IN URBAN MARKETS ACROSS
8 STATES IN CENTRAL AND SOUTHERN MEXICO
• SMALLER-FORMAT LOCATIONS (TYPICALLY LESS
THAN 2,500 FT2) FOCUSED PRIMARILY ON
JEWELRY LENDING
• MANY SIMILARITIES TO THE SUCCESSFUL MAXI
PRENDA ACQUISITION IN MEXICO IN EARLY 2016
– POTENTIAL TO INCREASE RETAIL SALES AND MARGINS
– WORKS IN TANDEM WITH LARGE FORMAT STORES IN
MANY MARKETS
• INCREASES POTENTIAL FIRSTCASH STORE COUNT
IN MEXICO TO 2,000 OR MORECUAUTITLAN, MEXICO
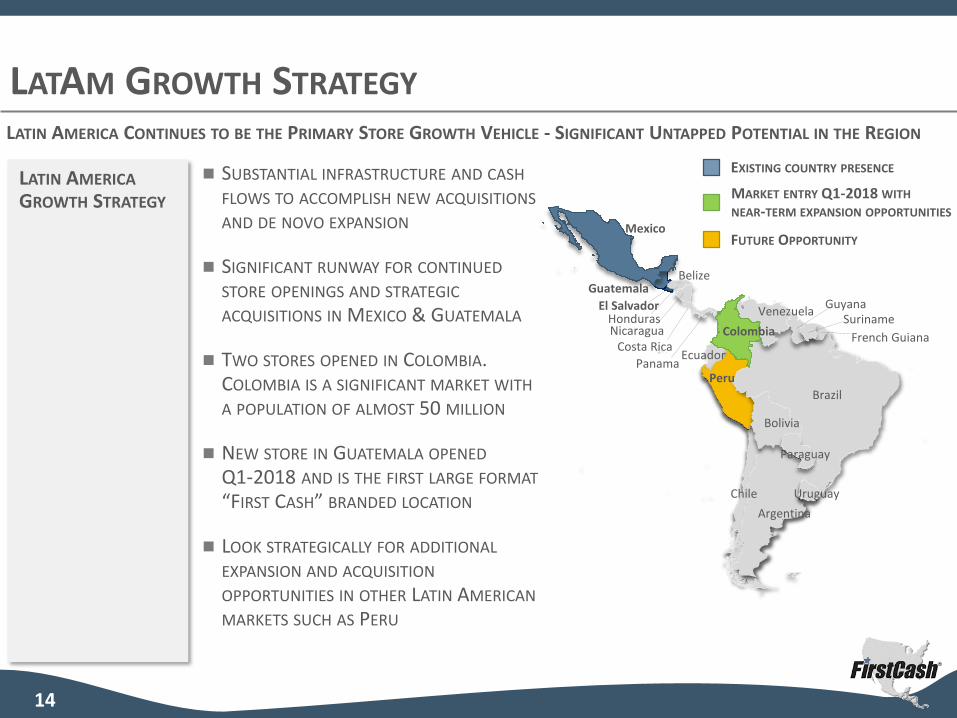
LATAM GROWTH STRATEGY
SUBSTANTIAL INFRASTRUCTURE AND CASH
FLOWS TO ACCOMPLISH NEW ACQUISITIONS
AND DE NOVO EXPANSION
SIGNIFICANT RUNWAY FOR CONTINUED
STORE OPENINGS AND STRATEGIC
ACQUISITIONS IN MEXICO & GUATEMALA
TWO STORES OPENED IN COLOMBIA. COLOMBIA IS A SIGNIFICANT MARKET WITH
A POPULATION OF ALMOST 50 MILLION
NEW STORE IN GUATEMALA OPENED
Q1-2018 AND IS THE FIRST LARGE FORMAT
“FIRST CASH” BRANDED LOCATION
LOOK STRATEGICALLY FOR ADDITIONAL
EXPANSION AND ACQUISITION
OPPORTUNITIES IN OTHER LATIN AMERICAN
MARKETS SUCH AS PERU
LATIN AMERICA CONTINUES TO BE THE PRIMARY STORE GROWTH VEHICLE - SIGNIFICANT UNTAPPED POTENTIAL IN THE REGION
French Guiana
SurinameGuyana
Panama
Costa RicaNicaragua
El SalvadorHonduras
Guatemala
Argentina
Bolivia
Brazil
Chile
Peru
Uruguay
Venezuela
Mexico
Paraguay
Belize
LATIN AMERICA
GROWTH STRATEGY
EXISTING COUNTRY PRESENCE
MARKET ENTRY Q1-2018 WITH
NEAR-TERM EXPANSION OPPORTUNITIES
14
Colombia
Ecuador
FUTURE OPPORTUNITY

NEW STORE OPENINGS
15
• 11 LARGE FORMAT DE NOVO LOCATIONS
OPENED IN LATAM Q1-2018
– 9 IN MEXICO AND SINGLE STORES IN
GUATEMALA AND COLOMBIA
• STRONG PIPELINE OF ADDITIONAL DE NOVO
LOCATIONS WHICH ARE EXPECTED TO OPEN
IN 2018
• THE COLOMBIAN STORE OPENINGS MARK
THE FIRST LOCATIONS IN SOUTH AMERICA
• THE DE NOVO GUATEMALA OPENING IS
THE COMPANY’S FIRST LARGE FORMAT
FIRST CASH BRANDED STORE IN THE
COUNTRY
BOGOTA, COLOMBIA – OPENED Q2-2018
AMATITLAN , GUATEMALA – OPENED Q1-2018

PROVEN NEW STORE OPENING PROCESS
16
OPENED FIRST STORES IN MEXICO IN 1999
EXPERIENCED REAL ESTATE DEVELOPMENT TEAM
PROVEN SITE SELECTION STRATEGY
STANDARDIZED STORE LAYOUTS, FIXTURES AND EQUIPMENT
STATE OF THE ART SECURITY TECHNOLOGY
CONSISTENT PROCESS ENSURES THE NEW STORES ARE DELIVERED ON TIME AND WITHIN BUDGET
UNDEVELOPED SITE SAME SITE AFTER REDEVELOPMENT
MONTERREY, MEXICO

Year 1 Year 2 Year 3 Year 4 Year 5
Op Margin (4%) 17% 22% 24% 26%
$0
$40
$80
$120
$160
$200
$0
$100
$200
$300
$400
$500
Year 1 Year 2 Year 3 Year 4 Year 5
Sto
re-l
eve
l pro
fit U
SD $
(Th
ou
san
ds)
Re
ven
ue
USD
$ (
Tho
usa
nd
s)
Revenue Store-level Profit
PROVEN RAPID PAYBACK MODEL
MEXICO NEW STORE INVESTMENT AND PROFITABILITY RAMP
Typical Mexico New Store RampNew Store Investment
(USD $)
Cap Ex- Leasehold improvements & fixtures
- Computer & security equipment
$160,000
Start-up Losses- Pre-opening- First six months of operation
$25,000
Total Store Investment $185,000
Working Capital (USD $)
First Year for New Store- Operating cash- Loan funding - Inventory
$90,000
CUMULATIVE BREAK-EVEN POINT = APPROXIMATELY 3 YEARS
`
17
($ IN USD)
1 Store-Level Operating Profit Before Administrative Expense & Taxes; Data is Based on NSO From 2005-2017
1

UNITED STATES OVERVIEWLOCATIONS IN 25 STATES
GRAND PRAIRIE, TEXAS
CORPUS CHRISTI, TEXAS
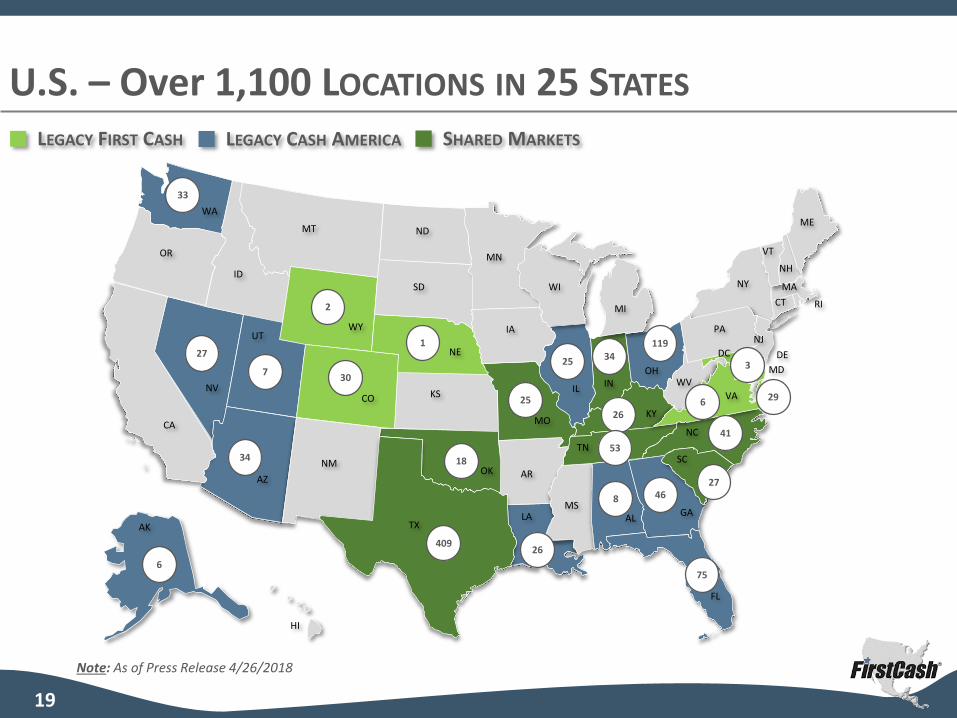
U.S. – Over 1,100 LOCATIONS IN 25 STATES
19
33
27
6
34
7
409
18
25
25 34119
26
53
41
27468
75
26
2
30
1
6 29
3
WA
ID
CA
NV
OR
AZ
CO
MT
NM
UTWY
TX
KS
OK
ILIN
IA
MN
NE
ND
SD WI
MSAL
AR
KY
LA
MO
FL
GA
NC
SC
VA
OH
CT
ME
MI
NH
NY
PA
VT
MA
NJ
MDWV
RI
DE
TN
AK
DC
HI
Note: As of Press Release 4/26/2018
SHARED MARKETSLEGACY FIRST CASH LEGACY CASH AMERICA

U.S. OPERATING TRENDS: Q1-2018
20
• LEGACY FIRST CASH STORES CONTINUE TO
SEE SOLID SAME-STORE INCREASES:
– SAME-STORE PAWN LOANS UP 6%
– SAME-STORE PAWN FEE REVENUE UP 4%
• LEGACY CASH AMERICA POSTED SOLID
SEQUENTIAL IMPROVEMENTS:
– PAWN LOANS EXPECTED TO COMP POSITIVE
IN Q3-2018
– RAPIDLY IMPROVING RETAIL MARGINS
– IMPROVED INVENTORY METRICS
89%88% 88% 91%
94%95%
11%
12%12% 9%
6%
5%
$283
$258$244
$240
$217
$188
$0
$50
$100
$150
$200
$250
$300
$350
Tho
usa
nd
s
U.S. INVENTORY LEVELS($ IN MILLIONS)
Current INV Aged INV1
1 Aged inventory defined as inventory aged 361+ days

CASH AMERICA MERGER SYNERGIES DRIVE ADDITIONAL
ACCRETION
21
Annual operating cost synergies
ESTIMATED AMOUNTS
AT TIME OF MERGER
ACHIEVED AS OF
DECEMBER 2017
• ~$45 MILLION PRIMARILY FROM
TECHNOLOGY, FINANCE AND OTHER
ADMINISTRATIVE SYNERGIES
ACHIEVED BY MID 2018
• MINIMAL STORE CLOSINGS
• UP TO ~$28 MILLION • APPROXIMATELY $24 MILLION
• ~$17 – $20 MILLION PRIMARILY
FROM TECHNOLOGY PLATFORM
SYNERGIES
• $43 MILLION IN 2017ANNUAL OPERATING
COST SYNERGIES
ANNUAL
DEPRECIATION AND
AMORTIZATION
SAVINGS
TRANSACTION AND
INTEGRATION COSTS
EXPECTED OPPORTUNITIES
IN 2018
• ~$75 MILLION OR MORE OF
RUN RATE SYNERGIES EXPECTED
TO BE ACHIEVED BY END OF
2018
• LESS THAN $2 MILLION IN
2018
• $19 MILLION IN 2017

ANNUALIZED TTM ADMIN AND D&A EXPENSES
22
Note: Excludes merger related expenses
($ IN MILLIONS ON A TTM BASIS)
$165 $161 $151 $140 $132 $122 $117
$70 $67$63
$59$57
$55 $52
$235$228
$213$199
$189$177
$169
$239
$-
$50
$100
$150
$200
$250
Q3-2016 Q4-2016 Q1-2017 Q2-2017 Q3-2017 Q4-2017 TTMQ1-2018
Proforma Admin Exp. Proforma Depreciation and Amortization Exp. Proforma Pre-Merger Expense
Realized Synergies of$70 Million at March 2018

23
U.S. PAWN AND INVENTORY COMPOSITIONU.S. OPERATIONS SEGMENT
Note: As of 3/31/18
PAWN COLLATERAL INVENTORY
61%
15%
9%
3%
9%
3%
66%
16%
6%
3%
6%
3%
JEWELRY ELECTRONICS TOOLS SPORTING GOODS MUSICAL INSTRUMENTS OTHER

U.S. EARNINGS GROWTH STRATEGY
24
•CONTINUE SCOUTING ACQUISITIONS IN EXISTING STATES
– ORGANIC DEMAND AS UNBANKED AND UNDERBANKED DEMOGRAPHICS
CONTINUE TO GROW
– CONTINUED OPPORTUNITIES FOR SMALLER “TUCK-IN” ACQUISITIONS
– 12 SHOP ACQUISITION IN TN/GA (US MONEY Q1-2018)
– 4 SINGLE STORE ACQUISITIONS TO DATE IN 2018
•DRIVE FURTHER MERGER SYNERGIES & MARGIN IMPROVEMENT
– ADDITIONAL SYNERGIES EXPECTED IN 2018
– INCREASED RETAIL MARGINS, ESPECIALLY IN LEGACY CASH AMERICA
LOCATIONS
– EXPECTING PAWN LOAN GROWTH IN SECOND HALF OF 2018 AND BEYOND

STABLE REGULATORY CLIMATE FOR PAWN
25
• PAWN LOANS ARE DIFFERENT FROM TRADITIONAL CONSUMER LOAN PRODUCTS
AND NOT SUBJECT TO THE CFPB SMALL DOLLAR LOAN RULES BECAUSE THEY:
– ARE NON-RECOURSE LOANS
– HAVE SIGNIFICANTLY SMALLER AVERAGE LOAN SIZES
– DO NOT INVOLVE CREDIT CHECKS, COLLECTION ACTIVITIES, ACH TRANSACTIONS OR NEGATIVE
CREDIT REPORTING
• REGULATIONS ARE PRIMARILY AT THE STATE LEVEL IN THE U.S. AND THE FEDERAL
LEVEL IN LATIN AMERICA
• NO SIGNIFICANT NEGATIVE REGULATORY CHANGES IN THE LAST 25 YEARS
• STATES WITH A POSITIVE RATE CHANGE INCLUDE:
– OHIO (119 STORES): ENACTED MARCH 28, 2017
– WASHINGTON (33 STORES): ENACTED JULY 24, 2015
– ARIZONA (34 STORES): ENACTED JULY 24, 2014
– NEVADA (27 STORES): ENACTED OCTOBER 1, 2011Note: As of 3-31-18

98%
2%
LIMITED EXPOSURE TO CFPB RULES FOR PAYDAY LENDING
26
TARGET REVENUE MIX (NEXT 3-5 YEARS)
96%
4%
CONSUMER LENDING
PAWN OPERATIONS
Q1-2018 TTM
REVENUE MIX IS PRIMARILY PAWN RELATED
• IN OCTOBER 2017, THE CFPB RELEASED ITS SMALL-DOLLAR LOAN RULE (THE “SDL RULE”), WHICH IS
SCHEDULED TO TAKE EFFECT IN JULY 2019. IF THE SDL RULE TAKES EFFECT, IT WILL IMPACT SHORT-TERM
SMALL DOLLAR LOAN PRODUCTS SUCH AS PAYDAY LOANS, AUTO TITLE LOANS AND CERTAIN INSTALLMENT
LOANS. IMPORTANTLY, THE SDL RULE DOES NOT APPLY TO NON-RECOURSE PAWN LOANS.
– THE PROPOSED RULES INCLUDE, AMONG OTHER THINGS:
– ADDITIONAL UNDERWRITING REQUIREMENTS
– COOLING-OFF PERIODS BETWEEN CERTAIN LOANS
– LIMITATIONS TO PREVENT THE SUSTAINED USE OF CERTAIN LOANS SUCH AS CAPPING THE NUMBER OF ROLLOVERS
– RESTRICTIONS ON COLLECTION PRACTICES
• TRADITIONAL PAWN LOANS ARE EXCLUDED FROM THE SCOPE OF THE NEW CFPB RULES

FINANCIAL HIGHLIGHTS
PUEBLA, MEXICO
CUAUTLA, MEXICO

ADJUSTED NET INCOME AND ADJUSTED EBITDA
28
($ IN MILLIONS)
Note: Adjusted Net Income and Adjusted Net EBITDA are non-GAAP numbers. See appendix for reconciliation to Net Income.
$68$85
$131$140$132
$180
$273 $273
$0
$40
$80
$120
$160
$200
$240
$280
2015 2016 2017 TTMQ1-2018
Adjusted Net Income Adjusted EBITDA

OPERATING CASH FLOW AND ADJUSTED FREE CASH FLOW
29
($ IN MILLIONS)
Note: Adjusted Free Cash Flow is a non-GAAP number. See appendix for reconciliation to Adjusted Free Cash Flow from Operating Activities.
$93 $97
$220
$248
$68 $68
$231$246
$0
$50
$100
$150
$200
$250
2015 2016 2017 TTMQ1-2018
Operating Activities Cash Flow Adjusted Free Cash Flow
FCF YIELD1 7%TTM 3/31/2018
1 FCF Yield is calculated as TTM Adjusted Free Cash Flow / Market Cap.

30
ADJUSTED EARNINGS PER SHARE
1 Adjusted earnings measures may exclude the impact of the Tax Act, merger and acquisition related expenses and the loss on extinguishment of debt from the senior notes refinancing, which are further described in the detailed reconciliations of adjusted earnings provided elsewhere in this presentation2 Given the difficulty in predicting the amount and timing of future ongoing Merger expenses, the Company cannot reasonably provide a full reconciliation ofadjusted guidance to GAAP guidance
$2.42 $2.44
$2.74
$0.00
$0.50
$1.00
$1.50
$2.00
$2.50
$3.00
$3.50
$4.00
2015 2016 2017 2018Guidance
Adjusted Net Income Per Share 2018 Guidance
GUIDANCE RANGE2:$3.35 - $3.55
1
GUIDANCE AS PROVIDED ON APRIL 26, 2018
FIRSTCASH FISCAL 2018 OUTLOOK
31
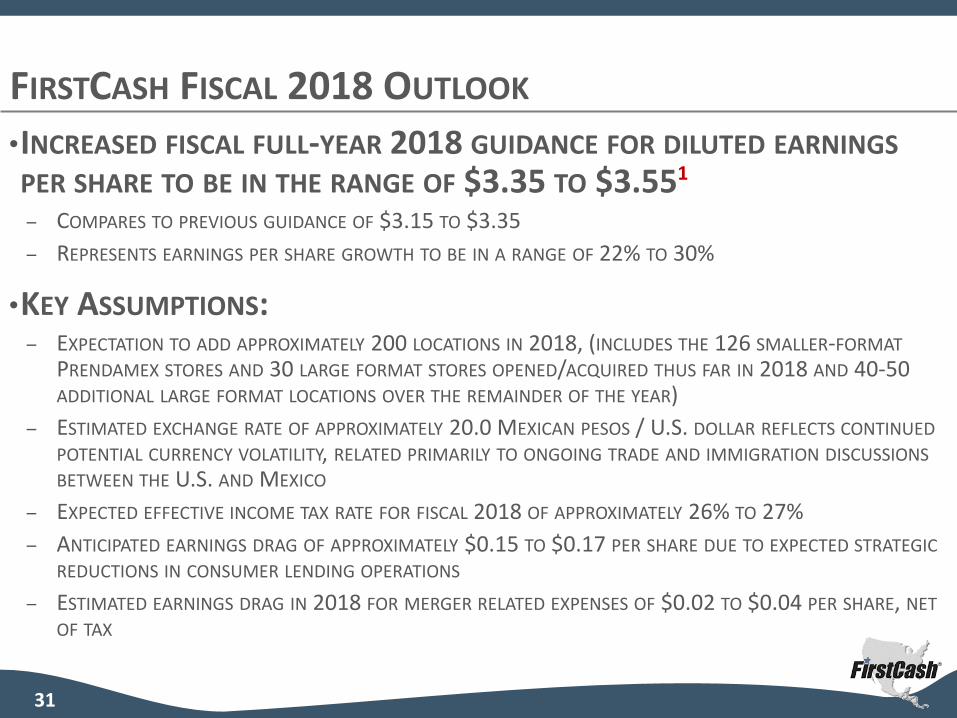
•INCREASED FISCAL FULL-YEAR 2018 GUIDANCE FOR DILUTED EARNINGS
PER SHARE TO BE IN THE RANGE OF $3.35 TO $3.551
– COMPARES TO PREVIOUS GUIDANCE OF $3.15 TO $3.35
– REPRESENTS EARNINGS PER SHARE GROWTH TO BE IN A RANGE OF 22% TO 30%
•KEY ASSUMPTIONS:– EXPECTATION TO ADD APPROXIMATELY 200 LOCATIONS IN 2018, (INCLUDES THE 126 SMALLER-FORMAT
PRENDAMEX STORES AND 30 LARGE FORMAT STORES OPENED/ACQUIRED THUS FAR IN 2018 AND 40-50 ADDITIONAL LARGE FORMAT LOCATIONS OVER THE REMAINDER OF THE YEAR)
– ESTIMATED EXCHANGE RATE OF APPROXIMATELY 20.0 MEXICAN PESOS / U.S. DOLLAR REFLECTS CONTINUED
POTENTIAL CURRENCY VOLATILITY, RELATED PRIMARILY TO ONGOING TRADE AND IMMIGRATION DISCUSSIONS
BETWEEN THE U.S. AND MEXICO
– EXPECTED EFFECTIVE INCOME TAX RATE FOR FISCAL 2018 OF APPROXIMATELY 26% TO 27%
– ANTICIPATED EARNINGS DRAG OF APPROXIMATELY $0.15 TO $0.17 PER SHARE DUE TO EXPECTED STRATEGIC
REDUCTIONS IN CONSUMER LENDING OPERATIONS
– ESTIMATED EARNINGS DRAG IN 2018 FOR MERGER RELATED EXPENSES OF $0.02 TO $0.04 PER SHARE, NET
OF TAX
32
($ IN MILLIONS)
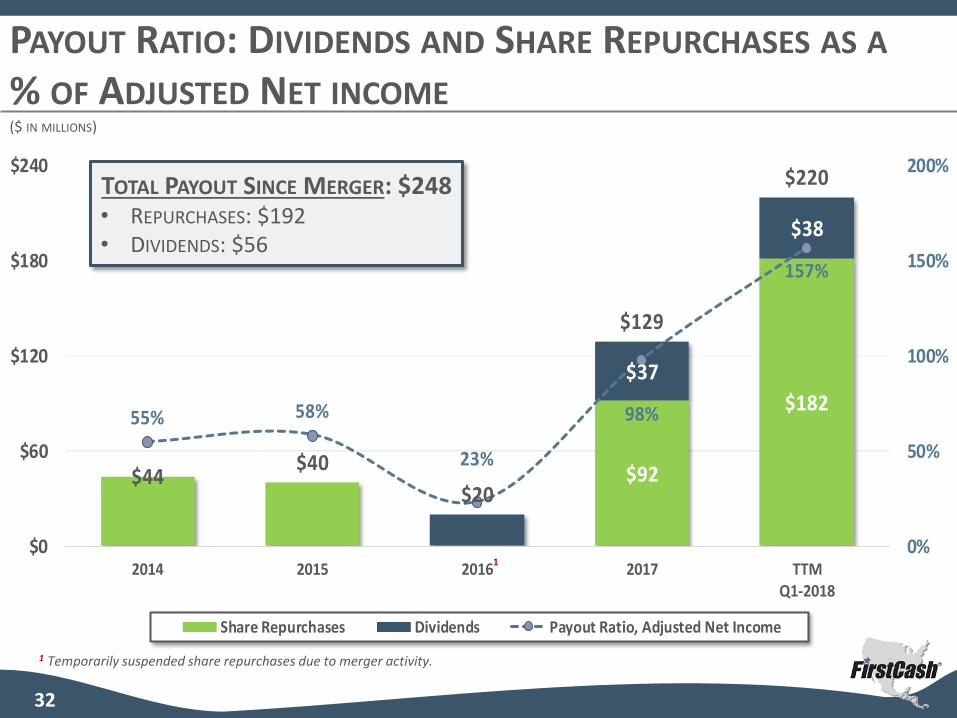
PAYOUT RATIO: DIVIDENDS AND SHARE REPURCHASES AS A
% OF ADJUSTED NET INCOME
$92
$182
$37
$38
$44$40
$20
$129
$220
55% 58%
23%
98%
157%
0%
50%
100%
150%
200%
$0
$60
$120
$180
$240
2014 2015 2016 2017 TTMQ1-2018
Share Repurchases Dividends Payout Ratio, Adjusted Net Income
TOTAL PAYOUT SINCE MERGER: $248• REPURCHASES: $192• DIVIDENDS: $56
1 Temporarily suspended share repurchases due to merger activity.
1

$0.125 $0.19 $0.22
$0.125
$0.19 $0.22 $0.125
$0.19
$0.22
$0.19
$0.20
$0.22
$0.57
$0.77
$0.88
$0.00
$0.20
$0.40
$0.60
$0.80
$1.00
2016 2017 2018Projected
Qtr. 1 Qtr. 2 Qtr. 3 Qtr. 4
33
DIVIDENDS PER SHARE CONTINUE TO GROW
2018 GUIDANCE:
★ IDENTIFIES SEQUENTIAL QUARTER-OVER-QUARTER DIVIDEND INCREASE
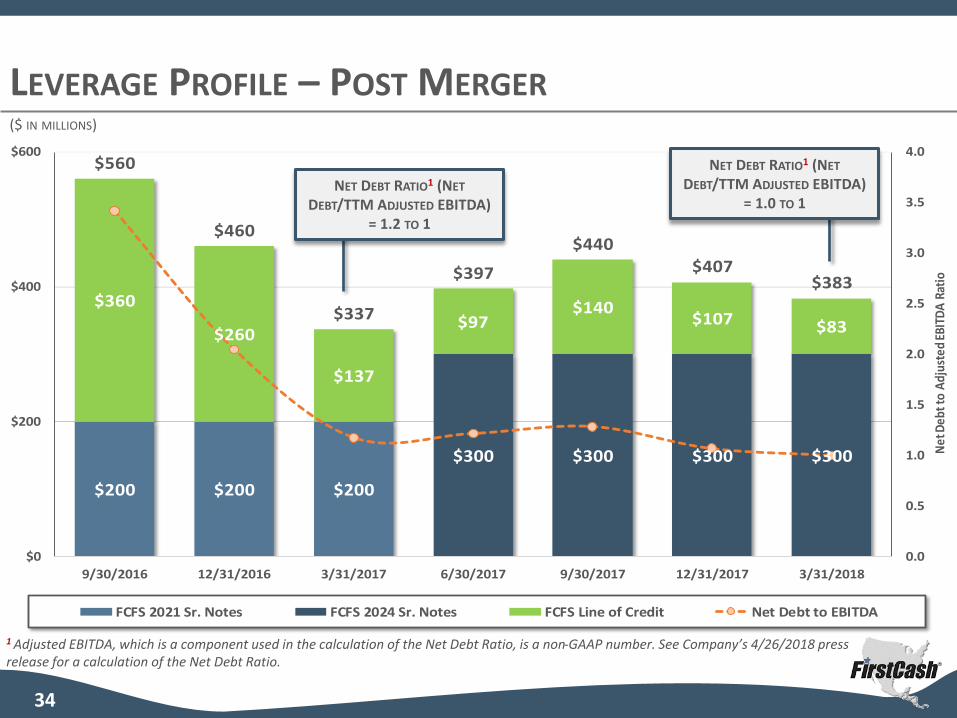
$200 $200 $200
$300 $300 $300 $300
$360
$260
$137
$97$140
$107 $83
$560
$460
$337
$397
$440$407
$383
0.0
0.5
1.0
1.5
2.0
2.5
3.0
3.5
4.0
$0
$200
$400
$600
9/30/2016 12/31/2016 3/31/2017 6/30/2017 9/30/2017 12/31/2017 3/31/2018
Net
Deb
t to
Adj
uste
d EB
ITD
A R
atio
FCFS 2021 Sr. Notes FCFS 2024 Sr. Notes FCFS Line of Credit Net Debt to EBITDA
LEVERAGE PROFILE – POST MERGER($ IN MILLIONS)
34
1 Adjusted EBITDA, which is a component used in the calculation of the Net Debt Ratio, is a non-GAAP number. See Company’s 4/26/2018 press release for a calculation of the Net Debt Ratio.
NET DEBT RATIO1 (NET
DEBT/TTM ADJUSTED EBITDA) = 1.0 TO 1
NET DEBT RATIO1 (NET
DEBT/TTM ADJUSTED EBITDA) = 1.2 TO 1

$0
$100
$200
$300
$400
$500
$600
$700
$800
$900
$1,000
$1,100
$1,200
$1,300
2004 2005 2006 2007 2008 2009 2010 2011 2012 2013 2014 2015 2016 2017 Q1-2018
Stock Repurchases & Dividends Acquisitions Capital Expenditures Net Debt
Cumulative Total
$ Millions
$597
$315
$428
Stock Repurchases & Dividends:
- 15,045,949 split-adjusted shares repurchased- $67 million in cumulative dividends paid
Acquisitions Since 2004:- 164 stores acquired in U.S.- 442 stores acquired in Latin America- 815 stores acquired in Cash America Merger
Capital Expenditures Since 2004:
- Includes 785 De Novo store openings
$273
OVER $1.3 BILLION IN CUMULATIVE INVESTMENTS &SHAREHOLDER PAYOUTS
35

36
• PAWN-FOCUSED BUSINESS MODEL
⦁ FOCUSED ON SMALL SECURED LOANS TO UNDERBANKED CONSUMERS WITH LIMITED
ACCESS TO TRADITIONAL CREDIT PRODUCTS
⦁ FOCUS ON FULL-SERVICE LENDING & RETAIL MODEL IS A SIGNIFICANT COMPETITIVE
ADVANTAGE
⦁ STRONG MARGINS & CASH FLOWS ALLOW FOR STORE GROWTH AND DIVIDEND & SHARE
BUYBACKS
• PROVEN MULTI-COUNTRY GROWTH STRATEGY
⦁ LONG RUNWAY FOR GROWTH IN LATIN AMERICA WHERE CUSTOMER DEMOGRAPHICS
ARE FAVORABLE AND COMPETITION IS LIMITED
• STRONG BALANCE SHEET TO FUND FUTURE GROWTH, ACQUISITIONS, SHARE BUYBACKS AND PAY DIVIDENDS
INVESTMENT RECAP

APPENDIX
KANSAS CITY, MISSOURI
SANTA TECLA, EL SALVADOR
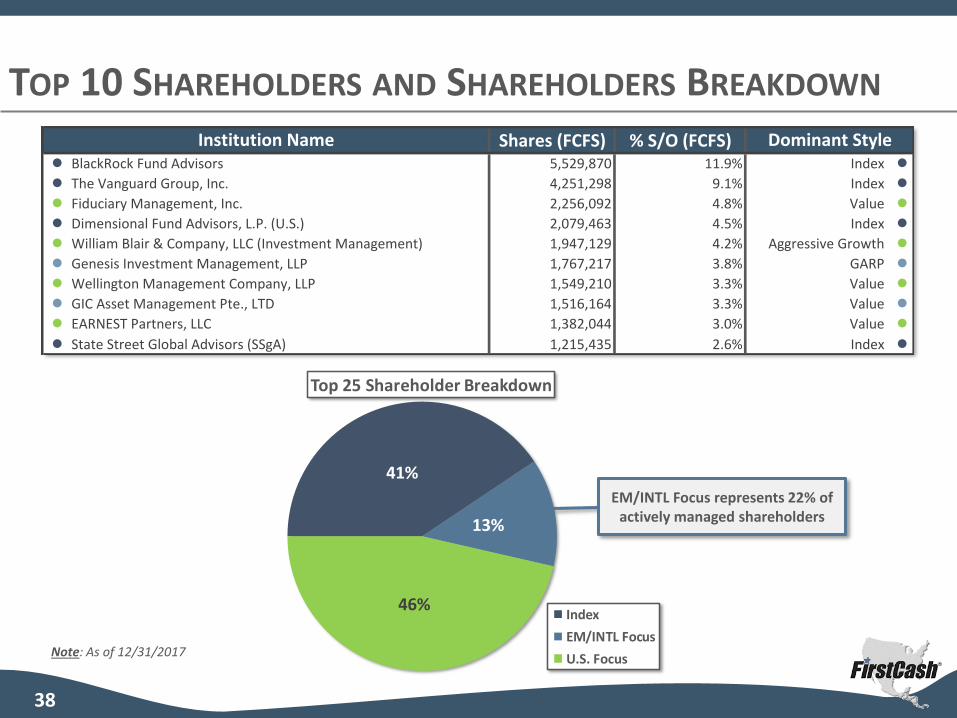
Shares (FCFS) % S/O (FCFS)l BlackRock Fund Advisors 5,529,870 11.9% Index l
l The Vanguard Group, Inc. 4,251,298 9.1% Index l
l Fiduciary Management, Inc. 2,256,092 4.8% Value l
l Dimensional Fund Advisors, L.P. (U.S.) 2,079,463 4.5% Index l
l William Blair & Company, LLC (Investment Management) 1,947,129 4.2% Aggressive Growth l
l Genesis Investment Management, LLP 1,767,217 3.8% GARP l
l Wellington Management Company, LLP 1,549,210 3.3% Value l
l GIC Asset Management Pte., LTD 1,516,164 3.3% Value l
l EARNEST Partners, LLC 1,382,044 3.0% Value l
l State Street Global Advisors (SSgA) 1,215,435 2.6% Index l
Institution Name Dominant Style
41%
13%
46%
Top 25 Shareholder Breakdown
Index
EM/INTL Focus
U.S. Focus
TOP 10 SHAREHOLDERS AND SHAREHOLDERS BREAKDOWN
38
EM/INTL Focus represents 22% of actively managed shareholders
Note: As of 12/31/2017

NON-GAAP FINANCIAL INFORMATION
39
The Company uses certain financial calculations such as adjusted net income, adjusted net income per share, EBITDA, adjusted EBITDA,
free cash flow, adjusted free cash flow and constant currency results (as defined or explained below) as factors in the measurement and
evaluation of the Company’s operating performance and period-over-period growth. The Company derives these financial calculations on
the basis of methodologies other than generally accepted accounting principles (“GAAP”), primarily by excluding from a comparable GAAP
measure certain items the Company does not consider to be representative of its actual operating performance. These financial
calculations are “non-GAAP financial measures” as defined in SEC rules. The Company uses these non-GAAP financial measures in
operating its business because management believes they are less susceptible to variances in actual operating performance that can result
from the excluded items, other infrequent charges and currency fluctuations. The Company presents these financial measures to investors
because management believes they are useful to investors in evaluating the primary factors that drive the Company’s operating
performance and because management believes they provide greater transparency into the Company’s results of operations. However,
items that are excluded and other adjustments and assumptions that are made in calculating adjusted net income, adjusted net income
per share, EBITDA, adjusted EBITDA, free cash flow, adjusted free cash flow and constant currency results are significant components in
understanding and assessing the Company’s financial performance. These non-GAAP financial measures should be evaluated in
conjunction with, and are not a substitute for, the Company’s GAAP financial measures. Further, because these non-GAAP financial
measures are not determined in accordance with GAAP and are thus susceptible to varying calculations, adjusted net income, adjusted net
income per share, EBITDA, adjusted EBITDA, free cash flow, adjusted free cash flow and constant currency results, as presented, may not
be comparable to other similarly titled measures of other companies.
The Company has adjusted the applicable financial measures to exclude, among other expenses and benefits, Merger related expense
because it generally would not incur such costs and expenses as part of its continuing operations. The Merger related expenses are
predominantly incremental costs directly associated with the Merger and integration of Cash America, including professional fees, legal
expenses, severance and retention payments, accelerated vesting of certain equity compensation awards, contract breakage costs and
costs related to consolidation of technology systems and corporate facilities.

RECONCILIATION OF NET INCOME TO ADJUSTED NET INCOME
40
YEAR ENDED DECEMBER 31, TTM ENDED MARCH 31,
2015 2016 2017 2018
IN THOUSANDS PER SHARE IN THOUSANDS PER SHARE IN THOUSANDS PER SHARE IN THOUSANDS PER SHARE
NET INCOME $60,710 $2.14 $60,127 $1.72 $143,892 $3.00 $152,882 $3.22
ADJUSTMENTS, NET OF TAX:
MERGER AND OTHER ACQUISITION EXPENSES:
TRANSACTION - - 14,399 0.41 - - - -
SEVERANCE AND RETENTION - - 9,594 0.27 2,456 0.05 2,144 0.04
OTHER 1,989 0.07 2,030 0.06 3,254 0.07 3,342 0.07
TOTAL MERGER AND OTHER ACQUISITIONEXPENSES
1,989 0.07 26,023 0.74 5,710 0.12 5,486 0.11
NET TAX BENEFIT FROM TAX ACT - - - - (27,269) (0.57) (27,269) (0.57)
LOSS ON EXTINGUISHMENT OF DEBT - - - - 8,892 0.19 8,892 0.19
NET GAIN ON SALE OF COMMON STOCK OF
ENOVA- - (818) (0.02) - - - -
RESTRUCTURING EXPENSES RELATED TO U.S. CONSUMER LOAN OPERATIONS
5,784 0.21 - - - - - -
ADJUSTED NET INCOME $68,483 $2.42 $85,332 $2.44 $131,225 $2.74 $139,991 $2.95
($ IN THOUSANDS, EXCEPT PER SHARE AMOUNTS)

RECONCILIATION OF NET INCOME TO EBITDA AND ADJUSTED EBITDA
41
YEAR ENDED DECEMBER 31, TTM ENDED MARCH31,
20151 2016 2017 2018
NET INCOME $60,710 $60,127 $143,892 $152,882INCOME TAXES 26,971 33,320 28,420 22,967
DEPRECIATION AND AMORTIZATION 17,446 31,865 55,233 52,273
INTEREST EXPENSE 16,887 20,320 24,035 24,120INTEREST INCOME (1,566) (751) (1,597) (2,251)EBITDA 120,448 144,881 249,983 249,991ADJUSTMENTS:
MERGER AND OTHER ACQUISITIONEXPENSES
2,875 36,670 9,062 8,654
LOSS ON EXTINGUISHMENT OF DEBT - - 14,114 14,114
RESTRUCTURING EXPENSES RELATED TO U.S. CONSUMER LOAN OPS
8,878 - - -
NET GAIN ON SALE OF COMMON STOCK OFENOVA
- (1,299) - -
ADJUSTED EBITDA $132,201 $180,252 $273,159 $272,759
1 For fiscal year 2015, excludes $493 of depreciation and amortization, which is included in the restructuring expenses relatedto U.S. consumer loan operations
($ IN THOUSANDS)

RECONCILIATION OF CASH FLOW FROM OPERATING ACTIVITIES TO
FREE CASH FLOW & ADJUSTED FREE CASH FLOW
42
YEAR ENDED DECEMBER 31, TTM ENDED MARCH31,
2015 2016 2017 2018
CASH FLOW FROM OPERATINGACTIVITIES
$92,749 $96,854 $220,357 $247,808
CASH FLOW FROM INVESTINGACTIVITIES:
LOAN RECEIVABLES, NET OF CASHREPAYMENTS
(3,716) (16,072) 40,735 29,766
PURCHASES OF PROPERTY ANDEQUIPMENT
(21,073) (33,863) (37,135) (37,896)
FREE CASH FLOW 67,960 46,919 223,957 239,678
MERGER RELATED EXPENSES PAID, NET OF TAX
- 20,939 6,659 6,425
ADJUSTED FREE CASH FLOW $67,960 $67,858 $230,616 $246,103
($ IN THOUSANDS)

INVESTOR CONTACT INFORMATION
43
INVESTOR RELATIONS GAR JACKSON
[email protected] GLOBAL IR GROUP
IR.FIRSTCASH.COM [email protected]
(817) 258-2650 (817) 886-6998