c r v f r y e june 2013 - rockbridge county, virginia
TRANSCRIPT

1
COUNTY OF ROCKBRIDGE, VIRGINIA
FINANCIAL REPORT
YEAR ENDED JUNE 30, 2013

COUNTY OF ROCKBRIDGE, VIRGINIA
FINANCIAL REPORT
YEAR ENDED JUNE 30, 2013


Table of Contents
Organizational Chart ........................................................................................................... .
List of Officials . . .. . . . ... . . . . . . . . . . . . . . . . . . . . . . . . . . . . . . . . . . . . . . . . . . . . . . . . . . .. . . . . . . . . . . . . . . . . . . . . . . . . . . . . . . . . . . . . . . . . . . . . . . . . . . . . . . . . ii
Independent Auditors' Report ...... ..... ....... ..... ... ........................... .... ........... ........ .................. 1-3
Management's Discussion and Analysis.............................................................................. 4-12
Exhibit Page Basic Financial Statements: Government-wide Financial Statements:
Statement of Net Position ............................................................................................ 1 13-14
Statement of Activities ................................................................................................. 2 15-16
Fund Financial Statements:
Balance Sheet-Governmental Funds .......................................................................... 3
Reconciliation of the Balance Sheet of Governmental Funds to the Statement of Net Position ..................................................................................... 4
Statement of Revenues, Expenditures, and Changes in Fund Balances Balances-Governmental Funds ......................................................................... 5
Reconciliation of Statement of Revenues, Expenditures, and Changes in Fund Balances of Governmental Funds to the Statement of Activities ......................... 6
Statement of Net Position-Proprietary Funds ............................................................ 7
Statement of Revenues, Expenses, and Changes in Net Position-Proprietary Funds .................................................................................................................... 8
Statement of Cash Flows-Proprietary Funds ............................................................ 9
Statement of Fiduciary Net Position-Fiduciary Funds ............................................. 10
Notes to Financial Statements ...................................................................................... .
Required Supplementary Information:
Schedule of Revenues, Expenditures, and Changes in Fund BalancesBudget and Actual:
General Fund ............................................................................................... 11
Schedule of Pension Funding Progress .................................................................... 12
Schedule of OPES Funding Progress ....................................................................... 13
17
18
19
20
21
22
23
24
25-71
72
73-74
75

Table of Contents (Continued)
Other Supplementary Information:
Schedule of Revenues, Expenditures, and Changes in Fund BalancesBudget and Actual:
Exhibit
School Capital Projects Fund .................................................................................... 14
Courthouse Construction Fund .................................................................................. 15
Combining Statement of Fiduciary Net Position-Fiduciary Funds .................................. 16
Combining Statement of Changes in Assets and Liabilities -Agency Funds .................. 17
Discretely Presented Component Unit-School Board: Combining Balance Sheet ......................................................................................... 18
Combining Statement of Revenues, Expenditures, and Changes in Fund Balances-Governmental Funds ....................................................................... 19
Schedule of Revenues, Expenditures, and Changes in Fund Balances-Budget and Actual ............................................................................ 20
Statement of Fiduciary Net Position- Fiduciary Fund .............................................. 21
Statement of Changes in Fiduciary Net Position ....................................................... 22
Schedule Supporting Schedules:
Schedule of Revenues-Budget and Actual-Governmental Funds ............................. 1
Schedule of Expenditures-Budget and Actual-Governmental Funds ......................... 2
Other Statistical Information:
Net Position by Component. ............................................................................................. 1
Changes in Net Position ................................................................................................... 2
Fund Balances of Governmental Funds .......................................................................... 3
Changes in Fund Balances of Governmental Funds ....................................................... 4
Assessed Value and Estimated Actual Value of Taxable Property ................................. 5
Property Tax Rates(-) Direct and Overlapping Governments ......................................... 6
Property Tax Levies and Collections ................................................................................ 7
Principal Property Taxpayers ........................................................................................... 8
Ratio of Net General Bonded Debt to Assessed Value and Net Bonded Dept Per Capita ........................................................................................................................... 9
76
77
78
79
80
81
82-83
84
85
86-90
91-94
95-96
97-100
101-102
103-104
105-106
107
108
109
110

Table of Contents (Continued)
Other Statistical Information: (Continued)
Demographic and Economic Statistics ........................................................................... 10
Principal Employers ........................................................................................................ 11
Full-time Equivalent County Government Employees by Function ................................ 12
Operating Indicators by Function ................................................................................... 13
Capital Asset Statistics by Function ............................................................................... 14
Schedule of the City of Lexington's and Buena Vista's Share of Certain General Government Expenditures ......................................................................................... 15
Compliance:
Independent Auditors' Report on Internal Control over Financial Reporting and on Compliance and Other Matters Based on an Audit of Financial Statements Performed in Accordance with Government Auditing Standards ................................. .
Independent Auditors' Report on Compliance For Each Major Program and on Internal Control over Compliance Required by OMB Circular A-133 ........................................ .
Schedule of Expenditures of Federal Awards ..................................................................... .
Schedule of Findings and Questioned Costs ...................................................................... .
111
112
113-114
115-116
117-118
119-120
121-122
123-124
125-126
127


RockbridgeCountyOrganizationalChart
June30,2013
Citizen
s
Board of
Supe
rviso
rs
Coun
ty
Administrator
Commun
tiy
Developm
ent
Geo
graphic Info
System
Econ
omic
Developm
ent
Planning
and
Zoning
Fiscal Services
Central A
ccou
nting
Payroll
Inform
ation
Techno
logy
Accoun
ts Payable
Building
Erosion Co
ntrol /
Stromwater
Managem
ent
Building
Mainten
ance
Soild
Waste &
Transportatio
n
Solid
Waste
Collections
Land
fill O
peratio
ns
Recycling
Central G
arage
Recreatio
nEm
ergency
Managem
ent/
HazM
at
Coun
ty Attorne
y
Constitutional O
fficers
Clerk of th
e Circuit C
ourt
Commissione
r of R
even
ueCo
mmon
wealth
Attorne
ySheriff
Treasurer
State:Local O
ffices
Circuit C
ourt
Coop
erative Extension
Electoral Board/Registrar
Gen
eral District C
ourt
Health
Dep
artm
ent
Magistrate
Prob
ation Office
Rental Assita
nce
Social Services
Boards and
Com
miss
ions
i

ii
COUNTY OF ROCKBRIDGE, VIRGINIA
BOARD OF SUPERVISORS
Ronnie R., Campbell, Chairman Albert W. Lewis, Jr., Vice-Chairman
Russell L. Ford John M. Higgins
David W. Hinty, Jr.
COUNTY SCHOOL BOARD
Laura C. Hoffnagle, Chairman Ben Swisher, Vice-Chairman
Albert “Jay” Lewis, II David B. McDaniel
Warren Schmid
OTHER OFFICIALS Judge of the Circuit Court ..................................................................................... Michael S. Irvine Clerk of the Circuit Court ....................................................................................... D. Bruce Patterson Judge of the General District Court ........................................................................ Gordon F. Saunders Judge of the Juvenile & Domestic Relations Court ................................................ Anita D. Filson Commonwealth's Attorney .............................................................................. ...... Robert N. “Bucky” Joyce, Jr. Commissioner of the Revenue ............................................................................... David C. Whitesell Treasurer ............................................................................................................... Betty S. Trovato Sheriff ..................................................................................................................... Christopher J. Blalock Superintendent of Schools ..................................................................................... John T. Reynolds Clerk of the School Board ...................................................................................... Rhonda Humphries County Administrator ............................................................................................. Spencer H. Suter Director of Fiscal Services ..................................................................................... Steven J. Bolster County Attorney ..................................................................................................... Vickie L. Huffman

ROBINSON~ FARMER~ COX ASSOCIATES CERTIFIED PUBLIC ACCOUNTANTS A PROH:"'SSJONAL Ll!vflTED LTABJLTTY COMPANY
INDEPENDENT AUDITORS' REPORT
TO THE HONORABLE MEMBERS OF THE BOARD OF SUPERVISORS COUNTY OF ROCKBRIDGE, VIRGINIA
Report on the Financial Statements
We have audited the accompanying financial statements of the governmental activities, the business-type activities, the discretely presented component units, each major fund and the aggregate remaining fund information of the County of Rockbridge, Virginia, as of and for the year ended June 30, 2013, and the related notes to the financial statements, which collectively comprise the County's basic financial statements as listed in the table of contents.
Management's Responsibility for the Financial Statements
Management is responsible for the preparation and fair presentation of these financial statements in accordance with accounting principles generally accepted in the United States of America; this includes the design, implementation, and maintenance of internal control relevant to the preparation and fair presentation of financial statements that are free from material misstatement, whether due to fraud or error.
Auditors' Responsibility
Our responsibility is to express opinions on these financial statements based on our audit. We conducted our audit in accordance with auditing standards generally accepted in the United States of America; the standards applicable to financial audits contained in Government Auditing Standards, issued by the Comptroller General of the United States; and the Specifications for Audits of Counties, Cities, and Towns, issued by the Auditor of Public Accounts of the Commonwealth of Virginia. Those standards require that we plan and perform the audit to obtain reasonable assurance about whether the financial statements are free from material misstatement.
An audit involves performing procedures to obtain audit evidence about the amounts and disclosures in the financial statements. The procedures selected depend on the auditors' judgment, including the assessment of the risks of material misstatement of the financial statements, whether due to fraud or error. In making those risk assessments, the auditor considers internal control relevant to the entity's preparation and fair presentation of the financial statements in order to design audit procedures that are appropriate in the circumstances, but not for the purpose of expressing an opinion on the effectiveness of the entity's internal control. Accordingly, we express no such opinion. An audit also includes evaluating the appropriateness of accounting policies used and the reasonableness of significant accounting estimates made by management, as well as evaluating the overall presentation of the financial statements.
We believe that the audit evidence we have obtained is sufficient and appropriate to provide a basis for our audit opinion.
1

Opinions
In our opinion, the financial statements referred to above present fairly, in all material respects, the respective financial position of the governmental activities, the business-type activities, the discretely presented component unit, each major fund and the aggregate remaining fund information of the county of Rockbridge, Virginia, as of June 30, 2013, and the respective changes in financial position, and, where applicable cash flows thereof for the year then ended in accordance with accounting principles generally accepted in the United States of America.
Emphasis of Matter
As described in Note 1 to the financial statements, in 2013, the County adopted new accounting guidance, GASB Statement Nos. 63, Financial Reporting of Deferred Outflows of Resources, Deferred Inflows of Resources, and Net Position and 65, Items Previously Reported as Assets and Liabilities. Our opinion is not modified with respect to this matter.
Other Matters
Required Supplementary Information
Accounting principles generally accepted in the United States of America require that the management's discussion and analysis on pages 4-12, budgetary comparison information, and schedules of pension and OPEB funding progress be presented to supplement the basic financial statements. Such information, although not a part of the basic financial statements, is required by the Governmental Accounting Standards Board, who considers it to be an essential part offinancial reporting for placing the basic financial statements in an appropriate operational, economic, or historical context. We have applied certain limited procedures to the required supplementary information in accordance with auditing standards generally accepted in the United States of America, which consisted of inquiries of management about the methods of preparing the information and comparing the information for consistency with management's responses to our inquiries, the basic financial statements, and other knowledge we obtained during our audit of the basic financial statements. We do not express an opinion or provide any assurance on the information because the limited procedures do not provide us with sufficient evidence to express an opinion or provide any assurance. The budgetary comparison information has been subjected to the auditing procedures applied in the audit of the basic financial statements and, in our opinion, is fairly stated in all material respects in relation to the basic financial statements taken as a whole.
Other Information
Our audit was conducted for the purpose of forming opinions on the financial statements that collectively comprise the County of Rockbridge, Virginia's basic financial statements. The introductory section, other supplementary information and supporting schedules, and other statistical information, are presented for purposes of additional analysis and are not a required part of the basic financial statements. The schedule of expenditures of federal awards is presented for purposes of additional analysis as required by U.S. Office of Management and Budget Circular A-133, Audits of States, Local Governments, and Non-Profit Organizations, and is also not a required part of the financial statements. The other supplementary information and supporting schedules and the schedule of expenditures of federal awards are the responsibility of management and were derived from and relate directly to the underlying accounting and other records used to prepare the basic financial statements. Such information has been subjected to the auditing procedures applied in the audit of the basic financial statements and certain additional procedures, including comparing and reconciling such information directly to the underlying accounting and other records used to prepare the financial statements or to the basic financial statements themselves, and other additional procedures in accordance with auditing standards generally accepted in the United States of America. In our opinion, other supplementary information and supporting schedules and the schedule of expenditures of federal awards are fairly stated in all material respects in relation to the basic financial statements as a whole.
2

The introductory section and other statistical information have not been subjected to the auditing procedures applied in the audit of the basic financial statements and, accordingly, we do not express an opinion or provide any assurance on them.
Other Reporting Required by Government Auditing Standards
In accordance with Government Auditing Standards, we have also issued our report dated December 6, 2013, on our consideration of the County of Rockbridge, Virginia's internal control over financial reporting and on our tests of its compliance with certain provisions of laws, regulations, contracts, and grant agreements and other matters. The purpose of that report is to describe the scope of our testing of internal control over financial reporting and compliance and the results of that testing, and not to provide an opinion on internal control over financial reporting or on compliance. That report is an integral part of an audit performed in accordance with Government Auditing Standards in considering County of Rockbridge, Virginia's internal control over financial reporting and compliance.
Staunton, Virginia December 6, 2013
3

THIS PAGE LEFT BLANK INTENTIONALLY

Management's Discussion and Analysis
As management of the County of Rockbridge, Virginia, we offer the readers of the County's financial statements this narrative. The narrative provides an overview and analysis of our financial activities for the fiscal year ending June 30, 2013.
Financial Highlights
The assets of the County of Rockbridge, Virginia exceeded its liabilities by $41 ,019,576 (net position) at the close of the most recent fiscal year. Of the total net position, $37,695,712 is associated with governmental activities and $3,323,864 is associated with business-type activities. Of the net governmental activities net position, $21,297,930 may be used to meet the government's ongoing obligations to creditors and citizens. Included in restricted net position is $71 ,412, which meets the debtservice reserve requirement for a $15,000,000 revenue bond issued January 5, 2006. There is an additional $8,285,095 in fund balance which is restricted/committed/assigned by the County Board of Supervisors to ensure the availability of funds for specific functions, programs, and anticipated specific future liabilities. These restricted accounts are shown on the Balance Sheet of Government Funds. Of the business-type activities net position, $1,073,661 is unrestricted and available to meet the businesstype activity's obligations. For the year ending June 30, 2013, the governmental activities' assets include $9,542,923 in taxes receivable and $7,984,033 in unearned revenues. This is shown as part of compliance with GASB. The $9,542,923 in taxes receivable are booked in the first half of calendar year 2013, but because of twice-a-year tax billing, $7,984,033 is not due until December 2013 and is shown as an unearned revenue. When compared to the net position at year's end June 30, 2012, total net position increased by $5,310,141. This net position increase is associated with: (1) greater revenue from new property tax rates for the first-half in 2013; (2) collecting higher than estimated general property taxes, other local taxes, and charges for services; and (3) sale of equipment.
At the fiscal year end, unassigned fund balance for the general fund was $17,219,353 or 46.14% of total general fund expenditures. This is a 2.21% increase in fund balance to expenditure ratio compared to year ending June 30, 2012.
As of the close of the fiscal year June 30, 2013, the County's governmental funds reported a combined ending fund balance of $25,462,928. This is an increase of $601,175 as compared with the previous fiscal year. The increase in fund balance is associated with increased revenues in several areas: (1) general property taxes- $1,486,748, (2) other local revenue sources- $267,791, (3) the Commonwealth - $113,377, and (4) the federal government- $2,138,060. The remaining fund balance of $16,989,750, or 66.7%, is available for spending at the government's discretion.
Overview of the Financial Statements
This discussion and analysis is intended to serve as an introduction to the County's basic financial statements. These statements include three components: 1) government-wide financial statements, 2) fund financial statements, and 3) notes to the financial statements. This report also contains other supplementary information in addition to the basic financial statements themselves.
Local government accounting and financial reporting originally focused on funds that were designed to enhance and demonstrate fiscal accountability. Now and in accordance with GASB 34, fund statements are accompanied by government-wide financial statements, to ensure objectives of operational accountability will also be met. These objectives will provide financial statement users with confirmation from the government that public monies have been used to comply with public decisions, and to confirm that operating objectives were met efficiently and effectively and can be met in the future.
Government-wide Financial Statements
Government-wide financial statements provide users with a general overview of County finances. The statements include all assets and liabilities using the accrual basis of accounting. All current year revenue and expenses are taken into account regardless of when cash is received or paid. Both the financial overview and accrual accounting factors are used in the reporting of a private-sector business.
4

Two financial statements are used to present this information: 1) the statement of net position and 2) the statement of activities.
The statement of net position presents all of the County's permanent accounts, or assets, liabilities and net position. The difference between assets and liabilities is reported as net position. Increases or decreases in net position may serve as a useful indicator of whether the financial position of the County is improving or deteriorating. Other non-financial factors such as changes in restricted accounts will also need to be considered to determine the overall financial position of the County.
The statement of activities presents information showing how the government's net position changed during the fiscal year. The statement is focused on the gross and net cost of various government functions that are supported by general tax and other revenue. The statement of activities presents expenses before revenues, emphasizing that in government, revenues are generated for the express purpose of providing services rather than as an end in themselves.
Both government-wide financial statements separate governmental activities and business-type activities of the County. Governmental activities are principally supported by taxes and intergovernmental revenues. They include general government administration; judicial administration; public safety; public works; health and welfare; parks, recreation and cultural; community development; and transfers to other funds. The County also created the Broadband Technology Opportunities Program fund to account for the activities of the federal American Recovery and Reinvestment Act Broadband Initiative. Businesstype activities recover all or a significant portion of their costs through user fees and charges. The County currently shows the Rockbridge County Solid Waste Authority as a business-type activity.
The government-wide financial statements include, in addition to the primary government or County, five component units: 1) the Rockbridge County School Board, 2) the Rockbridge Area Social Services Board, 3) the Rockbridge Regional Jail Commission, and 4) the Rockbridge County Public Service Authority. Although the component units are legally separate entities, the County is accountable or financially accountable for them. A primary government is accountable for an organization if the primary government appoints a majority of the organization's governing body. A primary government is financially accountable if, in addition, either the government is able to impose its will on the organization or the organization is capable of imposing specific financial burdens on the primary government. For example, the primary government may approve debt issuances, rate structures, and/or provide significant funding for operations of the component unit.
Fund Financial Statements
The fund financial statements present only major or significant funds. A fund is a group of related accounts used to maintain control over resources that are segregated for specific activities or objectives. Fund accounting is used to ensure and demonstrate compliance with finance-related legal requirements. The County's funds can be divided into three categories: governmental funds, proprietary funds, and fiduciary funds.
Governmental funds
Governmental funds are used to account for essentially the same functions, or services, reported as governmental activities in the government-wide financial statements. Whereas the government-wide financial statements are prepared on the accrual basis of accounting, the governmental fund financial statements are prepared on the modified accrual basis of accounting. The focus of modified accrual reporting is on near-term inflows and outflows of financial resources and the balance of financial resources available at the end of the fiscal year. Since the governmental funds focus is narrower than that of the government-wide financial statements, reconciliation between the two methods is provided at the bottom of the governmental fund balance sheet and the governmental fund statement of revenues, expenditures, and changes in fund balances.
5

Proprietary funds
There are two types of proprietary funds: enterprise funds, which are established to account for the delivery of goods and services to the public and internal service funds that account for the delivery of goods and services to other departments or agencies of the government. Proprietary funds use accrual basis accounting, similar to private sector business.
The Rockbridge County Solid Waste Authority is a blended component unit/business-type activity of the County of Rockbridge. The Authority's financial statements are shown as a proprietary/enterprise fund in the County's fund financial statements. The Authority owns the only permitted landfill site within the County of Rockbridge. The Authority has a separate yearly financial report that provides more financial details.
Fiduciary funds
Fiduciary funds account for assets held by the government as a trustee or agent for another organization or individual. The County is responsible for ensuring that the assets reported in these funds are used for their intended purposes. Fiduciary funds are not reflected in the government-wide financial statement because the funds are not available to support the County's own activities.
Notes to the financial statements
These notes provide additional information that is needed to fully understand the data provided in the government-wide and fund financial statements.
Government-wide Financial Analysis
As noted, net position may serve as a useful indicator of a government's financial position. For the County of Rockbridge, assets exceeded liabilities by $41,019,576 at the end of the fiscal year.
The County's net position is divided into three categories: (1) invested in capital assets, net of related debt, (2) restricted, and (3) unrestricted. A comparative analysis has been provided on the next page:
COUNTY OF ROCKBRIDGE'S NET POSITION June 30, 2013
Governmental Activities Business-type Activities Total 2013 2012 2013 2012 2013 2012
Current and other assets $ 38,846,660 $ 35,952,402 $ 4,000,751 $ 4,144,101 $ 42,847,411 $ 40,096,503 Capital Assets 77,696,252 53,391,352 2,491,604 1,863,589 80,187,856 55,254,941 Total Assets $ 116,542,912 $ 89,343,754 $ 6,492,355 $ 6,007,690 $ 123,035,267 $ 95,351,444
Deferred Outflows of Resources $ 1,121,006 $ - $ - $ - $ 1,121,006 $
Long-term liabilities $ 67,150,597 $ 46,608,372 $ 3,040,223 $ 2,680,034 $ 70,190,820 $ 49,288,406 Other liabilities 4,833,436 10,349,811 128,268 182,685 4,961,704 10,532,496 Total liabilities $ 71,984,033 $ 56,958,183 $ 3,168,491 $ 2,862,719 $ 75,152,524 $ 59,820,902
Deferred Outflows of Resources $ 7,984,173 $ - $ - $ - $ 7,984,173 $
Net Position: Net investment in
capital assets $ 10,937,946 $ 12,943,272 $ 1,397,575 $ 1,086,965 $ 12,335,521 $ 14,030,237 Unrestricted (deficit) 21,297,930 18,507,278 924,040 2,058,006 22,221,970 20,565,284 Restricted 5,459,836 935,021 1,002,249 6,462,085 935,021 Total net position $ 37,695,712 $ 32,385,571 $ 3,323,864 $ 3,144,971 $ 41,019,576 $ 35,530,542
6

For the County, investment in capital assets (i.e., land, buildings, machinery, and equipment), net of related outstanding debt used to acquire those assets is $12,335,521 which represents 54.45% of total net position. The County uses these capital assets to provide services to citizens; therefore, these assets are not available for future spending. Although the County's investment in its capital assets is reported net of related debt, it should be noted that the resources needed to repay this debt must be provided from other sources, since the capital assets themselves cannot be used to liquidate these liabilities. It is of note that a portion of the capital assets is used to encourage economic development and in turn may produce revenue for operations in either fees or sale of property.
The restricted net position represents resources that are subject to external or internal restrictions on how they may be used. The restricted net position for fiscal year 2013 included assets restricted by external sources. For fiscal year 2013, the restricted asset continues to meet the reserve requirements from a county debt discussed earlier in this report.
The unrestricted net position is $22,221,970, which is 54% of total net position that may be used to meet the government's ongoing obligations to citizens and creditors.
At the end of the fiscal year, the County is able to report positive changes in all categories of net position. For the year ending June 30, 2013, the government's total net position increased in value by $5,497,435. The changes in net position shows an increase in unrestricted assets of $1,089,798 and an increase in restricted assets of $7,467,449. This overall increase represents the reserved, additional proceeds from refinancing the original courthouse loan used to pay off the refunded debt. The business-type activities restrict a yearly amount for closure and post closure of the landfill.
During the year ending June 2013, total County liabilities increased by $15,278,572. The majority of this increase is linked to the second bond issued for $20,460,000 to complete the expansion of Maury River Middle School. During fiscal year 2013, $5,098,312 was spent on the Broadband Technology Opportunities Program with a goal to complete the fiber-optic internet project for the citizens and community-anchor institutes of Rockbridge County.
Governmental Activities
Governmental activities accounted for an increase of $6,551,921 in net position for the year ending June 30, 2013. This increase in net position is primarily represented by the surplus revenues related to the approved budget. The total result is better than expected when considering the slow-growth economy we continue to experience. The Board of Supervisors is committed to maintaining net position at a level which ensures the availability of assets to provide required services to maintain a reserve cash balance to fund emergencies, to fund opportunities that provide economic development, or to enhance the quality of life for County citizens.
Revenues increased by $5,366,045 compared to last year. Local revenue increased in conjunction with increased real property tax rates. The County also received an increase in state and federal funding.
For the year, the Boards of Supervisors' expenditure priorities were to maintain support for improvements in education, public safety, and economic development. In addition, the Board approved a 3% cost-ofliving adjustment to employees with a goal of retaining and attracting a quality workforce via competitive compensation. Overall expenses increased by $595,668 over the period. Key elements of the expenditures are as follows:
Increase of $248,588 in public safety outlays were realized during the fiscal year Over the course of the funding year, judicial administration expenses rose $246,399
7

Business-type Activities
The business-type activities/enterprise fund (landfill and recycling) net position increased by $178,893. The fee structure for trash disposal associated with our locality partners remained the same as last fiscal year. Revenues derived from fees for services decreased by $52,253 during the year. Charges for services to the City of Lexington rose by $1,299 while Buena Vista went down $20,750. The increase in net position is primarily associated with the transfer from the general fund to support payment towards the Maury Service Authority wastewater treatment plant and recycling activities. This transfer is up 1% from the prior year.
The County of Rockbridge's changes in net position chart below details these government activities changes.
Revenues:
Program revenues:
Charges for services
Operating grants
Capital grants
General Revenues:
Property taxes
Other taxes
Use of money and property
Other Grants and contributions not restricted to specific programs
Total Revenues
Expenses:
General
General Govt. Admin
Judicial administration
Public safety
Public works
Health and welfare
Education
Parks, recreation, and culture
Community development
Non-departmental
Interest on long-term debt
Total expenses
Increase (decrease) in net
position before transfers
Transfers
Increase (decrease) net position
Net position -beginning, as restated
$
$
$
$
$
Fund balance - ending $
COUNTY OF ROCKBRIDGE'S CHANGES IN NET POSITION
June 30, 2013
Governmental Activities Business-type Activities
2013 2012 2013 2012
1,889,975 $ 2,065,220 $ 1 ,034,968 1,087,221 $
18,461 2,412,618 2,257,672 26,161
5,816,685 1,993,245
22,519,602
8,157,801
78,229
743,278
20,241,098
7,890,010
74,448
1,710,031
4,676
3,815
4,000
68
Total
2013 2012
2,924,943 $ 3,152,441
2,438,779 2,276,133
5,816,685 1,993,245
22,519,602
8,157,801
82,905
747,093
20,241,098
7,890,010
78,448
1,710,099
2,741,009 2,761,428 2,741,009 2,761,428
44,359,197 $ 38,993,152 $ 1,069,620 $ 1,109,750 $ 45,428,817 $ 40,102,902
2,011,030 $
1,267,789
5,700,091
3,052,847
1,414,009
16,126,417
1,442,669
2,246,495
1,718,759
2,335,818 $ - $ - $
1,021,390
5,406,165
2,949,751 2,117,295 1,984,753
1,505,526
16,631,591
1,299,526
2,369,189
1,730,059
2,011,030 $
1,267,789
5,700,091
5, 170,142
1,414,009
16,126,417
1,442,669
2,246,495
1,718,759
2,335,818
1,021,390
5,406,165
4,934,504
1,505,526
16,631,591
1,299,526
2,369,189
1,730,059
2,833,978 1,969,401 2,833,978 1,969,401
37,814,084 $ 37,218,416 $ 2,117,295 $ 1,984,753 $ 39,931,379 $ 39,203,169
6,545,113
(1 ,234,972)
1,774,736 $ (1,047,675) $ (875,003) $
(1,111,015) 1,234,972 1,111,015
5,497,438 $ 899,733
5,310,141 663,721 187,297 236,012 5,497,438 899,733
32,385,571 31 ,721 ,850 3,136,567 2,900,555 35,522,138 34,622,405
37,695,712 $ 32,385,571 $ 3,323,864 $ 3,136,567 $ 41,019,576 $ 35,522,138
Financial Analysis of the Government's Funds
As previously mentioned, the County uses fund accounting to ensure and demonstrate compliance with finance-related legal requirements.
8

Governmental funds
The focus of the County's governmental funds is to provide information on near-term inflows, outflows, and balances of financial resources. Such information is useful in assessing the County's financing requirements. Unassigned fund balance may serve as a useful measure of a government's net resources available for spending at the end of the fiscal year.
At the end of the fiscal year, the County's governmental funds reported combined ending fund balances of $25,462,928, an increase of $601,175 over the prior year. The increase is associated with the increase of local, state, and federal revenues.
The general fund is the chief operating fund of the County. As of June 30, 2013, unassigned fund balance of the general fund was $17,219,353. This is an increase in unassigned fund balance of $1,935,140 as compared with the previous year. The total fund balance of the general fund was $21,053,801. This is an increase over the previous year by $678,417.
As a measure of the general fund's liquidity, it is useful to compare both unassigned fund balance and total fund balance to total fund expenditures. Unassigned fund balance represents 46.14% of total general fund expenditures, which includes transfers to the School Board component unit of $14,147,962. Total fund balance represents 56.42% of total general fund expenditures. The Board of Supervisors goal is to maintain the highest possible ratio of unassigned fund balance to expenditures.
Proprietary funds
The County's proprietary fund statements provide the same type of information found in the governmentwide financial statements, but in more detail.
The Solid Waste Authority owns and the County operates a permitted landfill that must close no later than December 2014. A request for permit extension to June 30, 2017 is currently being considered by the Virginia Department of Environmental Quality (VA DEQ). Part of the fund balance will be used to meet landfill closure requirements of the VA DEQ. The net position associated with financing these requirements are restricted. The remaining fund balance will support landfill operations and equipment purchases as needed. Other factors concerning the finances of this fund were discussed in the County's business-type activities section of this summary. Net position of the landfill fund at the end of the year was $3,133,068.
General Fund Budgetary Highlights
The difference between the original budgeted appropriations and the final, amended-budget appropriations was a $2,332,592 increase. This is 6.60% of the total original budget. The actual expenditures were $614,863 below the final appropriation total. This total is 1.63% below the final budget. The major components of these changes are:
• Total health and welfare expenditures were $134,399 more than its combined final budget • Total law enforcement expended $17,524 more than planned • Total protective services exceeded budget by $12,331
9

Capital Asset and Debt Administration
Capital assets
The County's investment in capital assets for its governmental activities as of June 30, 2013 was $77,696,252 (net of accumulated depreciation). This is an increase of $24,235,500 from the previous year. This investment in capital assets includes land, buildings and system, and machinery and equipment. The total net increase in the County's investment in capital assets for the current fiscal year was 45% for government activities. These increases are associated with construction in progress: Maury River Middle School and the Broadband Technologies Opportunities Program. The remaining change in capital assets is the result of depreciation.
The County's investment in capital assets for its proprietary funds is $2,491,604, an increase of $628,015 from the previous year. This is a result of completing the modification of the former baler facility into a transfer station and the purchase an loader during the fiscal year.
Additional information on the County's capital assets can be found in the notes to the financial statements.
Land
Buildings and systems
Machinery & equipment
Construction in progress
$
Total $
Long-term debt
COUNTY OF ROCKBRIDGE'S CAPITAL ASSETS
Net of Depreciation
Governmental Activities Business-type Activities
2013 2012 2013 2012
2,393,836 $ 2,393,836 $ 540,137 $ 540,137
40,816,541 46,031,586 1,433,559 694,048
779,468 793,888 376,916 97,413
33,706,407 4,241,442 140,992 589,282
77,696,252 ========= $ 53,460,752 $ 2,491,604 $ 1,920,880
Total
2013 2012
$ 2,933,973 $ 2,933,973
42,250,100 46,725,634
1,156,384 891,301
33,847,399 4,830,724
$ 80,187,856 $ 55,381,632
The County's long-term debt includes the Rockbridge County School Board debt and the business-type activities debt. For the year, the total long-term debt increased by $21,490,175. A second (and final) school bond was issued in the amount of $20,460,000 to complete the modification of the Maury River Middle School. The OPES obligation is included in the long-term debt to meet GASB requirements. The obligation increased by $10,000 for Government Activities and remained level for business-type activities for the year. The County also took advantage of low-interest rates available in the market, successfully completing two refinancing efforts during fiscal year 2013. First, we completed a current refunding on a 2002 Literary Loan to reduce total debt service payments resulting in a net present value savings of $200,956. Secondly, the County executed an advanced refunding on the 2006 courthouse loan and garnered an economic gain of $7 42,7 44 which will be realized over 23 years. Additional information on the County's long-term debt can be found in the notes to the financial statements.
10

At the end of fiscal year 2013, the County had the following outstanding debt:
COUNTY OF ROCKBRIDGE'S LONG-TERM OBLIGATIONS
Governmental Activities Business-type Activities Total
2013 2012 2013 2012 2013 2012
General Obligation Bonds $ 46,590,095 $ 24,907,549 $ - $ - $ 46,590,095 $ 24,907,549
Revenue Bonds 18,359,697 19,055,719 776,624 776,624 19,136,321 19,832,343
Literary Loans 1,635,000 2,000,000 1,635,000 2,000,000
Capital Leases 173,515 290,703 317,405 39,940 490,920 330,643
OPEB Obligation 120,000 110,000 2,000 2,000 122,000 112,000
Landfill closure liability 1,916,329 1,884,296 1,916,329 1,884,296
Compensated Absences 272,290 256,511 27,865 17,114 300,155 273,625
Total long-term obligations $ 67' 150,597 $ 46,620,482 $ 3,040,223 $ 2,719,974 $ 70,190,820 $ 49,340,456
Economic Factors and Next Year's Budgets and Rates
• For the fiscal year (FY) ending June 30, 2013, the unemployment rate for the Commonwealth and County were 5.9% and 6.0% respectively. During the progress of this management discussion and analysis report, the October 2013 unemployment rate dropped to 5.4% in the County. Local efforts by the Board of Supervisors to fund a variety of economic development initiatives continue to bear fruit via business inquiries and interest.
• The Board of Supervisors continued its commitment to the School Board in providing the maximum support possible during the slow-growth economic environment. The County student population continues to remain level at approximately 2,500. The strategy to maximize results in school programs resulted in the prior decision to move forward with the expansion of Maury River Middle School. Thereby consolidating all education efforts at the middle school level. The final financing (Virginia Public School Authority) for $21,460,000 was secured in support of this effort. Substantially completed in August 2013, the renovated school now serves all Rockbridge County middle-school students. For the long term, we maintain the expectation of reductions in operating cost.
• The final six months of FY 2013 involved changes to the County's real property tax rate. To meet the funding priorities approved by the Board of Supervisors and to meet the strategic goals of the County, the real property tax rate was increased to $0.67 per $100.00 of assessed valuation. The personal property rate of $4.25 remained at the prior year's level. During the FY 13-14 budget process, the Board of Supervisors also published a 5-year real estate tax increase projection in anticipation of increasing capital, debt service, and operational needs.
• The Rockbridge Area Network Authority was created through a partnership of Rockbridge County, the cities of Lexington and Buena Vista, and Washington & Lee University in 2009 to promote high-speed communication infrastructure for the area localities. The County's match to support construction of the high-speed "big broadband" fiber infrastructure and the initial administration costs for the Authority was $206,016. Using the calculations recommended by the Council of Economic Advisors, the Authority expects to see nearly 110 new jobs created, including 70 direct and indirect plus 36 induced job-years. The project completion date was September 30, 2013.
• The federal government faces a second round of automatic spending cuts (sequestration) in 2014 which includes an additional $20B+ in cuts beyond those established in 2013. In addition, the federal government reached a negotiated, temporary fix to the October 2013 shutdown. The provisional agreement includes funding the federal government through January 15, 2014 and suspending the national debt ceiling until February 7, 2014. While the national economy is expected to grow by 2.6% in 2014, the impacts of federal decisions will continue to impact the County at the local level.
11

• The state budget reduction in Aid to Locality ended after FY 13-14. However, the impact of the Commonwealth's fiscal austerity measures, which began in FY 08-09, will not be offset by modest gains in FY 14-15. Also, there is no change in the state-directed funding of the Line of Duty Act to the local level. It is anticipated that localities will likely continue to see a shift in funding of basic and mandated services down to the local level. Lastly, the General Assembly passed legislation to implement a new Virginia Retirement System Hybrid Plan on January 1, 2104. The plan requires local government agencies to fund Hybrid Plan employees' short and long-term disability coverage.
• We also face our own, local fiscal challenges with financing several current and potential projects. These include a "piggyback" lined landfill, a radio system upgrade, and the potential for constructing of a new regional 911 center, as well as meeting increased challenges involving the provision of Fire and EMS services. Future decisions on these and other funding requests will be guided by mission, vision and values statements that will drive strategic plans and future funding priorities. These statements were adopted by the Board of Supervisors on March 11, 2013.
• The Board of Supervisors fiscal year 14-15 budget priorities include limiting overall expenditures in all areas except education, "safety net" programs, public safety, solid waste management, and economic development. These activities may require increased funding compared to prior years. Additionally, the Board's goals include meeting all mandates, debt services, and legal obligations.
Requests for Information
This financial report is designed to provide readers with a general overview of the County of Rockbridge finances. Questions concerning any of the information provided in this report or requests for additional financial information should be addressed to the County Administration, 150 S. Main Street, Lexington, Virginia 24450.
12

THIS PAGE LEFT BLANK INTENTIONALLY

BASIC FINANCIAL STATEMENTS


GOVERNMENT-WIDE FINANCIAL STATEMENTS

County of Rockbridge, Virginia Statement of Net Position June 30, 2013
ASSETS Cash and cash equivalents Cash in custody of others Receivables (net of allowance for uncollectibles):
Taxes receivable Accounts receivable
Internal balances Due from component units Due from other governmental units Inventories Advances to other entities Prepaid items Restricted assets:
Temporarily restricted: Cash and cash equivalents
Capital assets (net of accumulated depreciation): Land Buildings and improvements Machinery and equipment Utility plant and equipment Construction in progress
Total assets
DEFERRED OUTFLOWS OF RESOURCES Deferred charge on refunding
LIABILITIES Accounts payable Advances from participating entities Retainage payable Accrued interest payable Due to primary government Performance deposits Due to other governments Deposits payable Long-term liabilities:
Due within one year Due in more than one year
Total liabilities
DEFERRED INFLOWS OF RESOURCES Unavailable revenue-property taxes
NET POSITION Net investment in capital assets Restricted for:
Fire funds Rental assistance Capital projects School carryover Debt service
Unrestricted (deficit) Total net position
Governmental Activities
$ 16,049,322
9,542,923 590,234 (62,896)
1,545,248 1,023,392
116,671 1,683,691
24,533
8,333,542
2,393,836 40,816,541
779,468
33,706,407 $ 116,542,912
$ 1 '121 ,006
$ 2,584,224
1 ,055,171 1,063,288
130,753
2,436,123 64,714,474
$ 71,984,033
$ 7,984,173
$ 10,937,946
53,912 15,016
5,319,496
71,412 21,297,930
$ 37,695,712
The notes to the financial statements are an integral part of this statement. 13
Primary Government Business-type
Activities Total
$ 966,341 $ 17,015,663
9,542,923 52,936 643,170 62,896
1,545,248 1,023,392
116,671 1,683,691
24,533
2,918,578 11,252,120
540,137 2,933,973 1,433,561 42,250,102
376,914 1,156,382
140,992 33,847,399 $ 6,492,355 $ 123,035,267
$ - $ 1,121,006
$ 53,976 $ 2,638,200 74,292 74,292
1 ,055,171 1,063,288
130,753
118,712 2,554,835 2,921,511 67,635,985
$ 3,168,491 $ 75,152,524
$ - $ 7,984,173
$ 1,397,575 $ 12,335,521
53,912 15,016
5,319,496
1,002,249 1,073,661 924,040 22,221,970
$ 3,323,864 $ 41,019,576

Exhibit 1
Component Component Component Unit Unit
Unit Rockbridge Rockbridge Component Rockbridge Regional Public
Unit Area Social Jail Service School Board Services Commission Authority
$ 189,381 $ 429,808 $ - $ 4,236,560 5,136
187,552 12,540 15,035 494,329
867,646 361,244 255,598 40,531 60,457
253,400
39,269
117,555 381,259 18,179,301 1,206,242 80,963 1,071,722 3,601 50,233 293,134
23,740,862 151,053 1,801,266
$ 20,907,088 $ 807,193 $ 1,683,297 $ 31,128,099
$ - $ - $ - $
$ 220,459 $ 159,415 $ 40,505 $ 341,278
73,672
998,707 546,541
101,677 38,070
103,235 61,271 109,818 986,955 1,029,823 35,770 73,212 12,587,994
$ 2,352,224 $ 904,674 $ 223,535 $ 14,027,969
$ - $ - $ - $
$ 19,368,578 $ {4,016) $ 1.407,528 $ 12,779,380
$ (813,714) (93,465) -----=5=2'-:0,2.;:_34_ 4,320,750
18,554,864 $===(!:9=7,==4=816) $ 1,459,762 $ 17,100,130
14

County of Rockbridge, Virginia Statement of Activities For the Year Ended June 30, 2013
Functions/Programs
PRIMARY GOVERNMENT: Governmental activities:
General government administration Judicial administration Public safety Public works Health and welfare Education Parks, recreation, and cultural Community development Nondepartmental Interest on long-term debt
Total governmental activities
Business-type activities: Landfill Fund Recycling Fund
Total business-type activities Total primary government
COMPONENT UNITS: Governmental activities:
School Board Rockbridge Area Social Services Board Rockbridge Regional Jail Commission
Business-type activities: Rockbridge Public Service Authority
Total component units
$
$
$
$ $
$
$
Program Revenues Operating
Charges for Grants and Expenses Services Contributions
2,011,030 $ 23,400 $ 215,455 $ 1,267,789 457,916 563,840 5,700,091 22,078 1,345,327 3,052,847 1,122,809 872 1,414,009 66,598
16,126,417 1,442,669 85,038 5,000 2,246,495 178,734 215,526 1,718,759 2,833,978
37,814,084 $ 1,889,975 $ 2,412,618 $
960,797 $ 1,034,968 $ - $ 1,156,498 26,161 2,117,295 $ 1,034,968 $ 26,161 $
39,931,379 $ 2,924,943 $ 2,438,779 $
30,791,136 $ 1,573,376 $ 13,883,833 $ 4,228,145 4,241,773 2,767,831 1,126,342 1,578,026
2,797,499 2,584,307 40,584,611 $ 5,284,025 $ 19,703,632 $
General revenues: General property taxes Local sales tax Consumers utility tax Business license tax Meals tax Motor vehicle licenses Lodging tax Other local taxes Unrestricted revenues from use of money and property Miscellaneous Grants and contributions not restricted to specific programs Transfers Total general revenues and transfers
Change in net position Net position -beginning as restated Net position - ending
The notes to the financial statements are an integral part of this statement.
15
Capital Grants and
Contributions
5,816,685
5,816,685
5,816,685
312,517 312,517

Primary Government Governmental Business-type
Activities Activities
$ (1 ,772, 175) $ - $ (246,033)
(4,332,686) (1 ,929' 166) (1,347,411)
(16, 126,417) (1 ,352,631) 3,964,450
(1 ,718,759) (2,833,978)
$ (27,694,806) $ - $
$ - $ 74,171 $ (1 '130,337)
$ - $ (1,056,166) $ $ (27,694,806) $ (1 ,056, 166) $
$ - $ - $
$ - $ - $
$ 22,519,602 $ - $ 2,392,591 1,522,050
913,827 1,317,225
537,855 1 '194,689
279,564 78,229 4,676
743,278 3,815 2,741,009
(1 ,234,972) 1,234,972 $ 33,004,947 $ 1,243,463 $
5,310,141 187,297 32,385,571 3,136,567
$ 37,695,712 $ 3,323,864 $
Total
(1,772,175) $ (246,033)
(4,332,686) (1 ,929,166) (1 ,347,411)
(16,126,417) (1,352,631) 3,964,450
(1 '718, 759) (2,833,978)
(27,694,806) $
74,171 $ (1 '130,337) (1 ,056, 166) $
(28,750,972) $
- $
- $
22,519,602 $ 2,392,591 1,522,050
913,827 1,317,225
537,855 1,194,689
279,564 82,905
747,093 2,741,009
34,248,410 $ 5,497,438
35,522,138 41,019,576 $
Net (Expense) Revenue and Changes in Net Assets
Component Unit Component Unit School Rockbridge Area Board Social Services
- $ - $
- $ - $
- $ - $
- $ - $ - $ - $
(15,333,927) $ - $ 13,628
(15,333,927) $ 13,628 $
- $ - $
121 108,573
16,058,033
16,166,727 $ - $ 832,800 13,628
17,722,064 (111,109) 18,554,864 $ (97,481) $
16
Component Unit Rockbridge Regional
Jail Commission
- $
- $
- $
- $ - $
- $
(63,463)
(63,463) $
- $
82 5,395
5,477 $ (57,986)
1,517,748 1,459,762 $
Exhibit 2
Component Unit Rockbridge Public Service Authority
99,325 99,325
10,242
185,211
195,453 294,778
16,805,352 17,100,130

THIS PAGE LEFT BLANK INTENTIONALLY

FUND FINANCIAL STATEMENTS


County of Rockbridge, Virginia Exhibit 3 Balance Sheet Governmental Funds June 30, 2013
Broadband School Technology Capital Courthouse
General Opportunities Projects Construction Fund Program Fund Fund Total
ASSETS Cash and cash equivalents $ 15,779,671 $ - $ 15,396 $ 254,255 $ 16,049,322 Receivables (net of allowance
for uncollectibles): Taxes receivable 9,542,923 9,542,923 Accounts receivable 543,444 46,790 590,234
Advances to other entities 1,683,691 1,683,691 Due from other funds 209,183 209,183 Due from component units 1,545,248 1,545,248 Due from other governmental units 905,718 117,674 1,023,392 Inventories 116,671 116,671 Prepaid items 24,533 24,533 Restricted assets:
Temporarily restricted: Cash and cash equivalents 1,006,433 7,327,109 8,333,542 Total assets $ 31,357,515 $ 164,464 $ 7,342,505 $ 254,255 $ 39,118,739
LIABILITIES Liabilities:
Accounts payable $ 496,481 $ 179,331 $ 1,908,412 $ - $ 2,584,224 Retainage payable 7,390 1,047,781 1 ,055,171 Due to other funds 62,896 207,346 1,837 272,079 Performance deposits 130,753 130,753
Total liabilities $ 690,130 $ 394,067 $ 2,958,030 $ - $ 4,042,227
DEFERRED INFLOWS OF RESOURCES Unavailable revenue-property taxes $ 9,613,584 $ - $ - $ - $ 9,613,584
FUND BALANCES Nonspendable:
Inventories $ 116,671 $ - $ - $ - $ 116,671 Total nonspendable $ 116,671 $ - $ - $ - $ 116,671
Restricted: Debt service and bond covenants $ 71,412 $ - $ - $ - $ 71,412 Capital projects 935,021 4,384,475 5,319,496 Rental assistance 15,016 15,016 Fire program 53,912 53,912
Total restricted $ 1,075,361 $ - $ 4,384,475 $ - $ 5,459,836 Committed:
School retirement $ 707,419 $ - $ - $ - $ 707,419 Total committed $ 707,419 $ - $ - $ - $ 707,419
Assigned: Garage $ 227,045 $ - $ - $ - $ 227,045 Industrial property 587,989 587,989 School carryover 868,718 868,718 Convenience centers 12,075 12,075 Partnership 82,097 82,097 Revenue recovery 157,073 157,073 Capital projects funds 254 255 254,255
Total assigned $ 1,934,997 $ - $ - $ 254,255 $ 2,189,252 Unassigned:
General fund $ 17,219,353 $ - $ - $ - $ 17,219,353 Special revenue funds (229,603) (229,603)
Total unassigned $ 17,219,353 $ (229,603) $ - $ - $ 16,989,750
Total fund balances $ 21,053,801 $ (229,603) $ 4,384,475 $ 254,255 $ 25,462,928 Total liabilities, deferred inflows of resources and fund balances $ 31,357,515 $ 164,464 $ 7,342,505 $ 254,255 $ 39,118,739
The notes to the financial statements are an integral part of this statement.
17

County of Rockbridge, Virginia Reconciliation of the Balance Sheet of Governmental Funds To the Statement of Net Position June 30, 2013
Amounts reported for governmental activities in the statement of net position are different because:
Total fund balances per Exhibit 3 - Balance Sheet- Governmental Funds
Capital assets used in governmental activities are not financial resources and, therefore, are not reported in the funds.
Other long-term assets are not available to pay for current-period expenditures and, therefore, are deferred in the funds.
Long-term liabilities, including bonds payable, are not due and payable in the current period and, therefore, are not reported in the funds.
Net position of governmental activities
The notes to the financial statements are an integral part of this statement.
18
Exhibit 4
$ 25,462,928
77,696,252
1,629,411
(67,092,879)
$ 37,695,712

County of Rockbridge, Virginia Exhibit 5 Statement of Revenues, Expenditures, and Changes in Fund Balances Governmental Funds For the Year Ended June 30, 2013
Broadband School Technology Capital Courthouse
Opportunities Projects Construction General Program Fund Fund Total
REVENUES General property taxes $ 22,414,930 $ $ - $ - $ 22,414,930 Other local taxes 8,157,801 8,157,801 Permits, privilege fees,
and regulatory licenses 172,766 172,766 Fines and forfeitures 235,024 235,024 Revenue from the use of
money and property 53,549 24,680 78,229 Charges for services 1 ,482,185 1 ,482,185 Miscellaneous 764,848 1,706,530 2,471,378 Recovered costs 350,799 350,799 Intergovernmental revenues:
Commonwealth 4,847,109 4,847,109 Federal 306,518 4,110,155 4,416,673
Total revenues $ 38,785,529 $ 5,816,685 $ 24,680 $ - $ 44,626,894
EXPENDITURES Current:
General government administration $ 1,588,585 $ $ - $ - $ 1,588,585 Judicial administration 1,278,954 1,278,954 Public safety 5,784,020 5,784,020 Public works 3,082,574 3,082,574 Health and welfare 1,413,425 1,413,425 Education 14,216,366 14,216,366 Parks, recreation, and cultural 1,345,586 1,345,586 Community development 2,238,899 5,098,312 7,337,211 Nondepartmental 1,723,096 1,723,096
Capital projects 21,849,069 21,849,069 Debt service:
Principal retirement 2,074,994 1,600,000 3,674,994 Interest and other fiscal charges 2,289,521 22,444 2,311,965 Bond issue costs 281 '128 6,644 287,772
Total expenditures $ 37,317,148 $ 5,098,312 $ 23,478,157 $ - $ 65,893,617
Excess (deficiency) of revenues over (under) expenditures $ 1 ,468,381 $ 718,373 $ (23,453,477) $ - $ (21 ,266, 723)
OTHER FINANCING SOURCES (USES) Transfers out $ (1 ,234,972) $ $ - $ - $ (1 ,234,972) Refunding bonds issued 11,760,000 11,760,000 General obligation bonds issued 21,895,000 21,895,000 Premium on refunding bonds issued 1,771,014 1,771,014 Premium on general obligation bonds issued 762,862 762,862 Payment to refunded bond escrow agent (13,086,006) (13,086,006)
Total other financing sources (uses) $ (789,964) $ $ 22,657,862 $ - $ 21,867,898
Net change in fund balances $ 678,417 $ 718,373 $ (795,615) $ - $ 601,175 Fund balances- beginning, as restated 20,375,384 (947,976) 5,180,090 254,255 24,861,753 Fund balances - ending $ 21,053,801 $ (229,603) $ 4,384,475 $ 254,255 $ 25,462,928
The notes to the financial statements are an integral part of this statement.
19

County of Rockbridge, Virginia Reconciliation of Statement of Revenues, Expenditures, and Changes in Fund Balances of Governmental Funds To the Statement of Activities For the Year Ended June 30, 2013
Amounts reported for governmental activities in the statement of activities are different because:
Net change in fund balances - total governmental funds
Governmental funds report capital outlays as expenditures. However, in the statement of activities the cost of those assets is allocated over their estimated useful lives and reported as depreciation expense. This is the amount by which the capital outlays exceeded depreciation in the current period.
The net effect of various miscellaneous transactions involving capital assets (i.e., sales, trade-ins, and donations) is to increase (decrease) net assets.
Revenues in the statement of activities that do not provide current financial resources are not reported as revenues in the funds.
The issuance of long-term debt (e.g. bonds, leases) provides current financial resources to governmental funds, while the repayment of the principal of long-term debt consumes the current financial resources of governmental funds. Neither transaction, however, has any effect on net position. Also, governmental funds report the effect of premiums, discounts, and similar items when debt is first issued, whereas these amounts are deferred and amortized in the statement of activities. This amount is the net effect of these differences in the treatment of long-term debt and related items.
Some expenses reported in the statement of activities do not require the use of current financial resources and, therefore are not reported as expenditures in governmental funds.
Change in net position of governmental activities
The notes to the financial statements are an integral part of this statement.
20
Exhibit 6
$ 601,175
24,313,760
(21 ,569)
104,672
(19,382,730)
(305,167)
$ =====5=,3=1 0=·=14=1=

County of Rockbridge, Virginia Exhibit 7 Statement of Net Position Proprietary Funds June 30, 2013
Enterprise Enterprise Fund Fund
landfill Recycling Fund Fund Total
ASSETS Current assets:
Cash and cash equivalents $ 966,341 $ - $ 966,341 Accounts receivable 52,936 52,936 Due from other funds 62,896 62,896
Total current assets $ 1 ,082,173 $ - $ 1,082,173 Noncurrent assets:
Restricted assets: Cash and cash equivalents $ 2,918,578 $ - $ 2,918,578 Total restricted assets $ 2,918,578 $ - $ 2,918,578
Capital assets, net of accumulated depreciation: Land $ 540,137 $ - $ 540,137 Buildings and improvements 1,232,030 201,531 1,433,561 Machinery and equipment 372,498 4,416 376,914 Construction in progress 140,992 140,992 Total capital assets $ 2,285,657 $ 205,947 $ 2,491,604 Total noncurrent assets $ 5,204,235 $ 205,947 $ 5,410,182 Total assets $ 6,286,408 $ 205,947 $ 6,492,355
LIABILITIES Current liabilities:
Accounts payable $ 49,783 $ 4,193 $ 53,976 Advances from participating entities 74,292 74,292 Bonds payable - current portion 20,000 20,000 Capital lease payable - current portion 75,912 75,912 Unamortized premium on bond issue-current portion 6,081 6,081 Compensated absences-curent portion 10,144 6,575 16,719
Total current liabilities $ 236,212 $ 10,768 $ 246,980 Noncurrent liabilities:
Compensated absences - net of current portion $ 6,763 $ 4,383 $ 11,146 Net OPEB obligation 2,000 2,000 Closure and post-closure liability 1,916,329 1,916,329 Bonds payable - net of current portion 635,000 635,000 Unamortized premium on bond issue -
net of current portion 115,543 115,543 Capital lease payable- net of current portion 241,493 241,493
Total noncurrent liabilities $ 2,917,128 $ 4,383 $ 2,921,511 T otalliabilities $ 3,153,340 $ 15,151 $ 3,168,491
NET POSTION Net investment in capital assets $ 1 '191 ,628 $ 205,947 $ 1,397,575 Restricted for debt service 1,002,249 1,002,249 Unrestricted (deficit) 939,191 {15,151} 924,040
Total net position $ 3,133,068 $ 190,796 $ 3,323,864
The notes to the financial statements are an integral part of this statement. 21

County of Rockbridge, Virginia Exhibit 8 Statement of Revenues, Expenses, and Changes in Net Position Proprietary Funds For the Year Ended June 30, 2013
Enterprise Enterprise Fund Fund
Landfill Recycling Fund Fund Total
OPERATING REVENUES Charges for services:
Landfill Rockbridge County $ 713,282 $ - $ 713,282 Landfill City of Lexington 212,132 212,132 Landfill City of Buena Vista 109,554 109,554 Sale of recycles 3,671 3,671 Miscellaneous 144 144
Total operating revenues $ 1,035,112 $ 3,671 $ 1,038,783
OPERATING EXPENSES Personal services $ 264,061 $ 260,535 $ 524,596 Fringe benefits 76,160 80,348 156,508 Contractual services 261,289 45,037 306,326 Other charges 134,522 25,993 160,515 Rent 43,319 43,319 Depreciation 113,013 26,480 139,493
Total operating expenses $ 892,364 $ 438,393 $ 1,330,757
Operating income (loss) $ 142,748 $ (434,722) $ (291 ,974)
NONOPERATING REVENUES (EXPENSES) Investment earnings $ 4,676 $ - $ 4,676 Contribution-Maury Service Authority (718, 1 05) (718,105) Commonwealth of Virginia-litter control grant 26,161 26,161 Interest expense (36,400) (36,400) Landfill closure costs and post-closure liability {32,033} {32,033}
Total nonoperating revenues (expenses) $ {63,757} $ {691 ,944} $ {755,701} Income before transfers $ 78,991 $ (1,126,666) $ (1 ,047,675)
Transfers in $ 139,993 $ 1,094,979 $ 1,234,972 Change in net position $ 218,984 $ (31 ,687) $ 187,297
Total net position- beginning, as restated 2,914,084 222,483 3,136,567 Total net position - ending $ 3,133,068 $ 190,796 $ 3,323,864
The notes to the financial statements are an integral part of this statement.
22

County of Rockbridge, Virginia Exhibit 9 Statement of Cash Flows Proprietary Funds For the Year Ended June 30, 2013
Enterprise Enterprise Fund Fund
Landfill Recycling Fund Fund Total
CASH FLOWS FROM OPERATING ACTIVITIES Receipts from customers and users $ 1,016,866 $ 7,864 $ 1,024,730 Payments to suppliers (493,211) (71 ,366) (564,577) Payments to employees p30,820~ p39,533~ {670,353~
Net cash provided by (used for) operating activities $ 192,835 $ {403,035~ $ {210,200~
CASH FLOWS FROM NONCAPITAL FINANCING ACTIVITIES Commonwealth of Virginia-litter control grant $ - $ 26,161 $ 26,161 Operating transfer from general fund 153,098 1,094,979 1,248,077
Net cash provided by (used for) noncapital financing activities $ 153,098 $ 1,121,140 $ 1,274,238
CASH FLOWS FROM CAPITAL AND RELATED FINANCING ACTIVITIES Purchase of capital assets $ (710,217) $ - $ (71 0,217) Proceeds from indebtedness 309,436 309,436 Principal payments on capital lease (31 ,972) (31 ,972) Interest paid on capital lease (36,400) (36,400) Contribution-Maury Service Authority {718,105~ {718, 1 05~
Net cash provided by (used for) capital and related financing activities $ {469, 153~ $ {718,105~ $ {1,187,258~
CASH FLOWS FROM INVESTING ACTIVITIES Interest received $ 4,676 $ - $ 4,676
Net increase (decrease) in cash and cash equivalents $ (118,544) $ - $ (118,544)
Cash and cash equivalents - beginning - including restricted 4,003,463 4,003,463 Cash and cash equivalents - ending - including restricted $ 3,884,919 $ - $ 3,884,919
Reconciliation of operating income (loss) to net cash provided by (used for) operating activities: Operating income (loss) $ 142,748 $ {434,722~ $ {291,974~ Adjustments to reconcile operating income (loss) to net cash
provided by (used for) operating activities: Depreciation expense 113,013 26,480 139,493 (Increase) decrease in accounts receivable (18,246) 4,193 (14,053) Increase (decrease) in accounts payable (54,081) (336) (54,417) Increase (decrease) in compensated absences 9,401 1,350 10,751
Net cash provided by (used for) operating activities $ 192,835 $ {403,035} $ {210,200}
Schedule of non-cash capital and related financing activities: Landfill closure costs $ 32,033 $ - $ 32,033
The notes to the financial statements are an integral part of this statement.
23

County of Rockbridge, Virginia Statement of Fiduciary Net Position Fiduciary Funds June 30, 2013
ASSETS Cash and cash equivalents
Total assets
LIABILITIES Accounts payable Amounts held for payroll deductions Amounts held for veterans memorial Amounts held for drug enforcement Amounts held for employee benefits Amounts held for commonwealth attorney forfeitures Amounts held for social services clients Amounts held for inmates/jail
Total liabilities
$ $
$
$
Primary Government
Agency Funds
91,403 $ 91,403 $
(68,642) $ 68,642 10,385 67,679
2,164 11 '175
91,403 $
The notes to the financial statements are an integral part of this statement.
24
Component Unit Rockbridge Area Social
Services Board
Agency Funds
Exhibit 10
Component Unit Rockbridge Regional
Jail Commission
Agency Funds
4,062 $ _____ -=-28~·..;..:12:;...:1:._ 4,062 $======28~·=12=1~
- $
4,062 28,121
4,062 $======28=·=12=1=

COUNTY OF ROCKBRIDGE, VIRGINIA
Notes to Financial Statements June 30, 2013
NOTE 1-SUMMARY OF SIGNIFICANT ACCOUNTING POLICIES:
The financial statements of the County conform to generally accepted accounting principles (GAAP) applicable to governmental units promulgated by the Governmental Accounting Standards Board (GASB). The following is a summary of the more significant policies:
A. Financial Reporting Entity
The County of Rockbridge, Virginia (government) is a municipal corporation governed by an elected fivemember Board of Supervisors. The accompanying financial statements present the government and its component units, entities for which the government is considered to be financially accountable. Blended component units, although legally separate entities, are, in substance, part of the government's operations. Each discretely presented component unit is reported in a separate column in the government-wide financial statements (see note below for description) to emphasize that it is legally separate from the government.
Blended component units - The Rockbridge Solid Waste Authority has been determined to be a component unit of Rockbridge County in accordance with Governmental Accounting Standards Board Statement 14. The Authority is a legally separate organization whose Board members are appointed by the Rockbridge County Board of Supervisors. Since the Board of Supervisors is able to impose its will on the Authority, the Authority is a component unit of Rockbridge County. Complete financial statements for the Authority may be obtained at the Authority's administrative office at 150 South Main Street, Lexington, Virginia 24450.
Discretely Presented Component Units:
Rockbridge County School Board: The School Board members are elected and are responsible for the operations of the County's School System within the County boundaries. The School Board is fiscally dependent on the County. The County has the ability to approve its budget and any amendments. The primary local sources of funding are from the General Fund of the County. The School Board does not issue a separate financial report. The financial statements of the School Board are presented as a discrete presentation in the County financial statements for the fiscal year ended June 30, 2013.
Rockbridge County Regional Jail Commission: The Rockbridge County Regional Jail Commission is a regional board organized to manage and confine prisoners from the localities of Lexington, Buena Vista and Rockbridge County. The Rockbridge County Board of Supervisors appoints one (1) member to the Commission, while the City of Lexington and the City of Buena Vista each appoint one member respectively. The Jail Commission is included in these financial statements because of the County's ability to designate the management and exercise significant control over the operations of the entity. The financial statements of the Commission are presented as a discrete presentation in the County financial statements for the fiscal year ended June 30, 2013. Complete financial statements of the Rockbridge County Regional Jail Commission are available at the Rockbridge County Jail, 258 Greenhouse Road, Lexington, Virginia 24450.
25

COUNTY OF ROCKBRIDGE, VIRGINIA
Notes to Financial Statements (Continued) June 30, 2013
NOTE 1-SUMMARY OF SIGNIFICANT ACCOUNTING POLICIES: (CONTINUED)
A. Financial Reporting Entity (continued)
Discretely Presented Component Units: (Continued)
Rockbridge County Public Service Authority: The Rockbridge County Public Service Authority is organized to provide water and sewer services to customers located in the County. The Authority is a legally separate entity from the County. The County is financially accountable for the Authority in that the County appoints the Authority's Board of Directors and has a financial indebtedness burden related to the Authority. The financial statements of the Authority are presented as a discrete presentation in the County financial statements for the fiscal year ended June 30, 2013. Complete financial statements of the Rockbridge County Public Service Authority are available at the Authority's office: 150 South Main Street, Lexington, Virginia 24450.
Rockbridge Area Social Services Board: The Rockbridge Area Social Services Board is a regional board organized to provide social services to Rockbridge County, and the Cities of Lexington and Buena Vista. All three participating entities appoint members of the Board. The Board is a legally separate organization. The financial statements of the Board are presented as a discrete presentation in the County financial statements for the fiscal year ended June 30,2013. The Board is included in these financial statements because of the Board's fiscal dependency on the County. Complete financial statements of the Rockbridge Area Social Services Board are available at the Rockbridge Area Social Services office: 20 East Preston Street, Lexington, Virginia 24450.
B. Other Organizations
Included in the County's Financial Report: None
Excluded from the County's Financial Report:
Rockbridge County Industrial Development Authority: The County created the Industrial Development Authority to attract industry to the County and to provide financing for such industries. The Authority is comprised of seven members appointed by the Board of Supervisors. The Authority was created by resolution pursuant to state statute, and it is legally separate from the County. The County cannot impose its will on the Authority since it does not have the ability to modify or approve the budget or overrule or modify the decisions of the Authority. The Authority is fiscally independent, and there is no financial benefit or burden relationship with the County. Therefore, it is not included in the County's financial statements.
Rockbridge Area Community Services Board: The Rockbridge Area Community Services Board is considered an intergovernmental Uoint) venture and therefore its operations are not included in the County's financial statements. The Cities of Lexington and Buena Vista and the County of Rockbridge provide the financial support for the Board and appoint its governing Board in which is vested the ability to execute contracts and to budget and expend funds. No one locality contributes more than 50% of the Board's funding or has oversight responsibility over its operations. Summary financial information is included in Note 4 of these financial statements. Complete financial statements can be obtained from the Rockbridge Area Community Services Board offices: 241 Greenhouse Road, Lexington, Virginia 24450.
26

COUNTY OF ROCKBRIDGE, VIRGINIA
Notes to Financial Statements (Continued) June 30, 2013
NOTE 1-SUMMARY OF SIGNIFICANT ACCOUNTING POLICIES: (CONTINUED)
B. Other Organizations (continued)
Excluded from the County's Financial Report: (Continued)
Maury Service Authority: The Maury Service Authority is responsible for acquiring, financing, constructing, and maintaining facilities for the improvement, treatment, storage and transmission of potable water. The Maury Service Authority is considered an intergovernmental Uoint) venture and therefore its operations are not included in the County's financial statements. The Cities of Buena Vista and Lexington and the County of Rockbridge appoint the Board of Directors and each provides substantially all of the Authority's revenues. Summary financial information is included in Note 4 of these financial statements. Complete financial statements of the Maury Service Authority are available at the Authority's office in Lexington, Virginia.
C. Government-wide and fund financial statements
The government-wide financial statements (i.e., the Statement of Net Position and the Statement of Activities) report information on all of the nonfiduciary activities of the primary government and its component units. For the most part, the effect of interfund activity has been removed from these statements. Governmental activities, which normally are supported by taxes and intergovernmental revenues, are reported separately from business-type activities, which rely to a significant extent on fees and charges for support. Likewise, the primary government is reported separately from certain legally separate component units for which the primary government is financially accountable.
The Statement of Net Position is designed to display financial position of the primary government (government and business-type activities) and its discretely presented component units. Governments will report all capital assets in the government-wide Statement of Net Position and will report depreciation expenses -the cost of "using up" capital assets - in the Statement of Activities. The net position of a government will be broken down into three categories- 1) net investment in capital assets, 2) restricted; and 3) unrestricted.
The Statement of Activities demonstrates the degree to which the direct expenses of a given function or segment are offset by program revenues. Direct expenses are those that are clearly identifiable with a specific function or segment. Program revenues include 1) charges to customers or applicants who purchase, use, or directly benefit from goods, services, or privileges provided by a given function or segment and 2) operating grants and contributions, and 3) capital grants and contributions, including special assessments. Taxes and other items not properly included among program revenues are reported instead as general revenues.
Separate financial statements are provided for governmental funds, proprietary funds, and fiduciary funds, even though the latter are excluded from the government-wide financial statements. Major individual governmental funds and major individual enterprise funds are reported as separate columns in the fund financial statements.
27

COUNTY OF ROCKBRIDGE, VIRGINIA
Notes to Financial Statements (Continued) June 30, 2013
NOTE 1-SUMMARY OF SIGNIFICANT ACCOUNTING POLICIES: (CONTINUED)
D. Measurement focus, basis of accounting, and financial statement presentation
The government-wide financial statements are reported using the economic resources measurement focus and the accrual basis of accounting, as are the proprietary fund financial statements. Revenues are recorded when earned and expenses are recorded when a liability is incurred, regardless ofthe timing of related cash flows. Property taxes are recognized as revenues in the year for which they are levied. Grants and similar items are recognized as revenue as soon as all eligibility requirements imposed by the provider have been met.
Governmental fund financial statements are reported using the current financial resources measurement focus and the modified accrual basis of accounting. Revenues are recognized as soon as they are both measurable and available. Revenues are considered to be available when they are collectible within the current period or soon enough thereafter to pay liabilities of the current period. For this purpose, the government considers revenues to be available if they are collected within 60 days of the end of the current fiscal period. Expenditures generally are recorded when a liability is incurred, as under accrual accounting. However, debt service expenditures, as well as expenditures related to compensated absences and claims and judgments, are recorded only when payment is due.
Property taxes, franchise taxes, licenses, and interest associated with the current fiscal period are all considered to be susceptible to accrual and so have been recognized as revenues of the current fiscal period. Accordingly, real and personal property taxes are recorded as revenues and receivables when billed, net of allowances for uncollectible amounts. Property taxes not collected within 60 days after yearend are reflected as unavailable revenues or deferred inflows of resources. Sales and utility taxes, which are collected by the state or utilities and subsequently remitted to the County, are recognized as revenues and receivables upon collection by the state or utility, which is generally in the month preceding receipt by the County.
Licenses, permits, fines and rents are recorded as revenues when received. Intergovernmental revenues, consisting primarily of federal, state and other grants for the purpose of funding specific expenditures, are recognized when earned or at the time of the specific expenditure. Revenues from general purpose grants are recognized in the period to which the grant applies. All other revenue items are considered to be measurable and available only when cash is received by the government.
The government reports the following major governmental funds:
The general fund is the government's primary operating fund. It accounts for and reports all financial resources of the general government, except those required to be accounted for in anotherfund. The general fund includes the activities of the central stores and the South River flood mitigation funds.
Special revenue funds account for the proceeds of the specific revenue sources (other than major capital projects) that are legally restricted to expenditures for specified purposes. The Broadband Technology Opportunities Program Fund is a special revenue fund of the County.
The capital projects funds account for and report financial resources to be used for the acquisition or construction of major capital facilities, other than those financed by proprietary funds. Capital project funds consist of the School Capital Projects Fund and the Courthouse Construction Fund.
28

COUNTY OF ROCKBRIDGE, VIRGINIA
Notes to Financial Statements (Continued) June 30, 2013
NOTE 1-SUMMARY OF SIGNIFICANT ACCOUNTING POLICIES: (CONTINUED)
D. Measurement focus, basis of accounting, and financial statement presentation (continued)
The government reports the following major proprietary funds:
The landfill and recycling funds account for and report the activities of the Rockbridge County Solid Waste Authority, a blended component unit of the government. The County operates the landfill and recycling operations of the Authority.
Additionally, the government reports the following fund types:
Fiduciary Trust and Agency funds account for assets held by the government in a trustee capacity or as agent or custodian for individuals, private organizations, other governmental units, or other funds. Agency funds include the Payroll Deduction, Drug, Veterans Memorial, Employee Benefit and the Commonwealth Attorney Forfeitures Funds.
As a general rule the effect of interfund activity has been eliminated from the government-wide financial statements.
Amounts reported as program revenues include 1) charges to customers or applicants for goods, services, or privileges provided, 2) operating grants and contributions, and 3) capital grants and contributions, including special assessments. Internally dedicated resources are reported as general revenues rather than as program revenues. Likewise, general revenues include all taxes.
Proprietary funds distinguish operating revenues and expenses from nonoperating items. Operating revenues and expenses generally result from providing services and producing and delivering goods in connection with a proprietary fund's principal ongoing operations. The principal operating revenues of the Authority enterprise fund are charges to customers for sales and services. Operating expenses for enterprise funds and internal service funds include the cost of sales and services, administrative expense, and depreciation on capital assets. All revenues and expenses not meeting this definition are reported as nonoperating revenues and expenses.
Sometimes the County will fund outlays for a particular purpose from both restricted (e.g. restricted bond and grant proceeds) and unrestricted resources, in order to calculate the amounts to report as restricted - net position and unrestricted - net position in the financial statements, a flow assumption must be made about the order in which the resources are considered to be applied. It is the County's policy to consider restricted -net position to have been depleted before unrestricted -net position is applied.
E. Assets, liabilities, deferred outflows/inflows of resources and net position/fund balance
1. Cash and cash equivalents
The government's cash and cash equivalents are considered to be cash on hand, demand deposits, and short-term investments with original maturities of three months or less from the date of acquisition.
Investments for the government, as well as for its component units, are reported at fair value. The State Treasurer's Local Government Investment Pool operates in accordance with appropriate state laws and regulations. The reported value of the pool is the same as the fair value of the pool shares.
29

COUNTY OF ROCKBRIDGE, VIRGINIA
Notes to Financial Statements (Continued) June 30, 2013
NOTE 1-SUMMARY OF SIGNIFICANT ACCOUNTING POLICIES: (CONTINUED)
E. Assets, liabilities, deferred outflows/inflows of resources and net position/fund balance (continued)
2. Receivables and payables
Activities between funds that are representative of lending/borrowing arrangements outstanding at the end of the fiscal year are referred to as either due to/from other funds (i.e., the current portion of interfund loans) or advances to/from other funds (i.e., the non-current portion of interfund loans). All other outstanding balances between funds are reported as due to/from other funds. Any residual balances outstanding between the governmental activities and business-type activities are reported in the government-wide financial statements as internal balances.
Advances between funds, as reported in the fund financial statements, are offset by a fund balance nonspendable account in applicable governmental funds to indicate that they are not available for appropriation and are not expendable available financial resources.
3. Inventory
Inventory is valued using the first in, first out method. Inventories in the General Fund and Discretely Presented Component Unit - School Board consist of expendable supplies held for consumption and are accounted for under the consumption method. Cost is recorded as an expense at the time the individual inventory items are used.
4. Property Taxes
Property is assessed at its value on January 1. Property taxes attach as an enforceable lien on property as of January 1. Real estate taxes are payable in two installments on June 5th and December 5th. Personal property taxes are due and collectible annually on December 5th. The County bills and collects its own property taxes.
5. Allowance for Uncollectible Accounts
The County calculates its allowance for uncollectible accounts using historical collection data and, in certain cases, specific account analysis. The allowance amounted to approximately $572,934 at June 30, 2013 and is comprised solely of property taxes.
6. Use of Estimates
The preparation of financial statements in conformity with generally accepted accounting principles requires management to make estimates and assumptions that affect certain reported amounts and disclosures. Accordingly, actual results could differ from those estimates.
7. Restricted Assets
The governmental funds maintain restricted cash for debt service, garage, fire funds, industrial property, and the discretely presented component unit-school board. The Landfill fund maintains restricted assets invested in the Local Government Investment Pool. These funds are restricted for the payment of future closure and post-closure costs associated with the County's landfill. The Component Unit Rockbridge Public Service Authority maintains restricted assets that are limited by applicable bond covenants.
30

COUNTY OF ROCKBRIDGE, VIRGINIA
Notes to Financial Statements (Continued) June 30, 2013
NOTE 1-SUMMARY OF SIGNIFICANT ACCOUNTING POLICIES: (CONTINUED)
E. Assets, liabilities, deferred outflows/inflows of resources and net position/fund balance (continued)
8. Capital assets
Capital assets, which include property, plant, equipment, and infrastructure assets (e.g., roads, bridges, sidewalks, and similar items), are reported in the applicable governmental or businesstype activities columns in the government-wide financial statements. Capital assets are defined by the government as assets with an initial, individual cost of more than $5,000 (amount not rounded) and an estimated useful life in excess of one year. Such assets are recorded at historical cost or estimated historical cost if purchased or constructed. Donated capital assets are recorded at estimated fair market value at the date of donation.
The cost of normal maintenance and repairs that do not add to the value of the asset or materially extend the asset's life are not capitalized.
Major outlays for capital assets and improvements are capitalized as projects are constructed. Interest incurred during the construction phase of capital assets of business-type activities is included as part of the capitalized value of the assets constructed. No interest was capitalized during the current or previous year.
Property, plant, and equipment and infrastructure of the primary government, as well as the component units, are depreciated using the straight line method over the following estimated useful lives:
Assets Buildings Building improvements Machinery and equipment Utility, plant and equipment
9. Compensated Absences
Years 40 40
5-10 5-30
Vested or accumulated vacation leave that is expected to be liquidated with expendable available financial resources is reported as an expenditure and a fund liability of the governmental fund that will pay it. Amounts of vested or accumulated vacation leave that are not expected to be liquidated with expendable available financial resources are reported as liabilities in the Statement of Net Position. In accordance with the provisions of Government Accounting Standards No. 16, Accounting for Compensated Absences, no liability is recorded for nonvesting accumulating rights to receive sick pay benefits. However, a liability is recognized for that portion of accumulating sick leave benefits that it is estimated will be taken as "terminal leave" prior to retirement. The County accrues salary-related payments associated with the payment of compensated absences.
10. Long-term obligations
In the government-wide financial statements, and proprietary fund types in the fund financial statements, long-term obligations are reported as liabilities in the applicable governmental activities, business-type activities, or proprietary fund type statement of net position. Bond premiums and discounts are deferred and amortized over the life of the bonds using the effective interest method. Bonds payable are reported net of the applicable bond premium or discount.
31

COUNTY OF ROCKBRIDGE, VIRGINIA
Notes to Financial Statements (Continued) June 30, 2013
NOTE 1-SUMMARY OF SIGNIFICANT ACCOUNTING POLICIES: (CONTINUED)
E. Assets, liabilities, deferred outflows/inflows of resources and net position/fund balance (continued)
10. Long-term obligations (continued)
In the fund financial statements, governmental fund types recognize bond premiums and discount, during the current period. The face amount of debt issued is reported as other financing sources. Premiums received on debt issuances are reported as other financing sources while discounts on
debt issuances are reported as other financing uses.
11. Fund equity
The County reports fund balance in accordance with GASB Statement 54, Fund Balance Reporting and Governmental Fund Type Definitions. The following classifications describe the relative strength of the spending constraints placed on the purposes for which resources can be used:
1111 Nonspendable fund balance- amounts that are not in spendable form (such as inventory and prepaids) or are required to be maintained intact (corpus of a permanent fund);
1111 Restricted fund balance- amounts constrained to specific purposes by their providers (such as grantors, bondholders, and higher levels of government), through constitutional provisions, or by enabling legislation;
1111 Committed fund balance- amounts constrained to specific purposes by a government itself, using its highest level of decision-making authority; to be reported as committed, amounts cannot be used for any other purpose unless the government takes the same highest level action to remove or change the constraint;
1111 Assigned fund balance- amounts a government intends to use for a specific purpose; intent can be expressed by the governing body or by an official or body to which the governing body delegates the authority;
1111 Unassigned fund balance- amounts that are available for any purpose; positive amounts are only reported in the general fund.
When fund balance resources are available for a specific purpose in more than one classification, it is the County's policy to use the most restrictive funds first in the following order: restricted, committed, assigned, and unassigned as they are needed.
The County establishes (and modifies or rescinds) fund balance commitments by passage of an ordinance. This is typically done through adoption and amendment of the budget. A fund balance commitment is further indicated in the budget document as a designation or commitment of the fund (such as for special incentives). Assigned fund balance is established by the Board of Supervisors through adoption or amendment of the budget as intended for specific purpose (such as the purchase of capital assets, construction, debt service, or for other purposes).
32

COUNTY OF ROCKBRIDGE, VIRGINIA
Notes to Financial Statements (Continued) June 30, 2013
NOTE 1-SUMMARY OF SIGNIFICANT ACCOUNTING POLICIES: (CONTINUED)
E. Assets, liabilities, deferred outflows/inflows of resources and net position/fund balance (continued)
12. Net Position
Net position is the difference between (a) assets and deferred outflows of resources and (b) liabilities and deferred inflows of resources. Net investment in capital assets represents capital assets, less accumulated depreciation, less any outstanding debt related to the acquisition, construction or improvement of those assets. Deferred outflows of resources and deferred inflows of resources that are attributable to the acquisition, construction, or improvement of those assets or related debt are also included in this component of net position.
13. Deferred Outflows/Inflows of Resources
In addition to assets, the statement of financial position will sometimes report a separate section for deferred outflows of resources. This separate financial statement element, deferred outflows of resources, represents a consumption of net position that applies to a future period(s) and so will not be recognized as an outflow of resources (expense) until then. The County shows a deferred charge on refunding reported in to government-wide statement of net position. A deferred charge on refunding results from the difference in the carrying value of refunded debt and its reacquisition price. This amount is deferred and amortized over the shorter of the life of the refunded or refunding debt.
In addition to liabilities, the statement of financial position will sometimes report a separate section for deferred inflows of resources. This separate financial statement element, deferred inflows of resources, represents an acquisition of net position that applies to a future period(s) and so will not be recognized as an inflow of resources (revenue) until that time. The County has one item that qualifies for reporting in this category. Under a modified accrual basis of accounting, unavailable revenue representing property taxes receivable is reported in the governmental funds balance sheet. This amount is comprised of uncollected property taxes due prior to June 30, 2nd half installments levied during the fiscal year but due after June 30th, and amounts prepaid on the 2nd half installments and is deferred and recognized as an inflow of resources in the period that the amount becomes available. Under the accrual basis, 2nd half installments levied during the fiscal year but due after June 30th and amounts prepaid on the 2nd half installments are reported as deferred inflows of resources.
14. Financial Reporting of Deferred Outflows of Resources, Deferred Inflows of Resources, and Net Position, Statement No. 63 of the Governmental Accounting Standards Board
The County implemented the financial reporting provisions of the above Statement for the fiscal year ended June 30, 2013. This Statement provides guidance for reporting deferred inflows and outflows of resources. The requirements of this Statement will improve financial reporting by standardizing the presentation of deferred outflows of resources and deferred inflows of resources and their effects on an entity's net position. With the implementation of this Statement, certain terminology has changed and financial statement descriptions have changed from "net asset" to "net position.
33

COUNTY OF ROCKBRIDGE, VIRGINIA
Notes to Financial Statements (Continued) June 30, 2013
NOTE 1-SUMMARY OF SIGNIFICANT ACCOUNTING POLICIES: (CONTINUED)
E. Assets, liabilities, deferred outflows/inflows of resources and net position/fund balance (continued)
15. Items Previously Reported as Assets and Liabilities, Statement No. 65 of the governmental Accounting Standards Board
The County implemented the financial reporting provisions of the above Statement for the fiscal year ended June 30, 2013. This Statement establishes accounting and financial reporting standards that reclassify, as deferred outflows of resources or deferred inflows of resources, certain items that were previously reported as assets and liabilities and recognizes, as outflows of resources or inflows of resources, certain items that were previously reported as assets and liabilities. The net equity reported in the financial statements was changed as a result of implementing this Statement and a restatement of prior balances was required to record a loan due from the Rockbridge Public Service Authority and to write off bond issue costs in the amount of $1,295,130 in the governmental activities and $25,753 in the business-type activities, respectively.
NOTE 2-RECONCILIATION OF GOVERNMENT-WIDE AND FUND FINANCIAL STATEMENTS:
A. Explanation of certain differences between the governmental fund balance sheet and the government-wide statement of net position
The governmental fund balance sheet includes a reconciliation between fund balance-total governmental funds and net position-governmental activities as reported in the government-wide statement of net position. One element of that reconciliation explains that long-term liabilities, including bonds payable, are not due and payable in the current period and therefore are not reported in the funds. The details of these ($67,092,879) and ($1, 133,058) differences for the primary government and discretely presented component unit, respectively, are as follows:
Bonds and loans payable $ Capital leases payable Unamoritzed premium on debt Accrued interest payable Deferred charge on refunding Net OPES obligation Compensated absences Net adjustment to reduce fund balance-total governmental funds to arrive at net position-governmental activities $
34
Primary Government
(63,450,639) $ (173,515)
(3, 134, 153) (1 ,063,288) 1 '121 ,006 (120,000) (272,290)
Component Unit School Board
(961 ,000) (172,058)
(67,092,879) $ ===(1=, 1=3=3,=05=8=)

COUNTY OF ROCKBRIDGE, VIRGINIA
Notes to Financial Statements (Continued) June 30, 2013
NOTE 2-RECONCIUATION OF GOVERNMENT-WIDE AND FUND FINANCIAL STATEMENTS: (CONTINUED)
B. Explanation of certain differences between the governmental fund statement of revenues, expenditures, and changes in fund balances and the government-wide statement of activities
The governmental fund statement of revenues, expenditures, and changes in fund balances includes a reconciliation between net changes in fund balances-total governmental funds and changes in net position of governmental activities as reported in the government-wide statement of activities. One element of that reconciliation explains that Governmental funds report capital outlays as expenditures. However, in the statement of activities the cost of those assets is allocated over their estimated useful lives and reported as depreciation expense. The details of these $24,313,760 and $1,180,534 differences for the primary government and discretely presented component unit, respectively, are as follows:
Capital outlay $ Depreciation expense Allocation of debt financed school assets based on current year repayments
Net adjustment to increase (decrease) net changes in fund balances-total governmental funds to arrive at changes in net position of governmental activities $
Primary Government
28,305,957 $ (1 '1 00,462)
(2,891 ,735)
Component Unit School Board
(412,347) (1 ,298,854)
2,891,735
24,313,760 $ ===1 =' 1=80='=53=4=
Another element of that reconciliation states that the issuance of long-term debt (e.g., bonds, leases) provides current financial resources to governmental funds, while the repayment of the principal of longterm debt consumes the current financial resources of governmental funds. Neither transaction, however, has any effect on net position. Also, governmental funds report the effect of issuance costs, premiums, discounts, and similar items when debt is first issued, whereas these amounts are deferred and amortized in the statement of activities. The details of this ($19,382, 730) difference in the primary government are as follows:
Issuances: General obligation debt $ Revenue bonds Premium on bonds
Principal repayments: General obligation debt Capital leases Payment to escrow agent for refunding Amortization of premium on general obligation bonds
Net adjustment to increase (decrease) net changes in fund balances-total governmental funds to arrive at
(21 ,895,000) (11 ,760,000)
(2,533,876)
3,557,806 117,188
13,086,006 45,146
changes in net position of governmental activities $ (19,382,730) ================
35

COUNTY OF ROCKBRIDGE, VIRGINIA
Notes to Financial Statements (Continued) June 30, 2013
NOTE 2-RECONCILIATION OF GOVERNMENT-WIDE AND FUND FINANCIAL STATEMENTS: (CONTINUED)
B. Explanation of certain differences between the governmental fund statement of revenues, expenditures, and changes in fund balances and the government-wide statement of activities (continued)
Another element of that reconciliation states that some expenses reported in the statement of activities do not require the use of current financial resources and therefore are not reported as expenditures in governmental funds. The details of these ($305, 167) and ($194,615) differences for the primary government and discretely presented component unit, respectively, are as follows:
Compensated absences Net OPEB obligation Accrued interest payable
Net adjustment to increase (decrease) net changes
$
in fund balances-total governmental funds to arrive at changes in net position of governmental activities $
Primary Component Unit Government School Board
(15, 780) $ 4,385 (1 0,000) (199,000)
(279,387)
(305, 167) $ ===::::):( 1=9=4,=6=15=)
NOTE 3-STEWARDSHIP, COMPLIANCE, AND ACCOUNTABILITY:
A. Budgetary information
The following procedures are used by the County in establishing the budgetary data reflected in the financial statements:
1. Prior to March 30, the County Administrator submits to the Board of Supervisors a proposed operating and capital budget for the fiscal year commencing the following July 1. The operating and capital budget includes proposed expenditures and the means of financing them.
2. Public hearings are conducted to obtain citizen comments.
3. Prior to June 30, the budget is legally enacted through passage of an Appropriations Resolution.
4. The Appropriations Resolution places legal restrictions on expenditures at the department level or category level. The Board of Supervisors has authorized the County Administrator to revise appropriations for each department or category as needed to meet actual operational expenditures. The County Administrator is also authorized to transfer budgeted amounts within general government departments; however, the School Board is authorized to transfer budgeted amounts within the school system's categories.
5. Formal budgetary integration is employed as a management control device during the year for the General Fund.
6. All budgets are adopted on a basis consistent with generally accepted accounting principles (GAAP).
7. Appropriations lapse on June 30, for all County units.
8. All budgetary data presented in the accompanying financial statements is the revised budget as of June 30.
36

COUNTY OF ROCKBRIDGE, VIRGINIA
Notes to Financial Statements (Continued) June 30, 2013
NOTE 3-STEWARDSHIP, COMPLIANCE, AND ACCOUNTABILITY:
B. Excess of expenditures over appropriations:
For the year ended June 30, 2013, the following funds had expenditures exceeding appropriations:
Fund
Broadband Technology Opportunities School Capital Projects Component Unit School Board Component Unit School Cafeteria Total
C. Deficit fund equity
$
Excess of Expenditures
over Appropriations
5,098,312 3,964,920
535,643 20,317
$ ======9=,6=1=9,=19=2=
At June 30, 2013, the Broadband Technology Opportunities Fund had deficit fund equity of ($229,603). Expenditures paid by the County towards the STOP program are collected within approximately sixty days after payment through a grant reimbursement from the federal government and its local partners. The delay between expenditures and collection of the reimbursement resulted in this deficit fund equity.
NOTE 4-JOINT VENTURES:
As described in Note 1-B, the following boards are construed as operating as joint ventures between the Cities of Lexington, Buena Vista and the County of Rockbridge. Summary financial information for the Boards at June 30, 2013 is provided below:
Maury Rockbridge Area Service Community
Authoritx: Services Board Total assets $ 40,628,959 $ 7,661,029 Total liabilities and deferred outflows of resources 19,082,652 4,983,257 Total net position $ 2116351423 $ 2 677 772 For the year ended June 30, 2013
Operating revenue $ 2,611,051 $ 4,896,759 Operating expenses (2,854,758) (8,327,560) Nonoperating income (expense) 1,219,035 3,175,404 Change in net position $ 975,328 $ (255,397)
Net position at beginning of year as restated 20,660,095 2,933,169 Net position at end of year $ 2116351423 $ 2 677 772
37

COUNTY OF ROCKBRIDGE, VIRGINIA
Notes to Financial Statements (Continued) June 30, 2013
NOTE 5-DUE FROM OTHER GOVERNMENTAL UNITS:
Due from other governments consists of payments due from federal, state, and local governmental units at June 30, 2013 as follows:
Component Unit
Component Rockbridge Unit Component Area Social
Governmental School Unit Jail Services Activities Board Commission Board
Commonwealth of Virginia: State sales taxes $ - $ 489,387 $ - $ Local sales taxes 457,302 Public assistance grants 43,447 Comprehensive services act 249,690 Communications tax 150,890 Shared expenses 157,099 114,520 Other 124,447 232,000 85,870
Federal Government: BTOP 117,674 Other 15,980 146,259 68,107
Other Governmental Units: City of Lexington 17,467 City of Buena Vista 9,674 County of Rockbridge 28,067
Totals $ 1,023,392 $ 867,646 $ 255,598 $ 361,244
NOTE 6-INTERFUND OBLIGATIONS:
The purpose of interfund obligations due to/from component unit is to report the balance of local appropriations unspent at year-end due back to the respective funds. The purpose of interfund obligations due to/from other funds is to repay the general fund for expenditures related to the landfill and school capital projects.
Due From Due To Component Component
Due From Due To Unit/Primary Unit/Primary Fund Other Funds Other Funds Government Government General $ 209,183 $ 62,896 $ 1,545,248 $ Broadband Technology Opportunities 207,346 Landfill Fund 62,896 School Capital Projects 1,837 Component Unit Rockbridge
Area Social Services 546,541 Component Unit School Board 998,707 Total $ 272 079 $ 272 079 $ 1,545,248 $ 1,545,248
38

COUNTY OF ROCKBRIDGE, VIRGINIA
Notes to Financial Statements (Continued) June 30, 2013
NOTE 7-LONG-TERM OBLIGATIONS:
Primary Government- Governmental Activity Indebtedness:
Annual requirements to amortize long-term debt and related interest are as follows:
Year Ending Revenue Bonds General Obligation Bonds
June 30, Principal Interest Principal Interest 2014 $ 489,697 $ 769,836 $ 1,298,061 $ 1,900,320 2015 480,000 799,255 1,340,037 1,738,271 2016 500,000 779,655 1 ,822,118 1,677,894 2017 135,000 767,293 1,884,665 1,602,878 2018 445,000 754,839 1,952,709 1,523,642 2019 580,000 732,727 2,015,553 1,444,548 2020 605,000 705,999 2,082,446 1,368,716 2021 635,000 675,846 2,154,438 1,286,916 2022 660,000 649,493 2,227,271 1 '195,869 2023 685,000 621,918 2,195,253 1 '1 06,851 2024 715,000 587,843 2,183,391 1,025,326 2025 755,000 553,655 1,950,000 957,604 2026 785,000 519,293 2,005,000 899,189 2027 820,000 483,146 1,780,000 844,779 2028 855,000 444,711 1,835,000 787,088 2029 905,000 403,852 1,895,000 723,456 2030 940,000 361,030 1 '160,000 681 '125 2031 990,000 316,196 1 '185,000 498,036 2032 1,035,000 269,002 815,000 314,185 2033 1,075,000 219,561 840,000 288,946 2034 1,130,000 169,169 865,000 262,945 2035 1 '180,000 117,726 890,000 236,181 2036 1,230,000 63,961 920,000 208,579 2037 355,000 27,625 950,000 180,061 2038 375,000 9,379 980,000 150,629 2039 1,010,000 119,650 2040 1,040,000 87,106 2041 1,075,000 53,531 2042 1 '105,000 18,233
Total $ 18,359,697 $ 11,803,006 $ 43,455,942 $ 23,182,554
39

COUNTY OF ROCKBRIDGE, VIRGINIA
Notes to Financial Statements (Continued) June 30, 2013
NOTE 7-LONG-TERM OBLIGATIONS: (CONTINUED)
Primar)! Government- Governmental Activit)! Indebtedness:
Year Ending Literary Loans June 30, Princieal Interest
2014 $ 200,000 $ 48,944 $ 2015 180,000 57,173 2016 180,000 51,683 2017 180,000 45,293 2018 180,000 38,003 2019 175,000 30,814 2020 180,000 22,725 2021 180,000 13,635 2022 180,000 4,545 Total $ 116351000 $ 3121812 $
Changes in Long-Term Obligations:
{continued}
Capital Leases Principal Interest
120,235 $ 2,549 53,280 499
1731515 $ 3 048
The following is a summary of long-term obligations transactions of the County for the year ended June 30, 2013:
General Unamortized Revenue Obligation Bond Literary Capital Net OPEB Compensated
Bonds Bonds Premium Loans Leases Obli~ation Absences Total Balance at July 1, 2012 $ 19,055,719 $ 24,262,126 $ 645,423 $ 2,000,000 $ 290,703 $ 110,000 $ 256,511 $ 46,620,482
Issuances: General obligation bonds 20,460,000 20,460,000 Revenue bonds 11,760,000 11,760,000 Literary loans 1,435,000 1 ,435,000 Premium on bonds 2,533,876 2,533,876
Retirements: Revenue Bonds (12,456,022) (12,456,022) General obligation bonds (1 ,266, 184) (1 ,266,184)
Capital leases (117,188) (117,188) Premium on bond issues (45,146) (45,146) Literary loans (1 ,800,000) (1 ,800,000) Increase in net OPEB obligation 10,000 10,000
Increase in compensated absences 15,779 15,779
Balance at June 30, 2013 $ 18,359,697 $ 43,455,942 $ 3,134,153 $ 1,635,000 $ 173,515 $ 120,000 $ 272,290 $ 67,150,597
40
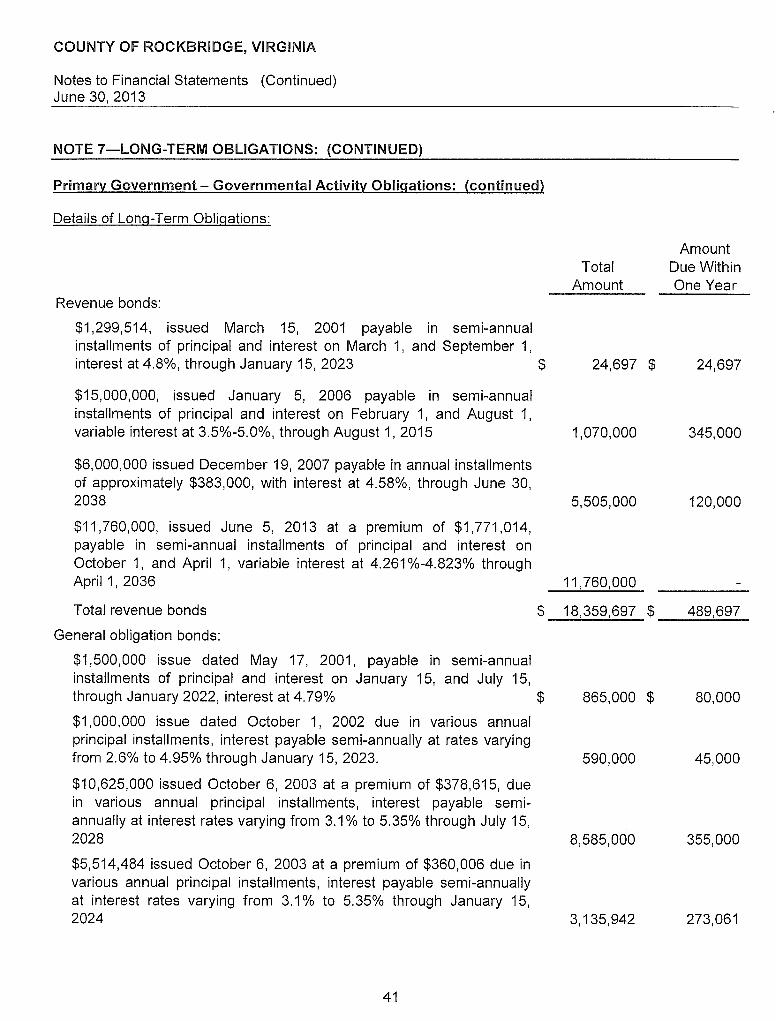
COUNTY OF ROCKBRIDGE, VIRGINIA
Notes to Financial Statements (Continued) June 30, 2013
NOTE 7-LONG-TERM OBLIGATIONS: (CONTINUED)
Primary Government- Governmental Activity Obligations: (continued)
Details of Long-Term Obligations:
Revenue bonds:
$1,299,514, issued March 15, 2001 payable in semi-annual installments of principal and interest on March 1, and September 1,
Total Amount
interest at 4.8%, through January 15, 2023 $ 24,697 $
$15,000,000, issued January 5, 2006 payable in semi-annual installments of principal and interest on February 1, and August 1, variable interest at 3.5%-5.0%, through August 1, 2015 1,070,000
$6,000,000 issued December 19, 2007 payable in annual installments of approximately $383,000, with interest at 4.58%, through June 30, 2038 5,505,000
$11,760,000, issued June 5, 2013 at a premium of $1,771,014, payable in semi-annual installments of principal and interest on October 1, and April 1, variable interest at 4.261%-4.823% through April 1, 2036 11,760,000
Amount Due Within One Year
24,697
345,000
120,000
Total revenue bonds $ 18,359,697 $ __ 4;...;;.8..;..l9,...;..69.;;_;.7_
General obligation bonds:
$1,500,000 issue dated May 17, 2001, payable in semi-annual installments of principal and interest on January 15, and July 15, through January 2022, interest at 4.79% $ 865,000 $
$1,000,000 issue dated October 1, 2002 due in various annual principal installments, interest payable semi-annually at rates varying from 2.6% to 4.95% through January 15, 2023. 590,000
$10,625,000 issued October 6, 2003 at a premium of $378,615, due in various annual principal installments, interest payable semi-annually at interest rates varying from 3.1% to 5.35% through July 15, 2028 8,585,000
$5,514,484 issued October 6, 2003 at a premium of $360,006 due in various annual principal installments, interest payable semi-annually at interest rates varying from 3.1% to 5.35% through January 15, 2024 3,135,942
41
80,000
45,000
355,000
273,061

COUNTY OF ROCKBRIDGE, VIRGINIA
Notes to Financial Statements (Continued) June 30, 2013
NOTE 7-LONG-TERM OBLIGATIONS: (CONTINUED)
Primary Government- Governmental Activity Obligations: (continued)
Details of Long-Term Details of Obligations:
General obligation bonds: (continued)
$3,590,000 issued May 12, 2005 at a premium of $213,677 due in various annual principal installments, interest payable semi-annually
Total Amount
Amount Due Within One Year
at interest rates varying from 3.1% to 5.1% through July 15, 2025 $ 2, 710,000 $ 150,000
$7,500,000 School tax credit bonds issued December 15, 2011 due in various annual principal installments, interest payable semi-annually at an interest rate of 4.25% through June 30, 2031 7,110,000 395,000
$20,460,000 VPSA bonds issued November 15, 2012 at a premium of $540,453, due in various annual principal installments, interest payable semi-annually at variable interest rates through November 15, 2042 20,460,000 Total school bonds $ 43,455,942 $ 1,298,061
Literary loans:
$4,000,000 issue dated January 1, 2002, payable in various annual principal and interest installments through January 1, 2014, interest at 4% $
$1 ,435,000 issue dated May 9, 2013, payable in various annual principal and interest installments, interest rates varying from 3.05%-4% through January 15, 2021 $
Total literary loans $ Capital leases:
$150,000 issued May 31, 2011 for vehicles for the Sheriff Department, due in quarterly payments of $12,970 through May 13, 2014, interest at 2.29% $
$206,315 issued March 7, 2012 for vehicles for the Sheriff Department, due in quarterly payments of $17,726 through March 7, 2015, interest at 1.89%
Total capital lease obligations
Unamortized bond premium
Net OPEB obligation (payable from the General Fund)
Compensated absences (payable from the General Fund)
Total long-term obligations
42
$
$
$
$
$
200' 000 $ __ 2_0__,0,_00_0_
1,435,000 $ ___ _
1 '635' 000 $ __ 2....;;.0...::....!0 1...;_00.;_;0_
51,146 $ 51' 146
122,369 69,089
173,515 $ 120,235
3, 134,153 $ 164,756
120,000 $
272,290 $ 163,374
67,150,597 $ 2,436,123

COUNTY OF ROCKBRIDGE, VIRGINIA
Notes to Financial Statements (Continued) June 30, 2013
NOTE 7-LONG-TERM OBLIGATIONS: (CONTINUED)
PrimarY Government- Enter~rise Activitv Obligations:
Annual requirements to amortize long-term debt and related interest are as follows:
Landfill Fund
Year Ending Revenue Bond Capital Leases
June 30, Principal Interest Principal Interest 2014 $ 20,000 $ 31,456 $ 75,912 $ 9,080 2015 20,000 30,631 60,199 6,853 2016 20,000 29,656 62,154 4,898 2017 25,000 28,653 64,172 2,880 2018 25,000 27,522 54,968 811 2019 25,000 26,316 2020 25,000 25,109 2021 30,000 23,700 2022 30,000 22,238 2023 30,000 20,800 2024 30,000 19,288 2025 35,000 17,622 2026 35,000 15,828 2027 35,000 14,134 2028 40,000 12,462 2029 40,000 10,763 2030 45,000 8,584 2031 45,000 6,278 2032 50,000 3,844 2033 50,000 1,281 Total $ 655,000 $ 376,165 $ 317,405 $ 24,522
43

COUNTY OF ROCKBRIDGE, VIRGINIA
Notes to Financial Statements (Continued) June 30, 2013
NOTE 7-LONG-TERM OBLIGATIONS: (CONTINUED)
Primary Government- Enterprise Activity Obligations: (Continued)
Changes in Long-Term Obligations:
The following is a summary of long-term obligations transactions of the enterprise activities for the year ended June 30, 2013.
Landfill
Closure
and
Post-Closure Net OPEB Compensated Bond
Liability Obligation Absences Payable
Balance at July 1, 2012 $ 1,884,296 $ 2,000 $ 17,114 $ 655,000
Increase in
compensated absences 10,751
Issuance of capital leases
Landfill closure and post-
closure liability 32,033
Retirements: Principal on capital leases
Balance at June 30, 2013 $ 1,916,329 $ 2,000 $ 27,865 $ 655,000
Details of long-term obligations:
Revenue bond: $655,000 obligation due in varying annual principal installments, and semi-annual payments totaling $51 ,456 annually with interest from 3.625% to 5.125% beginning October 1, 2012 through April 1,
Premium
on Bond Capital
Issue Leases Total
$ 121,624 $ 39,940 $ 2,719,974
10,751
309,437 309,437
32,033
(31,972) $ (31 ,972)
$ 121,624 $ 317,405 $ 3,040,223
Amount Total Due Within
Amount One Year
2033. $ 655,000 $ _ __;;;;2~0 1...;;_00;;_;0_ Captial leases:
$66,840 Issued April 24, 2011 for an excavator, due in monthly payments of $1,982 through March 27, 2014, interest at 4.550%
$309,436 Issued April 13, 2013 for a track loader, due in monthly payments of $5,588 through April 15, 2018, interest at 4.550%
Total capital leases
Unamortized bond premium Landfill closure and post-closure liability Net OPEB obligation Compensated absences Total long-term obligations
44
$ 17,606 $ 17,606
299,799 58,306 $ 317,405 $ _ ___;_7~5,...;;..91,;.;;;2;_
$ 121,624 $ __ __:6,_08_1_ $ 1,916,329 $ ___ _
$ 2, 000 $ ----:--:-----$ 27,865 $ __ 1__:6,_71;;,..;9_
$ 3,040,223 $==1=1=8=7=12=

COUNTY OF ROCKBRIDGE, VIRGINIA
Notes to Financial Statements (Continued) June 30, 2013
NOTE 7-LONG-TERM OBLIGATIONS: (CONTINUED)
Component Unit- Rockbridge County Public Service Authority:
Annual requirements to amortize the long-term bonds payable and the related interest are as follows:
Years Ending Revenue Bonds June 30, Princieal
2014 $ 943,309 2015 954,642 2016 968A76 2017 886,759 2018 802,116
2019-2023 3,986)53 2024-2028 2,720,597
2029-2033 337,257 2034-2038 299,182
Total $ 1118991091
Changes in Long-Term Obligations:
Water Fund: Revenue Bonds Rural Development Bond Net OPEB obligation
$
Balance July 1, 2012
1 )07,601 $
Compensated Absences Total Water Fund $ -----''-----'---Sewer Fund:
Revenue Bonds $ Advances Net OPEB obligation Compensated Absences
Total Sewer Fund $ -----'--'---
Totals $=~===:i::!:i:::===
Interest $ 85,099
72,991 60,379 47,214 41,091
142,346 79A12 47,343 12,532
$ 5881407
Issuance/ Additions
- $ 1A68,752
1,140 4,634
1A74,526 $
- $ 361,082
860 3A96
365A38 $ 1,8391964 $
Operating contributions from Rockbridge County consisted of the following:
Retirement/ Reductions
192,791 1,048
193,839
690,117
690,117 8831956
Principal and interest payments on the 2001 Water Revenue Refunding Bond Principal and interest payments on the Route 60 Project
Total
45
$
$
$
$ $
$
Balance June 30, 2013
1,114,810 1A67,704
6,840 24,878
2,614,232
9,316,577 1,620,212
5,160 18,768
10,960,717 1315741949
117,107 68,104
$ ===1=85='=21=1=

COUNTY OF ROCKBRIDGE, VIRGINIA
Notes to Financial Statements (Continued) June 30, 2013
NOTE 7-LONG-TERM OBLIGATIONS: (CONTINUED)
Component Unit- Rockbridge County Public Service Authority: (continued)
Details of long-term obligations:
Water Fund: Revenue Bonds:
$1 ,266,223 Water Revenue Refunding Bond dated March 1, 2001, payable in semi-annual installments through October 1, 2016. Interest rate of 4.74%. Payments on this bond are anticipated to be made by
Total Amount
Rockbridge County. $ 373,637 $
$767,900 Water Revenue Obligation issued through the Buena Vista Industrial Development Authority (Authority portion of $1,400,000 issue), dated August 1, 1996, payable semi-annually through July 14, 2016, average interest rate of approximately 6.3%. Payments on this bond are anticipated to be made by Rockbridge County.
$940,000 Infrastructure Revenue Bonds (Series 2002A) issued through the Virginia Resources Authority, dated June 6, 2002, payable annually through April 1, 2022, interest payable semi-annually at rates ranging from 3.1% to 5.35%.
$2,081,000 Water System Revenue Bonds (Series 2012) issued through the United States Department of Agriculture, dated June 28, 2012, payable annually through June 28, 2052, stated interest rate of 2.0%.
Total Bonds
Compensated absences
Net OPEB obligation
Total Water Fund
Sewer Fund:
Revenue Bonds: $14,700,000 Sewer System Revenue Bonds, Series 2005 issued through the Virginia Revolving Loan Fund payable through December 31, 2027 in equal installments with no interest. Amount advanced and outstanding at
$
$
$
211,173
530,000
1,467,704
2,582,514 $
24,878 $
6,840
2,614,232 $
year-end. $ 9,316,577 $
Advances:
Loan from Rockbridge County, dated September 1, 2010. upon repayment terms.
Compensated absences
Net OPEB obligation
Total Sewer Fund
Total long-term obligations
46
No agreed 1,620,212
18,768
5,160
$ 10,960,717 $
$ 13!574,949 $
Amount Due Within One Year
100,338
54,850
50,000
48,004
253,192
24,878
278,070
690,117
18,768
708,885
986,955

COUNTY OF ROCKBRIDGE, VIRGINIA
Notes to Financial Statements (Continued) June 30, 2013
NOTE 7-LONG-TERM OBLIGATIONS: (CONTINUED)
Component Unit- Rockbridge County Regional Jail Commission:
Changes in Long-Term Obligations:
Balance July 1, 2012 Additions Reductions
Net OPEB Obligation (payable from Rockbridge County Regional Jail Commission) $ 27,000 $ 12,000 $ 4,000 $
Compensated Absences (payable from Rockbridge County Regional Jail Commission) 140,301 7,729
Total Long-Term Obligations $ 167,301 $ 19,729 $ 4,000 $
Details of long-term obligations:
Amount Total Due Within
Amount One Year Net OPEB obligation $ 35,000 $
Compensated absences $ 148,030 $ 109,818
Total obligations $ 183 030 $ 109 818
Component Unit- Rockbridge Area Social Services Board:
Changes in Long-Term Obligations:
Balance Issuance/ Retirement! Jul:i 1, 2012 Additions Reductions
Capital lease $ 19,846 $ - $ 12,229
Compensated Absences (payable from Rockbridge Area Social Services Board) 107,677 18,253 Total Long-Term Obligations $ 1271523 $ - $ 30,482
47
Balance June 30, 2013
35,000
148,030
183,030
Balance June 30, 2013
$ 7,617
89,424 $ 97,041

COUNTY OF ROCKBRIDGE, VIRGINIA
Notes to Financial Statements (Continued) June 30, 2013
NOTE 7-LONG-TERM OBLIGATIONS: (CONTINUED)
Component Unit- Rockbridge Area Social Services Board: (continued)
Details of long-term obligations:
Capital Lease:
$36,709 capital lease, issued May 27, 2009, payable in monthly installments of $729, at 7% interest beginning June 2009 and ending May 2014
Compensated absences $
Total Amount
Amount Due Within One Year
7,617 7,617
89,424 53,654
97,041 $ ===61=,2=7=1=
Annual requirements to amortize long-term obligations and related interest are as follows:
Years Ending Capital Leases June 30, Principal Interest
2014 $ 7,617 $ 246 ___ __,_ __ Total $ 7,617 $ 246
Discretely Presented Component Unit-School Board-Indebtedness:
The following is a summary of long-term obligation transactions of the School Board Component Unit for the year ended June 30, 2013:
Balance Jul~ 1, 2012 Additions
Compensated Absences Net OPES Obligation Total
$ 176,443 $ - $ 762,000 199,000
$ 938,443 $ 199,000
Details of long-term obligations:
Compensated absences (payable from the School Fund) Net OPES obligation
Total long-term obligations
48
$
Balance Reductions June 30, 2013
4,385 $ 172,058 961,000
4,385 $ 1 '133,058
Amount Total Due Within
Amount One Year $ 172,058 $ 103,235
961,000 $ 1 '133,058 $ 103,235

COUNTY OF ROCKBRIDGE, VIRGINIA
Notes to Financial Statements (Continued) June 30, 2013
NOTE 8-DEFINED BENEFIT PENSION PLAN:
A. Plan Description
Name of Plan: Virginia Retirement System (VRS) Identification of Plan: Administering Entity:
Agent and Cost-Sharing Multiple-Employer Defined Benefit Pension Plan Virginia Retirement System (System)
All full-time, salaried permanent (professional) employees of public school divisions and employees of participating employers are automatically covered by VRS upon employment. Benefits vest after five years of service credit. Members earn one month of service credit for each month they are employed and their employer is paying into the VRS. Members are eligible to purchase prior public service, active duty military service, certain periods of leave and previously refunded VRS service as service credit in their plan.
VRS administers two defined benefit plans for local government employees - Plan 1 and Plan 2:
• Members hired before July 1, 2010 and who were vested as of January 1, 2013 are covered under Plan 1. Non-hazardous duty members are eligible for an unreduced retirement benefit beginning at age 65 with at least five years of service credit or age 50 with at least 30 years of service credit. They may retire with a reduced benefit early at age 55 with at least five years of service credit or age 50 with at least 1 0 years of service credit.
• Members hired or rehired on or after July 1, 2010 and Plan 1 members who were not vested on January 1, 2013 are covered under Plan 2. Non-hazardous duty members are eligible for an unreduced benefit beginning at their normal Social Security retirement age with at least five years of service credit or when the sum of their age and service equals 90. They may retire with a reduced benefit as early as age 60 with at least five years of service credit.
• Eligible hazardous duty members in Plan 1 and Plan 2 are eligible for an unreduced benefit beginning at age 60 with at least 5 years of service credit or age 50 with at least 25 years of service credit. These members include sheriffs, deputy sheriffs and hazardous duty employees of political subdivisions that have elected to provide enhanced coverage for hazardous duty service. They may retire with a reduced benefit as early as age 50 with at least five years of service credit. All other provisions of the member's plan apply.
The VRS Basic Benefit is a lifetime monthly benefit based on a retirement multiplier as a percentage of the member's average final compensation multiplied by the member's total service credit. Under Plan 1, average final compensation is the average of the member's 36 consecutive months of highest compensation. Under Plan 2, average final compensation is the average of the member's 60 consecutive months of highest compensation. The retirement multiplier for non-hazardous duty members is 1. 70 %. The retirement multiplier for sheriffs and regional jail superintendents is 1.85%. The retirement multiplier for eligible political subdivision hazardous duty employees other than sheriffs and jail superintendents is 1.70% or 1.85% as elected by the employer. The multiplier for Plan 2 members was reduced to 1.65% effective January 1, 2013 unless they are hazardous duty employees and their employer has elected the enhanced retirement multiplier. At retirement, members can elect the Basic Benefit, the Survivor Option, a Partial Lump-Sum Option Payment (PLOP) or the Advance Pension Option. A retirement reduction factor is applied to the Basic Benefit amount for members electing the Survivor Option, PLOP or Advance Pension Option or those retiring with a reduced benefit.
49

COUNTY OF ROCKBRIDGE, VIRGINIA
Notes to Financial Statements (Continued) June 30, 2013
NOTE 8-DEFINED BENEFIT PENSION PLAN (Continued):
A. Plan Description (continued)
Retirees are eligible for an annual cost-of-living adjustment (COLA) effective July 1 of the second calendar year of retirement. Under Plan 1, the COLA cannot exceed 5.00%; under Plan 2, the COLA cannot exceed 6.00%. During years of no inflation or deflation, the COLA is 0.00%. The VRS also provides death and disability benefits. Title 51.1 of the Code of Virginia (1950), as amended, assigns the authority to establish and amend benefit provisions to the General Assembly of Virginia.
The system issues a publicly available comprehensive annual financial report that includes financial statements and required supplementary information for VRS. A copy of the most recent report may be obtained from the VRS Web site at http://www.varetire.org/Pdf/Publications/2012-annual-report.pdf or by writing to the System's Chief Financial Officer at P.O. Box 2500, Richmond, VA, 23218.
B. Funding Policy
Plan members are required by Title 51.1 of the Code of Virginia (1950), as amended, to contribute 5.00% of their compensation toward their retirement. All or part of the 5.00% member contribution may be assumed by the employer. Beginning July 1, 2012 new employees were required to pay the 5% member contribution. In addition, for existing employees, employers were required to begin making the employee pay the 5% member contribution. This could be phased in over a period up to 5 years and the employer is required to provide a salary increase equal to the amount of the increase in the employeepaid member contribution. In addition, the County and School Board are required to contribute the remaining amounts necessary to fund their participation in the VRS using the actuarial basis specified by the Code of Virginia and approved by the VRS Board of Trustees. The County's and School's nonprofessional employee contribution rates for the fiscal year ended 2013 were 13.34% and 7.98%, respectively of annual covered payroll.
The School Board's contributions for professional employees were $1,939,535, $943,498, and $577,090, to the teacher cost-sharing pool for the fiscal years ended June 30, 2013, 2012, and 2011, respectively and these contributions represented 11.66%, 6.33%, and 3.93% for 2013, 2012, and 2011 respectively, of current covered payroll.
Component Unit- Rockbridge County Regional Jail Commission Plan members are required by Title 51.1 of the Code of Virginia (1950), as amended, to contribute 5.00% of their compensation toward their retirement. All or part of the 5.00% member contribution may be assumed by the employer. Beginning July 1, 2012 new employees were required to pay the 5% member contribution. In addition, for existing employees, employers were required to begin making the employee pay the 5% member contribution. This could be phased in over a period up to 5 years and the employer is required to provide a salary increase equal to the amount of the increase in the employeepaid member contribution. In addition, the Commission is required to contribute the remaining amounts necessary to fund participation in the VRS using the actuarial basis specified by the Code of Virginia and approved by the VRS Board of Trustees. The Commission's contribution rate for the fiscal year ended 2013 was 9.86% of annual covered payroll.
50

COUNTY OF ROCKBRIDGE, VIRGINIA
Notes to Financial Statements (Continued) June 30, 2013
NOTE 8-DEFINED BENEFIT PENSION PLAN (Continued):
B. Funding Policy (continued)
Component Unit- Rockbridge County Public Service Authority Plan members are required by Title 51.1 of the Code of Virginia (1950), as amended, to contribute 5.00% of their compensation toward their retirement. All or part of the 5.00% member contribution may be assumed by the employer. Beginning July 1, 2012 new employees were required to pay the 5% member contribution. In addition, for existing employees, employers were required to begin making the employee pay the 5% member contribution. This could be phased in over a period up to 5 years and the employer is required to provide a salary increase equal to the amount of the increase in the employeepaid member contribution. In addition, the Authority is required to contribute the remaining amounts necessary to fund participation in the VRS using the actuarial basis specified by the Code of Virginia and approved by the VRS Board of Trustees. The Authority's contribution rate for the fiscal year ended 2013 was 8.52% of annual covered payroll.
Component Unit- Rockbridge Area Social Services Board Plan members are required by Title 51.1 of the Code of Virginia (1950), as amended, to contribute 5.00% of their compensation toward their retirement. All or part of the 5.00% member contribution may be assumed by the employer. Beginning July 1, 2012 new employees were required to pay the 5% member contribution. In addition, for existing employees, employers were required to begin making the employee pay the 5% member contribution. This could be phased in over a period up to 5 years and the employer is required to provide a salary increase equal to the amount of the increase in the employeepaid member contribution. In addition, the Board is required to contribute the remaining amounts necessary to fund participation in the VRS using the actuarial basis specified by the Code of Virginia and approved by the VRS Board of Trustees. The Board's contribution rate for the fiscal year ended 2013 was 9.14% of annual covered payroll.
C. Annual Pension Cost
For fiscal year 2013, the Primary Government's annual pension cost of $762,643 was equal to the County's required and actual contributions.
For fiscal year 2013, the County School Board's annual pension cost for the Board's non-professional employees was $134,701 which was equal to the Board's required and actual contributions.
For fiscal year 2013, the Rockbridge County Regional Jail Commission's annual pension cost for the Board's non-professional employees was $132,585 which was equal to the Commission's required and actual contributions.
For fiscal year 2013, the Rockbridge County Public Service Authority's annual pension cost of $30,417 was equal to the Authority's required and actual contributions.
For fiscal year 2013, the Rockbridge Area Social Services Board's annual pension cost of $75,830 was equal to the Board's required and actual contributions.
51

COUNTY OF ROCKBRIDGE, VIRGINIA
Notes to Financial Statements (Continued) June 30, 2013
NOTE 8-DEFINED BENEFIT PENSION PLAN (Continued):
C. Annual Pension Cost (Continued)
Trend information for the County and its discretely presented component units is as follows: Annual Percentage Net Pension of APC Pension
Cost (APC) Contributed Obligation Primary Government:
Fiscal year ending June 30, 2013 $ 762,643 Fiscal year ending June 30, 2012 580,976 Fiscal year ending June 30, 2011 588,669
Component Unit - School Board Non-Professional Employees: Fiscal year ending June 30, 2013 $ 134,701 Fiscal year ending June 30, 2012 67,096 Fiscal year ending June 30, 2011 65,169
Component Unit - Rockbridge Regional Jail Commission: Fiscal year ending June 30, 2013 $ 132,585 Fiscal year ending June 30, 2012 137,598 Fiscal year ending June 30, 2011 146,261
Component Unit - Rockbridge County Public Service Authority: Fiscal year ending June 30, 2013 $ 30,417 Fiscal year ending June 30, 2012 29,625 Fiscal year ending June 30, 2011 27,440
Component Unit - Rockbridge Area Social Services Board: Fiscal year ending June 30, 2013 $ Fiscal year ending June 30, 2012 Fiscal year ending June 30, 2011
75,830 60,610 61,217
100% 100% 100%
100% 100% 100%
100% 100% 100%
100% 100% 100%
100% 100% 100%
$
$
$
$
$
The FY 2013 required contribution was determined as part of the June 30, 2011 actuarial valuation using the entry age normal actuarial cost method. The actuarial assumptions at June 30, 2011 included (a) an investment rate of return (net of administrative expenses) of 7.50%, (b) projected salary increases ranging from 3.75% to 5.60% per year for general government employees, 3.755 to 6.20% per year for teachers, and 3.50% to 4.75% for employees eligible for enhanced benefits available to law enforcement officers, firefighters, and sheriffs, and (c) a cost-of-living adjustment of 2.50% per year for Plan 1 employees and 2.25% for Plan 2 employees. Both the investment rate of return and projected salary increases include an inflation component of 2.50%. The actuarial value of the County's and the component units' assets is equal to the modified market value of assets. This method uses techniques that smooth the effects of short-term volatility in the market value of assets over a five-year period. The County's and component units' unfunded actuarial accrued liability is being amortized as a level percentage of projected payrolls on an open basis. The remaining amortization period at June 30, 2011 for the Unfunded Actuarial Accrued Liability (UAAL) was 30 years.
52

COUNTY OF ROCKBRIDGE, VIRGINIA
Notes to Financial Statements (Continued) June 30, 2013
NOTE 8-DEFINED BENEFIT PENSION PLAN: (CONTINUED)
D. Funded Status and Funding Progress:
As of June 30, 2012, the most recent actuarial valuation date, the County's plan was 73.56% funded. The actuarial accrued liability for benefits was $28,278,010, and the actuarial value of assets was $20,802,708, resulting in an unfunded actuarial accrued liability (UAAL) of $7,475,302. The covered payroll (annual payroll of active employees covered by the plan) was $5,366,128, and ratio of the UAAL to the covered payroll was 139.31%. The Rockbridge County Regional Jail Commission Participates in the County's plan and does not have a separate actuarial valuation.
As of June 30, 2012, the most recent actuarial valuation date, the County School Board's nonprofessional plan was 83.16% funded. The actuarial accrued liability for benefits was $7,193,562, and the actuarial value of assets was $5,981,938, resulting in an unfunded actuarial accrued liability (UAAL) of $1,211,624. The covered payroll (annual payroll of active employees covered by the plan) was $1,499,893, and ratio of the UAAL to the covered payroll was 80.78%.
As of June 30, 2012, the most recent actuarial valuation date, the Rockbridge Area Social Services Board's plan was 84.86% funded. The actuarial accrued liability for benefits was $4,686,433, and the actuarial value of assets was $3,977,054, resulting in an unfunded actuarial accrued liability (UAAL) of $709,379. The covered payroll (annual payroll of active employees covered by the plan) was $773,190, and ratio of the UAAL to the covered payroll was 91.75%.
As of June 30, 2012, the most recent actuarial valuation date, the Rockbridge County Public Service Authority's plan was 89.68% funded. The actuarial accrued liability for benefits was $1,234,153, and the actuarial value of assets was $1,106,807, resulting in an unfunded actuarial accrued liability (UAAL) of $127,346. The covered payroll (annual payroll of active employees covered by the plan) was $326,909, and ratio of the UAAL to the covered payroll was 38.95%.
The schedule of funding progress, presented as Required Supplementary Information following the notes to the financial statements presents multiyear trend information about whether the actuarial value of plan assets is increasing or decreasing over time relative to the actuarial accrued liability (AAL) for benefits.
53

COUNTY OF ROCKBRIDGE, VIRGINIA
Notes to Financial Statements (Continued) June 30, 2013
NOTE 9-0THER POSTEMPLOYMENT BENEFITS:
County and Other Participating Entities:
Beginning in fiscal year 2009, the County implemented Governmental Accounting Standards Board (GASB) Statement No. 45 for other postemployment benefits (OPES) offered to retirees. This standard addresses how local governments should account for and report their costs related to postemployment health care and other non-pension benefits. Historically, the plan subsidy was funded on a pay-as-you-go basis, but GASB Statement No. 45 requires that the County accrue the cost of other postemployment benefits during the period of the employees' active employment, while the benefits are being earned, and disclose the unfunded actuarial accrued liability in order to accurately account for the total future costs of postemployment benefits and the financial impact on the County. This funding methodology mirrors the funding approach used for pension benefits.
A. Plan Description
The County offers its employees the option to participate in the group health insurance program offered to other employees upon retirement, through a single-employer defined benefit plan. Employees must meet the age and service criteria for reduced VRS retirement and be a current employee at least 50 years of age and have been employed by the County in a benefits-eligible position for 10 of the last 13 years prior to retirement are eligible to remain enrolled in the health insurance group plan and continue to have the premiums paid for health insurance coverage subject to specific terms. Spouses and dependents listed for coverage by the employee prior to retirement may remain in the group program. Once the employee has retired, only the deletion or termination of coverage will be permitted. Full cost of dependent coverage will be the responsibility of the retired employee. Eligibility for this benefit terminates at the time the retiree obtains other health coverage or reaches the age of 65. Should an employee be granted full retirement by VRS and/or Social Security because of disability, he/she will be eligible to receive the payments made by the County for retirees regardless of age if he/she has been employed by the County for at least 10 years immediately prior to the disability. The County reserves the right to change the terms of the retirees' health insurance coverage at any time, including the right to terminate any or all coverage provided to retirees.
The Rockbridge Landfill and Component Units Rockbridge Regional Jail Commission and Rockbridge Public Service Authority (herein are referred to as Other Participating Entities) are included in this plan.
B. Funding Policy
The Rockbridge County Government establishes employer medical contribution rates for all medical plan participants as part of the budgetary process each year. The County also determines how the plan will be funded each year, whether it will partially fund the plan or fully fund the plan. Retirees pay 100% of spousal premiums. Coverage ceases when retirees reach the age of 65. Surviving spouses are not allowed access to the plan.
C. Annual OPES Cost and Net OPEB Obligation
The annual cost of other post employment benefits (OPES) under GASB 45 is based on the annual required contribution or ARC. The estimated pay as you go cost for OPES benefits is presented in the following table for fiscal year 2013. The County has elected not to pre-fund OPES liabilities. The County is required to contribute the annual required contribution of the employer (ARC), an amount actuarially determined in accordance with the parameters of GASB Statement 45. The ARC represents a level of funding that, if paid on an ongoing basis, is projected to cover normal cost each year and amortize any unfunded actuarial liabilities (of funding excess) over a period not to exceed thirty years.
54

COUNTY OF ROCKBRIDGE, VIRGINIA
Notes to Financial Statements (Continued) June 2013
NOTE 9-0THER POSTEMPLOYMENT BENEFITS: (CONTINUED)
County and Other Participating Entities: (continued)
C. Annual OPEB Cost and Net OPEB Obligation
The following table shows the components of the County and Other Participating entities' annual OPEB cost for the year, the estimated contribution to the Plan, and changes in the County and Other Participating Entities' net OPEB obligation to the Plan:
Rockbridge Rockbridge Rockbridge Public Service
County Regional Jail Landfill Authority Annual Required Contribution (ARC) $ 39,000 $ 12,000 $ 2,000 $ 2,000 Interest on OPEB Obligation 5,000 1,000 Adjustment to ARC (5,000) (1 ,000) Annual OPEB Cost $ 39,000 $ 12,000 $ 2,000 $ 2,000 Contributions Made (29,000) (4,000) (2,000) Increase in Net OPEB Obligation $ 10,000 $ 8,000 $ - $ 2,000 Net OPEB Obligation -beginning of year 110,000 27,000 2,000 10,000 Net OPEB Obligation - end of year $ 120,000 $ 35,000 $ 2,000 $ 12,000
For fiscal year 2013, the County's expected cash payment of $29,000 was $10,000 short of the OPEB cost.
For fiscal year 2013, the Rockbridge Regional Jail Commission's expected cash payment of $4,000 was $8,000 short of the OPEB cost.
For fiscal year 2013, the Rockbridge Landfill's expected cash payment was equal to the OPEB cost.
For fiscal year 2013, the Rockbridge Public Service Authority's expected cash payment of $0 was $2,000 short of the OPEB cost.
55

COUNTY OF ROCKBRIDGE, VIRGINIA
Notes to Financial Statements (Continued) June 30, 2013
NOTE 9-0THER POSTEMPLOYMENT BENEFITS: (CONTINUED)
County and Other Participating Entities: (continued)
c. Annual OPEB Cost and Net OPEB Obligation (continued)
The plan's annual OPEB cost, the percentage of annual OPEB cost contributed to the plan, and the net OPEB obligation for 2013 and the two preceding years are as follows:
Annual OPEB Cost: Percentage of Annual
Fiscal Annual OPEB Net Year OPEB Cost OPEB
Ended Cost Contributed Obligation County June 30, 2013 $ 39,000 74.36% $ 120,000
June 30, 2012 46,000 67.39% 110,000 June 30, 2011 43,000 44.19% 95,000
Rockbridge Regional Jail June 30, 2013 12,000 33.33% 35,000 June 30, 2012 14,000 42.86% 19,000 June 30, 2011 17,000 50.00% 12,000
Rockbridge Landfill June 30, 2013 2,000 100.00% 2,000 June 30, 2012 1,000 0.00% 2,000 June 30, 2011 1,000 100.00% 2,000
Rockbridge Public Service Authority June 30, 2013 2,000 0.00% 12,000
June 30, 2012 3,000 123.33% 10,000 June 30, 2011 3,000 0.00% 8,000
D. Funded Status and Funding Progress
The funded status of the plan as of June 30, 2012 is as follows:
Actuarial accrued liability (AAL) Actuarial value of plan assets Unfunded actuarial accrued liability Funded ratio (actuarial value of plan assets/AAL) Covered payroll (active plan members) UAAL as a percentage of covered payroll
$
$
$
448,000
448,000 0%
6,655,000 6.73%
Actuarial valuations of an ongoing plan involve estimates of the value of reported amounts and assumptions about the probability of occurrence of events far into the future. Examples include assumptions about future employment, mortality, and the healthcare cost trend. Amounts determined regarding the funded status of the plan and the annual required contributions of the employer are subject to continual revisions as actual results are compared with past expectations and new estimates are made about the future.
56

COUNTY OF ROCKBRIDGE, VIRGINIA
Notes to Financial Statements (Continued) June 30, 2013
NOTE 9-0THER POSTEMPLOYMENT BENEFITS PROGRAM: (CONTINUED)
County and Other Participating Entities: (continued)
D. Funded Status and Funding Progress (continued)
The schedule of funding progress, presented as required supplementary information following the notes to the financial statements, presents multiyear trend information about whether the actuarial value of plan assets is increasing or decreasing over time relative to the actuarial accrued liabilities for benefits.
E. Actuarial Methods and Assumptions
Projections of benefits for financial reporting purposes are based on the substantive plan (the plan as understood by the employer and the plan members) and include the types of benefits provided at the time of each valuation and the historical pattern of sharing of benefit costs between the employer and plan members to that point. The actuarial methods and assumptions used include techniques that are designed to reduce the effects of short-term volatility in actuarial accrued liabilities and the actuarial value of assets, consistent with the long-term perspective of the calculations.
Cost Method
The Entry Age Normal cost method is used to determine the Plan's funding liabilities and costs. Under this method, the actuarial present value of projected benefits of every active Participant as if the Plan's provisions on the valuation date had always been in effect, is determined as a level percentage of expected annual earnings for each future year of expected service. A normal cost for each year from the assumed entry date is determined by applying this level percentage of pay to the assumed earnings for that year (or if benefits are not pay related, the level amount for each year). Under this method, inactive Participants have no normal cost, and the actuarial liability is the present value of the plan benefits to which they and their beneficiaries are entitled. The Plan's total annual normal cost and actuarial liability are the sum of the individual Participant amounts. An experience gain or loss is a decrease or increase in the unfunded actuarial liability attributable to actual experience that differed from that expected by the actuarial assumptions. Such gains or losses are explicitly recognized under this method. Data is net of any retiree contributions. The UAAL is being amortized on an open basis. The remaining amortization at July 1, 2012 was 20 years.
Interest Assumptions Discount rate Payroll growth
School Board Health Insurance Plan
A. Plan Description
Not funded 4%
2.50%
The Rockbridge County School Board offers its employees the option to participate in the group health insurance program offered to other employees upon retirement, through a single-employer defined benefit plan. Employees must meet the age and service criteria for reduced VRS retirement and be a current employee at least 50 years of age and have been employed by the School Board in a benefits-eligible position for 10 of the last 13 years prior to retirement are eligible to remain enrolled in the health insurance group plan and continue to have the premiums paid for health insurance coverage subject to specific terms. Spouses and dependents listed for coverage by the employee prior to retirement may remain in the group program. Once the employee has retired, only the deletion or termination of coverage will be permitted.
57
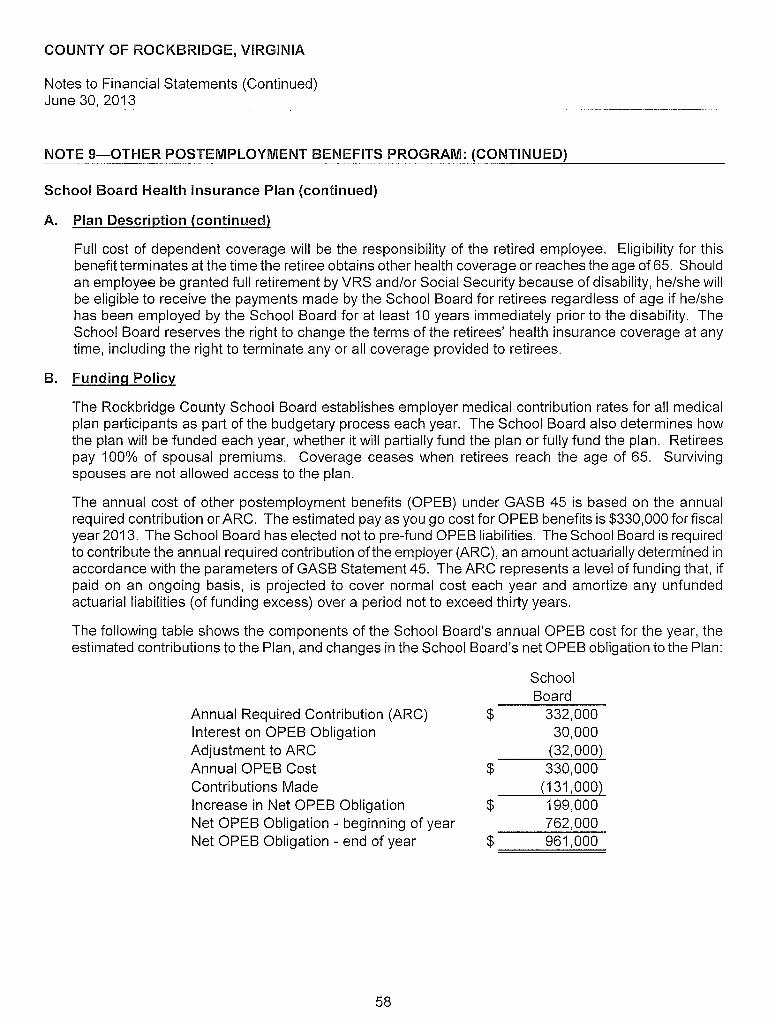
COUNTY OF ROCKBRIDGE, VIRGINIA
Notes to Financial Statements (Continued) June 30, 2013
NOTE 9-0THER POSTEMPLOYMENT BENEFITS PROGRAM: (CONTINUED)
School Board Health Insurance Plan (continued)
A. Plan Description (continued)
Full cost of dependent coverage will be the responsibility of the retired employee. Eligibility for this benefit terminates at the time the retiree obtains other health coverage or reaches the age of 65. Should an employee be granted full retirement by VRS and/or Social Security because of disability, he/she will be eligible to receive the payments made by the School Board for retirees regardless of age if he/she has been employed by the School Board for at least 10 years immediately prior to the disability. The School Board reserves the right to change the terms of the retirees' health insurance coverage at any time, including the right to terminate any or all coverage provided to retirees.
B. Funding Policy
The Rockbridge County School Board establishes employer medical contribution rates for all medical plan participants as part of the budgetary process each year. The School Board also determines how the plan will be funded each year, whether it will partially fund the plan or fully fund the plan. Retirees pay 100% of spousal premiums. Coverage ceases when retirees reach the age of 65. Surviving spouses are not allowed access to the plan.
The annual cost of other postemployment benefits (OPES) under GASB 45 is based on the annual required contribution or ARC. The estimated pay as you go cost for OPES benefits is $330,000 for fiscal year 2013. The School Board has elected not to pre-fund OPES liabilities. The School Board is required to contribute the annual required contribution of the employer (ARC), an amount actuarially determined in accordance with the parameters of GASB Statement 45. The ARC represents a level of funding that, if paid on an ongoing basis, is projected to cover normal cost each year and amortize any unfunded actuarial liabilities (of funding excess) over a period not to exceed thirty years.
The following table shows the components of the School Board's annual OPES cost for the year, the estimated contributions to the Plan, and changes in the School Board's net OPES obligation to the Plan:
Annual Required Contribution (ARC) Interest on OPES Obligation Adjustment to ARC Annual OPES Cost Contributions Made Increase in Net OPES Obligation Net OPES Obligation - beginning of year Net OPES Obligation - end of year
58
$
$
$
School Board
332,000 30,000
(32,000) 330,000
(131 ,000) 199,000 762,000
$ ===9=6=1 '=00=0=

COUNTY OF ROCKBRIDGE, VIRGINIA
Notes to Financial Statements (Continued) June 30, 2013
NOTE 9-0THER POSTEMPLOYMENT BENEFITS PROGRAM: (CONTINUED)
School Board Health Insurance Plan (continued)
B. Funding Policy (continued)
C.
Annual OPEB Cost. For 2013, the School Board's expected cash payment of $233,000 is $199,000 less than the OPES cost (expense) of $332,000. The Government's annual OPES cost, the percentage of annual OPES cost contributed to the plan, and the net OPES obligation for 2012 and the two preceding years are as follows:
Fiscal Annual Percentage of Net Year OPEB Annual OPES OPEB
Ended Cost Cost Contributed Obligation
June 30, 2013 $ 330,000 40% June 30, 2012 399,000 58% June 30, 2011 387,000 52%
Funded Status and Funding Progress
The funded status of the plan as of June 30, 2012 is as follows:
Actuarial accrued liability (AAL) Actuarial value of plan assets Unfunded actuarial accrued liability Funded ratio (actuarial value of plan assets/AAL) Covered payroll (active plan members) UAAL as a percentage of covered payroll
$
$ 4,290,000
4,290,000 0%
$ 16,081,000 26.68%
961,000 762,000 596,000
Actuarial valuations of an ongoing plan involve estimates of the value of reported amounts and assumptions about the probability of occurrence of events far into the future. Examples include assumptions about future employment, mortality, and the healthcare cost trend. Amounts determined regarding the funded status of the plan and the annual required contributions of the employer are subject to continual revisions as actual results are compared with past expectations and new estimates are made about the future.
The schedule of funding progress, presented as required supplementary information following the notes to the financial statements, presents multiyear trend information about whether the actuarial value of plan assets is increasing or decreasing over time relative to the actuarial accrued liabilities for benefits.
D. Actuarial Methods and Assumptions
Projections of benefits for financial reporting purposes are based on the substantive plan (the plan as understood by the employer and the plan members) and include the types of benefits provided at the time of each valuation and the historical pattern of sharing of benefit costs between the employer and plan members to that point. The actuarial methods and assumptions used include techniques that are designed to reduce the effects of short-term volatility in actuarial accrued liabilities and the actuarial value of assets, consistent with the long-term perspective of the calculations.
59

COUNTY OF ROCKBRIDGE, VIRGINIA
Notes to Financial Statements (Continued) June 30, 2013
NOTE 9-0THER POSTEMPLOYMENT BENEFITS PROGRAM: (CONTINUED)
School Board Health Insurance Plan (continued)
D. Actuarial Methods and Assumptions (continued)
Cost Method
The Entry Age Normal cost method is used to determine the Plan's funding liabilities and costs. Under this method, the actuarial present value of projected benefits of every active Participant as if the Plan's provisions on the valuation date had always been in effect, is determined as a level percentage of expected annual earnings for each future year of expected service. A normal cost for each year from the assumed entry date is determined by applying this level percentage of pay to the assumed earnings for that year (or if benefits are not pay related, the level amount for each year). Under this method, inactive Participants have no normal cost, and the actuarial liability is the present value of the plan benefits to which they and their beneficiaries are entitled. The Plan's total annual normal cost and actuarial liability are the sum of the individual Participant amounts. An experience gain or loss is a decrease or increase in the unfunded actuarial liability attributable to actual experience thqt differed from that expected by the actuarial assumptions. Such gains or losses are explicitly recognized under this method. Data is net of any retiree contributions. The UAAL is being amortized on an open basis. The remaining amortization at July 1, 2010 was 20 years.
Interest Assumptions Discount rate Payroll growth
VRS Health Insurance Credit Program
A. Plan Description
Not funded 4%
2.50%
The School Board participates in the Health Insurance Credit Program, a plan designed to assist retirees with the cost of health insurance coverage. This program is a cost sharing, multiple-employer defined benefit plan administered by the Virginia Retirement System (VRS). The Virginia General Assembly established the dollar amount of the health insurance credit for each year of creditable service. The credit amount and eligibility differs for state, school division, political subdivision, local officer, local social services department and general registrar retirees.
A teacher, who retires under VRS with at least 15 years of total creditable service under the System and is enrolled in a health insurance plan, is eligible to receive a monthly health insurance credit of $4 per year of creditable service. However, such credit shall not exceed the health insurance premium for the retiree. Disabled retirees automatically receive a monthly health insurance credit of $4 multiplied by the smaller of (i) twice the amount of their creditable service of (ii) the amount of creditable service they would have completed at 60 if they had remained in service to that age.
Benefit provisions and eligibility requirements are established by Title 51.1, Chapter 14 of the Code of Virginia. The VRS actuarially determines the amount necessary to fund all credits provided, reflects the cost of such credits in the applicable employer contribution rate pursuant to §51.1-145, and prescribes such terms and conditions as are necessary to carry out the provisions of the health insurance credit program. VRS issues separate financial statements as previously discussed in Note 8.
60

COUNTY OF ROCKBRIDGE, VIRGINIA
Notes to Financial Statements (Continued) June 30, 2013
NOTE 9-0THER POSTEMPLOYMENT BENEFITS: (CONTINUED)
VRS Health Insurance Credit Program (continued)
B. Funding Policy
The School Board is required to contribute, at an actuarially determined rate, the entire amount necessary to fund participation in the program. The current rate is 1.1% of annual covered payroll. The School Board's contributions to VRS for the years ended June 30, 2013, 2012, and 2011 were $179,165, $89,464, and $88,130, respectively and equaled the required contributions for each year.
NOTE 10-DEFERRED INFLOWS/OUTFLOWS OF RESOURCES:
Deferred inflows of resources totaling $7,984,173 is comprised of the following:
A. Prepaid Property Taxes: Property taxes due subsequent to June 30, 2013 but paid in advance by taxpayers totaled $407,793 at June 30, 2013.
B. Unbilled Property Taxes: Property taxes for the second half of 2013 that had not been billed as of June 30, 2013 amounted to $7,576,380.
Deferred outflows of resources totaling $1,121 ,006 is comprised of the following:
A. Deferred Charge on Refunding: Deferred inflows representing gain on refunding of debt but not available for funding of current expenditures totaled $1,121 ,006 at June 30, 2013.
NOTE 11-CONTINGENT LIABILITIES:
Federal programs in which the County participates were audited in accordance with the provisions of U.S. Office of Management and Budget Circular A-133, Audits of States, Local Governments, and Non-Profit Organizations. Pursuant to the provisions of this circular all major programs and certain other programs were tested for compliance with applicable grant requirements.
While no matters of noncompliance were disclosed by audit, the federal government may subject grant programs to additional compliance tests which may result in disallowed expenditures. In the opinion of management, any future disallowances of current grant program expenditures, if any, would be immaterial.
NOTE 12-DEPOSITS AND INVESTMENTS:
Deposits: Deposits with banks are covered by the Federal Deposit Insurance Corporation (FDIC) and collateralized in accordance with the Virginia Security for Public Deposits Act (the "Act") Section 2.2-4400 et. seq. of the Code of Virginia. Under the Act, banks and savings institutions holding public deposits in excess of the amount insured by the FDIC must pledge collateral to the Commonwealth of Virginia Treasury Board. Financial Institutions may choose between two collateralization methodologies and depending upon that choice, will pledge collateral that ranges in the amounts from 50% to 130% of excess deposits. Accordingly, all deposits are considered fully collateralized.
61

COUNTY OF ROCKBRIDGE, VIRGINIA
Notes to Financial Statements (Continued) June 30, 2013
NOTE 12-DEPOSITS AND INVESTMENTS: (CONTNUED)
Investments: Statutes authorize the County and its discretely component units to invest in obligations of the United States or agencies thereof, obligations of the Commonwealth of Virginia or political subdivisions thereof, obligations of the International Bank for Reconstruction and Development (World Bank), the Asian Development Bank, the African Development Bank, prime quality commercial paper and certain corporate notes, banker's acceptances, repurchase agreements, and State' Treasurer's Local Government Investment Pool (LGIP).
Credit Risk of Debt Securities
The County investment policy for credit risk is consistent with the investments allowed by statutes as detailed above.
The County and its discretely presented component units rated debt investments as of June 30, 2013 were rated by Standard & Poor's and the ratings are presented below using the Standard & Poor's rating scale.
Rated Debt Investments' Values Rated Debt Investments
Local Government Investment Pool SNAP External Investment Pool
Total
External Investment Pool
Fair Quality Ratings AAAm
$ 10,001 ,654 7,327,109
$ 17 328 763
The fair value of the positions in the Local Government Investment Pool (LGIP) are the same as the value of the pool shares. As this pool is not SEC registered, regulatory oversight of the pool rests with the Virginia State Treasury. LGIP maintains a policy to operate in a manner consistent with SEC Rule 2a-7. The State Non-arbitrage Pool (SNAP) is an open-end management investment company registered with the Securities and Exchange Commission (SEC).
Interest Rate Risk All County investments must be in securities maturing within five years.
NOTE 13-COMMITMENTS AND CONTINGENCIES:
The County and the City of Lexington entered into a modified voluntary settlement of Annexation and Immunity Agreement on May 6, 1986. This agreement is based on real estate assessed values and on non property local taxes. The amount due the City of Lexington is payable on January 1 of each year. Included in these financial statements is the payment for the year ended June 30, 2012 in the amount of $1,718,759. The amount to be paid on January 1, 2014, and which is not included in the financial statements, totals $1,742,885 for the fiscal year ended June 30, 2013.
The Government had the following material construction contracts outstanding at June 30, 2013:
Project Component units: School Board:
Maury River Middle School Total School Board
Contractor
MB Contractors, Inc.
62
Original Contract Amount
$ 23,955,000 $ 23,955,000
Amount of Amount Contract Spent Remaining
to Date at Year End
$ 19,662,579 $ 4,292,421 $ 19,662,579 $ 4,292,421

COUNTY OF ROCKBRIDGE, VIRGINIA
Notes to Financial Statements (Continued) June 30, 2013
NOTE 14-CAPITAL ASSETS:
Capital asset activity for the year ended June 30, 2013 was as follows:
Primary Government:
Beginning Ending
Balance Increases Decreases Balance
Governmental activities:
Capital assets not being depreciated:
Land $ 2,393,836 $ - $ - $ 2,393,836
Construction in progress 4,241,442 29,464,965 33,706,407
Total capital assets not being
depreciated $ 6,635,278 $ 29,464,965 $ - $ 36,100,243
Capital assets being depreciated:
Buildings and improvements $ 53,374,524 $ 57,425 $ (4,635,264) $ 48,796,685
Machinery and equipment 3,092,084 307,503 (331 ,078) 3,068,509
Total capital assets being
depreciated $ 56,466,608 $ 364,928 $ (4,966,342) $ 51,865,194
Accumulated depreciation:
Buildings and improvements $ (7,342,938) $ (856,799) $ 219,593 $ (7,980,144)
Machinery and equipment (2,298, 196) (243,663) 252,818 (2,289,041)
Total accumulated depreciation $ (9,641,134) $ (1 '1 00,462) $ 472,411 $ (10,269,185)
Total capital assets being
depreciated, net $ 46,825,474 $ (735,534) $ (4,493,931) $ 41,596,009
Governmental activities capital
assets, net $ 53,460,752 $ 28,729,431 $ (4,493,931~ $ 77,696,252
Business-type activities:
Capital assets not being depreciated:
Land $ 540,137 $ - $ - $ 540,137
Construction in progress 589,282 384,376 (832,666) 140,992
Total capital assets not being
depreciated $ 1,129,419 $ 384,376 $ (832,666) $ 681 '129 Capital assets being depreciated:
Buildings and improvements $ 1,583,181 $ 832,666 $ - $ 2,415,847
Machinery and equipment 1 '141 ,876 325,841 1,467,717
Total capital assets being depreciated $ 2,725,057 $ 1,158,507 $ - $ 3,883,564
Accumulated depreciation:
Buildings and improvements $ (889,133) $ (93,153) $ - $ (982,286)
Machinery and equipment (1 ,044,463) (46,340) (1 ,090,803)
Total accumulated depreciation $ (1 ,933,596) $ (139,493) $ - $ (2,073,089)
Total capital assets being
depreciated, net $ 791,461 $ 1,019,014 $ - $ 1,810,475
Business-type activities
capital assets, net $ 1,920,880 $ 1,403,390 $ {832,666~ $ 2,491,604
63

COUNTY OF ROCKBRIDGE, VIRGINIA
Notes to Financial Statements (Continued) June 30, 2013
NOTE 14-CAPITAL ASSETS: (CONTINUED)
Primary Government: (continued)
Depreciation expense was charged to functions/programs of the primary government as follows:
Governmental activities:
General government administration
Public safety
Public works Parks, recreation, and cultural
Community Development
$ 812,916
156,124 18,543
101,529
11,350
Total depreciation expense-governmental activities
Business-type activities: $ ===1:!:::::, 1=00=·=46=2=
Solid Waste Authority Total depreciation expense-business-type activities
$ __ ___..:1..::..39~·~49:..:3:..._
$ ======1=39=·=49=3=
Discretely Presented Component Unit-School Board:
Capital asset activity for the School Board for the year ended June 30, 2013 was as follows:
Beginning Balance Increases Decreases
Capital assets not being depreciated: Land $ 117,555 $ - $ - $ Construction in progress 2,519,686 {2,519,686}
Total capital assets not being depreciated $ 2,637,241 $ - $ {2,519,686} $
Capital assets being depreciated: Buildings and improvements $ 28,349,055 $ 4,929,206 $ - $ Machinery and equipment 4,298,898 436,295 {420,779}
Total capital assets being depreciated $ 32,647,953 $ 5,365,501 $ {420,779} $
Accumulated depreciation: Buildings and improvements $ (13,782,583) $ (1,316,377) $ - $ Machinery and equipment {3,260,215} {348,904} 366,427
Total accumulated depreciation $ {17,042,798} $ {1,665,281} $ 366,427 $ Total capital assets being
depreciated, net $ 15,605,155 $ 3,700,220 $ {54,352} $ School Board capital assets, net $ 18,242,396 $ 3,700,220 $ (2,574,038} $
64
Ending Balance
117,555
117,555
33,278,261 4,314,414
37,592,675
(15,098,960) {3,242,692}
{18,341,652}
19,251,023 19,368,578

COUNTY OF ROCKBRIDGE, VIRGINIA
Notes to Financial Statements (Continued) June 30, 2013
NOTE 14-CAPITAL ASSETS: (CONTINUED)
Discretely Presented Component Unit-School Board: (continued)
Reconciliation of increases in accumulated depreciation to depreciation expense:
Depreciation expense $ 1,445,688
Transfer of accumulated depreciation from primary government for corresponding debt financed assets 219,593 Net increase in accumulated depreciation $ 1,665,281
a. Legislation enacted during the year ended June 30, 2002, Section 15.2-1800.1 of the Code of Virginia, 1950, as amended, has changed the reporting of local school capital assets and related debt for financial statement purposes. Historically, debt incurred by local government on-behalf of school boards was reported in the school board's discrete column along with the related capital assets. Under the new law, local governments have a tenancy in common with the school board whenever the locality incurs any financial obligation for any school property which is payable over more than one fiscal year. For financial reporting purposes, the legislation permits the locality to report the portion of school property related to any outstanding financial obligation eliminating any potential deficit from capitalizing assets financed with debt. The effect on the County of Rockbridge, Virginia for the year ended June 30, 2013, is that school financed assets in the amount of $39,126,978 are reported in the Primary Government for financial reporting purposes.
Discretely Presented Component Unit-Rockbridge Area Social Services Board:
Capital asset activity for the Social Services Board for the year ended June 30, 2013 was as follows:
Beginning Ending Balance Additions Balance
Capital assets being depreciated: Equipment $ 75,693 $ - $ 75,693 Vehicle 73,036 73,036 Furniture and fixtures 8,857 8,857
Total capital assets being depreciated $ 157,586 $ - $ 157,586 Accumulated depreciation
Equipment $ (70,893) $ (1,200) $ (72,093) Vehicle (62,642) (1 0,393) (73,035) Furniture and fixtures (8,857) (8,857)
Total accumulated depreciation $ (142,392) $ (11,593) $ (153,985) Net capital assets $ 15,194 $ {11,593} $ 3,601
Depreciation expense for the year ended June 30, 2013 was $11,593.
65

COUNTY OF ROCKBRIDGE, VIRGINIA
Notes to Financial Statements (Continued) June 30, 2013
NOTE 14-CAPITAL ASSETS: (CONTINUED)
Component Unit-Regional Jail Commission:
A summary of capital assets is summarized below:
Capital assets not being depreciated Construction in progress $
Capital assets being depreciated: Jail facility $ Food service equipment
Washers/dryers Communications
Office equipment Telephone system
Other equipment Total capital assets being depreciated $
Accumulated depreciation Net capital assets $
Beginning Balance
151,053 $
3,711,513 $ 73,170
20,253
7,106
98,157 24,765
229,857 4,164,821 $
(2,844,618) 1,471,256 $
Depreciation expense for the fiscal year totaled $105,845.
66
Ending Additions Balance
- $ 151,053
- $ 3,711,513 73,170
20,253
7,106
98,157 24,765
42,117 271,974
42,117 $ 4,206,938 (105,845) (2,950,463)
{63,728} $ 1,407,528

COUNTY OF ROCKBRIDGE, VIRGINIA
Notes to Financial Statements (Continued) June 30, 2013
NOTE 14-CAPITAL ASSETS: (CONTINUED)
Component Unit-Rockbridge County Public Service Authority:
A summary of changes in capital assets for the year ended June 30, 2013 follows:
Beginning Balance Increases Decreases
Capital assets not being depreciated: Land $ 369,989 $ 11,270 $ - $ Construction in progress 773,782 1,771,366 ~743,882}
Total capital assets not being depreciated $ 1,143,771 $ 1,782,636 $ ~743,882} $
Capital assets being depreciated: Buildings and improvements $ 176,866 $ - $ - $ Machinery and equipment 357,300 306,329 (3,373) Utility plant and equipment 33,835,274 516,524 ~22,747}
Capital assets being depreciated $ 34,369,440 $ 822,853 $ ~26,120} $ Accumulated depreciation
Buildings and improvements $ (91 ,481) $ (4,422) $ - $ Machinery and equipment (326,286) (44,209) 3,373 Utility plant and equipment {9,784,856} ~825,841} 22,508 Total accumulated depreciation $ ~10,202,623} $ {874,472} $ 25,881 $
Capital assets being depreciated, net $ 24,166,817 $ {51,619} $ {239} $ Net capital assets $ 25,310,588 $ 1 731 017 $ {744,121} $
Depreciation expense for the fiscal year totaled $874,472.
NOTE 15-ADVANCES TO/FROM PARTICIPATING ENTITIES:
Ending Balance
381,259 1,801,266
2,182,525
176,866 660,256
34,329,051 35,166,173
(95,903) (367,122)
{1 0,588,189} {11,051,214} 24,114,959 26,297,484
The general fund has established an asset for advances to other entities in the amount of $1,683,691. This is comprised of advances to the component unit Rockbridge Public Service Authority and the Solid Waste Authority in the amounts of $1,620,212 and $63,479, respectively.
The Solid Waste Authority has established a liability for advances from participating localities as follows:
Balance Balance July 1, Increase June 30, 2012 {Decrease~ 2013
City of Lexington $ 5,303 $ - $ 5,303 City of Buena Vista 5,510 5,510 Rockbridge County 63,479 63,479 Total $ 74,292 $ - $ 74,292
67

COUNTY OF ROCKBRIDGE, VIRGINIA
Notes to Financial Statements (Continued) June 30, 2013
NOTE 16-LANDFILL CLOSURE AND POST-CLOSURE CARE COST:
The Solid Waste Authority owns the only permitted landfill site within the County of Rockbridge. The Cities of Lexington and Buena Vista also use the landfill site. Landfill costs are prorated to each jurisdiction based on tonnage of solid waste accepted each month. The County of Rockbridge is responsible for the management and operation of the landfill. Rockbridge County's share of tonnage has historically been approximately 70%, the City of Lexington's share has been approximately 20%, and Buena Vista's approximately 10%.
State and federal laws and regulations require the Solid Waste Authority to place a final cover on the landfill site when it is filled to capacity or stops accepting waste and to perform certain maintenance and monitoring functions at the site for thirty years after closure. Although closure and post-closure care costs will be paid only near or after the date that the landfill stops accepting waste, the Solid Waste Authority reports a portion of these closure and post-closure care costs as an operating expense in each period based on landfill capacity at each balance sheet date.
The landfill began operation during 1972 and currently has an estimated capacity to last until the year 2014. The $1,916,329 reported as accrued closure and post-closure liability at June 30, 2013 represents the cumulative amount reported based on the estimated number of years remaining (one). The Authority expects to close the landfill in the year 2014. The estimated total current cost of the landfill closure and post-closure care of $1,916,329 is based on the amount that would be paid if all equipment, facilities and services required to close, monitor and maintain the landfill were acquired as of June 30, 2013. Actual costs may be higher due to inflation, changes in technology, or changes in regulations. The Solid Waste Authority intends to fund these costs from tipping revenues and from any funds derived and accumulated for this purpose in the upcoming years.
The County demonstrated financial assurance requirements for closure, post-closure care, and corrective action costs through the submission of a Local Government Financial Assurance Test to the Virginia Department of Environmental Quality in accordance with Section 9VA C20-70 of the Virginia Administrative Code.
NOTE 17-RISK MANAGEMENT:
The County is exposed to various risks of loss related to torts; theft of, damage to, and destruction of assets; errors and omissions; injuries to employees; and natural disasters. The County carries commercial insurance for all of these risks of loss. Settled claims resulting from these risks have not exceeded commercial insurance coverage in any of the past three fiscal years.
68

COUNTY OF ROCKBRIDGE, VIRGINIA
Notes to Financial Statements (Continued) June 30, 2013
NOTE 18-SURETY BONDS:
The County had the following surety bonds on hand at June 30, 2013:
Department of Treasury - Division of Rick Management D. Bruce Patterson, Clerk of the Circuit Court Betty S. Trovato, Treasurer David C. Whitesell, Commissioner of the Revenue Christopher J. Blalock, Sheriff Above constitutional officers' employees-blanket bond
VACORP Rhonda Humprhies, Clerk of the School Board Blanket position - all employees
NOTE 19-INTERFUND TRANSFERS:
$
Amount
230,000 400,000
3,000 30,000 50,000
10,000 250,000
lnterfund transfers for the year ended June 30, 2013 consisted of the following:
Fund Transfers In Transfers Out
Primary Government:
General Fund $ - $ 1,234,972
Landfill Fund 139,993
Recycling Fund 1,094,979
Total $ 1,234,972 $ 1,234,972
Transfers are used to (1) move revenues from the fund that statute or budget requires to collect them to the fund that statute or budget requires to expend them and (2) use unrestricted revenues collected in the General Fund to finance various programs accounted for in other funds in accordance with budgeting authorization.
69

COUNTY OF ROCKBRIDGE, VIRGINIA
Notes to Financial Statements (Continued) June 30, 2013
NOTE 20-CAPITAL LEASES:
The government has financed the acquisition of sheriff's vehicles and landfill equipment by means of capital leases. These lease agreements qualify as capital leases for accounting purposes and therefore, have been recorded at their present values of their future minimum lease payments as of the inception date.
The assets acquired through capital leases are as follows:
Assets: Machinery and equipment Accumulated depreciation Total
$
$
Governmental Activities
371,950 $ (164,797)
Component-unit Social Services
Board
52,088 (52,088)
207154 $============
The future minimum lease obligations and the net present value of minimum lease payments as of June 30, 2013, are as follows:
Year Ended June 30, 2014 2015 Total minimum lease payments Amount representing interest Present value of minimum lease payments
NOTE 21-CURRENT REFUNDING:
$
$
$
Governmental Activities
122,784 $ 53,779
Component-unit Social Services
Board 7,787
176,563 $ 7,787 (3,048) (170)
173,515 $ ====7=,6=17=
On May 9, 2013, the County issued and $1,435,000 general obligation bond, Series 2013A (Refunding Bond) and sold it to the Virginia Public School Authority (VPSA). The proceeds from the issuance and sale of the current refunding bond were used to redeem, refinance, and refund the outstanding principal amount of the County for one literary loan in the amount of $1,600,000. The net carrying amount (including premium) of the new debt equaled the carrying amount of the old debt. The current refunding was undertaken to reduce total debt service payments over the next sixteen years by $212,188 and resulted in total net present value savings of $200,956 for the County.
NOTE 22-ADVANCE REFUNDING:
The government issued $11,760,000 in revenue bonds at interest rates ranging from 4.261% to 4.823%. The proceeds were used to advance refund $11,965,000 of outstanding 2005 Series C, public improvement bonds which had interest rates ranging from 3.5% to 5.0%. The net proceeds of$13,531 ,014 (including a $1,777,014 premium, and after payment of $252,391 in underwriting fees, and other issuance costs) were deposited in an irrevocable trust with an escrow agent to provide funds for the future debt services payment on the refunding bonds. As a result, the 2005 Series C, 2005 Series B revenue bonds are considered defeased and the liability for those bonds has been removed from the statement of net position.
70

COUNTY OF ROCKBRIDGE, VIRGINIA
Notes to Financial Statements (Continued) June 30, 2013
NOTE 22-ADVANCE REFUNDING: (CONTINUED)
The reacquisition price exceeded the net carrying amount of the old debt by $1,121,006. This amount is being amortized over the remaining life of the refunding debt. The government advance refunded the 2005 Series C revenue bonds to obtain an economic gain (difference between the present values of the debt service payments on the old and new debt) of $742,744.
NOTE 23-BEGINNING FUND BALANCE/NET POSITION RESTATEMENT:
The beginning fund balance/net position of the General Fund, Governmental Activities and Business-type Activities (Solid Waste Authority) was adjusted to record advances to other entities not previously recorded, reclassify equipment and write off bond issue costs in accordance with GASB Statement No. 65-ltems Previously Reported as Assets and Liabilities as follows:
General Governmental Business-Type Fund Activities Activities
Fund Balance/Net position at July 1, 2012 as $ originally reported 19,116,254
$ 31,143,791 $ 2,922.487
To adjust for due from other entities-Rockbridge County PSA not previously recorded 1,259,130 1,259,130 To adjust for landfill excavator equipment originally recorded in the governmental activities (17,350) 17,350 To adjust for write-off of bond issue costs in accordance with GASB Statement No. 65. {25,753~ Fund Balance/Net position at July 1, 2012 as restated $ 20,375,384 $ 32,385,571 $ 2,914,084
NOTE 24-UPCOMING PRONOUNCEMENTS:
The GASB has issued Statement No. 68, "Accounting and Financial Reporting for Pensions; an amendment of GASB Statement No. 27." This Statement replaces the requirements of Statements No. 27 and No. 50 related to pension plans that are administered through trusts or equivalent arrangements. The requirements of Statements No. 27 and No. 50 remain applicable for pensions that are not administered as trusts or equivalent arrangements. The requirements of this Statement are effective for financial statements for fiscal years beginning after June 15, 2014. The County has not determined the impact of this pronouncement on its financial statements.
71

THIS PAGE LEFT BLANK INTENTIONALLY

REQUIRED SUPPLEMENTARY INFORMATION


County of Rockbridge, Virginia Exhibit 11 General Fund Schedule of Revenues, Expenditures, and Changes in Fund Balances - Budget and Actual For the Year Ended June 30, 2013
Variance with Budgeted Amounts Final Budget -
Actual Positive Original Final Amounts (Negative)
REVENUES General property taxes $ 21,049,684 $ 21,048,410 $ 22,414,930 $ 1,366,520 Other local taxes 7,937,700 7,937,850 8,157,801 219,951 Permits, privilege fees, and regulatory licenses 208,500 208,500 172,766 (35,734) Fines and forfeitures 171,000 171,000 235,024 64,024 Revenue from the use of money and property 74,000 74,000 53,549 (20,451) Charges for services 1,345,100 1 ,345,100 1 ,482,185 137,085 Miscellaneous 541,700 541,700 764,848 223,148 Recovered costs 342,780 342,780 350,799 8,019 Intergovernmental revenues:
Commonwealth 4,789,472 4,789,472 4,847,109 57,637 Federal 125,000 125,000 306,518 181,518
Total revenues $ 36,584,936 $ 36,583,812 $ 38,785,529 $ 2,201,717
EXPENDITURES Current:
General government administration $ 1,603,709 $ 1,704,743 $ 1,588,585 $ 116,158 Judicial administration 1,299,720 1,317,060 1,278,954 38,106 Public safety 5,509,687 5,881,315 5,784,020 97,295 Public works 2,760,458 3,178,965 3,082,574 96,391 Health and welfare 1,274,148 1,279,026 1,413,425 (134,399) Education 16,020,165 17,108,216 14,216,366 2,891,850 Parks, recreation, and cultural 1,265,942 1,349,277 1,345,586 3,691 Community development 2,262,701 2,603,454 2,238,899 364,555 Nondepartmental 1,809,000 1,737,485 1,723,096 14,389
Debt service: Principal retirement 1,504,320 1,482,902 2,074,994 (592,092) Interest and other fiscal charges 8,441 8,440 2,289,521 (2,281 ,081) Bond issue costs 281,128 {281,128)
Total expenditures $ 35,318,291 $ 37,650,883 $ 37,317,148 $ 333,735
Excess (deficiency) of revenues over (under) expenditures $ 1,266,645 $ {1,067,071) $ 1,468,381 $ 2,535,452
OTHER FINANCING SOURCES (USES) Transfers in $ 210,000 $ 210,000 $ - $ (210,000) Transfers out (1, 109,217) (1 ,297,252) (1 ,234,972) 62,280 Refunding bonds issued 11,760,000 11,760,000 Premium on refunding bonds issued 1,771,014 1,771,014 Payment to refunded bond escrow agent {13,086,006} {13,086,006}
Total other financing sources (uses) $ {899,217) $ (1 ,087,252) $ (789,964} $ 297,288
Net change in fund balances $ 367,428 $ (2,154,323) $ 678,417 $ 2,832,740 Fund balances- beginning, as restated {367,428) 2,154,323 20,375,384 18,221,061 Fund balances - ending $ - $ - $ 21,053,801 $ 21,053,801
72

County of Rockbridge, Virginia Exhibit 12
Schedule of Pension Funding Progress As of June 30, 2013
PRIMARY GOVERNMENT: County Retirement Plan
Unfunded Actuarial Actuarial UAAL as
Actuarial Accrued Accrued % of Actuarial Value of Liability Liability Funded Covered Covered Valuation Assets (AAL) (UAAL) Ratio Payroll Payroll
Date { a } { b} { b-a } { a/b} { c } { {b-a}/c )
06/30/12 $ 20,802,708 $ 28,278,010 $ 7,475,302 73.56% $ 5,366,128 139.31% 06/30/11 20,969,792 26,305,910 5,336,118 79.72% 5,386,435 99.07% 06/30/10 20,189,345 25,317,355 5,128,010 79.75% 5,498,053 93.27%
DISCRETELY PRESENTED COMPONENT UNITS:
School Board Non-Professional Retirement Plan
Unfunded Actuarial Actuarial UAAL as
Actuarial Accrued Accrued % of Actuarial Value of Liability Liability Funded Covered Covered Valuation Assets (ML) (UAAL) Ratio Payroll Payroll
Date {a} {b) { b-a} { a/b} { c) { {b-a)/c )
06/30/12 $ 5,981,938 $ 7,193,562 $ 1,211 ,624 83.16% $ 1 ,499,893 80.78% 06/30/11 6,138,518 6,811,806 673,288 90.12% 1 ,455,186 46.27% 06/30/10 6,152,494 6,637,912 $ 485,418 92.69% 1,537,350 31.57%
Component Unit-Rockbridge Area Social Services Board
Unfunded Actuarial Actuarial UAAL as
Actuarial Accrued Accrued %of Actuarial Value of Liability Liability Funded Covered Covered Valuation Assets (AAL) (UAAL) Ratio Payroll Payroll
Date {a) { b} { b-a ) {a/b) { c ) { {b-a)/c)
06/30/12 $ 3,977,054 $ 4,686,433 $ 709,379 84.86% $ 773,190 91.75% 06/30/11 4,193,626 4,823,665 630,039 86.94% 835,926 75.37% 06/30/1 0 4,136,771 4,556,809 420,038 90.78% 867,390 48.43%
73

County of Rockbridge, Virginia
Schedule of Pension Funding Progress As of June 30, 2013 (continued)
Component Unit Rockbridge County Public Service Authority
Unfunded Actuarial Actuarial
Actuarial Accrued Accrued Actuarial Value of Liability Liability Valuation Assets (AAL) (UAAL)
Date ~a} ~ b } ~ b-a}
06/30/12 $ 1 '106,807 $ 1 ,234,153 $ 127,346 06/30/11 1,096,792 1,153,178 56,386 06/30/10 1,070,765 1,298,027 227,262
74
Exhibit 12
UAAL as %of
Funded Covered Covered Ratio Payroll Payroll ~alb} ~ c } { {b-a}/c L
89.68% $ 326,909 38.95% 95.11% 304,331 18.53% 82.49% 301,331 75.42%

County of Rockbridge, Virginia Exhibit 13
Other Postemployement Benefit Program Schedule of OPEB Funding Progress As of June 30, 2013
PRIMARY GOVERNMENT:
County Other Postemployment Benefit Program (includes Rockbridge Regional Jail Commission, Landfill, and Rockbridge County Public Service Authority)
Unfunded Actuarial Actuarial UAAL as
Actuarial Accrued Accrued %of Actuarial Value of Liability Liability Funded Covered Covered Valuation Assets (AAL) (UAAL) Ratio Payroll Payroll
Date (a} ( b} ( b-a} ( a/b} ( c} ( (b-a}/c }
06/30/12 $ - $ 448,000 $ 448,000 0.00% $ 6,655,000 6.73% 06/30/11 580,000 580,000 0.00% 6,387,000 9.08% 06/30/10 547,000 547,000 0.00% 6,387,000 8.56%
DISCRETELY PRESENTED COMPONENT UNIT:
School Board Other Postemployment Benefit Program
Unfunded Actuarial Actuarial UAAL as
Actuarial Accrued Accrued %of Actuarial Value of Liability Liability Funded Covered Covered Valuation Assets (AAL) (UAAL) Ratio Payroll Payroll
Date (a} ( b} ( b-a} ( a/b} ( c} ( (b-a}/c }
06/30/12 $ - $ 4,290,000 $ 4,290,000 0.00% $ 16,081,000 26.68% 06/30/10 4,406,000 4,406,000 0.00% 16,143,000 27.29%
DISCRETELY PRESENTED COMPONENT UNIT:
Rockbridge County Public Service Authority
Unfunded Actuarial Actuarial UAAL as
Actuarial Accrued Accrued %of Actuarial Value of Liability Liability Funded Covered Covered Valuation Assets (AAL) (UAAL) Ratio Payroll Payroll
Date (a l ( b} ( b-a} (alb} ( c l ( (b-a}/c }
06/30/12 $ - $ 12,000 $ 12,000 0.00% $ 133,738 8.97% 01/01/09 11,000 11,000 0.00% 128,352 8.57%
75

OTHER SUPPLEMENTARY INFORMATION

County of Rockbridge, Virginia School Capital Projects Fund
Exhibit 14
Schedule of Revenues, Expenditures, and Changes in Fund Balances - Budget and Actual For the Year Ended June 30, 2013
REVENUES Revenue from the use of money and property
Total revenues
EXPENDITURES Capital projects Debt service:
Principal retirement Interest and other fiscal charges Bond issue costs
Total expenditures
Excess (deficiency) of revenues over (under) expenditures
OTHER FINANCING SOURCES (USES) Issuance of general obligation bonds Premium on bonds
Total other financing sources (uses)
Net change in fund balances Fund balances - beginning Fund balances - ending
Budgeted Amounts
Original Final
$ - $ - $ $ ____ -_$ - $
$ - $ 19,513,237 $
Actual Amounts
Variance with Final Budget -
Positive (Negative)
24,680 $ 24,680 24,680 $ ----'=-24....!.,6.::..:8::..::0:_
21,849,069 $ (2,335,832)
1,600,000 (1 ,600,000) 22,444 (22,444)
6,644 (6,644) 23,478,157 $ ____ -_$ 19,513,237 $_~'--'-'---'--'-::...;__ $ (3,964,920)
- $ $ ____ _ (19,513,237) $ (23,453,477) $ (3,940,240)
$ - $ 19,513,237 $ 21,895,000 $ 2,381,763 762,862 762,862
- $ $ ____ _ 19,513,237' $ 22,657,862 $ 3,144,625
$ - $ - $ (795,615) $ (795,615) 5,180,090 5,180,090
- $ $===== - $ 4,384,475 $ 4,384,475
76

County of Rockbridge, Virginia Courthouse Construction Fund Schedule of Revenues, Expenditures, and Changes in Fund Balances - Budget and Actual For the Year Ended June 30, 2013
Budgeted Amounts Actual
Original Final Amounts REVENUES Revenue from the use of money and property $ - $ - $ -
Total revenues $ - $ - $ -
EXPENDITURES Capital projects $ - $ - $ -
Total expenditures $ - $ - $ -
Excess (deficiency) of revenues over (under) expenditures $ - $ - $ -
Net change in fund balances $ - $ - $ -
Fund balances- beginning 254,255 Fund balances - ending $ - $ - $ 254,255
77
Exhibit 15
Variance with Final Budget -
Positive (Negative)
$ $
$ $
$
$ 254,255
$ 254,255

County of Rockbridge, Virginia Combining Statement of Fiduciary Net Position Fiduciary Funds June 30, 2013
ASSETS Cash and cash equivalents
Total assets
LIABILITIES Accounts payable Amounts held for payroll deduction Amounts held for veterans memorial Amounts held for drug enforcement Amounts held for employee benefits Amounts held for commonwealth attorney forfeitures
Total liabilities
$ $
$
$
Payroll Deduction Drug
Fund Fund
- $ 67,679 $ - $ 67,679 $
(68,642) $ - $ 68,642
67,679
- $ 67,679 $
78
Exhibit 16
Agenc;t Funds
Commonwealth Veterans Employee Attorney Memorial Benefit Forfeitures
Fund Fund Fund Total
10,385 $ 2,164 $ 11 '175 $ 91,403 10,385 $ 2,164 $ 11 '175 $ 91,403
- $ - $ - $ (68,642) 68,642
10,385 10,385 67,679
2,164 2,164 11 '175 11 '175
10,385 $ 2,164 $ 11 '175 $ 91,403

County of Rockbridge, Virginia Exhibit 17
Combining Statement of Changes in Assets and Liabilities Agency Funds For the Year Ended June 30, 2013
Balance Balance Beginning End
of Year Additions Deletions of Year
Payroll Deduction Fund
LIABILITIES Accounts payable $ (71 ,586) $ 304,567 $ 301,623 $ (68,642) Amounts held for payroll deduction 71,586 (304,567) {301,623) 68,642
Total liabilities $ - $ - $ - $
Drug Fund ASSETS Cash and cash equivalents $ 49,556 $ 23,234 $ 5,111 $ 67,679
Total assets $ 49,556 $ 23,234 $ 5,111 $ 67,679
LIABILITIES Amounts held for drug enforcement $ 49,556 $ 23,234 $ 5,111 $ 67,679
Total liabilities $ 49,556 $ 23,234 $ 5,111 $ 67,679
Veterans Memorial Fund ASSETS Cash and cash equivalents $ 10,385 $ - $ - $ 10,385
Total assets $ 10,385 $ - $ - $ 10,385
LIABILITIES Amounts held for veterans memorial $ 10,385 $ - $ - $ 10,385
Total liabilities $ 10,385 $ - $ - $ 10,385
Employee Benefit Fund ASSETS Cash and cash equivalents $ 2,164 $ - $ - $ 2,164
Total assets $ 2,164 $ - $ - $ 2,164
LIABILITIES Amounts held for employee benefits $ 2,164 $ - $ - $ 2,164
Total liabilities $ 2,164 $ - $ - $ 2,164
Commonwealth Attorney Forfeitures Fund ASSETS Cash and cash equivalents $ 1,621 $ 12,269 $ 2,715 $ 11,175
Total assets $ 1,621 $ 12,269 $ 2,715 $ 11,175
LIABILITIES Amounts held for commonwelath's attorney forfeitures $ 1,621 $ 12,269 $ 2,715 $ 11,175
Total liabilities $ 1,621 $ 12,269 $ 2,715 $ 11,175
Totals ·All Agency Funds: ASSETS
Cash and cash equivalents $ 63,726 $ 35,503 $ 7,826 $ 91,403
Total assets $ 63,726 $ 35,503 $ 7,826 $ 91,403
LIABILITIES Accounts payable $ (71,586) $ 304,567 $ 301,623 $ (68,642) Amounts held for payroll deduction 71,586 (304,567) (301,623) 68,642 Amounts held for drug enforcement 49,556 23,234 5,111 67,679 Amounts held for veterans memorial 10,385 10,385 Amounts held for employee benefits 2,164 2,164 Amounts held for commonwelath's attorney forfeitures 1,621 12,269 2,715 11,175
Total liabilities $ 63,726 $ 35,503 $ 7,826 $ 91,403
79

County of Rockbridge, Virginia Combining Balance Sheet Discretely Presented Component Unit- School Board June 30, 2013
School School Permanent Operating Cafeteria Scholarship
Fund Fund
ASSETS Cash and cash equivalents $ 200 $ 148,779 $ Receivables (net of allowance
for uncollectibles): Accounts receivable 184,204 3,348
Due from other governmental units 785,709 81,937 Inventories 40,531 Prepaid items 248,664 4,736
Total assets $ 1,218,777 $ 279,331 $
LIABILITIES AND FUND BALANCES Liabilities:
Accounts payable $ 220,070 $ 389 $ Due to primary government 998,707
Total liabilities $ 1,218,777 $ 389 $
Fund balances: Nonspendable:
Inventory $ - $ 40,531 $ Prepaid items 248,664 4,736 Endowments
Committed: Special revenue funds 233,675
Unassigned (248,664} Total fund balances $ - $ 278,942 $ Total liabilities and fund balances $ 1,218,777 $ 279,331 $
Amounts reported for governmental activities in the statement of net position (Exhibit 1) are different because:
Total fund balances per above
Capital assets used in governmental activities are not financial resources and, therefore, are not reported in the funds.
Fund
40,402 $
40,402 $
- $
- $
- $
40,402
40,402 $ 40,402 $
$
Exhibit 18
Total Governmental
Funds
189,381
187,552 867,646 40,531
253,400 1,538,510
220,459 998,707
1,219,166
40,531 253,400 40,402
233,675 (248,664) 319,344
1,538,510
319,344
19,368,578
Long-term liabilities, including compensated absences, are not due and payable in the current period and, therefore, are not reported in the funds.
Net position of governmental activities
(1 '133,058)
$ 18,554,864
80

County of Rockbridge, Virginia Combining Statement of Revenues, Expenditures, and Changes in Fund Balances Governmental Funds -Discretely Presented Component Unit- School Board For the Year Ended June 30, 2013
REVENUES Revenue from the use of money and property Charges for services Miscellaneous Intergovernmental revenues:
Local government Commonwealth Federal
Total revenues
EXPENDITURES Current:
Education Debt service:
Interest and other fiscal charges Total expenditures
Excess (deficiency) of revenues over (under) expenditures
$
$
$
$
$
$
School School Operating Cafeteria
Fund Fund
- $ 113 $ 1 '1 06,198 467,178
162,925
14,147,982 11,073,326 16,371 2,101,825 692,311
28,592,256 $ 1 '175,973 $
28,588,376 $ 1,274,748 $
3,880 28,592,256 $ 1,274,748 $
- $ (98,775) $
- $ (98,775) $
Permanent Scholarship
Fund
8 $
8 $
- $
- $
8 $
8 $ Net change in fund balances Fund balances - beginning Fund balances - ending
377,717 40,394 $ - $ 278,942 $ 40,402
Amounts reported for governmental activities in the statement of activities (Exhibit 2) are different because:
Net change in fund balances - total governmental funds - per above
Governmental funds report capital outlays as expenditures. However, in the statement of activities the cost of those assets is allocated over their estimated useful lives and reported as depreciation expense. This is the amount by which the capital outlays exceeded depreciation in the current period.
The net effect of various miscellaneous transactions involving capital assets (I.e., sales, trade-ins, and donations) is to increase (decrease) net assets.
Some expenses reported in the statement of activities do not require the use of current financial resources and, therefore are not reported as expenditures in governmental funds.
$
$
Exhibit 19
Total Governmental
Funds
121 1,573,376
162,925
14,147,982 11,089,697 2,794,136
29,768,237
29,863,124
3,880 29,867,004
(98,767)
(98,767) 418,111 319,344
(98,767)
1 '180,534
(54,352)
(194,615)
Change in net position of governmental activities $ ==8~3~2,~80:;,;0~
81

County of Rockbridge, Virginia Schedule of Revenues, Expenditures, and Changes in Fund Balances -Budget and Actual Discretely Presented Component Unit- School Board For the Year Ended June 30, 2013
REVENUES Revenue from the use of money and property Charges for services Miscellaneous Intergovernmental revenues:
Local government Commonwealth Federal
Total revenues
EXPENDITURES Current:
Education Debt service:
Principal retirement Interest and other fiscal charges
Total expenditures
Excess (deficiency) of revenues over (under) expenditures
Net change in fund balances Fund balances - beginning Fund balances - ending
$
$
$
$
$
$
$
School Operating Fund
Budgeted Amounts Original Final Actual
- $ - $ - $ 1,371,250 1,371 ,250 1,106,198
162,925
13,902,454 14,017,502 14,147,982 11,072,935 11,070,659 11,073,326
1,597,202 1,597,202 2,101,825 27,943,841 $ 28,056,613 $ 28,592,256 $
27,940,841 $ 28,053,613 $ 28,588,376 $
3,000 3,000 3,880 27,943,841 $ 28,056,613 $ 28,592,256 $
- $ - $ - $
- $ - $ - $
- $ - $ - $
82
Variance with Final Budget
Positive (Negative)
(265,052) 162,925
130,480 2,667
504,623 535,643
(534,763)
(880) (535,643)

School Cafeteria Fund
Budgeted Amounts Original Final
$ 100 $ 100 $ 611,556 611,556
13,300 13,300 629,475 629,475
$ 1 ,254,431 $ 1 ,254,431 $
Actual
113 $ 467,178
16,371 692,311
1,175,973 $
Exhibit 20
Variance with Final Budget
Positive (Negative)
13 (144,378)
3,071 38,048
(103,246)
$ 1,254,431 $ 1,254,431 $ 1,274,748 $ _ ____,(~20.....!,_3_17_,_)
$ 1,254,431 $ 1,254,431 $ 1,274,748 $ (20,317)
$ - $ - $ (98,775) $ (123,563)
$ - $ - $ (98,775) $ (123,563) 377,717 377,717
$ - $ - $ 278,942 $ 254,154
83

County of Rockbridge, Virginia Statement of Fiduciary Net Position Fiduciary Fund - Discretely Presented Component Unit School Board June 30, 2013
ASSETS Cash and cash equivalents
NET POSITION Held in trust for scholarships
84
Exhibit 21
Scholarship Private-Purpose
Trust
$====1=3=, 7=8=0=
$====1=3=,7=8=0=

County of Rockbridge, Virginia Statement of Changes in Fiduciary Net Position Fiduciary Funds - Discretely Presented Component Unit School Board For the Year Ended June 30, 2013
ADDITIONS Investment earnings:
Interest Total additions
DEDUCTIONS Contributions to others Scholarships
Total deductions
Change in net position
Net position - beginning Net position - ending
85
Exhibit 22
Scholarship Private-Purpose
Trust
$ 5 $ 5
$ (787) {14,296)
$ (15,083)
$ (15,078)
28,858 $ 13,780

THIS PAGE LEFT BLANK INTENTIONALLY

SUPPORTING SCHEDULES

County of Rockbridge, Virginia Schedule 1 Schedule of Revenues -Budget and Actual Page 1 of 5 Governmental Funds For the Year Ended June 30, 2013
Variance with Final Budget -
Original Final Positive Fund, Major and Minor Revenue Source Budget Budget Actual (Negative)
General Fund: Revenue from local sources:
General property taxes: Real property taxes $ 15,446,084 $ 15,446,084 $ 16,152,227 $ 706,143 Real and personal public service corporation taxes 722,000 722,000 802,734 80,734 Personal property taxes 4,194,600 4,193,326 4,521,469 328,143 Mobile home taxes 44,000 44,000 37,399 (6,601) Machinery and tools taxes 333,000 333,000 356,921 23,921 Penalties 210,000 210,000 276,343 66,343 Interest 100,000 100,000 267,837 167,837
Total general property taxes $ 21,049,684 $ 21,048,410 $ 22,414,930 $ 1,366,520
Other local taxes: Local sales and use taxes $ 2,375,000 $ 2,375,000 $ 2,392,591 $ 17,591 Consumers' utility taxes 1,554,000 1,554,000 1,522,050 (31,950) Business license taxes 800,000 800,000 913,827 113,827 Motor vehicle licenses 541,700 541,850 537,855 (3,995) Bank stock taxes 102,000 102,000 87,703 (14,297) Taxes on recordation and wills 200,000 200,000 191 ,861 (8,139) Lodging tax 1,140,000 1,140,000 1,194,689 54,689 Meals tax 1,225,000 1,225,000 1,317,225 92,225
Total other local taxes $ 7,937,700 $ 7,937,850 $ 8,157,801 $ 219,951
Permits, privilege fees, and regulatory licenses: Animal licenses $ 8,300 $ 8,300 $ 11 ,489 $ 3,189 Land use application fees 2,000 2,000 1,340 (660) Transfer fees 700 700 693 (7) Permits and other licenses 197,500 197,500 159,244 (38,256)
Total permits, privilege fees, and regulatory licenses $ 208,500 $ 208,500 $ 172,766 $ (35,734)
Fines and forfeitures: Court fines and forfeitures $ 171,000 $ 171 ,000 $ 235,024 $ 64,024
Revenue from use of money and property: Revenue from use of money $ 55,000 $ 55,000 $ 26,018 $ (28,982) Revenue from use of property 19,000 19,000 27,531 8,531
Total revenue from use of money and property $ 74,000 $ 74,000 $ 53,549 $ (20,451)
Charges for services: Sheriffs fees $ 6,700 $ 6,700 $ 10,269 $ 3,569 Charges for courthouse maintenance 56,000 56,000 51,257 (4,743) Courthouse security fees 161 ,200 161,200 167,288 6,088 Consolidated share-Buena Vista 23,400 23,400 23,400 Charges for Commonwealth's Attorney 2,000 2,000 4,347 2,347 Charges for garage services 473,000 473,000 645,400 172,400 Charges for sanitation and waste removal 507,100 507,100 477,409 (29,691) Charges for parks and recreation 99,100 99,100 85,038 (14,062) Erosion Sediment Control Fee 14,000 14,000 17,457 3,457 DNA Fee 600 600 320 (280)
Total charges for services $ 1,345,100 $ 1 ,345,100 $ 1,482,185 $ 137,085
86

County of Rockbridge, Virginia Schedule 1 Schedule of Revenues -Budget and Actual Page 2 of 5 Governmental Funds For the Year Ended June 30, 2013 !Continued)
Variance with Final Budget-
Original Final Positive Fund, Major and Minor Revenue Source Budget Budget Actual (Negative)
General Fund: (Continued) Revenue from local sources: (Continued)
Miscellaneous revenue: Miscellaneous $ 541,700 $ 541,700 $ 764,848 $ 223,148
Total miscellaneous revenue $ 541,700 $ 541,700 $ 764,848 $ 223,148
Recovered costs: Lexington contribution-court building $ - $ - $ 9,407 $ 9,407 Joint services City of Lexington 170,000 170,000 170,690 690 Charges for hazard materials cleanup 40,000 40,000 16,162 (23,838) Fiscal agent fees 50,600 50,600 48,193 (2,407) Other recovered costs 82,180 82,180 106,347 24,167
Total recovered costs $ 342,780 $ 342,780 $ 350,799 $ 8,019
Total revenue from local sources $ 31,670,464 $ 31,669,340 $ 33,631,902 $ 1,962,562
Intergovernmental revenues: Revenue from the Commonwealth:
Noncategorical aid: Motor vehicle carriers' tax $ 63,000 $ 63,000 $ 77,033 $ 14,033 Mobile home titling tax 20,000 20,000 14,889 (5, 111) Timber sales 2,000 2,000 1,871 (129) Motor vehicle rental tax 35,000 35,000 45,385 10,385 State recordation tax 67,700 67,700 50,897 (16,803) Personal property tax relief funds 2,449,624 2,449,624 2,449,624
Total noncategorical aid $ 2,637,324 $ 2,637,324 $ 2,639,699 $ 2,375
Categorical aid: Shared expenses:
Commonwealth's attorney $ 322,814 $ 322,814 $ 312,824 $ (9,990) Sheriff 1,098,258 1,098,258 1,046,784 (51 ,474) Commissioner of revenue 98,818 98,818 97,248 (1 ,570) Treasurer 79,666 79,666 79,337 (329) Registrar/electoral board 48,381 48,381 33,549 (14,832) Clerk of the Circuit Court 248,191 248,191 251,016 2,825 Total shared expenses $ 1,896,128 $ 1,896,128 $ 1,820,758 $ (75,370)
Other categorical aid: Emergency medical services $ - $ - $ 11,590 $ 11 ,590 Victim-witness grant 30,235 30,235 30,776 541 Fire program 49,000 49,000 112,605 63,605 NBSWCD support 117,018 117,018 120,573 3,555 Other 59,767 59,767 111 '1 08 51 ,341 Total other categorical aid $ 256,020 $ 256,020 $ 386,652 $ 130,632
Total categorical aid $ 2,152,148 $ 2,152,148 $ 2,207,410 $ 55,262
Total revenue from the Commonwealth $ 4,789,472 $ 4,789,472 $ 4,847,109 $ 57,637
87

County of Rockbridge, Virginia Schedule 1 Schedule of Revenues -Budget and Actual Page 3 of 5 Governmental Funds For the Year Ended June 30, 2013 !Continued)
Variance with Final Budget -
Original Final Positive Fund, Major and Minor Revenue Source Budget Budget Actual (Negative)
General Fund: (Continued) Intergovernmental revenues: (Continued) Revenue from the federal government:
Noncategorical aid: Payments in lieu of taxes $ 65,000 $ 65,000 $ 101,310 $ 36,310
Categorical aid: Ground transportation grant $ - $ - $ 14,379 $ 14,379 Rental assistance 60,000 60,000 56,582 (3,418) DEQ rnining rents and royalties 872 872 Homeland security grant 70,228 70,228 Economic development grant 27,000 27,000 Domestic violence 33,147 33,147 DHCD 3,000 3,000
Total categorical aid $ 60,000 $ 60,000 $ 205,208 $ 145,208
Total revenue from the federal government $ 125,000 $ 125,000 $ 306,518 $ 181,518
Total General Fund $ 36,584,936 $ 36,583,812 $ 38,785,529 $ 2,201,717
Capital Projects Funds: Broadband Technology Opportunities Program Revenue from local sources:
Miscellaneous revenue: Other miscellaneous $ - $ - $ 1,706,530 $ 1,706,530
Total miscellaneous revenue $ - $ - $ 1,706,530 $ 1,706,530
Intergovernmental revenues: Revenue from the federal government:
Categorical aid: Broadband technology opportunities program $ - $ - $ 4,110,155 $ 4,110,155
Total categorical aid $ - $ - $ 4,110,155 $ 4,110,155
Total revenue from the federal government $ - $ - $ 4,110,155 $ 4,110,155
Total Broadband Technology Opportunities Program $ - $ - $ 5,816,685 $ 5,816,685
School Capital Projects Fund: Revenue from local sources:
Revenue from use of money and property: Revenue from the use of property $ - $ - $ 24,680 $ 24,680
Total School Capital Projects Fund $ - $ - $ 24,680 $ 24,680
Total Primary Government $ 36,584,936 $ 36,583,812 $ 44,626,894 $ 8,043,082
88

County of Rockbridge, Virginia Schedule 1 Schedule of Revenues - Budget and Actual Page 4 of 5 Governmental Funds For the Year Ended June 30, 2013 (Continued)
Variance with Final Budget -
Original Final Positive Fund, Major and Minor Revenue Source Budget Budget Actual (Negative)
Discretely Presented Component Unit - School Board: School Operating Fund: Revenue from local sources:
Charges for services: Tuition -private day school $ - $ - $ 6,198 $ 6,198 Tuition-City of Lexington, Buena Vista 1,371,250 1,371,250 1,100,000 (271 ,250)
Total charges for services $ 1,371,250 $ 1,371,250 $ 1,106,198 $ (265,052)
Miscellaneous revenue: Other miscellaneous $ - $ - $ 162,925 $ 162,925
Total revenue from local sources $ 1,371,250 $ 1,371,250 $ 1,269,123 $ (102,127)
Intergovernmental revenues: Revenues from local governments:
Contribution from County of Rockbridge, Virginia $ 13,902,454 $ 14,017,502 $ 14,147,982 $ 130,480 Total revenues from local governments $ 13,902,454 $ 14,017,502 $ 14,147,982 $ 130,480
Revenue from the Commonwealth: Categorical aid:
Share of state sales tax $ 2,859,970 $ 2,859,970 $ 2,860,950 $ 980 Basic school aid 5,146,960 5,146,960 5,192,162 45,202 Remedial summer education 26,520 26,520 (26,520) Regular foster care 15,656 15,656 (15,656) Gifted and talented 58,437 58,437 59,036 599 Remedial education 144,823 144,823 146,307 1,484 Special education 706,251 706,251 693,033 (13,218) Textbook payment 113,991 113,991 115,159 1,168 Vocational standards of quality payments 166,419 166,419 168,125 1,706 Social security fringe benefits 344,272 344,272 347,800 3,528 Retirement fringe benefits 574,210 574,210 580,094 5,884 Early reading intervention 46,149 46,149 44,557 (1 ,592) Homebound education 10,578 10,578 14,019 3,441 Vocational education other 56,990 56,990 41,455 (15,535) At risk payments 114,788 114,788 115,916 1,128 Composite index 102,293 102,293 102,293 Standards of learning algebra readiness 19,551 19,551 19,551 Reduced class size 171,660 171,660 169,761 (1,899) Group life insurance 21,596 21,596 21,818 222 Technology grant 232,000 232,000 232,000 At risk four-year olds 97,862 97,862 94,804 (3,058) English as a second language 16,107 16,107 11,934 (4,173) Adult EdGED 23,576 23,576 28,576 5,000 Other state funds 2,276 13,976 13,976
Total categorical aid $ 11,072,935 $ 11,070,659 $ 11,073,326 $ 2,667
Total revenue from the Commonwealth $ 11,072,935 $ 11,070,659 $ 11,073,326 $ 2,667
89

County of Rockbridge, Virginia Schedule 1 Schedule of Revenues - Budget and Actual Page 5 of 5 Governmental Funds For the Year Ended June 30, 2013 (Continued!
Variance with Final Budget -
Original Final Positive Fund, Major and Minor Revenue Source Budget Budget Actual (Negative)
Discretely Presented Component Unit- School Board: (Continued) School Operating Fund: (Continued) Intergovernmental revenues: (Continued) Revenue from the federal government:
Categorical aid: Federal land use $ 63,000 $ 63,000 $ 80,891 $ 17,891 Adult literacy 54,060 54,060 68,470 14,410 Title I 415,953 415,953 526,829 110,876 Title VI-B, special education flow-through 466,054 466,054 668,062 202,008 Vocational education 40,422 40,422 51' 197 10,775 Title VI-B, special education pre-school 11,653 11,653 14,759 3,106 Title II, Part A 96,371 96,371 122,059 25,688 Twenty-first century community learning centers 417,475 417,475 528,756 111,281 Total action against poverty 31,989 31,989 40,516 8,527 Technology grant 226 226 286 60
Total categorical aid $ 1,597,202 $ 1,597,202 $ 2,101,825 $ 504,623
Total revenue from the federal government $ 1,597,202 $ 1,597,202 $ 2,101,825 $ 504,623
Total School Operating Fund $ 27,943,841 $ 28,056,613 $ 28,592,256 $ 535,643
Special Revenue Fund: School Cafeteria Fund: Revenue from local sources:
Revenue from use of money and property: Revenue from the use of money $ 100 $ 100 $ 113 $ 13
Charges for services: Cafeteria sales $ 611 ,556 $ 611,556 $ 467,178 $ (144,378)
Total revenue from local sources $ 611,656 $ 611,656 $ 467,291 $ (144,365)
Intergovernmental revenues: Revenue from the Commonwealth:
Categorical aid: School food program grant $ 13,300 $ 13,300 $ 16,371 $ 3,071
Revenue from the federal government: Categorical aid:
School food program grant $ 629,475 $ 629,475 $ 596,133 $ (33,342) Twenty-first century community learning centers 770 770 Commodities 70,620 70,620 Total action against poverty 24,788 24,788
Total categorical aid $ 629,475 $ 629,475 $ 692,311 $ 38,048
Total revenue from the federal government $ 629,475 $ 629,475 $ 692,311 $ 38,048
Total School Cafeteria Fund $ 1,254,431 $ 1,254,431 $ 1 '175,973 $ (103,246)
Total Discretely Presented Component Unit- School Board $ 29,198,272 $ 29,311,044 $ 29,768,229 $ 432,397
90

County of Rockbridge, Virginia Schedule 2 Schedule of Expenditures - Budget and Actual Page 1 of 4 Governmental Funds For the Year Ended June 30, 2013
Variance with Final Budget -
Original Final Positive Fund, Function, Activity and Elements Budget Budget Actual (Negative)
General Fund: General government administration:
Legislative: Board of supervisors $ 66,993 $ 77,105 $ 77,862 $ (757)
General and financial administration: County administrator $ 204,331 $ 207,389 $ 204,670 $ 2,719 Legal services 153,888 161,120 156,051 5,069 Commissioner of revenue 257,103 257,405 251,167 6,238 Land use 1,260 958 798 160 Treasurer 300,591 300,591 283,016 17,575 Central accounting 129,630 131,060 127,406 3,654 Data processing 136,790 139,790 123,447 16,343 Director of fiscal services 211,435 290,637 202,768 87,869 Central stores 28,918 (28,918)
Total general and financial administration $ 1,395,028 $ 1,488,950 $ 1,378,241 $ 110,709
Board of elections: Electoral board and officials $ 141,688 $ 138,688 $ 132,482 $ 6,206
Total board of elections $ 141,688 $ 138,688 $ 132,482 $ 6,206
Total general government administration $ 1,603,709 $ 1,704,743 $ 1,588,585 $ 116,158
Judicial administration: Courts:
Circuit court $ 65,329 $ 65,329 $ 59,209 $ 6,120 County court 21,797 25,370 23,450 1,920 Victim witness coordinator 55,735 55,735 53,611 2,124 Clerk of the circuit court 366,625 380,392 364,743 15,649 Courthouse security 357,535 357,535 350,167 7,368
Total courts $ 867,021 $ 884,361 $ 851,180 $ 33,181
Commonwealth's attorney: Commonwealth's attorney $ 432,699 $ 432,699 $ 427,774 $ 4,925
Total commonwealth's attorney $ 432,699 $ 432,699 $ 427,774 $ 4,925
Total judicial administration $ 1,299,720 $ 1,317,060 $ 1,278,954 $ 38,106
Public safety: Law enforcement and traffic control:
Sheriff $ 2,025,415 $ 2,301,342 $ 2,318,866 $ (17,524)
Fire and rescue services: Fire prevention $ 862,000 $ 841,283 $ 837,831 $ 3,452 Emergency management 106,232 156,922 143,891 13,031 Rescue services 578,199 726,433 704,778 21,655 Consolidated Dispatch 653,882 722,014 677,019 44,995
Total fire and rescue services $ 2,200,313 $ 2,446,652 $ 2,363,519 $ 83,133
Correction and detention: Contribution to Component Unit Jail Commission $ 766,000 $ 637,363 $ 619,253 $ 18,110 Probation office 6,150 6,150 4,726 1,424 Juvenile probation and detention 42,196 42,196 42,196
Total correction and detention $ 814,346 $ 685,709 $ 666,175 $ 19,534
91

County of Rockbridge, Virginia Schedule 2 Schedule of Expenditures - Budget and Actual Page 2 of 4 Governmental Funds For the Year Ended June 30, 2013 (Continued)
Variance with Final Budget -
Original Final Positive Fund, Function, Activit:t and Elements Budget Budget Actual (Negative)
General Fund: (Continued) Public safety: (Continued)
Inspections: Building $ 284,958 $ 260,227 $ 235,744 $ 24,483
Other protection: Animal control $ 13,650 $ 16,380 $ 16,380 $ Other protective services 171,005 171 ,005 183,336 (12,3312
Total other protection $ 184,655 $ 187,385 $ 199,716 $ (12,331}
Total public safety $ 5,509,687 $ 5,881,315 $ 5,784,020 $ 97,295
Public works: Maintenance of highways, streets, bridges and sidewalks:
Road maintenance $ 12,500 $ 8,500 $ 7,198 $ 1,302 Total maintenance of highways, streets, bridges & sidewalks $ 12,500 $ 8,500 $ 7,198 $ 1,302
Sanitation and .waste removal: County pickup $ 1 '139,500 $ 1,260,164 $ 1,231,049 $ 29,115 Special enforcement-litter control 114,682 112,221 100,497 11,724
Total sanitation and waste removal $ 1,254,182 $ 1,407,613 $ 1,366,774 $ 40,839
Maintenance of general buildings and grounds: General properties $ 508,692 $ 606,725 $ 574,827 $ 31,898 Central garage 985,084 1,156,127 1,133,775 22,352
Total maintenance of general buildings and grounds $ 1,493,776 $ 1,762,852 $ 1,708,602 $ 54,250
Total public works $ 2,760,458 $ 3,178,965 $ 3,082,574 $ 96,391
Health and welfare: Health:
Supplement of local health department $ 248,395 $ 229,161 $ 229,161 $ Other contributions 66,677 66,902 66,677 225
Total health $ 315,072 $ 296,063 $ 295,838 $ 225
Mental health and mental retardation: Community services board $ 140,736 $ 158,161 $ 158,161 $
Welfare: Contribution to Rockbridge Area Social Services Board $ 772,659 $ 772,659 $ 746,358 $ 26,301 Other public assistance and welfare administration 45,681 52,143 48,368 3,775 Tax relief for the elderly 164,700 (164,700}
Total welfare $ 818,340 $ 824,802 $ 959,426 $ (134,624}
Total health and welfare $ 1,274,148 $ 1,279,026 $ 1,413,425 $ (134,399}
Education: Other instructional costs:
Community colleges/other programs $ 68,384 $ 68,384 $ 68,384 $ Contribution to County School Board 15,951,781 17,039,832 14,147,982 2,891,850
Total education $ 16,020,165 $ 17,108,216 $ 14,216,366 $ 2,891,850
92

County of Rockbridge, Virginia Schedule 2 Schedule of Expenditures - Budget and Actual Page 3 of 4 Governmental Funds For the Year Ended June 30, 2013 (Continued)
Variance with Final Budget -
Original Final Positive Fund, Function, Activity and Elements Budget Budget Actual ~Negative)
General Fund: (Continued) Parks, recreation, and cultural:
Parks and recreation: Parks and recreation $ 606,988 $ 679,830 $ 630,451 $ 49,379 Preschool 104,697 105,190 104,795 395
Total parks and recreation $ 711,685 $ 785,020 $ 735,246 $ 49,774
Library: Contribution to county libraries $ 554,257 $ 564,257 $ 610,340 $ ~46,083)
Total parks, recreation, and cultural $ 1,265,942 $ 1,349,277 $ 1,345,586 $ 3,691
Community development: Planning and community development:
Planning and zoning $ 273,374 $ 277,090 $ 266,830 $ 10,260 Geographic information system 156,767 161,295 150,143 11 '152 Rental assistance 75,324 75,324 73,292 2,032 Industrial development 886,230 1 '123,455 1 '179,901 (56,446) Other community development 68,605 120,605 102,761 17,844 Contribution to Public Service Authority 510,136 480,416 117,944 362,472
Total planning and community development $ 1,970,436 $ 2,238,185 $ 1,890,871 $ 347,314
Environmental management: Agriculture and home economics $ 80,600 $ 80,600 $ 67,716 $ 12,884 Other environmental management 80,069 149,073 145,657 3,416
Total environmental management $ 160,669 $ 229,673 $ 213,373 $ 16,300
Cooperative extension program: Extension office $ 131,596 $ 135,596 $ 134,655 $ 941
Total community development $ 2,262,701 $ 2,603,454 $ 2,238,899 $ 364,555
Nondepartmental: Miscellaneous $ 59,000 $ 18,726 $ 4,337 $ 14,389 Annexation payment 1,750,000 1,718,759 1,718,759
Total nondepartmental $ 1,809,000 $ 1,737,485 $ 1,723,096 $ 14,389
Debt service: Principal retirement $ 1,504,320 $ 1,482,902 $ 2,074,994 $ (592,092) Interest and other fiscal charges 8,441 8,440 2,289,521 (2,281 ,081) Bond issue costs 281,128 (281 '128)
Total debt service $ 1,512,761 $ 1,491,342 $ 4,645,643 $ (3,154,301)
Total General Fund $ 35,318,291 $ 37,650,883 $ 37,317,148 $ 333,735
Capital Projects Funds: Broadband Technology Opportunities Program: Community development:
Planning and community development: Capital projects $ - $ - $ 5,098,312 $ (5,098,312)
Total planning and community development $ - $ - $ 5,098,312 $ (5,098,312)
Total Rockbridge Area Net Authority $ - $ - $ 5,098,312 $ (5,098,312)
School Capital Projects Fund: Capital projects expenditures:
Capital projects $ - $ 19,513,237 $ 21,849,069 $ (2,335,832) Total capital projects $ - $ 19,513,237 $ 21,849,069 $ (2,335,832)
Debt service: Principal retirement $ - $ - $ 1,600,000 $ (1 ,600,000) Interest and other fiscal charges $ - $ - $ 22,444 $ (22,444) Bond issue costs 6,644 (6,644)
Total debt service $ - $ - $ 1,629,088 $ (1 ,629,088)
Total School Capital Projects Fund $ - $ 19,513,237 $ 23,478,157 $ (3,964,920)
Total Primary Government $ 35,318,291 $ 57,164,120 $ 65,893,617 $ (8,729,497)
93

County of Rockbridge, Virginia Schedule 2 Schedule of Expenditures - Budget and Actual Page 4 of 4 Governmental Funds For the Year Ended June 30, 2013 (Continued)
Variance with Final Budget -
Original Final Positive Fund, Function, Activi!}' and Elements Budget Budget Actual (Negative)
Discretely Presented Component Unit- School Board: School Operating Fund: Education:
Administration of schools: Instruction $ 21,551,137 $ 21,162,426 $ 21,898,342 $ (735,916) Administration, attendance and health 1,313,090 1,360,477 1,234,306 126,171 Pupil transportation 1,955,922 2,052,794 2,014,463 38,331 Operation and maintenance 3,100,692 3,270,393 3,221,120 49,273 Facilities 20,000 207,523 220,145 (12,622)
Total education $ 27,940,841 $ 28,053,613 $ 28,588,376 $ (534,763)
Debt service: Interest and other fiscal charges $ 3,000 $ 3,000 $ 3,880 $ (880)
Total debt service $ 3,000 $ 3,000 $ 3,880 $ (880)
Total School Operating Fund $ 27,943,841 $ 28,056,613 $ 28,592,256 $ (535,643)
Special revenue fund: School Cafeteria Fund: Education:
School food services: Administration of school food program $ 1,254,431 $ 1,254,431 $ 1,274,748 $ (20,317)
Total School Cafeteria Fund $ 1,254,431 $ 1,254,431 $ 1,274,748 $ (20,317)
Total Discretely Presented Component Unit- School Board $ 29,198,272 $ 29,311,044 $ 29,867,004 $ (555,960)
94

OTHER STATISTICAL INFORMATION

COUNTY OF ROCKBRIDGE, VIRGINIA
Net Position by Component Last Ten Fiscal Years (accrual basis of accounting)
Governmental activities Net investment in capital assets Restricted Unrestricted
Total governmental activities net position
Business-type activities Net investment in capital assets Restricted Unrestricted
Total business-type activities net position
Primary government Net investment in capital assets Restricted Unrestricted
Total primary government net position
2004
$ 811,714 $ 526,198
7,862,482
$ 9,200,394 $
$ 1,522,102 $
{193, 120)
$ 1,328,982 $
$ 2,333,816 $ 526,198
7,669,362
$ 10,529,376 $
95
2005 2006 2007
2,664,635 $ 1,034,139 $ 4,760,174 572,094 1,597,814 1,990,486
7,031,749 10,533,679 12,595,832
10,268,478 $ 13,165,632 $ 19,346,492
1,319,499 $ 1,445,213 $ 1,458,874
285,740 344,247 400,752
1,605,239 $ 1,789,460 $ 1,859,626
3,984,134 $ 2,479,352 $ 6,219,048 572,094 1,597,814 1,990,486
7,317,489 10,877,926 12,996,584
11,873,717 $ 14,955,092 $ 21,206,118

Table 1
Fiscal Year
2008 2009 2010 2011 2012 2013
$ 9,678,247 $ 12,942,462 $ 12,355,645 $ 11,866,668 $ 12,943,272 $ 10,937,946 1,441,943 935,021 935,021 960,040 1,002,603 5,459,836
13,004,039 17,260,280 16,443,020 17,653,362 17,197,916 21,297,930
$ 24,124,229 $ 31,137,763 $ 29,733,686 $ 30,480,070 $ 31,143,791 $ 37,695,712
$ 1,373,896 $ 1,421,280 $ 1,427,172 $ 1,338,861 $ 1,086,965 $ 1,397,575 1,176,854 1,002,249
575,480 875,031 1,201,435 1,570,098 881,152 924,040
$ 1,949,376 $ 2,296,311 $ 2,628,607 $ 2,908,959 $ 3,144,971 $ 3,323,864
$ 11,052,143 $ 14,363,742 $ 13,782,817 $ 13,205,529 $ 14,030,237 $ 12,335,521 1,441,943 935,021 935,021 960,040 2,179,457 6,462,085
13,579,519 18,135,311 17,644,455 19,223,460 18,079,068 22,221,970
$ 26,073,605 $ 33,434,074 $ 32,362,293 $ 33,389,029 $ 34,288,762 $ 41,019,576
96

COUNTY OF ROCKBRIDGE, VIRGINIA
Changes in Net Position Last Ten Fiscal Years (accrual basis of accounting)
Expenses Governmental activities:
General government administration Judicial administration Public safety Public works Health and welfare Education Parks, recreation and cultural Community development Interest on long-term debt Nondepartmental
Total governmental activities expenses
Business-type activities: Landfill Recycling
Total business-type activities expenses
Total primary government expenses
Program Revenues Governmental activities: Charges for services:
General government administration Judicial administration Public safety Public works Parks, recreation and cultural Community development
Operating grants and contributions Capital grants and contributions
Total governmental activities program revenues
2004
$ 1 '111 ,450 $ 536,139
3,689,644 1,975,258
696,286 10,412,045
1,100,441 1,078,395 1,091,455 1,111,003
$ 22,802,116 $
$ 909,617 $ 745,718
$ 1,655,335 $
$ 24,457,451 $
$ 397,816 $ 201,399
12,075 414,127
72,386 243,994
2,136,026 144,064
$ 3,621,887 $
97
2005 2006 2007
1 ,500,137 $ 925,309 $ 1,516,336 225,334 1,070,338 573,554
4,084,091 4,108,605 4,518,686 2,454,678 2,558,759 2,547,356 1,128,269 1,021,507 1,429,744
12,086,002 12,660,147 12,426,048 991,522 1,089,369 1,131,484
1,393,738 2,136,809 2,250,998 1,280,603 2,082,251 1,469,578 1,138,150 1,227,014 2,035,190
26,282,524 $ 28,880,108 $ 29,898,974
959,640 $ 1,106,115 $ 1,336,355 762,301 770,109 871,600
1,721,941 $ 1,876,224 $ 2,207,955
28,004,465 $ 30,756,332 $ 32,106,929
472,096 $ 501,055 $ 17,550 155,163 294,156 264,441
3,510 14,876 13,424 475,341 537,203 793,320
71,357 71,673 84,576 449,386 428,816 390,853
1,918,191 2,346,099 2,550,447 778,179 53,776
3,545,044 $ 4,972,057 $ 4,168,387

Table 2
Fiscal Year
2008 2009 2010 2011 2012 2013
$ 1,398,329 $ 2,170,904 $ 2,332,278 $ 2,333,275 $ 2,335,818 $ 2,011,030 4,699,190 2,725,181 1,211,172 1,186,366 1,021,390 1,267,789 4,658,008 4,926,453 5,364,665 5,160,253 5,406,165 5,700,091 3,001,287 2,856,775 3,040,215 2,824,461 2,949,751 3,052,847 1,471,189 1,527,149 1,459,423 1,498,930 1,505,526 1,414,009
14,126,792 14,178,044 14,437,698 13,085,583 16,631,591 16,126,417 1,236,686 1,358,529 1,361,665 1,267,868 1,299,526 1,442,669 1,699,223 1,831,694 2,109,085 2,585,270 2,369,189 2,246,495 2,087,610 1,733,021 1,932,209 1,862,608 1,730,059 1,718,759 1,698,751 2,060,962 1,944,765 1,747,190 1,969,401 2,833,978
$ 36,077,065 $ 35,368,712 $ 35,193,175 $ 33,551,804 $ 37,218,416 $ 37,814,084
$ 1,215,648 $ 1,058,560 $ 969,972 $ 862,292 $ 825,011 $ 960,797 1,059,036 1,001,618 954,393 983,111 1,159,742 1 '156,498
$ 2,274,684 $ 2,060,178 $ 1,924,365 $ 1,845,403 $ 1,984,753 $ 2,117,295
$ 38,351,749 $ 37,428,890 $ 37,117,540 $ 35,397,207 $ 39,203,169 $ 39,931,379
$ 23,400 $ 35,100 $ 11,700 $ 23,400 $ 23,400 $ 23,400 443,137 388,462 346,456 437,863 510,896 457,916
17,878 16,838 15,584 5,840 6,317 22,078 1 '153,570 1,028,928 1,154,832 958,805 1,236,913 1 '122,809
113,061 84,892 90,891 96,748 95,487 85,038 350,169 190,262 204,569 181,875 192,207 178,734
2,416,922 2,398,519 2,165,017 2,426,783 2,257,672 2,412,618 46,189 4,260,000 303,653 1,993,245 5,816,685
$ 4,564,326 $ 8,403,001 $ 3,989,049 $ 4,434,967 $ 6,316,137 $ 10,119,278
98

COUNTY OF ROCKBRIDGE, VIRGINIA
Changes in Net Position Last Ten Fiscal Years (accrual basis of accounting)
Business-type activities: Charges for services:
Landfill Recycling
Operating grants and contributions
Total business-type activities program revenues
Total primary government program revenues
Net(expense)/revenue Governmental activities Business-type activities
Total primary government net expense
General Revenues and Other Changes in Net Position
Governmental activities: Taxes
Property taxes Local sales and use taxes Motor vehicle licenses taxes Consumer utility taxes Business licenses taxes Other local taxes
Unrestricted grants and contributions Unrestricted revenues from use
of money and property Miscellaneous Transfers
Total governmental activities
Business-type activities: Unrestricted revenues from use
of money and property Miscellaneous Transfers
Total business-type activities
Total primary government
Change in Net Position Governmental activities Business-type activities
Total primary government
2004
$ 998,041 $ 72,938 16,789
$ 1,087,768 $
$ 4,709,655 $
$ (19, 180,229) $ (567,567)
$ (19,747,796) $
$ 13,190,248 $ 2,021,305
423,550 854,444 597,177
2,227,495 2,651,634
191,814 75,420
(657,216)
$ 21,575,871 $
$ 24,132 $ 627
657,216
$ 681,975 $
$ 22,257,846 $
$ 2,395,642 $ 114,408
$ 2,510,050 $
99
2005 2006 2007
1,185,681 $ 1 '1 85,380 $ 1,261,870 77,592 66,982 85,533 16,393 23,975 19,626
1,279,666 $ 1,276,337 $ 1,367,029
4,824,710 $ 6,248,394 $ 5,535,416
(22,737,480) $ (23,908,051) $ (25, 730,587) (442,275) (599,887) (840,926)
(23,179,755) $ (24,507,938) $ (26,571 ,513)
15,058,380 $ 15,762,626 $ 17,743,425 2,317,974 2,401,773 2,486,192
545,606 556,542 567,994 963,485 1,130,956 1,326,139 665,463 733,059 740,306
2,823,964 3,107,199 3,057,021 2,520,022 2,836,695 2,822,212
423,668 729,779 1,467,557 78,567 180,730 1,962,010
(657,299) (634,154) (767, 116)
24,739,830 $ 26,805,205 $ 31,405,740
57,820 $ 125,164 $ 143,976 3,413 24,790
657,299 634,154 767,116
718,532 $ 784,108 $ 911,092
25,458,362 $ 27,589,313 $ 32,316,832
2,002,350 $ 2,897,154 $ 5,675,153 276,257 184,221 70,166
2,278,607 $ 3,081,375 $ 5,745,319

Table 2
Fiscal Year
2008 2009 2010 2011 2012 2013
$ 1,184,892 $ 1,266,573 $ 1,213,411 $ 1 '116,260 $ 1,063,507 $ 1,034,968 189,307 101,959 104,549 77,872 23,714 23,798 23,013 18,913 21,503 18,461 26,161
$ 1,397,997 $ 1,391,545 $ 1,336,873 $ 1,215,635 $ 1 '1 05,682 $ 1,061,129
$ 5,962,323 $ 9,794,546 $ 5,325,922 $ 5,650,602 $ 7,421,819 $ 11,180,407
$ (31 ,512,739) $ (26,965, 711) $ (31,204,126) $ (29, 116,837) $ (30,902,279) $ (27,694,806) (876,687) (668,633) (587,492) (629,768) (879,071) (1,056,166)
$ (32,389,426) $ (27,634,344) $ (31,791,618) $ (29,746,605) $ (31 ,781 ,350) $ (28,750,972)
$ 19,225,297 $ 20,100,078 $ 19,737,346 $ 19,903,929 $ 20,241,098 $ 22,519,602 2,484,176 2,337,807 2,238,747 2,226,190 2,292,809 2,392,591
565,841 556,865 547,407 542,034 537,280 537,855 1,616,873 1,529,343 1,538,143 1,541,967 1,520,806 1,522,050
831 ,582 855,953 723,687 775,021 851,571 913,827 2,777,979 2,579,150 2,662,945 2,642,418 2,687,544 2,791,478 2,669,612 2,895,242 2,766,489 2,706,042 2,761,428 2,741,009
1,461,742 462,662 240,641 145,518 74,448 78,229 8,211,798 3,643,804 272,957 239,873 1,710,031 743,278 (890, 124) (981 ,659) (948,313) (859,771) (1,111,015) (1 ,234,972)
$ 38,954,776 $ 33,979,245 $ 29,780,049 $ 29,863,221 $ 31,566,000 $ 33,004,947
$ 76,310 $ 32,743 $ 6,505 $ 4,938 $ 4,000 $ 4,676 3 1 '166 117 10,264 68 3,815
890,124 981,659 948,313 859,771 1,111,015 1,234,972
$ 966,437 $ 1,015,568 $ 954,935 $ 874,973 $ 1 '115,083 $ 1,243,463
$ 39,921,213 $ 34,994,813 $ 30,734,984 $ 30,738,194 $ 32,681,083 $ 34,248,410
$ 7,442,037 $ 7,013,534 $ (1 ,424,077) $ 746,384 $ 663,721 $ 5,310,141 89,750 346,935 367,443 245,205 236,012 187,297
$ 7,531,787 $ 7,360,469 $ (1 ,056,634) $ 991,589 $ 899,733 $ 5,497,438
100

COUNTY OF ROCKBRIDGE, VIRGINIA
Fund Balances of Governmental Funds Last Ten Fiscal Years (modified accrual basis of accounting)
2004
General fund Reserved $ 526,198 Unreserved 7,756,750 Nonspendable Restricted Committed Assigned Unassigned
Total general fund $ 8,282,948
All other governmental funds Restricted Assigned, reported in: Capital projects funds $ -
Unassigned, reported in: Special revenue funds Capital projects funds 11 '193,011
Total all other governmental funds $ 11,193,011
$
$
$
$
2005 2006 2007 2008
572,094 $ 1,597,814 $ 1,549,574 $ 1,404,760 9,181,652 10,578,376 13,409,914 14,292,634
9,753,746 $ 12,176,190 $ 14,959,488 $ 15,697,394
- $ - $ - $
4,946,271 14,314,160 10,582,108 6,620,625
4,946,271 $ 14,314,160 $ 10,582,108 $ 6,620,625
(1) The County implemented GASB 54 in fiscal year 2011, the fund balances for previous years have not been restated per GASB 54 classifications.
101

Table 3
2009 2010 2011 (1) 2012 2013
$ 1,863,469 $ 2,531,217 $ - $ - $ 15,037,799 13,602,863
102,799 121,348 116,671 1,018,434 1,002,603 1,075,361
856,172 646,172 707,419 1,259,523 2,061,918 1,934,997
14,124,282 15,284,213 17,219,353
$ 16,901,268 $ 16,134,080 $ 17,361,210 $ 19,116,254 $ 21,053,801
4,384,475
$ - $ - $ 278,115 $ 5,434,345 $ 254,255
(90,345) (947,976) 535,995 314,661 (229,603)
$ 535,995 $ 314,661 $ 187,770 $ 4,486,369 $ 4,409,127
102

COUNTY OF ROCKBRIDGE, VIRGINIA
Changes in Fund Balances of Governmental Funds Last Ten Fiscal Years (modified accrual basis of accounting)
Fiscal Year
2003 2004 2005 2006 2007 Revenues General property taxes $ 12,215,031 $ 13,468,616 $ 14,703,809 $ 15,926,023 $ 17,167,695 Other local taxes 5,941,358 6,123,971 7,316,492 7,929,529 8,177,652 Permits, privilege fees and regulatory licenses 223,126 251,559 449,386 437,233 377,199 Fines and forfeitures 32,965 40,230 66,080 71,574 80,978 Revenue from use of money and property 180,966 191,814 423,668 729,779 1,467,557 Charges for services 834,074 1,050,008 1,111,387 1,338,972 1,105,987 Miscellaneous 96,132 75,420 78,567 162,730 537,870 Recovered costs 190,333 490,319 502,562 974,760 1,748,308 Intergovernmental: Commonwealth 3,983,568 4,549,699 4,160,230 4,864,082 5,038,154 Federal 282,401 382,025 277,983 1,096,891 388,281
Total revenues $ 28,739,739 $ 26,623,661 $ 29,090,164 $ 33,531,573 $ 36,089,681
Expenditures General government administration $ 1,162,054 $ 1,316,118 $ 1,486,047 $ 1,623,703 $ 1,609,206 Judicial administration 503,983 610,563 605,384 1,068,975 1 '156,273 Public safety 3,540,944 3,960,581 4,088,831 4,273,230 4,863,985 Public works 2,065,034 1,985,848 3,144,564 2,506,206 2,413,698 Health and welfare 690,819 696,286 1 '128,269 1,021,506 1,429,744 Education 9,382,117 10,187,881 10,547,631 10,974,800 10,596,063 Parks, recreation and cultural 903,723 1,097,492 1,011,319 1,087,400 1 '124,798 Community development 1,207,784 1,086,868 1,392,441 2,131,787 2,258,256
Non-Departmental 1,070,839 1 '117,968 1,145,122 1,227,971 1,469,578 Capital projects 4,590,930 2,557,207 12,496,492 6,801,707 5,056,909 Debt service Principal 997,242 7,086,362 2,376,378 2,487,469 2,795,373 Interest and other fiscal charges 743,435 644,397 1,440,657 1,746,288 2,153,457
Bond issue costs
Total expenditures $ 26,858,904 $ 32,347,571 $ 40,863,135 $ 36,951,042 $ 36,927,340
Excess of revenues over (under} expenditures $ 1,880,835 $ (5,723,910) $ (11 ,772,971) $ (3,419,469) $ (837,659)
Other financing sources (uses} Transfers in $ (635,811} $ 278,708 $ 84,940 $ 1,059,250 $ 750,000 Transfers out (935,924} (742,239} ( 1 ,693,404} (1,517,116} Refunding bonds issued Bonds issued 1,000,000 17,878,104 6,469,871 15,620,130 Premium on bonds issued 213,677 Capital leases 161,614 206,471 970,780 223,826 150,314
Payment to refunded bond escrow agent
Total other financing sources (uses} $ 525,803 $ 17,427,359 $ 6,997,029 $ 15,209,802 $ (616,802)
Net change in fund balances $ 2,406,638 $ 11,703,449 $ {4,775,942) $ 11,790,333 $ (1 ,454,461}
Debt service as a percentage of noncapital expenditures 6.48% 25.95% 13.46% 14.04% 15.53%
103

Table 4
2008 2009 2010 2011 2012 2013
$ 19,267,635 $ 19,905,850 $ 19,568,375 $ 19,778,269 $ 20,928,182 $ 22,414,930 8,276,451 7,859,118 7,710,929 7,727,630 7,890,010 8,157,801
335,529 188,491 202,087 181,875 192,207 172,766 196,529 177,259 153,837 223,673 284,725 235,024
1,461,742 462,662 240,641 145,518 74,448 78,229 1,569,157 1,378,732 1,468,108 1,298,983 1,588,288 1,482,185
657,112 363,416 257,616 239,873 2,150,539 2,471,378 8,187,010 3,798,055 359,866 343,712 303,718 350,799
4,904,117 4,686,608 4,652,229 4,935,567 4,733,732 4,847,109 228,606 607,153 299,277 500,911 2,278,613 4,416,673
$ 45,083,888 $ 39,427,344 $ 34,912,965 $ 35,376,011 $ 40,424,462 $ 44,626,894
$ 1,592,669 $ 1,592,002 $ 1,774,607 $ 1,642,181 $ "1,612,340 $ 1,588,585 1,149,258 1,292,358 1,199,478 1,183,984 1,188,236 1,278,954 5,081,176 5,144,522 5,334,327 5,198,378 5,535,432 5,784,020 2,853,198 2,709,261 2,911,708 2,944,557 2,956,944 3,082,574 1,471,189 1,527,091 1,459,363 1,498,725 1,503,694 1,413,425
12,166,930 12,259,269 12,565,769 11,514,555 12,848,581 14,216,366 1,230,352 1,248,904 1,257,674 1,170,665 1,197,527 1,345,586 2,093,877 1,838,680 2,101,876 2,998,230 6,177,505 7,337,211 1,698,751 1,733,021 1,932,209 1,747,190 1,730,059 1,723,096
17,915,845 9,482,489 62,263 36,677 2,335,173 21,849,069
3,923,340 2,326,302 2,320,388 1,758,226 1,854,205 3,674,994 2,040,141 2,172,542 2,033,512 1,939,473 2,026,423 2,311,965
287,772
$ 53,216,726 $ 43,326,441 $ 34,953,174 $ 33,632,841 $ 40,966,119 $ 65,893,617
$ (8,132,838) $ (3,899,097) $ (40,209) $ 1,743,170 $ . (541 ,657) $ (21,266, 723)
$ 1,750,000 $ - $ 175,135 $ - $ 1,087,294 $ (2,640,124) (981,659) (1,123,448) (859,771) (2,1 98,309) (1,234,972)
11,760,000 6,000,000 7,500,000 21,895,000
2,533,876 157,000 216,840 206,315
! 13,086,006}
$ 5,266,876 $ (981,659) $ (948,313) $ (642,931) $ 6,595,300 $ 21,867,898
$ (2,865,962) $ (4,880,756) $ (988,522) $ 1,100,239 $ 6,053,643 $ 601,175
16.89% 13.29% 12.48% 11.01% 10.05% 13.59%
104

COUNTY OF ROCKBRIDGE, VIRGINIA
Assessed Value and Estimated Actual Value of Taxable Property Last Ten Fiscal Years
Fiscal Real Personal Mobile Year Estate Property Homes
2013 $ 2,406,225,814 $ 181,627,780 $ 6,529,754 2012 2,393,006,606 174,030,130 6,943,019 2011 2,381,260,966 168,167,630 9,112,766 2010 2,436,189,073 161,297,226 9,172,343 2009 2,403,426,774 185,101 ,529 9,042,587 2008 2,361 ,326,219 178,824,784 9,418,745 2007 2,329, 760,003 176,096,685 9,629,610 2006 1,925,857,100 161,836,619 9,040,714 2005 1,508,942,650 144,732,914 9,500,275 2004 1,474,592,453 111,618,056 9,428,608
Source: Commissioner of Revenue Real estate is assessed at 100% of market value.
105
Machinery Total Taxable and Public Assessed
Tools Service Value
$ 14,352,182 $ 130,966,279 $ 2,739,701,809 13,415,023 118,289,855 2, 705,684,633 10,822,737 113,384,467 2,682,748,566 11,287,004 92,656,310 2,710,601,956 11,098,157 85,950,278 2,694,619,325 11,110,174 99,002,561 2,659,682,483 10,784,021 104,485,747 2,630,756,066 9,153,108 76,590,621 2,182,478,162 8,822,636 87,857,810 1,759,856,285
18,327,547 98,018,619 1, 711 ,985,283

Table 5
Estimated Assessed Actual Value as a
Taxable Percentage of Value Actual Value
$ 2,739,701,809 100.00% 2,705,684,633 100.00% 2,682,748,566 100.00% 2,710,601 ,956 100.00% 2,694,619,325 100.00% 2,659,682,483 100.00% 2,630,756,066 100.00% 2, 182,478,162 100.00% 1,759,856,285 100.00% 1,711,985,283 100.00%
106

COUNTY OF ROCKBRIDGE, VIRGINIA
Property Tax Rates (1) Direct and Overlapping Governments Last Ten Fiscal Years
Real Estate Tax 1st 2nd Year Half Half
2013 $ 0.67 $ 0.67 2012 0.64 0.64 2011 0.61 0.61 2010 0.59 0.59 2009 0.59 0.59 2008 0.55 0.59 2007 0.55 0.55 2006 0.73 0.55 2005 0.685 0.73 2004 0.64 0.685
(1) Per $100 of assessed value. (2) Tax year refelcts calendar year
Table 6
Direct Rates
Personal Mobile Machinery Property Homes and Tools
$ 4.25 $ 0.67 $ 2.55 4.25 0.64 2.55 4.25 0.61 2.55 4.25 0.59 2.55 4.25 0.59 2.55 4.25 0.55 2.55 4.25 0.55 2.35 3.75 0.73 2.35 3.75 0.685 2.35 3.25 0.64 2.35
107

COUNTY OF ROCKBRIDGE, VIRGINIA
Property Tax Levies and Collections Last Ten Fiscal Years
Collected within the Fiscal Total Tax Year of the Lev~
Fiscal Levy for Percentage Year Fiscal Year (1) Amount of Levy
2013 $ 23,894,710 $ 23,332,287 97.65% $ 2012 23,041 ,039 22,189,814 96.31% 2011 21 ,983,597 21,203,088 96.45% 2010 21 ,601,653 20,791,246 96.25% 2009 22,272,956 21,510,651 96.58% 2008 21,315,874 20,582,879 96.56% 2007 20,300,479 18,785,345 92.54% 2006 18,873,765 17,083,003 90.51% 2005 16,929,945 15,896,003 93.89% 2004 15,006,213 14,438,618 96.22%
Source: Commissioner of Revenue, County Treasurer's office.
Table 7
Collections Total Collections to Date in Subsequent Percentage
Years Amount of Levy
- $ 23,332,287 97.65% 172,877 22,362,691 97.06% 365,902 21,568,990 98.11% 521,506 21,312,752 98.66% 567,812 22,078,463 99.13% 559,146 21 '142,025 99.18%
1,482,598 20,267,943 99.84% 1,762,564 18,845,567 99.85% 1,007,674 16,903,677 99.84%
537,864 14,976,482 99.80%
(1) Exclusive of penalties and interest, includes Commonwealth of Virginia PPTRA reimbursement.
108

COUNTY OF ROCKBRIDGE, VIRGINIA Table 8
Principal Property Taxpayers Current Year and the Period Nine Years Prior
Fiscal Year 2013 Fiscal Year 2004 2013 %of Total 2004 % ofTotal
Type Assessed Assessed Assessed Assessed Taxpayer Business Valuation Valuation Valuation Valuation
Lexington Retirement Community, Inc. Health Provider 27,726,900 1.152% 11,138,500 0.755%
Stonewaii/Medusa/CWB&S/Barger Real Estate & Industry 20,980,790 0.872% 14,319,700 0.971%
White's/Lee Hi/Berkstresser Industry & Service 18,503,000 0.769% 10,913,600 0.740%
Natural Bridge of Virginia, LLC Hospitality 17,138,400 0.712% 8,431,700 0.572%
Wai-Mart Real Estate Business Trust Retail 8,992,900 0.374% 7,586,200 0.514%
Aladdin Manufacturing Corporation Industry 8,978,700 0.373% 14,705,600 0.997%
Elmech, Inc. (Wingate Hotel) Hospitality 8,415,600 0.350% 3,009,000 0.204%
Lowe's Home Center Retail 7,912,500 0.329% 413,800 0.028%
West Airs lie Farms, LLC Agriculture 3,795,700 0.158% 5,310,200 0.360%
Laurie Jeanne Landeau Individual 3,634,600 0.151% 6,716,700 0.455% 126,079,090 5.241% 82,545,000 5.598%
Source: Commissioner of Revenue
109

COUNTY OF ROCKBRIDGE, VIRGINIA Ratio of Net General Bonded Debt to Assessed Value and Net Bonded Debt Per Capita Last Ten Fiscal Years
Gross Less: and Debt Net Service
Fiscal Assessed Bonded Monies Year Population (1) Value (2) Debt (3) Available
2013 22,090 2,406,225,814 66,584,792 2012 22,307 2,393,006,606 45,963,268 2011 22,307 2,381 ,260, 966 40,486,947 2010 22,307 2,436, 189,073 42,006,156 2009 22,498 2,403,426, 77 4 44,15{212 2008 22,450 2,361,326,219 46,190,760 2007 22,313 2,329,760,003 43,845,628 2006 22,379 1,925,857,100 46,363,901 2005 21,737 1,508,942,650 31,977,315 2004 21,570 1,400,236,275 28,411,746
(1) www.coopercenter.org (2) Real property assessed at 100% of fair market value. (3) Includes all long-term general obligation bonded debt, bonded anticipation notes,
and literary fund loans. Excludes landfill closure/post-closure care liability, capital leases, and compensated absences.
110
Table 9
Ratio of Net Bonded Net
Net Debt to Bonded Bonded Assessed Debt per
Debt Value Capita
66,584,792 2.77% 3,014 45,963,268 1.92% 2,060 40,486,947 1.70% 1,815 42,006,156 1.72% 1,883 44,154,212 1.84% 1,963 46,190,760 1.96% 2,057 43,845,628 1.88% 1,965 46,363,901 2.41% 2,072 31,977,315 2.12% 1,471 28,411,746 2.03% 1,317

COUNTY OF ROCKBRIDGE, VIRGINIA
Demographic and Economic Statistics Last Ten Fiscal Years
Personal Fiscal Income Year Population ($million)*
2013 22,090 989 2012 22,155 989 2011 22,307 989 2010 22,498 989 2009 22,450 989 2008 22,313 989 2007 22,379 989 2006 21,737 989 2005 21,570 N/A 2004 21,371 N/A
Per Capita Personal Income*
$28,442 $28,442 $28,442 $28,442 $28,442 $28,442 $28,442 $28,442
N/A N/A
Table 10
Median School Unemploy~
Age Enrollment ment Rate
47 2,505 6.00% 40 2,498 5.60% 40 2,498 5.90% 40 2,650 6.30% 40 2,677 6.70% 40 2,801 4.10% 40 2,714 2.90% 40 2,748 2.70% N/A 2,724 3.10% N/A 2,765 3.20%
Sauce: www.fedstats.gov, www.bls.gov, Weldon Cooper Center, & Rockbridge County School Division.
*Data as of 2006. Independent cities of Buena Vista and Lexington included with Rockbridge County. Data not available separately.
111

COUNTY OF ROCKBRIDGE, VIRGINIA Table 11
Principal Employers Current Year and Nine Years Ago
Fiscal Year 2013 Fiscal Year 2004 %of Total %of Total
County County Em1;1lo~er EmEio~ees Rank EmEio~ment EmEio~ees Rank EmEio~ment
Mohowk* 750 1 12.39% Walmart 266 2 4.40% Whites Travel Center 170 3 2.81% Kendall 154 4 2.54% Rockbridge Community Services Board 146 5 2.41% Vesuvius Corporation 120 6 1.98% Lowes 111 7 1.83% Fitzgerald Lumber 84 8 1.39% Natural Bridge Hotel (off season) 75 9 1.24% Stella Jones (Burke Parsons Bowlby Corp)** 50 10 0.83% Totals 1,926 31.82%
*Fi!=!ures do not include temporary employees- with temporary employees, employment is at 800. Businesses with 2004 Employment figure marked n/a do not maintain their records that far back.
Sources: Individual company human resource departments. Note: Excludes government, schools, and state/local agencies.
112
900 n/a 0.00% n/a n/a 0.00% n/a n/a 0.00% 120 n/a 0.00% n/a n/a 0.00% n/a n/a 0.00% n/a n/a 0.00% 75 n/a 0.00% 75 n/a 0.00% n/a n/a 0.00% n/a n/a

COUNTY OF ROCKBRIDGE, VIRGINIA
Full-time Equivalent County Government Employees by Function Last Ten Fiscal Years
Fiscal Year
Function 2004 2005 2006 2007 2008
General government 24 24 25 25 25 Judicial administration 11 12 12 13 13 Public safety
Sheriffs department 36 36 36 38 38 Building inspections 4 4 4 4 4 Animal control 2 2 2 2 2
Public works General maintenance 6 6 6 6 6 Landfill 14 14 14 16 16 Engineering 1 1 1 1 1
Health and welfare Department of social services 26 25 25 25 25
Culture and recreation Parks and recreation 3 3 3 3 3
Community development Planning 3 3 4 4 4
Totals 130 130 132 137 137
Source: Individual county departments
113

Table 12
Fiscal Year
2009 2010 2011 2012 2013
22 22 21 21 21 12 12 12 12 12
36 38 38 38 38 5 4 4 4 4 2 2 2 2 2
6 6 6 6 6 15 15 10 10 10 1
25 25 25 25 25
3 3 3 3 3
5 5 5 5 5
132 132 126 126 126
114

COUNTY OF ROCKBRIDGE, VIRGINIA
Operating Indicators by Function Last Ten Fiscal Years
Function
Fire and rescue: Number of calls answered
Building inspections: Permits issued
Landfill: Refuse collected (tons/day) Recycling (tons/day)
Health and welfare Department of Social Services:
Case load
2004
4,549
724
142 9
717
Fiscal Year
2005 2006
2,443 1,671
589 535
140 160 12 14
1,495 2,342
*Calls dispatched; excludes Lexington and Buena Vista Fire and Rescue **Tons per day based on 287 work days
2007
3,829
688
167 15
2,412
***Includes cities of Buena Vista and Lexington, excludes private enterprises Source: Individual county departments--only information that is currently available.
115
2008
4,962
409
113 15
2,850

Table 13
Fiscal Year
2009 2010 2011 2012 2013
4,876 4,876 4,983 5,636 4791*
281 294 310 274 310
110 97 138** 138** 141** 16 13 11 *** 11*** 13***
2,931 3,622 6,714 6,714 6,366
116

COUNTY OF ROCKBRIDGE, VIRGINIA
Capital Asset Statistics by Function Last Ten Fiscal Years
Fiscal Year
Function 2004 2005 2006 2007
General government Administration buildings 1 1 1 1
Public safety Building inspections:
Vehicles 3 3 3 4 Animal control:
Vehicles 2 2 2 2 Landfill:
Sites 1 1 1 1 Health and welfare
Department of Social Services: Vehicles 1 1 1
Culture and recreation Parks and recreation: Vehicles 3 3 3 3 Swimming pools 2 2 2 2
Community development Planning: Vehicles 3 3 3 3
Sheriff (Law Enforcement): Vehicles 37 37 37 37
Source: Individual county departments--only information that is currently available
117

Table 14
Fiscal Year
2008 2009 2010 2011 2012 2013
1 1 1 1 1 1
4 4 4 3 3 3
2 2 2 2 2 2
1 1 1 1 1 1
1 1 1 4 4 4
3 3 3 3 3 3 2 2 2 2 2 2
3 3 3 3 3 3
37 38 38 39 39 39
118

COUNTY OF ROCKBRIDGE, VIRGINIA
Schedule of the City of Lexington's and Buena Vista's Share of Certain General Government Expenditures Year Ended June 30, 2013
Total State and City of Lexington Share Cost to Other Net County
Description the County Reimbursement Cost %Used Total Cost
Clerk of the Circuit Court $ 364,743 $ 251,016 $ 113,727 24.95% $ 28,375
Circuit Court- Expenses 59,209 59,209 24.95% 14,773
General District and J&D Court 23,450 23,450 24.95% 5,851
Courthouse Maintenance 298,224 298,224 24.95% 74,407
Administration Building, 150 S. Main Street 225,346 225,346 5.90% 13,295
25th Court Services Unit-Juvenile Probation 4,726 4,726 20.37% 963
Commonwealth's Attorney 427,774 312,824 114,950 24.95% 28,680
Sheriffs Salary 110,262 89,339 20,923 24.95% 5,220
Advancement of Agriculture (City Agent) 134,655 134,655 15.00% 20,198
Totals $ 1,648,389 $ 653,179 $ 995,210 $ 191,762
119

Table 15
City of Buena Vista Share
%Used Total Cost
$ - $
18.34% 867
$ 867
120

THIS PAGE LEFT BLANK INTENTIONALLY

COMPLIANCE


ROBINSON~ FARMJER9 Cox ASSOCIATES CERTIFIED PUBLIC ACCOUNTANTS A PROFESSIONAL LIMITED LIABILITY COMPANY
INDEPENDENT AUDITORS' REPORT ON INTERNAL CONTROL OVER FINANCIAL REPORTING AND ON COMPLIANCE AND OTHER MATTERS BASED ON AN AUDIT OF FINANCIAL STATEMENTS PERFORMED IN
ACCORDANCE WITH GOVERNMENT AUDITING STANDARDS
TO THE HONORABLE MEMBERS OF THE BOARD OF SUPERVISORS COUNTY OF ROCKBRIDGE, VIRGINIA
We have audited, in accordance with the auditing standards generally accepted in the United States of America; the standards applicable to financial audits contained in Government Auditing Standards, issued by the Comptroller General of the United States; and the Specifications for Audits of Counties, Cities, and Towns, issued by the Auditor of Public Accounts of the Commonwealth of Virginia, the financial statements of the governmental activities, the business-type activities, the discretely presented component units, each major fund and the aggregate remaining fund information of the County of Rockbridge, Virginia, as of and for the year ended June 30, 2013, and the related notes to the financial statements, which collectively comprise the County of Rockbridge, Virginia's basic financial statements, and have issued our report thereon dated December 6, 2013.
Internal Control Over Financial Reporting
In planning and performing our audit of the financial statements, we considered County of Rockbridge, Virginia's internal control over financial reporting (internal control) to determine the audit procedures that are appropriate in the circumstances for the purpose of expressing our opinions on the financial statements, but not for the purpose of expressing an opinion on the effectiveness of County of Rockbridge, Virginia's internal control. Accordingly, we do not express an opinion on the effectiveness of County of Rockbridge, Virginia's internal control.
A deficiency in internal control exists when the design or operation of a control does not allow management or employees, in the normal course of performing their assigned functions, to prevent, or detect and correct, misstatements on a timely basis. A material weakness is a deficiency, or a combination of deficiencies, in internal control, such that there is a reasonable possibility that a material misstatement of the entity's financial statements will not be prevented, or detected and corrected on a timely basis. A significant deficiency is a deficiency, or a combination of deficiencies, in internal control that is less severe than a material weakness, yet important enough to merit attention by those charged with governance.
Our consideration of internal control was for the limited purpose described in the first paragraph of this section and was not designed to identify all deficiencies in internal control that might be material weaknesses or, significant deficiencies. Given these limitations, during our audit we did not identify any deficiencies in internal control that we consider to be material weaknesses. However, material weaknesses may exist that have not been identified.
121

Compliance and Other Matters
As part of obtaining reasonable assurance about whether County of Rockbridge, Virginia's financial statements are free from material misstatement, we performed tests of its compliance with certain provisions of laws, regulations, contracts, and grant agreements, noncompliance with which could have a direct and material effect on the determination of financial statement amounts. However, providing an opinion on compliance with those provisions was not an objective of our audit, and accordingly, we do not express such an opinion. The results of our tests disclosed no instances of noncompliance or other matters that are required to be reported under Government Auditing Standards.
Purpose of this Report
The purpose of this report is solely to describe the scope of our testing of internal control and compliance and the results of that testing, and not to provide an opinion on the effectiveness of the entity's internal control or on compliance. This report is an integral part of an audit performed in accordance with Government Auditing Standards in considering the entity's internal control and compliance. Accordingly, this communication is not suitable for any other purpose.
Staunton, Virginia December 6, 2013
122

ROBINSON? fARMER? COX ASSOCIATES CERTIFIED PUBLIC ACCOUNTANTS A PROFESSIONAL LIMITED LIABILITY CO/v!PANY
INDEPENDENT AUDITORS' REPORT ON COMPLIANCE FOR EACH MAJOR PROGRAM AND ON INTERNAL CONTROL OVER COMPLIANCE REQUIRED BY OMB CIRCULAR A-133
TO THE HONORABLE MEMBERS OF THE BOARD OF SUPERVISORS COUNTY OF ROCKBRIDGE, VIRGINIA
Report on Compliance for Each Major Federal Program
We have audited County of Rockbridge, Virginia's compliance with the types of compliance requirements described in the OMB Circular A-133 Compliance Supplement that could have a direct and material effect on each of County of Rockbridge, Virginia's major federal programs for the year ended June 30, 2013. County of Rockbridge, Virginia's major federal programs are identified in the summary of auditors' results section of the accompanying schedule of findings and questioned costs.
Management's Responsibility
Management is responsible for compliance with the requirements of laws, regulations, contracts, and grants applicable to its federal programs.
Auditors' Responsibility
Our responsibility is to express an opinion on compliance for each of County of Rockbridge, Virginia's major federal programs based on our audit of the types of compliance requirements referred to above. We conducted our audit of compliance in accordance with auditing standards generally accepted in the United States of America; the standards applicable to financial audits contained in Government Auditing Standards, issued by the Comptroller General of the United States; and OMB Circular A-133, Audits of States, Local Governments, and Non-Profit Organizations. Those standards and OMB Circular A-133 require that we plan and perform the audit to obtain reasonable assurance about whether noncompliance with the types of compliance requirements referred to above that could have a direct and material effect on a major federal program occurred. An audit includes examining, on a test basis, evidence about County of Rockbridge, Virginia's compliance with those requirements and performing such other procedures as we considered necessary in the circumstances.
We believe that our audit provides a reasonable basis for our opinion on compliance for each major federal program. However, our audit does not provide a legal determination of County of Rockbridge, Virginia's compliance.
Opinion on Each Major Federal Program
In our opinion, County of Rockbridge, Virginia complied, in all material respects, with the types of compliance requirements referred to above that could have a direct and material effect on each of its major f~deral programs for the year ended June 30, 2013.
123

Report on Internal Control Over Compliance
Management of County of Rockbridge, Virginia is responsible for establishing and maintaining effective internal control over compliance with the types of compliance requirements referred to above. In planning and performing our audit of compliance, we considered County of Rockbridge, Virginia's internal control over compliance with the types of requirements that could have a direct and material effect on each major federal program to determine the auditing procedures that are appropriate in the circumstances for the purpose of expressing an opinion on compliance for each major federal program and to test and report on internal control over compliance in accordance with OMB Circular A-133, but not for the purpose of expressing an opinion on the effectiveness of internal control over compliance. Accordingly, we do not express an opinion on the effectiveness of County of Rockbridge, Virginia's internal control over compliance.
A deficiency in internal control over compliance exists when the design or operation of a control over compliance does not allow management or employees, in the normal course of performing their assigned functions, to prevent, or detect and correct, noncompliance with a type of compliance requirement of a federal program on a timely basis. A material weakness in internal control over compliance is a deficiency, or combination of deficiencies, in internal control over compliance, such that there is a reasonable possibility that material noncompliance with a type of compliance requirement of a federal program will not be prevented, or detected and corrected, on a timely basis. A significant deficiency in internal control over compliance is a deficiency, or a combination of deficiencies, in internal control over compliance with a type of compliance requirement of a federal program that is less severe than a material weakness in internal control over compliance, yet important enough to merit attention by those charged with governance.
Our consideration of internal control over compliance was for the limited purpose described in the first paragraph of this section and was not designed to identify all deficiencies in internal control over compliance that might be material weaknesses or significant deficiencies. We did not identify any deficiencies in internal control over compliance that we consider to be material weaknesses. However, material weaknesses may exist that have not been identified.
The purpose of this report on internal control over compliance is solely to describe the scope of our testing of internal control over compliance and the results of that testing based on the requirements of OMB Circular A-133. Accordingly, this report is not suitable for any other purpose.
Staunton, Virginia December 6, 2013
124

County of Rockbridge, Virginia Schedule of Expenditures of Federal Awards For the Year Ended June 30, 2013
Pass-through Federal Entity
Federal Grantor/State Pass -Through Grantor/ CFDA Identifying Federal Program or Cluster Title Number Number Exeenditures
Department of Agriculture: Pass Through Payments: Child Nutrition Cluster
Department of Agriculture: Food Distribution 10.555 40623 $ 70,620
Department of Education: National School Lunch Program 10.555 40623 466,584
Total School Lunch Program $ 537,204
School Breakfast Program 10.553 40591 $ 129,549
Schools and Roads - Grants to States 10.665 43841 80,891
Total Department of Agriculture $ 747,644
Department of Commerce: Pass Though Payments: Department of Commerce:
Broadband Technology Opportunities Program 11.557 Not/Available $ 4,110,155
Environmental Protection Agency: Pass Through Payments:
Department of Environmental Quality: DEQ Royalty Grants 66.000 Not/Available $ 872
Department of Homeland Security: Pass Through Payments: Department of Emergency Services: State Homeland Security Program 97.073 Not/Available $ 51,228 Hazard Mitigation Grant 97.039 Not/Available 19,000
Total Department of Homeland Security $ 70,228
Department of Housing and Urban Development: Pass Through Payments:
Department of Housing and Community Development: Section 8 Housing Assistance Payments Program 14.195 Not/Available $ 56,582 Community Development Block Grants/State's Program and Non-
Entitlement Grants in Hawaii 14.228 Not/Available $ 30,000
Total Department of Housing and Urban Development $ 86,582
125

County of Rockbridge, Virginia Schedule of Expenditures of Federal Awards (Continued) For the Year Ended June 30, 2013
Federal Grantor/State Pass -Through Grantor/ Program or Cluster Title
Department of Justice: Pass Through Payments: Department of Criminal Justice Service: Violence Aagainst Women Formula Grants
Department of Transportation: Pass Through Payments: Department of Motor Vehicles:
State and Cmmunity Highway Safety
Department of Education: Pass Through Payments: Department of Education: Adult Education-Basic Grants to States Title 1: Grants to Local Educational Agencies Special Education Cluster
Title Vl-8: Special Education Grants to States Title Vl-8: Special Education Preschool Grant
Career and Technical Education - Basic Grants to States Improving Teacher Quality State Grants Twenty-First Century Community Learning Centers Action Against Poverty ARRA- Education Technolo~y State Grants
Total Department of Education
Total Expenditures of Federal Awards
NOTE 1-BASIS OF PRESENTATION
Federal CFDA
Number
16.588
20.600
84.002 84.010
84.027 84.173 84.048 84.367 84.287 84.000 84.386
Pass-through Identifying
Number Federal
Expenditures
2009-WF-AX0037 $ -----=3:..::3.!.,.;., 1...:..4 7=--
SC-2010 50364 3984 $ ___ ,;_14"-'-'"--37;,::9'-
42801 $ 68,470 42901 526,829
43071 668,062 NoV Available 14,759
61095 51' 197 61480 122,059 60565 529,526
Not/Available 65,304 NoV Available 286
$ 2,046,492
$ 7,109,499
The accompanying schedule of expenditures of federal awards (the Schedule) includes the federal grant activity of the County of Rockbridge, Virginia under programs of the federal government for the year ended June 30, 2013. The information in this Schedule is presented in accordance with the requirements of OMS Circular A-133, Audits of States, Local Governments, and NonProfit Organizations. Because the Schedule presents only a selected portion of the operations of the County of Rockbridge, Virginia, it is not intended to and does not present the financial position, changes in net position, or cash flows of the County of Rockbridge, Virginia.
NOTE 2-SUMMARY OF SIGNIFICANT ACCOUNTING POLICIES
(1) Expenditures reported on the Schedule are reported on the accrual basis of accounting. Such expenditures are recognized following the cost principles contained in OMS Circular A-87, Cost Principles for State, Local and Indian Tribal Governments, wherein certain types of expenditures are not allowable or are limited as to reimbursement. (2) Pass-through entity identifying numbers are presented where available.
NOTE 3-FOOD DISTRIBUTION
Nonmonetary assistance is reported in the schedule at the fair market value of the commodities received and disbursed. At June 30, 2013, the County had food commodities totaling $40,531 in inventory.
NOTE 4- RELATIONSHIP TO FINANCIAL STATEMENTS
Federal expenditures, revenues, and capital contributions are reported in the County's basic financial statements as follows:
Intergovernmental federal revenues per the basic financial statements: Primary government:
Governmental funds General fund Broadband Technology Opportunities Program Department of the Interior- Payment in Lieu of Taxes
Total primary government
Discretely presented component unit- School Board: School operating fund School cafeteria fund
Total discretely presented component unit- School Board
Total federal expenditures per the Schedule of Expenditures of Federal awards
126
$ 306,518 4,110,155 (101,310)
$ 4,315,363
$ 2,101,825 692,311
$ 2,794,136
$ 7,109,499

Financial Statements
Type of auditors' report issued
Internal control over financial reporting:
- Material weal<ness(es) identified?
- Significant deficiency(ies) identified?
COUNTY OF ROCKBRIDGE, VIRGINIA Schedule of Findings and Questioned Costs
For the Year Ended June 30, 2013
Section 1-Summary of Auditors' Results
Noncompliance material to financial statements noted?
Federal Awards
Internal control over major programs:
- Material weakness(es) identified?
- Significant deficiency(ies) identified?
Type of auditors' report issued on compliance for major programs
Any audit findings disclosed that are required to be reported
in accordance with section 510(a) of Circular A-133?
Identification of major programs:
CFDA Numbers Name of Federal Program or Cluster 11.557 ..................... Broadband Technology Opportunities Program
Dollar threshold used to distinguish between type A and type B programs:
Auditee qualified as low-risk auditee?
Section 11-Financial Statement Findings
There are no financial statement findings to report.
Section Ill-Federal Award Findings and Questioned Costs
There are no federal award findings and questioned costs to report.
Section IV-Summary Schedule of Prior Year Findings
There were no prior year findings.
127
unmodified
yes x no
yes .2:_ none reported
yes x no
yes x no
yes .2:_ none reported
unmodified
yes x no
$300,000
x yes no

THIS PAGE LEFT BLANK INTENTIONALLY