c o m p r e h e n s i v e h o u s i n g m a r k e t a n a ...aleneid_comp_12.pdfcoeur d’alene,...
TRANSCRIPT

C O M P R E H E N S I V E H O U S I N G M A R K E T A N A L Y S I S
As of January 1, 2012U.S. Department of Housing and Urban Development Office of Policy Development and Research
Coeur d’Alene, Idaho
Bonner
Shoshone
Spokane
Latah
Whitman
Benewah
PendOreille L
inco
ln
Sanders
Clearwater
Kootenai
Mon
tana
Idaho
Was
hing
ton
Housing Market Area
Market DetailsEconomic Conditions ............... 2
Population and Households ..... 4
Housing Market Trends ............ 6
Data Profile ............................... 9
Summary
The Coeur d’Alene Housing Market Area (HMA), which consists of Koo-tenai County, is located in northwest Idaho, on the Idaho/Washington border. Situated on the northern shore of Lake Coeur d’Alene, the HMA attracts tourists and retirees from California and Wash-ington for its quality of life, beautiful sur roundings, and relatively low housing costs.
Economy The economy in the Coeur d’Alene HMA is primarily based on the gov - ernment, trade, and leisure and hos-pitality sectors. The largest employers include Kootenai Health, Center Part-ners, and the Coeur d’Alene Resort. Economic conditions remain weak in the HMA since job losses began in 2009, as nonfarm payrolls averaged 52,700 during 2011, a decrease of 100 jobs, or 0.2 percent, compared with nonfarm payrolls recorded during 2010. Nonfarm payrolls are estimated to increase by 2 percent a year during the 3-year forecast period.
Sales MarketThe sales housing market in the HMA is soft, with an estimated vacancy rate of 3.2 percent because of the declining in-migration of retirees. In 2011, home sales fell 4 percent to 2,975 homes, down from the number sold during 2010. Demand is estimated for 1,400 new homes during the forecast period (including 100 mobile homes). The 200 homes under construction may meet a portion of that demand (Table 1). In addition, the HMA has an estimated 6,825 other vacant units,
a portion of which may come back on the market and satisfy some of the demand.
Rental MarketRental housing market conditions in the HMA are tight, with an overall rental vacancy rate estimated at 5.5 percent, down from the 7.7-percent rate recorded in April 2010. During the forecast period, demand is estimated for about 1,050 new rental units. The 250 rental units currently under con - struction will satisfy some of the fore - cast rental demand (Table 1).
Notes: Total demand represents estimated production necessary to achieve a balanced market at the end of the forecast period. Units under construction as of January 1, 2012. A portion of the estimated 6,825 other vacant units in the HMA will likely satisfy some of the forecast demand. Sales demand includes an estimated demand for 100 mobile homes.
Source: Estimates by analyst
Coeur d’Alene HMA
SalesUnits
RentalUnits
Total Demand 1,400 1,050
Under Construction 200 250
Table 1. Housing Demand in the Coeur d’Alene HMA, 3-Year Forecast, January 1, 2012 to January 1, 2015

Co
eu
r d’
Ale
ne
, ID
• C
OM
PR
EH
EN
SIV
E H
OU
SIN
G M
AR
KE
T A
NA
LYS
IS
2Economic Conditions
Economic conditions have been weak in the Coeur d’Alene
HMA since 2009 but are beginning to improve. During 2011, the HMA lost 100 nonfarm payroll jobs, or 0.2 per - cent, compared with the loss of 900 nonfarm payroll jobs, or 1.7 percent, during 2010. Nonfarm payrolls expe - rienced their first decline in 20 years starting in 2009, falling by 3,600 jobs, or 6.3 percent, compared with the non - farm payrolls recorded during 2008. From 2003 through 2007, nonfarm payrolls in the HMA increased by an average of 2,700 jobs, or 5.1 percent, each year because of increased em - ployment in the construction subsector and the wholesale and retail trade and financial activities sectors to accom-modate an influx of retirees migrating from California and Washington. As the housing market began to soften and the nation’s economic conditions began to weaken, the HMA lost 3,600 jobs, or 6.3 percent, in 2009, compared with the number of jobs in 2008. Dur-ing 2011, the average unemployment rate remained relatively unchanged at 10.9 percent compared with 11 percent during 2010. Figure 1 shows labor force, resident employment, and un-employment rate trends in the HMA since 2000.
The number of jobs in most of the service-providing sectors either in - creased or remained the same during
2011, led by the addition of approx-imately 125 jobs, or 1.9 percent, in the leisure and hospitality sector. The leisure and hospitality sector has a significant effect on the local economy. Coeur d’Alene is known as a premier resort destination in the Pacific North - west and is popular among golf en - thusiasts for featuring the world’s only movable floating green. The sector is the third largest in the HMA and accounts for approximately 14 percent of nonfarm payrolls, with an average of 7,275 jobs during 2011. After 2 years of flat to negative growth, the leisure and hospitality sector is re - bounding. According to the Idaho Department of Commerce, during the 12 months ending November 2011 (the latest data available), lodging revenues in the HMA increased for the first time in 2 years to $2.6 billion), an increase of nearly 9 percent from the previous 12 months.
Job growth also occurred in the wholesale and retail trade, education and health services, and transporta-tion and utilities sectors during 2011, which added 75, 50, and 25 jobs, or 0.8, 0.5, and 2.3 percent, respectively, compared with the number of jobs in 2010 (Table 2). The education and health services sector has been the fastest growing sector in the HMA during the past decade, adding 2,900 jobs, an 80-percent increase, up from 2000 through 2010. Figure 2 illustrates the percentage change in nonfarm payrolls by sector from 2000 to the current date. Because of the aging population and growth in retiree in- migration, the education and health services sector is expected to continue to add new jobs during the forecast period as demand increases for health - care services from the population that is 65 years of age and older.
Source: U.S. Bureau of Labor Statistics
Figure 1. Trends in Labor Force, Resident Employment, and Unemploy-ment Rate in the Coeur d’Alene HMA, 2000 Through 2010
Labo
r Fo
rce
&
Res
iden
t Em
ploy
men
t
Une
mpl
oym
ent R
ate
75,000
70,000
65,000
60,000
55,000
50,000
45,000
2000
2002
2004
Labor Force Resident Employment Unemployment Rate
12.0
10.0
8.0
6.0
4.0
2.0
0.0
2006
2001
2003
2005
2007
2009
2010
2008

Co
eu
r d’
Ale
ne
, ID
• C
OM
PR
EH
EN
SIV
E H
OU
SIN
G M
AR
KE
T A
NA
LYS
IS
3Economic Conditions Continued
Figure 2. Sector Growth in the Coeur d’Alene HMA, Percentage Change, 2000 to Current
Note: Current is based on 12-month averages through December 2011.
Source: U.S. Bureau of Labor Statistics
Total Nonfarm Payroll Jobs
Goods Producing
Mining, Logging, & Construction
Manufacturing
Service Providing
Information
Financial Activities
Professional & Business Services
Education & Health Services
Government
Other Services
Leisure & Hospitality
Transportation & Utilities
Wholesale & Retail Trade
0 10 20 30 40 50 60 70 80 90– 10– 20– 40– 50 – 30
Notes: Based on 12-month averages through December 2010 and December 2011. Numbers may not add to totals because of rounding.
Source: U.S. Bureau of Labor Statistics
Table 2. 12-Month Average Nonfarm Payroll Jobs in the Coeur d’Alene HMA, by Sector
12 MonthsEnding
December 2010
12 MonthsEnding
December 2011
Percent Change
Total Nonfarm Payroll Jobs 52,800 52,700 – 0.2Goods Producing 7,725 7,550 – 2.3
Mining, Logging, & Construction 3,725 3,575 – 4.0Manufacturing 4,000 3,975 – 0.6
Service Providing 45,100 45,150 0.1Wholesale & Retail Trade 9,125 9,200 0.8Transportation & Utilities 1,075 1,100 2.3Information 670 600 – 11.1Financial Activities 3,100 3,050 – 1.6Professional & Business Services 5,925 5,900 – 0.3Education & Health Services 6,475 6,525 0.5Leisure & Hospitality 7,150 7,275 1.9Other Services 1,700 1,700 0.0Government 9,900 9,850 – 0.6
The government sector is the largest nonfarm payroll sector in the HMA. The sector accounts for approximately 19 percent of nonfarm payrolls in the HMA, with an average of 9,850 jobs during 2011, down 50 jobs, or 0.6 per - cent, from 2010 (Figure 3). Of the 10 largest employers in the HMA, 4 are government entities, including Koo - tenai Health, North Idaho College,
Kootenai County government, and the city government of Coeur d’Alene. The publicly funded Kootenai Health is the largest employer in the area, with approximately 1,850 employees. Table 3 shows major employers in the HMA. Job growth in the government sector is expected to increase during the forecast period as a result of the $9.5 million Kootenai Technical

Co
eu
r d’
Ale
ne
, ID
• C
OM
PR
EH
EN
SIV
E H
OU
SIN
G M
AR
KE
T A
NA
LYS
IS
4Economic Conditions Continued
Figure 3. Current Nonfarm Payroll Jobs in the Coeur d’Alene HMA, by Sector
Note: Based on 12-month averages through December 2011.
Source: U.S. Bureau of Labor Statistics
Government 18.7%
Leisure & Hospitality 13.8%
Other Services 3.2%
Education & Health Services 12.4%Professional & Business Services 11.2%
Transportation & Utilities 2.1%
Wholesale & Retail Trade 17.4%
Manufacturing 7.5%
Mining, Logging, & Construction 6.8%
Information 1.1%
Financial Activities 5.8%
Table 3. Major Employers in the Coeur d’Alene HMA
Name of Employer Nonfarm Payroll Sector Number of Employees
Kootenai Health Government 1,850Center Partners Professional & Business Services 1,750Coeur d’Alene Resort Leisure & Hospitality 950Coeur d’Alene Casino Resort Hotel Leisure & Hospitality 850North Idaho College Government 850Kootenai County Government Government 750Wal-Mart Stores, Inc. Wholesale & Retail Trade 750City of Coeur d’Alene Government 350Esterline Technologies Corporation Manufacturing 350Flexcel International, Inc. Wholesale & Retail Trade 350
Note: Excludes local school districts.
Source: Idaho Board of Labor
Education Campus, which broke ground in October 2011. The new vocational high school is expected to open by the fall of 2012 and will offer occupational programs in health, welding, construction, and
automotive jobs to high school juniors and seniors in the Coeur d’Alene, Post Falls, and Lakeland school districts.
All goods-producing sectors posted declines during 2011. The mining, logging, and construction sector lost the largest number of jobs, declining by 150 jobs, or 4 percent, compared with the number of jobs in 2010. Since 2007, the HMA has lost 2,500 construction jobs because of the soft residential and commercial real estate markets. During the same period, the mining and logging subsector lost an average of 100 jobs annually, leaving the HMA with only one remaining active lumber mill. Although manu-facturing job growth has remained flat, with an average of 3,975 jobs during 2011, the sector is expected to add jobs during the forecast period. In October 2011, Ground Force Manu -facturing, a global manufacturer of underground mining equipment, broke ground on an expansion that is expected to create 150 new jobs by the time it is completed in April 2012.
During the 3-year forecast period, nonfarm payrolls are estimated to grow at an average annual rate of 830 jobs, or 1.6 percent, to 55,900 jobs.
Population and Households
The population of the Coeur d’Alene HMA is currently
estimated at 141,500, indicating an average annual increase of 1,725, or 1.2 percent, from the 2010 Census. (See Table DP-1 at the end of this report.) From 2000 through 2010, population growth in the HMA averaged 2,975,
or 2.7 percent. From 2000 through 2010, net in-migration averaged approximately 2,275 annually, ac-counting for 77 percent of population growth. Figure 4 shows the compo-nents of population change in the HMA from 2000 through the forecast period. Net in-migration peaked

Co
eu
r d’
Ale
ne
, ID
• C
OM
PR
EH
EN
SIV
E H
OU
SIN
G M
AR
KE
T A
NA
LYS
IS
5
Figure 4. Components of Population Change in the Coeur d’Alene HMA, 2000 to Forecast
Sources: 2000 and 2010—2000 Census and 2010 Census; current and forecast—estimates by analyst
Net Natural Change Net Migration
2000 to 2010 2010 to Current Current to Forecast
Ave
rage
Ann
ual C
hang
e 2,500
2,000
1,500
1,000
500
0
during the 2004-through-2005 period, averaging 4,150 annually, but has declined since 2007 because of the national recession and soft housing market conditions in California and Washington, where most migrants originate. Based on 2010 data from the Idaho Division of Motor Vehicles,
the latest data available, 54 percent of surrendered driver’s licenses were from new residents previously living in California or Washington. Similarly, according to Internal Revenue Service migration data, from 2009 through 2010, 38 percent of in-migration occurred from residents originating from California or Washington. Ac - cording to local sources, most net in-migration has been of retirees or soon-to-be retirees who are attracted to the area’s natural surroundings. According to the 2010 Census, 42 percent of the HMA population was 45 years old and older compared with only 36 percent at the time of the 2000 Census. Population is forecast to grow by an estimated average of 1,975, or 1.4 percent, annually during the 3-year forecast period.
Household growth in the HMA in 2010 has increased by an average of 1,300 households, or 3.1 percent, annually to 54,200, up from 41,300 in 2000. Figure 5 shows trends in popu-lation and household growth from 2000 to the forecast period. From 2010 through the current date, house-hold growth has slowed to an annual average of 690, or 1.3 percent. The decline in household growth can be attributed to slower net in-migration, increased doubling up, and delays in younger household formation because of weak economic conditions. Of the current 55,400 households, about 38,500, or 70 percent, are owner house - holds compared with 75 percent in 2000. Figure 6 shows the number of households by tenure from 2000 to the current date. The number of house - holds is expected to grow by an average of 770 households, or 1.4 percent, annually during the forecast period.
Population and Households Continued
Population Households
Sources: 2000 and 2010—2000 Census and 2010 Census; current and forecast—estimates by analyst
Figure 5. Population and Household Growth in the Coeur d’Alene HMA, 2000 to Forecast
3,000
2,500
2,000
1,500
1,000
500
02000 to 2010 2010 to Current Current to Forecast
Ave
rage
Ann
ual C
hang
e
2000 2010 Current
Renter Owner
Figure 6. Number of Households by Tenure in the Coeur d’Alene HMA, 2000 to Current
Sources: 2000 and 2010—2000 Census and 2010 Census; current—estimates by analyst
40,000
35,000
30,000
25,000
20,000
15,000
10,000
5,000
0

Co
eu
r d’
Ale
ne
, ID
• C
OM
PR
EH
EN
SIV
E H
OU
SIN
G M
AR
KE
T A
NA
LYS
IS
6Housing Market Trends
Sales MarketThe sales housing market in the HMA is soft, partly because declines in re-gional home prices have discouraged potential new residents from selling their existing homes and migrating to the area. According to Hanley Wood, LLC, during 2011 new and existing home sales in the HMA fell 4 percent to 2,975 compared with an increase of 7 percent during 2010. The average new and existing home sales price fell 5 percent to $246,900 compared with a 1-percent increase during 2010. Since reaching its peak in 2007 at $316,100, the average home sales price in the HMA has fallen by 22 percent. From 2010 to 2011, however, the annual rate of average price decline has slowed to 5 percent compared with a 12-percent average price decline from 2008 to 2009.
New home sales in the HMA during 2011 fell 26 percent, down to 320 from 430 homes sold, and the average sales price of a new home rose 5 percent to $204,400. New home sales peaked from 2005 through 2007, when an average of 1,325 new homes were sold annually and the average sales price during the period was about $291,100. From 2010 through 2011, existing sales fell 1 percent to 2,650 and the average sales price fell 7 per-cent to $252,000. Existing sales have increased from 2007 through 2009, when an average of 2,125 homes were
sold and the average sales price was $287,500. After 4 years of substantial increases in Real Estate Owned (REO) sales, REO sales fell 11 percent, down to 800 compared with the 900 sold during 2010. From 2006 through 2010, REO sales increased by an average of 130 percent annually. Foreclosure activity in the HMA is slowing. Ac - cording to LPS Applied Analytics, as of December 2011, 5.1 percent of home loans in the HMA were 90 or more days delinquent, in foreclosure, or in REO, down from the 5.9-percent rate recorded a year earlier. This cur-rent rate compares with 5.5 percent for Idaho and 7.6 percent nationwide as of December 2011. The rate in the HMA has risen significantly since January 2008, the earliest data avail-able, when it was only 1.2 percent.
According to preliminary building permit data, about 420 single-family homes were permitted during 2011, a 13-percent decrease compared with the number permitted during 2010. Single-family homebuilding activity peaked from 2003 through 2005, when an average of approximately 2,025 homes were permitted annually, but it has declined every year since (Figure 7). The Crown Pointe development, pre - viously known as Ashworth, in sub - urban Post Falls has started constructing new homes priced between $120,000 and $200,000. As of January 2012, the infrastructure has been developed for the first phase of 82 residential lots and home construction has begun. The development plans to eventually have 450 single-family homes, 200 multifamily units, and commercial space. The entire development is projected to be complete within the next 6 years.
2000
2001
2002
2003
2004
2005
2006
Figure 7. Single-Family Building Permits Issued in the Coeur d’Alene HMA, 2000 to 2011
Notes: Includes townhomes. Includes data through December 2011.
Sources: U.S. Census Bureau, Building Permits Survey; estimates by analyst
2,500
2,000
1,500
1,000
500
0
2008
2009
2010
2011
2007

Co
eu
r d’
Ale
ne
, ID
• C
OM
PR
EH
EN
SIV
E H
OU
SIN
G M
AR
KE
T A
NA
LYS
IS
7
As the economy begins to improve and net in-migration increases, demand is estimated for 1,400 new homes during the 3-year forecast period, including 100 mobile homes (Table 1). Because of the 200 homes currently under con - struction and a portion of the 6,825
other vacant units that may return to the sales market during the forecast period, new units should not be needed until the second year of the forecast period. Demand for new market-rate sales housing by price range is illus-trated in Table 4.
Housing Market TrendsSales Market Continued
Price Range ($) Units of Percent
From To Demand of Total
100,000 199,999 710 55.0200,000 299,999 300 23.0300,000 399,999 160 12.0400,000 499,999 50 4.0500,000 and higher 80 6.0
Notes: The 200 homes currently under construction and a portion of the estimated 6,825 other vacant units in the HMA will likely satisfy some of the forecast demand. Excludes mobile homes.
Source: Estimates by analyst
Table 4. Estimated Demand for New Market-Rate Sales Housing in the Coeur d’Alene HMA, January 1, 2012 to January 1, 2015
Rental MarketAs of March 2011, the latest data available, the average apartment rents were $566 for a one-bedroom apartment; $603 for a two-bedroom, one-bath apartment; $754 for a two-bedroom, two-bath apartment; and $774 for a three-bedroom, two-bath apartment. In addition, according to the 2010 American Community Sur-vey, 44 percent of the rental market consists of single-family homes.
According to annual building permit data, multifamily construction peaked from 2005 through 2007, with an aver - age of 490 multifamily units permitted each year compared with an average of 120 units a year from 2008 through 2010. According to preliminary data, 100 multifamily units were permitted during 2011, down from the 160 units permitted during 2010. Currently, one income-restricted apartment project is under construction in the HMA. The 50-unit Riverstone West Family Apartments will include one-, two-, and three-bedroom units with income-
Because of an increased rental demand from former owner households that have recently gone through the fore -closure process, the rental housing market in the Coeur d’Alene HMA is currently tight with an overall estimated rental vacancy rate of 5.5 percent. Ac -cording to The Real Estate Report: Regional Research on Spokane and Kootenai Counties, the apartment vacancy rate declined significantly to 2.3 percent, down from 7.4 percent in March 2010. Figure 8 shows the overall rental vacancy rate for 2000, 2010, and the current date. The average monthly apartment rent for the HMA, however, has remained flat through-out the past 3 years at around $650.
Sources: 2000 and 2010—2000 Census and 2010 Census; current—estimates by analyst
2000 Current2010
7.8
5.5
7.78.0
6.0
4.0
2.0
0.0
Figure 8. Rental Vacancy Rates in the Coeur d’Alene HMA, 2000 to Current

Co
eu
r d’
Ale
ne
, ID
• C
OM
PR
EH
EN
SIV
E H
OU
SIN
G M
AR
KE
T A
NA
LYS
IS
8
restricted monthly rents starting at $468, $557, and $638, respectively. The low-income housing tax credit project will target families earning between 40 and 50 percent of area median income. Figure 9 illustrates the number of multifamily units permitted since 2000.
In the past 2 years, new apartment construction in the area has been
targeted toward elderly residents. Three new, low-income housing tax credit apartment projects were recently completed and are restricted to residents 55 years old and older. The 50-unit Mill River Seniors, the 42-unit Silver Creek, and the 50-unit Tullamore Senior Apartments will help meet the growing demand for affordable, age-restricted units.
Demand is estimated for 1,050 new rental units during the 3-year forecast period (Table 1). Because of the ex - pected re covery of the sales market, rental demand will be higher in the first and second years of the forecast period. The 250 units currently under construction will meet a portion of the forecast rental demand. Table 5 shows demand for new market-rate apartment units by rent level and number of bedrooms.
Housing Market TrendsRental Market Continued
2000
2001
2002
2003
2004
2005
2006
Figure 9. Multifamily Building Permits Issued in the Coeur d’Alene HMA, 2000 to 2011
Notes: Excludes townhomes. Includes data through December 2011.
Sources: U.S. Census Bureau, Building Permits Survey; estimates by analyst
900
800
700
600
500
400
300
200
100
0
2008
2009
2010
2011
2007
Notes: Numbers may not add to totals because of rounding. The 250 units currently under construction will satisfy some of the estimated demand.
Source: Estimates by analyst
One Bedroom Two Bedrooms Three or More Bedrooms
Monthly Gross Rent ($)
Units of Demand
Monthly Gross Rent ($)
Units of Demand
Monthly Gross Rent ($)
Units of Demand
Table 5. Estimated Demand for New Market-Rate Rental Housing in the Coeur d’Alene HMA, January 1, 2012 to January 1, 2015
400 to 599 220 600 to 799 540 750 or more 125600 or more 75 800 or more 95Total 290 Total 630 Total 130
Co
eu
r d’
Ale
ne
, ID
• C
OM
PR
EH
EN
SIV
E H
OU
SIN
G M
AR
KE
T A
NA
LYS
IS
9
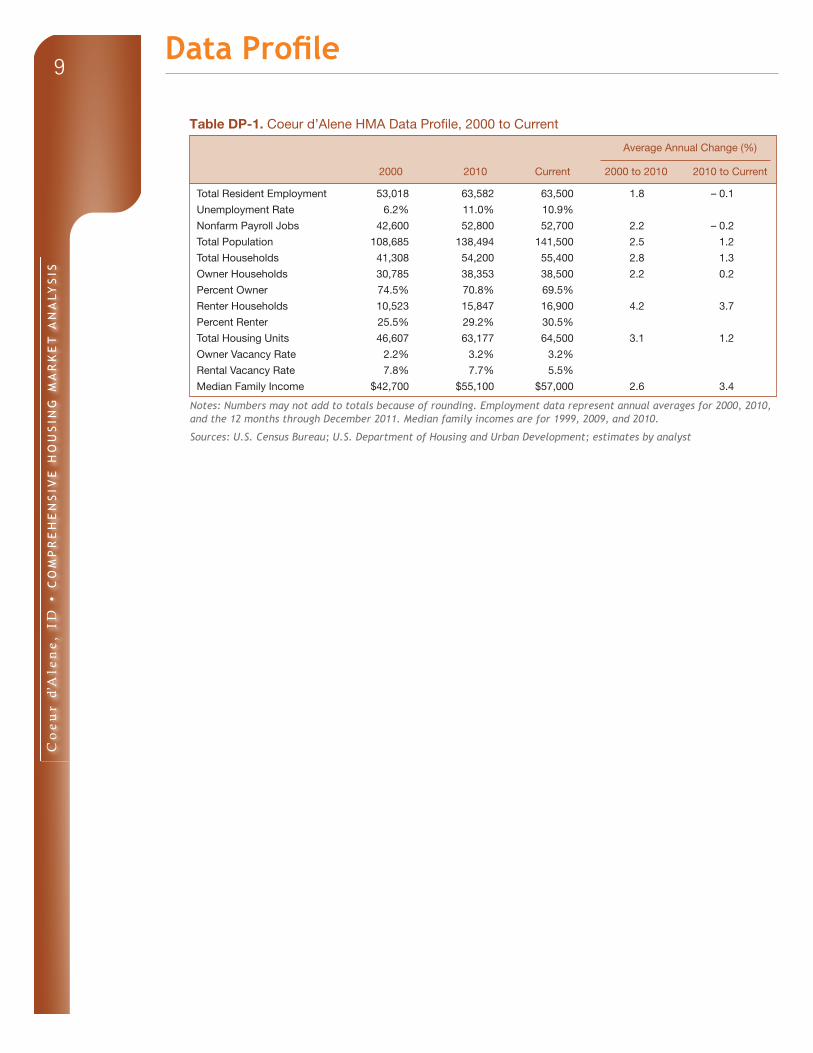
Notes: Numbers may not add to totals because of rounding. Employment data represent annual averages for 2000, 2010, and the 12 months through December 2011. Median family incomes are for 1999, 2009, and 2010.
Sources: U.S. Census Bureau; U.S. Department of Housing and Urban Development; estimates by analyst
Table DP-1. Coeur d’Alene HMA Data Profile, 2000 to Current
Average Annual Change (%)
2000 2010 Current 2000 to 2010 2010 to Current
Total Resident Employment 53,018 63,582 63,500 1.8 – 0.1
Unemployment Rate 6.2% 11.0% 10.9%
Nonfarm Payroll Jobs 42,600 52,800 52,700 2.2 – 0.2
Total Population 108,685 138,494 141,500 2.5 1.2
Total Households 41,308 54,200 55,400 2.8 1.3
Owner Households 30,785 38,353 38,500 2.2 0.2
Percent Owner 74.5% 70.8% 69.5%
Renter Households 10,523 15,847 16,900 4.2 3.7
Percent Renter 25.5% 29.2% 30.5%
Total Housing Units 46,607 63,177 64,500 3.1 1.2
Owner Vacancy Rate 2.2% 3.2% 3.2%
Rental Vacancy Rate 7.8% 7.7% 5.5%
Median Family Income $42,700 $55,100 $57,000 2.6 3.4
Data Profile

Co
eu
r d’
Ale
ne
, ID
• C
OM
PR
EH
EN
SIV
E H
OU
SIN
G M
AR
KE
T A
NA
LYS
IS
10
Data Definitions and Sources
2000: 4/1/2000—U.S. Decennial Census
2010: 4/1/2010—U.S. Decennial Census
Current date: 1/1/2012—Analyst’s estimates
Forecast period: 1/1/2012–1/1/2015—Analyst’s
estimates
Demand: The demand estimates in the analysis
are not a forecast of building activity. They are
the estimates of the total housing production
needed to achieve a balanced market at the end
of the 3-year forecast period given conditions on
the as-of date of the analysis, growth, losses, and
excess vacancies. The estimates do not account
for units currently under construction or units in
the development pipeline.
Other Vacant Units: In HUD’s analysis, these
include all vacant units that are not available
for sale or for rent. The term therefore includes
units rented or sold but not occupied, held for
seasonal, recreational or occasional use, used by
migrant workers and includes units that fall into
the category specified as “other” vacant by the
Census Bureau.
Building Permits: Building permits do not neces-
sarily reflect all residential building activity that
occurs in an HMA. Some units are constructed
or created without a building permit or are issued
a different type of building permit. For example,
some units classified as commercial structures are
not reflected in the residential building permits.
As a result, the analyst, through diligent fieldwork,
makes an estimate of this additional construction
activity. Some of these estimates are included in
the discussions of single-family and multifamily
building permits.
For additional data pertaining to the housing
market for this HMA, go to www.huduser.
org/publications/pdf/CMARtables_
CoeurdAleneID_12.pdf.
Contact Information
Elaine Ng, Economist
San Francisco HUD Regional Office
415–489–6777
This analysis has been prepared for the assistance and
guidance of the U.S. Department of Housing and Urban
Development (HUD) in its operations. The factual
information, findings, and conclusions may also be use-
ful to builders, mortgagees, and others concerned with
local housing market conditions and trends. The analysis
does not purport to make determinations regarding the
acceptability of any mortgage insurance proposals that
may be under consideration by the Department.
The factual framework for this analysis follows the
guidelines and methods developed by HUD’s Economic
and Market Analysis Division. The analysis and findings
are as thorough and current as possible based on
information available on the as-of date from local and
national sources. As such, findings or conclusions
may be modified by subsequent developments. HUD
expresses its appreciation to those industry sources and
state and local government officials who provided data
and information on local economic and housing market
conditions.
For additional reports on other market areas, please go to www.huduser.org/publications/econdev/mkt_analysis.html.