c o a s t a l zonema journal of coastal zone al-sarawi et al ... of the water quality and benthic...
TRANSCRIPT
Volume 20 • Issue 4 • 1000451J Coast Zone Manag, an open access journal ISSN: 2473-3350
Research Article Open Access
Al-Sarawi et al., J Coast Zone Manag 2017, 20:4DOI: 10.4172/2473-3350.1000451
Research Article Open Access
Journal of Coastal Zone ManagementJou
rnal
of C
oastal Zone Managem
ent
ISSN: 2473-3350
Recent Trace Metals Pollution in Bottom Sediments of Khor Al-Sabiya, KuwaitSondos Jasser, Mohammad Al-Sarawi* and Sawsan Khader Department of Earth and Environmental Science, College of Science, Kuwait University, Kuwait
AbstractThe tidal inlet within and around Bubiyan Island is dominated by tidal currents and the accumulation of soft mud
is well seen within the intertidal flat. Mudflats with increasing number of burrowers make up most of the beaches of the western part of Bubiyan Island. The middle parts of the tidal inlets are formed of coarse suspended sediments reflecting a high rate of bottom currents. Suspended sediments are highly recognized within the inlets. Benthic communities as well as high quantities of foraminifera are well documented at the main inlet. The benthic communities are affected by the inlets salinity accordingly they vary from one place to another. The study revealed the formation of high anthropogenic deposits at the western and north-eastern part of the tidal channel of Bubiyan Island. Trace Metals (TM) as well as Total Petroleum Hydrocarbons (TOC) were found to be within the permissible KEPA standards. Sediment distribution varied between soft mud to muddy sand along the tidal channels. Tidal currents trending north to south is affecting most of the sediment distribution. The coastal dunes and rocky tidal flats are found at the southern part of the main entrance of Khor Al-Subiyah while soft sediment form the northern most part of the Khor. The coastal geomorphic features are highly affected by the tidal current as well as wind action.
Keywords: Tidal channel; Khor Al-Subiyah; Anthropogenic; Beach profile; Tidal flat; Tidal inlet; Mud flat
IntroductionLocation and general description of the study area
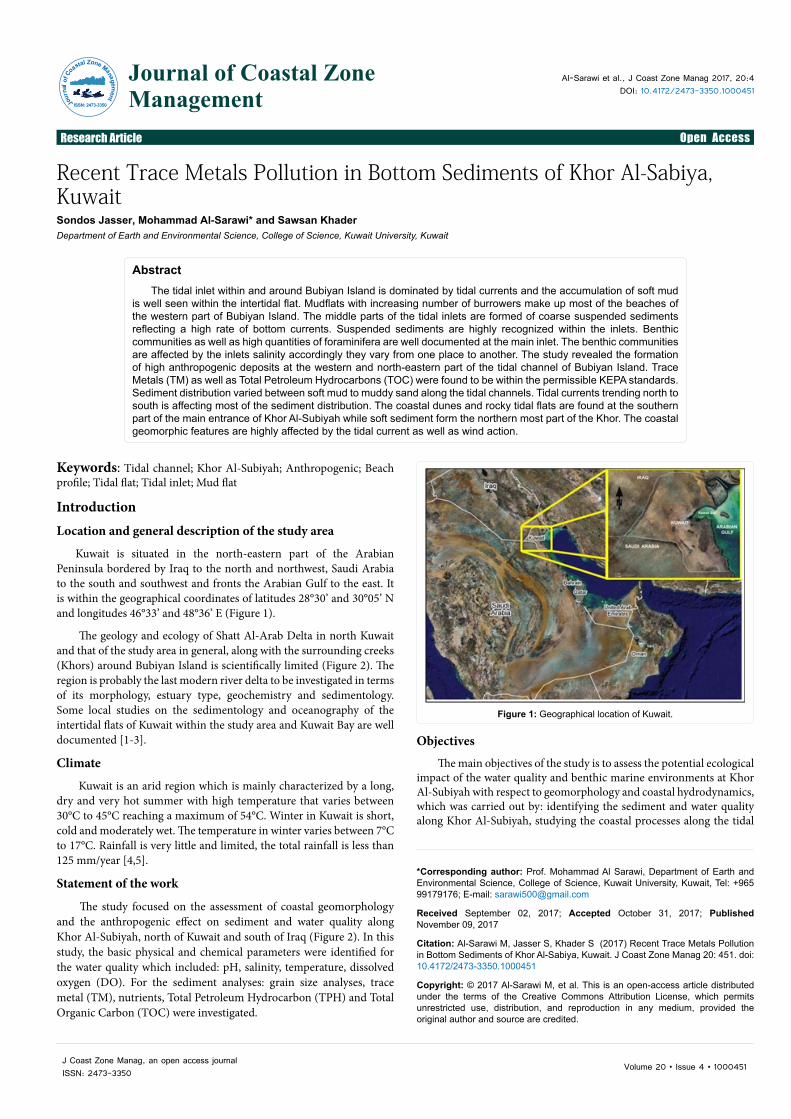
Kuwait is situated in the north-eastern part of the Arabian Peninsula bordered by Iraq to the north and northwest, Saudi Arabia to the south and southwest and fronts the Arabian Gulf to the east. It is within the geographical coordinates of latitudes 28°30’ and 30°05’ N and longitudes 46°33’ and 48°36’ E (Figure 1).
The geology and ecology of Shatt Al-Arab Delta in north Kuwait and that of the study area in general, along with the surrounding creeks (Khors) around Bubiyan Island is scientifically limited (Figure 2). The region is probably the last modern river delta to be investigated in terms of its morphology, estuary type, geochemistry and sedimentology. Some local studies on the sedimentology and oceanography of the intertidal flats of Kuwait within the study area and Kuwait Bay are well documented [1-3].
Climate
Kuwait is an arid region which is mainly characterized by a long, dry and very hot summer with high temperature that varies between 30°C to 45°C reaching a maximum of 54°C. Winter in Kuwait is short, cold and moderately wet. The temperature in winter varies between 7°C to 17°C. Rainfall is very little and limited, the total rainfall is less than 125 mm/year [4,5].
Statement of the work
The study focused on the assessment of coastal geomorphology and the anthropogenic effect on sediment and water quality along Khor Al-Subiyah, north of Kuwait and south of Iraq (Figure 2). In this study, the basic physical and chemical parameters were identified for the water quality which included: pH, salinity, temperature, dissolved oxygen (DO). For the sediment analyses: grain size analyses, trace metal (TM), nutrients, Total Petroleum Hydrocarbon (TPH) and Total Organic Carbon (TOC) were investigated.
*Corresponding author: Prof. Mohammad Al Sarawi, Department of Earth and Environmental Science, College of Science, Kuwait University, Kuwait, Tel: +965 99179176; E-mail: [email protected]
Received September 02, 2017; Accepted October 31, 2017; Published November 09, 2017
Citation: Al-Sarawi M, Jasser S, Khader S (2017) Recent Trace Metals Pollution in Bottom Sediments of Khor Al-Sabiya, Kuwait. J Coast Zone Manag 20: 451. doi: 10.4172/2473-3350.1000451
Copyright: © 2017 Al-Sarawi M, et al. This is an open-access article distributed under the terms of the Creative Commons Attribution License, which permits unrestricted use, distribution, and reproduction in any medium, provided the original author and source are credited.
Figure 1: Geographical location of Kuwait.
Objectives
The main objectives of the study is to assess the potential ecological impact of the water quality and benthic marine environments at Khor Al-Subiyah with respect to geomorphology and coastal hydrodynamics, which was carried out by: identifying the sediment and water quality along Khor Al-Subiyah, studying the coastal processes along the tidal

Page 2 of 18
Citation: Al-Sarawi M, Jasser S, Khader S (2017) Recent Trace Metals Pollution in Bottom Sediments of Khor Al-Sabiya, Kuwait. J Coast Zone Manag 20: 451. doi: 10.4172/2473-3350.1000451
Volume 20 • Issue 4 • 1000451J Coast Zone Manag, an open access journal ISSN: 2473-3350
spring and neap tides in Kuwait Bay never exceeds 50 cm/s. For the southern coastal area, the maximum current velocity may reach 1 m/s [9]. Al-Yammani et al. stated that “the surface sediments of the Kuwait offshore area are found to consist of seven textural classes: sand, silty sand, muddy sand, silt, sandy mud, silt and mud” [11]. The geographic distribution of the textural classes reveals that most of Kuwait’s marine area is covered with just three fine grain sediments which are mud, sandy mud and sandy silt. Coarse grain sediments (sand, muddy sand, and silty sand) are limited distribution and associated with the shallow rocky bottoms that are subjected to relatively strong waves and currents [3,12,13].
Sources and fates of pollutants
Al-Ghadban and Salman studied the tidal flat around Kuwait Bay and pointed the importance of sediment types in controlling the movement and fate of pollutants [14]. Al-Ghadban and El-Sammak stated that “The sediment can absorb toxic metals and hydrocarbons and can also release them into the marine environment” [15]. The Shat-Al-Arab River in Iraq was found to be the possible source of pollution to the Arabian Gulf, thereby affecting the Kuwait’s coastal waters [16,17]. Most of the northern part of the Gulf is characterized by a plume of suspended sediments. This suspended sediment phenomenon usually results from natural physical process, for example, flushing of material carried by rivers and receiving bodies of water and/or contribution of dust storms. It may also be caused by artificial or man-made activities, such as the indiscriminate dredging and implementation of development activities, i.e., excavation and filling around coastal and offshore areas. Another potential source of suspended sediment is the southern area of Iraq, where an area of about 9000 km2 (southern marshes) was drained, resulting in the occurrence of dry lands that are vulnerable to the dominant NW-SE wind direction creating dust storms that settle over the northern part of the Arabian Gulf [18].
Suspended sediments are known to accommodate a variety of pollutants, thus, play an important role in the augmentation and distribution of such pollutants as it can be seen that many pollutants such as phosphates and other materials enter the water current from Iraq and drifts into the Khor Al-Subiyah. As the water inflows downstream, it deteriorates the quality and increases the pollution in sediments.
The Arabian Gulf is subjected to continuous man-made pollution connected with the production and transportation of almost one-third of the world crude oil [19,20]. Several studies have been conducted on the distribution of total petroleum hydrocarbons in the marine environment of Kuwait and the Arabian Gulf. El-Samra et al. observed that the marine environment in the north-western part of the Arabian Gulf is subjected to heavier petroleum hydrocarbon pollution compared to the other marine environments [21].
Bou-Olayan and Al-Sarawi measured the total petroleum hydrocarbons at the Kuwait Waterfront Project and found that the average concentration of TPH was 0.139 mg/l [22]. They recorded higher concentration of TPH at Al-Shaab Club and Shuwaikh Industrial Area. Petroleum hydrocarbon concentrations in bottom sediments are typically a few µg/gin unpolluted coastal areas and ranges from 50-1000 mg/g in polluted areas [23].
Metwally et al. studied the petroleum hydrocarbons in near shore marine sediments of Kuwait and found that the TPH concentrations were variable ranging from 7.43 to 458.61 mg/g in dry sediment [24]. They recorded that the highest TPH levels were near the Shuaiba Industrial Area and in Doha-Shuwaikh Port (in Kuwait Bay) whereas
creeks, and studying the morphodynamics of the main tidal creek (Figure 2).
Literature Review
The marine and oceanographic aspect of Kuwait’s coast was investigated by [3-8]. Al-Sarawi et al. studied the shoreline of Kuwait and classified it into 10 categories according to its sensitivity to oil spill [8]. Abou Seida and Al-Sarawi studied the characteristics of the shoreline of Kuwait and recommended the formation of a technical board for coastal management in Kuwait [9]. The surface geomorphology of Kuwait was studied and classified into four major geomorphologic zones: a) The Coastal Zone, b) Wadis and Ridges Zone, c) The Low Land Zone, and d) The Dune Field Zone [5].
Coastal zone geomorphology
The coastal morphological features of Kuwait were identified based on geomorphology, near shore bathymetry and systematic description of its longitudinal beach profiles the backshore, the foreshore, and the near shore [5]. From field investigation and analysis of aerial and low-altitude flight photographs of the Bubiyan Island, three geomorphic sub-environments parallel to the coast were recognized: the Pleistocene-Holocene mainland sub-environment, the tidal flat complex sub-environment and the offshore marine sub-environment [10].
Coastal hydrodynamics
There are many factors affecting Kuwait’s coast such as tides, currents and waves. The tides are semidiurnal in the northern area and diurnal further south in Kuwait’s territorial waters. In Kuwait Bay, the tides are semidiurnal, with the range being as high as 4.2 m during the spring tides and as low as 0.5 m at neap. Farther south, near Al-Shuaiba, the tides are mixed; the mean tidal range is about 1.6 m at neap and about 2.4 m at spring tide [9]. Currents are mostly parallel to the coastline and occur mainly because of tides. The maximum current velocity during
Figure 2: Satellite map showing the sampling locations in the study area.

Page 3 of 18
Citation: Al-Sarawi M, Jasser S, Khader S (2017) Recent Trace Metals Pollution in Bottom Sediments of Khor Al-Sabiya, Kuwait. J Coast Zone Manag 20: 451. doi: 10.4172/2473-3350.1000451
Volume 20 • Issue 4 • 1000451J Coast Zone Manag, an open access journal ISSN: 2473-3350
the lowest were found in Salmiya and Ras-Al-Zour area. El-Sammak et al. reported that the northern part of Kuwait’s marine environment differs in nature from the southern region [25]. They indicated that the quality of sediments in the northern region is less than those from the southern region in general whereas the southern region discriminates by high contents of TPH.
Sources of heavy metals in the marine environment
Heavy metals found in sea water are continuously released into the marine environment by both natural and anthropogenic processes. The natural sources of metals in sea are categorized as follows: (a) Coastal supply, which includes input from rivers and from erosion due to wave action and glaciers; (b) deep sea supply, which includes metals released from particles or sediments by chemical processes; (c) supply which bypasses the near shore environment in particular metals transported in the atmosphere as dust particles or as aerosols and also material which is produced by glacial erosion in polar regions and is transported by floating ice [26].
Anthropogenic sources of metals include: (a) Atmospheric input from the burning of fossil fuels, the smelting and refining of metals, the use of leaded petrol in motor vehicles, fly ash from power stations and the use of sea water discharges for cooling from operations at power stations. For some metals, input into the atmosphere as a result of human activities is greater than natural inputs and the sea acts as a sink for atmospheric contamination [27]. Atmospheric particulate deposition and diffusion from shelf sediments was found to enrich heavy metals in particulate matter and dissolved seawater [28]; (b) Mining activities, such as tailings; (c) Industrial processing of ores and the use of metal components, such as electroplating, pigments, electrical wiring, batteries, galvanizing, fertilizers, etc.; (d) The release of sewage into the sea in considerable quantities has a high organic content and heavy metals [27]; (e) Contamination from ships in docks and harbours contain metals such as copper, tin and mercury in antifouling points and other metals such as lead, chromium and zinc in preservative paints [29,30]; (f) Dredging spoil, particularly from industrialized estuaries may contain heavy metals and other contaminants which are then transferred to the dumping grounds [27].
Materials and MethodologySampling field work
Khor Al-Subiyah, a tidal channel located north of Kuwait Bay was selected for the study (Figure 2). The sediment as well as water quality of the study area was assessed to evaluate the level of pollution. Sediment samples were collected and analyzed to determine the concentration of Grain Size analysis, Trace Metals, Total Petroleum Hydrocarbons, Nutrients, and Total Organic Carbon parameters. The surface water samples were analyzed for their physico-chemical properties. The sampling sites are shown in Figure 2.
Sample collection
A total of 11 sediments samples were collected from 11 stations along the study area, 5 sub samples were collected from each onshore and offshore stations (Figure 2). Six stations were located onshore and were sampled at low tide using a hand corer (Figures 3A and 3B) and 5 stations were located offshore in the middle of the channel and were sampled at high tide using a grab sampler. Samples were stored and transported to laboratory for analysis.
Costal geomorphology
Khor Al-Subiyah is an inlet separating Bubiyan Island from the
main land (Figure 4). The inlet is about 45.2 km long (actual length 45.2 km) and 0.45-2.24 km wide, and carries along soft sediments from the southern part of Iraq into the Kuwait Bay. The bottom sediments are mainly composed of hard shells associated with gravel and hard bottom strata. During high tide 70-75% of the rocky beach tidal flat is covered within the intertidal flat. The channel (inlet) is considered as a main supplier of nutrients to the Kuwait Bay as soft mud and suspended materials are passing through the inlet toward the Gulf. Due to the abundance of bioturbation the soft mud on both sides of the main channel is highly in suspension. The area is very rich in biodiversity and very sensitive from pollution. The old bridge from the mainland to Bubiyan Island with a maximum height of 20-25 m crosses the tidal channel (Figure 4B). A new bridge (tram and commercial) is developed along the same route which is also crossing the channel at 25.7 km to the north from the old bridge (Figures 4C and 4D).
Hydrodynamics
Waves, tides and currents play a major role in the configuration of the inlet which is reflected by the different morphological features seen along both sides of the inlet.
Wave monitoring for seven successive days revealed that the average wave period is about 25 secs and wave height is about 55 cm while wave length is 30-40 cm. During storm conditions wave height reached 1.35 m. Accordingly the wave condition can be considered as moderately high during storm conditions. Currents within the tidal channel, we recognized two important currents: a) long shore currents
Figure 3: (A) Core sampling at low tide; (B) Core samples collected from the upper intertidal flat.
Figure 4: (A) Khor Al-Subiya tidal inlet; (B) Tidal channel showing straight path; (C) The two bridges crossing the tidal channel; (D) The bridge.

Page 4 of 18
Citation: Al-Sarawi M, Jasser S, Khader S (2017) Recent Trace Metals Pollution in Bottom Sediments of Khor Al-Sabiya, Kuwait. J Coast Zone Manag 20: 451. doi: 10.4172/2473-3350.1000451
Volume 20 • Issue 4 • 1000451J Coast Zone Manag, an open access journal ISSN: 2473-3350
which are moving from north to south from the flood tide delta toward the entrance of the tidal channel flow into the Gulf area; and b) the tidal current which is influencing the coastal geomorphological features on both sides of the tidal channel.
The bottom sediments are highly influenced by the bottom tidal current. The tidal current flow rate (velocity) varies between 25-50 cm/sec. Tide is very effective in the tidal creek and tidal range is 4 m. Sediments are carried within the tides and redistributed along both sides of the channel. Fine sediments are carried in suspension and mainly well seen during high tide. The sediments are composed of silicates and sulphates. (Figure 5) shows the flow of suspension of sediments from the north of the tidal channel into the Kuwait Bay.
Tidal channel habitats
Up-north the tidal channel (Al-Subiyah inlet) is a major contributor to the ecosystem of Bubiyan Island and to its habitats. The network of the small creeks carrying a large amount of nutrients creates a major sink for the enrichment of the ecosystem. Unfortunately the major impact is from the raw and untreated sewage which enters the tidal creeks causing poor water quality and a major threat to public health and to the quality of coastal living. During high tide most of these pollutants flood the supratidal flat causing a threat to the burrowers and its habitats. Accordingly the impact and the consequences from the illegal dumping from southern Iraq into the tidal creeks of Bubiyan Island will destroy the poorly planned future coastal zone development on and around the tidal creeks. Most pollutants including sediments, chemicals, bacteria and viruses reach the tidal creeks. The tidal channel is a good nursery ground for most of the tidal flat habitats and provides food for juvenile fishes, shrimps and crabs. In general, the heavily polluted waters within the northern end of the tidal creeks could harm the ecosystem and this would degrade the surrounding environment and adversely impact the human health. The tidal channel acts as an early warning system for any pollutants that might enter the aquatic zone (Figure 6).
Types of lithofacies
The estuarine of the tidal flat of Bubiyan Island is very complex and it has been roughly investigated through a few cores sampling which reflected some changes within the vertical substrata along with depth. The field work indicated the following: 1) tidal channel with medium to coarse sand; 2) upper intertidal flat dominated by muddy sand; 3) intertidal creek with silty mud; 4) fine muddy interfingering with fresh water deposits.
Tidal channel
Most of the sequence of sediment deposits along the tidal channel’s longitudinal beach profiles is upward where coarse sediments are accumulating at the base. This is due to the low wave energy that is crossing from the subtidal into the intertidal zone. Bioactivities are well seen along the tidal channel deposits where it enhances the bioturbation as well as sediment in suspension. Many sedimentary structures were observed within the upper tidal channel areas.
The cross-sectional area of Khor Al-Subiyah is approximately asymmetric where the deeper end is towards the eastern side. The bottom channel which has coarse materials (gravel and coarse shells) reflects stronger bottom currents. The tidal channel of Bubiyan Island which is about 45-47 km long and 0.45-2.24 km wide is mainly controlled by the sediment properties (as mud or coarser sediment enter the channel via the main course) and erosion-deposition history of the environment.
Asymmetrical channel
As mentioned earlier, the tidal channel is asymmetrical, the eastern side is mainly composed of soft mud and outcropping rocks are covered by silty mud, while the western side of the channel is wide with a gentle slope and formed of coarser materials.
Geomorphology of the tidal channel
The coastal geomorphology of Khor Al-Subiyah comprises a straight tidal channel. The channel course reflects structural alignment which runs parallel to the Island and the mainland. The channel has several exbow lakes which reflect the process of erosion/deposition along the channel. Rocky headlands are occurring along the channel; however, there are some soft features like ridges and runnels that are formed due to the interaction of tides and long shore currents.
Hand-held corer
Hand held corer was used to drill several cores at 50 cm depth along the intertidal flat revealed visible sedimentary sequences and accumulation of sediment stratification between wave and tide-dominated inlet-fill deposits and lamination (Figure 7). The tidal range of the area supports such stratification.
Generally the core sequence of the bottom channel shows the following:
The bottom floor is poorly sorted, with medium to coarse shells and gravel-pebble lag. Strong-bottom channel reflect active inlet, Figure 5: Sediment in suspension flowing from the north of the tidal channel
into the Kuwait Bay.
Figure 6: Tidal channel an early warning system for pollutants entering the Kuwait Bay.

Page 5 of 18
Citation: Al-Sarawi M, Jasser S, Khader S (2017) Recent Trace Metals Pollution in Bottom Sediments of Khor Al-Sabiya, Kuwait. J Coast Zone Manag 20: 451. doi: 10.4172/2473-3350.1000451
Volume 20 • Issue 4 • 1000451J Coast Zone Manag, an open access journal ISSN: 2473-3350
with a mixture of trough cross to ‘planar bedded’ formed of medium to coarse-grained sand and shell lag. The sequence is either underlain by spit platform or long shore current deposits, the lithology varies between medium to fine sand (Figure 8).
Tidal flow
The flow is dominated by the flood tide which controls the tidal channel morphology, sediment in suspension, nutrients and facies morphodynamics.
Most supra-tidal flats create a supporting rich eco-environment for the burrowers. The beach profile is very gentle and flat with soft mud covering the whole tidal flat. Small tidal creeks are streaming with highly saline water (55-65%) toward the land. Blowing wind form sand spits which are attached to the beach face.
Salt pans
Interestingly, the southern part of Ras Al-Subiyah is widely covered
with salt pans. These features are highly formed of thinly laminated layers of silted clay. Gypsum and halite are well seen in the site during low tide (Figure 9).
Beach profiles
Longitudinal beach profiling was conducted throughout the field work to generate all the coastal geomorphological features. The features are subject to change due to exchange of hydrodynamics and are definitely important to study them in relation to the coastal activities. Eleven beach profiles were constructed along the tidal channel from the upper coastal dunes zone to the subtidal area (Figure 2).
Profile-1: This beach profile is located at the southern part of Ras Al-Subiyah (Figure 10A). The profile starts within the backshore area where coastal dunes are observed on the wet area of the sabkhas. Shrubs, gypsum and anhydrite cover most of the area (Figure 10B). Soft mud with the tidal creeks forms the majority of the sediment within the beach profile. The tidal channel and its morphological units are protected seaward by shoals and the spit is formed at the head of Ras-Al-Subiyah.
Profile-2: The beach profile is located in the semi-enclosed embayment of Ras Al-Subiyah (Figure 10C). It starts within the coastal ridges of Al-Subiyah area. The ridges are within the coastal dunes. The beach profile is characterized by Salicornia in the supratidal flat with patches of salt pans and calcrete ridges (Figure 10D).
Profile-3: The beach profile is at the entrance of the tidal channel from the southern end and is close to the main inlet of Al-Subiyah Power Station (Figure 10E). The profile runs from the hard Holocene beach ridges towards the beach into the tidal flat. The beach face is formed of coarse sand mixed with reworked shells (Figure 10F). Rocky tidal flat is formed at the lower beach face while the intertidal flat is not large and formed of a mixture of mud and fine sediment. Some aeolian deposits were observed on the tidal flat. Samhan et al. also found that trace metals found in Aeolian deposits [31].
Profile-4: The profile is located at the eastern side of the tidal channel within the Bubiyan Island (Figure 11A). The upper beach face is scattered with rocky platform which is veneered with soft mud (Figure 11B).Figure 7: Sampling by hand-held corer on the tidal flat.
Figure 8: Cores samples obtained from hand-held corer. Figure 9: Salt pans with dominant minerals like gypsum and halite.

Page 6 of 18
Citation: Al-Sarawi M, Jasser S, Khader S (2017) Recent Trace Metals Pollution in Bottom Sediments of Khor Al-Sabiya, Kuwait. J Coast Zone Manag 20: 451. doi: 10.4172/2473-3350.1000451
Volume 20 • Issue 4 • 1000451J Coast Zone Manag, an open access journal ISSN: 2473-3350
Figure 10: (A) Sketch description of profile-1; (B) Salt pan within beach profile-1; (C) Sketch description of profile-2; (D) Salicornia within the beach profile-2; (E) Sketch description of profile-3; (F) Coastal dunes within beach profile-3.
Figure 11: (A) Sketch description of profile-4; (B) Burrowers within beach profile-4; (C) Sketch description of profile-5; (D) Sand bars within beach profile-5; (E) Sketch description of profile-6; (F) Mud polygons within the tidal flat.
Profile-5: This profile is covered with coastal dunes and runs into the coarse sand within the upper beach face gently sloping into the upper tidal flat (Figure 11C). Remarkably, burrowers (Fedral crabs) are very active in this region. The recycling of sediments within the three zones of the narrow tidal flat due to the large tidal range results in enriching the ecosystem with nutrients and other materials. Towards the north, sand bars covers most part of the region (Figure 11D).
Profile-6: This area has a police station (Ebhetha). The profile is very narrow and steeper than profile 5 (Figure 11E). Due to the scouring, the beachface is covered by gabions. The tidal flat is well developed by mud polygons mainly of mud deposits (Figure 11F). The tidal channel is adjacent to this profile. High productivity and bioturbation is well seen at the lower intertidal flat.
Profile-7: This beach profile is totally composed of soft mud on the western side of the main tidal channel (Figure 12A). The fore-dunes area is a mixture between shrub vegetation and a shingle surface area. The upper beach area is highly bioturbated with coarse shell fragments at the upper beach face (Figure 12B). Since the channel is narrow the surf zone is not wide.
Profile-8: The beach profile is located at the western side of the tidal channel (Figure 12B). It is composed mainly of soft mud that usually moves in suspension during high tide. The muddy area is full of micro-organisms that support the mixing of substrate bottom sediment during the oscillation of high and low tidal phenomena. Berm is not well developed at the western side of the channel which could be due to the quite performance of wave action and a weak longshore current.
Profile-9: This profile is short due to the narrow beach, while the beach face is moderately dipping at 32°C (Figure 12C) with remarkable beach terraces (Figure 12D). Coarse to medium beach sand mixed with reworked shell fragments is dominant due to wave action and change in the morphodynamics of the tidal channel flow regime. Burrowers are limited to the upper subtidal flat with remarkable bioturbation of fedral crabs seen at the swash line. Sediments are mainly a mixture of aeolian driven and wave action. The sediments along many of the cross-sections reflect laminated and cross-bedding sedimentary structures.
Profile-10: The profile runs from east to west crossing the coastal dunes with hard gypsiferous layers (Figure 12E). The foreshore area is covered with mud and silt (Figure 12F). This profile is part of the Bubiyan Island where there are lots of burrowers, and soft mud (polygonal) structures. Within the lower sub-tidal section the isolated rocks are covered with soft mud and increasing number of organisms is colonizing the rocks.
Profile-11: This beach profile has well developed berms and beach face, and is much wider than the southern beach profiles (Figure 13A). Wave energy and tides play a major role in modifying the coastal geomorphic features along the tidal channel (Figure 13B).
Results The study was conducted in Khor Al-Subiyah and 11 stations were
sampled for sediment and water quality during the period between November to December 2016.
Water quality
In this study, physico-chemical parameters such as temperature, pH, salinity, Dissolved Oxygen (DO) and conductivity were measured for 11 samples in 11 stations (Table 1)
The average temperature recorded for all the sampling stations

Page 7 of 18
Citation: Al-Sarawi M, Jasser S, Khader S (2017) Recent Trace Metals Pollution in Bottom Sediments of Khor Al-Sabiya, Kuwait. J Coast Zone Manag 20: 451. doi: 10.4172/2473-3350.1000451
Volume 20 • Issue 4 • 1000451J Coast Zone Manag, an open access journal ISSN: 2473-3350
Figure 12: (A) Sketch description of profiles 7-8; (B) Bioturbation within beach profiles 7-8; (C) Sketch description of profile-9; (D) Beach terraces within beach profile-9; (E) Sketch description of profile-10; (F) Rocky debris which is covered by thin layer of soft mud.
Figure 13: (A) Sketch description of profile-11; (B) Rocky beaches covered by gabion to protect the beach face from erosion soft mud covers the upper tidal flat.
The recorded range of DO in Kuwait’s sea water is between 5-14 mg/L with an average of 5 mg/L. The mean concentration of DO in Kuwaiti water is 6.1 mg/L [11,32]. The mean concentration of DO for all the sampled stations along Khor Al-Sabiyah was 1.81 ppm with the range of 0.1 ppm (Station 1)-9.6 ppm (Station 3). The lowest DO was found in Station 1 due to the stagnation of the current, and the highest in station 3 due to the high rip current prevailing in this Station 3 (Figure 2).
DO is not supposed to fall below 6.00 mg/L, and its concentrations depend on different factors, such as the temperature of sea water, presence of sea plants, action of waves and current amount of organic matters, and degree of illumination [33]. Lack of DO can reduce metabolic rates which produce dwarfed species and cause different types of deformations for the marine species such as thin walled and less ornamentation [34,35].
Sediment grain size analysis
A grain size study was performed on the sediment collected from the eleven stations along the study area. The grain size parameters were calculated on the basis of their cumulative curves using statistical equations and classification by Shepard’s classification system, (1957). The sediment textural characteristics varied from coarse sand (Stations 7 and 11), medium sand (Stations 5, 8 and 9) to very fine sand (Stations 1, 2, 3, 4 and 6), and gravel (Station 10) (Table 2).
The percentage of various fraction of the collected sediment sample is illustrated in Figure 14 which represents the different sedimentological component of each sample. Most of the samples consist mainly of sand except for Station 10 which is composed of coarse grains. Figure 14 shows the distribution of bottom sediment along Khor Al-Subiyah. The sea floor in the Khor and open channel is covered with muddy sand with high constituents of gravel size oyster shells. The mud is dark gray calcareous siliciclastic with high amounts of fine sand and molluscan/foraminiferal shells and shell fragment. Near shore sediments exhibit laminations of alternating sandy and silt layers. Accumulations of muddy sediments were recorded near shore along the south end of Bubiyan Island and Khor Al-Subiyah shore line. These muddy sediments extend southward to reach the upper part of Kuwait. The study area is covered with sediments that are poorly-very poorly sorted, which indicates different sources of sediments contribute to the inlet. The textural facies map shows the hard bottom sediment mainly coarse consolidated materials such as limy aggregates cemented with calcium carbonate. The bottom current is probably shifting the fine particulate towards the Khor opening into the Gulf. Soft sediments are found to be accumulating mostly to the east of the Khor while the western side comprises mainly muddy sand with occasional hard clayey deposits.
DiscussionTotal petroleum hydrocarbons (TPH)
Concentration of total petroleum hydrocarbons in the bottom sediments of the study area are shown in Table 3. The average TPH concentration was found to be 163.72 ppm within the range of 72.44 ppm (Station 11)-252.79 ppm (Station 5). The highest TPH concentration was recorded for Stations 5 and the lowest was in Station 11 (Figures 15A and 15B). Station 5 represents the area for navigational routes and ship waiting area. The TPH content of sediments showed high variations. The data revealed that all locations are contaminated to different degrees, depending on the distance from the source of pollution.
in Khor Al-Subiyah was 14.35°C with the range varying between a maximum of 20.46°C at Station 3 which is nearby to the power station intake where some activities are occurring nearby and a minimum of 12.49°C at Station 8 (Figure 2).
In this study, water salinity during winter season ranged between 35.15% and 57.6% with an average of 42.24%. A maximum salinity was recorded at Station 3 while the northern sample showed lower salinity ranging from 6% to 11% from the river running off from Shatt Al-Arab (Figure 2).
During the present study, measurements of pH at the sampling sites in the investigated area were observed to range from 8.2 to 12.10 (Figure 2). The study area exhibits significant pH variation during the period of study. The highest pH values were recorded near Stations 4, 6 and 10 due to sewage inflows from the coastal beach houses which have a direct effect on the sites, the lowest pH values were recorded at Stations 1 and 2. These values indicate a change of conditions with respect to hydrogen ion concentration at the selected sites and depths. The pH values were found to be higher than the range of sea water standard pH values documented by [11].

Page 8 of 18
Citation: Al-Sarawi M, Jasser S, Khader S (2017) Recent Trace Metals Pollution in Bottom Sediments of Khor Al-Sabiya, Kuwait. J Coast Zone Manag 20: 451. doi: 10.4172/2473-3350.1000451
Volume 20 • Issue 4 • 1000451J Coast Zone Manag, an open access journal ISSN: 2473-3350
Figure 14: Distribution of sediment textural facies in the study area.
Sample No. Location Salinity (%) Temp (º C) pH DO (ppm)S-1 Let: 29°08.805'N Long: 48°11.174'E 56.24 16.5 8.24 0.1S-2 Let: 29°08.805'N Long: 48.11.174'R 40.96 16.19 8.31 0.4S-3 Let: 29°35.334'N Long: 48°11.174'E 57.6 20.46 9.3 9.6S-4 Let: 29°08.805'N Long: 48.09.67TE 44.44 12.73 12.1 1.86S-5 Let: 29°43.075'N Long: 48°06.144'E 38.42 12.94 8.59 1.88S-6 Let 29°39.988'N Long: 48°16.174'E 35.15 12.61 11.2 1.75S-7 Let: 29°44.253'N Long: 48.05.458'E 38.28 1427 9.3 2.42S-8 Let: 29°44.262'N Long: 48°06.316'E 38.05 12.49 10.37 2.01S-9 Lat:29°44.390'N Long:48°05.151'E 40.02 17.05 10.01 3.12S-10 Let: 29°39.000'N Long: 48°07.949'E 37.5 12.63 11.35 1.85S-11 Let: 29°55.094'N Long: 48°09.672'E 38.08 14 10.6 3.2
Mega 42.24 14.35 9.85 1.81Range 35.15-57.6 12.49-17.06 8.24-11.35 0.1-3.12
Table 1: Physico-chemical parameters of water parameters.
No Gravel % Sand % MudMean Grain Size Sorting
Mean Verbal Description Mean Verbal Description1 2.05 66.02 31.91 2.1 m S 1.64 ps2 0.19 92.66 -0.14 2.17 S 0.9 ps3 0.032 61.18 56 8 2.94 s M 1.06 ps4 1.36 55.48 42.41 2.72 m S 1.05 ps5 1.66 66.98 31.35 1.93 m S 1.57 ps6 0 6.53 93.29 3 9 M 0.22 vws7 33.6 40.66 21.25 0.12 gm S 2.7 vps8 35.41 51.77 21.81 1.04 gm S 1.38 ps9 13.38 121.33 40.04 1.3- m S 1.88 ps
10 61.2 35.08 3.7 -2.86 s G 3.79 vps11 25.89 50.67 23.42 0.46 s M 2.67 vps
Table 2: Average sediment parameters for grain size analysis at different locations in Khor Al-Subiyah.
Figure 15: Variation of TPH in sediment sample of Khor Al-Subiyah.
When compared with the TPH guide line values suggested [36], (Table 3), it was found that the study area is moderately to heavily polluted with petroleum contaminants. The heavily polluted petroleum areas (Stations 5, 6 and 7) are located towards the lower Khor surrounding the Subiyah-Bubiyan Bridge indicating direct petroleum input from the heavy traffic route to the Island.
Total organic carbon (TOC) According to El-samra et al. [21] sediment collected from Kuwait

Page 9 of 18
Citation: Al-Sarawi M, Jasser S, Khader S (2017) Recent Trace Metals Pollution in Bottom Sediments of Khor Al-Sabiya, Kuwait. J Coast Zone Manag 20: 451. doi: 10.4172/2473-3350.1000451
Volume 20 • Issue 4 • 1000451J Coast Zone Manag, an open access journal ISSN: 2473-3350
Sample No. TPH (ppm)1 180.62 160.203 160.344 177.765 252.796 239.927 2328 177.319 72.6710 74.8911 72.44
Mean 163.72Range 72.44 - 252.79
Table 3: Analytical results showing TPH mean and range.
coastal waters in 1985 had TOC levels ranging from 0.7 to 1.81% at Doha, Shuwaikh, and Ras Al-Ardh which are high compared to the rest. In their study lowest values recorded were <1% in Khor Al-Subiyah and offshore Mina Abdullah. Al-Sarawi [5] found out that TOC levels ranged from 0.04 in intertidal sediments, and from 0.1 to 12.68% in other areas, with the peak occurring in Shuwaikh. The increase in TOC levels observed in sediments is probably linked to local contamination from Kuwait City and other coastal places.
In this study the total organic carbon (TOC) concentration ranged between 0.083%-5.606% (Table 4). The maximum and minimum values were recorded in Stations 4 and 11. The mean TOC was found to be in the range of 1.27%. Figures 16A and 16B show the variation of TOC in Khor Al-Subiyah. The lowest amount of TOC within Station 11 is probably due to the impact of the anthropogenic activities to the northern side of Khor Al-Subiyah. The TOC facies distribution map in Figure 17 shows the lateral changes of TOC which is high at the southern part of the inlet and lowest towards the north. This could reflect the potential impact of human activities from beach houses as well as extensive flow of nutrients from north to south. The human related activities could increase the composition of TOC levels in the study area.
Literathy et al. [36] determined the background levels of TOC in the marine bottom sediments of Kuwait to be within the range of 0.5 to 0.8%. Based on the analytical results, it was concluded that the study area is contaminated with TOC concentration which is higher than the background levels. The main sources of TOC in the area are a result of high influx from Shatt Al-Arab Rivers, and to a less extent sewage discharge from the local beach houses.
Nutrients
The 11 samples collected along the study area were analyzed to determine the following nutrient content: Nitrate, Ammonia, Nitrite, Phosphate, Chloride and Sulphate (Table 5).
Nitrite (NO2)The average concentration of NO2 for all the sampled stations in the
study area was 0.22 ppm within the range of 0.086-0.38 ppm (Figure 17). The highest value was recorded in Station 6 which is located near Bubiyan Bridge in the southern part of the Khor while the lowest value was in Station 11 (Figure 2). Nitrite is extremely toxic to aquatic life. Nitrite accumulation by ammonia occurs in nutrient rich estuarine water, and related to DO concentration.
Ammonia (NH4)
Sample No. TOC (%)1 0.6512 0.2923 0.2224 5.6065 1.4176 2.1427 1.3418 0.1409 1.97210 0.13311 0.083
Mean 1.27Range 0.083-5.606
Table 4: Analytical results showing TOC mean and range.
Figure 16: (A) Variation of TOC in sediment sample of Khor Al-Subiyah; (B) Distribution of TOC in Khor Al-Subiyah.
The average concentration of NH4 for all the sampled stations in the study area was 15.85 ppm within the range of 5.46-29.45 ppm (Figures 18A and 18B). The highest value was recorded in Station6 while the lowest value was in Station 2 (Figure 2).
Nitrate (NO3)
The average concentration of NO3 for all the sampled stations in the study area was 3.63 ppm within the range of 1.24-5.32 ppm (Figures 19A and 19B). The highest value was recorded in Station 5 while the lowest value was in Station 11 (Figure 2).
Phosphate (PO4)
The average concentration of PO4 for all the sampled stations in the study area was 18.64 ppm within the range of 18.12-30.01 ppm (Figures 20A and 20B). The highest value was recorded in Station 6 while the lowest value was in Station 11 (Figure 2).

Page 10 of 18
Citation: Al-Sarawi M, Jasser S, Khader S (2017) Recent Trace Metals Pollution in Bottom Sediments of Khor Al-Sabiya, Kuwait. J Coast Zone Manag 20: 451. doi: 10.4172/2473-3350.1000451
Volume 20 • Issue 4 • 1000451J Coast Zone Manag, an open access journal ISSN: 2473-3350
Figure 17: (A) Variation of nitrite (NO2) ppm in the study area of Khor Al-Subiyah; (B) Distribution of nitrite (NO2) in the study area.
Sample No.
Nitrite(NO2) (ppm)
Ammonia(NH4)
(13Pm)
Nitrate(NO3) (ppm)
Phosphate(PO4)(ppm)
Chloride CI"(ppm)
SulphateSO4
(ppm)1. 0.2235 6.9525 4.97 12.31 3598.07 2278.672. 0.2237 5.4675 1.24 10.55 1007.63 155.463. 0.2497 10.114 2.37 12.5 893.7 118.244. 0.2106 24.03 5.20 26.05 653.46 152.135. 0.2349 10.136 5.32 12.8 937.3 190.166. 0.3837 29.455 3.22 30.01 1159.75 273.487. 0.3221 19.078 3.96 20.74 716.69 120.18. 0.2472 12.112 4.94 17.71 229.56 55.949. 0.1621 20.948 5.24 25.48 439.58 115.00
10. 0.1353 29.278 1.97 28.81 132.98 29.7711. 0.0861 6.8857 1.60 8.12 1418.18 250.7
Mean 0.221 15.85 3.63 18.64 1023.44 339.96
Table 5: Nutrient levels in the study area in Khor Al-Subiyah.
Chloride (Clˉ)
The average concentration of Clˉ for all the sampled stations in the study area was 1023.44 ppm within the range of 132.98-3598.07 ppm (Figures 21A and 21B). The highest value was recorded in Station1 while the lowest value was in Station 10 (Figure 2)
Sulphate (SO4)
The average concentration of SO4 for all the sampled stations in the study area was 339.96 ppm within the range of 29.77-2278.67 ppm (Figures 22A and 22B). The highest value was recorded in Station 1 while the lowest value was in Station 10 (Figure 2).
Heavy metals
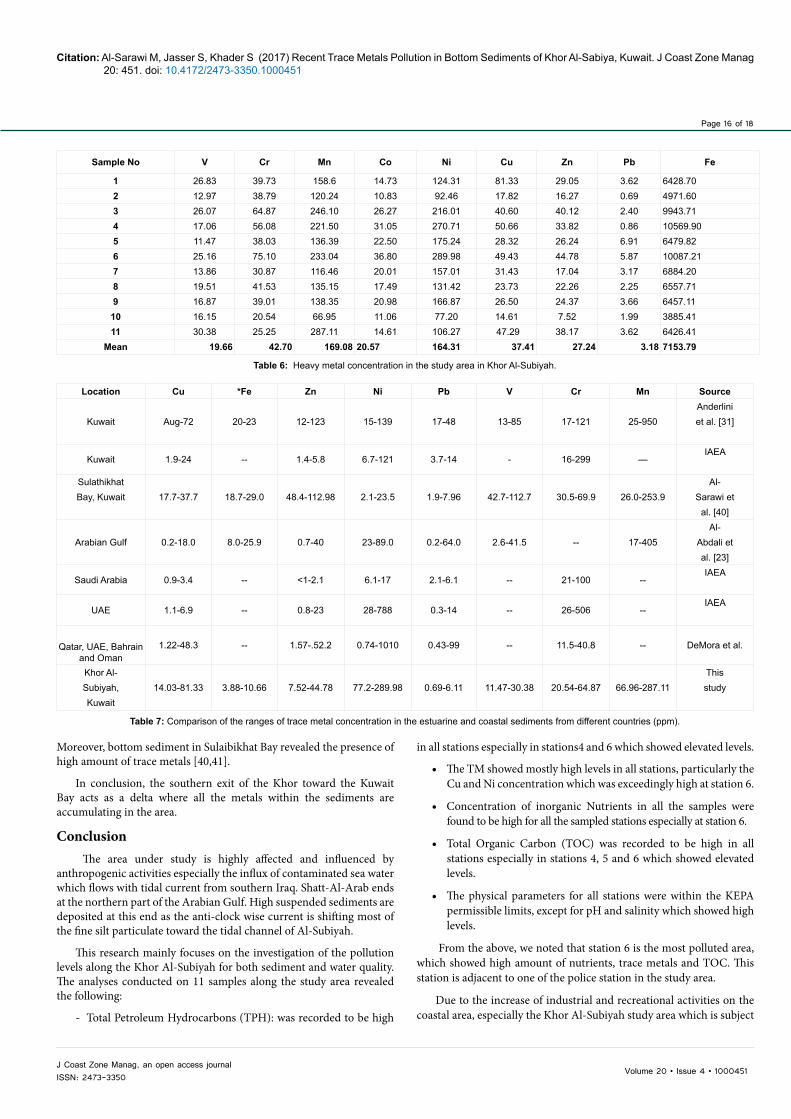
The total concentrations of trace metals V, Cr, Mn, Co, Ni, Cu, Zn, Pb, and Fe observed from 11 locations are presented in Table 6. Chemical analysis revealed minor variations in the trace metals concentration of V, Mn, Zn, Pb and Fe within the sample locations. A higher fluctuating range in the concentrations of Cr, Co and Ni and Cu was observed within the 11 locations, which could be attributed to different anthropogenic inputs such as industrial and sewage effluents. The concentration of the toxic metals such as Pb was found to be very low in all sampling sites. The sources of both Ni and V are usually crude oil, while the main source of Pb is terrestrial input. Abayachi and

Page 11 of 18
Citation: Al-Sarawi M, Jasser S, Khader S (2017) Recent Trace Metals Pollution in Bottom Sediments of Khor Al-Sabiya, Kuwait. J Coast Zone Manag 20: 451. doi: 10.4172/2473-3350.1000451
Volume 20 • Issue 4 • 1000451J Coast Zone Manag, an open access journal ISSN: 2473-3350
Figure 20: (A) Variation of phosphate (PO4) ppm in study area; (B) Distribution Phosphate (PO4) ppm in study area.
Figure 21: (A) Variation of chloride (Cl−) ppm in study area; (B) Distribution of chloride (Clˉ) ppm in the study area.
Figure 18: (A) Variation of Ammonia (NH4) ppm in study area of Khor Al-Subiyah. (B) Distribution of Ammonia (NH4) in the study area.
Figure 19: (A) Variation of nitrate (NO3) ppm in study area of Khor Al-Subiyah; (B) Distribution of nitrate (NO3) ppm in the study area.
Douabul [16] found that Shatt Al-Arab river is highly contaminated with trace metals.

Page 12 of 18
Citation: Al-Sarawi M, Jasser S, Khader S (2017) Recent Trace Metals Pollution in Bottom Sediments of Khor Al-Sabiya, Kuwait. J Coast Zone Manag 20: 451. doi: 10.4172/2473-3350.1000451
Volume 20 • Issue 4 • 1000451J Coast Zone Manag, an open access journal ISSN: 2473-3350
Figure 22: (A) Variation of sulphate (SO4) ppm in the study area of Khor Al-Subiyah; (B) Distribution of sulphate (SO4) ppm in study area of Khor Al-Subiyah.
Vanadium (V)
The mean concentration of V was 19.66 ppm. The range of V level was 11.47-30.38 ppm. Vanadium is an important indicator of oil pollution since oil is one of the main contributors of vanadium to the environment and most crude oils contain relatively high concentrations of vanadium. The highest concentration of vanadium was recorded in Stations 1, 3 and 11 which might be due to the open environment at these Stations (Figures 23A and 23B). The facies map for V distribution reflects the importance of anthropogenic activities in the marine environment (Figure 23).
Chromium (Cr)
The mean concentration of Cr was 42.70 ppm within the range of 20.54 ppm (Station 10)-64.87 ppm (Station 3) (Figure 24). The highest level of Cr was recorded in Station 3 (Figures 24A and 24B).
Figure 23: (A) Variation of V in the study area of Khor Al-Subiyah; (B) Distribution of Vanadium (V) in the study area.
Manganese (Mn)
The mean concentration of Mn was 196.08 ppm with the range of 66.96 ppm (Station 10)-287.11 ppm (Station 11) (Figures 25A and 25B). The highest level of Mn was recorded in Station 11 (Figure 2).
Cobalt (Co)
The mean concentration of Co was 20.57 ppm within the range of 10.83 ppm (Station 2)-36.8 ppm (Station 6) (Figures 26A and 26B). The highest levels of Co were recorded in Station 6 (Figure 2).
Nickel (Ni)
The mean concentration of Ni was 164.31 ppm within the range of 77.2 ppm (Station 10)-289.98 ppm (Station 6) (Figures 27A and 27B). The highest concentration of Ni was recorded at Station 6. The high concentrations of Ni probably reflect the oil-related activities (Figure 2).

Page 13 of 18
Citation: Al-Sarawi M, Jasser S, Khader S (2017) Recent Trace Metals Pollution in Bottom Sediments of Khor Al-Sabiya, Kuwait. J Coast Zone Manag 20: 451. doi: 10.4172/2473-3350.1000451
Volume 20 • Issue 4 • 1000451J Coast Zone Manag, an open access journal ISSN: 2473-3350
Figure 24: (A) Variation of Cr in the study area of Khor Al-Subiyah; (B) Distribution of Chromium (Cr) in the study area.
Figure 25: (A) Variation of Mn in the study area of Khor Al-Subiyah; (B) Distribution of Manganese (Mn) in the study area.
Copper (Cu)
The mean concentration of Cu was 37.41 ppm within the range of 14.03 ppm (Station 10)-81.33 ppm (Station 1) (Figures 28A and 28B). The highest level of Cu was recorded in Station 1 which is the shipping route. Copper is available as a result of high iron and organic content in the area. The presence of Cu is mainly attributed to the presence of ships and fishing boats operating in the area.
Zinc (Zn)
The mean concentration of Zn was 27.24 ppm within the range of 7.52 ppm (Station 10)-44.78 ppm with the highest value recorded in Station 6 (Figure 2). Sludges from recent sewage discharges could be the main source of Zn pollutants in the study area (Figures 29A and 29B) [37,38].
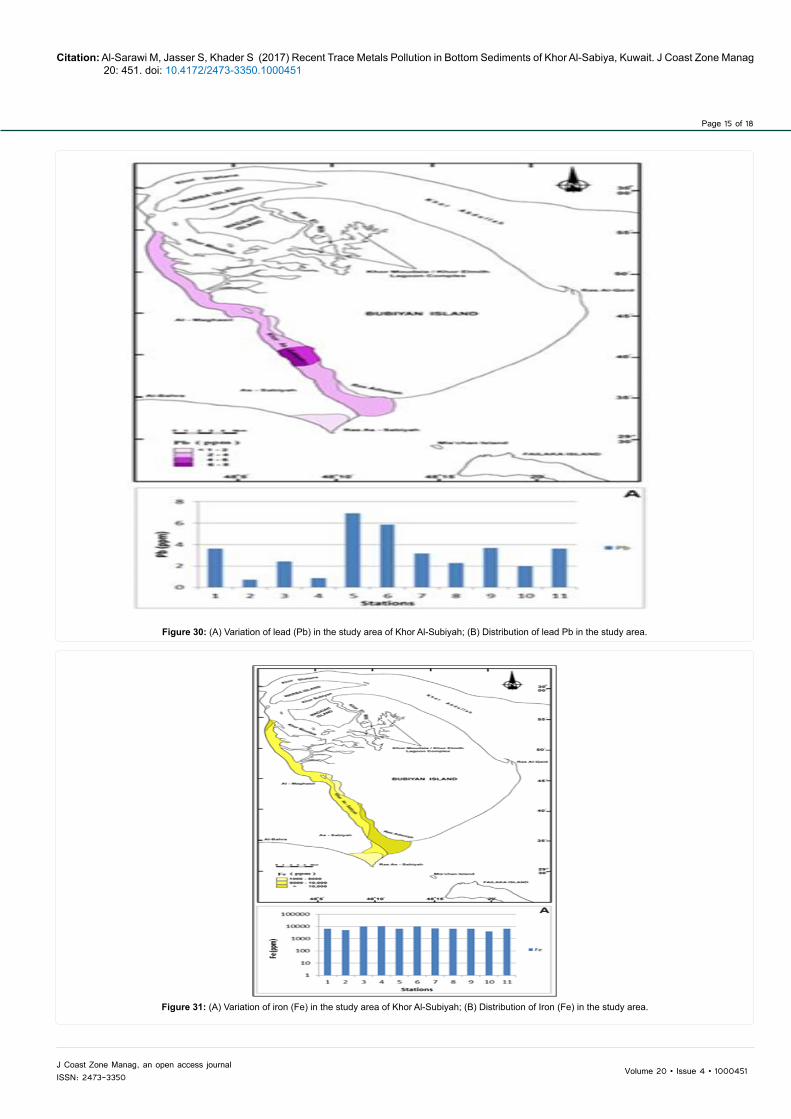
Lead (Pb)
The mean concentration of Pb was 3.18 ppm. The range of Pb levels was 0.69 ppm (Station 2)-6.11 ppm (Figures 30A and 30B) which is the highest level recorded in Station 5 (Figure 2).
Iron (Fe)
The mean concentration of Fe in sediments samples in the study area was 7,153.7 within the range of 3885.4 ppm (Stations 10)-10659.9 ppm (Stations 4) (Figures 31A and 31B). The highest concentration of Fe was recorded in Stations 4 and 6, and the lowest concentration was in Station 10 (Figure 2).
On comparison of the measured trace metals in the study area with the background levels documented Metwally et al. [24] and Al-Hashimi and Salman [39] it was found that the study area is heavily polluted with Cu and Ni. Similar comparison of the trace metal values with other studies undertaken in Kuwait and Arabian Gulf countries (Table 7), confirmed the heavy concentration of Cu and Ni in the study area.

Page 14 of 18
Citation: Al-Sarawi M, Jasser S, Khader S (2017) Recent Trace Metals Pollution in Bottom Sediments of Khor Al-Sabiya, Kuwait. J Coast Zone Manag 20: 451. doi: 10.4172/2473-3350.1000451
Volume 20 • Issue 4 • 1000451J Coast Zone Manag, an open access journal ISSN: 2473-3350
Figure 26: (A) Variation of in cobalt (Co) the study area of Khor Al-Subiyah; (B) Distribution of cobalt (Co) in the study area.
Figure 27: (A) Variation of nickel (Ni) in the study area of Khor Al-Subiyah; (B) Distribution of nickel (Ni) in the study area.
Figure 28: (A) Variation of Cu in the study area of Khor Al-Subiyah; (B) Distribution of copper Cu in the study area.
Figure 29: (A) Variation of Zn in the study area of Khor Al-Subiya; (B) Distribution of zinc (Zn) in the study area.
Page 15 of 18
Citation: Al-Sarawi M, Jasser S, Khader S (2017) Recent Trace Metals Pollution in Bottom Sediments of Khor Al-Sabiya, Kuwait. J Coast Zone Manag 20: 451. doi: 10.4172/2473-3350.1000451
Volume 20 • Issue 4 • 1000451J Coast Zone Manag, an open access journal ISSN: 2473-3350
Figure 30: (A) Variation of lead (Pb) in the study area of Khor Al-Subiyah; (B) Distribution of lead Pb in the study area.
Figure 31: (A) Variation of iron (Fe) in the study area of Khor Al-Subiyah; (B) Distribution of Iron (Fe) in the study area.
Page 16 of 18
Citation: Al-Sarawi M, Jasser S, Khader S (2017) Recent Trace Metals Pollution in Bottom Sediments of Khor Al-Sabiya, Kuwait. J Coast Zone Manag 20: 451. doi: 10.4172/2473-3350.1000451
Volume 20 • Issue 4 • 1000451J Coast Zone Manag, an open access journal ISSN: 2473-3350
Sample No V Cr Mn Co Ni Cu Zn Pb Fe
1 26.83 39.73 158.6 14.73 124.31 81.33 29.05 3.62 6428.702 12.97 38.79 120.24 10.83 92.46 17.82 16.27 0.69 4971.603 26.07 64.87 246.10 26.27 216.01 40.60 40.12 2.40 9943.714 17.06 56.08 221.50 31.05 270.71 50.66 33.82 0.86 10569.905 11.47 38.03 136.39 22.50 175.24 28.32 26.24 6.91 6479.826 25.16 75.10 233.04 36.80 289.98 49.43 44.78 5.87 10087.217 13.86 30.87 116.46 20.01 157.01 31.43 17.04 3.17 6884.208 19.51 41.53 135.15 17.49 131.42 23.73 22.26 2.25 6557.719 16.87 39.01 138.35 20.98 166.87 26.50 24.37 3.66 6457.11
10 16.15 20.54 66.95 11.06 77.20 14.61 7.52 1.99 3885.4111 30.38 25.25 287.11 14.61 106.27 47.29 38.17 3.62 6426.41
Mean 19.66 42.70 169.08 20.57 164.31 37.41 27.24 3.18 7153.79
Table 6: Heavy metal concentration in the study area in Khor Al-Subiyah.
Location Cu *Fe Zn Ni Pb V Cr Mn Source
Kuwait Aug-72 20-23 12-123 15-139 17-48 13-85 17-121 25-950Anderliniet al. [31]
Kuwait 1.9-24 -- 1.4-5.8 6.7-121 3.7-14 - 16-299 —IAEA
Sulathikhat17.7-37.7 18.7-29.0 48.4-112.98 2.1-23.5 1.9-7.96 42.7-112.7 30.5-69.9 26.0-253.9
Al-Bay, Kuwait Sarawi et
al. [40]
Arabian Gulf 0.2-18.0 8.0-25.9 0.7-40 23-89.0 0.2-64.0 2.6-41.5 -- 17-405Al-
Abdali etal. [23]
Saudi Arabia 0.9-3.4 -- <1-2.1 6.1-17 2.1-6.1 -- 21-100 --IAEA
UAE 1.1-6.9 -- 0.8-23 28-788 0.3-14 -- 26-506 --IAEA
1.22-48.3 -- 1.57-.52.2 0.74-1010 0.43-99 -- 11.5-40.8 -- DeMora et al. Qatar, UAE, Bahrain
and OmanKhor Al-
14.03-81.33 3.88-10.66 7.52-44.78 77.2-289.98 0.69-6.11 11.47-30.38 20.54-64.87 66.96-287.11This
Subiyah, studyKuwait
Table 7: Comparison of the ranges of trace metal concentration in the estuarine and coastal sediments from different countries (ppm).
Moreover, bottom sediment in Sulaibikhat Bay revealed the presence of high amount of trace metals [40,41].
In conclusion, the southern exit of the Khor toward the Kuwait Bay acts as a delta where all the metals within the sediments are accumulating in the area.
Conclusion The area under study is highly affected and influenced by
anthropogenic activities especially the influx of contaminated sea water which flows with tidal current from southern Iraq. Shatt-Al-Arab ends at the northern part of the Arabian Gulf. High suspended sediments are deposited at this end as the anti-clock wise current is shifting most of the fine silt particulate toward the tidal channel of Al-Subiyah.
This research mainly focuses on the investigation of the pollution levels along the Khor Al-Subiyah for both sediment and water quality. The analyses conducted on 11 samples along the study area revealed the following:
- Total Petroleum Hydrocarbons (TPH): was recorded to be high
in all stations especially in stations4 and 6 which showed elevated levels.
• The TM showed mostly high levels in all stations, particularly the Cu and Ni concentration which was exceedingly high at station 6.
• Concentration of inorganic Nutrients in all the samples were found to be high for all the sampled stations especially at station 6.
• Total Organic Carbon (TOC) was recorded to be high in all stations especially in stations 4, 5 and 6 which showed elevated levels.
• The physical parameters for all stations were within the KEPA permissible limits, except for pH and salinity which showed high levels.
From the above, we noted that station 6 is the most polluted area, which showed high amount of nutrients, trace metals and TOC. This station is adjacent to one of the police station in the study area.
Due to the increase of industrial and recreational activities on the coastal area, especially the Khor Al-Subiyah study area which is subject

Page 17 of 18
Citation: Al-Sarawi M, Jasser S, Khader S (2017) Recent Trace Metals Pollution in Bottom Sediments of Khor Al-Sabiya, Kuwait. J Coast Zone Manag 20: 451. doi: 10.4172/2473-3350.1000451
Volume 20 • Issue 4 • 1000451J Coast Zone Manag, an open access journal ISSN: 2473-3350
to developmental changes, this puts the ecological system in the area under stress and leads to deterioration of the environment at the inlet. The increase in the level of pollution will have harmful effects on the biological and geological environments in the area, and finally impact the human health due to the resuspension of contaminated sediments. As the contaminants can accumulate in the sediments and cause adverse effects to exposed benthic organisms and this would potentially lead to bioaccumulation of contaminants up through the food chain. The increase in the concentration of heavy metals in the area will impact the water quality and make it polluted and harmful not only for humans but it will also affect the marine organisms and birds in the area.
The study highly recommends the following:
• Identify and understand the effects of coastal development on the tidal channel (Khor Al-Subiyah) habitats.
• Evaluate the use of tidal channel as early warning system for pollutants.
• Evaluate the use of tidal channel as a sentinel habitat for the monitoring and assessment of activities.
• Conduct intensive studies for assessing the harmful chemicals in sediments and shellfish.
• Study in detail the presence of Polybrominated Diethyl Ethers (PBDES).
• Study the presence of faecal coliform bacteria as an indicator of the presence of pathogens in the environment.
• Study the presence of chemicals both in water and sediment to the north of the tidal channel.
Acknowledgement
The authors like to thank Kuwait University, environmental laboratory and the central lab at college of science for the support and cooperation. Special thanks to Florida International University, Department of Earth and Environment, United States of America for their technical guidance.
References
1. Al-Zamel AZ (1983) Geology and Oceanography of Recent Sediments of Jazirat Budiyan and Ras as Subiyah, Kuwait. University of Sheffield, Sheffield, UK.
2. Gunatilaka A (1986) Kuwait and the Northern Arabian Gulf: A study in Quarterly Sedimentation Episodes.
3. Khalaf F, Literathy P, Anderlini V (1982) Vanadium as a tracer of oil pollution in the sediments of Kuwait. Hydrobiology 91: 147-154.
4. Khalaf F, Al-Ghadban AN, Al-Saleh A, Al-Harmi I (1982) Sedimentology and Mineralogy of Kuwait Bay Bottom Sediments, Kuwait, Arabian Gulf. Marine Geology 46: 71-99.
5. Al-Sarawi MA (1995) Surface Geomorphology of Kuwait. Geo-journal 35: 493-503.
6. Khalaf FI (1978) Intertidal Flat Sediment of Kuwait. Kuwait Institute for Scientific Research, Report.
7. Hilmy ME, Slansky E, Khalaf FI (1971) Opaque Minerals in Recent Beach Sediments of Kuwait. Geol Palaeontol Monatsheft 6: 340-344.
8. Al-Sarawi M, Gundlach E, Baca B (1985) An Atlas of Shoreline Types and Resources. Kuwait University, Kuwait.
9. Abou SMM, Al-Sarawi MA (1990) Utilization and Management of Coastal Area in Kuwait. Coastal Management 18: 385-401.
10. El-Baz F, Al-Sarawi (2000) Atlas of the State of Kuwait from Satellite Images. Kuwait Foundation for the Advancement of Sciences, Safat Kuwait.
11. Al-Yamani FY, Bishop I, Ramadan E, Al-Husaini M (2004) Oceanographic Atlas of Kuwait’s Waters. Kuwait Institute for Scientific Research.
12. Abd-El-Gawad EA, Lotfy MM, Sadooni FN, Katheery BE (2008) Assessment of the Oil Pollution Extent in the Offshore Sediments, Abu Dhabi, UAE. Aus J Bas App Sci 2: 617-631.
13. Al-Bakri D, Khalaf F, Al-Ghadban AN (1984) Minerology, Genesis and Sources of Surficial Sediments in Kuwait Marine Environment, Northern Arabian Gulf. J Sedim Petro 54: 1266-1279.
14. Al-Ghadban A, Salman AS (1993) Preliminary Assessment of the suspended sediment and its associated pollutants in Kuwait Bay, Kuwait. KFAS Final Report.
15. Al-Ghadban AN, El-Sammak A (2005) Source, Distribution and Composition of the Suspended Sediments, Kuwait Bay, Northern Arabian Gulf. J Ari Env 60: 647-661.
16. Abayachi JK, Douabul AZ (1985) Trace Metals in Shatt Al-Arab River, Iraq. Water Research 19: 457-462.
17. Anderlini VC, Mohammed OS, Zarba MA, Fowler SW, Miramand P, et al. (1982) Trace metals in marine sediments of Kuwait. Bull Env Contam Tox 28: 75-80.
18. Al-Ghadban AN, Al-Sammak A, Al-Rushaid R, A-Shemmari H, Al-Matrouk K, et al. (2004) Environmental Assessment of the Coastal Habitats and Coral Reef Communities, Kuwait. Institute for Scientific Research.
19. Al-Zamel AZ, BouRabee F, Al-Sarawi MA, Olszewski M (2005) Determination of the Sediment deposition rates in the Kuwait Bay using 137 Cs and 210 Pb. Nukleonika 51: 39-44.
20. Al-Zamel AZ, Bou RF, Olsezewski M, Bem H (2005) Natural Radionuclides and 137Cs Activity Concentration in the Bottom Sediment Cores from Kuwait Bay. Journal of Radioanalytical and Nuclear Chemistry 226: 269-276.
21. El-Samra MI, Emara HI, Shundo F (1986) Dissolved Petroleum Hydrocarbon in the Northwestern Arabian Gulf. Marine Pollution Bulletin 17: 65-68.
22. Olayan AH, Al-Sarawi MA (1993) Inorganic and Organic Pollutant Measurements at the Kuwait Waterfront Project. Water Air and Soil Pollution 69: 301-308.
23. Massoud MS, Al-Abdali F, Al-Gadban AN, Al-Sarawi M (1996) Bottom Sediments of the Arabian Gulf-II TPH and TOC Concentrations as Indicators of oil pollution and Implications for the Effect and fate of the Kuwait Oil Slick. Environ Pollut 93: 271-284.
24. Metwally MES, Al-Muzaini S, Jacob PG, Bahloul M (1997) Petroleum Hydrocarbons and Related Heavy Metals in the Near-shore Marine Sediments of Kuwait. Env Int 23: 115-121.
25. El-Sammak AA, Ghadban AN, Beg MU (2004) Assessment of Sediment Quality South of Ras Al-Ardh and Northern Territorial Waters, Kuwait, Northern Arabian Gulf. J Coast Res 39: 64-88.
26. Bryan GW (1976) Heavy Metal Contamination in the sea. In: Johnstes R (ed.), Marine Pollution. Academic Press, London, UK. pp: 185-302.
27. Clark RB (1986) Marine Pollution. Clarendon Press, Oxford, London. p. 236.
28. Chester R, Stoner JH (1975) Material from surface seawater. Nature. p. 50.
29. Bellinger EG, Benham BR (1978) The levels of metals in dock-yard sediments with particular reference to the contributions from ship-bottom paints. Environ Poll 15: 71-81.
30. Young DR, Alexander GV, McDermott ED (1979) Vessel-related Contamination of Southern California Harbours by Copper and other Metals. Marine Poll Bull 10: 50-56.
31. Samhan O, Zarba M, Anderlini V (1986) Aeolian Contribution of Trace Metals to Marine Sediments of Kuwait. Environ Int 12: 001-007.
32. Al-Shemmari H (2000) Effect of Seasonal Variation on Trace Metal Concentrations in the Sediment of Kuwait Bay. Kuwait Institute for Scientific Research, Report No. KISR 5964, Kuwait.
33. Al-Shemmari H, Al-Senafy M, Al-Fahad K (2002) Effect of Seasonal Variation on the Water Quality in Kuwait Bay. Proceedings of the International Conference on Coastal Zone Management and Development Kuwait.
34. Alve E (1991) Benthic Foraminifera in Sediment Cores Reflecting Heavy Metal Pollution in Sorfjord, Western Norway. Journal of Foraminifera Research 21: 1-19.
35. Boltovasky E, Scott D, Medioli F (1991) Morphological variations of benthic foramina feral tests in response to changes in ecological parameters a review. Journal of Paleontology 65: 175-185.

Page 18 of 18
Citation: Al-Sarawi M, Jasser S, Khader S (2017) Recent Trace Metals Pollution in Bottom Sediments of Khor Al-Sabiya, Kuwait. J Coast Zone Manag 20: 451. doi: 10.4172/2473-3350.1000451
Volume 20 • Issue 4 • 1000451J Coast Zone Manag, an open access journal ISSN: 2473-3350
36. Literathy P, Foda M (1985) KISR Activities on Nowruz Oil Slick. Kuwait Institute for Scientific Research, Kuwait.
37. Literathy P (1993) Consideration for the Assessment of environmental Consequences of the 1991 Gulf War. Marine Poll Bull 27: 349-356.
38. Samhan O, Ghobrial F (1987) Trace Metals and Chlorinated Hydrocarbons in Sewage Sludges of Kuwait. Env Int 12: 001-007.
39. Al-Hashimi AH, Salman HH (1985) Trace Metals in the Sediments of the North-
Western Coast of Arabian Gulf. Marine Poll Bull 16: 118-120.
40. Al-Sarawi MA, Massoud MS, Khader SR (2002) Recent Trace Metal Pollution in Bottom Sediments of Sulaibikhat Bay, Kuwait. Technology 8: 38-50.
41. Baby S (2003) Landsat 7 Image of Bubiyan Island (Scale 1: 130,000). Landsat 7 Enhanced Thematic Mapper Plus (ETM+) bands 2, 4 and 7 color composite image of Bubiyan Island (Scale 1: 130,000). KISR, Kuwait.
Citation: Al-Sarawi M, Jasser S, Khader S (2017) Recent Trace Metals Pollution in Bottom Sediments of Khor Al-Sabiya, Kuwait. J Coast Zone Manag 20: 451. doi: 10.4172/2473-3350.1000451