c national library of sri lanka-cataloguing-in-publication
TRANSCRIPT


Copyright C October 2002 Institute of Policy Studies, Sri Lanka
National Library of Sri Lanka-Cataloguing-In-Publication Data
Shand, Ric
Irrigation and Agriculture in Sri Lanka/ Ric Shand.-
Colombo: Institute of Policy Studies, 2002.- 210p. ; 25 c.m. ISBN 955-8708-11-9 Price: i. 631.5875493 DDC 21 ii. Title
1. Agriculture – Sri Lanka
2. Irrigation – Sri Lanka ISBN 955-8708-11-9 Price Please address orders to: Institute of Policy Studies 99 St Michael’s Road, Colombo 3, Sri Lanka Tel: +94 1 431 368, 431 378 Fax: +94 1 431 395 Email: [email protected] The views expressed in this publication are those of the author and do not necessarily represent those of the Institute of Policy Studies.

Irrigation and Agriculture
in
Sri Lanka
by
Ric Shand This study was first commissioned under the Public Sector Restructuring Project in Sri Lanka for the World Bank and the Ministry of Finance and Planning, Government of Sri Lanka, Colombo, 1

i
Contents Page Foreword i
Acknowledgements ii
Contents iii
List of Tables iv
List of Diagrams vi
List of Maps vi
List of Figures vi
Special Terms, Acronyms and Abbreviations vii
Contributors x
1 Introduction Ric Shand 1
2 Historical Background Ric Shand 4
3 Irrigation in Public Sector Investment Programmes 1950 to 2000 S. Somasunderam and Y.M.W.B. Weerasekera 12
4 Benefits and Costs of Past Irrigation Investment Ric Shand and S.A.B. Ekanayake 37
5 Options for Future Investment in Irrigation N. Wickremaratne and Ric Shand 61
6 Operation and Maintenance Requirements of Irrigation Systems N. Wickremaratne and S.A.B. Ekanayake 107
7 Benefits and Costs of Rice Based Agricultural Development S.A.B. Ekanayake 116
8 Diversification and the Development of Commercial Agriculture U. Pethiyagoda and Ric Shand 139
9 Developments in Irrigation and Agriculture in the 1990s Ric Shand 168
Annex 1 185 References 187
ii
Foreword
Sri Lanka has always been predominantly an agricultural economy since ancient times and the history of irrigation facilities dates back to over two millennia. Small village tanks with single channel systems developed into an advanced irrigation technology such as the device called the valve pit (Biso Kotuwa) and a large number of irrigation systems helped make Sri Lanka in ancient times the “the Granary of the East”.
At the time of regaining independence the predominantly agricultural sector consisted of an export agricultural sector and a subsistence agricultural sector. Governments after independence attempted to develop the domestic agricultural sector through the development of agricultural infrastructure to improve irrigation facilities, apart from institutions for the delivery of credit, inputs and extension services. The major focus of agricultural policy was to achieve self-sufficiency in food, mainly rice and investments were made in the restoration and rehabilitation of existing irrigation schemes and the construction of new schemes. It was also to help in relieving the growing pressure of the population working on land in the existing dry zone areas.
About 75 per cent of the population still live in the rural sector and agriculture, particularly rice farming is, in Sri Lanka not merely a livelihood but is considered a way of life. In order to develop this sector it becomes necessary, as there is a seasonal variation in rainfall, to provide irrigation facilities to cultivate land in two seasons at least.
The Gal Oya Scheme was the first large multipurpose project to be undertaken followed since 1955 by a number of other irrigation schemes culminating in the largest ever multipurpose irrigation project undertaken by the State since independence in the Mahaweli Development Programme.
The present volume is timely and deals in depth with some important issues and problems associated with these irrigation schemes and agriculture. It has been written by a number of eminent specialists in their respective fields and ably correlated and edited by Ric Shand who has contributed considerably to the text himself. The study was originally completed in 1990 and has since been revised and updated to the year 2000. Of special interest is the examination of such issues as the costs and returns of irrigation schemes , the options for investment in irrigation, the adoption of new designs and technologies, the benefits and costs of rice based development with particular reference to productivity levels, and the prospects for diversification and development of commercial agriculture.
The arguments are supported by a wealth of statistical data and illustrated by some very interesting maps and diagrams. There is no doubt that the information and discussions provided in the book would be of interest and use to policy planners, administrators, experts in irrigation and agriculture as well as to the general public alike.
Gamani Corea Chairman, IPS August 2002

iii
Acknowledgements The editor and contributors wish to express their warm thanks to the Institute of Policy Studies and to its Executive Director, Dr. Saman Kelegama for their generous offer to publish an updated version of the 1990 study. As team leader of the original study and as editor of this volume, I would like to express my deep appreciation for the contributions made by the highly talented specialist members of the team. Their team spirit and cooperation made the study an enjoyable experience at a difficult time for Sri Lanka. The team was ably and sympathetically coordinated by Mr. Merrick Perera. We extend our warm thanks for the invaluable cooperation of the Cartography Unit in the Research School of Pacific and Asian Studies, Australian National University and in particular to Kay Dancey in the Unit who expertly and patiently prepared all the Maps, Diagrams and Figures. We also thank Christine Gomesz of the IPS who has guided this manuscript through the final stages of its preparation for publication.
Ric Shand
Editor
August 2002

iv
List of Tables Table 2.1 Classification of Irrigation Works by Type, Size and Features 10
Table 3.1 Investment in Irrigation 1950-1987 15
Table 3.2 Investments in Irrigation as Percentages of PIP 15
Table 3.3 Sectoral Allocation in Public Investment Programmes from 1979-83 to 1996-2000 17
Table 3.4 Mahaweli Allocations in the Public Investment Programme 1980-2000 21
Table 3.5 Ongoing and New Investments and Annual Expenditures in the Mahaweli, 1979 to 2000 24
Table 3.6 Investment in Non-Mahaweli Irrigation Schemes, 1986-1999 27
Table 3.7 Breakdown of Expenditures on the Inginimitiya Project 29
Table 3.8 Estimated Costs of the Kirindi Oya Project 30
Table 3.9 Some Performance Indicators of Major and Medium Schemes 31
Table 3.10 Breakdon of Expenditures on the Village Irrigation Rehabilitation Project 32
Table 3.11 Estimated Actual Costs of the Tank Irrigation Modernisation Project 33
Table 3.12 The Gal Oya Left Bank Management Project 34
Table 3.13 Other Performance Indicators of the Gal Oya Left Bank 41 Management Project 34
Table 4.1 Indicators of Costs and Benefits for Mahaweli and Rehabilitation Schemes 38
Table 4.2 Cost and Benefit Parameters for Six World Bank-Supported Projects 41
Table 4.3 Appraisal and Project Completion Projections of Cropping Intensities and Paddy Yields for the TIMP 46
Table 4.4 Sensitivity Tests on the Projected EIRR of the VIRP 49
Table 4.5 Distribution of the Benefit Cost Ratios within the VIRP 52
Table 4.6 Projected Economic Returns from the Major Irrigation Rehabilitation Project (MIRP) 53
Table 5.1 Total Areas under Other Proposed River Basin Development System Proposals within the North Central Province 67
Table 5.2 Reported Differences brought about by the New Technology at Walagambahuwa 80
Table 5.3 Cropping Patterns Followed by Farmers 80
Table 6.1 Holding Size and Cropping Intensity in Major Schemes 110
Table 6.2 Profitability of Irrigated Paddy 111
Table 6.3 Incidence of Paddy Parcels with Water Problems by Size of Parcel, Maha Season 1986/87 113
Table 6.4 Incidence of Paddy with Water Problems, Yala 1987 or Most Recently Cultivated Yala 113

v
Table 6.5 Percentage Distribution of Paddy Parcels with Water Problems by Type, Maha 1986/87 113
Table 6.6 Percentage Distribution of Paddy Parcels with Water Problems by Type, most recent Yala 114
Table 7.1 A Comparison of Estimates of Rice Production 126
Table 7.2 Projected Paddy Yields 127
Table 7.3 Average Paddy Yields in System H 128
Table 7.4 Projections of Population, Demand and Supply of Rice, 1991 to 2016 130
Table 7.5 Total Rice Production at Varying Levels of Yield Increase per annum with Area Expansion as Planned in 1992 131
Table 7.6 Total Rice Production at Varying Levels of Yield Increase per annum with Area Expansion Planned in 1992, Including System B (RB) and Moragahakanda 131
Table 7.7 Supply of Nutrients and the Sources 137
Table 7.8 Availability, Requirement and the Per Capita Per Day Shortfall of Locally Produced Food Items 138
Table 8.1 Area Planned by Crops, Uda Walawe Project 140
Table 8.2 Area Cultivated in Uda Walawe Project by Crops, Year and Season, 1969/70 to 1979 141
Table 8.3 Quantities, Yield and Area Required by Some Traditional Dry Zone Crops in 1987 148
Table 8.4 Costs and Returns for Paddy and Some Other Crops Under Irrigation at Polonnaruwa 148
Table 8.5 Yields and Returns from Crops Grown at Kalawewa, System H in Yala Season 149
Table 8.6 Areas of Crops Grown in System H in Yala Season, 1977 to 1984 150
Table 8.7 Crop Requirements Based on Nutritional Needs in 1986 150
Table 8.8 Economic Performance of Crops in Yala Season in Well Irrigated Areas 153
Table 8.9 Areas of Gravity Command within the AMDP by Type of Drainage 154
Table 8.10 Crops Identified as having Potential for Mahaweli Areas 156
Table 9.1 Growth Rates and Structure of Real Output, 1986 to 1997 168
Table 9.2 Sri Lanka Trade Policy Protection – Agricultural Crops Relative to Manufacturing Industry 175

vi
List of Diagrams Page Diagram 5.1 Present and Potential Additional Areas Under the
Mahaweli Irrigation System 63 List of Maps Map 2.1 The Mahaweli Development Project and Special Areas 6 Map 2.2 Accelerated Mahaweli Area 11 Map 3.1 Accelerated Mahaweli Development Programme 13 List of Figures Figure 5.1 Village Tank Systems 78 Figure 5.2 Solar Radiation and Rice Grain Yield 82 Figure 5.3 Profile of a Typical Dry Zone Landscape 84 Figure 5.4 Muthukandiya Model – Farm Level 85 Figure 5.5 Muthukandiya Model – Village Level 86 Figure 5.6 Weli Oya Model 89 Figure 5.7 A Two-Tank Version of the Weli Oya Model 90 Figure 5.8 Types of Aquifers 92 Figure 5.9 Areas under Ground Water Investigations 94 Figure 5.10 Vanathavillu Basin 95 Figure 5.11 Murunkan Basin 97 Figure 7.1 Trends in Paddy Prices and Cost of Production 120

vii
Special Terms, Acronyms and Abbreviations ADB Asian Development Bank
AC Alternative crops
AMDP Accelerated Mahaweli Development Programme
ANUGA Biennial food fair held in Cologne, Federal Republic of Germany
BDS Baffle Distribution System
BGs Bathalagoda rice varieties
CEM Country Economic Memorandum
CI Cropping intensity
DRC Domestic Resource Cost
EBCR Economic benefit cost ratios
EDS Enterprise development strategy
EIED Employment Investment Enterprise Strategy
EIRR Economic internal rate of return
EMS Export marketing strategy
EPC Effective Protection Coefficient
ERR Economic rate of return
ESC Effective Subsidy Coefficient
FCC Field canals
GDP Gross Domestic Product
GODB Gal Oya Development Board
GOSL Government of Sri Lanka
GPS Guaranteed Price Scheme
IDA International Development Agency
IPS Institute of Policy Studies
ISMP Irrigation Systems Management Project
LB Left Bank LDD Land Development Department

viii
LMCA Lower Mahaweli Catchment Area
LHG Low humic gley (soil)
MARD Ministry of Agricultural Development and Research
MASL Mahaweli Authority of Sri Lanka
MEA Mahaweli Economic Agency
MECA Mahaweli Engineering and Construction Agency
MIRP Major Irrigation Rehabilitation Project
MOARD Ministry of Agricultural Development and Research
NPC Nominal Protection Coefficient
OECD Organisation for Economic Cooperation and Development
OED Operations Evaluation Department (World Bank)
OFC Other food crops
O&M Operations and Maintenance
PAR Poverty Assessment Report
PCR Project Completion Report
PIP Public Investment Programme
PMU Planning and Monitoring Unit
PPAR Project Performance Audit Report
RB Right Bank
RBE Reddish brown earths
RVDB River Valley Development Board
SEDZ South East Dry Zone
SRD SR Daines Report
TEC Total estimated cost
TIMP Tank Irrigation Rehabilitation Project
TOR Terms of Reference
UKODM United Kingdom Overseas Development Ministry

ix
UMCA Upper Mahaweli Catchment Area
UMPD Upper Mahaweli Peripheral Development
USAID Unites States Agency for International Development
VIRP Village Irrigation Rehabilitation Project

x
Contributors 1990 Irrigation Sub-Sector Study Team
Merrick Perera Coordinator Public Sector Restructuring Project Ministry of Finance and Planning Ric Shand Team Leader University of Colombo and The Australian National University S. A. B. Ekanayake Senior Economist Planning and Monitoring Unit Mahaweli Authority of Sri Lanka U. Pethiyagoda Employment Investment Enterprise Development Mahaweli Authority of Sri Lanka N. L. Sirisena Deputy Director Statistics Division Central Bank of Sri Lanka S. Somasunderam Deputy Director National Planning Division Ministry of Finance and Planning Y. M. W. B. Weerasekera Senior Economist Department of Economic Research Central Bank of Sri Lanka K. N. Wickramaratne Assistant Director Mahaweli Engineering and Construction Agency Mahaweli Authority of Sri Lanka

1
1. Introduction
Since Independence, investment in irrigation has received high priority in the Public
Investment Programme (PIP) in Sri Lanka. The proportion of public investment allocated
for irrigation varied from 9 per cent to 40 per cent in the 1950-87 period. Being
traditionally a predominantly agricultural economy, it is not surprising that such large
allocations were made for investment in irrigation. Irrigation is an input that helps not only
in the expansion of area under agriculture, but can also facilitate technological change and
therefore help to increase productivity. Also, agro-climatically, Sri Lanka has an unusually
favourable environment for exploitation of rainfall and cultivable land through irrigation1.
One major concern associated with past expenditures on irrigation in the PIP was that the
high priority given to this sub-sector may have resulted in shortages of essential investment
funds for other sub-sectors within agriculture. For example, the tree crop sector (tea, rubber
and coconut), which accounts for a higher value added than the paddy sector in GDP, may
have suffered. Relatedly, sectors other than agriculture in the economy may also have been
adversely affected. Thus, essential developments in those areas may have been unduly
postponed. It has been suggested that sectors such as industry and transport earn greater
returns relative to irrigation and agriculture and therefore should be given preference in the
allocation of scarce investment funds within the economy.
A 1988 study for the World Bank found that, in spite of substantial subsidies given for
irrigation, fertilizer and credit, the overall effects of economy-wide policies discriminated
against the rice sector, although to a lesser extent, relative to tree crops (Krueger et al.
1988). In this context, greater attention in allocation of Public Investment Funds to the
agricultural sector relative to other sectors may have been justified. But, given that
investments in irrigation were concentrated in particular areas, e.g. the Accelerated
Mahaweli Development Programme (ADMP), the effect of the implicit tax on rice will
have varied substantially within the rice sector. Thus, rice growers outside the AMDP are
likely to have been at a greater disadvantage than those within the AMDP. This may have
important socio-economic and even political implications.
The above issues relate to inter-sectoral allocations within the agricultural sector. Another
important issue, which needs attention, is related to the allocation of public investment
1 Sri Lanka has two monsoons, a rainfall distribution and drainage pattern that permit large proportions of rainfall to be harnessed for irrigation purposes.

2
within the irrigation sub-sector. In brief, the major issue relates to the overwhelming share
of the PIP given to the Accelerated Mahaweli Development Programme (AMDP) in the
post-1980 period. For example, by the end of 1988, a total of Rs. 46,546 million has been
spent on the AMDP. Nearly 60 per cent of this was spent on major head works.2
What worried most critics was the impact of the acceleration. Fears were expressed in some
quarters that spending such a large amount of the country’s resources on the AMDP would
pose a threat to the country’s macroeconomic stability. Nevertheless, the AMDP went
ahead because of the perceived necessity to secure the expected benefits of the programme,
which were to reduce unemployment by creating short and long term employment
opportunities; to increase agricultural production, particularly rice to achieve food self-
sufficiency, and to alleviate power shortages. The World Bank (1987) agreed to the AMDP
for the above reasons despite the lack of knowledge and studies. There were also political
considerations. The decision to accelerate the Mahaweli Programme involved a trade-off.
Political and economic benefits were to compensate for the economic and political costs of
the economic and reform measures of the 1978 government, e.g., devaluation and reducing
subsidies. Also, many donors were prepared to fund large capital projects.
Whether the potential economic benefits of such a programme justify the enormous capital
costs needs to be established. The AMDP is already near its end, and the major issue is not
whether it was justified, rather it is whether similar programmes should continue to form
the basis of national irrigation policy.
This study was originally completed in 1990. It has since been revisited and updated to
Year 2000, so this particular question can be tested against the Public Investment
Programme through the 1990s.
In the chapters that follow, a brief historical background on irrigation in Sri Lanka is given in Chapter 2. Chapter 3 tracks investment in irrigation from 1950 to Year 2000, with
2 This was not a new phenomenon. The Short Term Implementation Program of the Department of National Planning (1962 p.119) drew attention to the fact that irrigation and land development continued to absorb a greater part of investment in the agricultural sector and stated that:
“despite this considerable investment, the output of this sector has not been such as to make any significant impact on our food problem. It is time, therefore, to critically examine returns in relation to investment made and to adopt a more realistic approach to development. This is all the more necessary at a time of scarce capital and foreign exchange resources. Continued investment in a traditional field quite unrelated to output can only be undertaken at the cost of funds to other more productive activities.”
3
particular emphasis on the period from 1979 to 2000 in the PIP. In consideration of investment in irrigation, a key factor to be considered is the comparison of costs and returns of the alternatives. Chapter 4 reviews costs and returns of past irrigation schemes for which adequate data could be obtained, ranging from the largest river basin development schemes such as the Accelerated Mahaweli Development Programme (AMDP) to the smallest minor irrigation projects. Chapter 5 examines options for investment in irrigation, including new projects within and outside the AMDP, rehabilitation and modernisation of existing projects, minor projects and ground water-based irrigation systems. It considers the need for adoption of new design concepts and new technologies in major irrigation schemes, and makes recommendations amongst these options. Chapter 6 comprises two parts. The first reviews O&M requirements and the past record of fee collection in Sri Lanka under traditional systems of rice based irrigated agriculture. The second is concerned with O&M under modernised irrigation systems and more diversified irrigated agriculture. The history of irrigated agriculture in Sri Lanka has essentially been one of rice based development with particular priority to self-sufficiency in rice. Chapter 7 examines the benefits and costs of rice based development and self-sufficiency with special reference to productivity levels in 1980 and prospective levels with planned expansion in irrigated area during the 1990s. It reviews past strategies for irrigation, land settlement and rice production in terms of direct and indirect intervention by government. It analyses the issue of self-sufficiency in cereals on both the supply and demand sides. It examines the social benefit/costs to rice growers in real financial terms. Finally, it examines private benefits/costs to rice growers in real financial terms. Chapter 8 examines the prospects for diversification and the development of commercial agriculture. These are considered in an environment in which paddy cultivation is not adequately remunerative on the typical smallholder area, and where traditional irrigation technology for rice may not suit prospective crops with diversification. Chapter 9 updates the original study from 1990 to 2000. It examines agricultural performance and its major determinants in the 1990s and reviews significant development policy shifts in the 1980s and 1990s, concentrating particularly on those that have influenced outcomes in the agricultural and irrigation sectors. It ends with a brief consideration of prospects.
4
2. Historical Background
2.1 Early Development
The origin of the irrigation civilisation of Sri Lanka in time cannot be identified with any
precision (Brohier 1934). One school of thought argues it commenced in the 5th Century
BC or even before. Harder evidence places it BC, but more recent, and that it continued up
to the 13th century, developing from independent small tanks to more elaborate irrigation
networks and culminated in transbasin diversions to augment major tanks. Examples are
the Kalawewa-Yoda-Ela system, the Angamedilla-Parakrama Samudra System and the
Elahera-Minneriya-Kantalai System. Very often, these transbasin diversion-based major
tanks in turn fed a series of small and medium tanks. The final delivery of water for
agriculture took place from these small and medium sized tanks. The command areas of
these irrigation systems were limited to the poorly drained soils, which are suitable only for
lowland rice cultivation.
This gradual transition of the "hydraulic civilisation" from the original small and medium
sized tanks into major transbasin diversions from small tanks was undertaken to increase
the reliability of irrigation water by tapping the rivers originating in the Wet Zone rather
than by simply depending on the erratic rainfall pattern of the Dry Zone. This can be
viewed as the ultimate point in the technological advancement of the ancient "hydraulic
civilisation". The absence of irrigated upland agriculture practiced on a sustained basis
over this period is a noteworthy feature.
While it is not the purpose of this study to dwell on the achievements of the ancient hydraulic
civilisation, there are some questions and comments which are relevant to present and future
irrigation investments. First, the engineering question remains as to how it was built.
Second, by all accounts, it was sustainable, which contrasts sharply with the requirements for
rehabilitation of present systems after only a short span of time from construction. Was the
old operations and maintenance (O&M) system more efficient? Third, given all its merits, it
was a low cropping intensity system. What is now needed in Sri Lanka is a sustainable high-
cropping intensity system.
5
2.2 Recent Irrigation Strategies
The recent development of irrigation in Sri Lanka began in the mid-eighteenth century and
continued until about the time of Independence with the restoration of certain major irrigation
works.
Under Colonial Rule, investment in irrigation development started in a small way primarily
due to personal interests of Governors in the restoration of large reservoirs that lay
abandoned in the Dry Zone jungles. With the abolition of Rajakariya by the British in the
latter part of the 19th century, a number of village reservoirs were restored with government
assistance. Restoration of major irrigation works started in the 1920s and became an integral
part of government's activity in the 1930s. This trend continued till Independence in 1948
during which time Minneriya, Parakrama Samudra and Elahera reservoirs were restored. In
1970, the government embarked on its most ambitious programme, the Mahaweli Ganga
Development Programme (Map 2.1), to harness the waters of the Mahaweli Ganga (river) for
irrigation and power. Since the early phase of development did not match the needs of
employment generation, food production and electric power, the government decided to
accelerate its implementation in 1977.
The early restorations were mostly limited to the reservoirs, while the distribution systems
were left more or less unchanged. Such restoration of major schemes in the 1900s was
coupled with the creation of new settlements and was done on the basis of two main canals
(left and right bank) and a system of distributory canals, which irrigated the entire area below
their command. Thus, both well-drained and poorly drained lands were irrigated.
The momentum was stepped up after Independence through a six year programme (1947/48-
1952/53) to complete settlement activities under the restored reservoirs (Arumugam, 1969).
The Gal Oya Scheme, the first river basin development, was started during 1948. Work on
the Uda Walawe Scheme was started during the latter part of the 1960s and continued
through the 1970s. The next phase of irrigation development commenced with large multi-
purpose projects such as Gal Oya, Uda Walawe and finally the Accelerated Mahaweli
Development Project.

6
Map 2.1: The Mahaweli Development Project and Special Areas
a

7
While this investment in new irrigation facilities has been taking place, culminating in the
Accelerated Mahaweli Development Project from the late 1970s, the operation and
maintenance of existing schemes has become a problem. A breakdown of the ancient and
traditional institutions for the operation and maintenance of the restored and newly developed
irrigation systems, together with the inability of the state to allocate sufficient public funds
for their operation and maintenance, has resulted in a rapid deterioration of these schemes. In
recent years, the rehabilitation and the modernisation of these deteriorated schemes has
become an important component of the national irrigation strategy. Several other approaches
have been tried on an experimental basis, including an attempt to irrigate upland areas with
lift irrigation. Another was the use of ground water resources by means of tube wells and lift
irrigation in some areas of the country.
2.3 Irrigation Water Distribution Strategies
In the traditional systems, only poorly drained soils (Low Humic Clays) were incorporated
within the distributive systems, and individual irrigation and drainage outlets to farmers were
not provided. These systems could only be operated as community ventures and not as
independent operations of individual farmers. Water distribution and drainage took place
from farm to farm down the slope. If the community decided on the dates and patterns of
irrigation, individuals in the community had no option but to adhere to the common plan.
The next stage of development in design was the provision of individual irrigation and
drainage outlets. This system was based on a continuous supply of irrigation water and
therefore did not require community participation for the operation. However, the tailenders
of canals were always at a disadvantage since the headenders could obtain a more or less
unlimited supply of water. Given that the paddy plant does not suffer from over-irrigation
and that the maintenance of standing water in the fields reduces weed problems, the
headenders were not concerned about the extent of their water consumption.
The most recent design in distributory irrigation systems was adopted in the 1970s under the
Mahaweli Project. Here a tertiary distribution system based on field channels of uniform
capacity serving a more or less similar number of farmers was utilised to practice a rotational
system of irrigation. This system was expected to alleviate the tailender problem of the
earlier model, but depended on total cooperation of the farmers in each field channel area for
efficiency and equity in the distribution of water. This, however, has not eliminated the
problems of the tailenders. Another innovation tried out on an experimental basis was a
piped distribution system. This was designed to enable individual farmers to obtain water as

8
and when required. The two most recent irrigation methods tried out in Sri Lanka are first, a
hydraulic canal water control system to provide constant water levels as required, and
second, an on-farm and on-demand system of drip or trickle irrigation to increase the
efficiency of water use further.
2.4 Definitions and Issues for the Irrigation Sub-sector
Before discussing the key issues which have emerged in the debate about future investment
in irrigation in Sri Lanka, it is important to have a clear understanding of what irrigation
actually is. Despite the obvious importance of definition, it is seldom seriously discussed.
Wyatt (1966) observed that irrigation is a term that is subject to inaccurate and loose usage.
Indeed, there are a number of possible definitions. Most broadly, it has been described as
"the action of supplying or fact of being supplied with moisture" or more specifically," the
action of supplying land with water by means of channels or streams" (Shorter Oxford
English Dictionary 1959, p. 1047).
These definitions are non-technical and make no reference to the control of water so
supplied. Wyatt on the other hand incorporates control in a scientific definition of irrigation:
"the controlled application of pre-determined quantities of water to the soil, in such a
manner that the optimum quantity required by the plant, at the time of irrigation, is made
available to it, with the minimum of losses".
He emphasises the need for (a) absolute control of water at all stages of distribution, and
(b) a method of distribution and application that will ensure the minimum of waste.
Significantly, he adds "The haphazard application of unmeasured water to a crop is not
irrigation in the accepted scientific sense".
Too little attention has been paid to the question of control in the past and this scientific
definition is highly relevant to this study in Sri Lanka and to the issues addressed in it. It is
well known, that the island can be classified into the Wet (rainfall 2500 to 5000 mm) and Dry
(rainfall less than 2000 mm) seasons. It benefits from two monsoons and has two crop
seasons (Maha and Yala). The Dry Zone, which extends around the hills from the North
West to the South East, requires irrigation for its agriculture and most of Sri Lanka's
irrigation works are found in this Zone (see Map 2.1).

9
Impounded water sources are from sub-surface and surface storage, and irrigation is either
by lift or gravity flow. Most of the lift irrigation works are in the hands of private
operators. Gravity irrigation schemes are in the state sector. The latter predominate and
are synonymous with irrigated settlement schemes. Gravity irrigation schemes can be
classified according to (a) the size of the command areas, (b) quantum of investment, and
(c) the type of management institution. Classifications have changed from time to time.
The Irrigation Ordinance of 1946 classified any scheme built without government aid and
maintained by the proprietors as a Minor or Village work. Thus, other schemes were
classified as Major, the operation and maintenance of which have been the responsibility of
the Irrigation Department. The Agrarian Services Act No.58 of 1979 now defines any
irrigation work with a command area of less than 200 acres as Minor and is managed by
farmers under the supervision of local governments. The remaining category is Major,
within which schemes are constructed and managed by the Irrigation Department. But
recently, this category has been further sub-divided (Abeywickrema 1985) on the basis of
institutions responsible for management. These are:
1. Medium - with command areas roughly within the range of 200 to 1000 acres, which are
managed by the Irrigation Department;
2. Major - with a command area of more than 1000 acres, also managed by the Irrigation
Department; and
3. River Basin Development - with a command area of more than 1,000 acres. These are
constructed and managed by special institutions.
This classification helps to differentiate the Mahaweli and Uda Walawe Scheme from other
Major schemes, as set out in Table 2.1.
Since 1970, investments in irrigation works other than Mahaweli have been referred to as
"other irrigation", as construction of Mahaweli works commenced in this year. Therefore,
it is proposed to study investment in irrigation as Pre-Mahaweli and Post-Mahaweli in this
study. The Post-Mahaweli period can be further divided into the non-Accelerated and
Accelerated phases. The Accelerated phase of Mahaweli investments the Accelerated
Mahaweli Development Programme or AMDP started in 1977 (Map 2.2). During this
phase large investments were also made in the power sector through the construction of

10
multipurpose dams. In this study, investment is apportioned between these two main uses
viz. irrigation and power.
In the Mahaweli Scheme, a large and contiguous command area falling within a major
hydraulic basin is referred to as an Irrigation System or simply as a System. Head works
include multipurpose dams for energy and irrigation and diversion weirs to feed the adjoining
basins.
The gravity irrigation schemes, except for a few new ones, were designed mainly for rice
cultivation to provide supplemental irrigation in the Maha season and a limited Yala
cultivation using the remaining storage in the reservoir. Therefore, by modern standards
they are not efficient in the control of irrigation.
Table 2.1: Classification of Irrigation Works by Type, Size and Features
Type Size Features Minor Village irrigation works
Up to 200 Acres
Irrigated from a single canal and served from field with no FCC.
Managed by local governments, maintained by farmers.
Predominantly praveni or private land.
Designed for one season (Maha) cultivation.
Crop invariably rice for subsistence.
Medium 200-500/1000 – Acres
A complete distribution system with FCC.
Managed and maintained by the Irrigation Department.
A mix of private and LDD land.
Designed for a Maha and part Yala cultivation crop, mainly for rice.
500/100Acres – to about 25,000 Acres
A complete distribution system with branch distributary and field channels.
Predominantly LDD plus a limited extent of private land.
Fairly uniform holdings designed for Maha and substantial Yala crops.
Rice plus other crops.
Non-farm activities important. Major River basin
schemes Similar to above but most management decisions and allocations are decided from a central point.

11
Map 2.2: Accelerated Mahaweli Area

12
3. Irrigation in Public Sector Investment Programmes, 1950 to 2000
3.1 Overview
Investment in the irrigation sub-sector increased from about Rs. 3 million annually in the
1940s to an average of about Rs. 50 million per annum in the 1950s and 1960s
(Abeywickrema, 1984). Since 1970, investments increased unprecedentedly due to the
Mahaweli Programme as shown under River Basin Development in Table 3.1. From 1980 to
1987, this category absorbed an average of 87 per cent of total irrigation investment. The
most important category of irrigation investment in the 1960s, Major irrigation, continued to
expand during the 1970s but its relative significance was reduced during the 1980s owing to
the massive increase in investment in the Accelerated Mahaweli Development Programme
(AMDP) (Map 3.1).
Investment in Minor (Village) works has remained more or less static and has continued to
be the smallest category. It was only 3 per cent of total investment during the whole 1950-
1987 period.
Investment in irrigation declined rapidly in the 1990s with the completion of the Mahaweli
programme and most of the Major irrigation works. Expenditures have focused on O&M,
rehabilitation and water management.
3.2 Irrigation in Public Investment Programmes
Sectoral allocation of resources in the Public Investment Programme (PIP) has varied over
time in accordance with measures taken by government to deal with prevailing economic and
political conditions and also with total resource availability. The PIP, a rolling plan, is
flexible and reflects changes in government policies and priorities from year to year. The
PIP is divided according to economic sectors viz., Agriculture, Industries, Social Overheads,
Economic Overheads and Human Settlements. It lists projects by sectors under three
categories: on going, annuals and new projects. Those that do not fit into any sector are
grouped under a heading "Miscellaneous". Resource requirements are indicated by the
implementing agencies for a period of five years from the current year. The aggregate of
requirements of all agencies gives total resource requirements.

13
Map 3.1: Accelerated Mahaweli Development Programme

14
Total resource availability is estimated from resource flows that are dependent on
international trade effects on primary commodities, the vagaries of weather on agriculture
and upon international assistance. Thus, these have a direct control over the size of the PIP.
Domestic savings are inadequate to finance the investment programme and recurrent
expenditure of the government, so foreign assistance is always needed.
Irrigation investment as a proportion of total PIP has fluctuated widely since Independence
(Table 3.2). In the Pre-Mahaweli period it was as high as 31 per cent in the 1950s, falling to
9 per cent in the 1960s. In the Mahaweli period it rose again to 15-17 per cent in the 1970s,
peaked at 40 per cent at the height of the Accelerated Mahaweli Development Programme
(AMDP) construction period in the early 1980s. It dropped to 13 per cent by 1990, and
thence to 2-3 per cent from the mid-1990s.
An examination of projections of investment from 1979 to 2000 shows a clear shift of
emphasis between sectors (Table 3.3). The Agricultural sector, which includes the AMDP,
dominated the PIP during the 1980s. This was reversed in the 1990s during which it
progressively gave way to the Economic Overheads sector.
The government elected in 1977 faced problems of high unemployment, acute food
shortages, a shortfall in electric power and a dearth of housing. In order to alleviate the
situation it decided to implement three lead projects: (a) the Accelerated Mahaweli
Development Programme, (b) Investment Promotion Zones, and (c) an Urban Renewal and
Housing Development Programme.
Public investment averaged 7.7 per cent of GDP during 1970-77, but rose to 16.6 per cent
during 1978-84. The average annual growth rate of the PIP also increased, from 2.9 per cent
during the former period to 6.0 per cent during the latter period. However, it was
accompanied with high inflation. These large investments were made possible through the
support of international donors. The adoption of liberal economic policies was the chief
attraction for large amounts of foreign aid.
The AMDP received more foreign aid than the other two lead projects, so allocations in the
first half of the decade were heavy in the agriculture sector, facilitated by this international
support (Table 3.3).

15
Allocations declined as the head works programme in the ADMP approached completion in
1985 and because of the low absorptive capacity of downstream works that dominated the
AMDP from 1985 onwards through the 1990s. Other reasons include high inflation rates and
the balance of payments, which deteriorated after the commodity boom in the early 1980s. It
was found necessary to effect more reforms which included privatisation, greater financial
discipline and manageable budget deficits to bring stability to the economy and to contain
inflation.
Table 3.1 Investment in Irrigation 1950-1987 (Rs million) Period Years River
Basin Devpt
Major Irrigation
Village Irrigation
Total Total PIP
Pre- Mahaweli
1950-54 1955-59 1960-64 1965-69
85 35 15 20
172 134 154 245
16 11 6
23
273 180 175 289
888
1226 2012 3191
Mahaweli
1970-74 1975-79 1980-84 1985-87
538
2687 27050 16758
150 642
2639 2749
72 77
499 562
760
3406 30188 20069
5104
20240 76094 80236
Source: Abeywickrema, N. 1984, Annual Reports of the Central Bank and General Treasury.
Table 3.2: Investments in Irrigation as Percentages of PIP * Period Years River
Basin Devpt Major
Irrigation Village
Irrigation Total
Irrigation per cent % % % Pre-Mahaweli
1950-54 1955-59 1960-64 1965-69
10 3 1 1
19 11 8 8
2 1 0 1
31 15 9 9
Mahaweli 1970-74 1975-79 1980-84 1985-87
11 13 36 21
3 3 3 3
1 0 1 1
15 17 40 25
* Columns in Table 3.2 correspond with the respective columns in Table 3.1. Source: Public Investment Programmes, Ministry of Finance and Planning, Colombo.

16
The government redefined its priorities in February 1984 and decided to:
(i) provide adequately for O&M allocations as a first priority.
(ii) exclude activities that could easily and efficiently be undertaken by the
private sector.
(iii) embark on:
- quick-yielding, production oriented projects which would reduce the balance of payments problem.
- essential infrastructure needs in power, irrigation, transport and communications.
- urgent needs in health, education housing and nutritional standards of the people.
The completion of the Agriculture Food and Nutrition Strategy Study later in the same year
identified areas of the agriculture sector that were starved of investment, such as the
plantation sub-sector, for which the Medium Term Investment Programme was implemented.
However, the declining trend was not reversed. From the latter part of 1987, civil strife
began to spread all over the country. As a result, revenue collection fell from an average of
21 per cent of GDP to 18.8 per cent in 1988. Export earnings declined further and private
transfers from migrant Sri Lankan workers leveled off. To add to these difficulties, in 1989
the new government launched its lead programme on poverty alleviation, employment
generation, nutrition and other social welfare measures to fulfil its election promises.
The PIP for 1989-93 (Table 3.3) was formulated to take these constraints and changes into
account. In its 1989 Policy Framework Paper, the government agreed with the IMF and
World Bank to bring stability and to contain inflation. The main reforms to be effected
during 1989-93 included:
a) reduction of the PIP from 11 per cent to 9 per cent of GDP.
b) reduction of the overall deficit from 12.5 per cent to 8 per cent of GDP.
c) reduction of domestic borrowing from 6.4 per cent to 3.8 per cent of GDP. However, to accommodate the government's new lead programme, subsidies and current transfers would increase during 1990-1991 but should level off thereafter.
The Transport Sector Master Plan and the ongoing Power sector study were other areas that
would compete for additional investments. Thus, a further shift of emphasis away from
agriculture was envisaged.

17
Although areas starved of investment were identified in the National Agriculture Food and
Nutrition Strategy Study, the absorptive capacity of the agencies within the agriculture
sector did not improve to the point where they became real competitors for irrigation.
Total Public Investment at the end of the 1980s was around Rs.30 billion. It was not
expected to grow at more than 2 per cent per year in the 1990s, with the adoption of the
new Policy Framework by the Government in consultation with donors. However, this
control was not exercised in practice. Total public investment rose from around Rs.38
billion in 1991 to Rs.61 billion in 1996, with expectations of Rs. 114 billion in 2001.
Table 3.3: Sectoral Allocations in Public Investment Programmes from 1979-83 to 1996-2000 (percentages)
Period 79-83 83-87 87-91 92-96 96-2000 Capital Budget 100
(n.a.) 100 (33)
100 (37)
100 (40)
100 (40)
Agriculture Of which
43 (n.a.)
45 (45)
22 (53)
17 (47)
10 (41)
Mahaweli Irrigation
23 (n.a.)
27 (53)
12 (52)
8 (31)
3 (29)
Non-Mahaweli Irrigation.
2 (n.a.)
4 (43)
3 (60)
2 (56)
2 (52)
Industries 10 (n.a.)
2 (8)
- (6)
2 (7)
3 (66)
Human Settlements 10 (n.a.)
11 (17)
9 (50)
18 (42)
14 (49)
Economic Overheads
30 (n.a.)
26 (37)
41 (43)
51 (55)
40 (64)
Social Overheads 7 (n.a.)
9 (15)
9 (22)
13 (23)
13 (17)
Miscellaneous - (n.a.)
7 (0)
7 (7)
6 (-)
21 (4)
Note: Numbers in brackets are percentages of foreign assistance. Source: Public Investment Programmes, Ministry of Finance and Planning, Colombo.
3.3 Breakdown of Expenditures on Pre Mahaweli and Mahaweli Schemes
3.3.1 Pre-Mahaweli schemes
Gal Oya scheme
The Gal Oya Scheme was the first multipurpose scheme, providing for both irrigation and
power, that was constructed on the island. It was also the first project in which foreign
contractors were engaged. The construction and operation were the responsibilities of a
special institution called the Gal Oya Development Board (GODB), which was also entrusted
18
with settlement activities. Preliminary work started with Independence in 1948 and it was
completed in 1952. The Gal Oya reservoir, known as Senanayake Samudra with a designed
command area of 120,000 acres is fed by a network of reservoirs and distributary canals
which are in turn fed by two main canals.
The Left Bank canal was designed to irrigate an area of 80,000 acres while the Right Bank
canal was to serve the balance of 40,000 acres. But the area finally realised under irrigation
was only 65,000 acres. Under the management of the GODB and the River Valleys
Development Board (RVDB), the project was referred to as a River Basin Development
Scheme, but after it was handed over to the Irrigation Department, it was treated as a Major
Scheme. The reservoir was completed at a cost of Rs. 75 million in 1949.
Uda Walawe
The second river basin development scheme, Uda Walawe, was initiated in 1963 to provide
irrigation for about 71,000 acres and hydro-power capacity of 5 MW. About 10,000 acres of
the total area constituted existing irrigated rice lands. About 25,000 acres of the land was
situated under the Right Bank Canal and the balance of 46,000 acres was under the Left Bank
canal. The cost to completion was estimated at Rs. 135 million. Dam and electrical power
plants were completed during 1967 at a cost of Rs. 71.6 million. Owing to balance of
payments problems, the government sought assistance from the Asian Development Bank
(ADB) to complete irrigation and settlement activities. A programme to develop about
33,200 acres on the Right Bank (RB) at a cost of Rs.157 million was accepted by the ADB
for funding. The project completion report by the ADB in 1979 found that about 10 per cent
of the physical works were still incomplete and water distribution was inefficient and
inequitable. It also criticized design flaws, poor construction and the neglect of O&M. ADB
funded the Left Bank Sevenagala Sugar Development project in 1982. It also funded the
project to rehabilitate the Right Bank in 1985.
Under the management of the GODB and the River Valleys Development Board (RVDB)
the project was referred to as a River Basin Development Scheme, but after it was handed
over to the Irrigation Department, it too was treated as a Major Scheme. The reservoir was
completed at a cost of Rs.75 million in 1949.

19
Mahaweli Programme
Past expenditure allocations to the Mahaweli Programme in the PIP are examined here under
three headings:
a) original capital expenditure requirements
b) annual allocations
c) actual expenditures
a) Original Capital Expenditure Requirements
The estimated cost of the original UNDP/FAO Master Plan, which proposed to construct
fifteen reservoirs and to irrigate 900,000 acres over a period of 30 years, was Rs. 5.583
billion with a foreign exchange component of 38 per cent. This included provision for
irrigation, drainage, flood protection, land development and settlement, and power
generation. Additional activities resulting directly from the scheme such as power
transmission, marketing and processing, agricultural products, and revenue earning
government activities were estimated to add a further Rs. 1.2 billion giving a grand total of
some Rs. 6.7 billion.
These estimates were revised in 1977 to take account of price and exchange rate changes. A
cost revision undertaken prior to the devaluation on 16 November 1978 estimated the total
cost of the programme to be Rs. 15 billion. In 1978, however, when the Accelerated
Mahaweli Development Programme (AMDP) was drawn up, a somewhat more modest
estimate of Rs. 11 billion (at 1978 prices) was prepared covering four major reservoirs, three
power generators and downstream development of Systems A, B, C and D. Later, when
work on most of the major head works had been completed, two more projects that were in
the original Master Plan, namely Moragahakanda and Uma Oya reservoirs, were added to the
AMDP. Thus, from time to time project components were either added to or subtracted from
the Mahaweli Programme which, quite apart from the cost escalation due to price and
exchange rate changes, caused changes in cost estimates and capital expenditure
requirements.
b) Allocations to the Mahaweli
The Mahaweli Development Programme was financed by loans and grants received from a
number of countries and international agencies and by the Sri Lankan government as the
local counterpart. The money received for the programme was usually allocated through

20
the Public Investment Programme (PIP) which reviewed the performance of ongoing
programmes and activities and the rate of utilisation of funds in each project before further
funds were released to the Mahaweli Authority. Additionally, the PIP acted as the guide for
prospective foreign participants who wished to consider providing assistance to one or
more projects within or outside the Programme. The PIP depicted the government's current
priority areas for investments in the short to medium term. Thus, the question as to how
much expenditure was allocated to the Mahaweli each year depended on the government's
priorities at that time and to some extent on other constraints imposed by international
financial institutions.
The government has consistently emphasised the importance of agriculture and irrigation in
its Public Investment Programme to varying degrees, but the role of the Mahaweli as an
irrigation and hydropower project was dominant from 1970 until the 1990s. In particular,
large sums of capital were allocated to the AMDP through the PIP in successive years.
During the construction period of the major head work projects, for example, the PIP
allocated as much as 40 per cent of its total capital expenditure to the Mahaweli Programme
(Table 3.4). These allocations slowed down in the latter part of the 1980s with the
completion of major head works projects3, but were then sustained by expenditures on the
Upper Mahaweli Catchment Area (UMCA) and on downstream investment in irrigation
system development. They declined further as ongoing downstream investment was
completed4. The latter investment was finished by 2000. Without new investment,
expenditures will comprise only annual outlays on O&M and rehabilitation5, and allocations
to the Mahaweli remain at around 2-3 per cent of the PIP (Table 3.4).
In 1980 it was thought that, whilst providing for the completion of major irrigation projects
started in 1978-79, emphasis should also be given to medium sized and minor irrigation
projects. This would redress a possible imbalance that might be caused by the heavy
investments in the AMDP and other large irrigation projects. Emphasis was also placed on
water management with the main objective of increasing cropping intensity and crop
3 Victoria reservoir was completed in April 1985, Kotmale in August 1985 and Randenigala in 1988. 4 In 1997, the total command area under irrigation was 128,250 hectares, of which 112,578 hectares were
under paddy and 15,700 hectares were under other field crops. 5 Rehabilitation commenced in 1993, 15 years after the start of the programme in 1978.

21
production. Finally, a need was seen to strike a reasonable balance between long gestation
projects and quick yielding, high return and export oriented projects in commodity
producing sectors when making capital expenditure allocations.
Table 3.4 Mahaweli Allocations in the Public Investment Programme 1980-2000 (Rs. billion)
Year
Allocation in PIP
% PIP
1980 2.0 17 1981 3.8 31 1982 7.2 40 1983 6.8 38 1984 6.0 35 1985 5.5 24 1986 3.5 14 1987 3.7 13 1988 5.1 17 1989 4.3 13 1990 4.3 13 1991 3.2 7 1992 2.7 6 1993 2.7 6 1994 7.5 14 1995 2.8 5 1996 2.1 3 1997 1.8 3 1998 1.3 2 1999 1.9 3 2000 2.0 3
Sources: Public Investment Programmes 1980-84 to 1996-2000. Ministry of Finance and Planning, Colombo.
An adverse budgetary situation in 1980 required the government to review the PIP in
November 1980 and March 1981 owing to the heavy expenditures made by a number of
government institutions, including the Mahaweli Development Board. The government
then decided to impose ceilings to contain expenditures within limits consistent with the
volume of financial and real resources estimated to be available for investment. As a
result, it became possible to increase expenditure on the AMDP and minor irrigation.
However, no new projects were contemplated for implementation in the short run. New
projects could be admitted to the PIP only if they met strict economic criteria. Expensive
capital and import intensive projects and those with heavy building commitments and

22
energy content were to be de-emphasized. Also, owing to financial constraints, it became
necessary to re-phase part of the downstream development and to recover O&M costs from
settlers in the newly irrigated areas.
In the PIP for 1986-90, emphasis continued to shift in favour of irrigation projects other
than the Mahaweli, i.e., major irrigation schemes, maintenance and rehabilitation and water
management of existing schemes. In 1987, the PIP concentrated on the encouragement of
private investment in developed areas to raise incomes of settlers, create employment, and
promote agro-processing industries. Infrastructure and rehabilitation continued to receive
attention.
The PIP for 1988-1992 assigned a still lower importance to the Mahaweli as work on major
ongoing projects neared completion. Also, from early 1989 there was some change in
investment emphasis after the introduction of new welfare policies that altered the pattern
of investment. Capital expenditure for the Ministry of Lands, Irrigation and Mahaweli
Development decreased by 28 per cent from 1988 from 1989. The voted expenditure for
the Mahaweli Authority of Sri Lanka (MASL) decreased by 41 per cent; and the share of
MASL in the total voted expenditure for the Ministry decreased from 75 per cent to 62 per
cent.
By 1991, forward irrigation policy showed two features: an orientation towards
rehabilitation, management and improved O&M, and the adoption of participatory
management of irrigation systems through farmers’ organisations, reducing the role of
government. By then, the Mahaweli had spent Rs. 52 billion, major construction work had
been completed (five reservoirs and main canals and hydro power systems), satisfactory
progress was being made with settlements (Systems G, H and L) and more attention was
being given to the protection of the Mahaweli catchment area.
In the 1990s, the Mahaweli entered a mature phase with 14 per cent of country’s total
cultivated area and 20 per cent of total paddy. It was, however, still in an early stage of
crop diversification and commercialised agriculture. Most of the command area was under
paddy and only about 10,000-15,000 hectares were under other food crops, mainly chillie,
maize and onions.

23
Policy initiatives for this new phase introduced in 1990-91 included farmers’ organisations
for O&M; a review of land and water policies, leasing of larger areas for commercial
farming and industrial parks for processing industries. Future projects were under study
such as rehabilitation of canals in Systems H and C.
c) Actual Expenditure on the AMDP
By December 1995, over Rs.66 billion at current prices (Rs.125 billion at 1994 prices and
exchange rates) had been spent, and the targets for new irrigable area and for settlement of
families had almost been met. The MASL was now burdened by heavy overheads which
policy was directed to reduce. MASL was studied as a River Basin Authority to oversee
system needs and environment and to broaden economic opportunities there.
From 1979 to 1990, a total of Rs.57.1 billion was spent on the AMDP (Table 3.5). By Year
2000, total expenditure had reached Rs.76.2 billion. Some 41 per cent of total capital
expenditures had been spent on major head works. The expenditure on the Victoria project
was Rs. 9.8 billion or 31 per cent of expenditures on all head works and 15 per cent of total
capital expenditure. Expenditure on the Kotmale project was Rs. 9.8 billion or 32 per cent
of all head works, and 15 per cent of total expenditure on the AMDP. Randenigala and
Maduru Oya utilised 28 per cent and 13 per cent respectively of total capital expenditure on
head works.
The 1988 estimate of costs to be incurred to 2000 in peripheral works within the UMCA
gave a total of Rs.2.1 billion. Of this, 57 per cent was for land acquisition for settlement, 5
per cent was allocated to buildings and roads, the development of townships accounted for
1 per cent, 3 per cent were for settler services. Another 26 per cent of expected costs were
for the environment (agriculture, forestry, fisheries etc).
Donors played a significant part in assisting projects in the Upper Mahaweli, providing
around 28 per cent of the project finance. The main projects were the:
- GTZ Upper Mahaweli Watershed Management Project funded by the Federal Republic of Germany,
- Victoria Land Use and Conservation Project for mapping of the Victoria catchment area (ODA), and
- Upper Mahaweli Forestry Project for pine plantations, a pilot forestry extension programme, and a research programme in plantation forestry (also ODA).

Table 3.5. Ongoing and New Investments and Annual Expenditures in the Mahaweli, 1979 to 2000 (Rs. Million)
Item 1979 1980 1981 1982 1983 1984 1985 1986 1987 1988 1989 1990 Headworks Victoria 77 945 1,128 1,405 1,825 1,635 668 531 1,050 223 140 90 Kotmale 259 909 1,016 1,353 2,170 1,880 761 383 688 208 83 51 Maduru Oya 68 371 827 937 436 1 1 - - - - - Randenigala 23 36 45 534 935 847 1,542 1,061 628 244 23 18 REV - - - - - - - 91 115 207 - - UMCD - - - - - - - - - - 146 66 EIED 108 143 Downstream Stage I 451 7 9 16 7 24 - - - - Stage II 536 371 344 323 264 457 66 29 71 29 8 2 System B (LB) 11 100 86 317 592 1,079 1,451 1,175 539 561 630 695 System B (RB) 195 175 22 20 - 3 361 494 System C 50 90 315 296 500 668 719 819 1,027 1,055 1,004 633 Minipe TBC 36 160 205 251 299 216 22 5 12 - - - System I 54 - System G 1 7 18 67 104 99 82 56 - - System L 81 45 57 Uda Walawe 13 29 40 82 60 118 113 157 282 226 Access Roads 1 21 40 83 90 63 117 108 38 New Investment - - Annual DA & Dairy Dev. O&M 205 305 313 372 328 348 Rehabilitation Other 25 28 2 - 8 - - - - - - - Total 1,536 3,017 3,991 5,469 7,272 7,179 5,704 4,726 4,701 3,313 3,320 2,861 Per cent foreign Assistance
59 49
24

Item 1991 1992 1993 1994 1995 1996 1997 1998 1999 2000 Total % of
CapitalHeadworks Victoria 52 19 15 1 1 2 1 1 1 1 9,811 15 Kotmale 28 10 13 10 1 1 18 - - - 9,842 15 Maduru Oya - - - - - - - - - - 2,641 4 Randenigala 27 70 50 10 50 30 1 1 - - 6,175 9 REV - - - - - - - - - - 413 1 UMCD 186 219 91 150 70 116 20 - - - 1,064 2 EIED 168 176 184 180 155 35 5 - - - 1,154 1 Downstream Stage I - - - - - - - - - - 514 1 Stage II 7 4 7 2 - 24 - - - - 2,554 4 System B (LB) 724 582 520 470 733 481 230 225 220 - 11,421 17 System B (RB) - - - - - - - - - - 1,270 2 System C 1,194 699 579 150 180 207 60 - - - 10,245 15 Minipe TBC - - - - - - - - - - 1,206 2 System G 34 9 - - - - - - - - 531 - System I - - - - - 100 70 50 35 25 280 - System L 75 72 150 200 200 - - - - - 880 1 Uda Walawe 199 274 208 390 469 217 520 550 750 850 5,547 8 Access Roads 77 53 15 19 40 3 2 - - - 669 1 New Investment 5 5 10 10 - 20 62 186 150 240 688 1 Annual DA & Dairy Dev. 91 29 20 28 10 17 1 - - - 196 O&M 310 287 295 390 400 338 325 300 250 250 5,016 Rehabilitation - 269 519 539 421 518 463 460 382 305 3,876 Other - - - - - - - - - - 63 1 Total 3,179 2,712 2,676 2,604 2,764 2,139 1,798 1,875 1,852 1,697 76,214 100 % Foreign assistance
50 43 26 28 34 19 22 33 40 35 15
Sources: Mahaweli Authority of Sri Lanka; Ministry of Finance and Planning; and Central Bank of Sri Lanka.
25

26
The major expenditure items in downstream development work were System B (LB), System C (Rs.
10,234 million) Stage II, and Uda Walawe. The fact that 41 per cent of total expenditure was spent
was on head works and 54 per cent on downstream development signifies the relative and absolute
importance attached to the construction of major infrastructure requirements and efforts to meet the
increasing demand for irrigation water. The focus of expenditures in the 1990s was almost entirely on
downstream development, and in policy, on how it was sustained.
Fears were expressed from time to time that spending such a large amount of the country's resources
on the AMDP would pose a threat to the country's macro-economic stability. What worried most
critics was that the "Acceleration" component of the funding would become the major problem.
Foreign sources came to the rescue by financing about 60 per cent of this cost (i.e., Rs. 30 billion),
while the balance of 40 per cent or Rs. 20 billion had to be financed locally through the budget. At
that time the government had embarked on a number of other large scale projects such as the Million
Houses Programme, building of the New Parliamentary Complex, Integrated Rural Development
Projects (IRDPs), Free Trade Zones (FTZs) and the Road Development Project. Hence the allocation
of such large sums to the AMDP became burdensome on the budget. This was reflected in the
trimming of costs of some components. For example, the height of the Kotmale Dam was reduced,
the construction of infrastructure facilities in System B was slowed down and the implementation of
Moragahakanda and the Uma Oya projects were postponed. These components were thought to be
the least detrimental to the objectives of the AMDP.
3.4 Other Irrigation
A breakdown of allocations to Other Irrigation according to their constituent projects (Table 3. 6)
includes ongoing projects and annual expenditures. Some 80 per cent of the allocations for Other
Irrigation from 1978 to 2000 were capital expenditures, of which 78 per cent were ongoing and 2
per cent were new after 1987. Within capital expenditures, priority was given to projects receiving
no concessional foreign assistance. Maintenance (O&M) and rehabilitation absorbed most of
annual expenditures (15 per cent), but attracted little or no foreign aid. Other annuals received
about 7 per cent.
The number of Major irrigation projects undertaken showed a considerable increase in expenditures
over the pre-1970 period. Among Ongoing works, the largest were the:
- Kirindi Oya Irrigation and Settlement Project (KOISP) Phases I & II to irrigate new and existing land (17 per cent of total expenditures),
- Minipe Nagadeepa Project with tubewells, shallow wells, roads and a bridge (13 per cent),

Table 3.6. Investment in Non-Mahaweli Irrigation Schemes, 1986 -2000 (Rs. millions) Item To 1986 1986 1987 1988 1989 1990 1991 1992 1993 1994 1995 1996 1997 1998 1999 2000 Total Village Tank Rehabilitation
659 151 152 77 73 116 40 - - - - - - - - - 1,268
Kirindi Oya I 1,524 196 118 104 52 14 116 62 3 - - - - - - - 2,189 Kirindi Oya II - 34 40 70 85 112 62 101 119 60 - - - - - - 745 MIRP - - - - 176 162 110 72 33 - - - - - - - 553 ISMP - - - - 150 180 208 113 114 105 83 55 44 - - - 1,052 Minipe Nagadeepa Rehabilitation
- - - - 125 19 12 136 63 190 99 558 361 400 245 - 2,208
Moneragala - - - - 50 119 - - - - - - - - - - 169 Nilwala Ganga Flood Prtctn.
839 254 538 416 50 45 15 6 5 - - - - - - - 2,168
12 NWP schemes - - - - - 14 41 56 22 23 45 83 44 7 - - 335 NIRP - - - - - - - 51 140 157 265 535 512 - - - 1,660 NWP Water Res. Project
- - - - 90 23 50 83 44 162 147 - 599
Kalu Ganga study - 13 - - - - - - - - - - 13 Other Ongoing - - - 27 50 43 28 54 54 58 31 34 379 ANNUALS Rehab. and Maintenance
130 140 81 107 148 170 179 208 215 220 222 225 2,045
Improvements to major works
15 15 10 9 11 12 14 16 18 20 20 20 180
Strengthening of H/Works
15 13 9 9 14 18 18 22 20 16 18 20 192
Investigations 6 7 7 32 33 27 20 31 22 15 15 15 230 Flood Damage Repairs 10 14 9 10 18 11 18 22 22 20 20 20 194 Strengthening of ID and IMD
14 14 9 3 - - - - - - - - 40
Other 11 9 8 8 8 8 65 77 77 66 68 70 475 NEW 1 - - - 26 93 49 57 55 11 292 TOTAL 3,022 635 848 667 962 1,006 738 802 871 859 910 1,837 1,482 1,047 841 415 16,942
Sources: Mahaweli Authority of Sri Lanka; Ministry of Finance and Planning; and Central Bank of Sri Lanka.
27

28
- Nilwala Ganga Flood Protection Project (13 per cent),
- National Irrigation and Rehabilitation Project (NIRP) (10 per cent), and
- Village Irrigation and Rehabilitation Project (VIRP) (7 per cent).
Other smaller projects included the
- Major Irrigation and Rehabilitation Project (MIRP),
- Irrigation System Management Project (ISMP) to develop the institutional capacity of the Ministry of Lands, Irrigation and Mahaweli to operate and maintain major irrigation systems,
- North West Water Resources Development Project, and
- Restoration of 12 schemes in North West Province in Kurunegala and Puttalam districts.
By 1994, it was judged that “practically all economically viable irrigation schemes have
been constructed” (PIP 1992-96, p47). With construction and rehabilitation of most of the
Major schemes completed or nearing completion, budgetary allocations to Other Irrigation
decreased in the agriculture sector. The emphasis has shifted to institutional re-orientation,
rehabilitation of existing systems to optimize efficiency in water utilisation (farmers’
organisations for O&M) and an increasing emphasis on achieving diversified high income
agriculture based on consolidation of systems and improved drainage, salt water exclusion
and ground water development. Broad priorities are given to sustainability, watershed
management and comprehensive river basin development.
3.5 A Review of some Completed Major and Medium Irrigation and
Rehabilitation Schemes
3.5.1 Major Schemes
The Inginimitya project
This reservoir project was completed in 1988 at a cost of Rs. 360 million, funded by the
Japanese government. The reservoir impounds the waters of Mi Oya with a three-mile long
dam to irrigate about 4700 acres of new lands and 1900 acres of existing paddy (Table 3.7).
Around 2000 farm families were settled in the head works lands. The reservoir was
completed in 1985 and the settlement of families in 1988.
The project was approved in 1978 but construction did not start until 1981. The final
estimate of costs of completion is more than double the original estimate. The "extra long"
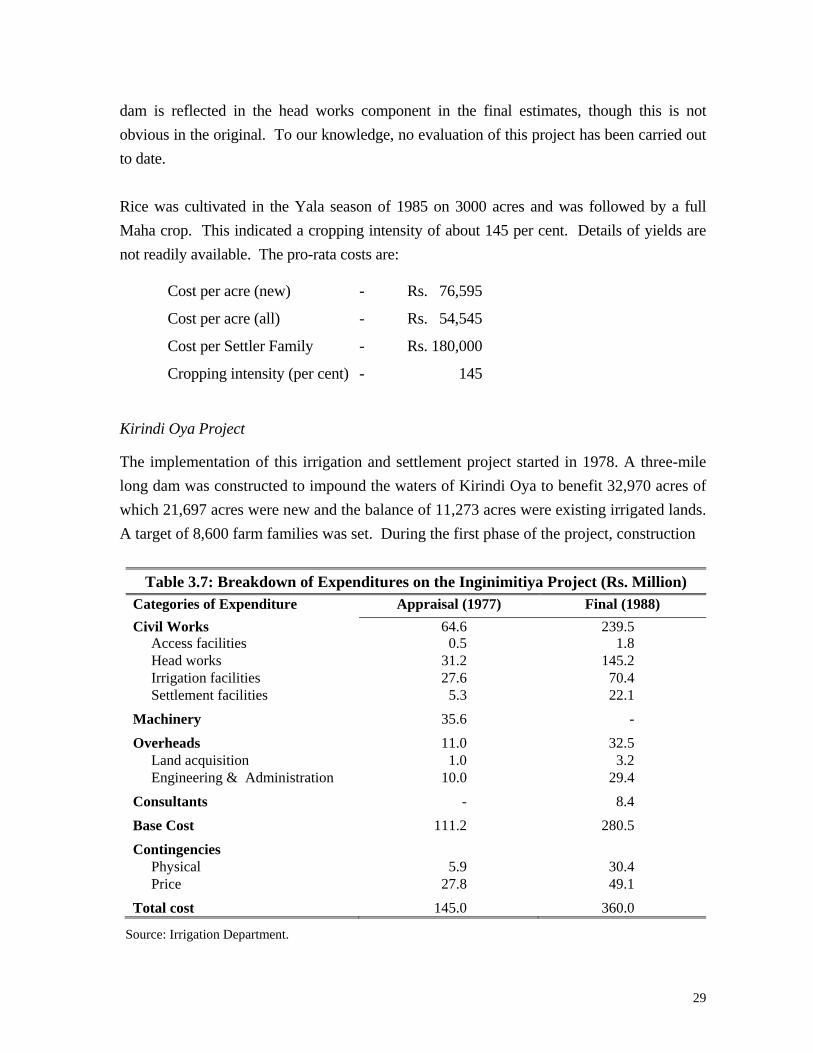
29
dam is reflected in the head works component in the final estimates, though this is not
obvious in the original. To our knowledge, no evaluation of this project has been carried out
to date.
Rice was cultivated in the Yala season of 1985 on 3000 acres and was followed by a full
Maha crop. This indicated a cropping intensity of about 145 per cent. Details of yields are
not readily available. The pro-rata costs are: Cost per acre (new) - Rs. 76,595
Cost per acre (all) - Rs. 54,545
Cost per Settler Family - Rs. 180,000
Cropping intensity (per cent) - 145
Kirindi Oya Project
The implementation of this irrigation and settlement project started in 1978. A three-mile
long dam was constructed to impound the waters of Kirindi Oya to benefit 32,970 acres of
which 21,697 acres were new and the balance of 11,273 acres were existing irrigated lands.
A target of 8,600 farm families was set. During the first phase of the project, construction
Table 3.7: Breakdown of Expenditures on the Inginimitiya Project (Rs. Million) Categories of Expenditure Appraisal (1977) Final (1988)
Civil Works 64.6 239.5 Access facilities 0.5 1.8 Head works 31.2 145.2 Irrigation facilities 27.6 70.4 Settlement facilities 5.3 22.1
Machinery 35.6 -
Overheads 11.0 32.5 Land acquisition 1.0 3.2 Engineering & Administration 10.0 29.4
Consultants - 8.4
Base Cost 111.2 280.5
Contingencies Physical 5.9 30.4 Price 27.8 49.1
Total cost 145.0 360.0
Source: Irrigation Department.

30
of the dam and irrigation facilities to serve 10,797 acres of new and 11,273 acres of
existing irrigated lands were to be completed to settle 4200 farm families. The remaining
new area of 10,970 acres was to be developed during the second phase. The first phase was
estimated to cost Rs.1.6 billion, and the second phase costing was Rs.0.9 billion. Phase I
was completed in 1992 for a total cost of Rs.2.2 billion, a substantial cost overrun. Phase II
was completed in 1993 and cost Rs.0.7 billion, which was below the final estimate.
Table 3.8 Estimated Costs of Kirindi Oya Project (Rs. million) Categories of expenditure Phase I Phase IIDam 614 - Irrigation Facilities 164 245 Roads etc - 50 Settlement 84 258 Agriculture Extension 11 17 Livestock Development - 45 Social Forestry - 3 Consultancy 35 9 Engineering & Admn. 66 47 Evaluation 6 4 Physical Contingencies 78 59 Price Contingencies 539 203 Total 1597 940
Source: Irrigation Department.
The dam work was completed in 1986. Up to the end of 1987, irrigation facilities were
supplied for about 10,715 acres of new land and 8,913 acres of existing lands. A mid-project
evaluation was carried out (Gamage, Wanigaratne, Wijetunge and Tudawe, 1988) but at that
stage, with only two seasons of production after the dam was completed, the report could
offer only limited insights.
3.5.2 Medium Irrigation Schemes
The Mahadiulwewa Project
This scheme involved the restoration of an abandoned reservoir to irrigate 1200 acres of
new lands and 160 acres of existing paddy land. About 480 farm families were settled on
the new land, each receiving 2.5 acres of irrigated land. The total estimated cost in 1978
was Rs. 16 million but it was completed at a cost of Rs. 34 million in 1982. The EEC
funded the project.

31
The reservoir supports two seasons of cultivation. It was found that water availability was
in excess of requirements of the command area so some of the excess water was diverted to
an adjacent basin. This indicates that the cropping intensity may be over 175 per cent. The
cost per settler family in this scheme was Rs. 70, 833 while the cost per acre of irrigation
was Rs. 28, 333 or Rs. 25,000 when existing land was also taken into account.
Among the Major and Medium schemes, Mahadiulwewa was cost effective while in the
cases of Inginimitya and Kirindi Oya, extra long dams had to be constructed which
involved heavy costs (Table 3.9).
Table 3.9: Some Performance Indicators of Major and Medium Schemes
Indicators Unit Mahadiulwewa Inginimitya Kirindi Oya Cost per family Rs 127,287 180,000 42,571 Cost per acre (new) Rs 50,914 76,595 166,712 Cost per acre (all) Rs 44,925 54,545 81,558 Cropping intensity % 175 145 n.a.
Source: Irrigation Department.
3.5.3 Rehabilitation Schemes
Minor (Village) Schemes
The quantum of expenditure involved in the construction or rehabilitation of a Minor
irrigation scheme is very small compared with that of a Major scheme. Statistics of
investment and its benefits are rarely kept in a systematic manner. Also, it is difficult to find
a reliable source of statistics for the purposes of comparing investments and the resulting
benefits of individual minor schemes with those of other schemes. However, through the
selection of the on-going IDA-funded Village Irrigation Rehabilitation Project (VIRP), this
difficulty is partially overcome. This project provided for the collection of such information
necessary to evaluate the project and comparisons are presented in a later chapter.
The VIRP provided for the rehabilitation of about 1200 village reservoirs by the Irrigation
Department, benefiting about 78,000 acres of land, and modernising another 500 reservoirs
(by the Department of Agrarian Services), benefiting about 30,000 acres (Table 3.10).
Completion of the project was originally expected in five years with an estimated cost of
about Rs. 784 million in 1981, but actual expenditure on the completion of this project in
1991 was Rs. 1,168 million.

32
It was expected that the average cost per acre of rehabilitation would be Rs.8, 400, and for
modernisation, it would be Rs.1, 100. However, these costs were exceeded owing to delays
in selection of reservoirs and other implementation difficulties.
Major Schemes
The O&M of Major schemes are the responsibility of the state. Neglect of maintenance in
the past has resulted in the deterioration of the systems. This was partly due to insufficient
allocation of funds for maintenance and partly to the greater attention being paid to new
construction works during the period. The Irrigation Department, which is responsible for
both maintenance and construction works, favoured the latter.
Table 3.10 Breakdown of Expenditures on the Village Irrigation Rehabilitation Project
Categories of expenditure
Cost estimate 1981 Work done up to December 1986 Cost in 1988
Qty* Rate Amount Qty* Rate Amount Rs. Rs. mn. Rs. Rs. mn. Civil Works Survey and Investigation
1440
7500
10.8
1100
9181
10.1
Rehabilitation by ID 1200 545250 654.3 592 694087 410.9 Rehabilitation by DAS 500 66000 33.0 228 93421 21.3
Equipment & Vehicles
Procured by ID 38.7 38.9 Procured by DAS 7.5
Consultancy & Training
Coordination & Admin ID
10.4
5.6
Administration DAS 11.7 6.9 Consultancy 9.0 8.8 Training 5.3 5.6 Contingencies 3.6 0.0
Total 784.3 508.1
Qty* = No of reservoirs. Source: Irrigation Department.

33
3.6 The Tank Irrigation Modernisation Project (TIMP)
In 1976, the TIMP was launched to rehabilitate five major schemes in the North Central Dry
Zone that were operating well below designed capacity. This project provided for the
rehabilitation of the physical system and machinery for O&M. A water management
component was also included. It was expected to benefit about 10,600 farm families on
31,500 acres of irrigated land and the International Development Agency (IDA) and United
Kingdom Development Ministry (UKODM) funded it (Table 3.11).
Studies have pointed out that there has been a heavy bias towards engineering solutions
(e.g., Abeyasekera 1986). Physical improvements should be coupled with appropriate
cultural practices and strengthening of farmer organisations to ensure success. It is also
necessary to consult the farmers in the initial stages of the project. Failure to observe this
has resulted in many control structures and channels left damaged after a short period of
their completion. These points are taken up in later chapters.
Table 3.11: Estimated Actual Costs of the Tank Irrigation Modernisation Project (Rs. millions)
Tank Area Civil Equip- Tech Total Pro-rata CI Yield ERR Acres Works ment Asst. Cost (bush.
/ac)
(Rs./ac) (%) (%) Mahakandarawa Mahawilachchiya 26100 22.25 5.61 1.82 29.68 11415 169 80 11 Pavathulam 4400 24.21 9.51 2.91 36.63 8325 165 80 21 Padaviya 12500 65.76 27.03 6.75 99.54 7963 118 80 14 Vavyunikulam 6000 31.17 12.98 3.24 47.39 7898 147 80 16 Total 31500 198.14 68.1 18.91 285.15 9052 146 80 15
Source: Tank Irrigation Modernisation Project, Credit 666-CE Completion Report, August 26,1985, World Bank.
3.7 Gal Oya Left Bank Water Management Project
The Gal Oya Scheme was started in 1948 and completed in the early 1950s. It has a
command area of 120,000 acres, of which its Left Bank Canal serves 65,000 acres. The
system had deteriorated considerably and about one third of the Yala area was not
receiving water when it was chosen for rehabilitation in 1979. The original total estimated
cost of rehabilitation was Rs. 295 million in 1979, but this had increased to Rs. 524 million

34
when it was terminated in 1985. Civil strife in some parts of the project area prevented its
completion.
The original total estimated cost placed a heavy emphasis on machinery and equipment.
This bias was later changed and the socio-economic research component was given more
emphasis. The strengthening of farmer organisations was considered to be the key factor in
achieving success. Specially trained Institutional Officers were deployed before the
commencement of physical rehabilitation of secondary and tertiary systems to organise
farmers and get their views and suggestions on proposed rehabilitation. The activities,
listed below in Table 3.12, in Gal Oya included support of rehabilitation, water
management and training of irrigation staff throughout the country. Some before and after
performance indicators are given in Table 3.13.
Table 3.12: The Gal Oya Left Bank Management Project Categories of Expenditure Appraisal
(Rs. million) Revised
(Rs. million) Rehabilitation 91 198
Machinery & Equipment 65 73 Master Planning and On-farm Research 3 1 Central support 42 96 Training 16 18 Socio-economic Research 9 39 Contingencies & Inflation 58 64 Sub-Total 284 490 Improvements to GITI 12 16 Investigations of follow on project 0 13 Water Management 0 3 Water Management Research Centre 0 2 Total 295 524
Source: Irrigation Department.
Table 3.13: Other Performance Indicators of the Gal Oya Left Bank Management Project
Description Unit Before Project (1979) After Project (1985) Irrigated Area acres 42,000 53,000 Cropping Intensity % 119-129 >165 Cost of Production Rs/acre 2232-2460 2573-3802 Production bushels 3,057,360 7,039,853 Pro-rata cost Rs/ac -- 9,000-11,000
Source: Irrigation Department.

35
The achievements, according to the International Science and Technology Institute (ISTI)
(1985) evaluation, were:
i) Rehabilitation of a scheme in very bad repair in a cost-effective manner and to an operational state.
ii) Ability to form farmer organisations.
iii) Some beneficial changes in the agronomic practices, viz.,
- timeliness of land preparation;
- shortening of time between land preparation and sowing;
- enhanced fertiliser application;
- improved pest control.
The Irrigation Systems Management Project (ISMP) was a follow up of the above project and
drew heavily on the Gal Oya experience. The Major Irrigation Rehabilitation Project
(MIRP), completed in 1993, is another with similar characteristics. The Nagadeepa and
Minipe Rehabilitation Project was also similar but had additional components in the nature of
a rural development project. The Moneragala Agricultural Resources Development Project,
completed in 1990, was another rehabilitation project, designed to carry out similar activities
but in a medium sized irrigation context. 3.8 Lift Irrigation
The Impact Evaluation Report on the Sri Lanka Lift Irrigation project (World Bank 1985)
stated that the project was an overall failure. The project envisaged the provision of lift
irrigation and agricultural development to 13,500 acres above the command areas of four
existing major irrigation schemes. Beneficiaries were to be both landless labourers in the
schemes and educated but unemployed youths (7,400 acres were allocated to the latter). It
provided for the construction of irrigation canals, control structures and installation of
pumps and housing for settlers at a cost Rs. 19.6 million. At completion in 1976 the cost
had escalated to Rs. 35 million. Conceived as a crash programme, it was prepared without
adequate information on beneficiaries, conditions and institutions involved.
The Impact Evaluation Study observed that farmer organisations can play an important role
in the functioning of lift irrigation schemes if they are made responsible for operations and
replacement of pumps and engines as well. This Scheme is further analysed in a later
chapter.

36
3.9 Concluding Remarks
Investment in irrigation after Independence assumed a greater role in the Public Investment
Programme than before, though this was highly variable between 1950 and 2000. It was as
high as 31 per cent in the early stages, fell to a low of 9 per cent in the 1960s. It rose in the
1970s again, culminating in a high point of 40 per cent in the first half of the 1980s, and
thereafter fell again to only 5 per cent in 1996-2000.
The diversity of types of irrigation schemes needs to be stressed. There was a wide range in
size of schemes. Those which were in favour early were Major Schemes, whilst the advent
of the Mahaweli Programme and its Accelerated Project changed the emphasis to large scale
river basin development schemes. The smallest, the Minor or Village works received
relatively little attention until the 1980s but even then were dwarfed by the other two
categories in that period and at no stage were more than 3 per cent of total irrigation
investment (and 2 per cent of total PIP). One other important point arising from the
preceding discussion is that, there are currently three fairly distinct directions for future
irrigation investments.
i) Investment in the Mahaweli Programme. This was necessarily biased in its initial years towards the construction phase, particularly in head works. The benefits of settlement schemes downstream are not yet fully exploited.
ii) Investment in rehabilitation of existing schemes where there is much scope in both major and minor schemes. However, the economics of such investments need to be explored and is in later chapters. In this respect the balance between rehabilitation in infrastructure and management that will encourage farmer participation and production efficiency is a significant issue.
iii) Modernisation of irrigation systems and diversification of cropping patterns. This study expands beyond consideration of completing on-going new investments and rehabilitation of old schemes. Despite the difficult economic circumstances, Sri Lanka needs to consider the economics of modernisation of irrigation systems and diversification of cropping patterns.
This review of past irrigation investments and their importance in past PIPs is a necessary
first step in generating perspectives for future investments, but there are other options also
to be considered. These will be examined and where possible compared, in terms of a
variety of performance indicators in later chapters.

37
4. Benefits and Costs of Past Irrigation Investment
4.1 Introduction
In the consideration of future investment in irrigation, one of the key factors to be considered
is the comparison of costs and benefits of the alternatives. It is, of course, very difficult to
predict the outcome of future irrigation investment schemes, but past experience can assist.
This chapter reviews costs and benefits of those schemes in Sri Lanka for which data are
available.
The government of Sri Lanka formulated an irrigation investment strategy in the early 1980s
(Ministry of Lands and Land Development 1984). Whilst this was flexible in terms of choice
of schemes, it did indicate the preferred direction of priorities.
”Construction of any new major schemes should be taken up again only after a period of
review and research, including environmental impact assessment. A strategy of future
expansion of irrigable area based on construction and rehabilitation of small and medium
scale tanks is far preferable, especially when one takes the nation's financial limitations into
consideration".
At that time, such a shift in allocation of diminished financial resources in this direction was
more easily said than done, for the GOSL had already made substantial commitments,
particularly in the AMDP. There was nevertheless more flexibility from 1990-91 onwards
than there was earlier, so the setting of priorities was a highly pertinent exercise, since even
forward commitments to on-going schemes can be altered in timing and size, and availability
of financial resources can improve.
The general direction of allocation projections in 1984 showed a lower priority for irrigation
as a whole after 1985 and a greater shift in emphasis to projects outside the Mahaweli
Programme, both of which were welcomed by the World Bank (1986).
The alternatives were summarised by the World Bank (1986) in terms of a number of
indicators of costs and benefits for the Mahaweli and Rehabilitation schemes as follows
(Table 4.1):

38
Table 4.1: Indicators of Costs and Benefits for Mahaweli and Rehabilitation Schemes
Indicator Mahaweli Rehabilitation
% Economic Rate of Return (ERR) 12-21 (7-18) 16-23 (13-29) Investment Cost per hectare (US$) 3800 - 6200 530 - 1930 Net Investment Benefit per hectare (US$) 930 - 1134 150 - 630 Investment Cost per (US$) 4000 - 6200 720 - 2340 Net Incremental Benefit per family (US$) 970 – 1340 200 - 760
Notes: 1. ERRs in parentheses include sunk costs of major head works, and for rehabilitation projects, denote the
range of returns from individual tanks. 2. Total investments included in the economic analysis in the appraisal reports are in constant 1984 prices.
They explicitly exclude costs of settlement and social services, which are assured to generate their own benefits, but include all irrigation infrastructure and on-farm production costs.
Source: The World Bank (1986) Sri Lanka. Institutional and Policy Issues for Agricultural Development. Washington DC.
These data suggest that Mahaweli projects generally cost more per hectare because of the
new development costs of clearing and irrigation infrastructure, but generate higher
benefits and create more employment than rehabilitation projects. Thus, while the latter are
likely to earn higher economic rates of return, Mahaweli projects will produce higher net
economic benefits (net present values) per hectare.
Given the need for reductions in investment allocations for irrigation beyond 1985, the World
Bank (1986) gave the following ranking of priorities in irrigation for the medium term:
"(a) Increased provision of funds for investigating and preparing rehabilitation projects and for strengthening the institutions involved with a view to accelerating the investments in this area by about 1988
(b) Selectivity in rehabilitation investments, and the study of an entire catchment area as a whole
(c) Increased funding for investments aimed at improving water management
(d) Adequate fund allocations for system operation and maintenance
(e) Concentration of most Mahaweli resources on completing Systems B and C incorporating the lessons learned from System H.
(f) Implementation of detailed studies and designs for Mahaweli Systems A and D so as to allow initiation of construction when funds and organisational capacity permit.
(g) Shelving of irrigation development plans for the Southeast and Northwest Dry Zones".

39
We are concerned here with examining the validity of the conclusions drawn from the above
comparison of the Mahaweli and Rehabilitation projects. These calculations and the
underlying assumptions are therefore examined in the light of the range of studies now
available on Sri Lanka's past and on-going irrigation projects.
The World Bank (1984) gave a more detailed set of parameters of six irrigation projects
which they have supported (Table 4.2). The six comprise the Mahaweli Ganga II, III and IV,
the Tank Irrigation Modernisation Project (TIMP), the Village Irrigation Rehabilitation
Project (VIRP) and the Major Irrigation Rehabilitation Project (MIRP).
The parameters used in Table 4.2 are drawn from the Appraisal Reports of the six projects.
The validity of the conclusions drawn in these Reports depends upon the extent to which
actual costs and benefits matched these appraisal projections. Also, there is a question as to
whether these six were representative within Sri Lanka. This chapter examines and compares
these projects to weigh up, to the extent possible, the relative merits of large new schemes
and smaller rehabilitation projects.
4.2 River Basin Development Projects
The Mahaweli Ganga Project II
Performances can only be judged by comprehensive and careful ex post evaluations and not
by appraisal indicators, as the latter are all too frequently based on assumptions that are wide
of the mark. Furthermore, much importance is placed on the assessment of assumptions
made in ex post evaluations.
The World Bank undertook an ex post assessment of the performance of Mahaweli Project II
of the AMDP, which was completed in 1985, in their Project Completion Report 1987
(World Bank 1987). This was based on a draft prepared by PMU/MASL in 1984 and other
MASL data. The PMU draft did not contain a benefit cost analysis of Project II either in
financial or economic terms. The Bank did make such an analysis based on the benefits and
costs of H4 and H5 areas of System H only6. The PCR reported an internal rate of return of –
1 per cent as against an appraisal ERR of 21 per cent. Unfortunately, some of the critical
6 These comprise irrigation development of the Right Bank area of System H together with the provision of some facilities for the Left Bank area.

40
assumptions, viz., those on which the economic price of rice was based and the base year for
the cost calculations, were not made explicit. Also the PCR II assumed the cropping pattern
of System H would not change.
The price assumption was most important as the ERR was particularly sensitive to change in
shadow prices. Indeed, a Project Performance Audit report of the Bank for Project II in May
1988 based on the PCR II found that the Bank's negative rate of return was largely due to the
depressed price forecast. The use of appraisal shadow prices (1976) gave an ERR of 16 per
cent on completion. This assumption is, however, too arbitrary.
The Project Monitoring Unit of the Mahaweli Authority undertook its own appraisal of the
returns from Project II in 1988. Its assumptions differed substantially from those of the
World Bank with respect to the shadow price of rice and yield with and without Project II of
paddy and chillie, at the commencement and during the life of Project II. The resulting ERR
was a more attractive 10 per cent. The Bank eventually accepted the differences in
assumptions and there is no apparent reason to question the revised ERR of 10 per cent.
Indeed it could well be higher.
For the Mahaweli Authority, crop diversification is a policy priority, in line with government
policy. In its conclusions, this study considered this priority and a range of investments and
pre-investment studies on the basis of prospects for the production of high value export crops
both within and outside Mahaweli. System H is one of the promising locations for these
alternative crops where an ERR of 10 per cent could be conservative if diversification can be
achieved.
The same argument can be applied to the prospective ERR of System B, Right Bank. The
World Bank completed an ex ante reappraisal of System B (RB) in 1986 and calculated a low
ERR of 3 per cent. The underlying assumptions are not known but would require careful
scrutiny, particularly in the light of possible diversification and irrigation modernisation in
this area.

41
Table 4.2: Cost and Benefit Parameters for Six World Bank-Supported Projects
Project Area Develo-
ped
Steady Stream of
Production Costs
Stream of O&M Costs
EconomicAppraisal
Net Benefits
Net Benefits
Invest-ment
Costs Net Benefits
Invest-ment
Benefit/Costs
EconomicRate of
Return/s
Familiesbenefited
Increment Paddy Pdn..
(ha.) US$mns US$mns US$mns US$ mns US$mn of 1984
US$mn of 1986
Per ha. US$
Costs/haUS$
Inv./CostRatio
‘000 (‘000)
Mahaweli-Ganga II (1976)
14,700 14.6 4.7 0.5 9.4 13.6 38.5 55.1 925 3,789 24.4 21.2 (14.4)
14 51.5
Mahaweli Ganga III (1980)
24,100 55.5 20.1 1.2 34.2 32.3 125.3 118.4 1,340 4,913 27.2 18.0 24 185.8
Mahaweli Ganga IV (1984)
14,000 22.8 8.8 0.2 13.8 14.3 83.8 86.7 1,021 6,193 16.5 12.0 (7.0)
14 104.0
TIMP (1976)
12,750 8.6 2.7 0.4 5.5 8.0 17.0 24.6 627 1,929 32.5 23.0 (20-29)
11 25.5
VIRP (1980)
31,500 11.4 4.6 0.4 6.4 6.0 24.0 22.7 190 721 26.4 20.0 25 37.8
MIRP (1984)
46,264 13.9 6.6 0.3 7.0 7.0 24.7 24.7 151 534 28.3 16.0 (13-20)
34 73.8
Data in brackets are: - for Mahaweli projects, ERRs with sunk costs of head works, etc. included in the computation; - for Irrigation rehabilitation projects, the range of ERRs for individual tanks included in the respective projects. Source: IRBD Staff Appraisal Reports, Washington DC.
41
42
4.3 Major Irrigation Schemes
The Uda Walawe Project
Development and settlement of the Walawe River Valley was initially included in the
National Council's Ten-Year Plan in 1959.
The Uda Walawe Project was started in 1969 in the Walawe River Basin in the Southern Dry
Zone with Asian Development Bank's assistance as its first integrated rural development
undertaking in Sri Lanka. The project area was envisaged as 30,000 net irrigable acres,
comprising the Right Bank service area of the Uda Walawe Reservoir. Project work
included:
i) Improvement of the existing irrigation system and land use.
ii) Construction of new irrigation facilities, land development and settlement.
iii) Development of settlement infrastructure.
iv) Establishment of an agricultural experiment and extension centre.
The executive agency was the River Valley Development Board (RVDB).
The prime objective was to develop and irrigate the 30,00 acres for double cropping, enhance
yields, accommodate about 3440 new settlers, and to improve agricultural productivity and
living standards for about 3,100 earlier settlers. Farm production was expected to increase to
more than Rs. 70 million under full development.
The Project was scheduled for completion in three years, i.e., in 1972. At Appraisal, two
assumptions were made. Under Assumption A, total construction costs of the Walawe dam
after 1964 and investment after 1970 were taken into account. Under Assumption B, only
the latter was included. Assumption A was thought to be the most relevant since investment
from 1970 only continued the older project from 1964.
The ERRs at appraisal and on completion were as follows: Assumption Appraisal Completion
A 12 per cent 10 per cent B 16 per cent 11 per cent

43
The ERRs on completion, as assessed in 1979, were 2 per cent and 5 per cent lower than at
appraisal. There were a number of reasons for the reductions. First, implementation was
much delayed. Disbursement ended only in 1977, and in 1979, the Project was only 90 per
cent complete. Second, two tracts were eliminated from the Project. Third, due to the
absence of adequate design and construction supervision, the quality of irrigation works was
not satisfactory which resulted in severe scouring and/or siltation at many canal structure
locations. Fourth, additional costs were incurred to rehabilitate Project works. Fifth, paddy
yields were lower than expected in the early years. Finally, only a small area under village
tanks, which were to receive water from the Walawe system, actually received it, and even
then only from 1978.
The Uda Walawe Reservoir was expected ultimately to serve about 81,000 net acres (33,000
on the RB and 48,000 on the LB). However, water use in the Project area far exceeded
original expectations. In 1979, the entire supply from the reservoir and local tanks was
delivered to an average of about 21,000 acres on the RB and 10,900 acres on the LB. Only
lack of development of the LB allowed this excessive use.
This use arose from a change in the cropping pattern envisaged, which was to devote 55 per
cent of the irrigable area, on below-command land at higher elevations with well drained
soils, to subsidiary crops (maize and groundnuts in Maha and cotton, chillie and red onions in
Yala seasons). Instead, double cropping of paddy prevailed. Of the 16,522 acres of irrigable
land newly developed under the Project, all but 300-400 acres, either in Maha or Yala
seasons in all years to 1979, were used to grow paddy. The small areas of non paddy crops
were planted with chillie, vegetables, green gram, cowpea, maize and gingelly in Maha
season, and with cotton and green gram in Yala season.
Thus in Maha, proportions of the total cultivated area were 88 per cent paddy, 3 per cent
chillie, 4 per cent vegetables and 5 per cent other crops. In Yala, the pattern was 93:1:1:5
respectively.
Cropping intensities fell well below the expectations of 2.0. In one section of tracts it
reached 1.67 in 1978/9 or 89 per cent of projections. In the other larger section, it only
reached 0.94 or 47 per cent of projections. Thus, both in terms of diversification and
cropping intensity the Project fell well short of expectations.

44
4.4 Rehabilitation Projects
Rehabilitation projects are divided into two major groups according to size: Major and Minor
(village). This analysis follows rehabilitation schemes since Independence in historical
sequence. The Tank Irrigation Modernisation Project (the TIMP) concerned with major tanks
was identified in 1973 and for which credit agreement was effectively given in 1977 with
expected completion in 1980. The Village Irrigation Rehabilitation Project (VIRP) was
appraised in 1981 and was planned for implementation from 1981 to 1983. The Major
Irrigation Rehabilitation Project (MIRP) was appraised in 1984 after a 1983 feasibility study,
using the approach of and lessons from the TIMP in its design.
4.4.1 The Tank Irrigation Modernisation Project
Projections
The TIMP was designed for five tanks in the North of Sri Lanka's Dry Zone where reservoirs
were planned to supplement Maha rainfall and utilise any remaining rainfall for limited Yala
cultivation. It was believed that increases in production could be achieved by scheme
modernisation, improved water management and by the introduction of improved cropping
practices utilising existing water supplies.
The water balances were highly variable in the five tanks before the project, ranging from
poor to very favourable. Past inflow analyses had indicated that water was available to
increase yields and cropping intensities if irrigation practices and tank operations were
improved. With better use of rainfall and tank water, average cropping intensity was
expected to increase from 103 per cent to 156 per cent. For this, a firm irrigation calendar
was established and strict rotational irrigation was to be enforced based on crop water
requirements. Paddy was to remain dominant but with significant diversification into crops
such as maize, sorghum and pulses. With better extension services, yields were expected to
rise considerably. A substantial incremental increase in rice production was also expected.
There would be savings in foreign exchange and some 10,500 farm families were to benefit
directly. Net farm incomes were expected to double, raising them to the national average.
The economic rate of return of the project was estimated to be 23 per cent. Sensitivity
analysis gave a 13 per cent return at worst (with 25 per cent cost increase, 25 per cent lower
benefits and a 2-year delay in reaching full development). Viability of each tank was 'proven'
with estimated rates of return varying from 20 to 29 per cent.

45
Most importantly, the principal agronomic changes were to follow the practices of the
Walagambahuwa model (IBRD 1976). These practices were:
1. Use of intermittent irrigation for paddy as needed by the crop (not tried in this zone to that time but demonstrated at Maha Illupalama and elsewhere).
2. Use of weedicides and hand weeding to counter the expected increase in weeds caused by intermittent irrigation.
3. Land preparation by tractors on a significant portion while dry, or following first monsoon rains, to reduce the traditional use of tank water for this purpose.
4. To establish firm irrigation schedules to improve the efficiency of water use.
5. To grow other crops on paddy lands in Yala, and in some areas, in Maha season.
Early and dry cultivation with tractors using shorter duration varieties of paddy and savings
of tank water to increase cropping intensity in Yala season were the cornerstone of the
Walagambahuwa model (see with and without estimates in Table 4.3). Critically, farmers
needed the rainfall (and the assurance of its availability) in time for the early sown crop.
Performance
The completion report for the Project (IBRD 1985) estimated the EIRR at 15 per cent (as
against 23 per cent at appraisal) with a range from 8 to 21 per cent. These assumed that "full
development targets set at appraisal will be reached in all schemes except Mahakandarawa".
These included projected yields and cropping intensities. The lower projections of the EIRR
were explained by:
(1) Cost increase of 67 per cent over appraisal due to inflation, rupee devaluation and
delayed implementation.
(2) Extended implementation - three years longer than expected.
(3) Lower rice prices.
(4) Poorer outlook for the Mahakandarawa Scheme. It is useful to note the various
estimates of cropping intensities and paddy yields (Table 4.3).

46
Table 4.3: Appraisal and Project Completion Projections of Cropping Intensities and Paddy Yields for the TIMP
Appraisal Estimates Project Completion Estimates Scheme Without
project With
project Without project
With project
A. Cropping intensities (per cent)
1 94 168 90 110 2 90 169 125 169 3 124 165 130 165 4 92 118 92 118 5 109 147 110 147
Total 108 156 114 146
B. Paddy yields (60 bushels/ac)
1 52 73 60 80 2 47 73 60 80 3 57 73 60 80 4 50 74 60 80 5 51 74 60 80
Total 54 73 60 80
Source: Project Completion Report (PCR) (IBRD 1985) p.30.
The PCR projections could only be based upon data from one or two crop years after the
completion of the project (and some years prior to this). These did not provide an adequate
guide, as the first year experienced severe water shortage and the second experienced
extremely heavy rainfall (as admitted in the PCR on p25). Also, rainfall incidence in earlier
years showed a wide range and thus implies much uncertainty as to monsoon behaviour in
this region. Paddy yields in the two years were not far below the full development estimate
but so were average yields for the entire districts of each of the scheme.
The PCR reported generally adequate resources in terms of availability of draft power. It
did report a lack of credit, but more importantly, an unwillingness of farmers to invest in
early cultivation (ibid p.24). Further:
"The recent drought years have not helped in building up farmer confidence
that irrigation water would be available for their early sown crops or, in some

47
areas, for any crops. Difficulty of ensuring against failure of early sown crops
and expectations (based on experience) that additional water issues could be
obtained for later sown crops, further reduced farmers' willingness to assume
the risk of early cultivation".
Further corroborative evidence of the limited applicability of the Walagambahuwa concept
has since appeared, particularly in studies by Abeysekera on the usefulness of the TIMP, as
the concept was adopted as a model for the Major Irrigation Rehabilitation Project (MIRP).
Abeysekera carefully scrutinised the performance of the Walagambahuwa Model within the
TIMP by means of a base line field study in 1978-80 and a later study of the situation after
completion in three of the tank areas in May 1983. The latter study's findings suggested that
a majority of farmers felt that the irrigation network had improved after the modernisation
though problems still remained. The detailed schedules for rotational distribution of water
were not functioning below field channel owing to a lack of cooperation among farmers and
because they were not convinced of the benefits.
Preparation of paddy lands prior to rains was not favourably received by farmers despite the
potential for saving tank water for Yala season. Reasons given for non-adoption were erratic
rainfall (which is supported by rainfall records for Maha season), difficulties in weed control
(in the absence of suitable pre-emergent weedicides) and non-availability of suitable rice
varieties for dry sowing. Where chena cultivation was practiced, there was also a conflict
between its cultivation and dry sowing, with preference for the chena. Mud sowing and a
"full tank mentality" prevailed.
Despite extension efforts, there was little diversification into other crops in Yala season,
despite the savings in water. Farmers preferred to grow paddy. Other reasons given were
soil problems associated with drainage (on LHG and poorly drained RBEs), inadequate water
supply, marketing problems, lack of familiarity with these other crops and heavy credit
requirements.
Thus, neither the Bank's assessment nor Abyesekara's field studies suggested that the target
projections for paddy yields, cropping intensity and total production, and for diversification
into other crops, were likely to be achieved. Seasonal data for more recent years would be
helpful and allow firm conclusions to be drawn. However, on the basis of available evidence

48
we cannot accept the Bank's optimism expressed in the PCR and therefore would expect an
EIRR below the projected 15 per cent.
This project has been considered at some length for two reasons. It was the first systematic
attempt to rehabilitate older irrigation schemes taking water management into account.
Previous schemes were confined to engineering work to put the tanks back into good
working order. Second, the TIMP was accepted as the model for the later Village Irrigation
Rehabilitation Project (VIRP), the Major Irrigation Rehabilitation Project (MIRP) and the
Kurunegala Integrated Rural Development Programme (KIRDP). 4.4.2 Village Irrigation Rehabilitation Project (VIRP)
Projections
The VIRP was concerned with the scattered irrigable areas commanded by small village
tanks and anicuts. The project area covers the whole of the dry and intermediate zones and
parts of the neighbouring Wet Zone and excludes only the two Dry Zone districts of
Anuradhapura and Polonnaruwa (Water Board 1981).
The objectives were centred on increasing agricultural production and farmer incomes by
rehabilitating about 1200 village irrigation schemes with improvements and repairs to tank
infrastructure and irrigation distribution systems, and modernising working schemes to
facilitate the introduction of systematic water management programmes. Conditions of tanks
varied widely from abandoned schemes to operational tanks that required rehabilitation to
maintain or increase production.
The total command area was estimated at about 31,500 hectares and the work was scheduled
for 1981-85. Higher yields and cropping intensities were expected along with 7,100 rainfed
hectares to be brought under irrigation. Cropping intensities were low in the Dry Zone at
around 70 per cent in Maha (irrigated and rainfed) and 5 per cent in Yala. With the project,
these were expected to rise to 85 per cent irrigated in Maha and 20 per cent in Yala. The
corresponding figures in the intermediate zone were 90 per cent and 25 per cent (without the
project) rising to 95 per cent and 50 per cent (with the project). Some diversification was
expected into chillie, and cowpea on lighter soils provided the water management
programme succeeded. Yields of paddy were expected to rise from 2.25 to 2.8 tons per
hectare in Maha and from 2.2 to 2.8 tons per hectare in Yala. Families who would benefit

49
would number around 20-25,000 and farm incomes would rise by an average of 43 per cent.
A project life of 25 years was assumed. One year's rehabilitation (1981) would give first
benefit in 1982 and full production benefits in 1999. The ERR of the base case was projected
at 19.8 per cent and was tested for sensitivity as follows (Table 4.4).
Table 4.4: Sensitivity Tests on the Projected EIRR of the VIRP
Variables %Change % EIRR Base case - 19.8 Economic price of paddy +20 24.8 Economic price of paddy -20 14.0 Paddy yields with project +20 30.6 No increase in dry zone Yala cropping - 14.4 No diversification into upland cropping - 17.8 Total command area -20 16.1 Agricultural value added without project +20 12.4 All farm costs +20 12.4 Delay in benefits by two years - 14.8
Source: Staff Appraisal Report (World Bank 1981).
The set of farming practices, which were expected to be adopted in order to obtain the
projected increases in paddy yields and cropping intensity, together with the desired degree
of diversification in Yala season, were again those of the Walagambahuwa concept. An
FAO/IBRD Appraisal Mission (FAO 1980) carefully reviewed the experience gained in the
field from the Walagambahuwa village tank area from 1976-77 to 1979-80. It was with some
reservations:
"As the new concept is based on a very tenuous factor, sufficient rainfall, to initiate the paddy
rice crop and fill the small village tank, it is important for the proponents of this concept and
the farmers that it does not fail due to a period of drought" (ibid Annex 4, p7).
The Mission noted the concept was not new to Sri Lanka but that at Walagambahuwa they
had been more successful. With a list of requirements to facilitate its success, the Mission
then decided to support and expand the Walagambahuwa concept as a project component.

50
Performance
The most important performance analysis of the VIRP came from a series of socio-economic
studies undertaken by the Department of Agricultural Economics and Extension, University
of Peradeniya, and by the Agricultural Research and Training Institute (ARTI). The former
(the UP studies) commenced in 1981 as part of project preparation and were completed in
1989 with the publication of the final report (Herath 1989) that examined in depth the
changes that have occurred as result of rehabilitation for the period 1981-88. This last
covered six districts and had to abandon studies of schemes from the Northern and Eastern
Provinces owing to the prevailing civil disturbances there.
Economic benefit/cost ratios were computed for 36 tanks. This is an admittedly limited
number in relation to the VIRP as a whole (about 1 per cent of all small tanks in the Dry
Zone and around 3 per cent of those in the project). It regrettably had to exclude those
selected in the five districts within the Northern and Eastern Provinces. Nevertheless, the
analysis of the 36 provided valuable and much needed insights into performances.
The farming system in the tank areas typically comprised upland and lowland components.
Only the lowland areas were affected by the Project. In all districts and tanks, Maha paddy
was the dominant crop before and after rehabilitation. In a few cases the proportions of
farmers growing Maha paddy increased. Subsidiary crops were virtually absent in this
season both before and after rehabilitation except in one district (Badulla) where there was a
slight shift towards them.
In Yala season, inadequacy of water was a feature before rehabilitation. In the four districts
of Badulla, Moneragala, Galle and Ratnapura, the proportions of tanks left fallow were 33
per cent, 63 per cent, 33 per cent and 18 per cent respectively. In this season paddy was also
the predominant crop in the tanks where cultivation occurred. Few reported other crops,
again with the exception of Badulla, where potatoes and vegetables were widely grown.
After rehabilitation, no significant changes in cropping pattern were reported, i.e., there was
no major shift towards subsidiary crops. In Yala season, the results were mixed. Overall
there was some reduction in tank numbers left fallow. One or two definite increases in
cropping intensity were reported and some others in which there were marginal increases and
decreases, but the broad conclusion was that changes in Yala cultivation were not very
satisfactory and land use intensity was still low after rehabilitation.

51
There was an absence of mechanisation in preparatory tillage and timing of preparatory
tillage coincided with the rains. It was advanced in only two tanks but even these later
reverted to traditional timing. There was considerable uncertainty in farmers' minds over
storage and assured water supplies even after rehabilitation. Newly improved varieties (Bgs)
were generally grown before rehabilitation but their adoption did increase after the project.
Maha paddy yields increased in 60 per cent of lands in Badulla, 72 per cent in Moneragala
and average Yala yields increased in both. Maha yields increased in 64 per cent of tanks in
Ratnapura, and finally, increases in average yields occurred in Matara and Galle in both
seasons. Costs of production of paddy had risen markedly over the period (mainly in hired
labor). Overall, this caused an absolute decline in profitability of paddy despite
rehabilitation.
The economic analysis was made difficult by constraints on data collection of cost and
benefits and some data could not be obtained at all, so sophisticated analysis using shadow
prices could not be applied. Use was made of conventional benefit/cost techniques and
focused only on economic returns to the society as a whole. Forty-four schemes were
evaluated. In eight (19 per cent), total rice production was lower due to rehabilitation, which
of course meant negative incremental net benefits. A distribution of benefit/cost ratios by
district (Table 4.5) shows the eight negative cases and another four with less than one, which
are positive but are also unprofitable. Fourteen are between 1 and 5 while eight are above 10,
thus illustrating the large variation.
The cases with very high Economic Benefit Cost Ratios (EBCRs) are those in which there
was no Yala cultivation prior to rehabilitation, and where the addition of this crop occurred.
While caution is necessary in generalising from this analysis, it is suggestive of some
important conclusions. First, translation of the EBCRs into ERRs would not give a high
average economic return from the VIRP. Second, the cases where a second crop can be
added in Yala will give high returns even if the crop is paddy. Third, the VIRP does not
appear to be generally capable of achieving a second crop in Yala and reasons for this need to
be identified. Fourth, there is no evidence in this study of any significant adoption of the
Walagambahuwa model by small tank farmers. This suggests the model is generally
inappropriate under village tank conditions and that any positive net benefits in terms of
economic returns from the project were mainly obtained from the structural, storage and
distributional components of the Project.

52
In another study of the VIRP, Somasiri (1987) commented that the "limited studies at
Walagambahuwa conducted by the Department of Agriculture provided the rationale for
water management under the village irrigation tanks". While stating that the data were
inadequate for far reaching conclusions, he made several useful observations based on
hydrological data. First, he emphasised the wide variability, intensity and spatial
distribution of Maha rainfall in the Dry Zone. Second, within the Dry Zone, the northeast
was favoured in terms of amounts and regularity, receiving a greater inflow for a longer
period. Thus, it may be that the Walagambahuwa model is effective in such areas but even
this suggestion needs further study of rainfall records to determine the likelihood of
success. The author commented that in this north east region and in the intermediate zone,
advancing Yala planting time substantially would enable the Yala area to expand using
tank water effectively and would possibly permit diversification.
Table 4.5: Distribution of the Benefit Cost Ratios within the VIRP
District Negative Less than 1 1-5 5-10 Greater than 10
Total
Badulla 3 3 6 2 1 15 Moneragala 2 1 4 3 1 11 Ratnapura 3 - 1 3 4 11 Matara 0 - 1 1 1 03 Galle 0 - 2 - 1 03
Source: Herath et al. 1989.
Somasiri’s water balance data confirmed "that it would be more advantageous to have an
adequately well managed Maha rice crop than to conserve the water in the tank at the
expense of the Maha crop". It would be of little value to conserve the water for a second
crop (Yala crop) without providing adequate irrigation for the Maha crop.
Finally, a study by Begum (1987) pointed out that the success of the Walagambahuwa
project itself was the result of well distributed rains up to 1980. These results were not
subsequently sustained and recent experience does not support the adoption of dry sowing.
On the other hand, in locations where rainfall is reliable, e.g., in Trincomalee district, farmers
do prepare their land before the onset of the Maha rains.

53
4.4.3 The Major Irrigation Rehabilitation Project (MIRP) Projections
The MIRP envisaged the rehabilitation of seven major tank systems commencing in 1986
with a completion target for rehabilitation in 1990. Total area to be rehabilitated was 46,240
hectares or 26 per cent of the total land under major irrigation tanks in Sri Lanka. The
production potential of each of these schemes was seen as high at appraisal (World Bank
1984, p.32) given "adequate and timely supply of water, adoption of improved water
management and other supporting agriculture services”. Expected gains in paddy and
soyabean production from the project were to come from improvements in cropping practices
and from higher cropping intensity and yields. The economic rate of return of the project
was estimated at 16 per cent at appraisal. A breakdown by schemes of ERRs and NPVs is
given in (Table 4.6).
Table 4.6: Projected Economic Returns from the Major Irrigation Rehabilitation Project (MIRP)
System ERR% NPVs (US$M) Kantalai 18.0 1.1 Morawewa 20.0 0.5 Iranamadu 18.0 2.6 Giant Tank 13.0 0.9 Rajangana 18.4 1.8 Nachchaduwa 13.4 0.7 Huruluwewa 19.0 0.8 Total 16.0 8.4
Source: Staff Appraisal (World Bank 1984).
The project's economic viability was said to be sensitive to shocks arising from major cost
increases or reductions in benefits, which were "both unlikely". For incremental benefits to
drop by 13 per cent, either the projected yields or the cropping intensity would have to fall
significantly. Leaving aside the question of a cost escalation, the issue of a fall in benefits
needs consideration. The Bank's Appraisal Report notes considerable differences in water
supply situations between the tanks. Also, intensity of cropping and crop yields and cropping
practices were directly related to the availability of water, though interbasin water transfers
have helped to increase inflows.
The criterion for adopting a cropping pattern based on hydrological studies was the finding
from rainfall records that a shortage of water would occur in only 4 of 30 years. This
criterion was admitted as being somewhat arbitrary but was considered as reasonable as "an

54
attempt to rationalise the planning for tank fed irrigation in Sri Lanka" (World Bank 1984, p
21). On the basis of these studies cropping intensities (CIs) were projected to be 150 per
cent, 150 per cent, 150 per cent, 188 per cent, 143 per cent, 95 per cent and 150 per cent for
the seven tanks after rehabilitation. The increases, mostly to be achieved in Yala season,
were 15 per cent, 20 per cent, 13 per cent, 7 per cent, 25 per cent and 20 per cent
respectively.
The changes in cropping practices recommended for the MIRP were to be those of the
Walagambahuwa model. However, the only tank scheme in which dry land cultivation and
dry zoning are currently practiced in Maha season is in Iranamadu which is located in the
northeast and, as has been pointed out above, is one area which has reliable Maha rains.
The crucial question is whether farmers could be persuaded to adopt these new practices.
The prospects were not particularly favourable given past experience in the TIMP, on the
basis of which the MIRP was planned. The problem lay in the choice of the criterion for
assessing the potential cropping intensities. For farmers, the question to be taken into
account was not only the likelihood of failure of Maha rains, but was also the reliability of
onset and follow-up rains. Late rains do not necessarily mean a failure of the monsoon but
they can cause a failure of the crop, which farmers cannot afford.
The adoption of the Walagambahuwa model for the MIRP was therefore likely again to pose
problems in areas unlike Iranamadu and the projected economic returns and farm incomes
were probably too high, since a large proportion of farmers would reject the recommended
cropping practices.
The Kurunegala Integrated Rural Development Project (KIRDP)
District Integrated Rural Development Projects are one of the major strategic approaches of
the GOSL to strengthen the pace of rural development. Kurunegala was the first district in
which an IRDP was introduced in 1979, and it was completed in 1986. It was thus a
blueprint approach for later IRDPs and was important for that reason alone. The strategy
followed in Kurunegala was to upgrade the small holder farming systems prevalent in paddy
and coconut production with better techniques and increased input use through project
intervention and to raise production.

55
One component of this KIRDP is of particular interest to this study: the rehabilitation of
irrigation tanks. The Appraisal Report (World Bank 1979) highlighted two main problems in
irrigation schemes in the Kurunegala District:
a) inefficient use of rainfall water and a wasteful use of stored water, and
b) inequitable water distribution within the irrigation schemes.
The former was said to be due to the priority given to chena cultivation over paddy, the
consequent delay in paddy cultivation and dependence on tank water in Maha season which
finally led to a low cropping intensity in Yala season. In this project, once the physical
rehabilitation work was done, it was intended to introduce a system of controlled water use to
prevent crop losses and raise cropping intensities. Tank rehabilitation/improved water
management was financially, the largest component in the KIRDP and furthermore was to be
the basis of other components of the project on which higher productivity, employment and
other living standards would depend. The expenditure for this component was 34 per cent of
the total (Malagoda 1986).
For improved water management, the Project adopted the now familiar Walagambahuwa
model.
Experience with this model in the KIRDP (Malagoda 1986) was that “only a few farmers
practiced it in the project area”. Two major reasons were given for its rejection:
a) Irregular nature of rainfall, which often caused crop failures.
b) Heavy weed growth.
Also, dry land preparation required tractors for ploughing and limited access to tractors and
cash costs discouraged tractor use. No positive acceptance of dry sowing was observed in
the study area.
A later evaluation study (Asoka et al. 1988), in reviewing component-wise target
achievement of the KIRDP, reported first, that the envisaged water management programme
could not be implemented until very late in the project life (from around 1982 onwards).
Second, it reported that agronomists at Maha Illupalama “no longer advocated dry sowing as
a means of saving water under village tanks". Instead, the Department of Agrarian Services
had introduced their own systematic water management programme including cropping

56
calendars with specific dates for operations, rotational water issues, or issues according to
need. Thus, the KIRP appears to have been the first rehabilitation project that dropped the
Walagambahuwa concept. Accordingly, appraisal projections of ERRs do not need to be
reconsidered because of this factor. Rather, their achievement will depend upon the success
of the water management programme that replaced the concept.
The Gal Oya Left Bank Rehabilitation System
This project was otherwise named the Water Management Project in Sri Lanka. It was
designed to develop a replicable institutional capacity to manage large irrigation schemes
more efficiently and effectively with active farmer participation, an objective which a final
evaluation report believes was substantially achieved (Institute of Science and Technology,
1985). This project involved the rehabilitation of the Left Bank of the Gal Oya Irrigation
System that was originally completed in 1955 with a capacity to irrigate 42,000 acres. By
1980, it was estimated that only 30,000 acres could be adequately irrigated7.
The Evaluation Report (ISTI, 1985) concluded that the Project had been a success by any
reasonable standard. Rehabilitation of the system had been achieved, 370 farmer
organisations had been formed and were functional. The irrigated area had increased by
some 11,000 acres, and with changes in agronomic practices, yields and cropping intensity
had been increased. These achievements had produced an EIRR of 47.4 per cent, despite
ethnic disturbances to the Project. Such a result in terms of achievement of objectives and
such a high economic rate of return deserves consideration in the light of future investment
priorities.
The capital costs were larger than expected but were spread over 10 years rather than the first
2-3 years. The benefits, according to this report came sooner than expected and boosted the
discounted benefit stream. Cropping intensity rose from 129 per cent to 197 per cent by 1985
but was expected to average 175 per cent in the future (years 10 to 20). Yields increased
from an estimated 65 to 79 bushels per acre in 1985. This performance resulted in this high
estimation of the economic rate of return as against 23.3 per cent projected in the Project
Paper and 34.7 per cent projected in the Project Paper amendment. A few important
agronomic changes contributed to this:
- timeliness of land preparation.
7 Tilakaratne (1989) summarizes the history and accumulated weaknesses.

57
- reduction of time between land preparation and sowing. - enhanced use of fertilisers. - improved weed and pest control.
There was a modest achievement in diversification by 1985, with chillie (393 acres) and
green gram (605 acres). The Department of Agriculture (DOA) anticipated no significant
expansion until marketing and pricing policies were improved.
A more recent assessment of this project differed somewhat in its conclusions, based on data
collected by the ARTI, in its baseline studies, monitoring programme and final impact
assessment (Tilakaratne 1989).
First, the project was characterised as physical rehabilitation and modernisation for greater
efficiency. Modernisation included better water control with gates, regulators etc. and better
water measurement capacity with measuring devices, structures and techniques. It was
agreed that this programme had been largely achieved. Also, there was effective cooperation
of farmers through farmer organisations. It became possible to reduce water duties as a
consequence of these improvements and there was narrowing of disparities in water
availability. In the initial years to 1985 there was an unusually favourable water supply
owing to heavy rains. This was not expected to continue so a lower CI of 165 per cent was
assumed. Also, this analysis could suggest no clear yield trend for 1980-85, but projected
average yields for the project were a little lower in early years and little higher on maturity.
A shadow price for labour of 50 per cent of the market wage rate was assumed. Finally,
there was greater emphasis on capital costs in the earlier years.
In the upshot, the estimated ERR was only 17 per cent. This was of course very much lower
than the 47.4 per cent referred to above. However, it should be noted that the estimations of
the ERR by the evaluation team have varied greatly as follows: IRR Project Paper High 32.0 per cent Low 13.0 per cent Base Case 23.3 per cent
IRR Project Paper Amendment High 44.2 per cent Low 23.7 per cent Base Case 34.7 per cent
Final Evaluation 47.4 per cent

58
A precise explanation of why base case evaluations shifted from 23.3 per cent to 47.4 per
cent over the project period is not available. However, reasons were suggested as to why the
ISTI estimates were so high. First, an unrealistic exchange rate was used (US$1 = Rs.15.50).
Second, O&M changes were underestimated (Rs. 125 per acre as against Rs. 200 per acre).
Third, there was an exaggeration of the area that benefited.
4.5 Lift Irrigation Scheme (LIS)
Projections
One of the most interesting but least successful of the post-Independence irrigation projects
in Sri Lanka was the Lift Irrigation Scheme (LIS). This scheme has considerable
significance for this study, which is concerned to assess the potential of lift irrigation for
upland crops in Sri Lanka. The project originally envisaged provision of lift irrigation and
agricultural development for 13,500 acres comprising 6,100 acres of uplands in existing
settlement schemes of formerly landless labourers and 7,400 acres for settlement of
unemployed educated single youths.
The objective was to construct irrigation channels and provide pumps, pump houses and
water delivery structures to irrigate about 6500 acres of uplands in low areas in the Dry Zone.
These were at Vavunikulam (500 acres) in the north, Rajangana (3700 acres) in the north-
west, at Polonnaruwa (850 acres) in the east and Nagadeepa (1200 acres) in the central area.
It was designed to increase the production of upland high value cash crops, particularly
chillie and onions, for the domestic market, which were then mainly imported. It was,
therefore, also an early attempt to diversify agricultural production under irrigation. At
appraisal (IBRD 1968), cropping intensity for areas irrigated was projected at 133 per cent
and the ERR was projected to reach 16 per cent.
Performance
The basic concept of providing irrigation for upland crops was sound. However, it was
demonstrated that most of the conditions which would make such a project viable were not
met during or after implementation and the LIS was considered to be a failure, achieving an
ERR of only 1.3 per cent. The project was judged as non-sustainable (IBRD 1985).
In the early stages, one of the schemes was replaced by a more recently established
colonisation scheme (Nagadeepa). There it was agreed to grow tree crops, especially papaya,

59
banana and citrus under irrigation. Settlers arrived with the belief that they would grow two
crops of rice per year, but that was not possible owing to inadequate water and high soil
percolation rates, and many farmers had to seek supplementary employment in the dry
season. This particular part of the scheme was completed near the end of the project and
provided water for only 18 per cent of the potential command area. Subsequently farmers
were offered canal water for upland areas, which they refused because they had already
planted fruit trees that they did not wish to irrigate. They preferred traditional upland crops
in the absence of any familiarity with intensive chillie cultivation and did not wish to divert
water to these lower value crops. In 1981, all pumps were removed and this component of
the scheme was written off as a failure.
The northern scheme of Vavunikulam did develop as envisaged in the Appraisal Report.
This is a Tamil area where intensive vegetable cultivation was traditional and local lift
irrigation was not uncommon. Most of the 500 acres were planted with chillie, and from
1981, onions were increasingly grown. There was, however, a decline in LIS utilisation
either temporarily or permanently for reasons that were not clearly determined, though the
farmers were concerned about input costs including fuel, market prices and demand.
The Rajangana RB and LB scheme was a partial success, as the cultivation of chillie
gradually became more popular. But water supplies were limited in early years especially on
the RB. Greater and faster commercial chillie production was achieved on the LB.
The Youth Scheme in Polonnaruwa was partially and intermittently successful. Early, when
the farmers were provided with food supplements and other incentives, they used the system.
When full costs were imposed they ceased to use the pumps. They later returned when credit
for fuel was made available by the Bank of Ceylon and they produced chillie with efficient
pump use.
Overall, completion of civil works fell five years behind schedule and there was a substantial
cost overrun (79 per cent) owing to higher prices, delays and construction changes. By 1978,
only half of the target acreage of 6,500 acres were under irrigation and of this fewer than
1,500 acres were under chillie and onions. Excluding the Nagadeepa project, cropping
intensity was only 28 per cent, against a planned 133 per cent. There was inadequate
extension, a serious lack of institutional coordination between Irrigation and Agriculture
Departments and a considerable reduction in producer prices of chillie and onions.

60
Farmers’ decisions were also affected by the uncertain or very limited supply of water owing
to shortages at source, pump breakdowns, scheduling problems, poor farmer cooperation,
wasteful use or combinations of these factors, and by a serious under estimation of the
amount of water needed for chillie and onions. No scheme was immune from this problem,
but worst of all, the severity of shortage occurred in the early stages. Also, these crops are
capital and labour intensive and costs are too high for subsistence cultivators unless
supported financially. This problem is intensified with uncertain water supplies. Finally,
there was a cost/price squeeze with a rise in costs of production and a drop in chillie prices
during the period concerned. The two crops do give good returns but prices of both fell.
Thus, the LIS failed through a multiplicity of faults in both planning and implementation
stages.
The LIS was the largest lift irrigation scheme undertaken to date but it is by no means the
only one. A 1982 survey of lift irrigated agriculture lists these others. Although the total
area then of some 15,000 acres was small by comparison with the 1.4 million acres
cultivated in Maha and Yala seasons, it did contribute to highland (or subsidiary) crop
production (chillie, onions, cowpeas, green gram etc.) and furthermore there is much scope
for area expansion. If properly organised with modern irrigation techniques, this could be a
way of at least satisfying the expanding domestic demand for this particular group of food
crops. The use of lift irrigation for upland tree crops should also be explored.

61
5. Options For Investment In Irrigation
A major theme of this study is that a part of future investment in irrigation needs to be used
for the improvement of water management practices, as national economic benefits
associated with improved water management would be substantial. Technological
discussions within this chapter will enable this theme to be spelled out in later chapters.
This chapter examines options for investment in irrigation, ranging from new projects
within and outside the Accelerated Mahaweli Development Programme (AMDP) and the
Mahaweli project master plan, rehabilitation and modernisation of existing projects, minor
projects and ground water based irrigation systems. It considers the need for adoption of
new design concepts and new technologies in major irrigation schemes, and makes
recommendations amongst these options.
5.1 New Projects 5.1.1 Within the AMDP Areas Potentially Cultivable
A computer simulation study was carried out in 1985 within the Mahaweli Water
Resources Management Project, financed by the Canadian International Development
Agency (CIDA) (ACRES 1985). The study revealed that, assuming current water duties in
systems under the AMDP, there was sufficient water in the Mahaweli and allied basins to
support an annual cropping intensity (CI) of 2.0 (i.e., full Maha and Yala crops) in all
irrigation areas, with the exception of System H (Diagram 5.1).
In System H, even an overall improvement of 10 per cent in irrigation efficiency, with a
shift to a diversified Yala cropping pattern would be unlikely to result in a reliable annual
cropping intensity of 2.0. The main constraints to achieving intensity objectives in System
H were a lack of diversion capacity at the Bowatenna tunnel, a lack of adequate storage
capacity within System H itself and the excessive use of water under the gravity flow
system. It was found that only 65 per cent of the total area of System H could be cultivated
during Yala with an acceptable reliability of existing water duties. The study showed that
the economic impact of achieving a Yala cropping intensity of only 65 per cent is very
significant. A reduction from an annual CI of 2.0 to 1.65 results in an 18 per cent decrease
in average family income.

62
Supportable Irrigation Areas
The Acres study showed that substantial benefits could be realised by reducing irrigation
water duties in the Mahaweli Scheme with improved water management practices. It was
shown that:
- by achieving an increase in overall system efficiency of 10 per cent, reliable annual cropping intensity could be increased from 1.65 to 1.80 in System H and this would increase agricultural benefits in Yala from System H alone by an estimated Rs.47 million per annum,
- allowing more water to be routed down a higher generating head with efficient water use in existing areas would generate more power and greater benefits,
- higher efficiencies would reduce the number of years of water deficits in System D1 and C.
New Systems Development
It was planned to develop areas identified as Systems A, B, C, D, G and H under the
AMDP (Figure 3.1). Chapter 3 described the development of various Systems to Year
2000. The only Systems that have not been developed are Systems A and D. These are
discussed below.
a) System A
System A is the furthest downstream system in the Mahaweli Basin. It is bounded to the
west by System D and to the south by System B. A part of System A has now been reserved
for a wild life sanctuary. The net command area of System A, according to the NEDECO
study (1984) was 36,200 hectares but subsequent studies have estimated the net command
area at only 20,300 hectares, including the 7,000 hectares of the existing Allai scheme.
The ACRES study (1985) indicated that System A could be supplied without shortage for
the period of 32 years considered for simulation for the cultivation of the full potential area
of 20,300 hectares. Soils were found to be suitable for wetland rice cultivation. The areas
identified as suitable for upland crops were less than 1500 hectares, which ruled out crop
diversification in System A. As this area is in the actual delta of the Mahaweli, floods
might become a problem during Maha season and further studies of the drainage system
would be required. The head works of System A consist of a barrage on the Mahaweli at
Kandakadu. Figure 3.1 indicates the location of the barrage and the proposed main canal.

63
Diagram 5.1: Present and Additional Areas Under the Mahaweli Irrigation System

64
A feasibility report, prepared by Joint Venture Randenigala for System A, indicated an
economic rate of return of 14.2 per cent per annum. Sensitivity tests on changes in costs,
benefits and timing gave EIRRs in the range of 12-16 per cent, which showed that the
project was economically viable. This report recommended the project area should be
limited to Mahaweli Right Bank lands and should exclude Left Bank lands except for 3000
ha in the Verugal area below the existing spill structures. It also recommended rice
monoculture.
According to the JVR study, the financial investment, including monetary contingencies
over a period of six years would be Rs.6.6 billion for all components of the project. Based
on 1981 prices, it was estimated that public works would cost Rs.5.5 billion and the foreign
exchange element would be 66 per cent.
b) System D
System D has been sub-divided into Systems D1 and D2. The Parakrama Samudra Scheme
constitutes System D2. The other schemes namely, Minneriya, Kaudulla and Kantalai Tanks
fall under System D1. Apart from run-off from its own catchment area, System D1 draws
water from the Aban Ganga at Elahera. An anicut at Elahera diverts water through the
existing Elahera-Minneriya Yoda Ela. The Kantalai Tank is supplied from Minneriya Tank
through the existing Minneriya-Kantalai Yoda Ela, while Kaudulla Tank receives overspill
from Minneriya Tank through Aggalawan Oya. Parakrama Samudra receives additional
supply from the Aban Ganga at Angamedilla anicut.
An additional area of 10,000 hectares has been identified for possible development in the
Kaudulla Scheme in System D1. This would bring the total irrigable area to be served in
this scheme to 14,600 hectares. However, the ACRES study found that the expansion of
the Kaudulla Scheme would be subject to the following constraints on water availability.
- limited diversion capacity at Polgolla. - limited main system storage at Kotmale. - limited diversion capacity from Minneriya owing to the high sill level of the
Minneriya-Kantalai Yoda Ela sluice. - limited storage in the Kaudulla Tank. - priority given to meeting water requirements at Kantalai tank.

65
These factors limit the additional land area that could be developed in the Kaudulla Scheme.
This study indicated that an increase in area of only 2,500 hectares could be supported with
adequate reliability, which is far less than the area available. Expansion beyond this limit
would require the development of additional main system storage, possibly at
Moragahakanda. A second alternative could be to construct a dam and diversion on the Kalu
Ganga, which would supply additional water at the Elahera diversion. Under this
arrangement, however, Kalu Ganga flows would be unavailable for diversion at
Angamedilla. These expansion options were not investigated by the ACRES study.
The following potential system expansions were recommended within the limits imposed by
water availability:
System A: An additional area of 13,300 hectares identified for possible development would bring the total irrigable area to be served to 20,300 hectares.
System B: An additional area of 3,000 hectares, identified for possible development in Zone 4B would bring the total irrigable area to be served to 41,300 hectares.
System D: An additional area of 10,000 hectares, identified for possible development in the Kaudulla Scheme of System D1, would bring the total irrigable area to be served to 14,600 hectares.
Moragahakanda Project
In the Moragahakanda Project, it was proposed to build a rock fill dam to form a reservoir
across the Aban Ganga, which is the main tributary of the Mahaweli River. This reservoir
would supplement the irrigation needs of 62,200 hectares of existing and new lands in
Systems D and C. It would also facilitate the operation of a powerhouse.
The ACRES study found that the expansion of the Kaudulla Scheme in System D1 would
have to be limited to 2,500 ha in the absence of additional main system storage. It would
be possible to develop a full potential area of 10,100 ha in System D1 if this reservoir was
constructed. According to revised estimates this project would cost US$310 million.
5.1.2 Outside the Accelerated Mahaweli Program
There were a number of new proposals made in the Master Plan that were excluded from the
AMDP.

66
The South East Dry Zone Diversion
In addition to the systems expansion discussed in the previous section, the ACRES study
(1985) found that a substantial volume of water could be diverted at Minipe by new
conveyance works without adversely affecting the water supply to existing irrigation
projects.
It was therefore proposed to divert this uncommitted water to the South East Dry Zone
(SEDZ) which is located south of the Maduru Oya reservoir. The SEDZ comprises the
Gallodai Aru Maha Oya, Rambukkan Oya, Magalwattawan Aru, Navakiri Aru and Andella
Oya. Of the 225,290 hectares of gross area available in the basins, 82,890 hectares were
located in the command areas of the proposed irrigation systems. The total irrigable area of
40,000 hectares were divided into two sub-systems:
- SE1, which consists of the Gallodai Aru basin, with a net irrigable area of 15,500
hectares, including the existing Rukam Scheme, and
- SE2, which consists of the Maha Oya, Rambukkan Oya and Magalawatawan Aru basins, with a net irrigable area of 24,500 hectares, including the existing Unichchai Scheme.
Other proposals were made that require the construction of costly diversion works, storage
reservoirs and tunnels, with complementary investment in irrigation infrastructure.
Feasibility studies are required to ascertain the economic viability of these proposals.
5.2 Other River Basin Development Proposals
5.2.1 In the Mahaweli Master Plan
In the original UNDP/FAO study there was a proposal to divert Mahaweli waters to the
North Central Province beyond Anuradhapura, to Systems designated as I, J, K, L and M
with a total potential irrigable area of approximately 190,000 hectares (Table 5.1).
The supply of water to these systems would require the construction of approximately 215
km of canals and several pumping stations.
The Transbasin Diversion Study completed in 1981 concluded that the development of these
Systems would not be economically justified.

67
Table 5.1: Total Areas under Other Proposed River Basin Development System Proposals within the North Central Province
System (ha) Gross Area (ha) Command Area Area (ha)
Irrigable
I 144,550 79,250 49,350
J 82,430 54,420 34,200 K 31,110 15,060 9,800
L 96,370 70,520 42,650
M 160,100 94,900 54,150
Total 514,560 314,150 190,150
Source: UNDP/FAO study.
5.2.2 Outside the Mahaweli Project Master Plan
a) Kalu Ganga Diversion
A feasibility report on multipurpose development of the Nilwala Ganga, Gin Gange and Kalu
Ganga basins showed that the transbasin diversion of Kalu Ganga waters to the South Eastern
Dry Zone (SEDZ) will increase the internal rate of return (IRR) in relation to the within-basin
development concept.
The Master Plan study for the Electricity Supply of Sri Lanka (1989) also considered the
diversion of Kalu Ganga waters to the SEDZ. This proposal included construction of five
major reservoirs across the Kuda Oya, Manik Ganga, Kubukkan Oya and Weli Oya.
b) Nalanda Diversion
In this proposal, the waters of the Nalanda reservoir in Matale district could be diverted
through a tunnel and a powerhouse to Kurunegala District. The water would be diverted to
Kimbulwana Oya and to a new reservoir on Kimbulawana Oya approximately 6.5 km
upstream of the existing Kimbulawana tank. This would allow an increase in, and
improvement of, the reliability of water supply to existing major tanks, as well as an
expansion of the irrigable areas in the central Kurunegala district.
The main project components would be:
- an earth-fill dam on the Kimbulawana Oya, creating the "Ragedara" reservoir,

68
- a diversion weir approximately l km upstream of the existing Diyatura anicut on Kimbulwana Oya, for diverting flows into the northern and southern transfer canals,
- a northern transfer canal from the Ragedara reservoir to the existing Hakwatuna Oya reservoir,
- a southern transfer canal from the Ragedara reservoir to the existing Batalagoda tank, and
- secondary and tertiary works to serve the areas under command.
The scheme would allow intensification of existing irrigated agriculture on approximately
9,100 net hectares and development of a new irrigation scheme on about 3,200 net hectares.
The overall cost excluding Ragedara Dam was estimated at US$11.2 million with a present
value of US$14.3 million assuming a four-year construction period. The net present benefits
from this project were estimated at US$43.4 million and the present worth of the project at
US$7.4 million.
In Maha season, 77 per cent of cropped area in this region is under paddy, with the rest under
vegetables, green gram and cowpea, plantain and maize. In Yala, about 50 per cent are under
paddy, 20 per cent under vegetables and other subsidiary crops. Some 60 per cent of the
project area may comprise LHG soils though some of the lowlands may be alluvial. The rest
are RBEs.
The proposed cropping pattern would have all land under paddy in Maha season. In Yala,
50 per cent would be under paddy and the rest under brinjal, green gram, cowpea, red
onion, chillie and capsicum. Cropping intensity was put at 1.85. The net present benefit
with the project using a 10 per cent discount rate is US$43.4 million. The overall cost
excluding the dam has a present value of US$11.2 million over a four-year construction
period. The power component of the project is promising and one of the best small-power
schemes in the country. The addition of irrigation and flood control benefits makes it one
of the most attractive water resources development projects in the country. For the central
Kurunegala district, it is the only project that could secure a surface water supply for
12,000 hectares of often drought stricken irrigation areas. Finally, this project rates very
highly amongst hydro projects according to system merits as assessed by the Master Plan.

69
c) Uma Oya Project
The head works of the existing Uma-Ela scheme lie downstream of the proposed UMA0063
hydropower project. A 16 km long winding channel, which almost reaches Welimada area,
supplies water to 405 hectares of paddy cultivation in steep terrain. The potential new
irrigable area is located uphill of the existing irrigated area.
The proposed irrigation development would include:
- improvement of water supplies to the existing Uma-Ela irrigation scheme.
- development of 492 hectares of new lands to the north of the existing scheme.
The overall cost of capital works for irrigation is estimated at only US$3.6m, with a Present
Value of US$4.3m assuming a three-year construction period.
Net present benefits from the project are estimated at a high US$12.2 million, and the Present
Worth of the project is US$6.9 million. These figures reflect the high potential value of the
use in this area of well-drained soils for crops such as potatoes, cabbage and tomatoes
(typical of the Nuwara Eliya district). Cropping intensity is assumed at 1.85 with vegetables
(and paddy) in both seasons.
The other interesting feature is the recommendation of a pipe-based tertiary distribution to
farms because of the terrain. This could provide an opportunity for introducing on-farm, on-
demand micro-irrigation as well.
Water released from the powerhouse would be adequate for irrigation so that the two
objectives of power generation and irrigation are complementary. However, this project is
listed at only 16th (of 25) in ratings out of all hydro projects according to system merits in the
Master Plan.
d) Loggal Oya Project
The potentially irrigable areas in this Project are located on the left and right bank of the
Loggal Oya, downstream from the proposed BADU013 powerhouse site.

70
Left Bank irrigation development would include the following components:
- improvement of irrigation water supply to the existing 800 hectare Komarikagama project, immediately downstream of the powerhouse.
- expansion of the irrigated area downstream of the Komarikagama project. The total new net irrigable area would be 2,413 hectares. The proposed cropping pattern would be (long and short-term) paddy only in Maha season. In Yala season, almost half the area would be under paddy and the rest under brinjal, tomato, beans, chillie, capsicum, cowpea and green gram, i.e., subsidiary crops typical of the Badulla district.
The canals, structures and on-farm development costs were valued at US$12.9 million with
operation and maintenance requirements of US$2.5 million, giving a total Present Value of
costs of US$15.4 million. The Present Value of Benefits was estimated at US$23 million
and Present Value of Project Worth was an estimated US$7.3 million at an assumed discount
rate of 10 per cent, making the project potentially attractive from an economic viewpoint.
5.3 Rehabilitation and Modernisation of Existing Projects
During the early post-Independence period, several irrigation schemes were restored and a
number of new projects, including major projects such as the Gal Oya Scheme and the Uda
Walawe Scheme, were completed. More recently, the Mahaweli Ganga Project for the
development of nearly 250,000 hectares of new land became the focus. Within this, nearly
50,000 hectares were developed during the last ten years.
At present there are approximately 520,000 hectares of irrigated land in Sri Lanka. Nearly 34
per cent of this, about 175,000 hectares, come under minor irrigation schemes. These are
managed by the Department of Agrarian Services. The Irrigation Department is responsible
for the operation and maintenance of nearly 300,000 hectares including all irrigation schemes
with a command area of more than 80 hectares. The Mahaweli Authority of Sri Lanka
manages another 45,000 hectares under the Mahaweli Project. Overall, about 80 per cent of
the total irrigated area of 300,000 hectares in Sri Lanka comes under major projects each of
which has a command area of more than 1,000 hectares. Total irrigated area under major
irrigation projects was about 203,000 hectares in 1975, but by 1985 it had increased to
277,000 ha.

71
5.3.1 Project Life of a Scheme
The first rehabilitation of major projects commenced in 1976 to benefit five tanks serving a
total of 12,600 hectares. In 1979, a rehabilitation project for Gal Oya commenced at an
estimated cost of 490 million rupees. This project was originally started in 1948 and
construction of an irrigation network continued through the 1950's until about 1965. It can
therefore be said that rehabilitation was necessitated after an operational life of 20-25 years.
The Uda Walawe Project was initiated in 1959 and development work continued up to 1979,
although it was scheduled for completion in 1972. A project was initiated in 1987 for the
rehabilitation of this project and work started in 1988 after 15 years of operation. It is
therefore safe to assume that Sri Lankan irrigation projects need rehabilitation after 20 years
of operation owing to poor on-going maintenance of the systems, which in turn is a
consequence of a lack of public funds allocated for this purpose.
5.3.2 Annual Requirements of Funds for Rehabilitation Works
With a total of nearly 300,000 hectares of irrigated land, it would be necessary to rehabilitate
15,000 ha annually to keep all major irrigation schemes in operational condition on the
assumption of a 20-year project life span. The total project cost of the Gal Oya rehabilitation
project was Rs.503 million for a command area of 24,300 ha. The average rehabilitation cost
was Rs.20,700 per ha in 1985 prices. For the Uda Walawe Project the estimated cost was
US$13.7 million for the benefit of 12,000 hectares, so the average cost of rehabilitation was
nearly Rs.38,000 per hectare in 1985 prices. The rehabilitation cost of the MIRP project was
Rs.26,000 per hectare in 1984.
Therefore, the average cost of rehabilitation can be taken to be around Rs.30,000 per hectare.
Hence, the total annual requirement of funds for rehabilitation works to maintain all major
irrigation schemes would be about Rs.450 million.
5.4 Recent Rehabilitation and Modernisation Projects
The first rehabilitation project, the Tank Irrigation Modernisation Project (TIMP)
commenced in 1976. This was t o benefit five tanks covering a total of 12,600 hectares. The
second project, the Irrigation Rehabilitation and Water Management Project commenced in
1979, was to serve 24,300 hectares on the left bank system of the Gal Oya Irrigation Scheme.
The Major Irrigation Rehabilitation Project (MIRP) was commenced in 1984 to serve seven
major tanks covering an area of 46,240 hectares. The Irrigation System Management

72
Program (ISMP) commenced in 1987 to serve 51,000 hectares. The Village Irrigation
Rehabilitation Project (VIRP) was started in 1981 to serve 31,500 hectares under minor
irrigation schemes. A VIRP Stage II serves 125 medium size tanks. In all, nearly 50 per cent
of Sri Lanka's irrigable area under major irrigation schemes has been subject to rehabilitation
and modernisation or improvement during 1970 to 1980.
The rehabilitation of the irrigation infrastructure usually means a restoration of the physical
system to its original design specifications that were based on the objectives, agricultural
practices, and water management practices at that time. But during the operational period
(usually more than 20 years) some of the project objectives might have changed along with
agricultural and water management practices. Therefore, the original specification may not
be appropriate for the changed conditions of the project.
Rehabilitation should provide an opportunity to reap the benefits from changes in technology
that have occurred since the inception of the project. Hence, modernisation of the physical
system may become necessary in order to improve upon the original design specification. As
restoration, rehabilitation, improvement and modernisation are frequently used in relation to
irrigation projects, the following definitions are given:
Restoration - restoring non-functional or abandoned irrigation projects to the existing and
original level of design specifications,
Rehabilitation - restoring the physical system to its original design specifications from the
present functional level of the system,
Improvements - Improvement of the physical systems of irrigation projects to current
design specifications,
Modernisation - Adoption of new technologies designed to maintain water level and/or
discharge in main and distributary canals or automation of canal systems using the
advanced concepts of canal and pipe line operation as discussed later in this chapter.

73
5.5 Need for Management Process Improvement
Until recently, irrigation rehabilitation was considered primarily to be a technical exercise to
improve the physical condition of irrigation systems necessitated by:
- ageing of systems.
- changes in demand pattern.
- increased costs of operation and maintenance.
- excessive operational losses.
- mismatches between demand and delivery.
- outdated system objectives and purposes.
However, recent studies have shown that physical rehabilitation of irrigation systems alone is
not sufficient to increase yields significantly and efforts to improve management are also
required. Hence, all recent rehabilitation projects have allocated a part of project budgets to
improve water management practices. Indeed, the main objective of the Gal Oya
rehabilitation project was to develop better water management practices. Studies of the first
rehabilitation project (TIMP) identified a need to look beyond purely engineering solutions
into the following areas:
- focussing on building farmer organisations.
- providing more adaptable agricultural technologies.
- incorporating farmer's knowledge and experience in designing rehabilitation
projects.
The TIMP contributed significantly to an improved understanding of the requirements of
rehabilitation projects in Sri Lanka. Many lessons learned have been incorporated into
planning and implementation of subsequent rehabilitation projects like MIRP and the Gal
Oya water management project. For example, more emphasis is now placed on software
solutions to improve the reliability and equality of water distribution in all parts of the
system. The need was recognised to organise water sharing programs and to work closely
with the engineers involved in the redesign and reconstruction of the canal network.
The Irrigation Systems Management Project (ISMP) was designed to continue testing and
improving the approach used for organising farmers of Gal Oya. In addition, the project has
attempted to develop strong farmer organisations and to develop a performance and financial
monitoring capacity.

74
5.5.1 Need for Selection of Appropriate Methods
There is typically considerable variation in water availability at the head, middle and tail
areas of an irrigation canal of a project. It is a common belief that the improvement of an
irrigation system alone will not ensure reliability and equality of water distribution. Hence,
strong farmer organisations are necessary to ensure such equitable distribution occurs.
However, there are other factors that need consideration.
Irrigation managers tend to believe that most problems in canal operations, such as inequity
and unreliability, enter the system at the secondary and tertiary levels, and the main canals
operate according to their design under steady flow conditions. After improvements to the
irrigation system, it is intended to ensure:
Reliability, by improving:
- water control capacity with control gates and cross canal regulators.
- water measurement capability by installation of measuring devices, structures and
techniques.
Equity of water distribution, through the introduction of strict rotational delivery
schedules with the cooperation of farmer organisations.
It is however, very difficult to maintain main canals under steady flow conditions. Variations
of flow occur owing to such factors as rainfall, opening and closure of off-takes, and water
demand variations. As all control gates and most regulators need manual adjustment,
frequent resetting of the gates becomes necessary to maintain canal water levels or discharge
through off-takes to ensure strict rotational schedules. This requires a large number of
trained and dedicated operational staff, a good communications system and transportation
facilities. In turn this will increase operational and maintenance costs of the project.
Effective farmer organisations lead to improved co-operation among farmers, and to
improved co-operation and communication between farmers and agency officials. Water
distribution at secondary and tertiary levels can then be handed over to farmers along with
canal maintenance. These improvements can lead to improved performance on a sustained
basis. The farmer organisation program of the Gal Oya water management project has been
fairly successful, but the experiences in other irrigation systems, such as Mahaweli "H" area

75
and Minipe were not encouraging. There are a number of other social issues that have very
important impacts on the effectiveness of farmer organisations.
As there is no guarantee that farmer organisations will be sustainable in the long run in all
irrigation projects, other options must be sought that will not require dependence solely on
the organisations, e.g., through:
- reliability and equity of water distribution.
- penalties (or disincentives) for over-consumption of water.
- flexibility in delivery to maximise on-farm yield (for crop diversification).
It is therefore recommended that at least a part of any rehabilitation project area, preferably
the head end areas, should be modernised by the adoption of advanced concepts of canal and
pipeline operation. These can have a decisive influence on the success of a project (see
below) or to allocate a portion of rehabilitation funding for a research program to identify
appropriate technology for irrigation system modernisation.
5.6 Other Issues Under Rehabilitation
The primary objective of any rehabilitation project is to improve and sustain the performance
of an irrigation system by appropriately upgrading the physical structures and infrastructure
(hardware) and the associated organisational structures and the management processes
(software). The following software solutions will also help to increase the efficiency of
irrigation water use:
- irrigation system management,
- computer modeling of canal operation and irrigation scheduling,
- on-farm development works to improve application efficiency,
- development of water user associations for equitable distribution of water,
- training of farmers with modern agricultural and water management practices,
- co-ordination between agencies,
- elimination of negative factors responsible for rejection of agricultural innovations
(uncertain water supply, limited land base and landlessness, mortgaging and leasing
of lands, indebtedness),
- systematic maintenance of irrigation infrastructure, and
- introduction of water charges.

76
The above issues will be discussed in this study. Chapter 6 will assess operation and
maintenance requirements of irrigation systems (O&M) within the context of improved water
management and farmer participation that will encourage cost recovery.
5.7 Minor Irrigation Projects
The land area provided with irrigation facilities in Sri Lanka is about 520,000 hectares of
which nearly 175,000 hectares are under minor irrigation schemes. The Agrarian Service
Act No.58 of 1979 defines a minor irrigation scheme as an irrigation work serving up to 80
hectares (or 200 acres) of agricultural land. The Ministry of Lands and Land Development
estimates that there are over 25,000 minor schemes in the country. A survey carried out by
the Department of Agrarian Services shows that there are 9,294 village tanks and 9,796 weirs
(anicuts) in working order with varying degrees of efficiency and cropping intensity. These
minor irrigation schemes play a vital role in Sri Lanka's economy. It has been estimated that
village irrigation accounts for 34 per cent of the 175,000 hectares under irrigated paddy
cultivation.
During the 1980s, the restoration of abandoned village irrigation works and rehabilitation of
working irrigation schemes became an important component of rural development in Sri
Lanka.
5.8 Ancient Irrigation Schemes
The remains of extensive and elaborate tank irrigation systems in the Dry Zone of Sri Lanka
are ample evidence of an ancient and advanced hydraulic civilisation. It is said that the first
irrigation tank was built early in the fifth century BC, with a 24 foot high and mile long bund.
The development of a hydraulic civilisation continued up to 13th century. At that time, there
were a number of major tanks in the Dry Zone, viz., Kalawewa, Minneriya, Parakrama
Samudra, Wahalkada, Padaviya and Giant's tank and a few transbasin diversions. The size
and extent of the cultural monuments of this period suggest a self-sustaining agro-surplus
economy built on the more fertile soils of the Dry Zone. The absence of irrigated upland
agriculture practiced on a sustained basis on the island over a span of nearly 1,000 years
should be noted. This ancient civilisation was centred on and sustained by irrigated lowland
rice cultivation. In addition, during the rainy season, coarse grains, gram, legumes and oil
and fibre crops were grown under shifting or chena cultivation.

77
As the average annual rainfall of the Dry Zone is about 1,500 mm (e.g., Anuradhapura has
56 inches), of which over 70 per cent falls during the northeast monsoon season (October-
March), it follows that the irrigation system that evolved in the Dry Zone maximised the use
of rainfall.
Most village tanks are shallow and have a widespread area of water compared with the area
irrigated and are replenished by local minor streams that are not perennial. As the capacity of
the tanks is small, water cannot be stored for the next cultivation season, so cultivation under
these tanks is usually limited to the Maha season. According to traditional cultivation
practices, when the storage in the tank is insufficient to cultivate the full command area, only
a part is cultivated at the head-end of the canal, but every farmer gets a piece of land to
cultivate in proportion to his land holding.
Careful observation of village tanks shows that most are connected in series or by parallel
links. Excess water from one tank can be sent to an adjoining tank with this arrangement as
shown in Figure 5.1 During a cultivation season, drainage water from the cultivated area
under a tank is stored in the tank below. This arrangement facilitates the re-use of drainage
water. During the rainy season, when a tank in the upper reach is full, excess water (or spill
water) is sent to lower tanks. A number of tanks connected in parallel are shown in Figure
5.1. With this arrangement, when a tank is filled, excess inflow to the tank could be sent to
an adjoining tank through a canal. This can be considered as a small-scale transbasin
diversion, as excess water of one stream is diverted to the adjacent stream. By combining
these two systems a very effective small tank system is formed, where a high percentage of
rainfall is stored for cultivation and return flows from the cultivation areas are used a number
of times.
Even small tanks in major irrigation schemes functioned in a similar way so as to increase
the re-use of water. Therefore, it is suggested in planning the rehabilitation and/or
modernisation of village tanks these tanks and their links should be considered as systems
instead of individual tanks. This will be further discussed below.

78
Figure 5.1: Village Tank Systems

79
5.8.1 Walagambahuwa Model and Its Application
The Walagambahuwa Village tank settlement is a typical example of tank based agriculture
in the Dry Zone. Its development was undertaken jointly by the Department of Agriculture
and IDRC Canada under a research program started in 1977. The objective was to develop a
new cropping system for small farmers. It was found that, by using dry tillage, dry seeding,
short duration varieties and a greater dependence upon Maha season rainfall, a rice crop
could be brought to maturity with minimum dependence on the tank, and sufficient water
could be saved for a second non-rice crop during the Yala season. In the early years this was
considered as a success story. Project results are given in Tables 5.2 and 5.3.
Subsequently, several irrigation projects (e.g., VIRP and TIMP) were designed and
implemented on the basis of the 'Walagambahuwa Model' as discussed in Chapter 4. The
economic findings of Table 5.2 showed that, with the Walagambahuwa approach,
rehabilitation of village and medium sized reservoirs would be economically attractive.
However, subsequent studies have revealed that farmers in Walagambahuwa returned to
traditional practices after a few years, mainly because Maha rains did not come in time as
expected. In their study, Panabokke and Balasuriya (1988) stated:
"At Walagambahuwa, a typical northern Dry Zone (DL1) tank village, owing to water
scarcity, a successful rice crop was obtained only once in four or five years. In this village
the Department of Agriculture (DOA) undertook a cropping systems research program from
1976-81, with the objectives of increasing water use efficiency and land use intensity.
Upasena (1986), reporting on these findings, stated that with dry tillage and dry seeding prior
to the main Maha rains (i.e., in September or early October, rather than the customary sowing
in November to December). With a short term duration rice variety (3 month), sufficient
water could be saved in the tank for raising a second low water consumption non-rice crop
such as a pulse in Yala season. However, extending these findings to other areas through the
Tank Irrigation Modernisation Project (TIMP) did not prove popular among farmers
(Ministry of Lands 1983, Abeysekera 1985, 1986). The main reasons were high cost of dry
tillage using tractors, heavy weed infestation, high cost of weed control, and uneven plant
stands due to erratic early seasonal rains. In summary, the high cost and risks were
unacceptable to small farmers" (p 44).
Abeysekera (1986) concluded that agricultural innovations including dry sowing, which
advance the sowing time using short season varieties and saving water from Maha to enable a

80
Yala crop, do not produce higher returns than those which follow the conventional practice of
planting a long season variety of paddy in late Maha (also see Abeysekera 1988).
Murray-Rust and P. S. Rao (1987) stated that farmers prefer to ensure one good wet season
rice crop, and use irrigation water for land preparation and long term (4.0-4.5 month) rice
varieties.
Table 5.2: Reported Differences brought about by the New Technology at Walagambahuwa
Traditional (Agricultural Practices) New Technology 1. Rice crop once in 5 or 6 years
1. Rice crop every year
2. No secondary crop 2. (i) Second rice crop every average year (ii) Second pulse crop every poor year
3. Rice production per acre per year – 20-25 bu (1,020-1,287 kgs/ha)
3. Rice production per acre per year – 70-80 bu (3,605-4,124 kgs/ha)
4. Risks involved high, no or very little investment in terms of cash inputs
4. Risks involved minimum, potential for investment in the rice crop
Source: Cropping Systems Project – Walagambahuwa, Department of Agriculture, Peradeniya, March 1988.
Table 5.3: Cropping Patterns Followed by Farmers Year Cropping Pattern Annual Precipitation Before 1976 Traditional pattern rice-fallow -
1976/77 Rice-Pulse 817 mm 1977/78 Rice-Rice-Vegetable 1,036 mm 1978/79 Rice-Rice 925 mm 1979/80 Rice-Rice 742 mm
Source: Cropping Systems Project – Walagambahuwa, Department of Agriculture, Peradeniya, March 1988.
Using traditional agricultural practices, rice cultivation usually starts in mid or late
December, about one month before Maha rains stop. When farmers start cultivation late in
Maha, the amount of tank storage is known and they can decide on the areas that can be
cultivated given the storage volume in the tank.
In review, the available evidence suggests that traditional practices are the most economical
in the long run in risky rainfall environments. It is suggested here that future VIRP projects
should only base project appraisals on this model if it can be shown that rainfall is reliable,
and risks in using the new practices are low.

81
Additionally, scientists have consistently found a high positive correlation between the
amount of solar radiation received by the rice plant during last 45 days before harvest and
grain yield (Figure 5.2). Solar radiation is quite low during the Maha season, mostly because
of the cloud cover during this period. The lowest value for solar radiation occurs during
December while the highest values occur in February and March. Therefore late cultivation
can gain the advantage of high solar radiation which is lacking with early cultivation and
short-term varieties.
5.9 VIRPs and Their Performance
There are nearly 20,000 village (minor) irrigation schemes in the country. Assuming a
project life of 25 years for a scheme, nearly 800 schemes must be rehabilitated annually to
keep the minor irrigation schemes in good operational condition.
The Government of Sri Lanka gives the rehabilitation of minor irrigation schemes a high
priority for agricultural development as the area under these projects accounts for 34 per cent
of the total area under irrigation. The Government channels funds through District
Development Councils, in addition to the rehabilitation projects undertaken by the Irrigation
Department.
In 1981, the World Bank promoted a Village Irrigation Rehabilitation Program (VIRP) to
benefit 1,200 village works covering 31,500 ha at a cost of Rs.180 million targeted for
completion in 1985. The project was extended to 1992 owing to interruptions of work by
civil strife. Herath et. al. (1989) reported highly variable benefit/cost ratios of rehabilitating
most tanks and some were negative. They also indicated that most of the tanks rehabilitated
did not conform to the selection criteria laid down for such tanks.
One of the factors found to be relevant was average farm size. Herath et. al. concluded
"lowland farms under command area were found to be very small in size. In many cases
they were less than 0.5 acres. Therefore it is evident that these lowland farms cannot give
substantial support to family income even under best conditions and they tend to find other
lands outside the command area".
Under these circumstances it is clear that family income cannot be increased substantially
through the VIRP. A new development model, which considers highland cultivation under
rainfed conditions along with lowland cultivation of paddy, should be considered. As

82
Figure 5.2: Solar Radiation and Rice Grain Yield

83
pointed out earlier, it would be necessary to rehabilitate minor irrigation schemes at a rate of
800 per year to avoid deterioration of the total system through reduction of total cultivable
land. At present rates this would require an investment of Rs.240 million annually. To
maximise returns from this investment, including social benefits, a new approach along the
line of the Weli Oya model, which considers all tanks in the system and traditional
cultivation practices, should be developed. A research program is recommended along this
line to develop one or more suitable location specific models.
Muthukandiya and Weli Oya Models
The Dry Zone has an undulating landscape with a ridge and a valley pattern. The northern
dry zone has relatively low ridges and broad flat valleys, while the southern dry zone shows
few broad valleys. The soils in the dry zone are differentiated into categories. The convex
upper slopes have well drained reddish brown earths (Figure 5.3). The middle slopes have
imperfectly drained reddish brown earths (RBEs) and concave bottomlands are composed of
poorly drained low humic gley soils (LHGs) and varying areas of alluvial soils together with
saline/alkaline soils.
The Muthukandiya and Weli Oya models have been tried out to overcome the limitations of
the traditional dry zone farming approaches, i.e., minor tank and chena models, and to
stabilise shifting or chena cultivation under rainfed conditions. They try to match cropping
patterns with dry zone landscapes and also to maximise storage of rainfall in storage
reservoirs and as ground water.
The Muthukandiya Model
In this scheme a farmer is given 2.5 hectares of land and a pond about 15 ft deep is
constructed on his holding (Figure 5.4). The land is developed in such a way that all storm
water after rainfall is channeled to the pond. Soil conservation bunds are also formed to
prevent soil erosion and to increase the infiltration rate. By this method, ground water
recharge is maximised during the rainy season. Water from the pond (ground water) is used
during the dry season.

84
Figure 5.3: Profile of a Typical Dry Zone Landscape
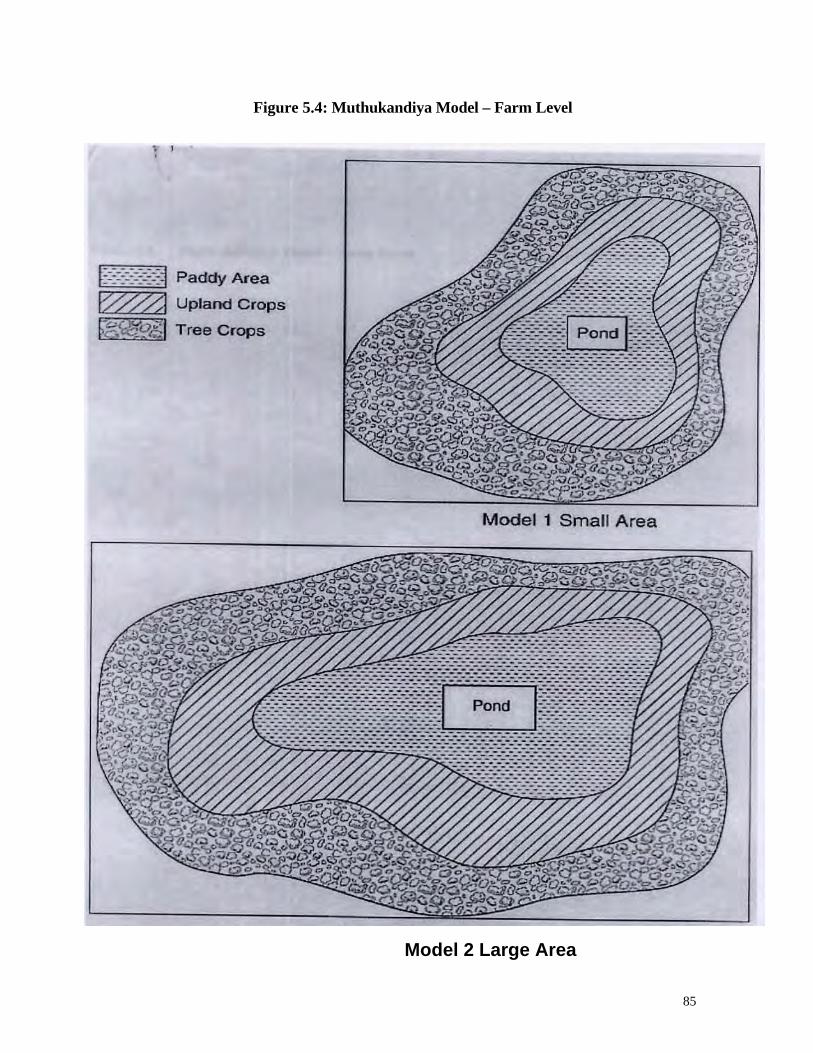
85
Figure 5.4: Muthukandiya Model – Farm Level
Model 2 Large Area

86
Figure 5.5: Muthukandiya Model – Village Level

87
With a little modification, such a village tank can be developed into a similar system (see
Figure 5.5) for village tanks that can be used to maintain a high ground water table as well
as to store surface runoff during rains. Usually LHG soils are available close to the stream
(Figure 5.5). Adjoining them would be moderately drained LHGs and then RBE soils.
When a bund is constructed across the stream, a reservoir is formed which would save
rainfall runoff. If a block of land is selected so as to contain LHG, moderately drained
LHG and RBE soils, crops could be selected to match the soil types, e.g., paddy for LHG
soils, annual crops such as chillie, and pulses, or vegetables such as citrus, mango or
cashew which can withstand prolonged dry periods for RBE soils. The tank would ensure
a high water table in the area and the down stream area could be used as common pasture.
This model, called the Muthukandiya model (Figure 5.5), would give year around income,
as different crops could be cultivated to match soil types. Moreover, it would encourage
efficient water use, as cultivation under the tank is not allowed. Land could be divided as
shown in Figure 5.5, so that each farmer would have access to water in the tank. The
cropping patterns for both systems should be developed to suit the typical dry zone landscape
(see Figure 5.3).
Weli Oya model
Figure 5.6 shows a typical example of the Weli Oya model. This is similar to the
Muthukandiya model described above except that paddy cultivation is allowed under the
tank with the stored water in the tank. Here also each farmer is allotted soils suitable for
cultivation of paddy, upland crops and perennial crops. This facilitates a suitable
cultivation pattern even during a dry year. This model can be improved by combining two
tanks, as shown in Figure 5.7. Two tanks will ensure a high water table between them. A
farmer can have a well on his land to get water for cultivation of upland crops and the
upper tank should ensure a high water table. Farmers can then cultivate non-rice crops
using ground water. Paddy cultivation can be allowed under the lower tanks during Maha
season.
Advantages of the Weli Oya model include:
- each farmer would have suitable land for rice cultivation, and home garden crops and each family gets about 2.5 hectares which is sufficient to generate a good income,
- it matches with traditional chena cultivation,

88
- soil conservation methods can be practiced which will also increase infiltration to ground water, and
- the farmer is gainfully employed all year round instead of only in the Maha cultivation season. As current VIRP projects using the Walagambahuwa model do not generate sufficient income, variations and combinations of this model may give better results and they will also improve cost recovery.
Studying the literature on VIRP projects the following shortcomings were identified.
- average farm size under the command area is typically very small, so family income will not vary or increase significantly through rehabilitation,
- cultivation development outside command areas was not considered under this project,
- identified tanks were considered as individual units and not as a part of a unified tank system,
- it was assumed that farmers would adopt agricultural innovations originating in the Walagambahuwa Project,
- based on the above assumption, the ratio of tank storage to command area was kept low, and
- farmers were not consulted in the process of identifying necessary improvements. Suggestions to improve VIRP project benefits include: - consider an identified tank as a unit of a small tank system and its contribution in
storing rainfall as a part of the tank system,
- explore the possibility of allocating lands adjacent to the command area for cultivation of other crops as in the Weli Oya Model,
- maintain a high storage to command area ratio (say 5 cu ft/acre) to avoid water shortage at the end of the season,
- assume that farmers will not change traditional cultivation practices as the latter have been proven to give greater benefits, unless rainfall reliability is demonstrated,
- increase farmer participation in the planning phase, and
- develop farmer organisations to improve irrigation water management.

89
Figure 5.6: Weli Oya Model

90
Figure 5.7: A Two Tank Version of the Weli Oya Model

91
5.10 Ground Water Based Irrigation Systems 5.10.1 Incidence of Ground Water
In general, ground water resources in Sri Lanka are widespread owing to the abundant annual
rainfall throughout the island. However, the quantity and the quality of ground water and its
development for irrigation depend mainly on the thickness, extent and localities of aquifers
and their hydrological characteristics.
In many cases of practical interest, ground water occurs in a water bearing layer of
relatively high permeability (e.g., a layer of sand) confined between two layers of very low
permeability e.g., clay layers (see Figure 5.8). The soil layer transmitting water is called a
confined aquifer when its pores are filled with water and when it is bounded on its two
sides by completely impermeable layers. When one or both of the layers above or below
the soil layer are not completely impermeable, but their permeability is very low compared
with permeability of the layer itself, this layer is then said to be a semi-confined aquifer, for
example, the Vanathavillu aquifer north of Puttalam.
When a cross section of a soil profile is considered (Figure 5.8) there is a level (ground water
table line) below which all pore space is filled with water and the soil is saturated with water.
This water-bearing layer usually rests on an impervious layer and this type of aquifer is
called unconfined.
It can be said that all shallow wells in Sri Lanka tap unconfined aquifers. When water
collected in a location is bounded by an impervious layer 'X' it is called a perched aquifer.
Deep wells constructed in metamorphic rocks usually draw water from this type of aquifer.
5.10.2 Geology in Relation to Ground Water
Crystalline rocks cover nearly 90 per cent of the land area of the island, irregularly covered
by an overburden of decomposed rocks and alluvial deposits, which seldom exceed 15
metres. Underlying the water bearing soil cover of generally mixed gravel, sands, silts and
clays, the basement rock strata of this area show deep irregularly weathered zones with open
joints, fissuring etc., often poorly interconnected. Thus deep ground water encountered in
this part of the island has insufficient yield potential for successful development of large-
scale agriculture. The other type of sub-surface in the Dry Zone is shallow ground water.
The availability of such reserves has not been adequately studied and thus the prospects for

92
Figure 5.8: Types of Aquifers

93
tapping this water for irrigation in the Dry Zone are uncertain. In his survey of available
evidence, Madduma Bandara (1974, 1977) suggests the strong probability of a high water
table below tanks which "provides a good starting point to explore the possibility of using
(shallow) sub-surface water for irrigation in the Dry Zone”. Large scale use would require
(1) an adequate supply, (2) suitable lifting techniques (3) a lift irrigation program to suit the
existing socio-economic organisation (4) substantial economic returns, and (5) no serious
unwelcome ecological or other consequences with extraction. In the Wet Zone, as a result of
evenly distributed rainfall, the overburden soil often retains sufficient water throughout the
year for domestic consumption and small-scale agriculture.
The remaining 10 per cent of the island consist of deep sedimentary formations in the north
and northwestern coastal belt (Figure 5.9), where the Miocene limestone formations
provide major karst aquifers. Development of ground water resources for agriculture in
this area is possible.
Areas identified for development include:
Vanathavillu Basin
The area underlain by the Vanathavillu limestone aquifer measures nearly 55 sq km (Figure
5.10). It has been estimated that approximately 24.6 million cubic metres of water flow
through the aquifer. An area of nearly 1620 hectares along the eastern boundary directly
recharges this aquifer with 6.2 million cubic metres. It is possible to increase this recharge
rate by the development of a belt along the eastern boundary of the aquifer using the water of
Kala Oya from which the flow has increased considerably as a result of return flows from
irrigation areas of System H.
This needs further investigation, but it is possible to increase the recharge rate so that more
land than planned could be brought under cultivation.
The development of this area should receive high priority for the following reasons:
- development costs per hectare are low compared to a new irrigation scheme,
- there is a lower rainfall during the Maha season than in other dry zone areas. Therefore, year round cultivation of upland crops is possible since crop damage due to heavy rains is negligible,

94
Figure 5.9: Areas Under Ground Water Investigations

95
Figure 5.10: Vanathavillu Basin
96
- people of this area are used to growing alternative (to paddy) crops such as chillie,
onions and potatoes, and they will not grow rice under irrigation. Hence net returns to
them and to the economy would be high,
- the high permeability of the soils is good for cultivation of horticultural crops such as onions. Also, day and night temperature differences are favourable for potatoes,
- this is a comparatively undeveloped area with almost flat lands, and
- there are other advantages associated with ground water development in this area.
Murunkan-Silavaturai Basin
This basin near Mannar (Figure 5.11) covers an area of 310 sq km. It is a water table
aquifer from which free water is available in the region of 5 to 10 metres depth. The quality
of the water is also very high. The total recharge of the basin is expected to be around 120
million cubic metres (80,000 acre feet) by direct precipitation and runoff from basement
areas. Pump tests have indicated safe yields of around 14.1 per second, so this area should
also be given high priority.
Puttalam-Palavi Area
This area covers approximately 80 sq km. There are a few flowing wells near the edge of
Puttalam lagoon at Palavi and within Puttalam town. As this aquifer is in a pressurised
condition, pumping costs are much lower than in other basins. As the potential development
area is large, a feasibility study is needed and recommended to formulate a development
plan. This also should be given high priority since it has the advantages mentioned under
Vanathavillu basin.
5.10.3 Other Areas Planned for Development
Potential ground water basins, namely Mulankavilu, Paranthan and Puthukudiyiruppu within
the Mannar-Mullativu limestone belt have been identified. These areas should be further
investigated in a feasibility study program to assess their optimum development potentials.
Jaffna Peninsula
The whole Jaffna Peninsula and its islands are composed of Miocene karst limestone and the
sandstones assume depths in all of around 243.8 metres. Recharge of these aquifers is

97
Figure 5.11: Murunkan Basin

98
from direct rainfall. As this area is already developed to a maximum, it may not be possible
to develop additional areas there.
5.10.4 Conjunctive Use of Ground Water
Conjunctive use of ground water in areas served by surface canals is possible as a supplement
to canal irrigation or for water table control with irrigation as a secondary benefit (e.g., for
crops like sugar cane).
In irrigated areas, recharge from canal irrigation will ensure availability of ground water. For
example, losses from the canal system are around 30 per cent. The application efficiency for
upland crops would be around 40 per cent. Percolation losses from paddy fields are nearly
30 per cent of their daily requirements. Therefore, average gross efficiency of a project area
would be around 40 to 45 per cent. The major part of these losses will appear as ground
water and drainage flows. These losses can be re-used for irrigation, either by pumping from
shallow wells or from drainage canals.
The total amount of reusable water is roughly 40 per cent of the losses or 25 per cent of the
irrigation issues as soil cover is shallow and the bedrock is impermeable. But there are two
practical problems:
- if the water requirement from ground water is distributed equally among all farmers, then each farmer will require a shallow well and pump to meet his needs (say 25 per cent of his total requirements),
- if the use of ground water is limited to certain areas it would be unpopular with farmers due to pumping costs and their costs would have to be absorbed by the Government. Hence development of large wells would be necessary. But this is not possible, as the rate of recharge is low since the wells are shallow and have low permeability. Pumping from drainage canals is one possible way of overcoming the above problems.
The use of ground water is possible in existing irrigation areas in the following situations:
- to solve tail end problems in field canals,
- to solve water shortages (usually limited to 2-3 weeks at the end of the cultivation period),
- when it is necessary to lower the ground water table for cultivation of alternative (non-rice) crops (e.g. sugar cane),
- pumping from drainage streams to irrigate large areas (say 20-100 hectares), and
- to serve highland areas.

99
The expansion of the Mahaweli canal system has changed the groundwater picture in the
N.W. Province and the Dry Zone. However, these changes are, with few exceptions,
restricted to the project (irrigation) areas and the development of groundwater use would be
limited to the cases given above.
Future projects can be designed to increase overall efficiency by using ground water
conjunctively with irrigation water when benefits from the additional areas cultivated offset
the pumping costs involved. Canal systems can even be designed to maintain a ground water
table at a suitable level so that farmers can pump water according to their requirements. As
pumping costs are involved, farmers will not pump more water than they require. They may
even choose to use high efficiency irrigation methods like micro (drip) irrigation to reduce
pumping costs. Such systems are highly efficient and are discussed later in this study.
5.10.5 Other Alternatives
Lift irrigation from canals can utilize a belt of land along main canals or transbasin canals
could be developed if it is planned at the start of the project. Rajangana lift irrigation project
funded by the World Bank (IBRD, 1985) has been considered as a failure. In existing
projects, this type of development can be reconsidered when present water duties are lowered
through improved water management practices that would economise on water. There would
then be additional water available in the system to develop new lands through lift irrigation.
Sub-surface reservoirs: The Dry Zone of the island has a large number of shallow tanks. The
water losses through infiltration into the ground may be in order of about 5-10 per cent of the
total storage. As rice is also cultivated under flood irrigation, seepage losses from paddy
fields are about 20 per cent of the water requirements. During the monsoon rains, a part of
surface runoff also infiltrates into the ground. Therefore the extent of ground water flow in
the Dry Zone needs further study to ascertain its development potential. As subsurface
reservoirs have distinct advantages a study along these lines would be worthwhile to identify
potential areas suitable for subsurface reservoirs outside major irrigation projects.

100
5.11 Need for Adoption of New Design Concepts and Technologies in Major Irrigation Schemes
5.11.1 New Design Concepts
Before 1970, irrigation systems were designed for rice cultivation, which is primarily an
aquatic crop that grows well under saturated conditions or with 3-5 cm of standing water.
Hence, irrigation systems were designed to supply continuous irrigation water throughout
the growing period. These systems did not have sufficient control structures or measuring
devices to issue water according to the need of the crop nor of the soils. When shortages
were experienced, a rotation among distributary canals was practiced.
When designs for Mahaweli areas were undertaken, it was assumed that upland crops would
be cultivated on well-drained soils during Yala season. It was also decided to limit the size
of a turnout area to 20 hectares in view of the proposed water distribution between farms.
This method looks attractive on paper, but efficient distribution of water within turnout areas
needs total cooperation from the farmers in the turnout, otherwise head end farmers get more
than their fair share. It therefore became necessary to establish farmer organisations at
turnout level for proper distribution of water. Such efforts have been made to organise farmer
groups at turnout level (maximum 20 farmers) for the last 10 years without much success.
An effective turnout, where water is distributed in the way envisaged at the planning stage,
does not exist. Now it is proposed to organise farmers at distributary canal level (80-200
farmers), as turnout level organisations cannot function without the support of head end
farmers of secondary canals.
Farmer organisations are now the most important factor for the smooth functioning of present
irrigation systems. Equitable distribution of irrigation water and the maintenance of field
canals will never be achieved without properly organised farmer groups. Farmers at the tail
end of field canals never know whether or when they will get their due share, and therefore
consider this system as very unreliable. If farmer organisations cannot be developed within
the next five years, it will be necessary for irrigation system planners to consider irrigation
systems, which can operate and function without farmer organisations.

101
5.11.2 Crop Diversification and High Reliability and Flexibility in the Irrigation System
Improvements in rice growing technologies and the development of new lands for
irrigation during the last two decades have resulted in near self-sufficiency in rice
production in Sri Lanka. Therefore, policies have shifted towards maximising the
economic utilisation of land and water resources and income of farmers, particularly by
growing non-rice crops in irrigated areas. It is therefore necessary to investigate the
potential for improving the manageability and performance of irrigation systems to meet
the specific demands of more diversified cropping in the dry season. In 1985, the Asian
Development Bank requested the International Irrigation Management Institute (IIMI) to
undertake a study to develop a practical technology for irrigation to achieve crop
diversification. According to the project co-leaders, "A major factor constraining the
farmers' ability to diversify their cropping pattern is the unreliability of supply at the farm
level" (Panabokke and Balasuriya 1988).
Future projects should therefore be planned to achieve high reliability and to minimise those
factors affecting reliability. Otherwise, farmers will not be motivated to grow non-rice crops,
which are a high risk venture where cash and labour inputs can be three or four times those of
rice. It is also necessary to have a flexible system, as crop water requirements and the
response to water stress by different crops vary with the growth stage of the crop and climatic
factors. Therefore, future irrigation systems should give farmers the flexibility to decide
upon the time of irrigation, the quantity of water to use and the duration of irrigation. Such
irrigation systems, which give the farmer full flexibility, are called "on-demand" systems.
Examples of this are low pressure pipe systems, free level canal systems equipped with
automatic downstream water level control gates, and lift pumps (or tube wells).
There are a number of constraints to diversification in existing irrigation projects, which have
been designed for the irrigation of rice. These can be avoided either by making the system
"on demand" or having farmer organisations share water within the command area of the
field canals/distributary canals.
5.11.3 Automation of Canal Systems
Upland crops have very specific water requirements for optimal production, and both
excesses and deficits in water delivery will affect yields. As a number of different crops are
cultivated in a large irrigation project on different types of soils, irrigation water is required at

102
3variable intervals, mostly during the daytime. Farmers may also use different modes of on-
farm water application methods. Surface methods, such as drip or sprinkler irrigation require
different flow rates at different locations. Moreover, the farmer may want to cultivate
according to his own crop calendar to benefit from high market demand or to avoid gluts.
Thus, the farmer requires flexibility in water distribution in terms of frequency, rate and
duration. The frequency of irrigation needs to be scheduled flexibly to prevent crop stress
and to avoid interference with other activities like spraying for weed control.
The rate of water delivery determines the uniformity of distribution and efficient use of
labour. Similarly, the duration or length of time that water is applied to a field needs to be
adjusted to avoid over or under irrigation. The ideal mode of water delivery to match the
above requirements is an "on-demand" system. The canal system, therefore, should be
designed to function as an automated irrigation system.
5.11.4 Methods for Automation of Canal Systems
Free level canals can be automated by installation of hydraulically controlled gates, so that
the canal system will behave in a fashion similar to one with a pressurised water piping
system.
Control technologies (technologies designed to maintain water level and/or discharge in open
canals as per given target) have been extensively used for surface irrigation in Mediterranean
countries with success, in Morocco in particular. The modern development of control
technologies implemented in this region started about 40 years ago. But in Asia, application
of these modern technologies is rare. If modernisation of irrigation systems is carried out on
an "on-demand" level for cultivation of upland crops, this technology can be used, as there
are distinct advantages over centrally controlled irrigation systems. The cost of this type of
system can be minimised by using upstream control gates from the main reservoir to feed
balancing reservoirs, and downstream water level control gates to distribute and control
waters from balancing reservoirs to the end of canals.
This hydraulic regulation offers a high degree of automation but without dependence on an
external source of energy. Furthermore, it requires minimal staff training. But care must be
taken in introducing these systems to Sri Lankan farmers. With the proposed irrigation
systems, the farmer is given freedom to take as much water as he needs at any time, and also
to select the crops he will cultivate. It is said that Sri Lankan farmers are inclined to grow

103
rice when there is a liberal water supply in the dry season, even though alternative crops
return greater net profits. Therefore, without volumetric billing, an "on-demand" system
would be a failure, as farmers would most probably cultivate rice even on light soils.
Another aspect to which attention should be paid is the tampering of irrigation systems by
farmers to avoid volumetric billing. With volumetric billing, a price can be placed on
irrigation water to encourage farmers to adopt efficient on-farm systems like drip, sprinkler
or furrows with precise land levelling, to increase application efficiency and reduce costs of
irrigation. It will also motivate farmers to grow crops that give high returns or increase
cropping intensity to maximise returns.
5.12 Future Project Development Scenarios with Alternative (non-rice) Crops
Most non-rice crops cannot be successfully grown when the water table is high. Rice is still
considered the best crop in both wet and dry seasons under heavy soil conditions (LHG
soils), although recently other crops for those soils have shown promise, where drainage is
adequate as will be discussed later. Therefore, cultivation of non-rice crops should be
promoted only on well drained soils (or light soils) during the dry season. As heavy rains
during the Maha season are concentrated only in October, November and December, there is
a nine-month dry period in which two crops can be easily raised. The rainy period can be
considered as a fallow period for non-rice crops.
It is therefore suggested that development of land in future irrigation projects should be
limited to areas with well-drained soils in the first stage. The balance of areas with heavy
soils can be sold to the farmers after a few years, either to cultivate rice or to grow pasture.
The analysis of a project in which only non-rice crops are grown during a nine-month dry
period would definitely give higher ERRs and cost/benefit ratios than one in which rice is
cultivated during the wet season and non-rice crops on light soils during the Yala season.
When land is reserved for future development in the project area it gives the following
additional advantages:
- progressive farmers with excess cash reserves can purchase land closer to their existing land, and need not go elsewhere to invest their money profitably,
- the development cost of land would be borne by farmers,
- there will be land for the second generation, and

104
- farmers may even develop heavy soils with adequate drainage for cultivation of non-rice crops.
In this case, storage reservoirs, main and branch canals will have to be designed to take
account of the total requirement in the project area.
First, consider a simple "on-demand" system that pumps from ground water (e.g., a shallow
well or tubewell). As pumping costs are involved, a farmer will not wish to pump more
water than is required and will also seek methods of reducing pumping costs through
efficient water application. Then new irrigation systems like drip irrigation can be introduced
showing their advantages including lower pumping costs. Most systems that involve
pumping costs at farm level are likely to be efficient systems as they are alternatives to
volumetric billing systems. If pumping costs are comparatively low, then costs can be
recovered by efficient introduction of a different tariff system.
When the present operation and maintenance costs of pumping are considered, the cultivation
of rice will not give adequate returns for pumped water. Therefore, such systems should be
limited only to areas with light soils.
Considering the facts discussed above, future projects should have the following features:
- first stage development is limited to areas with light soils (well-drained soils). Areas with heavy soils are reserved for future development and farmers will have the option to buy these lands,
- water levels in main and branch canals are controlled by hydraulically operated gates, and
- secondary canals are designed to maintain a constant level, and field canals are replaced by low pressure pipe systems with meters to measure volumetric discharges or water is pumped to farms from the secondary canals (or shallow dug wells on the farm), or
- a constant discharge module is fixed at each turnout and farmers are well organised at turnout level for distribution of water within the turnout for the secondary canal command area,
- precise land levelling is required to increase the efficiency of surface application methods, or drip/sprinkler irrigation methods are used,
- rice is not cultivated even during Maha season (or high rainfall period may be followed), and
- each area specialises in one type of crop.

105
5.13 Upgrading of Existing Projects
The objectives of upgrading a project's design and operation would be the same as those for
new projects, but implementation of actual physical improvements would be more difficult.
Built-in constraints and limitations in existing projects have to be identified, evaluated and
removed on a project-by-project basis. For some projects, significant improvements may not
be technically or economically feasible e.g., older long canal systems. It also may not be
practical or economical to replace the existing major control structures (equipped with large
conventional radial or sluice gates) by automatic hydromechanical equipment. A great
variety of modern concepts and associated technologies are available for canal design to
improve water management in irrigation systems, but no one concept or technology is
appropriate for all types of irrigation projects. It is therefore recommended to take maximum
advantage of hydraulic regulation in the design process.
5.14 Major Recommendations
Major recommendations arising from this examination of options for investment in irrigation
include:
1. Among major schemes within Mahaweli, decide whether or not to proceed with the Moragahakanda, and the SouthEast Dry Zone Diversion.
2. Outside Mahaweli, decide on major schemes including the Diversion of the Kalu Ganga to the SouthEast Dry Zone and the Diversion of the Nalanda to Kurunegala.
3. Give a high priority to planned rehabilitation and modernisation of all major tanks. This would involve 15,000 hectares annually at a cost of Rs. 30,000/hectare and would need an allocation of Rs.450 million annually.
4. Give a high priority to planned rehabilitation and modernisation of all minor tanks. This would involve 800 annually, and at Rs. 30,000 per hectare, would require an annual allocation of Rs.240 million.
5. Give high priority to the development of location-specific sustainable models of water conservation and storage in tanks to maximise efficiency of use for irrigation, e.g., Weli Oya and Muthukandiya models. This would also require study of crop production systems appropriate for each model.
6. Give high priority to the development of groundwater based irrigation schemes. Suggested locations are the Vanathavillu Basin (with investigation), Murunkan-Silavatirai Basin, the Puttalam-Palavi area (needs a development plan) and a feasibility study for the Mulankavilu, Paranthan, Puthukudiyiruppu areas.

106
7. Invest in the conjunctive use of groundwater in the Mahaweli settlement areas, both below and above canal command areas. This would entail a study of sub-surface groundwater reserves there (and elsewhere in the Dry Zone outside major irrigation project areas).
8. Give priority to research in on-demand delivery systems both to the farm (hydraulic control systems) and on-farm (micro-irrigation systems) for existing schemes, and in the design of new schemes and rehabilitation plans, in conjunction with research in a program of crop diversification (discussed in Chapter 7). It will also greatly assist in the problem of cost recovery.
9. Give first priority to the development of well-drained soils in recently completed irrigation schemes, as irrigation of these high value crops will earn high financial and economic returns.

107
6. Operation and Maintenance Requirements of Irrigation Systems 6.1 Introduction
Until 1984, the entire responsibility for financing and implementing the operation and
maintenance programme of major irrigation schemes up to the distributary channel level lay
with the state and the Department of Irrigation. The O&M of field channels were the
responsibility of the farmers. Over the years it was found that the financial burden on the
state for O&M expanded and the required funds could not be generated in full within the
government budget.
In 1984, the government introduced an O&M fee to all major irrigation schemes. The
average cost of operating and maintaining an acre of irrigated land within major irrigation
schemes was estimated to be Rs. 200 per acre. However, government policy was to begin
recovery of O&M cost at the rate of 50 per cent, which would eventually be increased to
cover the full amount. Accordingly, the fee payable by farmers was set at Rs. 100 per acre in
1984. Actual collections subsequently began to diminish at a rapid rate so the original
proposal to increase the O&M fee annually was not implemented.
This chapter comprises two parts. The first reviews O&M requirements and the past record
of fee collection in Sri Lanka under traditional systems of rice based irrigated agriculture.
The second is concerned with O&M under modernised irrigation systems and more
diversified irrigated agriculture. The review of the past is based upon the findings of a 1989
consultancy (TAMS, 1988) which undertook of field survey of 1000 respondents in twenty
major irrigation schemes in Sri Lanka, and upon a review of literature on this topic.
6.2 O&M in the Past
The major socio-economic issues relevant to the problem of O&M fee collection are
discussed under the following themes in this section.
- the need to collect O&M fees,
- the ability of water users to pay fees,
- their willingness to pay,
- actual payment of fees, and
- how, when and how much to collect.

108
6.3 The Need to Collect O&M Fees
The need to collect O&M fees arises from the inability of the state to generate and allocate
sufficient funds to operate and maintain major irrigation schemes at an optimum level.
Allocations received for O&M of major irrigation schemes were only 51 per cent of
requirements from 1984 to 1988 decade (Resource Development 1978-1987, Ministry of
Lands and Lands Development). The total amount of funds required for O&M in this period,
was Rs. 735 millions. In 1988, the allocation received was the lowest amount and was only
39.7 per cent of the estimated requirement (Rs. 182 million).
The direct consequence of the failure to allocate sufficient funds for O&M over the long run
has been a rapid deterioration of irrigation infrastructure. This has resulted in reduced water
control and has created disparities in relation to adequacy, reliability and equity in the supply
of water within major irrigation schemes. As noted earlier in this study, about 15,000
hectares need rehabilitation annually if present levels of productivity are to be maintained.
This would require approximately Rs. 450 million at present prices. Obviously, a more
effective maintenance regime would reduce the annual cost incurred on rehabilitation, at least
in the medium and long term if not in the short run. Thus, in this way it may be possible to
reduce the total expenditure incurred on O&M plus rehabilitation.
A strong economic argument in favour of pricing services or commodities is the need to
ensure optimum resource allocation in production. Thus, volumetric pricing of irrigation
water, if feasible, can ensure that wastage of water is minimised. In other words, if farmers
have to pay for the amount of irrigation water consumed, they will be motivated to use only
that quantity, which will equate the marginal productivity of water with its price. However,
irrigation water within gravity fed irrigated projects serving a large number of small farmers
exhibits many characteristics of a public good and therefore, volumetric pricing is not
feasible. Hence, O&M fees are based on the area of land cultivated irrespective of the
volume of water consumed. In economic efficiency terms, area based O&M fees have the
exact opposite effect on water users, i.e., they are inclined to use as much water as possible
for the given fee in the absence of physical, administrative, legal or social restrictions to
prevent them.
In recent years many researchers have suggested that in most developing countries macro-
economic policies have consistently been biased against the agricultural sector. Krueger et
al. (1988) found that, in spite of substantial subsidies given for irrigation, fertiliser and credit,

109
the overall effects of economy-wide policies in Sri Lanka have discriminated against the rice
sector, although to a lesser extent than against tree crops. To the extent such discrimination
prevails, the socio-economic justification for the collection of any fee is weakened.
However, such inter-sectoral biases are dictated by political realities and have to be accepted
as given in the short term. Therefore, suitable mechanisms have to be evolved within the
irrigation sector for the generation of the required funds.
6.4 The Ability of Water Users to Pay Fees
The ability of water users to pay a fee or any other levy related to irrigation has been a major
determinant in the decision as to how, when and how much to collect. Legislation or
administrative measures that force beneficiaries to pay/contribute an amount in excess of the
capacity of a majority can afford invite large scale defaulting. When large numbers default,
the enforcement of the law or administrative measures becomes impossible. After all, the
objective of constructing, maintaining and operating irrigation schemes is to allow the
maximum possible number of farmers to receive water and not to reduce the number of
beneficiaries. A historical review of irrigation legislation in Sri Lanka has shown that, even
in colonial times the state was sensitive to the ability of farmers to pay in enforcing irrigation
levies (Teams, 1989).
The ability of farmers to pay fees is determined by their surplus, which is defined as follows:
Farm family economic surplus = Total farm family income - Cost of living
Total farm family income is defined as the difference between gross farm income and the
cost of purchased inputs. Where off-farm sources of income are available, total farm family
income is the sum of the above and off-farm income. Total farm income is determined by a
wide range of factors that vary from scheme to scheme and also within schemes from one
location to another. Some of these factors are the area cultivated, cropping intensity,
cropping pattern, crop yields, and costs of production. Crop yield in turn is determined by
soil type, access to irrigation water, cultivation practices, agro-ecology of the area, etc.
Secondary information sources suggest that holding size and area cultivated, crop yields,
cropping intensities and profits have varied greatly between schemes (Tables 6.1 & 6.2) as
well as within schemes (Ekanayake 1987). Accordingly, it is clear that ability to pay varies
and therefore even a nominal fee may adversely affect the subsistence level of a sizeable
proportion of the farming community.

110
Table 6.1: Holding Size and Cropping Intensity in Major Schemes
Project Name District Year of Alienation
Holding (LL Ac.)
Size (HL Ac.)
Paddy area (acres)
CI in 1985/86
Nachchaduwa Anuradhapura 1925 3.25 0.4 6,263
Minneriya Polonnaruwa 1933 2.6 1.7 10,028 200
Minipe Stage I Kandy 1937 5.0 3.0 2,435
Parakrama Samudra
Polonnaruwa 1942 4.6 3.0 15,916 200
Huruluwewa Anuradhapura 1952 3.8 1.2 8,685 100
Kantalai Trincomalee 1953 3.0 2.0 7,463 183
Gal Oya Ampara 1956 32,643
Giritale Polonnaruwa 1956 5.5 3.2 3,756 200
Padaviya Anuradhapura 1956 5.0 2.0 13,000
Mahakand-arawa
Anuradhapura 1961 2.7 1.6 5.036
Rajangana LB Kurunegala 1965 2.0 1.1 5,510 200
Kaudulla Polonnaruwa 1966 3.0 1.4 10,454 121
Minipe
Stages III & IV
Matale 1968 5,294
Nagadeepa Mahawewa
Badulla 1968 1.9 1.0 4,028
Muruthawela Stage I
Hambantota 1969 2,458
Muthukandiya Monaragala 1980 3.4 2,043
Kirindi Oya Hambantota 1982 1.8 0.5 3,825
Ridiyagama Hambantota N.A. 6,770
Batalagoda Kurunegala N.A. 6,624
Nuwarawewa Anuradhapura N.A. 6,624
Kimbulawana Oya
Kurunegala 2.0 1.0 2,400 166
Notes: LL = lowland; HL= highland; and CI= cropping intensity. Source: - UNDP – SRL/84/037.
- Annual Plan 1987, Ministry of Lands and Development. - Land Commissioner’s Department.

111
Table 6.2: Profitability of Irrigated Paddy (per acre)
District Maha 1985/86 Yala 1985
Anuradhapura 2389.8 (939.8) 1832.8 (969.9)
Polonnaruwa 2695.2 (2010.9) 2386.4 (1603.1)
Kandy 2824.2 (888.0) 2380.7 (834.2)
Trincomalee n.a. n.a.
Ampara 1132.2 (526.3) 1687.3 (886.9)
Matale 3183.0 (2073.0) 1224.1 (886.9)
Badulla 3637.9 (1625.7) 1224.1 (191.6)
Hambantota 1275.5 (578.0) 2153.0 (1516.0)
Monaragala 1864.1 (557.8) 2537.9 (1006.6)
Kurunegala 3749.4 (2656.5) 4410.8 (3354.5)
Kalawewa 3490.4 (2523.80) 2729.9 (1829.8)
Udawalawe 1606.9 (1008.5) 1552.1 (819.6)
Note: Figures in brackets include the imputed cost of family labour. Source: Cost of cultivation of Agricultural Crops, Department of Agriculture, Peradeniya.
The analysis of actual payment of O&M fees in the 1984-87 period by farmers classed
according to their output showed an increasing trend of fee payment from low output to
higher output classes. This trend has sharpened over the years, owing to the rapidly
escalating costs of production of rice relative to its price.
6.5 Farmer Willingness to Pay Fees
The field survey explored the attitudes of farmers towards the payment of O&M fees. Some
94 per cent of sample farmers expressed willingness to pay O&M fees if the supply of water
is adequate. At first glance this appears to be at variance with their economic circumstances,
i.e., their ability to pay as discussed above. But their ability to pay at present is determined by
their incomes, which in turn are influenced to a great extent by the adequacy of irrigation
water and the reliability of supply. The reliability of water supply has implications for risk
aversion of farmers and therefore, influences yields and profits. Farmers responses to the
question of whether they were willing to pay O&M fees may have been based on the
potential yields and profits under an improved O&M scenario.
112
6.6 Actual Payment of Fees
Our review of the history of irrigation levies in Sri Lanka shows that farmers have been
willing to contribute and have contributed towards meeting the various costs of irrigation,
financially or otherwise. In recent times, with the bureaucratization of the management of
irrigation systems, willingness to pay and actual incidence of payments appear to have
declined.
Although 94 per cent of farmers were willing to pay an O&M fee if the water supply was
good, only 40 per cent paid in 1984. In 1987 this had declined to 10 per cent and today it is
effectively zero. This situation suggests first, that the collection mechanism is faulty and
second, that farmers are not satisfied that they get a service which deserves payment of a fee.
It was mentioned earlier that irrigation water is a commodity with certain "public good"
characteristics and therefore, enforcement of fee collection is difficult. Although there is
evidence of a decline in profits from rice cultivation, the rate of decline is certainly not as
steep as the drop in the payment of O&M fees. It is clear that the major cause of this decline
was not the profit rate alone. Where the enforcement mechanism for fee collection is weak,
it is good economic sense for a farmer not to pay for a service that could be obtained free. In
the gravity operated, surface irrigation setting for small farmers, the prevention of access to
water on grounds of default is virtually impossible unless cultivators are evicted. The
political will for such drastic action is not present at this time, and probably never existed in
the recent past.
The survey on which this section draws showed that farmers had sufficient reasons to feel
that water problems did not justify payment of fees at present (Table 6.3 to 6.6).
Thus, it is easy to understand why the rate of O&M fee payment declined when one
combines the fact that the enforcement mechanism was not effective with the dissatisfaction
that farmers had about the water service which discouraged voluntary payment.
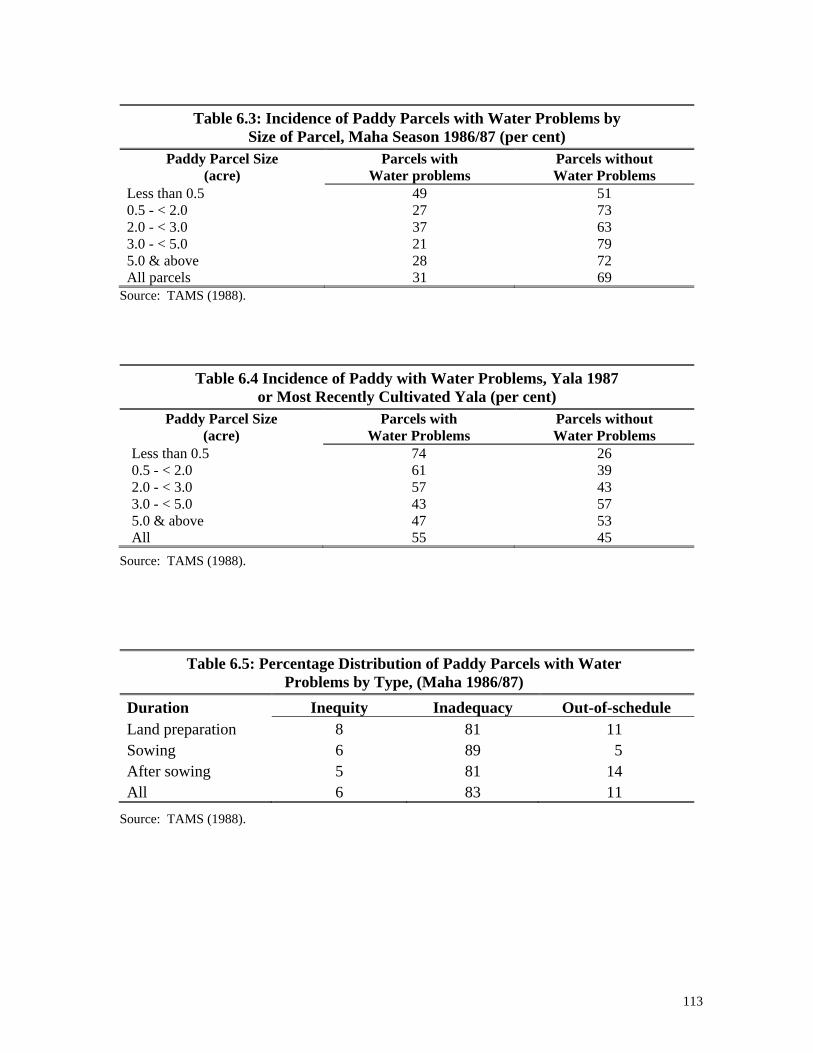
113
Table 6.3: Incidence of Paddy Parcels with Water Problems by Size of Parcel, Maha Season 1986/87 (per cent)
Paddy Parcel Size (acre)
Parcels with Water problems
Parcels without Water Problems
Less than 0.5 49 51 0.5 - < 2.0 27 73 2.0 - < 3.0 37 63 3.0 - < 5.0 21 79 5.0 & above 28 72 All parcels 31 69
Source: TAMS (1988).
Table 6.4 Incidence of Paddy with Water Problems, Yala 1987 or Most Recently Cultivated Yala (per cent)
Paddy Parcel Size (acre)
Parcels with Water Problems
Parcels without Water Problems
Less than 0.5 74 26 0.5 - < 2.0 61 39 2.0 - < 3.0 57 43 3.0 - < 5.0 43 57 5.0 & above 47 53 All 55 45
Source: TAMS (1988).
Table 6.5: Percentage Distribution of Paddy Parcels with Water Problems by Type, (Maha 1986/87)
Duration Inequity Inadequacy Out-of-schedule Land preparation 8 81 11 Sowing 6 89 5 After sowing 5 81 14 All 6 83 11
Source: TAMS (1988).

114
Table 6.6. Percentage Distribution of Paddy Parcels with Water Problems by Type, (most recent Yala)
Duration Inequity Inadequacy Out-of-schedule Land preparation 7 88 5 Sowing 6 87 7 After sowing 3 72 25 All 4 78 18
Source: TAMS (1988).
6.7 When, How and How Much to Collect
Irrigation schemes of Sri Lanka are very different from domestic water supply schemes. In
the latter, each consumer enters into a contract with the supplier and is billed on a volumetric
basis. In advanced economies/societies the consumer can even sue the supplier for any
lapses on his part. The technical design is such that all individuals get more or less the same
service. Sri Lankan irrigation schemes are not like this. The amount of water received is not
controlled fully by design, the actions of other users are an influence, and water supply to
individual farm lots is not on demand. Furthermore, the supplier cannot be held responsible
for any lapses in the availability of irrigation water to an individual.
The overwhelming evidence is that irrigation water is best managed when it is treated as a
social good and managed through social action. Hence the notion of a "user support system"
arises. Since all societies have "black sheep", legal measures are necessary to control them.
But the emphasis should be on user support systems leading eventually to "user owned
systems". Our analysis suggests that where farmers can decide or help to decide O&M
priorities and to determine the relevant fee, they are more likely to be responsible partners
within the O&M system, and pay O&M fees. In effect, such a situation could lead to
significant reductions in O&M costs in financial terms. For example, farmers themselves can
carry out most labour intensive maintenance activities during the off season. This is again
good economic resource management since the opportunity cost of labour during the off
season is near zero. Similarly, there are operational activities that can be taken over by
farmer representatives on a voluntary basis thereby reducing the cost in financial terms.
6.8 Recent Changes in Government Policies
Early in 1989 the GOSL adopted the following proposals made jointly by the Ministers of
Agriculture and Lands for participatory management in irrigation schemes:

115
- the need for participatory management be accepted as a policy by government with the objective of improving overall management and performance.
- the management principle of the village tanks be adopted in larger systems in the turnout areas, field canals and the distributary canals respectively.
- village level institutions be developed to provide for active farmer participation and involvement.
- farmers be encouraged to manage the O&M of distributary systems by contributing their labour and other resources. It is expected that such a development would enable the exemption of farmers from payment of O&M fees.
- Government funds continue to be made available to maintain and manage the Main System, namely the head works and main canals. It is estimated that this would amount to approximately 50 per cent of the total cost of maintenance.
- a legal framework be provided to recognise the rights and obligations of farmer organisations through amendments to the Irrigation Ordinance and to the Agrarian Services Act, as required.
- legislation be enacted to transfer, over a period of time, the ownership of the irrigation network below the D-canal level to farmer organisations when they are found to be ready to take on that responsibility.
6.9 O&M Options Under a Modernised Irrigation System
When an irrigation system is modernised to increase its flexibility by installation of
hydraulically controlled structures, dependence on manual adjustments is considerably
reduced. This has been confirmed by the findings of the Impact Study of the Rajangana Pilot
project implemented under MIRP (1989). The Impact Study gave only the results obtained
during 1987/88 Maha season, but it can be safely assumed that the operation costs will fall
even further when the irrigation staff and farmers become accustomed to the system.
The study found that the Avio and the Baffle Distribution are very convenient and easy to
operate because of the simplicity of the operational mechanisms compared with the
functioning of the standard weir regulators. The relative convenience of operation of the
various structures was assessed, by comparing the frequency of operating the structures in the
Pilot and Control areas. It was observed that the Avio gate needs only 6 adjustments
compared to the 30 adjustments required for the conventional turnout structure.
The report estimated the operational cost per turnout in the Pilot area at Rs. 284 against Rs.
483 for the Control area. It was concluded that modernisation reduced the operational cost to
59 per cent of that of the Control area. Overall, the case for modernised systems is very
strong on the ground of savings in operation costs.

116
7. Benefits and Costs of Rice Based Agricultural Development
This chapter examines Benefits/Costs of predominantly rice based agricultural development
with special reference to self-sufficiency in rice on the basis of productivity levels in 1980
and prospective levels with planned expansion in irrigable area.
The chapter comprises four sections:
A review of past strategies for irrigation, land settlement and rice production in terms of direct government intervention and indirect intervention in the form of subsidies etc.
An analysis of the self sufficiency issue in cereals, both on the supply side, with expansion of area cultivated, changes in cropping intensity, yields, technological changes, and on the demand side, with population increase, changes in per capita income, tastes and preferences, and prices. Projections are made for years 1995 and 2000 based on Sirisena (1988).
Social benefit/costs of rice production, including strategic interests, income distribution effects, nutritional status, financial and budgetary implications, and linkage effects with other sectors of the economy.
Private benefit/costs to rice growers in real financial terms. This component takes account of the fact that private benefit/costs diverge from social benefit/costs owing to various distortions in the economy and that farmer decision making is based on the former.
7.1 Past Strategies for Irrigation Land Settlement and Rice Production, Government Intervention
Irrigation water is almost exclusively used for rice cultivation with a few notable exceptions,
e.g., Jaffna Peninsula, Puttalam area and Mahaweli System H. Further, most major irrigation
schemes have significant settlement components.
Agricultural development in Sri Lanka has been overwhelmingly influenced by concern for
supporting the rice production sector. "Successive governments in Sri Lanka, particularly
after gaining independence in 1948, have implemented a number of policies and programs
for the rice sector to increase production, to reduce reliance on imports and to maintain the
nutritional intake of the population.
These policies and programs have included:
117
On the production side:
irrigation schemes and land resettlement projects,
research and extension programs,
provision of subsidised credit and fertiliser,
crop insurance, and
implementation of a guaranteed price scheme.
and on the consumer side:
provision of rice to consumers at subsidised prices under rationing, and
food stamp schemes."(Gunawardena and Quilkey 1988).
Achievements in terms of the construction of new projects and rehabilitation of existing
projects have been presented in previous chapters. In spite of these achievements, national
irrigation policy has been subject to constant criticism from various quarters. The
Agriculture Plan of the Ministry of Agriculture and Food of 1958 for example stated that.
"It has been shown that the costs of current policies for development of irrigation and
colonisation are extremely high. The annual production in the average Dry Zone colony
represents only about 16 per cent of the total capital outlay as contrasted with over 100 per
cent in the Punjab. Moreover, as these schemes are extended and marginal lands are brought
in, costs will progressively increase. Colonisation has also led to the emergence of new and
serious problems including the establishment of communities without social cohesion; the
phenomenon of landlessness in colonisation schemes which results in an unprecedented
number of squatters; the piecemeal restoration of irrigation schemes with probably permanent
damage to the water resources of certain catchments; the indiscriminate clearing of forests
and dangers of siltation of the existing reservoirs and channels. The continuation of present
policies will endanger not only the agriculture of Ceylon but will also seriously undermine all
efforts to develop the country on economic lines." (pp 5-6).
The Short Term Implementation Program of the Department of National Planning in 1962
drew attention to the fact that irrigation and land development continued to absorb a greater
part of investment in the agricultural sector. It stated that, “despite this considerable
investment, the output of this sector has not been such as to make any significant impact on
our food problem. It is time, therefore, to critically examine returns in relation to investment
made and to adopt a more realistic approach to development. This is all the more necessary

118
at a time of scarce capital and foreign exchange resources. Continued investment in a
traditional field quite unrelated to output can only be undertaken at the cost of funds to other
more productive activities" (p 119).
The evaluation committee appointed for the Gal Oya Project (Government of Sri Lanka
1970) raised a major criticism of the larger multipurpose irrigation schemes:
"Our detailed findings have revealed some striking features to which close attention must be
paid by policy makers in the future. The first is the poor benefit/cost ratio of the colonisation
element of the Gal Oya Project. The existing expenditures on the infrastructure and the low
productivity of the individual colonists have been clearly shown in our evaluation. This
finding makes it necessary that policy makers take a long, hard look at the advisability of
diverting resources to what is essentially a social welfare function in an economy where the
greatest need is to maximise production" (p 140).
The most recent of such criticisms was the Country Economic Memorandum of the World
Bank submitted to the Sri Lanka Aid Group Meeting in 1988 (World Bank 1988). The report
recommends that the share of irrigation/resettlement in future PIPs be reduced substantially
and that future investment should concentrate on high return projects in rehabilitation and on
the upgrading of existing irrigation schemes. Finally, it was suggested that a major
reorientation of the existing programs, and particularly reconsideration of plans to complete
the fifth dam under the AMDP (Moragahakanda), might be needed.
The pros and cons of large scale irrigation/resettlement programs such as the Mahaweli have
been examined in Chapter 4 above. It was argued there that judgement of the performance of
such projects should be based on the evidence of ex post evaluations and also that the validity
of their conclusions depended on the validity of assumptions used. In particular, it was found
that with correct assumptions, Mahaweli Project II would give a respectable rate of return of
10 per cent, and perhaps more if plans for crop diversification came to fruition.
7.1.1 Rice Production Policies
Other major components of national rice policy are the guaranteed price scheme, rice
marketing policies, institutional credit, the fertiliser subsidy and the research and extension
programs.

119
7.1.2 Guaranteed Price Scheme
The objectives of the guaranteed price scheme (GPS) were to assure producers of fair prices
and a ready market for their produce, to stimulate the production of food crops consumed in
the country, and to replace food imports by locally produced food with self sufficiency as the
long term goal. The GPS was used solely as a mechanism for supplying the rice rationing
scheme, particularly during 1970-77. Since 1978, the major objective of this scheme has
been to provide a minimum price insurance to farmers.
Over much of the period from 1952 to 1977, the GPS was above the import price at the
official foreign exchange rate (Figure 7.1). Between 1973 and 1985 the GPS was
substantially below the border price, and from 1972 to 1983, the average producer price was
also less than the border price. From 1983 to 1988, the producer price was higher than the
border price.
7.1.3 Effects of Rice Pricing and Marketing Policies
Rice pricing and marketing policies can be expected to have significant effects on farmers
and consumers. Taxpayers are affected to the extent that these policies involve a transfer of
funds from the national treasury to producers and consumers. The resulting net gains or
losses to society depend on the net effects on the producers, consumers and taxpayers.
Gunewardena and Quilkey (1989) studied the welfare effects of rice marketing policies in Sri
Lanka within a comparatively static partial equilibrium framework. This enabled
measurement of the welfare effects separately for the concessional (subsidised) market, open
market and the "arbitrage market". The arbitrage market refers to the selling of subsidised
rice in the open market by some consumers thereby resulting in a reduction in the economic
loss due to price distortions in the open market.
The outcomes of policy interventions were compared with a hypothetical situation where
Sri Lanka would be a net importer of rice under conditions of free (international) trade in
rice at world prices. The analysis showed that rice pricing and marketing policies in Sri
Lanka have favoured consumers and had an unfavourable effect on the welfare of farmers
since 1952. The unfavourable effect has been greater for small farmers than for large
farmers. However, because all farmers received benefits in their capacity as consumers in
the concessional market, it may well be that the eventual welfare losses of farmers were
reduced.

120

121
In addition, it was found that the maintenance of domestic rice prices below the world market
price resulted in substantial losses of production to the economy over time. The overall
conclusions of this study, therefore, were consistent with the hypothesis advanced by a
number of economists, that agricultural pricing and marketing policies in less developed
countries favour consumers at the expense of farmers.
7.1.4 Fertiliser Subsidy
The fertiliser subsidy represents one of the most important direct measures of state
intervention in the rice sector in Sri Lanka. This scheme, introduced in 1950, continued
virtually uninterrupted until 1990 when it was removed. Initially, the rate of subsidy was
one-third of the cost of fertiliser. The subsidy rate was raised to 50 per cent of the cost for
members of cooperatives. From 1963, all paddy farmers who paid cash for fertiliser became
eligible for the 50 per cent subsidy. From 1968, it was extended to farmers who bought on
credit as well. The subsidy rate remained around 50 per cent of the cost until 1977. In that
year, following the unification of the exchange rate, the subsidy was increased to 75 per cent
so that the domestic fertiliser price remained unchanged. The World Bank (1986) found that
the financial subsidy for fertiliser ranged from a high of 55 per cent for urea to a low of 20
per cent for rock phosphate, while the economic subsidy ranged from a high of 47.4 per cent
for TSP to a low of 19.7 per cent for rock phosphate.
A World Bank comparative analysis showed that the US dollar equivalent of the urea price to
Sri Lankan farmers was lower only in Burma and Indonesia in the whole of Asia, and that the
economic subsidy was substantially higher in Sri Lanka than in India, Pakistan and
Bangladesh. Further, only Indonesian farmers enjoyed a significantly better paddy to
fertiliser price ratio.
Since 1983, the administration of the fertiliser subsidy has been the responsibility of the
National Fertiliser Secretariat. According to the Director of the Secretariat: "The intention of
the government in providing fertiliser subsidies is to encourage the use of fertiliser in
adequate quantities in agriculture and to educate the people of its importance for efficient
cultivation. The government proposes to progressively reduce these subsidies with the
gradual realisation of this objective and to curtail its burden on the finance of the state"
(Kuruppu, 1984, p 3).

122
From 1983, the government imposed a ceiling of Rs.1 billion in nominal terms as the total
budgetary cost of the fertiliser subsidy. As a result, the government's objective of gradually
phasing out the subsidy may be achieved, owing to inflation and the increase in the total
quantity of fertiliser used.
7.1.5 Subsidised Credit
Agricultural credit is another important policy measure with potentially high benefits for
small farmer based agriculture. Adequate and timely availability of credit is considered
essential if maximum benefits are to be realised from new high yielding rice technology. The
history of Sri Lanka's formal agricultural credit schemes for the rice sector extends back to
the late 1940s. Originally, agricultural credit schemes were implemented through the
Department of Agrarian Services with government funds. In 1967, this operation was re-
assigned to the People's Bank. Subsequently, the Bank of Ceylon and other commercial
banks started to participate in the program.
In spite of its long history, the proportion of total rural credit supply accounted for by formal
sources remains small. In 1986, for example, only Rs. 450 million were directed to private
holders under Central Bank re-financing schemes while the total amount available for the
entire agricultural sector was Rs. 5,152 million. Only 42,000 farmers were given formal
agricultural credit out of a total number of farming families in the island of around 3,000,000.
Thus, it is clear that the formal rural credit program in Sri Lanka has failed up to the 1990s.
A high rate of default by farmers has often been cited as the major cause of such poor
performance. However, a number of recent reviews of the rural credit sector suggest that the
causal factors lie in a number of inadequacies within the organisation and operation of the
formal credit system and not with the borrowers (Ministry of Finance and Planning 1984,
FAO/ADB 1988, Fernando and Nanayakkara 1984, Fernando 1987).
Formal sector rural credit schemes in Sri Lanka have been conceived, designed and launched
by the state. Banks are then called upon to participate in subsidised credit programs with re-
finance facilities provided by the Central Bank. It is clear that commercial banks do not
consider rural credit as an important area of their operations mainly because of the small
margins allowed to them. As a result, formal rural credit in Sri Lanka is characterised by a
low volume of lending, high rates of default, a large subsidy element, and above all, the
reluctance of the rural banks to engage in this market beyond a minimum level.

123
There appears to an emerging consensus by 1990 that the subsidy element in the rural credit
programs should be gradually phased out, positive real interest rates should come into
operation, and in general give sufficient incentives for the commercial banks to engage
actively in this market.
7.1.6 Effects of Economy-wide Policies
Moore (1987) argued that government policy in Sri Lanka has supported farm level prices of
rice below world prices through the maintenance of an over-valued rate of exchange.
Krueger et al. (1988) studied the impact of sector specific (direct) and economy-wide
(indirect) policies on agricultural incentives for eighteen developing countries. The direct
effect was measured by the proportional difference between the producer price and the border
price (with adjustments for distribution, storage, transport, and other marketing costs). The
indirect effect was measured by identifying its two components:
(a) The impact of the unsustainable portion of the current account deficit and of industrial
protection policies on the real exchange rate and thus on the price of agricultural
commodities relative to those of non-agricultural tradables.
(b) The impact of industrial protection policies on the relative prices of agricultural
commodities to those of non-agricultural tradable goods.
It was found in almost all cases studied, that the direct effect is equivalent to a tax on
exportable goods, and that indirect effects also tax agriculture and dominate the direct effect.
Specifically, it was found that the direct effects on rice in Sri Lanka amounted to a subsidy of
18 per cent in 1975-79 period and to 11 per cent in the 1980-84 period. These levels seem to
be realistic given that there are substantial subsidies for capital, fertiliser and irrigation water.
However, the negative impact of the indirect effect was sufficiently large in both time periods
to produce significant overall negative protection for rice. The indirect effects were -35 per
cent and -31 per cent in the two periods, resulting in an overall effect of -17 per cent and - 20
per cent respectively. In other words, although sector specific policies have subsidised rice
cultivation, the positive effect from such subsidies have been more than offset by the broader
economy wide policies that have adversely affected agriculture.

124
7.1.7 Agricultural Policies of Developed Countries
The importance of such negative protection of rice on the impact of irrigation within the
economy is obvious. A more disturbing implication is that agriculture in general is possibly
subject to such discrimination within the normal policy framework of developing countries.
If this is the case in Sri Lanka, then crop diversification, which aims to optimise scarce land
and water resources of Sri Lanka, can encounter problems. Industrialised countries are
known to use a variety of controls such as price support systems, generous crop finance
programs and import controls against agricultural imports as a result of the powerful lobby of
the domestic rural and rurally-related industrial interests. The effects on domestic efficiency
of such distortions have a relatively small impact in these countries since the agricultural
sector is very small relative to the industrial and services sectors. The impact of these
controls on the predominantly agricultural DCs, which need overseas markets for their farm
produce is of great significance (Asian Development Bank 1988). In Japan, for example, rice
imports are largely prohibited and domestic rice growers are heavily subsidised. In USA,
sugar imports are controlled extensively by quotas and domestic sugar prices are supported
by crop financing schemes. In the European Economic Community, sugar, rice, fruits,
vegetables and derivative vegetable oils are controlled by the Common Agricultural Policy
(CAP) which applies variable levies to raise import prices to levels comparable to domestic
prices of farm products in the community.
Recent country studies on foreign trade barriers and export growth in Asia (Asian
Development Bank 1988) reflect the concerns of exporters from Asian DCs that agricultural
policies in advanced industrial countries have contributed significantly to depressed
international markets for such agricultural commodities as sugar and rice. The most
important offenders appear to be the USA and EEC. The provision of direct subsidies in the
form of highly concessionary crop loans, to encourage US rice exports under the US Farm
Security Act of 1985 is viewed as further depressing the already low international rice prices.
This hurts the efficient rice exporters in Asia such as Thailand and Pakistan. The EEC
similarly has depressed world sugar prices by "dumping" excess stocks of sugar accumulated
through official purchases to support domestic sugar prices. Such practices are not confined
to the EEC or to sugar alone.

125
7.1.8 Income Distribution
If the prevailing domestic macro economic environment continues unchanged, together with
that of international markets, the present trend of declining real profits from rice may persist,
and therefore, rural income distribution can deteriorate. Settlers in the AMDP, for example,
will experience lower rice incomes and increased poverty with unchanging yields. Solutions
to this lie in any one or more of the following:
- technological change,
- greater economic efficiency on farm,
- crop diversification, and
- changes in the mode of production.
A hypothetical case is worked out below using System H data.
7.2 Supply and Demand for Rice and Other Cereals
7.2.1 Supply of Rice
With the national self sufficiency target in sight, a number of independent analyses of
national rice production have been made (Ministry of Finance of Planning 1984, Abeyratne
1986, Department of Census and Statistics 1987). The last date for which the Ministry of
Finance and Planning (1984) has made a projection was 1991. Abeyratne (l986) gave a
projection to the year 2001. The study by the Department of Census and Statistics (l987)
provided an estimate for 1991 but with their estimation equation it is possible to project
production for the remaining years, up to 2001.
The three estimates are given in Table 7.1. The basis of the estimates in the last two studies
was trend line analyses. The former used a straight line (linear) trend approach, while the
latter fitted a parabolic function to the historical trend of aggregate rice production in all
categories of areas. The latter approach is justified purely on the higher R2 obtained rather
than on any economic justification. As the table shows, this attempt to maximise the R2 has
yielded a projection that is excessively optimistic. It is obvious that if the true trend in rice
production was parabolic then there will soon be a time when an infinite amount of the grains
could be produced on a given land area.

126
Table 7.1: A Comparison of Estimates of Rice Production (paddy million bushels)
Source Year of Study 1991 1996 2001 Census 1987 152.1
(1.96) 183.57 (2.36)
217.58 (2.80)
NPD 1984 142 (lower bound)
(1.83)
USAID 1986 139.2 (1.79)
157.7 (2,03)
172.5 (2.22)
Source: Ministry of Finance and Planning, 1984.
The approach of the Ministry of Finance and Planning (1984) was far more realistic. Its
estimate was based on targeted expansion in the land area cultivated and alternative
assumptions of expected yields. The performance of the rice sector up to 1987 with this
estimate showed that even the low estimate (given in Table 7.2) was not achieved.
Obviously, the underlining yield targets were not attained, and it is also known that area
expansion under state sponsored schemes, which is the major means of new land
development for rice cultivation in Sri Lanka, did not occur at the rate expected in the
1983/84 period.
Given that area expansion and average yield trends differ among major and minor schemes
and in rainfed areas, our own analysis disaggregated the three categories. Since area
expansion under major schemes (which account for 55 per cent of national rice production) is
entirely dependent on government programs, it was considered prudent to base the area
expansion estimates for this category on currently available data up from on-going and
projected programs (Public Investment Programme 1988-1992). Future area expansion for
the other two categories (minor schemes, and rainfed areas) was based on a linear trend line
analysis.
A base case for future expected average yields was obtained for major, minor and rainfed
areas by means of linear trend analysis separately, using historical data from the year 1974.
Disaggregated data for each category were not available prior to this date. Visual
observation of plotted aggregate national average yields since the 1950's show that an
upward shift occurred in the early 1970's (Table 7.4). This is to be expected since the Green
Revolution in Sri Lanka took place in the period extending from the late 1960s to the early
1970s. In fact, this explains the better statistical fit obtained by the Department of Census of
Statistics with their parabolic functional form. In our view it is wrong to consider the post

127
70s as a continuation of the pre-1979 trend as the underlying production technologies and
production functions were very different.
Theoretically, the expected average yield over time for a given technology can be expected to
take the form of a sigmoid curve. Immediately after introduction, a technology will normally
increase average yields very slowly, but yield will soon start rising, first at an increasing rate
and then at a decreasing rate until a yield plateau is reached at the maximum potential of that
particular technology.
Currently available varieties of rice can yield around 200 tonnes per hectare. How this
potential will be achieved, if at all, will depend on many factors, such as producer
Table 7.2: Projected Paddy Yields (bushels per acre)
Year Minor Irrigation Major Irrigation Rainfed Maha Yala Maha Yala Maha Yala
1986 70.7 58.4 80.8 73.9 53.9 47.4 1991 75.4 68.7 88.7 88.3 62.4 57.6 1992 77.4 70.4 90.6 90.5 63.9 59.2 1993 79.4 72.1 92.4 92.8 65.3 60.7 1994 81.4 73.8 84.2 95.0 66.8 62.2 1995 83.4 75.4 96.0 97.3 68.2 63.8 1996 85.4 77.1 97.8 99.5 69.7 65.3 1997 87.3 78.8 99.6 101.7 71.1 66.8 1998 89.3 80.4 101.4 103.9 72.5 68.4 1999 91.3 82.1 103.2 106.2 74.0 69.9 2000 93.3 83.8 105.0 108.4 75.4 71.4 2001 95.3 85.4 106.9 110.7 76.9 73.0 2006 105.3 93.8 115.9 121.8 84.1 80.6 2011 115.2 102.1 125.0 133.0 91.3 88.3 2016 125.1 110.5 134.0 144.2 98.5 96.0 2021 135.1 118.9 143.1 155.3 105.7 103.6 2026 145.0 127.2 152.1 166.5 112.9 111.3 2031 154.9 135.6 161.2 177.7 120.2 119.0 2036 164.9 143.9 170.3 188.9 127.4 126.6 2041 174.8 152.3 179.3 200.0 134.6 134.3 2046 184.8 160.6 188.4 211.2 141.8 142.0 2051 194.7 169.0 197.4 222.4 149.0 149.6 2056 204.6 177.3 206.5 233.5 156.2 157.3
Source: Department of Census and Statistics, Ministry of Plan Implementation. Progress in Paddy Cultivation and Production in Sri Lanka: Forecasts for the Future. New Monograph Series No.1, Colombo.
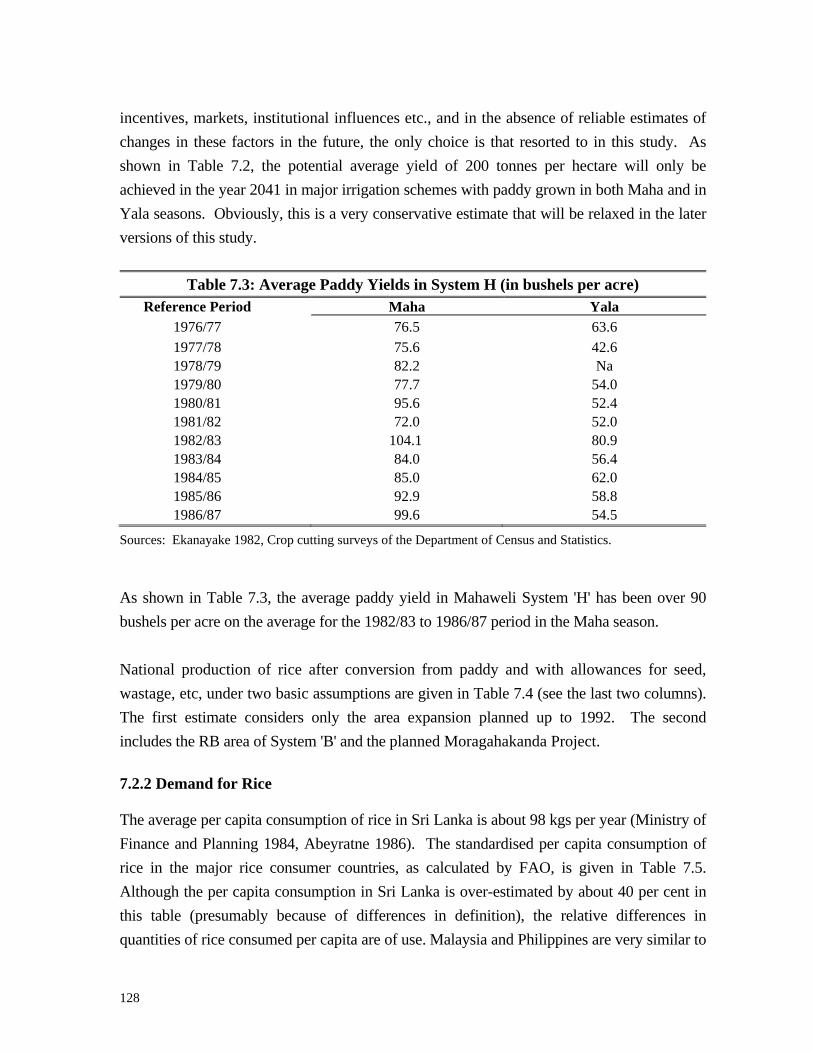
128
incentives, markets, institutional influences etc., and in the absence of reliable estimates of
changes in these factors in the future, the only choice is that resorted to in this study. As
shown in Table 7.2, the potential average yield of 200 tonnes per hectare will only be
achieved in the year 2041 in major irrigation schemes with paddy grown in both Maha and in
Yala seasons. Obviously, this is a very conservative estimate that will be relaxed in the later
versions of this study.
Table 7.3: Average Paddy Yields in System H (in bushels per acre) Reference Period Maha Yala
1976/77 76.5 63.6
1977/78 75.6 42.6 1978/79 82.2 Na 1979/80 77.7 54.0 1980/81 95.6 52.4 1981/82 72.0 52.0 1982/83 104.1 80.9 1983/84 84.0 56.4 1984/85 85.0 62.0 1985/86 92.9 58.8 1986/87 99.6 54.5
Sources: Ekanayake 1982, Crop cutting surveys of the Department of Census and Statistics.
As shown in Table 7.3, the average paddy yield in Mahaweli System 'H' has been over 90
bushels per acre on the average for the 1982/83 to 1986/87 period in the Maha season.
National production of rice after conversion from paddy and with allowances for seed,
wastage, etc, under two basic assumptions are given in Table 7.4 (see the last two columns).
The first estimate considers only the area expansion planned up to 1992. The second
includes the RB area of System 'B' and the planned Moragahakanda Project.
7.2.2 Demand for Rice
The average per capita consumption of rice in Sri Lanka is about 98 kgs per year (Ministry of
Finance and Planning 1984, Abeyratne 1986). The standardised per capita consumption of
rice in the major rice consumer countries, as calculated by FAO, is given in Table 7.5.
Although the per capita consumption in Sri Lanka is over-estimated by about 40 per cent in
this table (presumably because of differences in definition), the relative differences in
quantities of rice consumed per capita are of use. Malaysia and Philippines are very similar to

129
Sri Lanka in this respect while Burma, Thailand, Bangladesh and Indonesia consume 32 per
cent to over 100 per cent of the Sri Lankan level. Japanese consumption is about 22 per cent
less than that of Sri Lanka.
The above data illustrate that rice consumption is probably determined by a complex of
factors (historical, economic etc.) and that attempts to estimate future trends in rice
consumption in any country can be hazardous. Our approach, therefore, is to derive two
estimates of per capita rice consumption as follows, and then estimate the national demand
for rice using population projections (Korale 1988).
(a) Historical average per capita annual rice consumption (98 kgs), and
(b) Nutritional requirement of cereal consumption as recommended by the Medical
Research Institute (145 kgs).
These two are used as minimum and maximum figures/estimates in the analysis. Actual
consumption at any given time will depend on per capita incomes, prices of rice and other
grains, and changing tastes and preferences.
Given that wheat cannot be profitably produced in significant quantities in Sri Lanka, and
that wheat prices are determined in an imperfect international market primarily based on
political considerations, gradual substitution of wheat for rice is probably a prudent course of
action for Sri Lanka. Related issues will be discussed at length in the following sections.
7.2.3 Prospects for Meeting Domestic Demand from Local Production
The demand and supply position for rice in Sri Lanka (Table 7.4) shows that, if rice
consumption continues at the historical average of 98 kgs/capita, Sri Lanka will be self-
sufficient by 1991. But at that point, overall self-sufficiency in terms of cereals will be 71
per cent. Demand estimates are given for 98 kgs/capita, 107 kgs/capita, 112 kgs/capita and
145 kgs/capita in the table. The first and the last were described earlier. The second and third
are the medium and optimistic estimates used in the Ministry of Finance and Planning Study
(1984). These are useful in illustrating how self-sufficiency may be achieved at alternative
levels of consumption.

130
Table 7.4: Projections of Population, Demand and Supply of Rice, 1991 to 2016
Projected Demand
Population (million)
At 98 kgs/cap.
At 107 kgs/cap.
At 112 kgs/cap.
At 145 kgs/cap.
Supply (a)
Supply (b)
Year 17.9 1.75 1.91 1.99 2.59 1.84 1.84
1991 19.0 1.86 2.03 2.12 2.75 2.09 2.03
1996 20.1 1.96 2.14 2.24 2.90 2.31 2.20
2001 21.0 2.60 2.25 2.35 3.05 2.48 2.37
2006 21.0 2.15 2.35 2.35 3.19 2.64 2.53
2011 22.9 2.24 2.45 2.56 3.32 2.79 2.69
2016
Notes: (a) Assumes area expansion planned to 1992, RB of System B and Moragahakanda. (b) Assumes only area expansion planned to 1992. Source: Ministry of Finance and Planning Study, 1984.
The most striking finding here is that, even by the year 2016, Sri Lanka will be only 84 per
cent self-sufficient if area expansion halts with System B-RB and Moragahakanda at current
yield trends (Table 7.6).
Given the substantial scope for increased technical efficiency in rice production in major
irrigation schemes, i.e., the potential for increasing output at the present levels of inputs
applied, the possibility of accelerating the achievement of self-sufficiency in food grains was
subjected to the following sensitivity analysis. The average yield in the major irrigation
schemes was progressively increased at the rate of 5 per cent per annum with the following
two scenarios.
(a) Taking only the expansion area up to 1992.
(b) Including System B-RB and Moragahakanda as well.
Minor irrigation schemes and rainfed areas were not subjected to this treatment since it is
evident that the current high risks of these forms of cultivation for small farmers prevent the
adoption of cultural practices which increase crop yields. The failure of the
"Walagambahuwa Model" discussed earlier in this study illustrates this problem.

131
Table 7.5: Total Rice Production at Varying Levels of Yield Increase per annum with Area Expansion as Planned in 1992
Year % Increase in average yields of Major scheme
1991 5% 10% 15% 20% 25% 30% 35% 40% 455 50% 1996 1.86 1.91 1.97 2.03 2.09 2.15 2.22 2.29 2.36 2.44 2001 2.08 2.14 2.20 2.26 2.33 2.40 2.48 2.56 2.64 2.73 2006 2.30 2.36 2.43 2.50 2.58 2.65 2.74 2.82 2.91 3.01 2011 2.51 2.59 2.66 2.74 2.82 2.91 3.00 3.09 3.19 3.29 2016 2.73 2.81 2.89 2.97 3.06 3.16 3.25 3.36 3.46 3.58 2021 2.95 3.03 3.12 3.21 3.31 3.41 3.51 3.62 3.74 3.86 2026 3.39 3.48 3.58 3.69 3.80 3.91 4.03 4.16 4.29 4.43 2031 3.61 3.71 3.81 3.92 4.04 4.16 4.29 4.42 4.56 4.71 2036 3.83 3.93 4.04 4.16 4.28 4.41 4.55 4.69 4.84 5.00 2041 4.04 4.16 4.27 4.40 4.53 4.66 4.81 4.96 5.11 5.28 2046 4.26 4.38 4.50 4.63 4.77 4.91 5.07 5.22 5.39 5.56 2051 4.48 4.61 4.74 4.87 5.02 5.17 5.32 5.49 5.66 5.85 2056 4.30 4.43 4.57 4.71 4.86 5.02 5.18 5.36 5.5.4 5.73
Source: Ministry of Finance and Planning Study, 1984.
Table 7.6: Total Rice Production at Varying Levels of Yield Increase per annum with Area Expansion Planned in 1992,
Including System B (RB) and Moragahakanda Year % Increase in Average Yields of Major Scheme
1991 5% 10% 15% 20% 25% 30% 35% 40% 455 50% 1996 1.97 2.03 2.10 2.16 2.23 2.31 2.38 2.46 2.55 2.64 2001 2.19 2.26 2.33 2.40 2.48 2.56 2.64 2.73 2.82 2.92 2006 2.41 2.48 2.56 2.64 2.72 2.81 2.90 3.00 3.10 3.20 2011 2.84 2.93 3.02 3.11 3.21 3.31 3.42 3.53 3.65 3.77 2016 3.06 3.15 3.25 3.35 3.45 3.56 3.68 3.80 3.92 4.05 2021 3.28 3.38 3.48 4.59 3.70 3.81 3.94 4.06 4.20 4.34 2026 3.50 3.60 3.71 3.82 3.94. 4.07 4.20 4.33 4.47 4.62 2031 3.72 3.83 3.94 4.06 4.19 4.32 4.45 4.60 4.75 4.91 2036 3.94 4.05 4.17 4.30 4.43 4.57 4.71 4.86 5.02 5.19 2041 4.15 4.28 4.40 4.53 4.67 4.82 4.97 5.13 5.30 .5.47 2046 4.37 4.50 4.63 4.77 4.92 5.07 5.23 5.40 5.57 5.76
2051 4.59 4.72 4.86 5.01 5.16 5.32 5.49 5.66 5.85 6.04 2056 4.41 4.55 4.69 4.85 5.01 5.17 5.35 5.53 5.72 5.92
Source: Ministry of Finance and Planning Study, 1984.

132
An alternative is to move in the direction of another "quantum leap" in technological change,
i.e., towards another "green revolution". This may be achieved in bio-technical areas or in
modern forms of irrigation or in combinations of the two. Options in this area are discussed
at length later in this study.
7.3 Social Benefit/Costs of Rice Production
7.3.1 Strategic Interests
Most studies of future world food supply conclude that the world as a whole has the
resources and the technological capacity to produce food at least at the same rate at which the
demand will grow (Mahangas 1985). However, the mechanism to distribute food among
consumer nations, the world market, is highly artificial as shown below, and developing
countries might feel justified in avoiding it as much as possible. It is of course possible to
prove on theoretical grounds that, where markets are competitive, trade oriented self reliance
may often be superior to domestic self-sufficiency in food in terms of maximising economic
welfare.
A country considering food self-reliance through trade needs security of access to export
markets to obtain the necessary exchange as well as to the food markets. It has to cope with
the general protectionist tendencies existing in the richer countries described in an earlier
section and thus its vulnerability to potential ad hoc restrictions. For instance, Mahangas
(1985) suggests that any country which imports food from the USA should not have any
trade with Cuba. In general, these restrictions imply that access to markets is determined not
only by economic factors but also, and may be predominantly, by political factors.
The actual price paid for food imports in monetary as well as non-monetary terms depends
on the relative bargaining powers of the buyers and sellers. For obvious reasons, USA has
extracted a much higher price from Bangladesh, for example, than from the USSR.
"The price at which trade takes place becomes, as often as not, a function of three domestic
decisions: the willingness to subsidise exports in surplus periods and to restrict exports in
shortage years; the willingness of other countries with more flexible trade policies to enter
the market to remove surpluses; and the extent to which governments and private firms
choose to hold reserves. Rather than a smoothly functioning “competitive world market, one

133
has a strange market structure composed of the complex of these policy decisions" (Josling
quoted in Mahangas 1985).
World rice price forecasts of the World Bank predict a declining trend in real prices for rice
as well as for other food grains in the medium and long term. In contrast, the Global 2000
Report to the US President predicts increasing real prices of energy by the year 2000, and
accordingly, an increase in the real prices of food grains (Barney, 1980).
The World Bank forecasts are based on the unrealistic assumption that there are no major
"shocks" in the system as occurred, for example, with the 1987 drought in Asia. Other shocks
which may increase world rice prices include: disease and pest attacks, a large increase in
fertiliser prices, changes in USA or EEC agriculture policies, domestic instability in either
importing or exporting countries, or increased demand in Asia or in other regions such as the
Middle East, Africa or Latin America.
Monke and Pearson (1987) noted that, while the possibility of any one of these events
happening is small, their joint probability of occurring is high. The impact of the Asian
drought in the 1980s demonstrates how volatile world rice prices are to shocks: a 4 per cent
decline in world production in 1987 raised the rice price by nearly 30 per cent in the same
year.
The unreliability of World Bank commodity price forecasts for rice has been noted by well
known economists and even by certain departments of the World Bank itself. Given that the
appraisal of agricultural projects routinely depend on commodity price projections of the
World Bank in determining shadow prices, and the sensitivity of such projects to price
variations, a careful investigation of this problem is required.
Siamwalla (1987) noted that the January and August 1986 World Bank forecasts of rice
prices for the year 1990 differed by 43 per cent in real 1984 prices and 68 per cent in current
prices. Mahaweli System H was one major project that was adversely affected by the
unreliability of price forecasts of the World Bank. The ex-post evaluation of this major
project (the pilot scheme of the Mahaweli Program) found that, although the project was
successful and achieved the project targets, the economic rate of return was a disappointing
-1 per cent.

134
The comments of the Operations Evaluation Department (OED) of the World Bank on this
project and the ex-post evaluation were that "attaining major objectives such as land
development, settlement, and crop production ….the project ERR has been recalculated at -1
per cent mainly due to much lower actual and forecast prices for rice than price forecasts at
the time of appraisal (p xii),…. the cropped area at the time of project completion was only
14 per cent below appraisal, but paddy production of 67,473 tons compared with 59,554 tons
estimated at appraisal was more than 135 per cent higher…."
In analysing the reasons for this variation of prices, which made System H uneconomic in
spite of the attainment of project targets, the OED found that such "large differences between
rice price projections and actual market developments were not a particular negative case but
that price projections for other commodities [by the World Bank] were equally flawed".
However, the OED was satisfied that improvements to the Bank's price forecasting
methodology since 1982 by the introduction of 22 global models have resulted in greater
accuracy (p 34).
The substantial variations noted above in the Bank's 1986 forecasts do not justify the
optimism of the OED. Siamwalla (1987) notes the difficulties involved in making
projections in an uncertain world, prescribes the adoption of a policy rule in pricing rather
than a fixed policy and suggests that one starts with a possible list of contingencies and
then identifies a course of action for each contingency. The relevant contingencies
identified are (a) global weather conditions, (b) the level of stocks existing in the market,
(c) policy decisions of major countries, and (d) commodity price forecasts of the World
Bank. The last is important since investments in agriculture, particularly in relation to
irrigation, are affected by the price projections. As discussed earlier, the investment for
System H may not have been undertaken if the drop in real prices in the '80s could have
been predicted.
While the recent price increase may have been triggered by weather factors, the dynamic
effects of low world prices on future production growth, which are typically ignored in price
forecasts, is creating a condition for food shortages and for high rice prices in the future. For
example, Hayami (1978, 1988) has shown that low and projected low rice prices make
irrigation investment unattractive and reduce public support for rice research. Alternatively,
when rice prices are high, so is investment. The impact of these reductions will be felt in the
medium to longer term, which fuels roller coaster effects.

135
Changes in price policies have more immediate impacts. For example, reductions in the
fertiliser subsidy are predicted to have a major impact in Indonesia's rice production as nearly
half of the growth in rice output in the past decade has been attributed to this policy
instrument (Timmer 1985).
Rice markets are said to be dominated, not by fundamental demand and supply factors, but
by policy decisions taken in many countries (Siamwalla 1987). Macro economic events and
policy distortions rather than supply and demand factors have been the more important
factors affecting the secular trends in world prices (Mitchell 1987). Among agro-economic
variables, rapid growth of income of oil exporting countries and of newly industrialised
countries, overvaluation of the dollar that increases the price of grain to non-US importers
and exporters, and the sharp price increases of fertiliser due to the oil price shocks in 1973
and 1979, were the most important factors behind the unprecedentedly high world prices in
the 1970s.
Policy induced distortions in developed countries also directly and indirectly reduce world
rice prices. The US Food Security Act of 1985, the Export Credit Guarantee Programs and
the PL 480 Programs reduced US export prices by 30 to 35 per cent which in turn boosted
US export shipments. The growing protection of rice markets in Japan, Taiwan and Korea
has curtailed world import demand. High protection of wheat and other grains in developed
countries has led to dumping of surpluses that eventually depress world rice prices because of
the increasingly strong linkage among the grain markets (Mitchell 1987). By contributing to
the general collapse of agricultural commodity markets, agricultural protectionism has
exacerbated foreign exchange constraints and thus weakened import demand of many
developing countries.
While a low world price of rice is beneficial to consumers and importers, economic welfare
and farm incentives of exporting countries and of rice farmers in importing countries are
reduced. Declining rice prices as a result of technical change, on the other hand, can benefit
consumers without necessarily hurting the producers. However, it is unjust that low income
countries must bear the burden of adjustment to the market distortions which are due to
developed country polices of agricultural protectionism. An OECD report monitoring
progress in agricultural markets (1988) noted that there is "a continuing structural over-
supply in major agricultural commodities produced by developed countries, to the detriment
of developing countries in Asia and elsewhere" (Far Eastern Economic Review, 2 June
1988). This report showed that agricultural subsidies are on the increase in spite of repeated

136
calls for their reduction. For the 24 countries of OECD, the average subsidy to agriculture -
or price support equivalent (PSE) as the OECD terms it - rose from around 30 per cent in
1979-81 to 47 per cent by 1986. The best performer was Australia where the PSE increased
only from 9 per cent to 15 per cent. The worst was Japan, where it had increased from 57 per
cent to 75 per cent.
The foregoing discussion illustrates why small developing countries would prefer food self-
sufficiency to trade-oriented self-reliance. The fundamental reality is that the world rice and
grain markets are not competitive or guided by demand and supply forces. Hence, trade
based on comparative advantage cannot be expected to maximise welfare.
This has profound implications for the methodology of project appraisal as well. The border
prices observed in such a distorted market cannot be expected to yield valid economic
opportunity costs.
7.4 Income Distribution Effects
7.4.1 Nutrition
The Food Balance Sheet 1985, under the heading "Comparison of Nutrient Availability with
International Standard", states that Sri Lanka is far ahead of most of the developing countries
with a per capita availability of 2,500 calories per day (Table 7.7), which is also the level
required in the Ministry of Plan Implementation (MPI) recommendations (Ministry of
Agricultural Development and Research 1987). Moreover 95 per cent of this has been
produced by vegetable sources such as rice, wheat, flour, sugar, coconuts and coconut oil.
Per capita availability of proteins, which is around 55 grams per day, also fully satisfies the
physiological requirements as recommended by the MPI.
The available evidence discussed above indicates that food supplies have been sufficient on
average to meet nutritional requirements in Sri Lanka. However, the itemised food balance
sheet indicates an overwhelming dependence on imported food items.

137
Table 7.7: Supply of Nutrients and the Sources
Commodity Group Per Capita Availability Kg/Year Grams/
Day Calories/
Day Protein Grams/
Day
Fat Grams/
Day Cereals 146.65 401.77 1400.75 30.12 2.24 Roots, tubers & starchy food 34.79 95.3 137.81 0.83 0.19 Sugar 18.49 50.65 200.51 0.02 - Pulses & Nuts 37.71 103.20 449.12 7.58 38.19 Vegetables 63.16 173.03 95.06 4.57 0.38 Fruits 8.16 22.37 17.28 0.20 0.02 Meat 1.57 4.12 5.16 1.02 0.12 Eggs 2.21 6.05 10.46 0.81 0.81 Fish 9.82 23.90 43.18 6.94 1.54 Milk 19.11 52.36 61.52 2.83 3.72 Oils & Fats 3.93 10.77 96.54 0.01 10.74 Total 2,517.48 55.02 57.95
Source: Food Balance Sheet 1985 – Department of Census and Statistics of the Ministry of Plan Implementation, Sri Lanka.
Table 7.8 shows the extent of the contribution made by locally produced food commodities
and the state of under-nutriment if imports were curtailed. In the case of cereals, 75 per cent
of the total supply comes from rice and 23 per cent from wheat flour imported under PL 480.
Only 2 per cent come from other cereals. Given the problems associated with a trade-based
strategy of self reliance discussed earlier, there is a strong case for self-sufficiency of at least
the staple food. At present there is a shortfall of 32.98 gms on the daily requirement of
cereals. Any problems in relation to Sri Lankan export markets and/or access to food supply
sources in the world market can have serious implications for average domestic nutrition
levels.
With regard to pulses, present local products provide only 36 per cent of the total
requirement. For nuts and seeds, available data are insufficient to make a quantitative
analysis, but even so, shortfalls are evident. These are other potential areas for expansion of
production under irrigation.

138
Table 7.8: Availability, Requirement and the Per Capita Per Day Shortfall of Locally Produced Food Items
Food Items Availability per capita per day
(gms)
Recommended levels per capita per
day (gms)
Shortfall
1. Cereals Rice 288.96 Maize 4.24 Kurakkan 2.02 Wheat flour (PL480) Total
69.80 365.02
398
-32.98
2. Pulses
Green gram 2.29 Cow-pea 5.20 Black gram 1.53 Soya-beans 1.20 Total 10.22 21 -10.78
3. Yams and tubers
Potatoes 14.77 Manioc 85.65 Sweet potatoes 13.94 Other yams 5.73 Total 120.22 114 +6.09
4. Nuts & seeds
Gingelly 2.25 Ground-nuts 2.19 Coconut, margarine butter to contribution.
4.44 85 -
5. Condiments
Chillie 5.31 Onion 11.34
Source: Ministry of Agricultural Development and Research, 1987.

8. Diversification and Development of Commercial Agriculture
8.1 The Development of Diversified Cropping in Sri Lanka
8.1.1 Historical Background
The most compelling justification for diversified production on irrigable lands is that paddy
cultivation is not adequately remunerative on the typical area cultivated by smallholders.
As its water use is also inordinately high with the traditional system of gravity flow
irrigation, any restriction of the area committed to the crop will release irrigation water in
quantities capable of developing much larger areas of alternative crops (ACs) and thus of
enhancing returns to investment in irrigation projects. For this of course, modern
technologies for irrigation of such crops may be necessary and the economies of the
combination of such technologies and these non-paddy crops must be shown to be
attractive.
The importance of diversifying agricultural production is expressed in virtually all
documents relating to agricultural policy and planning, investment in the irrigation sector
and improvement of the economic conditions of the rural sector, not only for Sri Lanka but
elsewhere in Asia.
In Sri Lanka, early peasant settlement schemes in the Dry Zone were based on a traditional
pattern of land use where the poorly drained soils on the valley bottoms were used
exclusively for rice and the better drained upland soils for rainfed arable crops.
Certain areas of ill-drained soils of the Low Humic Gley (LHG) type are continuously
committed to paddy all year round. Rice has remained the most remunerative crop for such
marshy soils and other options are severely limited with traditional irrigation technology.
Where RBE soils are ill-drained, they are commonly used for paddy in the Maha Season and
for other crops in Yala. The well drained sections can be used for irrigated crops in both
seasons and currently represent the major short-term opportunity for diversification. Above
command areas are committed to rainfed cropping in Maha or to perennials, though an
economical system of lift irrigation would open up further options and change existing
cropping patterns.
The early concept of irrigated agriculture in the Dry Zone was to supply water for rice
cultivation. Irrigation of other field crops in the command area of an irrigation system was

prohibited by the Irrigation Ordinance. From the mid-1960s however, the scope for crops
was widened. All field crops were included and diversified cropping in irrigable lands
became "the more acceptable pattern of land use" (Somasiri 1981). However, it was found
that, quite apart from the issue of suitability of the gravity flow system for such crops,
farmers lacked experience with crops other than rice under irrigation.
Nearly thirty years ago, plans for settlement in the Uda Walawe were made on the
expectation of diversification on irrigable allotments. The Uda Walawe Project was
notable for being the first project after Independence in which crop diversification was
planned on a major proportion of irrigated land (Table 8.1).
Table 8.1: Area Planned by Crops, Uda Walawe Project Crop Area (acres) % of Land Paddy 22,000 34 Cotton 16,000 25 Sugar Cane 16,000 25 Subsidiary crops 8,000 13 Citrus 2,000 3 Total 64,000 100
Source: Hunting & Co., Uda-Walawe Project, 1981 in Pinnaduwage (1982).
The results fell well short of targets with respect to the irrigable uplands while the paddy
area, though it expanded during the 1970s, fluctuated and also fell short of the target (Table
8.2). Areas planted to subsidiary crops in rainfed conditions expanded much more than
those under irrigation.
Reasons given for the lack of success in diversification included an absence of adaptive
research to ensure suitability of crops to local conditions, low profitability compared with
paddy and a poor system of input distribution, as a result of which extension workers could
not operate effectively for diversification. The crops introduced (maize/groundnuts in
Maha and cotton/chillie/red onions in Yala) were new to the farmers and thus called for
management practices and extension assistance that were quite different than for paddy.
By 1979, aside from a small area of chillie and vegetables, farmers chose to double crop
paddy.
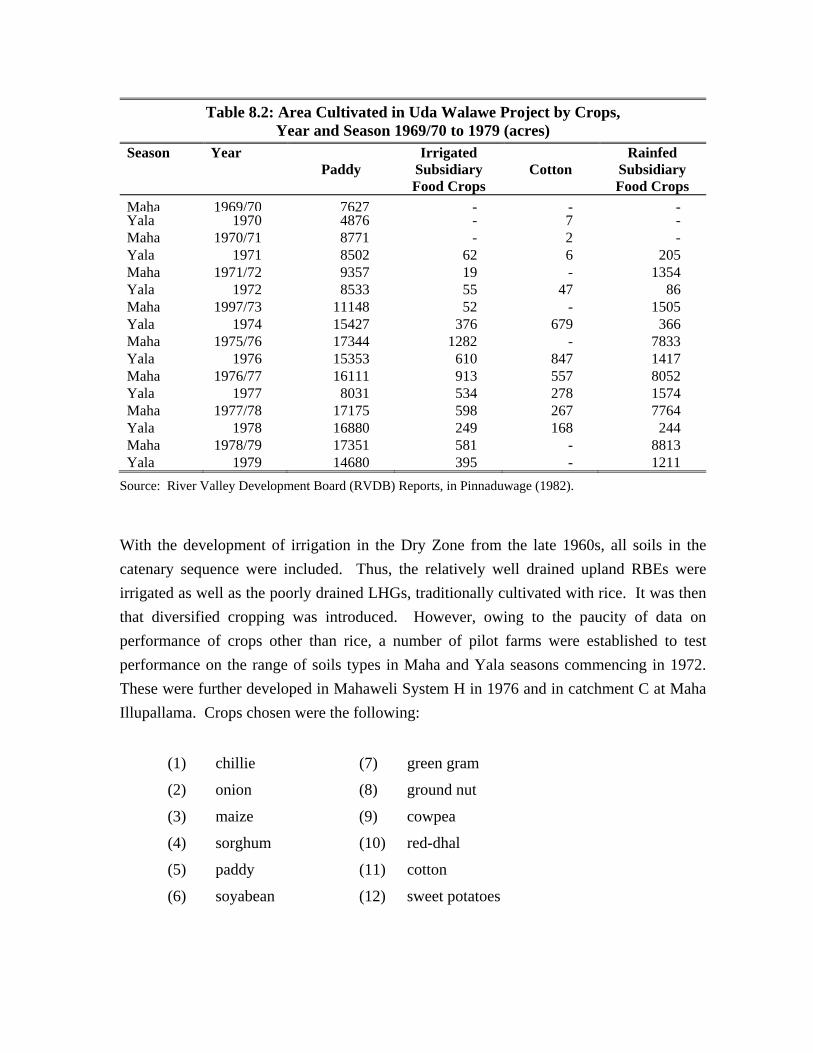
Table 8.2: Area Cultivated in Uda Walawe Project by Crops, Year and Season 1969/70 to 1979 (acres)
Season Year Irrigated Rainfed Paddy Subsidiary
Food Crops Cotton Subsidiary
Food Crops
Maha 1969/70 7627 - - -Yala 1970 4876 - 7 - Maha 1970/71 8771 - 2 - Yala 1971 8502 62 6 205 Maha 1971/72 9357 19 - 1354 Yala 1972 8533 55 47 86 Maha 1997/73 11148 52 - 1505 Yala 1974 15427 376 679 366 Maha 1975/76 17344 1282 - 7833 Yala 1976 15353 610 847 1417 Maha 1976/77 16111 913 557 8052 Yala 1977 8031 534 278 1574 Maha 1977/78 17175 598 267 7764 Yala 1978 16880 249 168 244 Maha 1978/79 17351 581 - 8813 Yala 1979 14680 395 - 1211
Source: River Valley Development Board (RVDB) Reports, in Pinnaduwage (1982).
With the development of irrigation in the Dry Zone from the late 1960s, all soils in the
catenary sequence were included. Thus, the relatively well drained upland RBEs were
irrigated as well as the poorly drained LHGs, traditionally cultivated with rice. It was then
that diversified cropping was introduced. However, owing to the paucity of data on
performance of crops other than rice, a number of pilot farms were established to test
performance on the range of soils types in Maha and Yala seasons commencing in 1972.
These were further developed in Mahaweli System H in 1976 and in catchment C at Maha
Illupallama. Crops chosen were the following:
(1) chillie (7) green gram
(2) onion (8) ground nut
(3) maize (9) cowpea
(4) sorghum (10) red-dhal
(5) paddy (11) cotton
(6) soyabean (12) sweet potatoes

Rice proved to be the best performer on LHG soils in both Maha and Yala seasons. All the
other crops performed better on the well drained soils and yields were generally higher in
Yala than in Maha season. Two types of irrigation were tried, gravity flow and sprinkler.
There were pros and cons to sprinkler irrigation but the most decisive factor found against
it was the recurrent on-farm costs of sprinkler irrigation. The 18 farmers who cultivated
these crops over two seasons in each of four years obtained their highest profits from non-
paddy crops on RBEs in Yala season. It was considered that these results were sufficient to
provide a basis for recommendations for other food crops (OFCs) and their location and
timing. Somasiri (1981) concluded that in Mahaweli "irrigated agriculture will not be
confined to irrigated rice but diversified cropping would be the normal pattern of land use.
The experiences of both pilot projects indicate that a farming family seeks an insurance
against extreme want. Consequently, paddy had to be one of the crops in the rotation. It
was the main crop in both pilot projects in the Maha rainy season, and was followed by
high value crops such as chillie, onion and vegetables in the Yala season.
8.2 Current Support for Diversification
Crop diversification is an explicit objective in the National Agriculture, Food and Nutrition
Strategy (1984), and this was to be promoted in all agro-ecological zones. In particular,
other field crops (OFCs) were to be encouraged on well drained rice lands "to obviate
prodigality of water use and in certain areas sugar cane cultivation must be substituted for
rice"(ibid p. 22). Diversification was envisaged as a major task over the next decade.
Increased emphasis on it would require:
(a) Institutional re-orientation of research, seed production and support service systems.
(b) Redirection of resource allocation to selected crops.
(c) A marketing programme to ensure the commercial viability of the non-rice crops.
(d) Greater attention to policy review and assessment of other field crops to ensure that producer incentives are maintained.
The OFCs embraced coarse grains, legumes, spices, oil seed crops, roots and tubers. In
particular, priority was given to maize, kurakkan, grams, sesame, groundnut, soyabean,
chillie and onions, of which only some were grown under irrigated conditions. The crops
were grown mainly for the domestic market and for home consumption, and profits in the
domestic market were quite low. Constraints on development were seen to include:

- weak government support services.
- generally low yields.
- a thin research base.
- weak marketing institutions.
Under developed storage and processing facilities within the Accelerated Mahaweli
Development Project, approximately 150,000 acres of upland and intermediate level areas
were available for crop diversification of which 75,000 could be cultivated with OFCs and
the rest with sugarcane or cotton. There was no specific consideration given in the NAFNS
to growing OFCs on irrigated lands outside the Mahaweli in the Dry Zone, i.e., in major,
medium or minor irrigation schemes.
The rationale for irrigated crop diversification has been well argued by Miranda and
Panabokke (1987) for tropical Asian countries including Sri Lanka. They particularly cite
the approach of self-sufficiency in rice and a complementary push for self-sufficiency in
selected non-rice crops, especially those with potential for import substitution. They
expressed concern over the problems of growing such non-rice crops in irrigation systems
that were designed for irrigated rice and for the need "to find appropriate management
practices that will make possible the efficient and productive use of irrigation for crops
other than rice". In analysing some of the constraints to non-rice cropping from irrigation
water supplies, greater economic risks, larger cash and labour inputs, uncertainty of market
prices and the demand for an increased managerial input were cited.
In a 1986 review of institutional and policy issues in Sri Lanka's agriculture, the World
Bank (1986) saw an increasing need to augment the national diet with additional supplies
of foodstuffs other than paddy and imported wheat. A wide variety of such crops were
already being grown but usually under relatively low intensity and low yield production
systems. The Bank argued for diversification, not because of the likely but possibly
temporary achievement of rice self-sufficiency, but rather because it would allow
considerable improvements in the efficiency of both real and financial resource use in the
agricultural sector. Many of the non-paddy food crops were seen as having "potential for
significant productivity improvements and/or acreage expansion, into either rainfed or
irrigated areas in the Dry and Intermediate Zones". The Bank particularly favoured
diversification into crops for the expected growth in the domestic market. It saw a role for

some export crops (e.g., pepper) but advised a cautious approach in view of the "difficulties
and uncertainties involved in producing for uncertain export markets".
The Ministry of Agricultural Development and Research produced an Agricultural
Diversification Plan in the late ‘80s (MOADR, 1987) in which a case for crop
diversification with OFCs as the base was "a distinct possibility in Sri Lanka". Again, this
Plan was primarily concerned with the domestic market for a range of these crops, and
concluded that "for many of these crops the domestic market may prove insufficient to
absorb the entire production that will come off an organised diversification programme".
Production efficiency was therefore, essential in order to keep export options open. A
study for the Mahaweli Authority in 1985 (Agroskills 1985) saw the principal agricultural
and industrial thrusts of the Authority's Enterprise Development Strategy (EDS) as being
aimed at:
(1) "diversifying agriculture in settlers' farms to raise settlers income levels.
(2) bringing in agriculturalists from higher income brackets to introduce basic processing facilities for primary produce and to provide feed stock for agro-industries.
(3) encouraging the setting up of agro-industries designed to draw feed stock from nucleus estates, small holder farmers and Mahaweli settlers".
These crops should be readily marketable either locally or abroad. This EDS was based on
the availability of a large area of well drained irrigable soils capable or growing a wide
variety of crops. Finally, it should be noted that in 1989, the government approved
submissions for new strategies in agricultural development that would move away from
mono cropping towards diversified and commercial cropping systems, stressing "higher
productivity per land area"(Ministry of Agriculture, Food and Cooperatives 1989).
8.2.1 Technical Inputs Required
Compilation of basic information required for a substantial commitment to diversification
in Sri Lanka has proceeded along three broad lines:
(a) surveys for assessing land suitability and water availability,
(b) identification of potential candidate crops, and
(c) agronomic studies of promising crops.

Much work on soil surveys and land capability classifications has been done over the years
by several agencies including the Land Use Division of the Irrigation Department. A
generalised agro-ecological map for the island was prepared in 1976 that provides broad
information on crops for different regions of the country. Information in greater detail has
been presented in studies commissioned for major irrigation schemes and in the districts
falling within the purview of the various Crop Research Institutes in assessing
intercropping opportunities on tea and rubber lands. Information relevant to areas outside
the major irrigation schemes has appeared in the FAO study on uneconomic tea lands and
in feasibility reports for the UNDP-supported Integrated Rural Development Projects.
While these are indispensable as aids to policy planning, they are unfortunately of limited
use to actual land users. Since settlement activities in the major irrigation schemes
(including the AMDP) continue to alienate irrigable land in small parcels, and taking
account of the variations in land use characteristics over relatively short distances, there
was no alternative to detailed and essentially "case by case" assessments of potential land
use. The requirements could change if irrigable lands were granted to entrepreneurs in
much larger areas than hitherto, particularly if they could act as nuclei for surrounding
small holders.
8.2.2 Area Potential for Diversification
Some 483,000 hectares were estimated to be irrigable under major and minor irrigation
schemes. A minor area of about 6000 to 8000 hectares of this total area has been under
sugar cane as a permanent irrigated crop. Another 20,000 hectares were cultivated under
diversified short-term crops during the 1986 Yala season. It was estimated that the balance
of some 72,000 hectares of well drained land was available under gravity command in the
major irrigation schemes and on which farmers could be persuaded to grow upland crops at
least in the dry season (Dimantha, 1987). The major problem was that excess moisture in
the wet season and unseasonal rains in the dry (Yala) season hampered upland crop
cultivation. Selection of short duration varieties and sowing dates became critical.
It was also estimated that there were 185,000 hectares under minor irrigation schemes,
where there was insufficient water for rice in the dry season, which could be considered for
upland crops. However, much of this area was imperfectly to poorly drained and would
require measures to improve surface and sub-surface drainage and avoidance of cropping
during the very wet months.

In the context of the present study, which considers investment only in the irrigation sector,
emphasis is necessarily placed on the Dry Zone to where the efforts of all major and most
minor irrigation schemes have been directed. Diversification of Dry Zone production was
thus a central objective. Abeyratne (1967), identified the following features:
(i) Population pressures compel settlements in smallholdings that, however, cannot be economically viable, unless they are entirely irrigated.
(ii) Although a wide variety of food crops are possible, there is no way of producing them effectively without irrigation.
(iii) Due to the soil and drainage characteristics of the Dry Zone even over small distances, a system of diversified farming is essential.
(iv) To maximise returns from land and water, it is essential to grow one type of crop in all suitable land, irrespective of ownership.
8.2.3 Criteria for Diversification
In achieving the objective of developing irrigated farms Abeyratne (1967) envisaged a
three fold increase of cultivated area by disciplined water use. He identified farm
management, irrigation and mechanisation as three factors to be brought together if any
headway was to be made in Dry Zone agriculture. The extreme importance of maximum
economy in the use of irrigation water and in the adoption of technologies capable of
efficient on-farm water management was emphasised by the assessment that "the total
extent of agriculturally good soil in the Dry Zone is far in excess of the total area which
could be economically served by conventional irrigation, even after complete exploitation
of all the water resources that could be made available from all proposed major storage and
diversion schemes" (Panabokke 1967).
The following criteria were identified as important for a successful cropping pattern or for
diversification (NEDECO 1984).
Biological feasibility: Crops should be suited to the environment, flexible enough to accommodate drought conditions and should constitute good land use.
Technical feasibility: Technical aspects should be within the capability of the farmer. He should be able to understand and accept new methods or techniques or to improve old ones.
Economic feasibility: Costs of cropping should fall within available resources and yield a reasonable and reliable level of profit. Cropping should be capable of accommodating changes in market demand.

8.2.4 Choice of Crops for Diversification
Historically, there have been two major approaches to the choice of crops for
diversification. The first focussed principally on the objectives of attaining domestic self-
sufficiency in the more important food items. The quantities were determined by the
requirements for balanced nutrition. The second focussed on identification of crops with
export potential. Both approaches are discussed below.
8.3 Traditional Crop Strategy
8.3.1 Domestic Market Prospects
Dimantha (1987) estimated the quantities and areas required for some traditional Dry Zone
crops (Table 8.3).
The required area of 222,000 hectares of irrigated uplands on the basis of a single crop per
year, is not available under the major irrigation schemes. The estimate is 70-80,000
hectares. However, the overall area of all food crops, which is indicative of the total area
(irrigated and rainfed) available, conforms reasonably well to the figure of 222,000
hectares required. Clearly this includes rainfed cultivation and single season activities in
Yala on paddy lands.
In terms of commercial opportunities offered by prospects for import substitution, flour,
milk, cotton and sugar are potentially attractive.
Major factors that determine the extent to which farmers will diversify are the relative
financial returns from each crop, labour needs and availability, input costs, cash income
flows, level of required technology, storage and markets, accessibility to suitable soils and
control over water.
Table 8.4 presents costs and returns for paddy (in Polonnaruwa) and estimates compiled
from a number of sources for several other food crops that are commonly cultivated in
irrigable uplands.

Table 8.3: Quantities, Yield and Area Required for Some Traditional Dry Zone Crops in 1987
Crop Qty Required
Rainfed Yield
Irrigated Yield
Rainfed area Required
Irrigated area Required
(‘000 mt) (Kg/ha) (Kg/ha) (‘000 ha.) (‘000 ha.) Cowpea 75 700 1,500 107 50 Green gram 38 600 1,000 62 38 Black gram 27 800 1,500 32 17 Ground nut 30 800 1,500 36 19 Soya bean 9 1,500 2,000 6 5 Chillie 32 400 1,000 77 32 Onions 112 7,000 10,000 16 11 Sugar 300 4,000 6,000 75 50 Total 623 15,800 24,500 411 222
Source: Dimantha, 1987, p.140.
Table 8.4: Costs and Returns for Paddy and Some Other Crops Under Irrigation at Polonnaruwa (Rs. per acre)
Crop Labour Cost
Other Costs
Total Cost
Yield Unit Price
Gross Returns
Net Returns
Paddy 730 3,115 3,845 70 bu. 72.0 5,100 1,255 Sesame 2,360 3,759 6,119 1,000 kg 10.25 10,250 4,131 Green gram 4,800 5,411 10,211 1,700 kg 13.5 22,950 12,379 Ground nut 4,600 5,391 9,991 2,000 kg 10.0 20,000 10,009 Soya 3,840 2,870 7,710 2,200 kg 7.5 16,500 8,790 Melon 13,920 4,840 18,760 20,000 kg 3.0 60,000 42,240 Gherkins 28,200 11,000 39,200 8,000 kg 9.0 72,000 32,800 Chillie 20,600 10,561 31,161 1,800 kg 60.0 108,000 76,839 Onions (large)
25,280 15,724 41,004 20,000 kg 13.5 270,000 228,996
Sources: Polonnaruwa District (Agricultural Economics Unit, Department of Agriculture). Other figures were compiled from various sources by Marketing Division, EIED of MASL.
Of particular interest are melons (identified as a potential export crop in an SRD market
study discussed below), gherkins (which have acquired considerable popularity by 1980),
chillie (very popular in System H) and onions (gaining in popularity). It should be
cautioned that these costs and returns are only indicative and can vary sharply with
location.

Table 8.5 presents an analysis from crops grown in 1982 Yala at Kalawewa in System H of
the Mahaweli.
Financial returns from the crops exert a considerable influence on farmers' choice, and Table
8.4 shows the apparent influence of other related factors, principally prices and markets in
Yala season 1982. Chillie predominated in relative popularity amongst OFC's in System H
during the 1977-84 period (Table 8.6).
Where conditions for cultivation are appropriate, the opportunity for import substitution is
a clear factor in determining the choice of crops. Requirements based on assessed
nutritional needs of the population represent the safe upper requirements (Table 8.7). A
more immediate opportunity, subject to appropriate purchase and marketing arrangements,
is the quantum of imports of commodities that can be produced in the Dry Zone under
irrigation.
Table 8.5: Yield and Returns from Crops Grown at Kalawewa, System H Yala Season
Item Unit Paddy Irrigated Chillie
Irrigated Soyabean
Irrigated Cowpea
Irrigated Red
Onion
Irrigated Tomato
Irrigated Seed
Cotton
Av. Yield Kg/ha 3,200 1,411 1,444 806 8,675 12,566 1,949
Av. Price Rs/kg 3.06 19.71 9.34 7.74 5.00 2.75 8.24
Gross Return
Rs/ha 9,799 27,874 13,484 6,255 43,373 34,557 16,060
Net Return (incl. family labour)
Rs/ha
3,561
12,990
4,486
(-)1,155
17,306
15,765
6,203
Net Return (excl. family labour)
Rs/ha
5,825
19,812
8,266
5,045
23,584
21,929
10,798
Net Return (/unit of capital)
Rs
1.46
2.46
1.59
4.18
1.19
1.74
2.05
Net Return (/manday)
Rs
27.43
28.64
17.87
4.48
41.22
38.72
24.89
Source: NEDECO (1984) Detailed Proposals on Alternative Cropping Patterns, Mahaweli Authority of Sri Lanka, Colombo, Annex 1.
By its nature, the Food Balance Sheet does not represent the maximum absorption capacity
of the market. Rather, it suggests the lower limit. The comprehensive study of agricultural
diversification, completed by the Ministry of Agricultural Development and Research in

1987, was originally to include fruits and vegetables and the crop cluster known as OFCs.
For various reasons, the diversification action plan was narrowed down only to OFCs. In
diversifying from rice, these crops were seen to be the logical alternatives under irrigation
in the pursuit of maximum returns on investment. The OFCs considered were coarse grains
(maize), oilseeds (soyabean, groundnuts and sesame), pulses (green and black gram and
cowpea), and condiments (chillie and onions).
Table 8.6: Areas of Crop Grown in System H in Yala Season, 1977 to 1984 (hectares)
Year Chillie Soyabeans Cowpea Green Gram
Red Onion
Bombay Onion
Vegetables Other
1977 11 4 12 6 3 - 3 36 1978 13 1 35 1 4 - 12 4 1979 9 2 20 13 2 - 49 - 1980 478 40 383 76 31 - 82 19 1981 1,050 170 380 71 29 - 135 15 1982 1,504 457 112 48 20 - 66 100 1983 2,479 394 283 51 18 31 198 - 1984 8,790 800 1,000 300 100 85 16 50
Source: Project Manager’s Office, Galnewa.
Table 8.7: Crop Requirements Based on Nutritional Needs in 1986 ('000 tonnes)
Commodity Total Supply Production Imports
Maize 70.62 40.62 30.0 Onions 104.16 56.84 47.32 Soyabean 4.56 3.80 0.76 Cowpea and Dhall 65.9 23.9 42.0 Sugar 358.59 35.06 323.53 Rice 2911.67 25.88 323.67
Notes: a. To this may be added 514,250 metric tons of wheat flour, 24,090 metric tonnes of dried fish and 25,630 tonnes of milk powder.
Source: Food Balance Sheet 1986 - Department of Census and Statistics.
Some 72,000 hectares of irrigable land high in potential for diversification with OFCs were
identified in Systems H, B, and C of the Mahaweli Project, Kirindi Oya and Uda Walawe
Schemes in this study. Future demand for OFCs could not be estimated with any degree of
econometric precision. Two approaches were used, one based on nutritional needs and the

other on per capita income growth. The former was naturally the higher. Future
production was estimated on a straight line trend basis, assuming technology remained
unchanged.
The analysis suggested that production of pulses, soyabean and maize was most likely to
encounter domestic demand constraints. There could be a big gap between supply and
demand for onions, which would favour producers. Production of black gram, groundnut
and gingelly exceeds nutritional needs, which has led to some exports.
Demand estimates, based on income elasticities of demand, suggested that production
levels were even closer to potential demand. Only potatoes and onions showed a wide
enough gap to encourage rapid production increases. For the rest, additional supplies
would have to find export markets. Sri Lanka's potential for exports was assessed for the
OFCs with particular reference to Thailand. Average costs of production were compiled on
a district basis over the 1978 to 1986 period for comparison, and these were found to vary
widely. Overall, gingelly and black gram were competitive, groundnuts to a lesser degree
while green gram and maize were not competitive. Certain districts were competitive in
these other food crops but others were not, so there was no consistency by location. Over
recent years, exports of OFCs have declined owing to such factors as instability in local
production, poor quality and unfavourable local prices. This study concluded
"diversification (with OFCs) cannot be based entirely on the domestic market as there are
indications that the domestic market could be easily saturated".
8.3.2 Export Market Prospects
“Sri Lanka has the potential to break into the export market but the difficulty has been to
produce efficiently and competitively" (MARD, 1987, p.20). Sri Lanka would need to
lower costs and raise quality with these crops (OFCs) in order to compete internationally.
The other crucial question linked with export potential is whether the private profitability
of the OFCs is sufficiently attractive to encourage higher production levels. Table 8.8 casts
much doubt on this. Comparison of returns per unit of family labour for these crops shows
that long and short duration rice varieties were two of the three most remunerative crops.
Chillie gave the second highest return. There was then a substantial fall in returns per unit
of family labour, ranging from black gram down to the lowest for cowpea. Big and red
onions (along with chillie) gave high returns to management and land, but notably, both
onion crops were highly labour intensive, which reduced returns to family labour. There

was also a major contrast between total variable costs per hectare between rice and chillie
and the two onions. Red onions were outstanding in gross returns per hectare, total
variable cash costs per hectare, net benefits to management and labour requirements.
Attractive as some of these OFCs may be in certain respects, marketing prospects must
play a dominant part in the promotion or otherwise of each, as discussed above.
Organisationally, the MARD study recognised the limited administrative, manpower and
budgetary resources available and recommended a diversification plan for a number of
large contiguous blocks of land where a programme could be carried out economically.
Thus, it was not to be a nation-wide programme but one which selected some 11 blocks of
land ranging from 5,000 to 54,000 hectares, of which five were in existing irrigation
schemes in the Dry Zone. The study of alternative cropping patterns for the Mahaweli
Authority in System H, the pilot scheme for the rest of the Project referred to above
(NEDECO 1984), was amongst the first to focus on diversification under irrigation. It
considered a range of upland crops for the Yala or dry season to be grown on irrigated, well
drained reddish brown earths (RBEs). These included the familiar OFCs: chillie,
soyabeans, cowpea, green and black grams, red and big onions and vegetables.
The first approach to a diversification strategy for irrigable land is to identify crops that
most gainfully exploit the available resources of land, water and labour. Such a study was
undertaken in respect of Systems B, C, G and H (AMDP) of the Mahaweli.
The strategy proposed was that well-drained soils not yet allocated to settlers should be
reserved for non-rice cropping. Where contiguous lands were available, they were proposed
for development in the form of nuclear estates. Such estates would attract the participation of
agriculturalists from higher income brackets who would be capable of introducing basic
rocessing facilities and providing feedstock for agro-industries. The agro-industries that
would thus develop would be designed to draw feedstock from the nuclear estates, small
holder farmers and settlers. The resulting diversification in settlers' farms would raise their
income levels. The availability of areas of well drained and imperfectly drained land with
gravity command in the AMDP are given in Table 8.9.

Table 8.8: Economic Performance of Crops in Yala Season in Well Irrigated Areas (Rs/hectare)
Crop and Duration (months)
Gross Benefits
Total Variable
Cash Cost
Return to Farm Labour,
Land, Management and Capital
Total Variable
Cash Cost and
Opportunity
Net benefit to Labour and Land
Rice 3-3.5 mn.
11,370 5,968 5,672 7,621 4,109 (9)
Rice 4-4.5 mn.
14,417 6,257 8,160 8,108 6,309 (7)
Chillie 47,005 9,787 37,218 18,287 27,718 (3) B’Onion 55,425 11,225 44,200 26,320 29,105 (2) R’Onion 91,505 54,762 36,743 62.027 29,478 (1) Soya bean 12,087 4,675 7,412 7,595 4,492 (8) Cowpea 9,230 2,322 6,908 7,980 1,250 (11) Green Gram 14,137 1,987 12,150 6,165 7,972 (4) Black Gram 12,732 2,362 10,370 5,867 6,865 (6)
Note: Figures in brackets are rankings.
Table 8.8. continued
Crop and Duration (months)
Return per Unit of Family
Labour
Net Return per Unit of Capital
Return per Unit of Cash Cost
Total Labour Requirement
(md/ha.) Rice 3-3.5 mn.
105 (3) 1.53 1.96 (12) 90
Rice 4-4.5 mn.
129 (1) 1.78 2.30 (11) 105
Chillie 124 (2) 2.43 4.80 (4) 436 B’Onion 86 (6) 2.11 4.94 (3) 662 R’Onion 71 (8) 1.47 1.67 (13) 669 Soya bean 57 (9) 1.59 2.58 (9) 209 Cowpea 34 (12) 1.15 3.97 (5) 220 Green Gram 83 (7) 2.29 7.11 (1) 188 Black Gram 98 (4) 2.17 5.39 (2) 141

Table 8.9: Areas of Gravity Command Within the AMDP by Type of Drainage
System Well Drained Irrigable Imperfectly/Poorly Drained, Irrigable
% Well Drained
B 4,790 39,425 11
C 3,276 18,696 15
G 996 1,993 33
H 9,675 14,500 50
Total 18,737 74,614 25
Source: Agroskills Ltd., 1985.
8.3.3 New Crops
In Systems G and H, settlers occupy almost all arable lands (about 27,000 hectares).
Unallocated irrigable land in Systems B and C amounts to around 7,300 hectares while a
further 19,000 hectares of poorer soils are available for crops that are not exacting in their
soil requirements.
Once the assessments of land availability indicated that sizeable areas were available,
selection of crops was based on four main criteria.
a) agro-climatic suitability.
b) amenability to crop rotation patterns and versatility to be grown profitably on different sizes of units - small holdings, commercial farms and settler lands.
c) consistency with planned irrigation development and labour availability.
d) ready marketability - domestic or export - or as the feed stock for agro-industries to be set up.
A first list of 27 crops was prepared, using criteria (a)-(c) above. This necessarily was not
exhaustive and relied heavily on already available evidence of local performance and
familiarity with the crops. It excluded crops with potential if they were unproven in the
locality. The report acknowledges this deficiency. The next phase of crop selection took
account of the marketability criterion (d) within the terms of domestic and potential export
demand.
Next, the crops were placed in categories according to priority, with the following
specifications:-

Category 1 Crops with potential for immediate results on account of their agronomic suitability and marketability: mango, pawpaw, tomato, capsicum, sesame, blackgram, cashew, soyabean, greengram, chillie, onions and pasture.
Category 2 Crops that appear to have potential but whose agronomic suitability and/ or marketability would need further investigation for which government support would be warranted: pineapple, ginger, turmeric, coconut, maize and groundnut.
Category 3 Crops which appear to be agronomically suitable but whose economic feasibility and marketability should be further investigated by prospective investors: banana, passionfruit, okra, gherkin, cucurbits, cassava and specialty rice.
The above crops were further assigned to the different systems on the basis of expected
suitability and their irrigation requirements, and end uses were defined. Subsequent to the
preparation of this study, progress in certain crops - notably gherkins, passionfruit,
groundnut, melons and pineapple - seemed to establish their agronomic suitability and may
warrant revisions of this position.
8.3.4 Candidate Crop List
The soils of the Dry Zone fall largely into four great soil groups - the Reddish Brown
Earths (RBEs), Non-calcic brown soils, red-yellow latosols and Low Humic Gley soils
(LHGs). The last named are generally distributed throughout the lowlands in the lower
topographic sites. Small deposits of alluvial soils occur along valleys and flood plains of
major streams and rivers (Panabokke, 1967). The RBE soils are the most important
quantitatively and agriculturally. With the exception of the LHGs and some of the alluvial
soils that are ill-drained and thus are more suitable for paddy than for diversified cropping,
by far the greater part of the Dry Zone is eminently suitable for diversified irrigated
agriculture. This is all the more so because well drained LHGs are now known to be able
to be used for crops other than paddy. Since most crops other than paddy favour moist to
dry soil conditions, the essence of their successful management is the avoidance of over-
wet conditions in the Maha (wet) Season and assurance of regular supplies of irrigation
water in the dry periods of the Yala season.
It has been argued in a number of studies that, if proper irrigation technology, land
formation and selection of appropriate cultivars are practiced, the range of soils in the
irrigated zones provides very satisfactory conditions for a diversity of crops. In addition to
traditional crops grown, a lengthy list of candidate crops, held out to have agronomic
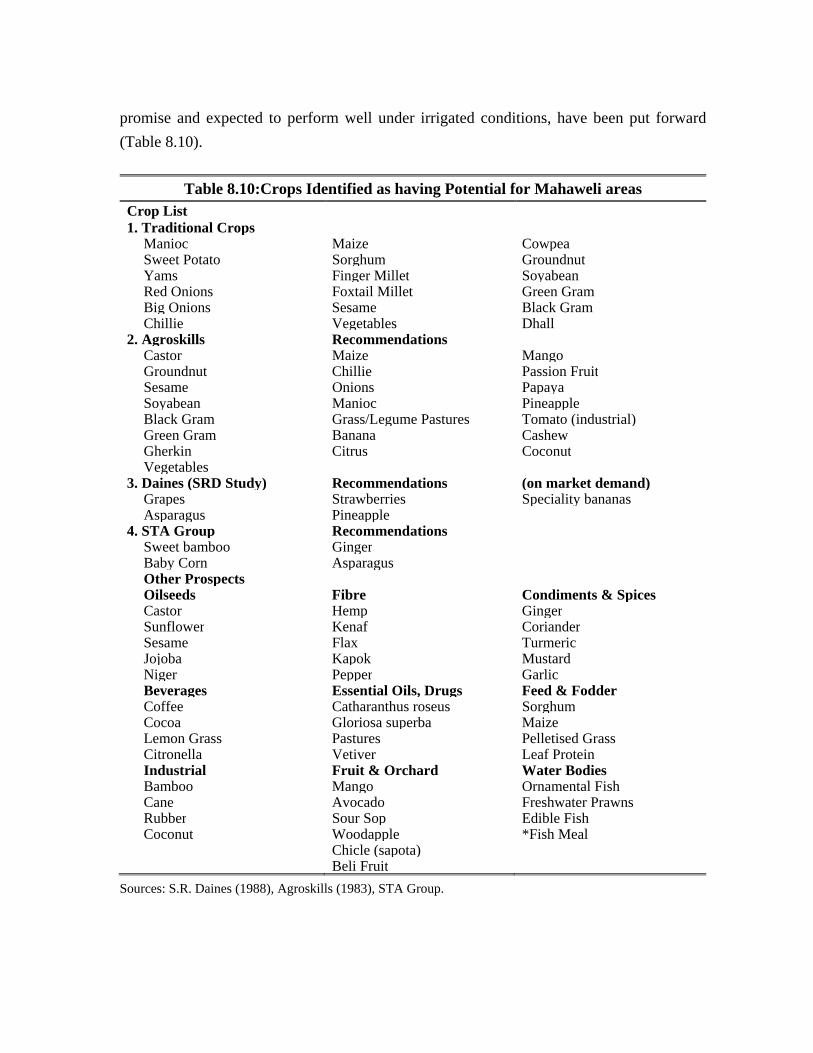
promise and expected to perform well under irrigated conditions, have been put forward
(Table 8.10).
Table 8.10:Crops Identified as having Potential for Mahaweli areas
Crop List 1. Traditional Crops
Manioc Maize CowpeaSweet Potato Sorghum Groundnut Yams Finger Millet Soyabean Red Onions Foxtail Millet Green Gram Big Onions Sesame Black Gram Chillie Vegetables Dhall
2. Agroskills RecommendationsCastor Maize MangoGroundnut Chillie Passion Fruit Sesame Onions PapayaSoyabean Manioc Pineapple Black Gram Grass/Legume Pastures Tomato (industrial) Green Gram Banana CashewGherkin Citrus Coconut Vegetables
3. Daines (SRD Study) Recommendations (on market demand) Grapes Strawberries Speciality bananas Asparagus Pineapple
4. STA Group RecommendationsSweet bamboo GingerBaby Corn AsparagusOther ProspectsOilseeds Fibre Condiments & SpicesCastor Hemp GingerSunflower Kenaf Coriander Sesame Flax Turmeric Jojoba Kapok Mustard Niger Pepper GarlicBeverages Essential Oils, Drugs Feed & Fodder Coffee Catharanthus roseus Sorghum Cocoa Gloriosa superba MaizeLemon Grass Pastures Pelletised Grass Citronella Vetiver Leaf Protein Industrial Fruit & Orchard Water Bodies Bamboo Mango Ornamental Fish Cane Avocado Freshwater Prawns Rubber Sour Sop Edible Fish Coconut Woodapple *Fish Meal
Chicle (sapota) Beli Fruit
Sources: S.R. Daines (1988), Agroskills (1983), STA Group.

There is little experience in irrigated culture of perennial and semi-perennial crops.
However, demonstrations in the 1990s (e.g., Galnewa Farm of System H) have provided
useful evidence of effectiveness of micro-irrigation systems in delivering water directly to
the root zones of trees.
8.4 The Export Market Strategy 8.4.1 Perishable Products
The second approach taken towards diversification in irrigated agricultural areas is one that
can be termed the Export Marketing Strategy (EMS). This was favoured by the EIED of
the Mahaweli Authority in the late 1980s and early 1990s. A private consulting firm
identified commodities with an export potential. This was undertaken in two stages: the
first identified perishable products, the second identified processed or semi-processed
commodities for export markets. This discussion is confined to the first category.
The export potential for a product was seen as based on a long run competitive and
comparative advantage: long run because risks and costs are high, so that Sri Lankan
products must be assessed as having an underlying advantage, preferably over most, if not
all, competitors. The SRD study suggested Sri Lanka had three major long run competitive
advantages over many existing or potential competitors:
Seasonal flexibility: enabling many crops to be grown all year round owing to favourable
temperatures, rainfall incidence and irrigation water availability (provided the water can be
used efficiently). The long dry season in the Mahaweli and South East Dry Zone
minimises pest and disease problems.
Low labour costs: labour costs are substantially lower than those in other developing
countries of Asia, Central and Southern America. This advantage of course becomes more
marked for crops where labour inputs are high. Labour intensity was a criterion in choice
of products.
Geographical position and Transport costs: the SRD group considered Sri Lanka to be
very advantageously located, mid way between the two largest importing regions for fresh
fruits and vegetables, Western Europe and the Pacific Rim, centred on Japan. The study
suggested a valuable opportunity for geographical diversification between these two market

regions. In practice, while it is true that most other existing or potential competitors are
restricted to only one of these regions, Sri Lanka is located relatively distantly from each of
these market regions (Nippon Koei, 1988). For example, tropical African countries are
closer to Western Europe, Central America to the USA, and Thailand, Malaysia and
Taiwan are closer to Japan. The major exception is the Gulf market, where Sri Lanka has
only India, Pakistan and Kenya as its competitors.
A lack of transport advantage may not be critical if it is outweighed by the first two
advantages of seasonal flexibility and low labour costs. Finally, it should be noted that at
present, Sri Lanka is not well served by air or sea freight services. Air Lanka is a small
airline with limited flights and routes, and other major airlines utilise Singapore (and
Bangkok to a lesser extent) to take advantage of the high frequency/high volume traffic
flow. It may be necessary for Sri Lanka to link up with this international network through
Singapore under special freight agreements, or improve its range of direct flights. Sri
Lanka's future in sea freight remains unresolved at this point of time, though it does have a
favourable location. Singapore would offer the greatest competition.
There is one aspect in which geographic isolation could act as a disadvantage. The
Mahaweli and the South East Dry Zone (SEDZ) are located at considerable distances from
the one international airport near Colombo. For producers, road and rail links are
reasonably well developed, if somewhat slow-moving, but there are difficulties in
communications and living conditions, and there is a lack of the sophisticated services
necessarily associated with exports by air-freight in particular. These factors place the
Mahaweli and the SEDZ at a management disadvantage (SRD, 1988: p.3).
The SRD study first decided to select the major markets most favourable to Sri Lanka.
Choice was based upon accessibility (tariff, sanitary restrictions and barriers based on
quality standards and sophistication) and market size. On these criteria, accessibility
ratings ranged from Gulf markets (easiest), Singapore/Hong Kong (easy), Europe and
Australia (average) and Japan (difficult).
In terms of market size, the most dominant market was Western Europe. Excluding
internal supplies, the non-EEC imports to Europe of fresh fruit and vegetables were
roughly double those in the USA and treble those in Japan. Gulf markets were small but
easy to enter and are of particular significance for crops such as bananas. The

Singapore/Hong Kong/Australia ("South East Asia") area was also easy and gives a margin
for quality. Collectively, they are about twice the size of Gulf markets. SRD's final
country ranking in terms of relative importance was:
1. West Germany
2. United Kingdom
3. Japan
4. Gulf and Middle East
5. Hong Kong
6. Singapore
A selection of products then followed, for which seven criteria were used including market
demand (imports and consumption), transport shelf life (days), labour content and
technology requirements. The weightings given to each were arbitrary, so that the 'final
priority score' might be arguable. First, products were preferred with large market
demands and second, where large proportions were met by imports. Transport shelf life
was evaluated in terms of perishability and feasibility of reaching markets in 10-15 days of
sea travel. Labour content was important partly because it is an indicator of comparative
advantage for Sri Lanka and partly because productive employment generation is an
important objective. The final three were technological difficulty, availability of existing
produce and the time frame for impacts on the Mahaweli.
Sixty products were given preliminary listings in Mahaweli/SRD lists, of which 18 were
left after application of the above criteria, viz.,
1. Bananas 10. Gherkin/Cucumbers
2. Tomatoes 11. Cashews
3. Carnations 12. Orchids
4. Peppers/Chillie 13. Strawberries
5. Shrimp 14. Asparagus
6. Mushrooms 15. Ginger
7. Grapes 16. Melons
8. Pineapples 17. Papaya
9. Mango 18. Garlic

As the SRD report notes importantly (p.6) "The strength of a seasonally flexible production
climate such as Sri Lanka has, is that the current size of imports is a vast underestimate of
total import 'demand' for most products". This is because supply is seasonal while
household consumption demand is often fairly even throughout the year.
A demand model constructed for 17 selected products for Sri Lankan local consumption
(with income and population growth assumptions to year 2000) showed that only chillie
and papayas would require sizeable extra output and then only around 10,000 additional
hectares for each. Garlic was a third and special product since most is imported. None of
these three "survived" as a high priority export product. Hence, it was concluded that the
local market had very limited absorptive capacity for products with high export potential.
Thus, the possible local absorption of export oriented crops was not recommended. This,
therefore, quite clearly differentiated the domestic-oriented from the export-oriented crops.
The 18 selected products were tested in a field survey by the SRD team in 13 countries to
obtain a final priority list of 14 products associated with markets. This was done by adding
two criteria to the seven described above: market interest and competitive position of Sri
Lankan products. The final ranking for export market priorities was as follows: 1. Grapes 2. Strawberries 3. Asparagus 4. Pineapple 5. Bananas 6. Mango 7. Melon 8. Shrimp 9. Mushroom 10. Orchids 11. Pepper 12. Cashew 13. Gherkin 14. Tomato
The SRD study separated these 14 into four categories:
a) Springboard - large markets and favourable competitive positions with a potential to
become whole industries in the Mahaweli leading the way in infrastructural
development technology transfer for other industries to follow. In order, five such
products were identified: table grapes, strawberries, asparagus, pineapple and bananas,
with grapes well out in front involving few technological, management or
infrastructural difficulties. Strawberries involved difficult training infrastructural and
management requirements. Pineapples and bananas would give most problems.

b) General Major Markets – viz., mangoes, melons and shrimps that have large markets
in more than one area. Mangoes should, on SRD criteria, be the first and maybe only
focus in exotic tropical fruit market as the most important single market, but Sri Lanka
faces stiff competition.
c) Single Major Markets - two in all and both in Japan: viz. dried Shitake mushrooms
and potted orchids. Both are large enough markets for exploitation.
d) Target Markets - these are small and locationally specific, e.g., gherkins in Australia
and more recently in Europe. This and others crops can be important for a few enterprises
with a limited total area under production.
The top market in terms of priority rankings was West Germany (fruits, vegetables,
flowers). Twelve products/markets were in the highest 'springboard' category and half were
in West Germany. Japan and the UK were seen as ranking next for Sri Lankan produce
with the former having the larger long term potential with higher income and population,
but adjusted downwards for difficulty of market entry owing to rigid sanitary regulations,
and of communications.
Another report, focusing only on the UK fruit and vegetable market (M&IA, 1988),
suggested that prospects for exotic fruits and vegetables were favourable, both during the
on and off seasons, particularly for fruit. This has been partly due to increased airfreighting
to the UK adding to the variety available, but also to retailers in presenting new lines,
especially through the supermarket chains. Among the fruits were avocado, mango and
(perhaps) papaya. Smaller volume fruits including lychees and passionfruit were
mentioned. On a cautious note, the study concluded that opportunities for Sri Lankan
produce would centre on high value categories, which justified transportation costs. It also
concluded that few such products could be sent by sea owing to perishability, so airfreight
would be crucial. The main opportunities for Sri Lanka would lie in these higher value,
smaller volume categories e.g., exotic or speciality fruits and vegetables and the out-of-
season non-exotics e.g., strawberries. The main concern was whether Sri Lanka could land
produce in the UK at a competitive price, given the distance involved. It voiced some
doubts as follows:
"For many lines it is evident that however good the quality and presentation and however
efficient were production, marketing and distribution, Sri Lanka would be unable to land

produce in the UK at a price which was on a par with prevailing levels. This is largely a
matter of transportation costs, Sri Lanka's distance from the market imposing a major
barrier. In addition, production in major supplying countries is by large scale highly
efficient operations, and it must be questioned whether Sri Lanka is suited to such
agricultural organisation" (M&IA, 1988, p.i).
The SRD report finally listed the top five products for export from Sri Lanka.
1. Grapes
Their analysis showed an almost six month off-season market window, from mid-
December to the end of May. It noted that, up till then, off-season supplies have come
from temperate climate countries in the Southern Hemisphere. Tropical quality, table
grape production on a commercial scale is very recent, e.g., from Maharashtra, India.
Northern Europe is the best market and SRD recommended this as the top priority crop
for the Mahaweli. This crop has a lengthy storage life.
2. Strawberries
The best market window in major markets is from December to May and especially in
December and January. The crop has a short shelf life. It should be noted that
expertise in this crop exists in Nuwara Eliya from production through to market and
much could be learnt from this.
3. Asparagus
The European market window is from July to December/January. Again this is a
typically temperate climate crop and tropical production on an export scale is very
recent and will grow in Thailand and Sri Lanka. Fresh asparagus markets are largest in
West Germany, followed by France, Japan and other European countries. Production is
already under way in the Mahaweli, but yields, profitability and market connections
need further study.
4. Pineapple
Major competitors are from Latin America, tropical Africa and Southeast Asia
(Thailand, Malaysia and the Philippines). There has been a shift from processed to
fresh fruit in the market and it is becoming a major all year round fresh fruit staple.
Successful experimental trials have been undertaken in the Mahaweli (System H).

5. Bananas
SRD claimed that the most important market for Sri Lankan bananas in Europe was in
the speciality varieties, as the world market is dominated by the Cavendish variety.
Those with promise of high price and profitability and a market niche may be Ambul
and Kolikuttu, both native to Sri Lanka. The country is in a highly favourable position
to sell to Middle East markets from Iran to Libya. Historical ties between colonies with
multinational involvement dominate the large markets in Europe for Cavendish
bananas. Again, trials are in process in System H with these two local varieties under
irrigation. Systems B may be suitable for this crop in the Mahaweli.
The two broad approaches presented above represent opposite ends of the spectrum in
terms of developing a strategy for diversification for Sri Lanka. The first commences at the
production end, with familiar crops but with a limited vision of the potentialities of
modernising agriculture through crop diversification and on-demand irrigation. The market
strategy has the vision, in terms of an export crop strategy for diversification, but is weak at
the production end. Both approaches envisage diversification as being based upon the
irrigation technology currently available and do not consider modernisation. Perhaps this
last is too much to expect, yet in other countries dependent upon export-oriented crop
diversification, irrigation technology is a central concern. It is still a marginal
consideration in Sri Lanka, immersed as it has been in a rice based farming system and a
traditional gravity flow irrigation system. It is well recognised in Sri Lanka that this
system is not suited to the demands and needs of non-rice crops but to date neither crop
diversification nor the techniques of modernising irrigation water delivery systems and
their integration have become part of the thinking of policy makers.
This study recognises the continuing role of rice in the agricultural sector, as set out in the
previous chapter, and thus of the continuity of the traditional irrigation systems and
methods of water delivery. But in seeking to diversify production in the long term and on a
large scale, it also canvasses the options among irrigation technologies both to and on-farm,
for these determine productivity, investment levels and returns on investments. Above all,
the choice must be made amongst options that are adapted or are adaptable to the small
holder who is to be the basic production unit.

8.5 Field Production Data
One major weakness in the various recommendations of the export market strategy has
been the paucity of field production data on export-oriented crops selected by the SRD
study for their market potential. It is not that the crops in question are unknown in Sri
Lanka. Indeed of the eighteen priority crops, virtually all are produced on some scale,
however small. The problem is that very few are grown on an organised industry basis as
sole or even as interplanted crops. They may or may not be irrigated, but if they are, the
system used is 'low irrigation technology". Many are grown in house lots in a haphazard
cropping mixture. With such organisation, statistics on inputs, yields, costs, and returns are
of course not available. Data are almost non-existent on production under `high irrigation
technology', which is necessary to break the monsoon cycle.
The SRD study was conscious of both the production and the intermediate stages leading to
actual sales in export markets. They emphasised the wide variety of skills required in this
pioneering area of diversification, and identified three key areas in which experience was
required.
a) Experience in production of perishables.
b) Experience in post harvest handling and transport of perishables.
c) Experience in marketing of perishables.
But the SRD survey study team interacted mostly with private sector firms and not with
small holders. The preferred strategy was to find firms with production experience and
those that were capable of and interested in developing the necessary technological skills of
production and to use these as the starting base for each industry. Each would be allocated
a substantial area of suitable land, e.g., up to 50 acres, on a long-term lease. It was
envisaged that these firms would have a demonstration effect on surrounding smallholders
who would acquire the technology to grow the crop on a small scale. Technology and
support would thus flow from the central firm outwards in what is termed the 'outgrower'
system. This had already commenced independently with gherkins within and outside the
Mahaweli. Among private sector firms, 40 to 50 had some production experience with
perishables and a number had experience in four of the top seven products in priority,
pineapple, bananas, mangoes and melons, in order of frequency.
Experience was much less common in post-harvest handling and transport and perishables
(8 of 100 businessmen), so skills in cooling, selection, packaging and refrigerated transport

were seriously lacking, and this area was named as the single most important enterprise
capability constraint. This is hardly surprising, as marketing organisation is weak in Sri
Lanka. First, only a small volume of perishables is exported e.g., to the Maldives. Second,
marketing is dominated by small farmers with limited quantities of surplus produce for
sale, ‘assemblers’ who aggregate this produce, and 'collectors' who generally trade with
wholesalers located in the main consumption centres (Nippon Koei, 1988). The practices
of sorting, grading and drying of crops for storage are rare, as are cold store facilities,
which are needed between production areas and ports of exit. The transport infrastructure
is quite well developed (though not specifically for exports) but marketing facilities are
poor. The third area is export market experience. Farmers are not well informed about
prices, varieties or quality standards required for export. Only a few private sector firms
have had direct experience with these markets, particularly in Japan or Western Europe.
Thus there are gaps in knowledge of requirements in post harvest technology, handling and
transport of perishables and of course in export market information. These gaps can be
filled from experience available in other countries that can be transferred to Sri Lanka, with
modifications as may be needed. In relation to market demand, there are a number of ways
information can be obtained to assess market potential for new Sri Lankan exports. One,
however, with particular merit is ANUGA, the biennial food fair that has been held in
Cologne in the Federal Republic of Germany since the 1950s. It is the world's biggest food
fair and attracts buyers and sellers from all countries.
An area of greater concern is the nucleus firm/outgrower strategy of developing these
industries. While an attractive approach, there are inherent weaknesses in relying solely
upon it.
l. It is questionable whether enough private sector firms will be prepared to invest in each of the priority industries identified for development.
2. There is no assurance that they will be successful and thus subsequently have the desired demonstration effect upon outgrowers.
3. These `nucleus' firms appear to be expected to impart the necessary technology to outgrowers through active extension activities. It is open to doubt whether all or many would wish this involvement and/or would have the resources and expertise to participate in this way.
4. Even if they were willing, there would be a time lag involved. The nucleus firms would themselves have to achieve successful results on their own farms before they

could confidently offer technical advice to farmers. While large firms could afford to absorb initial losses, small holders could not.
This strategy of production organisation deserves support in cases where nucleus firms are
likely to be successful and wish to assist the development of an outgrower system.
However, it has restricted appeal from the viewpoints of whole industry organisation and of
a time frame for the development of broad (smallholder) based export industries. Since
MASL does not have the resources for much research and extension itself and already
depends heavily upon the Department of Agriculture, it seems appropriate that the
Department should play a role, if not the major role, in smallholder development of these
crops. This would involve a change in emphasis for the Department that hitherto has been
primarily concerned with rice. However, it could be achieved through an expansion of the
existing Horticulture Division, which in fact has been recently engaged in the importation
of a large number of varieties of a wide range of existing and exotic horticultural crops for
introduction and commercial development in Sri Lanka. Other Divisions should also be
strongly involved, particularly Research, Extension and Agricultural Economic and
Projects. This could remove much of the uncertainty of dependence of the smallholder on
the lead activities of the private sector and accelerate the contribution of the smallholder.
The private sector may well benefit more through expanded activity in the post-harvest to
marketing phases, where its strengths are more proven.
8.5.1 Processed Export Crops
Discussion to this point has focussed solely upon perishable export crops, as this has been
the focus of interest for diversification. Another direction in the diversification process is
into processed export crops. This area has been little explored as yet in terms of potential
in international markets, but is a logical next step, i.e., into post-harvest technology
research. It can be argued that the initial focus of the export strategy might be more
strongly focussed on processed commodities as they pose fewer problems in technology
between field and market, e.g., gherkins.
8.5.2 Import Substitution Products
The potential for expanded production of some commodities for the domestic market
should not be ignored where a potential exists. This has already been discussed in relation
to OFCs, where there is a limited potential except for chillie and perhaps onions. The other
commodity areas with potential under irrigation conditions are sericulture and livestock

products and within this latter category, milk production. At present, milk products are a
major and costly import item.
8.5.3 Dairy Development8
Dairy development was originally begun as a Draught Animal Programme by MEA in the
Mahaweli to enable substitution of draught animal power for expensive tractors. This was
expanded to include a Dairy component in 1983 as a result of the desire of farmers to add
one or two animal production units to their agricultural incomes. This latter programme
comprised:
Breeding better quality dual purpose animals. An active extension service. A positive nutrition programme. An animal health and disease control programme. An efficient milk collection system. Milk processing to give added value to the farmer .
By 1990, all indigenous animals will have been upgraded in Systems H and C using
imported bulls. The extension service has encouraged the formation of producer
associations (self- managed). Producers were paid fortnightly in Mahaweli areas.
However, by then only 10-15% of settlers is associated with income generating dairy
production. This was due primarily to the shortage of suitable improved stock to expand
the number of units.
In addition to these efforts, one large company in the private sector commenced dairy
development in 1983 through the encouragement of fresh milk collection from outgrowers.
Factories were set up in Anuradhapura, Kurunegala, Puttalam and Kandy. Total collections
have increased from 5.7 million litres in 1983 to 13.06 million litres in 1987. While this
was only a small proportion of total consumption of milk products, it is a profitable and
expansionary type of diversification for small holders, and deserves encouragement.
8.5.4 Other Livestock
Small holder participation in poultry, goat, pigs and duck programmes has started in the
Mahaweli but these programmes are currently given lower priority than dairy development.
8 This section benefited from advice of Mr C.de Saram, Secretary General, MASL who initiated and developed the Mahaweli Livestock Programmes.

9. Developments in Irrigation and Agriculture in the 1990s
This final chapter focuses on developments in irrigation and agriculture in the 1990s. It
examines agricultural performance and its major determinants in the 1990s highlighting
significant shifts in policy in the agricultural and irrigation sectors.
9.1 Agricultural Performance
During the 1980s, there was widespread concern that agricultural sector growth rates in
developing countries were much slower than those in the industrial and service sectors, and
that agricultural performance was retarding the overall pace of economic development.
Also, since population growth rates remained high and the transfer of labour out of
agriculture was slow, poverty was increasingly becoming concentrated in the rural sector.
This deteriorating situation led to a reassessment of development strategies from the mid-
1980s.
Table 9.1 Growth Rates and Structure of Real Output, 1986 to 1997 (constant prices)
1. Growth 1978-89a 1990-97a 1991 1992 1993 1994 1995 1996 1997 Agriculture 2.5 2.2 0.8 -2.4 5.0 3.8 3.3 -5.1 3.0 Manufacturing 5.4 8.7 6.8 8.8 10.5 9.1 9.2 6.5 9.3 Services 5.5 5.6 5.9 5.7 6.4 5.3 5.0 5.5 6.6 GDP 4.7 5.4 4.6 4.3 6.9 5.6 5.5 3.8 6.4 2. Structure 1980 1990 1991 1992 1993 1994 1995 1996 1997 Agriculture 22.2 19.9 19.2 18.0 17.6 17.3 17.0 15.5 15.0 Manufacturing 13.7 17.4 17.7 18.5 19.1 19.7 20.4 21.0 21.5 Services 58.5 56.4 57.1 57.8 57.5 57.4 57.1 58.1 58.2 GDP* 100.0 100.0 100.0 100.0 100.0 100.0 100.0 100.0 100.0
Notes: a. Annual average compound growth rate. * Includes Mining and Quarrying.
Sources: Ministry of Policy Planning and Implementation (1991) and Institute of Policy Studies (1998).
Sri Lanka was one such case of weak agricultural performance (Table 9.1). The average
growth rate of agricultural output during 1978-89 was 2.5 per cent per annum as against 5.4
per cent for manufacturing and 5.5 per cent for services, which substantially dampened the
growth rate of GDP to an average of 4.7 per cent. In the subsequent period of 1990-97,
average agricultural growth was slower at 2.2 per cent per annum, as against 8.7 per cent for
manufacturing and 5.6 per cent for services and 5.4 per cent for GDP. Over the period 1980
to 1997, the share of agriculture in GDP fell from 22.2 per cent to 15.0 per cent, but in 1995,
some 65 per cent of total population, and 40 per cent of the total workforce were still rural
based (World Bank 1995).
9.2.2 Determinants of Agricultural Performance
Key factors that influenced agricultural performance in the 1990s were irrigation policy and
the priority given to irrigation in the Public Investment Program (PIP), macroeconomic
policy and agricultural policy, which are considered below:
9.2.1. Irrigation Policy and Practice
Irrigation has been traditionally a cornerstone of agricultural development policy. It has
underpinned the policies of self-sufficiency in basic foods, enhancement of the nutritional
status of the people, and the alleviation of poverty. It has been a prominent, at times
dominant, component of the Public Investment Programme (PIP) as shown in this study.
Large scale irrigation schemes have been the leading edge of this policy, culminating in the
Accelerated Mahaweli Development Programme (AMDP).
At its height, the agricultural sector, including irrigation, dominated the PIP during the
1980s. In 1981-85, agriculture’s share was 45 per cent (Chapter 3, Table 3.3). Total
irrigation investment was 43 per cent of total PIP and thus dominated agricultural
investment. Of this, 38 per cent was on the Mahaweli (AMDP) and only 5 per cent on non-
Mahaweli.
In the 1980s, concerns grew over the dominance of irrigation and the AMDP. Possible
adverse impacts on Sri Lanka’s economy were canvassed by critics including:
inflationary pressures arising from the high and sustained levels of investment in irrigation.
postponement of essential developments in other sectors.
the crowding out, by emphasis on large scale new irrigation schemes, of other options within the irrigation sub-sector, such as rehabilitation schemes. Only 4 per cent of the cropped area was in new large irrigation schemes, while 41 per cent was in rehabilitated schemes, 24 per cent in minor schemes and 31 per cent in rainfed areas.

The unaffordably high opportunity cost of pursuing food security through physical self-sufficiency in basic foods in terms of sector growth foregone. The World Bank (1995) estimated that on 1993 output with no cost recovery, the total annual cost of the subsidy was US$250 million for paddy and other import-competing crops. This amounted to about 3 per cent of GDP and favoured farmers in major irrigation systems. The Bank calculated that the subsidy on recently constructed schemes was five times that in major rehabilitation schemes and seven times that in minor rehabilitated schemes.
In 1984, the National Food and Nutrition Strategy (NAFNS) called for a new perspective on
irrigation development (NAFNS 1984), in the form of redirection of investments towards
rehabilitation and new efforts in water management. It continued to espouse self-sufficiency
in basic foods, but it also advocated enhancement of incomes and creation of new
employment opportunities in the rural sector, improved nutritional status of the people and
expansion of export capacity to improve the balance of payments.
The World Bank (1987) highlighted serious challenges with respect to cost recovery, water
management and the rehabilitation of irrigation infrastructure. It emphasised that financial
viability required full cost recovery (capital and O&M) from the farmers and that an
economically efficient system required water to be priced by the market through supply and
demand interaction. The Bank urged irrigation policy reform through the treatment of
irrigation water as a private good with:
basic legal and institutional structures to facilitate market forces, and
enforceable water property rights for individual farmers and water markets.
The Bank criticised the high cost of irrigation in its Country Economic Memorandum
submitted to the Sri Lankan Aid Group Meeting in 1988 (World Bank 1988). The report
recommended that the share of irrigation/resettlement in future PIPs be reduced
substantially, and future investments should concentrate on high return projects in
rehabilitation and on the upgrading of existing irrigation schemes. It also recommended a
major reorientation of the existing programs, and particularly reconsideration of plans to
complete the fifth dam under the AMDP (Moragahakanda).
The cost of irrigation development, particularly of new large scale schemes, has been high
because successive Sri Lankan governments have regarded irrigation water as a public good
and have invested without recourse to cost recovery. In 1983, a nation-wide program of
water charges was introduced but with little success. Cost recovery conditionality was tried

but collections ceased in the face of political opposition and enforcement problems. To date,
the Bank’s efforts to introduce a cost recover program into irrigated areas has achieved a
degree of success only in the Mahaweli.
Greater priority was urged for rehabilitation schemes from the mid-1980s based partly on
attractive projected rates of return. While the need for rehabilitation of existing major and
minor schemes was clear, our ex post analysis of past schemes (Chapter 5) showed that
returns fell well short of expectations. The optimism was based on the prospects of a new
technology and cropping pattern – the “Walagambahuwa” model – included in successive
rehabilitation schemes. In practice this technology proved too risky for farmers who
preferred to continue with traditional practices. Nevertheless, the rehabilitation program of
major and minor schemes continued to be implemented in successive projects.
In practice, the 1990s witnessed a major shift in public investment away from agriculture
and irrigation in the PIP, as described in Chapter 3 (Table 3.3). The agricultural sector’s
share fell from a peak of 54 per cent in 1981-85 to 22 per cent in 1987-91 and again to 10
per cent in 1996-2000.
Total irrigation investment was 43 per cent of total PIP in 1981-85 and thus dominated
agricultural investment. By 1987-91, it was down to 15 per cent, with Mahaweli still
dominant (12 per cent) and non-Mahaweli only 3 per cent. By 1996-2000, total irrigation
was 5 per cent with Mahaweli 3 per cent and non-Mahaweli 2 per cent.
In the early 1990s, it was judged that practically all economically viable new irrigation
schemes had been constructed (Ministry of Finance and Planning 1992). With construction
and rehabilitation of most of the major schemes completed or nearing completion, budgetary
allocations to Other Irrigation also decreased. The emphasis shifted to institutional re-
orientation and rehabilitation of existing systems to optimize efficiency of water utilisation
(i.e., farmers’ organisations for O&M). There was also an increasing emphasis on
diversifying into high income agriculture based on consolidation of systems and improved
drainage, salt water exclusion and ground water development. Broad priorities were given to
sustainability, watershed management and comprehensive river basin development.
The emphasis in the PIP shifted to economic and social overheads. In 1981-85, total
investment in overheads were 27 per cent of PIP (23 per cent economic and 4 per cent

social). By 1996-2000, total overheads received 53 per cent of total PIP (40 per cent
economic and 13 per cent social).
9.2 Macroeconomic Policy
Under the policy regime pursued until 1977, the agricultural sector suffered from
discrimination in favour of manufacturing with:
high effective rates of protection through high import tariffs and trade restrictions on final products
lower but substantial import tariffs on intermediate products,
an overvalued exchange rate
export taxes on tree crops
In the 1980s and 1990s, the Sri Lankan government pursued a course of economic reform
through liberalisation, market-orientation and globalisation, which progressively reversed
previous inward-looking policies of stringent exchange and trade controls and import
substitution, and state intervention in all areas of economic activity (Athukorala 1997). The
agenda for reform and liberalisation including reduction of levels and adjustment of relative
levels of protection between sectors, particularly of bias towards manufacturing at the
expense of agriculture. Trade liberalisation programs underway since 1977 included rebate
schemes for manufactured exports to provide access to imported inputs at duty free prices,
but these had limited effect on agriculture due to the relatively low use of imported inputs.
After 1988, the pace of trade liberalisation was slow and poorly designed (Athukorala
1997). Where some tariffs were reduced, benefits were moderated by changes in other taxes
or administrative procedures. Instead of liberalising trade, the main focus was in trying to
offset biases in the protection system against exports through a host of special incentives for
exporters. In the face of a strong bias against agriculture, pressures also developed for
further interventions aimed at protecting or subsidising some segments of agriculture rather
than phasing out high protection for import substituting manufactures.
Agricultural price and trade policies were left virtually undisturbed. The most important
intervention domestically was the Guaranteed Price Scheme (GPS) for paddy, which set the
domestic producer price above the border price. This was introduced in 1948 and still
applies. However in recent years, a restrictive import price has had a greater impact.

Government intervention in paddy marketing was greatly reduced with only a small
proportion of paddy output purchased.
A study of protection undertaken by the World Bank (1995) quantified the types and levels
of protection given in 1993 to agriculture, to sub-sectors within agriculture and the relative
levels between agriculture and manufacturing. As bias against agriculture has been
considered to be a factor retarding agricultural performance, the major findings are
presented below:
(a) Agriculture
There was positive protection for the main import-competing crops (paddy, chillie,onion
and potato), as measured on output. Nominal Protection Coefficients (NPCs)9, were in
excess of 1. The NPC for rice was 1.3 in 1993. In 1985-93, NPCs averaged 1.3 for
chillie, 2.0 for big onions and 1.6 for potato. Using production weights, the average NPC
for import competing crops was 1.33, which was close to rice.
The Effective Protection Coefficient (EPC)10, which measured protection provided to
rice on traded inputs and output, was small after 1990. In 1993, it was between 1.34 and
1.38 for rice, depending on the water regime (Table 9.2). Average EPCs for rice and
import competing crops were 1.36 and 1.70 in 1993. Both were close to their respective
NPC estimates in that year, showing that output price policy dominated price-based
production incentives for farmers.
The EPC for export crops in 1990-93 averaged 1.02, implying a virtually neutral regime.
Nonplantation export crops were mainly fruits, vegetables, foliage plants, medicinal
herbs, etc., which showed active growth up to the early 1990s. Other minor crops, such
as cinnamon and raw tobacco also showed growth.
The overall EPC was 1.35 for the nonplantation crop sector in 1993. It was 1.00 for
plantation agriculture, which reflected the removal of export taxes on plantation
products. The EPC was 1.24 for agriculture as a whole.
9 Positive protection is indicated by ratios exceeding 1. 10 Effective Protection Coefficients (EPCs) measure net incentive for a crop showing the combined net protection or disprotection received by output and by traded inputs (fertilisers, agrochemicals, machinery) used in its production.

Effective Subsidy Coefficients (ESCs)11 are important in Sri Lanka because of the
importance of irrigation, research and extension in crop agriculture, for which cost
recovery has been zero. For irrigation, the subsidy is 100 per cent of the annual cost
repayment, finance and O&M charges. In large scale irrigation systems, the construction
cost subsidy was 96 per cent of the economic value added per hectare for paddy. With
no cost recovery, the subsidy to major new irrigation systems was as high as US$1,000
per hectare per annum. The O&M subsidy was 3.5 per cent of the economic value added
for paddy. For rehabilitation investment, the subsidy totaled 27 per cent for major and 21
per cent for minor schemes respectively.
This comprehensive measure (ESC) showed that agriculture benefited far more than was
apparent from the EPCs. The ESC was 2.30 for paddy produced on a recently constructed
large scale irrigation scheme, as against its EPC of 1.34. Other import competing and export
crops produced under similar conditions experienced similar additional protection. For
average paddy production nation-wide (Table 9.2), the increase was 20 per cent (1.36 to
1.56), while for the plantation sector overall, there was a 10 per cent increase (1.35 to 1.45).
Thus the most substantial increases came from irrigated agriculture and particularly from
new large scale schemes.
In contrast, the plantation sector had an ESC of 1.03 in 1993 and so was highly
disprotected compared with irrigated agriculture.
Domestic Resource Cost (DRC) analysis showed Sri Lanka had no comparative
advantage in production of rice or other field crops under irrigation or rainfed, i.e.
domestic production was more costly than imports.
In review, far from suffering an anti-agricultural bias, paddy farmers have received
support of around 5 per cent of GDP to produce a low value and uncompetitive crop.
Furthermore the concentration of irrigation expenditure on construction of large scale
irrigation systems resulted in a large subsidy being captured by only around 3 per cent of
all farmers. Within the nonplantation crop sector, the protection afforded paddy and
other import competing crops has been much higher than for export crops. This bias has
been a clear impediment to diversification and export orientation within the agricultural
sector, and has encouraged it to retain its traditional inward orientation.
11 Effective Subsidy Coefficients (ESCs) include subsidies on nontraded as well as traded inputs and outputs.
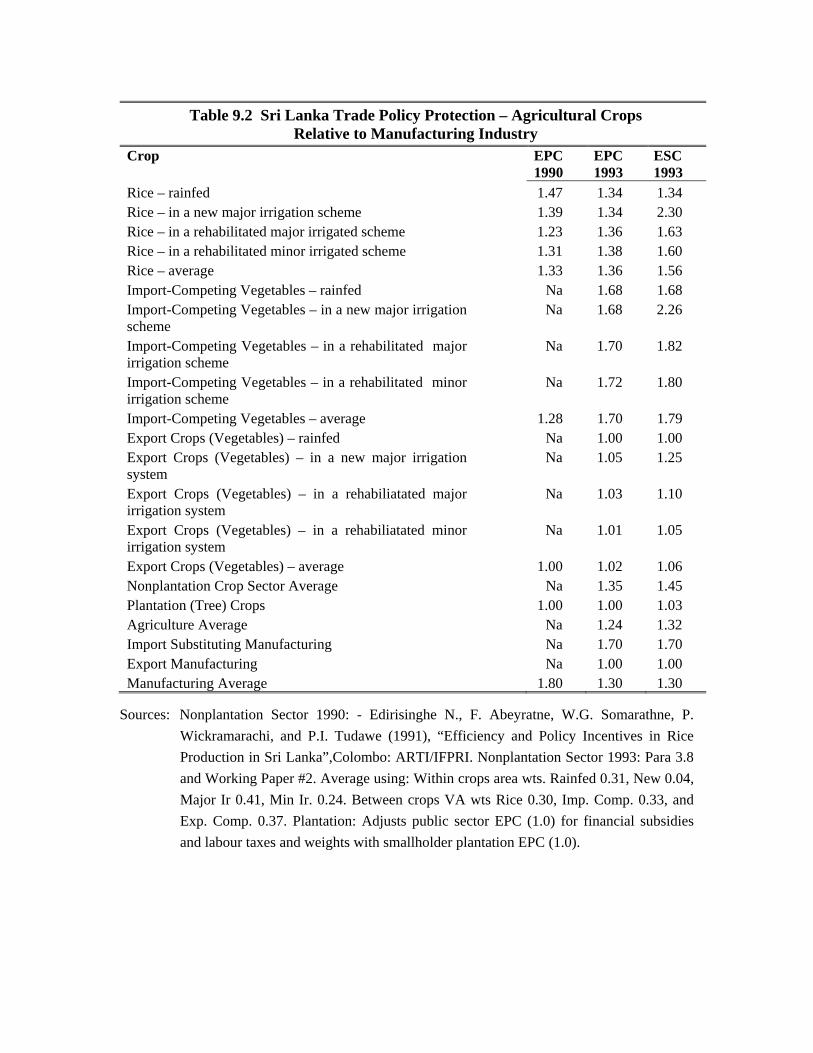
Table 9.2 Sri Lanka Trade Policy Protection – Agricultural Crops Relative to Manufacturing Industry
Crop EPC 1990
EPC 1993
ESC 1993
Rice – rainfed 1.47 1.34 1.34 Rice – in a new major irrigation scheme 1.39 1.34 2.30 Rice – in a rehabilitated major irrigated scheme 1.23 1.36 1.63 Rice – in a rehabilitated minor irrigated scheme 1.31 1.38 1.60 Rice – average 1.33 1.36 1.56 Import-Competing Vegetables – rainfed Na 1.68 1.68 Import-Competing Vegetables – in a new major irrigation scheme
Na 1.68 2.26
Import-Competing Vegetables – in a rehabilitated major irrigation scheme
Na 1.70 1.82
Import-Competing Vegetables – in a rehabilitated minor irrigation scheme
Na 1.72 1.80
Import-Competing Vegetables – average 1.28 1.70 1.79 Export Crops (Vegetables) – rainfed Na 1.00 1.00 Export Crops (Vegetables) – in a new major irrigation system
Na 1.05 1.25
Export Crops (Vegetables) – in a rehabiliatated major irrigation system
Na 1.03 1.10
Export Crops (Vegetables) – in a rehabiliatated minor irrigation system
Na 1.01 1.05
Export Crops (Vegetables) – average 1.00 1.02 1.06 Nonplantation Crop Sector Average Na 1.35 1.45 Plantation (Tree) Crops 1.00 1.00 1.03 Agriculture Average Na 1.24 1.32 Import Substituting Manufacturing Na 1.70 1.70 Export Manufacturing Na 1.00 1.00 Manufacturing Average 1.80 1.30 1.30
Sources: Nonplantation Sector 1990: - Edirisinghe N., F. Abeyratne, W.G. Somarathne, P.
Wickramarachi, and P.I. Tudawe (1991), “Efficiency and Policy Incentives in Rice
Production in Sri Lanka”,Colombo: ARTI/IFPRI. Nonplantation Sector 1993: Para 3.8
and Working Paper #2. Average using: Within crops area wts. Rainfed 0.31, New 0.04,
Major Ir 0.41, Min Ir. 0.24. Between crops VA wts Rice 0.30, Imp. Comp. 0.33, and
Exp. Comp. 0.37. Plantation: Adjusts public sector EPC (1.0) for financial subsidies
and labour taxes and weights with smallholder plantation EPC (1.0).

Table 9.2 (continued)
Crop Crop Protection (ESC) relative to:
Import Substg.Manufact-
uring
Export Manufact-
uring
Manufact-uring
Average
Rice – rainfed 0.79 1.40 1.03 Rice – in a new major irrigation scheme 1.35 2.30 1.77 Rice – in a rehabilitated major irrigated scheme 0.96 1.61 1.25 Rice – in a rehabilitated minor irrigated scheme 0.94 1.60 1.23 Rice – average 0.92 1.59 1.20 Import-Competing Vegetables – rainfed 0.99 1.35 1.29 Import-Competing Vegetables – in a new major irrigation scheme
1.33 1.57 1.74
Import-Competing Vegetables – in a rehabilitated major irrigation scheme
1.07 1.41 1.40
Import-Competing Vegetables – in a rehabilitated minor irrigation scheme
1.06 1.39 1.39
Import-Competing Vegetables – average 1.05 1.39 1.38 Export Crops (Vegetables) – rainfed 0.59 1.00 0.77 Export Crops (Vegetables) – in a new major irrigation system
0.74 1.16 0.96
Export Crops (Vegetables) – in a rehabiliatated major irrigation system
0.65 1.04 0.85
Export Crops (Vegetables) – in a rehabiliatated minor irrigation system
0.62 1.03 0.81
Export Crops (Vegetables) – average 0.62 1.03 0.82 Nonplantation Crop Sector Average 0.85 1.28 1.12 Plantation (Tree) Crops 0.61 1.03 0.79 Agriculture Average 0.78 1.20 1.02 Import Substituting Manufacturing - 1.70 1.31 Export Manufacturing 0.59 - 0.77 Manufacturing Average 0.77 1.21 -
Sources (continued) Agricultural Average: Weighted average, using 1993 value added shares as
weights. Nonplantation 0.68, Plantation 0.32. Import manufacturing: - Edwards
C. (1993) Protectionism and Trade Policy in Manufacturing and Agriculture:
Sri Lanka Institute of Policy Studies. Estimation process gives upward bias,
but used in the absence of any meaningful basis to adjust for this. Export
manufacturing: - assumes no export subsidies and refund of import taxes on
inputs. Manufacturing Average: - weighted average of industrial production,
60 per cent exports and 40 per cent import substitutes.

(b) Agriculture versus Manufacturing
Within the two components of manufacturing, the World Bank (1995) study showed:
export manufacturing enjoyed no protection or disprotection with an ESC of 1.00 in
1993 (Table 9.2).
import substituting manufacturing recorded an ESC of 1.70 in 1993. This suggests a
higher level of protection for this type of manufacturing than for average non-plantation
agriculture (1.45) and for average agriculture (1.32). However, the measure for import
substituting manufacturing was derived from the tariff schedule rather than from
comparison of actual prices. Tariff collection was subject to widespread ad hoc
exemptions, reducing the effective rate below the actual rate. In 1992-93, import tariffs
were restructured into three bands between a maximum of 35 per cent and a minimum of
15 per cent, which further reduced industry protection. Finally, to obtain an overall
protection rate for industry, the weightage of 60 per cent for manufactured exports (EPC
= 1.00) reduced protection even further and gave an average EPC and ESC for
manufacturing of only 1.30, a little below the ESC of 1.32 for agriculture.
The average EPC or protection for import substituting manufacturing of 1.70 was clearly
greater than that for agriculture in 1993 of 1.24. Like plantation tree crops in agriculture,
the EPC for export manufacturing was near unity and close to policy-neutrality. The
EPC for average manufacturing (1.30) was slightly higher than the 1.24 for average
agriculture in 1993. This comparison shows that, overall, there was little difference in
the levels of protection between the two sectors.
The substantial differences came from within agriculture where the extent of protection
was higher for non-plantation agriculture. It was:
much higher for irrigated non-plantation crop agriculture,
increased with the size of the irrigation system, and
was inversely related to the age of the system (Table 9.2).
The degree of protection of the various crops relative to manufacturing industry (Table 9.2)
with crops differentiated by types of irrigation system shows:

Within the nonplantation sector
Average nonplantation crop protection (ESC of 1.45) was higher than for manufacturing
(EPC/ESC of 1.30) and received much more protection than export manufacturing
(EPC/ESC of 1.00).
Relative to export manufacturing, only rainfed export crops received the same
disprotection as manufacturing exports.
Irrigated crops were given far more protection relative to manufacturing than rainfed
crops, e.g., paddy grown in Mahaweli received 230 per cent more protection than
manufacturing exports such as garments.
Paddy grown in rainfed areas received only 40 per cent more protection.
Export vegetables averaged only 3 per cent more protection, while export vegetables
grown in rainfed areas received the same zero protection as manufactured exports.
Within the nonplantation sector:
relatively favourable treatment was given to paddy and other import-competing crops
relative to export crops, i.e., on average 47 per cent more protection for rice and 117 per
cent for rice in the Mahaweli, and 69 per cent for other import-competing crops.
this showed a strong inward-looking or anti-export bias in agricultural trade policy,
which discouraged diversification.
Sri Lanka has recently acceded to trade reform measures under the Uruguay Round
Agreement on Agriculture (URAA), which means that agriculture is now covered by
mainstream GATT rules for agricultural trading (Athukorala and Kelegama 1998). In 1996,
Sri Lanka still retained import restrictions on a few commodities, but under pressure has
since complied. It bound all tariffs on agricultural goods at a uniform 50 per cent and has
removed quantitative restrictions (QRs) on all but wheat and flour. It has also begun to
dismantle import licensing and reduce tariffs on agricultural imports. There has been a
consensus on the desirability of going further with trade liberalisation and trade reform has
been accepted as beneficial for growth and poverty alleviation.

9.2.3 Agricultural Policy: Paddy Farming and Diversification
The 1995 World Bank study also estimated the comparative advantage of producing the
main import-competing crops in Sri Lanka, using the Domestic Resource Cost (DRC)12.
For paddy, the DRC ratio varied from 2.16 in new large scale irrigation systems to 1.53 in
rainfed production. It was generally higher in regions with high yields, implying a negative
relation between yield and DRC, owing to higher irrigation investment and O&M costs. But
estimates exceeded unity for all regions, averaging 1.73 for Maha season 1993. Thus for its
most important crop, Sri Lanka possessed no comparative advantage.
Amongst other food crops, the DRC ratio for chillie also exceeded unity, varying from 1.68
rainfed in Anuradhapura to 2.17 irrigated in Jaffna, and implied losses for this crop. Also,
since assumptions about cropping intensity and the construction period for irrigation
schemes were overly-optimistic, these DRC estimates were biased downwards, indicating
the situation was likely to be worse.
Clearly there has been a very high cost attached to self-sufficiency in food crops, especially
rice. The World Bank study estimated that the total annual transfer from taxpayers to paddy
producers, mostly in irrigation infrastructure, based on 1993 output, was about US$240
million for paddy and $8 million for chillie, giving a total of $250 million or around 3 per
cent of GDP.
Nonplantation agriculture has been stagnant and incomes low in the 1990s. Paddy output
has shown no trend or yield gains since 1990. Paddy prices and real net incomes have fallen,
making subsistence difficult for farmers. Diversification of nonplantation crop agriculture
has been disappointing. Trials were conducted on horticultural crops with an export
emphasis after 1989 (Institute of Policy Studies 1997), combined with contract farming as a
way of involving smallholders. There was some progress, particularly with gherkins, which
supplied 80 per cent of vegetable exports in 1993 and 1994, but this expansion was short-
lived and collapsed in 1995 and 1996 from low yields and high cost of production. Also,
contract farming failed to realise its promise. Most recently, the liberalisation of food crop
imports has lowered prices for crops such as chillie and potato and production has declined
(Institute of Policy Studies 1998).
12 The DRC ratio shows the cost of domestic resources used to produce a unit of foreign exchange, or the value (cost) of the resources used to produce a unit of the product. Comparative advantage increases below 1, while losses increase above 1.

Views diverge as to the seriousness of the agrarian situation in Sri Lanka’s rural sector. The
World Bank (1995) calculated that the incidence of absolute poverty declined between 1985
and 1993, with the proportion of rural households below the poverty line falling from 32 per
cent in 1985/86 to 24 per cent in 1990/91. This improvement was attributed to an increase
in real average per capita consumption (5 per cent ) and to a better income distribution (the
Gini coefficient down from 0.30 to 0.28 in 1995).
The World Bank (1996) believed farm input and output markets were not constraints and
placed the blame for stagnation on the rural markets for labour and land.
The Bank argued that off-farm employment earns more than any crops other than paddy. As
paddy required little labour, farmers maximise earnings from off-farm employment. The
Bank saw off-farm labour market as the key to farmers’ behaviour and to its
recommendations.
The Land Reform Law of 1970 and 1975 Amendment nationalised large estates and
regulated the size of paddy farms, alienating excesses for redistribution to smallholders as
tenants in perpetuity. The ceiling on private owner operated paddy land was 25 acres, and 5
acres for tenant farming and in public sector irrigation schemes. Rapid population growth
since World War II, slow growth of employment in other sectors and the limits of cultivable
land being reached have meant that population pressure on existing agricultural land has
become intense and farm size has been dwindling. Increasing cropping intensity, which has
been low and falling, has not counterbalanced this. A three-year CI average for paddy in
1988/89 to 1990/91 was only 109 per cent .
At present there is no formal market for land. Government land is only leased and there are
no sales or sub-leases. Normal adjustment in farm size is blocked by dominance of
Government land ownership and the ineffective land market. The Bank accordingly
recommended:
- a generalised policy of private ownership of agricultural land
- programs in settlement areas to transfer ownership to listed tenants
- programs to enhance the efficiency and transparency of the land market, and
- elimination of restrictions on land use.

The World Bank’s broad recommendations for the agriculture sector (1995 and 1996) were:
diversification from paddy into higher value crops, livestock, forestry and fisheries. For
this, the following improvements were needed:
- a well functioning land market - further privatisation of the tree crop sector - removal of constraints of existing agricultural trade policies and state intervention
in marketing. - continuing public support in research and extension - infrastructure up-grading and human resource development - institutional reforms in the Mahaweli.
With poverty reduction as a concomitant of better agricultural policies, growth was to be
achieved with:
- creation of an effective land market (collateralizing land, enabling mobility of labour without loss of asset base and increased holding size to encourage commercial farming for higher incomes)
- lower state intervention in trade and pricing policies with public sector support to be made cost-effective. Inefficient paddy was protected by tariffs and subsidies on non-traded goods, which do not help the poor.
Dunham and Edwards (1997) took issue with the World Bank’s analysis and conclusions
and argued that an agrarian crisis had been growing in rural areas since the mid-1980s from
population pressure on finite land resources engendered by:
an acute land shortage,
small and diminishing farm size, and
low out-migration, with rural population still comprising 72 per cent of the total in
1990/91.
The authors then argued that real incomes in the peasant sector were stagnant or declining
from the mid-1980s owing to stagnant or declining real income from paddy. This decline
could be attributed to:
a decline in the real price of paddy, stagnation in average paddy yields and a decline in the hired labour for paddy.
limited success achieved in crop diversification into higher value crops. Statistics showed a decline in sown area of paddy by 11 per cent , which
suggested that some diversification had occurred in the second half of 1980s. Value added from “other agriculture” rose steeply 1985 to 1991 but this was not confirmed by sectoral and area studies, which suggested on-farm diversification was uneven, occurred mainly in Yala season, and was generally slow growing. Few farmers with significant assets experimented this way. Homestead production did not appear to have expanded. There was some increase in area of some subsidiary crops (onions, potatoes and green gram) but not for others (Bombay onions and chillie). Thus crop diversification did not appear to have been a major new source of income for the rural poor.
Progress was also restricted in extensive development to new land. There was
settlement in Mahaweli but the rate declined to 1993, at the time when the
World Bank claimed that poverty had declined. There was no evidence that
many escaped from poverty.
the rate of job creation in the rural non-farm sector was extremely slow. There was
little information on rural non-farm incomes though it was thought to be low
productivity, mostly in services and unlikely to be the answer to poverty. Less was
known about trends over time and real wage rates in rural non-farm employment.
The World Bank argued that there was significant movement out of agriculture
between 1985 and 1990 – either out of rural areas or into rural industrialisation. But
migration out of rural areas was low and was difficult to judge the impact of
industrialisation. Survey data did not show that industrial employment had risen, and
at that time it was mostly in Greater Colombo. Also, with real farm incomes in
decline, it was unlikely that any substantial increase in rural employment was
created. A 200 Garment Factory scheme was started in rural areas but not until after
1990, so rural non-farm employment grew very slowly, at least until after 1990.
Dunham and Edwards argued three objective factors were signaling a deepening agrarian
crisis in the Sri Lankan countryside:
prices had moved against paddy and average yields had stagnated with falling returns per family labour day and in the absence of an increase in the demand for casual labour
on-farm diversification out of paddy into other crops had been very limited, generating little employment and little extensive development
rural non-farm employment had grown very slowly, at least after 1990.

Given the already high incidence of poverty, these amounted to an agrarian crisis –
production and social. This conclusion flatly contradicted the World Bank’s argument
(1995) that rural poverty had been declining since the mid-1980s in the following ways:
__________________________________________________________________________ World Bank Dunham and Edwards __________________________________________________________________________ sufficient out-migration to reduce poverty no evidence for this and some counter-
evidence
income transfers into the rural areas not enough to make a difference the agrarian crisis is a myth a review of paddy incomes showed
declining earnings regardless of the deflator or methodology
Poverty Assessment Report calculations the PAR calculations were wrong. There are indicated lower poverty incidence no concrete grounds for doubting their own
conclusions though there were areas of uncertainty. The Bank’s argument was rooted in two surveys’ evidence which were both in unusual years so their analysis was skewed.
Dunham and Edwards concluded that agricultural growth had been far too slow to affect
poverty levels. With 80 per cent of the poor in agriculture and a relatively slow rate of
absorption into non-agricultural activities, what happened in agriculture was of major social
and economic importance.
The authors criticised the Bank for failing to account for Sri Lanka’s special characteristics
in agriculture:
Farm size argument was crop specific; small scale farmers can diversify,
Sri Lanka’s farm sector is increasingly dependent on transfers from outside to enable them to survive. It is a remittance and transfer economy, which has ramifications for agricultural policies. Since they depend massively on funds from outside, they may not feel inclined to sell up their land, and concessionary input credit may not have the desired effect.
There was no evidence that transfers had been fed productively into agriculture. If land ownership became concentrated and transfers fell, social differentiation may be exacerbated with worrying implications for stability. Local conditions must be taken into account.

In 1995, after forming a new government, President Chandrika Kumaratunga issued a new
policy statement for agriculture. The Government’s programme of action to achieve broad
sectoral goals would include the following new reform initiatives:
remove hidden discrimination against agriculture from inequitable
macroeconomic and trade policies of the past.
all types of agricultural market monopolies will be eliminated and greater competition fostered.
Domestic agricultural prices will be brought into line with international prices over time.
The agricultural research system will be reorganised to make it more responsive to markets. Producers and other private sector agencies will be given a greater voice in research planning bodies. A program of market research will be developed to provide more information on prices and market trends. These measures will enhance productivity.
A more appropriate division of labour between public and private sectors will be achieved in the management of the nation’s irrigation facilities. It is a matter of concern that many farmers in the Mahaweli settlements earn less than Rs. 1,500 per month, so that these huge investments have sustained poverty instead of prosperity. In particular commercial activities can be handed over to the private sector, and downstream operation and maintenance activities to relevant public agencies and farmer organisations.
Improvements in agricultural productivity and incomes, together with the creation of non-farm jobs, are the only viable solutions to rural poverty.
A well coordinated plan to develop the conjunctive use of surface, ground and run-off water will be implemented with due regard for environmental considerations.
The 1990s have witnessed a sharp reduction in the role of irrigation in agricultural
development policy, particularly in new investment with the completion of the AMDP. This
has relieved pressures on the Public Investment Programme. The decade has seen further
liberalisation and globalisation in macroeconomic policy, which has removed intersectoral
bias against agriculture. Also, new policy guidelines have been set for agriculture. But to
date, there has been no significant improvement in agricultural growth performance. This
appears to be partly due to lack of progress with diversification into higher value crops,
particularly for export, which remains a challenge. This is coupled with the absence of relief
from resource pressures through accelerated out-migration of rural labour or from improved
rural labour market opportunities.

Annex 1
1. Public Sector Restructuring Project: Irrigation Sub-Sector Study Terms of Reference
The tasks to be undertaken by the research team will consist of but not be limited to the following: A) Review past expenditure allocations to irrigation and area related projects in the
Public Sector Investment Program.
B) Examine the overall allocation for irrigation including irrigation related multi-purpose area development projects versus other claims on the capital budget.
C) Assess options for investment in irrigation, e.g., new irrigation related multi-purpose area development, expanded program for tank rehabilitation and improvement, supplementary irrigation facilities of a combination of these strategies etc.
D) Make policy recommendations for the overall investment pattern and investment options in irrigation and related multi-purpose area development and also make proposals on sector related programs and projects.
2. Assessment of Benefits/Costs of Future Mahaweli Related Investment Costs
A) Assess investment requirements for on-going programs such as Mahaweli System `B' Left Bank and System `C' and new projects.
B) Review completion of the Mahaweli System `B' Right Bank works with possible re-designing of components of the project emphasising activities (such as crop diversification, newer irrigation technologies, agro-industrial development etc.) giving a higher rate of return.
C) Review Upper Mahaweli Peripheral Development work (UMPD). D) Assess operation and maintenance requirements of irrigation systems within the
context of improved water management and farmer participation that will encourage cost recovery.
E) Review all proposed/potential area development program for irrigation agriculture within Sri Lanka, e.g., Moragahakanda Project. Assess economic costs, benefits, financial implications and systems water balance effects of such project.

Benefits A) Examine Benefits/Costs of predominantly rice based agricultural development with
special reference to self sufficiency in rice on the basis of present and potential levels of productivity and planned expansion in irrigable area inclusive of the Mahaweli and Moragahakanda projects.
B) Assess the impact of returns of past and intended investments resulting from a)
changing strategies for production patterns, adoption of more efficient technologies for water use, water provision and crop productivity, b) improving the incentive management structure, c) crop diversification.
C) Assess the relative merits of Benefits A) and B) above for strengthening employment
investment and enterprise development activities and commercial agriculture. 3. Structure of Costs/Benefits
Review the structure of costs/benefits of irrigation development to allow a proper comparison of investment in various modes of water resources development.

References Abeyratne, Senaka, (1986). Rice Supply, Demand and Self Sufficiency Prospects in Sri
Lanka: An Overview, (mimeo) USAID, Colombo. Abeyratne, Shyamala, Piyasena Ganewatte, and Douglas J. Merry (eds.) (1986) -
Proceedings of a Workshop on Water Management in Sri Lanka, January 20-22, 1982, ARTI Documentation Series No.10, Colombo ARTI.
Abeysekera, W. A. T. (1984). A Preliminary Assessment of the Performance of a Major
Tank Rehabilitation Program: The Case of Tank Irrigation Modernisation Project Research. Study No 60, Colombo, Agrarian Research Study Training Institute.
Abeysekera, W. A. Terrance (1986). Improvement of Irrigation System Performance in Sri Lanka: The Experience at Mahavilachchiya Settlement. Unpublished PhD
dissertation. Ithaca, USA, Cornell University. Abeysekera, W. A. T. (1986). Mobilising Farmer Participation in Irrigation Rehabilitation
and Management Programs: The case of Tank Irrigation Modernisation Projects, in the Proceedings of the Workshop on Participatory Management in Sri Lanka's Irrigation Schemes, IIMI Kandy, 1986.
Abeysinghe, Ariya (1982a). Minor Irrigation in the Agricultural Development of Sri
Lanka, (Part I) Economic Review, September. Abeysinghe, Ariya (1982b). Minor Irrigation in the Agricultural Development of Sri
Lanka (Part II) Economic Review, October/November. Abeysinghe, Ariya (1986). Agro-Industrial Development in Sri Lanka, Economic Review,
Vol. 12, No. 2.
Abeysinghe, Ariya (1988). Some Issues in Agricultural Marketing in Sri Lanka. (Paper
presented at the EDIABA/SEAMEO/SEARCO Agricultural Marketing Seminar,
Indonesia). Abeysinghe, Ariya and Jayantha Jayewardena (ud). Review of existing price support
system, effects of imports on Mahaweli produce, recommend a better price support system, identification of crops and commodities for price support (mimeo).
Abeysinghe, Ariya and B. K. D. S. Samarasinghe (ud). Demand analysis of crops with a
local and foreign demand, qualification of demand (mimeo).

Abeywardena, V. (1968). Forecasting coconut crops using rainfall data. Proceedings of FAO working party on coconut production, and processing (3rd session) FAO, Rome (PGIA).
Abeywardena, V. (1979). Influence of watering on the yield of coconut. Ceylon Coconut.
Q 30 (3/4). Abeywickrema, N. (1984). Irrigation and Water Management Policies in Sri Lanka.
Progress, Volume 4, Issue 1. Ministry of Plan Implementation, Colombo. Abeywickrema, Nanda (1986). Government policy in participatory management.
Participatory Management in Sri Lanka's Irrigation Schemes. Digana Village Sri Lanka: International Irrigation Management Institute, pp 17-28.
Acres (1980). Maduru Oya Project: Feasibility report. Acres International Ltd, Niagara
Falls, Canada. Acres (1986). Mahaweli Water Resources Management Project: Studies of Operating
Policy Options, Acres, Niagara Falls, Canada. Agrarian Research and Training Institute (ARTI) (1986). Abstracts of papers. Seminar on
Irrigation Water Management and Agricultural Development in Sri Lanka 20-21 February. Irrigation Management Research Information Centre Documentation Series No. 1. Colombo: ARTI.
Agroskills Ltd. (1983). Subsidiary Food Crops Marketing Study, Commissioned for
NAFNS by NDP, Ministry of Finance and Planning and USAID. Agroskills Ltd. (1985a). Prospects for crops and agro-industries. Report on Sub-Task
No.1, Mahaweli Enterprise Development Strategy, Agroskills Ltd. Agroskills Ltd. (1985b). Mahaweli Enterprise Development Strategy: Prospects for Crops
and Agro-Industries. Report on Sub-Task No. 1, Colombo, Agroskills Ltd. Agroskills Ltd. (1985c). Mahaweli Enterprise Development Strategy: Information System
for the Strategy, Report on Sub-Task No. 6, Colombo, Agroskills Ltd. Alles, W. S. (1967). Soil and Water Conservation in the Dry Zone. Aluwihare, P.B. and Masao Kikuchi (1991). Irrigation Investment Trends in Sri Lanka:
New Construction and Beyond. Colombo, IIMI. Alwis, J. (1986). Irrigation legislation and participatory management. Participatory
Management in Sri Lanka's Irrigation Schemes. Digana Village, Sri Lanka: International Irrigation Management Institute, pp 29-40.

Arcon Development Bank (1979). Project Completion Report of the Walawe Development Project in Sri Lanka, Manila, Asian Development Bank.
Arugam, S. (1969). Water Resources of Ceylon: Its Utilisation and Development.
Colombo: Water Resources Board. Asian Development Bank (1979). Project Completion Report of the Walawe Development Project in Sri Lanka. Manila, Asian Development Bank. Asian Development Bank (1980). Appraisal of Anuradhapura Dry Zone Agricultural
Projects in Sri Lanka. Report No. SPI:AP-20. Manila, Asian Development Bank. Asian Development Bank (1986a). Irrigation Service Fees Proceedings of the Regional
Seminar Irrigation Service Fees. ADB, (1986) of the Regional Seminar on Irrigation Service Fees. Manila, Asian Development Bank.
Asian Development Bank (1986b). Review of Bank Operations in the Irrigation Sector,
1966-85, Manila: Asian Development Bank. Asian Development Bank (1995). Industry sector policy review, Sri Lanka, Ministry of
Industrial Development. TA.No 2161-SRI, September. Asian Development Bank and International Irrigation Management Institute (1986).
Irrigation Service Fees, Proceedings of the Regional Seminar on Irrigation Service Fees. Manila: Asian Development Bank.
Asian Regional Team for Employment (1986). Sri Lanka: Employment and Development
in the Domestic Food Crop Sector, A Report Prepared for the Ministry of Agricultural Development and Research, Sri Lanka. New Delhi, ARTEP-ILO.
Athukorala, Prema-Chandra and Saman Kelegama (1998). “The political economy of
agricultural trade policy: Sri Lanka in the Uruguay Round”, Contemporary South Asia, 7(1) 7-26.
Bandaragoda, D.J. (1988). Non-Farm Employment in the Settlement Sector in Sri Lanka
with Special Reference to the Mahaweli Development Programme. Research Studies, Employment Series 1, Colombo: Institute of Policy Studies.
Beets, W. (1982). Multiple Cropping and Tropical Farming Systems. Gower Publishing
Company Ltd. Begum, Szleh (1987). Minor Tank Water Management in the Dry Zone of Sri Lanka.
Occasional Publication No. 39, Colombo: ARTI. Bertin, Y. (1976). The cultivation of passionfruit in Sri Lanka (Ceylon): Fruits, (France).

Bogahawatte, C., C. Sivayogananthan and H. M. G. Herath (1984). Socio-Economic Data of Selected Village Irrigation Schemes in Sri Lanka (Village Irrigation Rehabilitation Project), Working Paper No. 2, Peradeniya: Department of Agricultural Economic and Extension, Faculty of Agriculture.
Brunnel, J. and A. Shepherd (1985). Report of consultancy mission to the horticulture
(fruit) research and development project, SRI/84/013. Central Bank of Sri Lanka. Annual Reports, several issues. Colombo: Central Bank of Sri
Lanka. Central Bank of Sri Lanka (1998). Economic Progress of Independent Sri Lanka 1948-88. Colombo: Central Bank of Sri Lanka. Central Engineering Consultancy Bureau (1989). South East Dry Zone Development,
Draft Preliminary Project Proposals, Central Engineering Consultancy Bureau, Colombo.
Central Engineering Consultancy Bureau (1989). South East Dry Zone Development:
Preliminary Project Proposals, Ministry of Lands Development, Irrigation and Mahaweli Development, Colombo. Carruthers, Ian and Roy Stoner (1981). Economic Aspects and Policy Issues in Groundwater Development. Staff Working Paper 496, The World Bank Washington.
Ceylon Association for The Development of Agriculture in the Advancement of the Dry
Zone. Proceedings of a Science (1967) symposium, edited by O.S. Peries. CFTRI (1977). Homescale processing and preservation of fruit and vegetables. IDB,
Mysore. Chambers, Robert (1977). Men and water: The organisation and operation of irrigation.
In B.H. Farmer (ed). Green Revolution? Technology and Change in Rice-Growing Areas of Tamil Nadu and Sri Lanka. Boulder, USA: Westview Press. pp 340-363.
Chambers, Robert (1978). Water management and paddy production in the Dry Zone of
Sri Lanka. ARTI Occasional Paper No 8. Colombo: ARTI. Choo, Y. K. and S. Senthinathan (1986). Water management for rice cultivation in
Mahakanadarawa tank area - Tank Irrigation Modernisation Project, Maha 1980-81. In S. Abeyratne, P. Ganewatte, D. J. Merrey (eds). Proceedings of a Workshop on Water Management in Sri Lanka, January 20-22, 1982. ARTI Documentation Series No. 10 Colombo: ARTI. pp 89-117.
CISIR (1981). Space Processing (IDB/CISIR). CISIR (ud). Processing of spices and essential oils for export (IDB/CISIR).

Chung (1986). "Agricultural Marketing Investment Plan for the Mahaweli Area", Chankil Chung, FAO.
Commonwealth Secretariat (1988). Fruit and Tropical Products. Corey, A. T. (1986). Control of water within farm turnouts in Sri Lanka. In S. Abeyratne,
P. Ganewatte, D. J. Merrey (eds). Proceedings of a Workshop on Water Management in Sri Lanka, January 20-22, 1982. ARTI Documentation Series No. 10. Colombo ARTI. pp 155-164.
Coward E. Walter (ed) (1985). Irrigation and Agricultural Development in Asia:
Prospectives from the Social Sciences. Crowther, P. C. (l979). The processing of banana products for food use. TPI London
(IDB).
Cruess, W. V. (1958). Commercial fruit and vegetable products. McGraw Hill, New York (IDB).
CTC Services Ltd. (1986). Nucleus Farm Approach to Agro-Industry Investments in the
Mahaweli Settlements. CTC Services Colombo. Curtis, R. and K. G. Gunatilake (1986). Semi-processed or stored fruits and vegetables as
raw materials and catering sector-market opportunities in Sri Lanka Economic Review Vol. 12, No. 2.
Cutbertson and Khan (1986). Effective Protection to Manufacturing Industry in Sri Lanka,
IBRD (mimeo). Daines, S.R. Research Group (1988). Export Marketing Strategy: Final Conclusions and
Recommendations. SRD Research Group, Utah. Deegan, J. L., M. A. L. B. Herath, (1980). Farmer reluctance to grow subsidiary crops in
the Mahaweli System H during Yala 1980. J Nat. Agric. Soc. Ceylon Vol. 19. Department of Agriculture (1968). Santake Chillie. Leaflet published by DA, Agricultural
Info. Div., Colombo. Department of Agriculture (1973). Chillie under irrigation. Leaflet published by DA,
Agricultural Info. Div., Colombo. Department of Agriculture (1973a). Greengram and Blackgram. Leaflet published by DA,
Agricultural Info Div., Colombo. Department of Agriculture (1973b). Groundnuts. Leaflet published by DA, Agricultural
Info. Division, Colombo.

Department of Agriculture (1973c). Maize, Newsletter No. 6. Leaflet issued by DA, Agricultural Info. Div., Colombo (DA/CARI and PGIA).
Department of Agriculture (1973d). Soyabean. Newsletter No. 8. Leaflet published by DA, Agricultural Info. Div., Colombo. (DA/CARI). Department of Agriculture (1973e). Vegetable Growing: Exotic Varieties. Bulletin
published by DOA, Agricultural Information Division, Colombo. Department of Agriculture (1978). How to boost the yield of Manioc and Sweet Potato.
Leaflet published by DOA, Agricultural Information Division, Colombo. Department of Agriculture (1979). Agro-Ecological Regions of Sri Lanka. (MAP).
Compiled by Land and Water Use Div. of Department of Agriculture, Peradeniya, Sri Lanka.
Department of Agriculture (1980). Rice Symposium 80, Peradeniya, Department of
Agriculture. Department of Census and Statistics, (1987). Progress in Paddy Cultivation and Production
in Sri Lanka and Forecasts for the Future, Colombo. Department of Irrigation (1989). The Impact Study of Pilot Areas in the MIRP,
Department of Irrigation, Colombo. De Rosa, Dean, (1988). Agricultural Trade and Protection in Asia: Identifying Hurdles to
Intra Regional Trade, Finance and Development, 25(4), 50-52. De Silva, B. C. D. (1982). Descriptive study on fruit characteristics of different mango
cultivars in Sri Lanka. Research dissertation for the degree of B.Sc.(Agric), University of Sri Lanka, (Peradeniya).
De Silva, M. S. M. and D. C. O. Mendis (1989). A plan for the Development of the
SEDZ, Colombo (mimeo). Dassanayake, C. B. and S. V. R. Weerasooriya (1985). The Hydrogeochemical Atlas of Sri Lanka. National Resources, Energy and Science Authority of Sri Lanka, Colombo.
De Silva, N. G. R. (1981). Farmer participation in water management: The Minipe project
in Sri Lanka. Rural Development Participation Review 3(1): 16-19. Desrossier and Norman, W. (1970). Technology of food preservation. AVI Publishing Co,
West-Port (IDB). De Vaz, C. R. (1988). Expert consultation of the Asian network on tropical vegetables.

De Zoysa, A. O. C. (l973). Coordinated varietal trial to evaluate the growth and yield potential of 10 promising varieties of soyabean grown at four locations. DA Maha Illuppalama Research Station, half yearly report, 1973, Yala.
De Zoysa, M. A. U. (1987). Export of fresh and processed fruits and vegetables from Sri
Lanka, Business Lanka. Dimantha, Sunil (1987). Irrigation Management for Crop Diversification in Sri Lanka, in
IIMI, Irrigation Management for Diversified Cropping, Digana Village, IIMI. DMEC (1984). Report of the Committee on Reformulation of MEC Assistance Schemes,
DMEC.
Dunham, David (ud). Rural Non-Farm Employment: Some Conceptual Issues. Research Studies, Employment Series 2, Institute of Policy Studies, Colombo.
Dunham, David (1995). Contract Farming and Export Horticulture: Can Agribuiness
Revitalise the Peasant Sector in Sri Lanka. Research Studies, Agricultural Policy Series No. 3, Colombo: Institute of Policy Studies, February.
Dunham, David and Chris Edwards (1997). Rural Poverty and an Agrarian Crisis in Sri
Lanka, 1985-95: Making Sense of the Picture. Research Studies, Poverty & Income Distribution Series No. 1, Colombo: Institute of Policy Studies, April.
EDB (1962). The Sri Lanka Export Development Board and its Activities. Engineering
Consultants Incorporated (1962). Uda Walawe Project Development of the Walawe Ganga Basin. ECI, Colombo.
Edirisinghe, N., F. Abeyratne, W. G. Somarathne, P. Wickramachi and P.I. Tudawe (1991).
Efficiency and Policy Incentives in Rice Production in Sri Lanka, Colombo: ARTI/IFPRI.
Edwards, C. (1993). Protectionism and Trade Policy in Manufacturing and Agriculture.
Colombo: Institute of Policy Studies. Engineering Consultants Incorporated (1968). The Three Basin Report, ECI, Colombo. FAO (1971). Automated Irrigation and Drainage Paper No.5, FAO, Rome. FAO (1986). Agricultural Marketing Development Plan for the Mahaweli Area. FAO (1980a). Localised Irrigation - Design, Installation, Operation, Evaluation. Irrigation
and Drainage Paper No. 36 FAO, Rome. FAO (1980b). Report of the Village Tank Rehabilitation Project. FAO/World Bank
Cooperative Program.

FAO (1986). Sugar production and price policy analysis of the sugar industry with
recommendations for its future development, FAO, Rome. FAO (1988). "Rural Credit Review, Phase II", FAO/ASDB Cooperative Program, FAO,
Rome. FAO (1989). Trends in and Prospects for Trade in Tropical Horticultural Products, an
ECDC Seminar on Tropical Horticultural Products in Asian and Pacific Countries, FAO, Bangkok, Thailand.
Farmer, B. H. (1985). Rainfall and water supply in the Dry Zone of Ceylon. Geographical
Essay on British Tropical Lands, London DA/CARI and PGIA). Farrington, J. (1979). Cotton: the economics of expansion in Sri Lanka. Research Study
No. 30. ARTI, Colombo. Fernando, S. N. U. (1968). An appraisal of manioc cultivation in Ceylon. Publishers:
Ministry of Agriculture and Lands. Colombo, Sri Lanka.
Gamage, H. (1981). Irrigated soyabean production in Sri Lanka. In: Irrigated soyabean production in arid and semi-arid regions. Judy, W. H., J. A. Jacobs, (Editors) Urbana - Champaign, Illinois, USA. International Publications (1981) 170-172.
Gamage, D., R. B. Wanigaratne, L. D. I. Wijetunga and I. Tudawe (1988). Kirindi Oya
Irrigation and Settlement Project, Mid-Project Evaluation, Research Study, No. 65, ARTI, Colombo.
Government of Sri Lanka. Annual Budget Estimates of the Government of Sri Lanka;
1969/70 to 1989, Ministry of Finance and Planning, Colombo. Gunadasa, J. M. and P. Wickramasekera (ud). A Benefit Cost Evaluation of Village
Rehabilitation in Sri Lanka, University of Peradeniya, Sri Lanka. Gunesekera, Ananda (1985). Recovery of operation and maintenance rates in the major
(gravity) irrigation schemes. In K. P. Wimaladharma (ed). Towards Improved Water Management: Some Papers Presented at PASE Training Courses, 1983-85. Sri Lanka. UNDP Project for Advancing Settlement Expertise. Ministry of Lands and Land Development, Pase Publication No. 6. Colombo, Mimeo.
Gunasekere, Wickrema (1981). The role of traditional water management in modern paddy
cultivation in Sri Lanka. Japan: United Nations University. Gunasena, H. P. M. (1972). Recent advances in the development of agro-industrial crops
of Ceylon. Proceedings of the Symposium on Development of Animal Husbandry and Agriculture under the Five Year Plan. Nat. Agric. Soc. Ceylon, (PGIA).

Gunasena, H. P. M. (1974). Field Crop Production. Publisher: Lake House Investments. Gunasena, H. P. M., P. Sangakkara, P. Wickramasinghe, (1976). Studies on cereal -
legume intercrop systems. National Science Council Sri Lanka. Gunasena, W. P. M. and H. M. G. Herath (1986). Integrated Farming Systems.
Proceedings of a Symposium sponsored by the National Agricultural Society of Sri Lanka and Faculty of Agriculture, University of Peradeniya, Peradeniya
Gunawardana, P. J., A. Chandrasiri (1980). Factors Influencing Vegetables Price: A study
of the vegetable economy in Sri Lanka. ARTI, Colombo. Gunewardena, P. J. and J. J. Quilkey. Pricing and Marketing Policies in the Rice Sector of
Sri Lanka: History and Impact, Upanathi, 2(2), Pp.227-279. Harris, John (1977). Problems of water management in Hambantota district. In B. H.
Farmer (ed). Green Revolution? Technology and Change in Rice-Growing Areas of Tamil Nadu and Sri Lanka. Boulder, USA: Westview Press. Pp.364-376.
Harwood, R. R., and E. C. Price, (1975). Multiple cropping in Tropical Asia. ASA Special
Publication No. 27, American Society of Agronomy, Crop Science Society of America, Soil Science Society of America.
Hayami, Y., and M. Kikuchi, (1978). Investment Inducements to Public Infrastructure:
Irrigation in the Philippines. The Review of Economics and Statistics, 70-77.
Hayami, Y., M. Kikuchi and K. Marooka, (1988). The Market Price Response of Rice Research.
Herath, E. (1976). Cultivation and uses of soyabean in Sri Lanka. INTSOY Series -
International Soyabean Program (USA), 10 pp. 250-252. (PGIA). Herath, H. M. G. et al. Socio-Economic Evaluation of the (1989) Village Irrigation
Rehabilitation Project Report No. 2. Department of Agricultural Economics and Extension, Faculty of Agriculture, University of Peradeniya, Peradeniya.
Hindagala, C. B. (1974). Growth and yield of varieties of maize under irrigation.
Directory of Scientific Research Project in Sri Lanka. 1970 - 1973. National Science Council Colombo 1974. (PGIA and CISIR).
Hindagala, C. B. A. (1980). Varietal improvement and agronomic studies of maize in the
dry zone. Tropical Agriculturist. Vol. 136. IBRD (1968). Lift Irrigation Project : Ceylon Project Appraisal Report, IBRD, Washington D.C.
IBRD (1969a). Mahaweli Ganga Development Project Stage I, Ceylon, IBRD, Washington D.C.
IBRD (1969b). Drainage and Reclamation Project, Ceylon, IBRD, Washington D.C. IBRD (1979). Sri Lanka: Agricultural Extension and Adaptive Research Project, Staff
Appraisal Report No. 23962-CE, IBRD, Washington D.C.
IBRD (1981). Sri Lanka: Minor Export Crops Sector Review (mimeo) IBRD, Washington D.C.
IBRD (1983). Sri Lanka Dairy Sector Review. Report No. 4365-CE, Washington D.C. IBRD (1983). Sri Lanka Issues in Irrigation Management, Washington D.C.. IBRD (1984). Sri Lanka Agro-industries and Credit Reconnaissance Mission Report.
(mimeo), Washington D.C. IBRD (1985a). Sri Lanka Fourth Tree Crop Project. Staff Appraisal Report No. 5265-CE
No. 5089-CE, Washington D.C. IBRD (1985b). Sri Lanka: Lift Irrigation Project, Impact Evaluation Report Washington
D.C., Operations Evaluation Department. IBRD (1985c). Sri Lanka Recent Economic Developments and Policies for Growth.
(Report No. 5628-CE), Washington D.C. IBRD (1985d). Sri Lanka Second Dairy Development Project. Staff Appraisal Report No. 5089-CE, IBRD (1985a), Washington D.C. Institute of Policy Studies (1995). Sri Lanka: State of the Economy 1995. Colombo:
Institute of Policy Studies, August. Institute of Policy Studies (1997). Sri Lanka: State of the Economy 1997. Colombo:
Institute of Policy Studies, December. Institute of Policy Studies (1998). Sri Lanka: State of the Economy 1998. Colombo:
Institute of Policy Studies, October. International Irrigation Management Institute (IIMI) (1986). Proceedings of the Workshop
on Participatory Management in Sri Lanka's Irrigation Schemes. IIMI, Digana Village, Sri Lanka.
International Irrigation Management Institute (1987). Irrigation Management for
Diversified Cropping, IIMI, Digana Village, Sri Lanka.

International Irrigation Management Institute (1996). Annual Report 1996. IIMI, Colombo. International Science and Technology Institute Inc (1985). Final Evaluation of Sri Lanka
Water Management: Gal Oya Left Bank System. Project No. 383-0057, Washington D.C., International Science and Technology Institute, Inc.
International Science and Technology (ISTI). Final Evaluation of Sri Lanka, water
management (Project No 383-0057). Washington D.C. United States Agency for International Development.
JICA (1989a). The Study on Extension of the Moragahakanda Agricultural Development
Project, (Phase I), Japan International Cooperation Agency. JICA (1989b). The Study on Extension of the Moragahakanda Agricultural Development Project, Master Plan (Phase II), Volumes I-IV.
Karunanayake, M. M. (1980). Farmer organisations and irrigation leadership in Sri Lanka: retrospect and prospects, MARGA 6(1) Pp1-17.
Karunanayake, M. M. (1982). Some issues in irrigation management in settlement schemes
in Sri Lanka in K. P. Wimaladharma (ed). Land Settlement Experiences in Sri Lanka. Selected Papers from the Seminar Sponsored by USAID and Ministry of Lands and Land Development, 6-8 April 1981, Colombo pp 77-87.
Karunatilake, T. H. (1986). Farmer participation in water management in the Mahaweli
project, in Participatory Management in Sri Lanka's Irrigation Schemes. Digana Village, Sri Lanka: International Irrigation Management Institute pp 69-76.
Korale, R. B. M. (1988). Sri Lanka in the Year 2015 - Demographic Trends and
Projections, Sri Lanka Economic Journal, 3(2), 1-26. Korale, R. B. M. (ud). A Statistical Overview of Employment and Unemployment Trends.
Research Studies, Employment Series 5, Institute of Policy Studies, Colombo. Krueger, Anne O, M. Schiff, and A. Valdez, (1988). Agricultural Incentives in Developing
Countries: Measuring the Effects of Sectoral and Economy wide Policies, The World Bank Economic Review, 2(3), pp 255-73.
Kumaratunga, H.E. Chandrika Bandaranaike (1995). Policy Statement of the Government
of Sri Lanka on the Occasion of the Opening of Parliament, Colombo, 6 January. Madduma Bandara, C.M. (1974). The Case for Recycling subsurface water for paddy
cultivation in the Dry Zone (mimeo), Peradeniya, Ceylon Studies Seminar.

Madduma Bandara, C.M. (1977). The Prospects of Recycling Sub-Surface Water for Supplementary Irrigation to the Dry Zone, Chapter 7 in S. W. R. de A. Somasinghe (ed) Agriculture in the Peasant Sector of Sri Lanka, Peradeniya. Ceylon Studies Seminar.
Mahangas, Mahar, (1985). Relative Emphasis on Domestic Food Self-Sufficiency and
Trade Oriented Self-reliance, in World Food Security: Selected Themes and Issues, FAO Economic and Social Development Paper 53, 1-15.
Mahaweli Development Board and Snowy Mountains Engineering Corporation (1973).
Samanalawewa Project for Development of Hydropower. Mahinda Silva A. T., Tudor O. Devendra and Wickrema Gunasekera(1982). The Study of
Lift Irrigated Agriculture in Sri Lanka. Marga Institute, Colombo. Malagoda, M. L. (1986). Kurunegala Integrated Rural Development Project: Evaluation of
the Irrigation and Water Management Component. Research Study No. 74,Colombo, ARTI.
Market and Industry Analysts (1988). The UK Market for Fresh Fruit and Vegetables with
particular references to Exotic off season production. A study for the Sri Lanka Export Development Board M&IA, Brussels.
Mendis, D. L. O. (1971). The Engineer and National Planning Appendix on Southern Area
Planning, the Institution of Engineers, Sri Lanka Transactions, Colombo. Mendis, D. L. O. (1988). The Need of the Hour: Non-dependent Implementation of
Southern Area Plan, The Institute of Engineers, Sri Lanka, Transactions. Mendis, D. L. O. (1988). Astrology for the Agricultural Development of the Southern
Province of Sri Lanka, Marga Institute, Colombo. Merrey, Douglas J., and Senerath Bulankulame (1987). Responsibility in irrigation system
management: Some policy issues for Sri Lanka. IIMI Management Brief No. 5 Digana Village, Sri Lanka: IIMI.
Merrey, Douglas J., P. S. Rao and Edward Martin (1988). Irrigation Management Research
in Sri Lanka: A Review of Selected Literature. IIMI Occasional Paper, International Irrigation Management Institute, Digana Village, Sri Lanka, June. Ministry of Agricultural Development and Research (MARD) (1986). Farming Systems,
Research and Extension in Sri Lanka, Proceedings of a Workshop on Farming Systems and Extension in Sri Lanka, a USAID Diversified Agricultural Research Project, Department of Agriculture, Peradeniya.

Ministry of Agricultural Development and Research (MARD) (1987). Agricultural Diversification Plan, Colombo, Ministry of Agricultural Development and Research.
Ministry of Finance and Planning (1984). National Agriculture, Food and Nutrition Strategy: A Change in Perspective, Ministry of Finance and Planning, Colombo.
Ministry of Finance and Planning (1984). A Review of Prices and Agricultural Incentives,
NAFNS Special Report No. 6. Ministry of Finance and Planning (1984). Rice Self-sufficiency and Beyond: Export
Prospects, National Agriculture, Food and Nutrition Strategy Special Report 1, Colombo.
Ministry of Finance and Planning (1986). National Agriculture Food and Nutrition
Strategy: Implementation Plan, Ministry of Finance and Planning, Colombo. Ministry of Finance and Planning (1988). Public Investment 1988-1992, Colombo. Ministry of Finance and Planning (1989). Public Investment 1989-1993, Colombo. Ministry of Finance and Planning (1991). Public Investment 1991-1995, Colombo. Ministry of Finance and Planning (1992). Public Investment 1992-1996, Colombo. Ministry of Finance and Planning (1993). Public Investment 1993-1997, Colombo. Ministry of Finance and Planning (1995). Public Investment 1995-1999, Colombo. Ministry of Finance and Planning (1996). Public Investment 1996-2000, Colombo. Ministry of Finance and Planning (1997). Public Investment 1997-2001, Colombo. Ministry of Lands and Land Development (1984). Irrigation, Land and Forestry
Development Strategy. Ministry of Lands and Land Development, Colombo. Ministry of Lands and Land Development (1988). Resource Development, 1978-1987,
Ministry of Lands and Land Development, Colombo. Ministry of Plan Implementation (1987). Progress in Paddy Cultivation and Production in
Sri Lanka and Forecasts for the future, next Monograph Series No. 1, Ministry of Plan Implementation, Colombo. National Planning Division, Ministry of Finance: - Public Investment Program 1979-1981 through to 1988-1992, National Planning Division of the Ministry of Finance and Planning, Colombo.

Miranda, S.M. and C. R. Panabokke (1988). Irrigation Management for Diversified Cropping: Concept Paper, in IIMI, Irrigation Management for Diversified Cropping, Digana Village, IIMI.
Mitchell, Donald, O. (1987). Rice Market prospects to the Year 2000, Paper presented at
the Seminar on Recent and Future Movements in World Rice Prices, Jakarta, Indonesia, Jan 14,1987.
Monke, Eric A. and Scott R. Pearson (1987). The International Price of Rice: Issues and
Trends, Paper presented at the Seminar on Recent and Future Movements in World Rice Prices, Jakarta, Indonesia, January 13-14, 1987.
Moore, M.P. (1980a). Approaches to improving water management in large-scale
irrigation schemes in Sri Lanka. ARTI Occasional Paper No. 20 Colombo: ARTI. Moore, M. P. (1980b). The management of irrigation systems in Sri Lanka: A study in
practical sociology. Sri Lanka Journal of Social Sciences 2(2): 89-111. Moore, M. P. (1982). Institutional adaptiveness and succession. The case of irrigation in
Sri Lanka. Sri Lanka Journal of Agrarian Studies 3(1):23-33. Murray, Rust and P. S. Rao (1987a). Case Study I: The tank irrigation modernisation
project of Sri Lanka in D. A. Fowles (ed.)International Conference on Irrigation Rehabilitation and Betterment. Vol 2 Papers. Fort C. Colorado State University, pp 245-93.
Murray, Rust D. H. and P. S. Rao (1987b). Learning from the care of the Tank Irrigation
Modernisation Projects (TIMP) of Sri Lanka, ODI/IIMI Irrigation Management Network Newsletter 87/2b, Digana Village.
NEDECO (1984). Detailed Proposals on Alternative Cropping Patterns, NEDECO,
Colombo. Nippon Koei Co. Ltd. (1988). Study on Agricultural Markets Two volumes, Nippon Koei,
Tokyo (Draft). O'Mara, Gerald T. (1988). Efficiency in Irrigation: The Conjunctive Use of Surface and
Groundwater Resources. World Bank, Washington D.C. Panabokke, C. R. (1980). Keynote Address, in Department of Agriculture, Rice
Symposium 80, Peradeniya, Department of Agriculture. Panabokke, C. R. and the IIMI Group (1987). Status Research Report: Sri Lanka in IIMI,
Irrigation Management for Diversified Cropping, Digana Village, IIMI.
Panabokke, C. R. and I. Balasuriya (1988). A Review of Literature on On Farm Irrigation Management in IIMI, Irrigation Research in Sri Lanka: A Review of selected Literature, Occasional Paper, Digana Village, IIMI.
Paul, Niranjan (ed), (1982) - Productivity and Equity in irrigation systems. Ashish
Publishing House, New Delhi, India. Peiris, G. H. (1987). Irrigation and water management in a peasant settlement scheme of
Sri Lanka: A study of the water management project of Minipe. ARTI Research Study No. 78. Colombo: ARTI.
Perera, Jayantha (ud.). The Pertinence and Value of Village Studies for the Analysis of
Rural Employment and Unemployment. Research Studies, Employment Series 6, Institute of Policy Studies, Colombo.
Perera, J. (1989). State sponsored Village Irrigation Rehabilitation Program (VIRP): a new
design for effective management of village irrigation in Sri Lanka in ADB. Asian Regional on the Modernisation and Rehabilitation of Irrigation and Drainage Schemes, Manila, Asian Development Bank.
Perera, K. D. P. (1986). Sri Lanka experience of integrated management of major
irrigation settlement schemes (INMAS) program on water management. Paper prepared for Expert Consultation on Efficient use of water with Specific Reference to Paddy in Irrigation Projects. 9-13 September. Bangkok,Thailand.
Pinnaduwage, S. (1982). Uda Walawe Experience in Crop Diversification and Agricultural
Extension, in Kamila P. Wimaladharma (ed) Land Settlement Experiences in Sri Lanka. Colombo, USAID and Ministry of Lands and Land Development.
Raby, Namika (1988). Participative management and INMAS project management: The
outline of an operational plan. Digana village, Sri Lanka: International Irrigation Management Institute. Draft paper.
Rajapakse, Purnima (ud). Employment Consequences of Alternative
Stabilization/Adjustment Measures: The Case of Sri Lanka, 1970-1985. Research Studies, Employment Series 7, Institute of Policy Studies, Colombo.
Ranatunga, A. S., J. Farrington and W. A. T. Abeysekera (1981). Some Issues Confronting
the Rehabilitation of Major Irrigation Schemes in the Dry Zone, ARTI, Research Study No. 44, Colombo, ARTI.
Ranaweera, Nimal F. C. (1975). Cropping Systems Pilot Production Programs in Sri
Lanka: A Case Study, Peradeniya, Division of Agricultural Economics and Projects, Department of Agriculture.

Rodrigo, Chandra and Nimal Attanayake (1988). The Employment Consequences of Alternative Development Strategies in Sri Lanka. Research Studies, Employment Series 8, Institute of Policy Studies, Colombo.
Rowley, Anthony, (1988). Far Eastern Economic Review 2nd June, 1988, p.61. Salzgittes, Consult, GMBW et al. (1982). Mahaweli Ganga Development System A
Feasibility Study, Joint Venture Randenigala, Ministry of Mahaweli Development, Colombo.
Sepala, Asoka, C. K. Chandrasiri, J. K. M. D. Gamage, D. Jayasena, W. G. Tudawe, A.
Abeysekera, W. A. T. and R. D. Wanigaratne, Kurunegala, Integrated Rural Development Project: Ex-Post Evaluation, Research Study No. 84 Colombo, ARTI.
Shand, R.T. (ed.) (1990) Future Directions for Irrigation and Agricultural Diversification in
Sri Lanka. World Bank and Ministry of Finance and Planning, Colombo: International Irrigation Management Institute.
Siamwalla, Ammar, (1987). Outlook of the World Rice Market to 1992, paper presented at
the Seminar on Recent and Future Movements in World Rice Prices, Jakarta, Indonesia, January 14-14, 1987.
Silva, Mahinda (1986). The evolution of policies in Sri Lanka relating to the recovery of
water charges from farmers for irrigation services. A study carried out for the International Irrigation Management Institute. Digana, Village, Sri Lanka: IIMI pub. Draft.
Siripala, Gamage Don (1984). “Economic Analysis of Walagambahuwa ", unpublished
paper presented at the National Cropping Systems Workshop, Peradeniya. Sirisena, N. L., (1986). An Evaluation of Agricultural Policy on the Paddy Sector, Sri
Lanka Economic Journal 1, 66-97. Sirisena, N. L., (1988). Sri Lanka Economy by the Year 2015 - Alternative Scenarios for
Accelerated Growth, Sri Lanka Economic Journal, 3(2), pp 45-58. Small, Leslie E., Marietta S. Adriano, and Edward D. Martin (1986). Regional study on
irrigation service fees: Final report. A report submitted to the Asian Development Bank by the International Irrigation Management Institute. Digana Village, Sri Lanka:IIMI. Draft.
Somasiri, S. (1978). Efficient Utilisation of Physical Agricultural Resources in the Dry
Zone of Sri Lanka, Tropical Agriculturalist, Vol 134: 17-31. Somasiri, S. (1979). Village Tank as an Agricultural Resource in the Dry Zone of Sri
Lanka Tropical Agriculturalist, Vol 135: 33-46.

Somasiri, S. (1981). Land Water and Crop Management under Irrigation in the Dry Zone
of Sri Lanka: A Research Report, Land and Water Use Division, Department of Agriculture, Peradeniya.
Somasiri, S. (1987). Village Irrigation: Physical Resource Evaluation: Report of 1980/86.
Peradeniya, Department of Agriculture. Spinks, G. R. (1984). Sri Lanka Marketing of Agricultural Produce and Distribution of
Inputs, FAO/IBRD Cooperative Program (mimeo).
Stanbury, Pamela, (1988). Land settlement planning issues in irrigation management: A review of experiences in Sri Lanka. IIMI Working Paper No.5. Digana Village, Sri Lanka: International Irrigation Management Institute.
TAMS Consultants Inc (1988). The Kalu Ganga Multipurpose Project - Pre-feasibility
study. TAMS Consultants Inc, USA. Tilakaratne, W. M. T. (1989). Costs and benefits of irrigation rehabilitation and
modernisation: a case study of the Gal Oya water management project in Sri Lanka, in Asian Development Bank, Asian Regional Symposium on the Modernisation and Rehabilitation of Irrigation and Drainage Schemes. Manila, Asian Development Bank.
Upasena, S. H., M. Sikurajapathy and T. Seneviratna (1980). A new Cropping System
Strategy for the Poorly Irrigated Ricelands of the Dry Zone, Tropical Agriculturalist Vol 136: 51-58.
Upasena, S. H. (1986). The cropping systems and water management studies carried out at
Walagambahuwa minor tank settlement scheme in the Dry Zone of Sri Lanka, in S. Abeyratne, P. Ganewatte and D. J. Merrey (ed) Proceedings of a Workshop on Water Management in Sri Lanka, ARTI Documentation series No.10, Colombo, ARTI.
Uphoff, Norman (1982). Contrasting approaches to water management development in Sri
Lanka. Third World Legal Studies 1982. New York, USA: International Center for Law and Development pp 202-249.
USAID (1982). Irrigation Development Options and Investment Strategies for the 1980s, Sri Lanka Water Management Synthesis Project No. 11.
Widanapathirana, A. S. (1984). Gal Oya Water management research project: Seasonal report 1983 Yala season. ARTI Occasional Publication No.31. Colombo: ARTI.

Wijayaratna, C.M., C.R. Panabokke, P.B. Aluwihare, S.H. Charles and R. Sakthivadel (1996), Potential for Diversified Cropping in the Rice Lands of Sri Lanka. IIMI Country Paper No. 14, International Irrigation Management Institute, Colombo.
Wijeratne, C. M. (1985). Involvement of farmers in water management in Gal Oya, Sri
Lanka. Participatory Experiences in Irrigation Water Management. Proceedings of the Expert Consultation on Irrigation Water Management. Yogjakarta and Bali, Indonesia, 16-22 July 1984, Rome FAO. pp 117-132.
Wijetunga, A. A.,(1988). National Policies on Land Settlement (Mimeo), Ministry of
Lands and Land Development, Colombo. Wimaladharma, Kapila P. (ed). (1982) Land Settlement Experiences in Sri Lanka,
Colombo, USAID and Ministry of Lands and Lands Development. World Bank (1977). Sri Lanka: Appraisal of Mahaweli Ganga Development Project II,
World Bank, Washington, D.C. World Bank (1979). Sri Lanka : Issues and Prospects for Industrial Development. The
World Bank Report No. 2261-CE, Washington D.C. World Bank (1981a). Staff Appraisal Report : Sri Lanka - Mahaweli Ganga Development
Project III. World Bank, Washington D.C. World Bank (1981b). Staff Appraisal Report Lanka. Village Irrigation Rehabilitation
Project. Report No. 3363-CE. Washington D.C., World Bank, World Bank (1984). Sri Lanka : Major Irrigation Rehabilitation Project. Staff Appraisal
Report, Washington D.C., World Bank. World Bank (1985a). Sri Lanka Tank Irrigation Modernisation Project Completion Report.
Washington D.C., World Bank. World Bank (1985b). Staff Appraisal Report: Sri Lanka Dairy Development II, World
Bank, Washington D.C. World Bank (1986a). Appraisal of the Tank Irrigation Modernisation Project : Report No.
951-CE, Washington D.C., World Bank. World Bank (1986b). Sri Lanka : Institutional and Policy Issues for Agricultural
Development, 3 volumes, Washington D.C., World Bank.
World Bank (1987a) Sri Lanka and the World Bank: A Review of a Relationship. A World Bank Operations Evaluation Study. Washington D.C., Operation Evaluation Department, World Bank.

World Bank (1987b). Sri Lanka : Mahaweli Ganga II. Draft Completion Report, Washington, D.C., The World Bank.
World Bank (1988). Sri Lanka : A Break with the Past: the 1987-90 Program of Economic
Reforms and Adjustment Report No. 7220-CE, 2 volumes, Washington D.C., The World Bank
World Bank (1991) “Agricultural Diversification: policies and issues from East Asian
experience”, Policy and Research Series No. 11, Agriculture and Rural Development Division, World Bank, Washington D.C.
World Bank (1995) Sri Lanka Poverty Assessment. World Bank Report No. 13431-CE,
World Bank, Washington D.C. World Bank (1996) Sri Lanka: Nonplantation Crop Sector Policy Alternatives. Report No.
14564-CE. World Bank, Washington D.C., March 20. Wyatt, W. R. M. (1966). A Note on One Axiom of Water Utilisation in the Dry Zone of
Ceylon in Abeygunawardena (ed) Research and Production of Rice in Ceylon. Ceylon Association for the Advancement of Science, Colombo.