c d tel chromosome 15q11-q13 mkrn3 gel2 ndn ap1 -snrpn snornas/ ipw ube3a 0a abrb3 abra5g3 a2 c2 bp1...
TRANSCRIPT

1 2 3 4 5
6 7 8 11 129 10
13 14 15 17 1816
19 20 21 X22 Y
0
1,000
2,000
3,000
4,000
5,000
6,000
POU5F1
SOX2
DNMT3
B
NANOGLI
N28
TDGF1
WT-ESCsWT-iPSCsPWS-iPSCs
Rel
ativ
e ex
pres
sion
0
5
10
15
20
170
DES
NCAM1
AFP
PWS-iPSCsPWS-20 d EBs
Rel
ativ
e ex
pres
sion
a
1 2 3 4 5
6 7 8 11 129 10
13 14 15 17 1816
19 20 21 X22
PWS-iPSC-1 PWS-iPSC-2
PWS-iPSC-1
PWS-iPSC-2
b
c d
Rel
ativ
e ex
pres
sion
0
25
50
75
100
WT-F
ib
PWS-F
ib0
100
200
300
400
500
WT-F
ib
PWS-F
ib0
500
1,000
1,500
2,000
WT-F
ib
PWS-F
ib
CRHBP(chromosome 5)
ZNF280D (chromosome 15)
RPPH1 (chromosome 14)
e
Supplementary Figure 1. Characterization of PWS-iPSCs. (a) G-band karyotyping of representative PWS-iPSC lines, demonstrating a diploid genome, excluding chromosome 15 aberrations. (b) Representative alkaline phosphatase staining for PWS-iPSC lines. Scale bar, 200 µm. (c) Mean expression levels ± s.d. of representative pluripotency markers in four PWS-iPSC lines (PWS-iPSC-1-A and B and PWS-iPSC-2-A and B) compared with �ve control (WT) PSCs (two iPSC and three ESC lines). (d) Gene expression analysis of 20-d-old embryoid bodies (EBs) from the two PWS-iPSC lines, demonstrating differentiation in vitro into all three embryonic germ layers. DES, NCAM1 and AFP represent markers for mesoderm, ectoderm and endoderm, respectively (mean expression levels ± s.d.; two biological replicates). (e) Mean expression levels ± s.d. of representative potential targets of PEGs in the PWS locus, in PWS and control (WT) �broblasts.
Nature Genetics: doi:10.1038/ng.2968
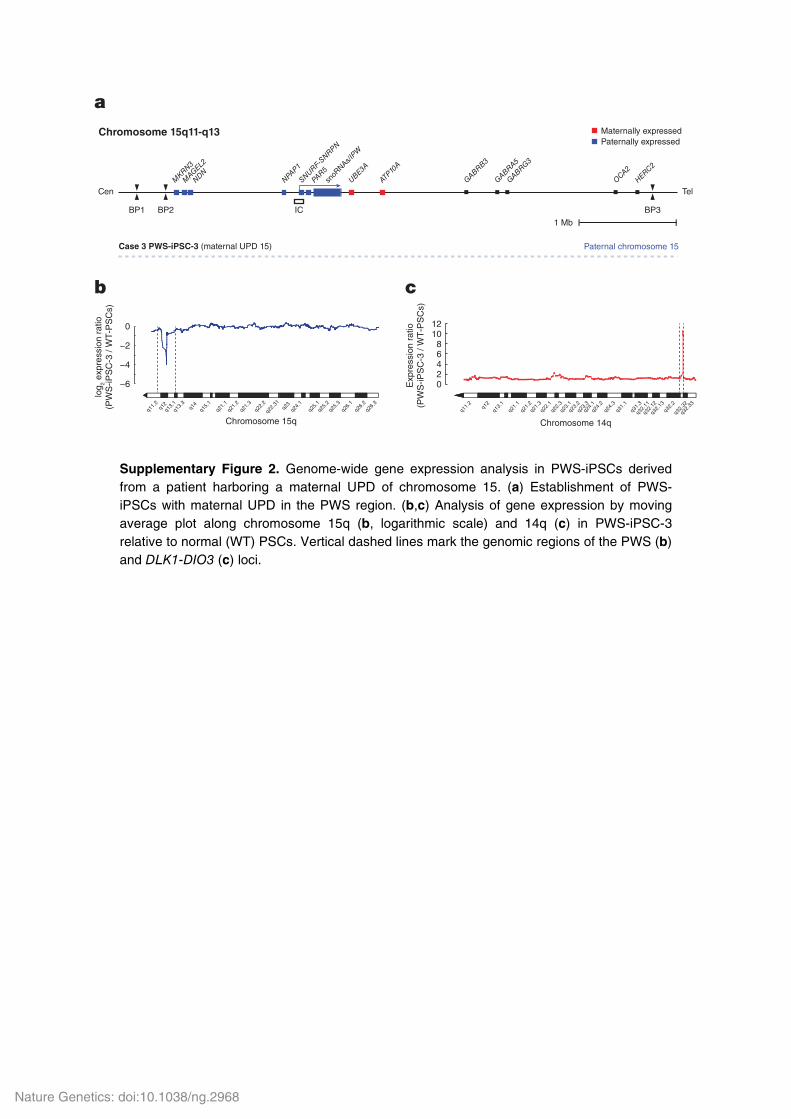
Cen Tel
Chromosome 15q11-q13
MKRN3
MAGEL2
NDNNPA
P1
SNURF-SNRPN
snoR
NAs/IPW
UBE3A
ATP10
A
GABRB3
GABRA5
GABRG3
OCA2
HERC2
ICBP2 BP3BP1
1 Mb
PAR5
Maternally expressedPaternally expressed
Case 3 PWS-iPSC-3 (maternal UPD 15) Paternal chromosome 15
a
b
0
−2
−4
−6
q11.
2q1
2q1
3.1
q14
q15.
1q2
1.1
q21.
2q2
1.3
q23
q24.
1q2
5.1
q26.
2q2
6.3
q13.
3q2
2.2
q22.
31
q25.
2q2
5.3
q26.
1
Chromosome 15q
log 2
exp
ress
ion
ratio
(PW
S-iP
SC
-3 /
WT
-PS
Cs)
q12
q11.
2q1
3.1
q21.
1q2
1.2q2
1.3q2
2.1
q22.
3q2
3.1q2
3.2q2
3.3q2
4.1q2
4.2
q24.
3q3
1.1
q31.
3
q32.
11
q32.
12
q32.
13q3
2.2
q32.
32
q32.
33
02468
1012
Exp
ress
ion
ratio
(PW
S-iP
SC
-3 /
WT
-PS
Cs)
Chromosome 14q
c
Supplementary Figure 2. Genome-wide gene expression analysis in PWS-iPSCs derived from a patient harboring a maternal UPD of chromosome 15. (a) Establishment of PWS-iPSCs with maternal UPD in the PWS region. (b,c) Analysis of gene expression by moving average plot along chromosome 15q (b, logarithmic scale) and 14q (c) in PWS-iPSC-3 relative to normal (WT) PSCs. Vertical dashed lines mark the genomic regions of the PWS (b) and DLK1-DIO3 (c) loci.
Nature Genetics: doi:10.1038/ng.2968
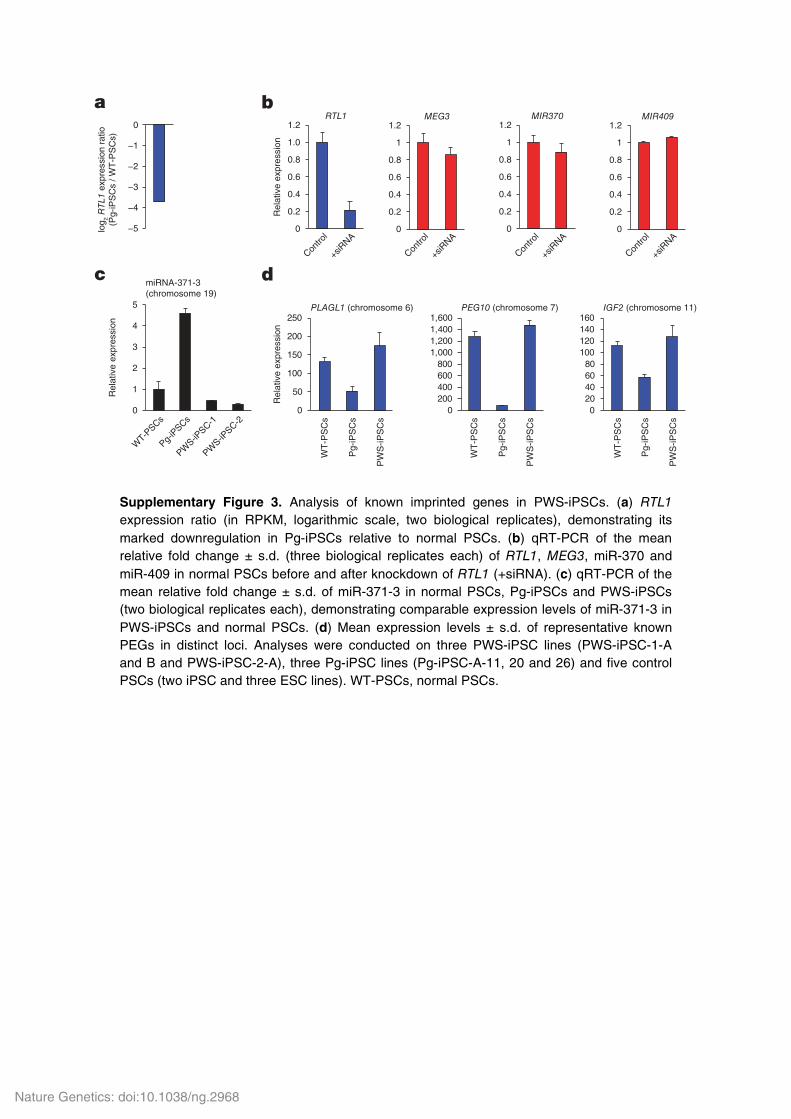
RTL1
Rel
ativ
e ex
pres
sion
Contro
l0
0.2
0.4
0.6
0.8
1.0
1.2
+siR
NA0
0.2
0.4
0.6
0.8
1
1.2MIR370
Contro
l
+siR
NA0
0.2
0.4
0.6
0.8
1
1.2MEG3
Contro
l
+siR
NA0
0.2
0.4
0.6
0.8
1
1.2MIR409
Contro
l
+siR
NA
a
−5
−4
−3
−2
−1
0
log 2
RTL
1 ex
pres
sion
rat
io(P
g-iP
SC
s / W
T-P
SC
s)b
miRNA-371-3(chromosome 19)
0
1
2
3
4
5
WT-P
SCs
Pg-iP
SCs
PWS-iP
SC-1
PWS-iP
SC-2
Rel
ativ
e ex
pres
sion
Rel
ativ
e ex
pres
sion
WT
-PS
Cs
Pg-
iPS
Cs
PW
S-iP
SC
s
PLAGL1 (chromosome 6)
0
50
100
150
200
250PEG10 (chromosome 7)
0200400600800
1,0001,2001,4001,600
WT
-PS
Cs
Pg-
iPS
Cs
PW
S-iP
SC
s
IGF2 (chromosome 11)
020406080
100120140160
WT
-PS
Cs
Pg-
iPS
Cs
PW
S-iP
SC
s
c d
Supplementary Figure 3. Analysis of known imprinted genes in PWS-iPSCs. (a) RTL1 expression ratio (in RPKM, logarithmic scale, two biological replicates), demonstrating its marked downregulation in Pg-iPSCs relative to normal PSCs. (b) qRT-PCR of the mean relative fold change ± s.d. (three biological replicates each) of RTL1, MEG3, miR-370 and miR-409 in normal PSCs before and after knockdown of RTL1 (+siRNA). (c) qRT-PCR of the mean relative fold change ± s.d. of miR-371-3 in normal PSCs, Pg-iPSCs and PWS-iPSCs (two biological replicates each), demonstrating comparable expression levels of miR-371-3 in PWS-iPSCs and normal PSCs. (d) Mean expression levels ± s.d. of representative known PEGs in distinct loci. Analyses were conducted on three PWS-iPSC lines (PWS-iPSC-1-A and B and PWS-iPSC-2-A), three Pg-iPSC lines (Pg-iPSC-A-11, 20 and 26) and �ve control PSCs (two iPSC and three ESC lines). WT-PSCs, normal PSCs.
Nature Genetics: doi:10.1038/ng.2968

Rel
ativ
e M
EG
3 ex
pres
sion
0
0.2
0.4
0.6
0.8
1.0
1.2
PWS fib
robla
sts
PWS B
-cell
line
1
PWS B
-cell
line
2
N.E. N.E.
Exp
ress
ion
ratio
(PW
S-F
ib/W
T-F
ib)
q12
q11.
2q1
3.1
q21.
1q2
1.2
q21.
3q2
2.1
q22.
3q2
3.1
q23.
2q2
3.3q2
4.1q2
4.2
q24.
3q3
1.1
q31.
3
q32.
11
q32.
12
q32.
13q3
2.2
q32.
32
q32.
33
0123456
Chromosome 14q
0
200
400
600
800
1,000
1,200
Rel
ativ
e ex
pres
sion
Fibroblasts iPSCsWTPgPWS
MEG3
SNORD113-
3
SNORD113-
4
SNORD114-
2
SNORD114-
3
SNORD114-
26
MEG3
SNORD113-
3
SNORD113-
4
SNORD114-
2
SNORD114-
3
SNORD114-
26
a
c
b
Supplementary Figure 4. Gene expression analyses in PWS cell lines. (a) Analysis of gene expression by moving average plot along chromosome 14q in PWS parental �broblasts relative to control �broblasts. Vertical dashed lines mark the genomic boundaries of the DLK1-DIO3 region. (b) qRT-PCR of the mean relative fold change ± s.d. (three biological replicates each) in MEG3 in mature PWS cells derived from three affected individuals, showing negligible expression levels in patient-derived B cells. N.E., not expressed. (c) Expression analysis of all MEGs represented in the expression arrays in the parental �broblasts (left panel) and undifferentiated iPSCs (right panel). WT, control.
Nature Genetics: doi:10.1038/ng.2968
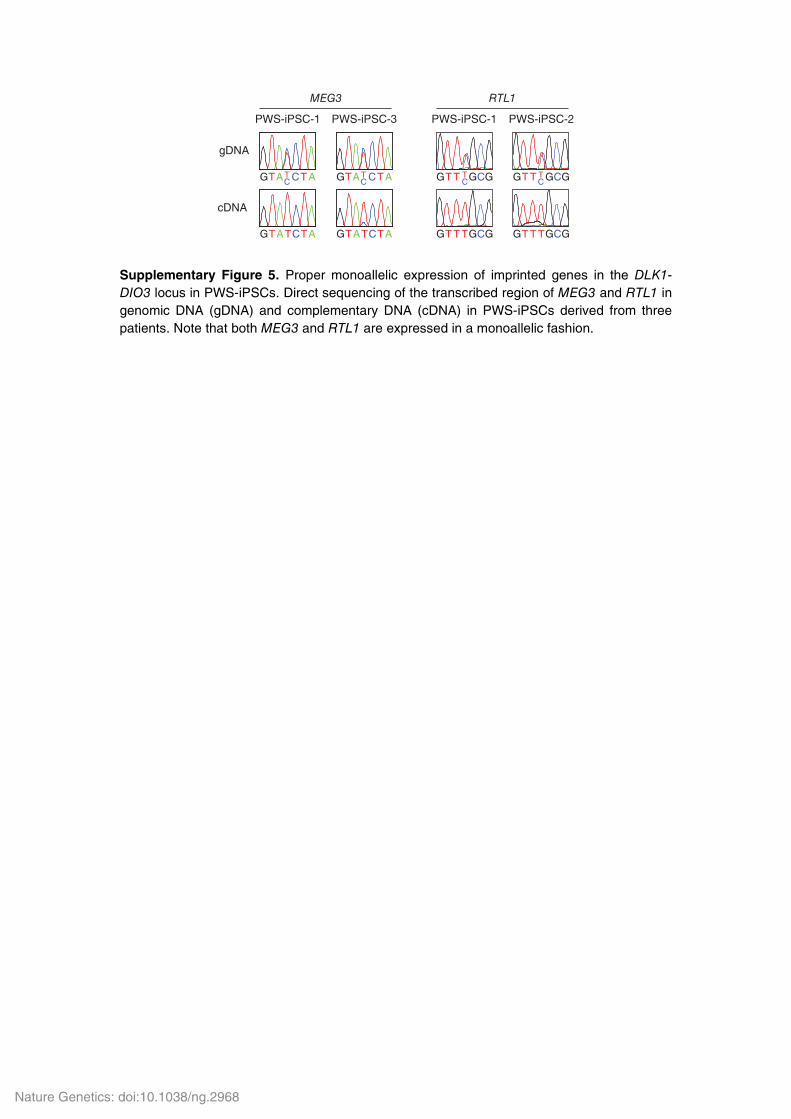
gDNA
cDNA
MEG3
PWS-iPSC-1 PWS-iPSC-3
TA C ATG CT
TA C ATG T
TA C ATG CT
TA C ATG T T T G GCG T
CTT T G GCG
T T G GCG T
T T G GCG CT
PWS-iPSC-1 PWS-iPSC-2
RTL1
Supplementary Figure 5. Proper monoallelic expression of imprinted genes in the DLK1-DIO3 locus in PWS-iPSCs. Direct sequencing of the transcribed region of MEG3 and RTL1 in genomic DNA (gDNA) and complementary DNA (cDNA) in PWS-iPSCs derived from three patients. Note that both MEG3 and RTL1 are expressed in a monoallelic fashion.
Nature Genetics: doi:10.1038/ng.2968

0
200
400
600
800
1,000
1,200
PWS-iP
SCs
PWS-iP
SCs
+ HOTA
IR
Rel
ativ
e H
OTA
IR e
xpre
ssio
n
0
0.5
1.0
1.5
Rel
ativ
e M
EG
3 ex
pres
sion
Con
trol
+ H
OTA
IR
+ IP
W
WT
-PS
Cs
PWS-iPSCs
0
50
100
150
WT
-iPS
Cs
Con
trol
+ IP
W
Con
trol
+ IP
WPWS-iPSCs
Pg-iPSCs
Rel
ativ
e Z
FP
57 e
xpre
ssio
nInput
H3K9me3
WT-ESCs
T CGAGT TG
T CGAGT TG
a b
c d
Supplementary Figure 6. Chromatin regulation in PWS-iPSCs. (a) qRT-PCR of the mean relative fold change ± s.d. (three biological replicates each) in HOTAIR in PWS-iPSCs before and after transfection with an overexpression plasmid. (b) qRT-PCR of the mean relative fold change ± s.d. (three biological replicates each) in MEG3 in PWS-iPSCs before and after transfection with the HOTAIR overexpression plasmid, relative to control (WT) PSCs. (c) Allelic sequence analysis following ChIP for H3K9me3 reveals the association of this histone modi�cation with both methylated and unmethylated alleles of the IG-DMR in normal PSCs. (d) qRT-PCR of the mean relative fold change ± s.d. in ZFP57 in Pg-iPSCs (three biological replicates each) and PWS-iPSCs (three biological replicates each) following introduction of IPW, relative to control (WT) iPSCs.
Nature Genetics: doi:10.1038/ng.2968

Supplementary Table 1. Genes downregulated at least 3-fold in both PWS-iPSCs
and Pg-iPSCs compared with WT-iPSCs
Probe Set ID Gene Symbol Chromosome Start Stop WT-ESCs WT-iPSCs Pg-iPSCs PWS-iPSCs
7981990 SNORD116-21 15 25333951 25334042 3357.58 2621.19 78.77 9.28
7981976 SNORD116-14 15 25325289 25325380 3712.52 3214.09 90.59 17.33
7981982 SNORD116-17 15 25328735 25328826 5370.81 4760.38 162.51 33.68
7981986 SNORD116-17 15 25331674 25331765 5370.81 4760.38 162.51 33.68
7981943 PAR5 15 25230247 25230313 938.75 1057.28 32.62 10.14
7981964 SNORD116-8 15 25315578 25315673 1221.37 1769.01 32.19 17.53
7981958 SNORD116-5 15 25307480 25307574 1099.29 1294.71 22.93 13.61
7981962 SNORD116-5 15 25312935 25313029 1099.29 1294.71 22.93 13.61
7981953 SNORD116-3 15 25302007 25302101 1627.13 2351.93 48.93 24.86
7981966 SNORD116-3 15 25318254 25318348 1627.13 2351.93 48.93 24.86
7981978 SNORD116-15 15 25326434 25326525 6026.03 5255.39 177.84 57.66
7981988 SNORD116-20 15 25332809 25332900 2472.09 2160.71 67.20 24.79
7981996 SNORD116-24 15 25339184 25339275 700.86 587.50 16.64 8.00
7981955 SNORD116-4 15 25304685 25357041 675.72 790.81 27.75 13.34
7981949 SNORD116-1 15 25296624 25296718 501.63 585.67 14.30 10.92
7981919 SNRPN 15 25068794 25244175 1945.02 2189.04 90.59 50.38
7915592 --- 1 45196727 45196842 265.82 495.73 9.75 17.15
7981960 SNORD116-6 15 25310173 25310268 339.13 273.23 14.73 9.62
7981992 SNORD116-22 15 25335070 25335161 295.64 194.74 9.50 7.73
7981947 SNORD109A 15 25287120 25287187 207.84 221.88 14.00 12.12
7982098 SNORD109A 15 25523489 25523556 207.84 221.88 14.00 12.12
7981945 SNRPN 15 25281106 25281637 133.83 129.37 8.26 7.12
7982002 SNORD116-27 15 25346722 25346813 209.24 202.29 13.73 11.36
7924307 --- 1 215803368 215803459 144.20 118.68 11.02 7.65
7981984 SNORD116-18 15 25330532 25330623 172.99 103.74 7.94 6.85
7981974 SNORD116-13 15 25324205 25324296 107.31 92.77 7.69 6.60
7982006 SNORD116-29 15 25351668 25351750 150.15 128.34 14.30 11.81
7981951 SNORD116-2 15 25299357 25299451 223.14 180.75 37.15 25.29
7982000 SNORD116-26 15 25344646 25344741 51.04 58.20 9.83 8.57
7977507 RPPH1 14 20811233 20811565 1582.20 1712.27 382.87 257.26
7982004 SNORD116-28 15 25349789 25349878 129.21 74.16 15.81 12.07
7981994 SNORD116-23 15 25336932 25337024 154.04 60.77 12.03 10.14
7981970 SNORD116-11 15 25321076 25321167 74.04 62.66 13.50 10.49
8115443 --- 5 156085598 156087446 1976.07 1292.76 266.14 230.95
8133876 CD36 7 80231523 80306326 34.23 131.00 24.83 23.42
7978801 MDGA2 14 47309295 48143953 54.61 143.32 41.45 26.88
8094870 SHISA3 4 42399856 42403656 105.86 653.04 173.27 125.83
7981998 SNORD116-25 15 25342810 25342901 52.22 47.96 11.30 10.16
8124684 ZFP57 6 29640260 29658489 42.15 621.85 48.42 157.20
7986757 NDN 15 23930554 23932450 107.91 97.22 25.61 26.01
8095299 --- 4 60698893 60698992 26.54 62.04 17.00 17.21
8047784 ZDBF2 2 207139528 207172525 137.14 315.92 33.32 96.23
8134384 DYNC1I1 7 95401866 95727738 80.32 296.42 75.29 95.27
Nature Genetics: doi:10.1038/ng.2968

Supplementary Table 2. Genes upregulated at least 3-fold in both PWS-iPSCs and
Pg-iPSCs compared with WT-iPSCs
Probe Set ID Gene Symbol Chromosome Start Stop WT-ESCs WT-iPSCs Pg-iPSCs PWS-iPSCs
7976814 SNORD114-2 14 101418190 101418270 10.37 15.37 168.00 116.68
7976795 MEG3 14 101296942 101327358 71.51 81.31 628.81 636.23
7976810 SNORD113-3 14 101396247 101396327 27.02 18.70 313.84 172.13
7976812 SNORD113-4 14 101402828 101402902 8.62 19.13 513.70 203.52
7976816 SNORD114-3 14 101419686 101419760 15.61 19.48 138.20 550.09
7989159 ZNF280D 15 56922374 57030101 30.66 54.31 192.49 198.16
8124380 HIST1H1A 6 26017248 26018048 214.27 173.14 1531.35 654.25
8151931 TSPYL5 8 98285714 98290176 30.50 35.76 301.83 151.38
8027266 --- 19 20480241 20482121 585.71 488.66 1967.53 2218.60
8070629 C21orf105 21 44339133 44345726 228.59 135.80 462.47 822.77
8106418 CRHBP 5 76248680 76265299 96.88 63.27 245.57 1208.75
7976826 SNORD114-26 14 101453371 101453454 27.64 23.12 73.66 448.05
Nature Genetics: doi:10.1038/ng.2968

Supplementary Table 3. Complete list of primers
Quantitative RT-PCR
Gene 5′ primer
/ TaqMan probe 3′ primer
Size (bp)
Number of cycles
Tm (°C)
MEG3 GCCAGCTGTCCCTCTTACCTAA
GCAGGTGAACACAAGCAAAGAC
138 40 60
IPW TGCCTAGACCACCCACTAAAGG
AGTCTCCATGCGGAAGGAAGA
120 40 60
DES CTACACCTGCGAGATTGACG
TGTTGTCCTGGTAGCCACTG
110 40 60
NCAM1 GATGCGACCATCCACCTCAA
TCTCCGGAGGCTTCACAGGTA
113 40 60
AFP AGGCCAGGAACAGGAAGTCT
CAAAGCAGCACGAGTTTTTG
70 40 60
RTL1 TCCTGGCCATAAGAAAGCAC
ACCGAAGATGTGTGGAAAGC
158 40 60
miR-371-3 TGTCCAAGTGGAAAGTGCTG
AGGTTTTCCGGAGCCATTAC
177 40 60
GAPDH AGCCACATCGCTCAGACACC
GTACTCAGCGCCAGCATCG
302 40 60
ZFP57 TGTGGCCAGAATCTTTCTGCAT
AGCGCCTGCTGAAACATTTG
317 40 60
HOTAIR GGTAGAAAAAGCAACCACGAAGC
ACATAAACCTCTGTCTGTGAGTGCC
170 40 60
MIR370 Tm2275 40 60
MIR409 Tm2332 40 60
GAPDH Hs99999905_m1 40 60
PCR and RT-PCR for direct sequencing
Gene 5′ primer 3′ primer Size (bp)
Number of cycles
Tm (°C)
MEG3 TGAGGGGTTTTGAGTCATCC
GGAGTCAGGTGCCCTTATGA
510 35 60
RTL1 TGCAAGACCTCAAAGAGCAA
GCAGGATGAGCACAATCAGA
537 35 60
IG-DMR TCCTTGGACAAGAGAGCACA
GTTGCAAACCAGGGTGAAGT
197 35 60
IPW RT-PCR and cloning
Gene 5′ primer 3′ primer Size (bp)
Number of cycles
Tm (°C)
IPW
AGCTGCTAGCCCAAATCATAGATCAAGATATTTTATTTATGTATG
ACGTCCCGGGTTACACAGGTTTAAGAATTTATTAAGAAAAGA
4498 39 55
ChIP-qPCR
Region 5′ primer 3′ primer Size (bp)
Number of cycles
Tm (°C)
DLK1 promoter AGGCCCTGACTGAGATGCTG
AGACGCTTACGCAGAGCCA
121 40 60
IG-DMR ACTGGAACTGGCAAAGCACC
ACATCAAAAATGCGGAACTCG
121 40 60
SNORD-113 cluster AAAGAACTCACCCGGGCAAT
GCCTCACACCAGCTGAGAGAC
121 40 60
Negative control (chromosome 14)
TGGCCTGCATCCTGTTTTATC
AGACTGACACCTGCTGGCCT
121 40 60
Nature Genetics: doi:10.1038/ng.2968