c copyright 2015 american society of civil engineers ...eprints.qut.edu.au/90829/1/journal paper 1 -...
TRANSCRIPT

This is the author’s version of a work that was submitted/accepted for pub-lication in the following source:
Gallage, Chaminda & Uchimura, Taro(2016)Direct shear testing on unsaturated silty soils to investigate the effects ofdrying and wetting on shear strength parameters at low suction.Journal of Geotechnical and Geoenvironmental Engineering, 142(3), Arti-cle Number-04015081.
This file was downloaded from: https://eprints.qut.edu.au/90829/
c© Copyright 2015 American Society of Civil Engineers
Notice: Changes introduced as a result of publishing processes such ascopy-editing and formatting may not be reflected in this document. For adefinitive version of this work, please refer to the published source:
https://doi.org/10.1061/(ASCE)GT.1943-5606.0001416

Direct Shear Testing on Unsaturated Silty Soils to Investigate the Effects of
Drying and Wetting on Shear Strength Parameters at Low Suction
Chaminda Gallage1 and Taro Uchimura2
1Senior Lecturer, Faculty of Science and Engineering, Queensland University of Technology, 2, George
Street Brisbane, QLD 4001, Australia; E-mail: [email protected]
2Associate Professor, Department of Civil Engineering, University of Tokyo, 7-3-1, Hongo, Bunkyo-Ku,
Tokyo 113-8656, Japan; E-mail: [email protected]
Abstract 1
A modified conventional direct shear device was used to measure unsaturated shear strength of two silty 2
soils at low suction values (0 ~ 50 kPa) that were achieved by following drying and wetting paths of soil-3
water characteristic curves (SWCCs). The results revealed that the internal friction angle of the soils was 4
not significantly affected by either the suction or the drying-wetting SWCCs. The apparent cohesion of 5
soil increased with a decreasing rate as suction increased. Shear stress-shear displacement curves obtained 6
from soil specimens subjected to the same net normal stress and different suction values showed a higher 7
initial stiffness and a greater peak stress as suction increased. A soil in wetting exhibited slightly higher 8
peak shear stress and more contractive volume change behavior than that of soil in drying at the same net 9
normal stress and suction. 10
11
Key words: unsaturated soils, direct shear tests, suction, hysteresis of suction, shear strength, 12
friction angle, apparent cohesion 13
14
15
Introduction 16
Conventional testing equipment, such as triaxial and direct shear testing apparatus used for saturated soil 17
testing, has been modified and extensively used in the determination of the shear strength of unsaturated 18
soils (Bishop and Donald 1961; Ho and Fredlund 1982; Gan et al. 1988; Ridley 1995; Vanapalli et al. 19
1996; Caruso and Tarantino 2004; Sedano et al. 2006). The modified direct shear apparatus is particularly 20
convenient for determination of shear strength of unsaturated soils (Fredlund and Rahardjo 1993). This 21
apparatus offers an advantage over triaxial tests because the drainage path is relatively short. In the direct 22
shear test, the time required to reach equilibrium conditions under applied matric suction is approximately 23
1 ~ 2 days compared to 7 ~ 15 days (depending on the sample height) for a triaxial test. Further, the 24
design of modified triaxial apparatus for unsaturated soils is complicated, and the experimental set-up is 25
tedious. Rahnenma et al. (2003) pointed out that the failure mechanism of rain-induced soil slope failures 26
can be more appropriately modeled by simple shear tests that are less complicated, easier to set-up, and 27
less time-consuming. 28
The present study involves modification of a conventional direct shear apparatus to apply the desired 29
suction to the soil specimen. The soil sample was exposed to the atmosphere to maintain pore-air pressure 30
(ua) at zero. The negative gauge pore-water pressure (uw) in the specimen was controlled by applying a 31
constant negative head to the water phase through a ceramic disk at the base. As water cavitates in the 32
measuring system when the negative gauge pressure approaches 101 kPa, the apparatus limited the 33
applied matric suction (ua-uw) to 101 kPa (i.e., 1 atm). The modified apparatus can be used to apply and 34
maintain a desired suction value following drying or wetting paths of soil-water characteristic curves 35
(SWCCs). 36
Zhao et al. (2013) reported that most rain-induced soil slope failures are shallow-seated with sliding 37
depths varying between 0.5 m and 3.0 m and therefore the shear stresses on the failure plane are in the 38
low range. To initiate rain-induced failures, the shear strength on the failure plane should decrease below 39
these mobilised stress values. During rainfall, the strength of soil decreases as soil suction decreases. 40
Therefore, at the initiation of rain-induced slope failures, a very low suction range (0 – 50 kPa) or positive 41

pore-water pressure can be expected on the failure plane (Gofar et al. 2008; Yeh et al. 2008). Further, 42
fine-grained soils exhibit a significant hysteresis (the difference between drying and wetting SWCCs) at 43
low suction range (Gallage and Uchimura 2010) and unsaturated shear strength of soil is affected by this 44
hysteresis. Therefore, to analyze and predict the rain-induced soil slope stability, it is important to 45
understand the effects of low suction and the hysteresis of SWCCs on unsaturated shear strength 46
parameters. 47
Although numerous experimental results can be found for the hysteresis between drying and wetting 48
SWCCs and effects of high suction on unsaturated shear strength parameters, limited experimental 49
evidence exists on the effects of the hysteresis and low suction on unsaturated shear strength parameters. 50
Therefore, this paper presents the results of modified direct shear tests conducted on two silty soils for a 51
low suction range (0~50 kPa). The suction values of test specimens were achieved following wetting and 52
drying paths of SWCCs of the soil (hysteresis). Further, the test results obtained from the modified direct 53
shear apparatus were used to investigate the effects of suction and dying-wetting hysteresis on the shear 54
strength, stiffness, internal friction angle, and apparent cohesion of test materials. 55
56
Modified Direct Shear Apparatus 57
Modification on a conventional direct shear apparatus was undertaken to facilitate direct shear testing on 58
soils under constant suction. Fig. 1 depicts the general layout of the modified apparatus. The apparatus 59
accommodates a cylindrical specimen (60 mm diameter and 20 mm height). A ceramic disk with an air 60
entry value of 100 kPa is embedded in the sample base. The sample can either be prepared on the disk or 61
placed upon it after extruding an undisturbed sample or re-compacting the sample. 62
The compartment below the ceramic disk is connected to a water tank that maintains a water level at the 63
mid-height of the sample. The water in the tank can be subjected to negative pressure, with a pressure 64
transducer connected to the bottom of the water tank facilitating the measurement (Fig. 1). Negative 65
pressure is applied to the water phase in the sample through the saturated ceramic disk at the base of the 66
sample. The soil specimen is exposed to the atmosphere through the gap (1 mm) between the two shear 67

boxes to maintain the pore-air pressure (ua) at zero. Therefore, the matric suction (ua-uw) in the sample is 68
equal to the absolute value of negative pressure in the water tank. This apparatus can be used to apply a 69
maximum suction of 100 kPa. 70
The water tank is placed on an electronic balance that can be used to measure mass up to 4.2 kg with an 71
accuracy of 0.01 g. The balance reading is used to calculate the movement of water into and out of the 72
soil specimen. A thin layer of silicon oil is placed on the water surface in the tank to minimise water 73
evaporation. It is assumed that equalization of the pore-water pressure of the sample is achieved when the 74
balance reading is approximately constant. 75
Total vertical stress (σn) is applied by a double action bellofram cylinder mounted with a loading piston, 76
which in turn is connected to the vertical loading shaft of the direct shear apparatus. Two load cells 77
attached to the load- receiving plate measure the vertical load (Wu, 2003). The sum of the readings of two 78
load cells yields the applied vertical load. During shearing, the control feedback system changes the 79
vertical load to maintain a constant vertical normal stress by taking the change in cross sectional area of 80
the sample into account. A shaft connected to the worm wheel system allows for application of horizontal 81
shear force to the upper shear box, facilitating displacement (strain) controlled shear tests. As shown in 82
Fig. 1, a load cell is connected to the horizontal shaft to measure the applied horizontal shear load. 83
Two linear voltage displacement transducers (LVDT), each with a maximum range of 10 mm, are used to 84
measure vertical and shear displacements. Output signals of all the transducers (three load cells, two 85
LVDTs, one pore-water pressure transducer) are logged using control software at specified intervals. 86
87
Testing Materials 88
Two silty soils, both from Japan, were tested in this study: Edosaki soil procured from a natural slope in 89
Ibaraki; and Chiba soil excavated from a railway embankment in Chiba prefecture. Wet sieving analysis 90
and hydrometer tests were performed on both the Edosaki and Chiba soils as they exhibit fines (particles 91
finer than 0.075 mm) contents of 16.5 % and 36 %, respectively. Table 1 displays grain size parameters 92
and basic soil properties, obtained using JGS standard test methods, for both materials, including: specific 93

gravity, maximum void ratio, minimum void ratio, and Atterberg limits. Review of these results relative 94
to the Unified Soil Classification System (USCS) characterizes both soils as silty sand. 95
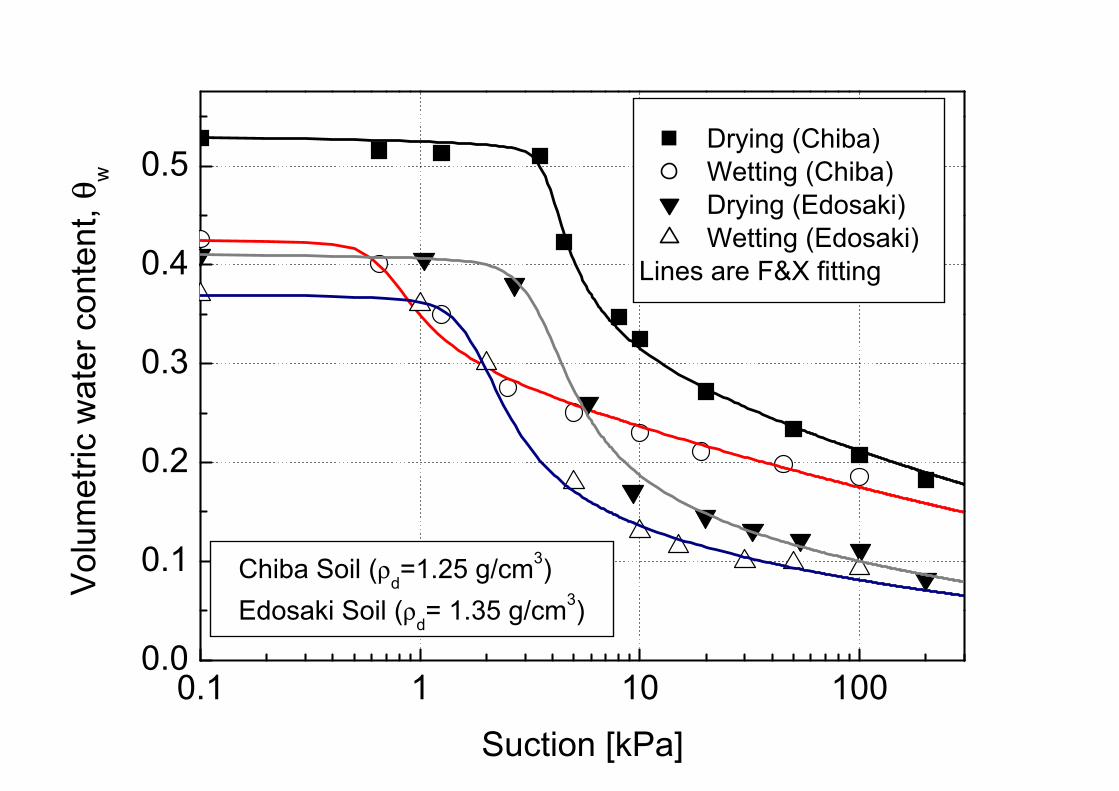
Fig. 2 depicts SWCCs obtained in the laboratory using a Tempe pressure cell for Edosaki and Chiba 96
soils. Drying and the wetting SWCCs were obtained for a sample of Edosaki soil with a dry density of 97
1.35 Mg/m3, and for Chiba soil with a dry density of 1.25 Mg/m3. Gallage and Uchimura (2010) detailed 98
the Tempe pressure cell and its testing procedure used in this study. The equation in Fredlund and Xing 99
(1994) was used to best-fit the SWCC experimental data. 100
101
Testing Program and Data Analysis 102
Unsaturated shear strength parameters for the Edosaki soil (initial dry density of 1.35 Mg/m3) were 103
obtained through a series of constant suction consolidated drained direct shear (CSCDDS) tests at 104
predetermined low suction values (e.g., 0, 10, 20, 50 kPa) achieved following drying and the wetting 105
paths. Four tests were conducted under different net normal stress (σn-ua) values (e.g., 34, 84, 135, 185 106
kPa) for each suction value. All specimens were prepared with an initial gravimetric water content of 8 % 107
to obtain an initial matrix suction greater than 50 kPa. 108
A second series of CSCDDS tests were conducted on the Chiba soil (initial dry density of 1.25 Mg/m3) 109
with similar low suction values as used for the Edosaki series. As above, for each suction value four tests 110
with different net normal stress (σn-ua) values (e.g., 25, 50, 100, 200 kPa) were conducted. All test 111
specimens in this series were prepared with an initial gravimetric water content of 10 % to obtain an 112
initial matrix suction greater than 50 kPa. 113
The test procedure for measuring unsaturated shear strength parameters in wetting and drying using the 114
modified direct shear apparatus involves: 115
(1) The sample preparation and installation in the apparatus, 116
(2) Achieving the pre-determined suction following wetting or drying, and 117
(3) Shearing the sample under the controlled suction. 118

Sample Preparation 119
Following the procedure of Huang (1994), the ceramic disk and associated system were saturated. The 120
base of the sample (surface of the ceramic disk) was then elevated 1 mm above the bottom edge of the 121
lower shear box to allow the specimen to freely expand (dilate) during shearing. Thereafter, the upper and 122
lower shear boxes were clamped with spacers in between to create a gap. The gap eliminates frictional 123
resistance between the two shear boxes during shearing. The water tank was placed on the electronic 124
balance, with the water level brought to the mid-height of the specimen. The LVDT, which measures 125
vertical displacement, was set at the position indicated in Fig. 1. Following setup, all measurements were 126
initialized to zero. The valve connecting the water tank and the compartment below the saturated ceramic 127
disk and its associated system was closed. The pore-water pressure transducer was then connected to the 128
compartment to measure initial suction (negative pore-water pressure) of the sample. 129
The specimen was directly prepared on the ceramic disk by moist tamping at a pre-specified moisture 130
content to achieve a predetermined sample density. The top reaction frame and the modified load cells for 131
vertical load (Wu, 2003) were mounted and the spacers between shear boxes were carefully pulled out 132
minimizing disturbance to the specimen. 133
Data logging was initiated prior to stabilization of initial suction in the soil sample. The clamp on the 134
vertical loading shaft was then released and a predetermined vertical stress was applied at a constant rate 135
of increase of 2 kPa/min. At the same time, the valve connecting the water tank and the base of the 136
sample was opened allowing the water, which was subjected to a predetermined negative pressure, to 137
flow into the specimen through the ceramic disk. 138
139
Wetting and Drying Processes 140
The specimen in the wetting path 141
The initial water content of soils (8% or 10%) was determined in order to achieve initial suction greater 142
than 50 kPa. Suction was then reduced to a predetermined value, less than 50 kPa, by wetting the soil 143
sample. Negative air pressure was first applied to the water tank until the predetermined negative water 144

pressure was achieved. The valve was then opened allowing water to flow into the specimen through the 145
ceramic disk. During this water supply, the normal stress was gradually increased to a predetermined 146
value. The change in the mass of the water tank was monitored during the wetting process. Pore-water 147
pressure equalization of the specimen was assumed to have occurred when water flow stopped. At this 148
point, the reading of the electronic balance was approximately constant. It generally took between 24 to 149
30 hours to obtain pore-water pressure equalization in the sample. Fig. 3 shows the typical time histories 150
of sample pore-water pressures (measured and controlled) and the change in the mass of the water tank 151
until the pore-water pressure equalization was achieved. 152
153
The specimen in the drying path 154
Once the specimen was prepared on the ceramic disk and setup in the apparatus, it was saturated 155
allowing water, which was in the tank under atmospheric pressure conditions (zero pressure), to flow into 156
the specimen through the ceramic disk. The saturation of the specimen was assumed to have occurred 157
when the change in the mass of the water tank was negligible. At the same time, the normal stress was 158
gradually increased to a predetermined value. 159
After sample saturation, the valve was closed and negative air pressure was gradually applied to the 160
water tank until a predetermined negative pore-water pressure value was achieved. When the valve was 161
re-opened, water flowed into the tank from the specimen until pore-water pressure equalization was 162
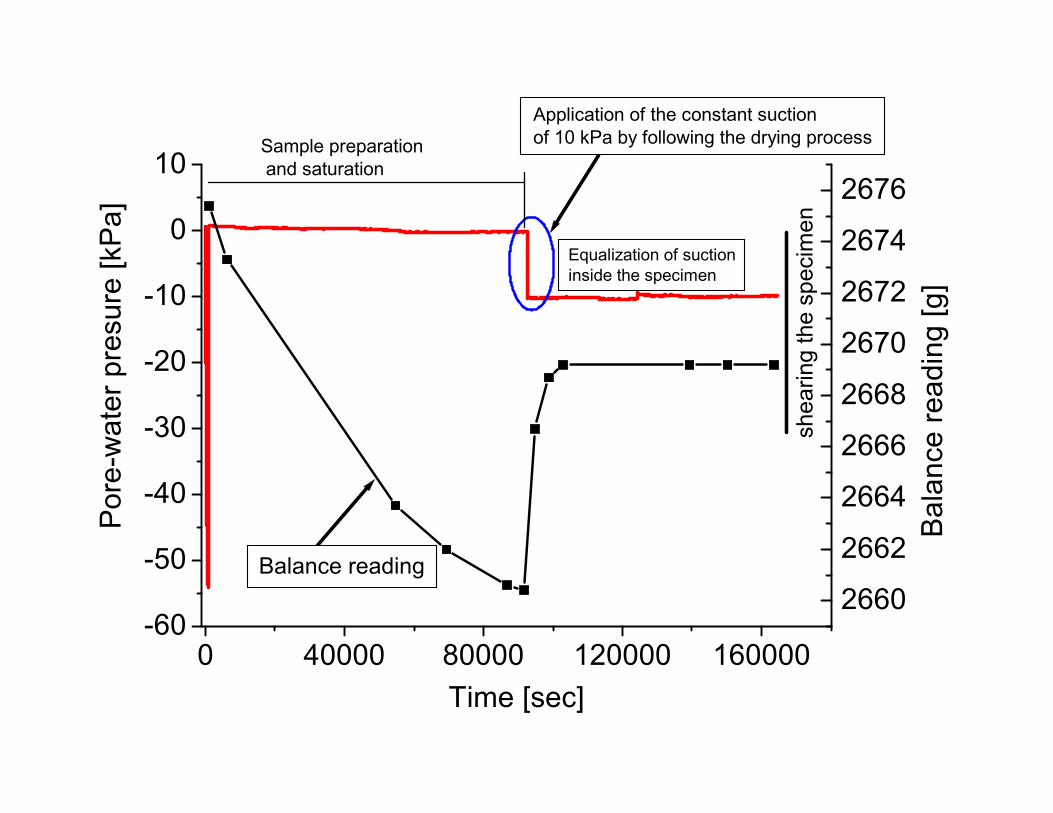
achieved. It took between 12 to 24 hours for saturation and another 24~30 hours for de-saturation. Fig. 4 163
shows the typical time histories of the pore-water pressure and the change in the mass of the water tank 164
until the pore-water pressure equalization was achieved. 165
166
Shearing the Specimen 167
Once the predetermined suction (e.g., 0 ~ 50 kPa), either by drying or wetting, and vertical normal stress 168
(e.g., 25 ~ 200 kPa) were achieved, the specimen was sheared with the shear displacement rate of 0.00008 169
mm/sec, which is the minimum rate of shear displacement that this apparatus can apply. Gan et al. (1988) 170

reported that shear displacement rates smaller than 0.00022 mm/sec would satisfy the drainage shearing 171
assumption for unsaturated silty clay. Therefore, the shear displacement rate (0.00008 mm/sec) used in 172
this testing program would ensure the drained shearing conditions for the tested soils. 173
The vertical and shear displacements were measured in mm. Negative and positive values of the vertical 174
displacement represented contraction and dilation of the sample, respectively. The shear stress was 175
calculated by using the measured shear force and corrected cross sectional area of the specimen. During 176
shearing, the output data from the measuring system were logged at every 2 sec. The final water content 177
of the specimen was measured after the test was completed. 178
To obtain saturated shear strength properties of test materials, the specimen was first saturated following 179
the procedure explained in the section of “the specimen in the drying path” while increasing the normal 180
stress. Then, the specimen was sheared maintaining zero pore-water pressure. 181
182
Data Analysis 183
The shear stress (τ) and the normal vertical stress (σn) are calculated as follows: 184
τ = SF/Ac (1) 185
σn = NF/Ac (2) 186
where SF is the shear force, NF is the normal force to the specimen, and Ac is the corrected area of the 187
specimen being sheared. For a cylindrical specimen of internal diameter D, 188
189
−= θδθ sin
2
2
DDAc (3) 190
191
Where
= −
Dδθ 1cos in radians and δ is the relative displacement between the lower and upper shear 192
boxes. δ is equal to shear displacement (d) as the lower shear box is fixed. Shear displacement (δ ) can 193
be used to calculate shear strain (%) = (shear displacement /sample diameter) x 100). However, the shear 194

strain is not uniform around the perimeter of the sample when a circular sample is used. Therefore, the 195
shear displacement is used to interpret direct shear results when a circular sample is used. 196
197
Results and Discussion 198
The results of a series of unsaturated direct shear tests on Edosaki and Chiba soils are presented and 199
discussed in this section. 200
201
Effects of Net Normal Stress on Shear Strength and Volume Change Behaviors of Soil 202
Fig. 5 show the effects of the net normal stress (σn –ua) on shear stress-shear displacement and volume 203
change behaviors of Edosaki soil with constant suction of 20 kPa, which was achieved by following a 204
wetting path. It can be seen that the shear strength and the initial stiffness of unsaturated soils increase 205
with increasing net normal stress (σn –ua). Further, the volume of unsaturated soils becomes contractive 206
(in the figures, the negative vertical displacement represents the volume reduction of the specimen) as the 207
net normal stress increases. Similar results can be observed from four tests conducted under constant 208
suction of 20 kPa, which was achieved by following a drying path (Figs. 6(a) and (b)). Tests conducted on 209
both Edosaki and Chiba soils with constant suction of 0 (saturated samples), 10 kPa, and 50 kPa achieved 210
by following either wetting or drying paths showed similar results. It is seen from the results that the 211
shear strength and the initial stiffness of unsaturated soils increase and the volume of soils becomes 212
contractive as the net normal stress increases. These behaviors are independent of the degree of saturation, 213
the method of suction achievement (drying or wetting), and soil type. Further, similar results have been 214
observed by Huang (1994); Blight (1967); Gan and Fredlund (1996); Mashhour et al. (1995). 215
According to Newton’s friction law, frictional resistance increases with increasing the normal stress 216
acting on the plane. The same concept is applied to the shear plane when a direct shear test is conducted 217
on soil. In a direct shear test, the applied vertical stress is normal to the shear plane and therefore when 218
the vertical stress (net normal stress) is increased, the shear strength (the failure shear stress) of soil 219

increases (Fig. 5(a) and Fig. 6(a)). Further, a greater vertical stress induces a higher confinement to the 220
direct shear sample. As a result, the shear stiffness (the initial slope shear stress – shear displacement 221
curve) of soil increases with the vertical net normal stress (Fig. 5(a) and Fig. 6(a)). 222
Initial dry density of soil samples tested in this study is 1.35 g/cm3 or 1.25 g/cm3. These densities are 223
relatively low as no clear peak stress is observed in the shear stress – shear displacement plots. Therefore, 224
when these samples are sheared the net normal stress may force soil particles to close-packed 225
arrangement (volume contraction) during shearing. As a result, samples become more contractive as the 226
net normal stress increases (Figs. 5(b) and 6(b)). This volume contraction makes the sample denser and as 227
a result the shear resistance and the initial stiffness increase. However, when the net normal stress is low 228
and it is smaller than the peak (maximum) shear stress of the samples, the vertical normal stress is not big 229
enough to force soil particles into close-packed arrangement during shearing. In such cases, the samples 230
tend to show dilation (volume increase) during shearing as shown in Fig. 6(b) by the specimen with net 231
normal stress of 34 kPa. It can be concluded that under constant suction, the increase in vertical stress 232
causes a progressive sample volume change from dilatancy to compression until dilatancy completely 233
disappears. 234
235
Effects of Suction on Shear Stress-Shear Displacement and Volume Change Behaviors 236
Figs. 7(a) and (b) show the shear stress-shear displacement and the volumetric behaviors, respectively, 237
of four tests conducted on Edosaki soil specimens subjected to the same net normal stress of 34 kPa and 238
different suction values (e.g., 0, 10, 20, and 50 kPa). The suction values were achieved by wetting. The 239
results suggest that the shear strength and stiffness of the soil increase with the increase in soil suction. 240
The soil exhibits more dilative volumetric behavior as suction is increased. Similar results were observed 241
for every group of four tests with the four different suction values: 0, 10 kPa, 20 kPa, and 50 kPa that 242
were achieved by following either drying or wetting path. Tests were conducted on both Edosaki and 243
Chiba soils. Each group of four tests was conducted by maintaining a constant net normal stress (e.g., 34, 244
84, 135, 185 kPa for Edosaki soil, and 25, 50, 100, 200 kPa for Chiba soil). The test results strongly 245

demonstrate that suction has a great influence on the shear characteristic of unsaturated soil. Independent 246
of:soil type, net normal stress, andhow the suction was achieved (i.e., following drying and wetting paths), 247
the shear resistance and stiffness of soils increases, and the specimens exhibit more contractive behaviors 248
as suction increases. These phenomena are consistent with the fact that inter-particle forces in soils 249
increase as suction increases. 250
To clarify the physics of unsaturated particulate media, two spherical particles of radius R in contact are 251
considered. The water meniscus between them is bound by the two particles and by an imaginary torus. 252
The small radius of this doughnut-shaped torus is r1 and the distance from the centre to the inside wall of 253
the torus is r2. Therefore, the local contact force, F, which the meniscus imposes on the particles, 254
contributed by the pressure of the fluid acting on the cross-sectional area of the meniscus and the surface 255
tension (Ts) acting along the perimeter of the meniscus, can be expressed as (Cho and Santamarina 2001): 256
257
)2())(( 22
2 rTruuF swa ππ +−= (4) 258
259
This force is the only one arising from meniscus water and increases as suction increases. Therefore, the 260
effects of matric suction result in a greater normal force holding the particles together and limiting 261
slippage strength (Sawangsuriya 2006). As a result, the stiffness and the strength of unsaturated soils 262
increase with increasing matric suction. However, this effect is not unbounded, since the contact force (F) 263
tends toward a limiting value due to progressive reduction in the meniscus radius (r1) as suction increases 264
(Mancuso et al. 2002). 265
As shown in Fig. 7(a), a residual state is achieved at 5 - 6 mm shear displacement. At this shear 266
displacement, pore-water paths could be discontinued at the shear plane and pore-water pressure in the 267
shear plane will be equal to atmospheric pressure. Therefore, no suction effect can be observed at the 268
residual state. 269
Another effect of suction on the unsaturated soil behavior can be clearly seen in the volumetric 270
deformation during shearing. As shown in these figures, the soil is more contractive at zero suction and 271
becomes less contractive with the increasing value of suction prior to shear, regardless of the value of the 272
net confining pressure. As soil structures become stronger and less deformable with an increase in suction, 273
it is expected that they will exhibit dilative (less contractive) behavior with an increase in suction. 274
However, it is worth mentioning that the effect of suction on volumetric behavior of unsaturated soil 275
reduces as the net confining stress increases. Similar effects of suction on stress-strain and volumetric 276
behaviors have been reported by Huang (1994); Blight (1967); Gan and Fredlund (1995); Mashhour et al. 277
(1995). 278
279
Effects of Drying and Wetting on Shear Stress –Shear Displacement and Volume Change Behaviors 280
The results shown in Fig. 8 were obtained by shearing two Edosaki sand specimens subjected to the 281
same constant value of suction of 10 kPa and an identical net normal stress of 84 kPa. The only difference 282
was the method used to achieve the suction: one was achieved by wetting and the other was by drying. It 283
can be observed from the results that the specimen subjected to wetting exhibits slightly greater peak (or 284
failure) shear stress than the specimen subjected to drying. Further, the specimen subjected to wetting is 285
more contractive than that subjected to drying. The similar behaviors were observed independent of soil 286
(e.g: Edosaki or Chiba soil), suction value, and net normal stress used. Though, the difference between 287
wetting and drying stress-strain behavior is small, a significant difference in volume change during 288
shearing can be observed. 289
The results shown in Fig. 8 suggest that the specimen subjected to wetting (lower water content) has 290
slightly higher peak shear strength than that subjected to drying (higher water content). These results 291
contradict the previous finding that the higher water content resulting from the drying process results in a 292
higher strength in the soil sample (Lamborn 1986; Vanapalli et al. 1996; Oberg and Sallfors 1997). 293
Therefore, to investigate the possible reasons for these contradictory results, detailed analyses were 294
conducted on data of two identical specimens (one subjected to drying and the other subjected to wetting) 295
measured during shearing. 296
Fig. 9 shows the vertical displacement, degree of saturation, and suction change during shearing of two 297
identical soil samples of Chiba soil re-compacted to an initial dry density of 1.25 g/cm3 at a gravimetric 298
water content of 10%. Although both specimens were subjected to the same suction of 10 kPa, one was 299
subjected to drying process and the other was subjected to wetting process. Both specimens were sheared 300
under a constant vertical net stress of 50 kPa. As shown in Fig. 9(a), the vertical displacement suggests 301
that the specimen subjected to wetting is more contractive than the specimen subjected to drying. No 302
water content change in the sample was observed in either specimen during shearing and the final water 303
contents (just after the test) were measured as 20.9 % and 18.7% for the sample subjected to drying and 304
wetting, respectively. The change in degree of saturation of the specimens during shearing was calculated 305
using the final water content and the sample volume change. The sample volume change was calculated 306
using the measured vertical displacement and assuming a constant cross sectional area which is equal to 307
the cross sectional area of a shear box. Figure 9(b) shows the change in degree of saturation of the two 308
specimens during shearing. As both specimens exhibited contractive behavior, the degree of saturation 309
increased as shown in Fig. 9(b). Since the specimen subjected to drying is more contractive than the one 310
subjected to wetting, the difference between the degree of saturation of the specimens subjected to drying 311
and wetting decreased as shown in Fig. 9(b). It was observed by Wu et al. 2007 and Airey (1987) that the 312
volumetric strain in the shear band in the direct shear test is significantly greater than the average 313
volumetric strain of the specimen. Hence, the volume change in the shear band of the specimen from 314
wetting and from drying could be more contractive and more dilative, respectively, than the calculated 315
values. Especially at peak stress, this volume change behavior could make the degree of saturation of the 316
shear band of the specimen from wetting to be greater than that from drying. This phenomenon may give 317
higher strength to the specimen subjected to wetting than to the subjected to drying. The experimental 318
results herein may then agree with the results of Lamborn (1986); Vanapalli et al. 1996; Oberg and 319
Sallfors (1997). 320

The suction in the specimens was controlled by applying negative pressure to the water supplying tank 321
and therefore, no change in suction in the specimens was observed during shearing (Fig. 9(a)). 322
323
Effects of Suction and Wetting-Drying Hysteresis on Shear Strength Parameters 324
The direct shear test results on unsaturated soils demonstrated the significant effect of suction on the 325
shearing resistance, of which a more detailed and quantitative analysis will be made in this section. In this 326
analysis, the failure of a specimen refers to its peak (maximum) shear stress. The correction for the 327
dilatancy effect was not made on the measured shear stresses at failure since the majority of direct shear 328
tests exhibited contractive behavior. 329
To obtain the shear strength parameters (the apparent cohesion (c’) and the internal friction angle (φ’)) 330
corresponding to a particular suction value, four soil specimens subjected the same suction and four 331
different net normal stresses (i.e., 34, 84, 134, and 184 kPa) were sheared. Implying the mentioned failure 332
criterion, the failure shear stress for each test was then obtained. Plotting these failure shear stresses with 333
the corresponding net normal stress and performing best linear-fitting on the plotted data, the apparent 334
cohesion(c’) and the internal friction angle (φ’) corresponding to the particular suction value were 335
obtained. Figs. 10(a) and (b) depict the variation of φ’ and c’, respectively, with the increase in suction, 336
for Edosaki and Chiba soils. Furthermore, these figures demonstrate the effect of wetting–drying on φ’ 337
and c’. 338
It can be seen from the Fig. 10(a) that φ’ is relatively independent of the increase in suction, and the 339
calculated φ’ values are quite consistent with the effective internal friction angle of the saturated soil. It 340
can be observed that the effective friction angle of saturated soil makes the same contribution to the shear 341
strength of unsaturated soil. Further, Fig. 10(a) shows that the effect drying-wetting hysteresis of the 342
SWCCs on φ’ is insignificant. This φ’ represents the frictional resistance at inter-particle contacts, and 343
may be affected by surface roughness of the particles (Christopher et al. 2008), particle crushing during 344

loading (Hamidi et al. 2009; Bolton 1986), and the density (dilatancy effect) (Bolton 1986), but not by 345
suction or water content (Cokca et al 2004; Mouazen et al. 2002). 346
Fig. 10(b) shows that the apparent cohesion (c’) increases at a decreasing rate as the suction increases. A 347
number of researchers (Escario & Saez 1986; Fredlund et al. 1987; Wheeler 1991; Ridley 1995; Ridley et 348
al. 1995) found a linear increase of c’ with suction until the air-entry value of soil, followed by a non-349
linear increase (decreasing rate). The air-entry values of soils used in this study are relatively small, 3 – 4 350
kPa (Fig. 2), and therefore the effect of the air-entry on linear and non-linear variation of c’ with suction 351
cannot be observed. The increase in suction may increase the inter-particle bonding force which can 352
contribute to the apparent cohesive force between particles. Furthermore, these figures reveal that the c’ 353
from wetting is greater than that from drying, and this is consistent with the finding of Han et al. (1995). 354
A possible reason for this behavior has been discussed under the sub-topic of “Effects of the drying and 355
the wetting on shear stress–shear displacement and volume change behaviors” 356
357
Conclusions 358
The shear behavior of unsaturated silty soils subjected to low suction (0 ~50 kPa) and low net normal 359
stress was investigated in this study by using a modified direct shear apparatus. A series of shear tests was 360
conducted on Edosaki and Chiba soils under various combinations of net normal stress and suction. The 361
suction was achieved by either wetting or drying in order to investigate the effect of wetting-drying (the 362
hysteresis of SWCC) on the shear behavior of unsaturated soils. The main conclusions of this study are 363
follows: 364
• The shear resistance increases and volume change becomes more contractive with the increase in 365
the net normal stress. 366
• Shear stiffness and peak shear stress increase as suction increases. Further, a soil having a higher 367
suction shows less contractive volume change during shearing. 368

• The internal friction angles of tested materials are independent of the suction and the wetting-369
drying hysteresis of SWCC. 370
• The results indicated that the apparent cohesion increases with suction in a non-linear fashion at a 371
decreasing rate with increasing suction. 372
• Soil with suction achieved by wetting exhibits higher apparent cohesion at the same suction than 373
soil with suction achieved by drying. 374
• During shearing, soil from wetting is more contractive than the soil from drying at the same 375
suction and the net normal stress. 376
377
Acknowledgement 378
The authors gratefully acknowledge the Promoting Fundamental Transport Technology Research of the 379
Japan Railway Construction, Transport and Technology Agency (JRTT) and Grants-in-Aid for Scientific 380
Research of the Japan Society for the Promotion of Science (JSPS) for the financial support for this study. 381
This paper is based on the first author’s research completed as partial fulfillment for the Ph.D 382
requirements at the University of Tokyo, Japan. Therefore, the first author acknowledges the scholarship 383
received from the Ministry of Education, Science, Sports, and Culture, Government of Japan 384
(MONBUSHO) for undertaking his doctoral degree. 385

References 386
Bishop, A. W., and Donald, I. B. (1961). “The experimental study of partially saturated soils in the 387
triaxial apparatus.” Proc., 5th Int. Conf. Soil Mech. Found. Eng., Vol. 2, Dunod, Paris, France, 13-21. 388
Blight, G. E. (1967). “Effective stress evaluation for unsaturated soils.” J. Soil Mech. Found. Eng. Div., 389
93(2), 125-148. 390
Bolton, M. D. (1986). “The strength and dilatancy of sands.” Geotechnique, 36(1), 65-78. 391
Caruso, A., and Tarantino, A. (2004). “A shear box for testing unsaturated soils from medium to high 392
degree of saturation.” Geotechnique, 54(4), 281-284 393
Cho, G. C., and Santamarina, J. C. (2001). “Unsaturated particulate materials – particle-level studies.” J. 394
Geotech. Geoenviron. Eng., 127(1), 84-96. 395
Christopher, A.B., Tuncer, B. E., Craig, H. B., and David, M. M. (2008). “Geological and physical factors 396
affecting the friction angle of compacted sands.” J. Geotech. Geoenviron. Eng., 134(10), 1476-1489. 397
Cokca, E., Erol, O., and Armangil, F. (2004). “Effects of compaction moisture content on the shear 398
strength of unsaturated clay.” Geotech. Geol. Eng. J., 22(2), 285-297. 399
Escario, S., and Saez, J. (1986). “The shear strength of partly saturated soils.” Geotechnique, 36(4), 453-400
456. 401
Fredlund, D. G., and Rahardjo, H. (1993). Soil mechanics for unsaturated soils, John Wiley & Sons, New 402
York. 403
Fredlund, D. G., Rahardjo, H., and Gan, J. K. M. (1987). “Non-linearity of strength envelope for 404
unsaturated soils.” Proc. 6th Int. Conf. Expansive Soils, Vol. 1, Taylor & Francis, New Delhi, India, 49-405
54. 406
Fredlund, D. G., and Xing, A. (1994). “Equation for the soil-water characteristic curve.” Can. Geotech. J., 407
31(4), 521-532. 408
Gallage, C. P. K., and Uchimura, T. (2010). “Effects of dry density and grain size distribution on soil-409
water characteristic curves of sandy soils.” Soil Found., 50(1), 161 -172. 410

Gan, J. K. M., Fredlund, D. G., and Rahardjo, H. (1988). “Determination of the shear strength parameters 411
of an unsaturated soil using the direct shear test.” Can. Geotech. J., 25(8), 500-510. 412
Gan, J. K. M., and Fredlund, D. G. (1996). “Shear strength characteristics of two saprolitic soils.” Can. 413
Geotech. J.,33(4), 595-609. 414
Gofar, N., Lee, M. L., and Kassim, A. (2008). “Response of Suction Distribution to Rainfall Infiltration in 415
Soil Slope.” Elect. J. Geotech. Eng., 13(E), 1-13. 416
Hamidi, A., Alizadeh, M., and Soleimani, S. M. (2009). “Effect of particle crushing on shear strength and 417
dilation characteristics of sand gravel mixtures.” Int. J. Civil Eng., 7(1), 61-71. 418
Han, K. K., Rahardjo, H., and Broms, B. B. (1995). “Effects of hysteresis on the shear strength of a 419
residual soil.” Proc., 1st Int. Conf. Unsat. Soils, E. E. Alonso and P. Delage, ed., Vol. 1, A. A. Balkema, 420
Paris, France, 499-504. 421
Ho, D. Y. F., and Fredlund, D. G. (1982). “A multi-stage triaxial test for unsaturated soils.” Geotech. Test. 422
J., 5(1/2), 18-25. 423
Huang, Y. (1994). “Effects of suction on strength and deformation behavior of unsaturated collapsible 424
soils.” Ph.D. thesis, University of Tokyo, Tokyo, Japan. 425
Lamborn, M. J. (1986). “A micromechanical approach to modeling partly saturated soils.” M.Sc. thesis, 426
Texas A&M University, Texas, USA. 427
Mancuso, C., Vassallo, R., and d’Onofrio, A. (2002). “Small strain behaviour of a silty sand in controlled 428
suction resonant column – torsional shear tests.” Can. Geotech. J., 39(1), 22-31. 429
Mashhour, M. M., Ibrahim, M. I., and El-Eemam, M. M. (1995). “Variation of unsaturated soil shear 430
strength parameters with suction.” Proc., 1st Int. Conf. Unsat. Soils, E. E. Alonso and P. Delage, ed., Vol. 431
3, A. A. Balkema, Paris, France, 1487-1493. 432
Mouaza, A. M., Ramon, H., and Baerdemaeker, J. D. (2002). “Effect of bulk density and moisture content 433
on selected mechanical properties of sandy loam soil.” Biosys. Eng., 83(2), 217-224. 434
Oberg, A. L., and Sallfors, G. (1997). “Determination of shear strength parameters of unsaturated silt and 435
sands based on the water retention curve.” Geotech. Test. J., 20(1), 40-48. 436

Sawangsuriya, A. (2006). “Stiffness-suction-moisture relationship for compacted soils.” PhD. thesis, 437
University of Wisconsin, Madison, USA. 438
Rahnenma, A., Habibagahi, G., and Ghahramani, A. (2003). “A new simple shear apparatus for testing 439
unsaturated soils.” Iran. J. Sci. Tech., 27(B1), 73-80. 440
Ridley, A. M., Burland, J. B., and Monroe, A. S. (1995). “Unconfined compression tests with pore 441
pressure measurements.” Proc., 11th Afric. Reg. Conf. Soil. Mech. Found. Eng., Egyptian Geotechnical 442
Society, Cairo, Egypt, 332-345 443
Ridley, A. M. (1995). “Strength-suction-moisture content relationships for Kaolin under normal 444
atmospheric conditions.” Proc., 1st Int. Conf. Unsat. Soils, E. E. Alonso and P. Delage, ed., Vol. 2, A. A. 445
Balkema, Paris, France, 645-651. 446
Senado, J. A. I., Vanapalli, S. K., and Garga, V. K. (2006). “Modified ring shear apparatus for unsaturated 447
soils testing.” Geotech. Test. J., 30(1), 1-9. 448
Vanapalli, S. K., Fredlund, D. G., Pufahl, D. E., and Clifton, A.W. (1996). “Model for the prediction of 449
shear strength with respect to soil suction.” Can. Geotech. J., 33(3), 379-392. 450
Wheeler, S. J. (1991). “An alternative framework for unsaturated soil behavior.” Geotechnique. 41(2), 451
257-261. 452
Wu, P., Matsushima, K., and Taysuoka, F. (2007). “Effects of specimen size and some other factors on 453
the strength and deformation of granular soil in direct shear tests.” Geotech. Test. J., 31(1), 45-64 454
Wu, P. (2003). “Particle size effects on soil-reinforcement interaction in direct shear tests.” Ph.D. thesis, 455
University of Tokyo, Tokyo, Japan. 456
Yeh, H. F., Lee, C. C., and Lee, C. H. (2008). “A rainfall infiltration model for unsaturated soil slope 457
stabilisation.” J. Environ. Eng. Manage., 18(4), 261 – 268. 458
Zhao, H.F., Zhang, L.M., and Chang, D. S. (2013). “Behavior of coarse widely graded soils under low 459
confining pressures.” J. Geotech. Geoenviron. Eng., 139(1), 35-48 460

Table 1. Physical Properties of Test Materials Properties Edosaki Soil Chiba Soil
Specific gravity, Gs 2.75 2.72
Mean Grain size, D50 [mm] 0.22 0.14
Coefficient of uniformity, Cu= D60/D10 16.4 54.40
Coefficient of gradation, Cc=(D30)2/(D10*D60) 3.97 1.95
Sand content, [%] (0.075 – 4.75 mm) 83.50 64.00
Fines content, [%] (smaller than 0.075 mm) 16.50 36.00
Clay content, [%] (smaller than 0.002 mm) 2.00 5.00
Maximum void ratio, emax 1.59 1.74
Minimum void ratio, emin 1.01 1.11
Liquid limit [%] NP 25.78
Plastic limit [%] NP 23.52
Plastic index NP 2.26

Fig. 1. Schematic diagram of modified direct shear apparatus Fig. 2. Soil-water characteristic curves for Edosaki and Chiba soils Fig. 3. Sample preparation and bringing the sample to 10 kPa suction following the wetting path Fig. 4. Sample preparation and bringing the sample to 10 kPa suction following the drying path Fig. 5. Effects of the net normal stress on, (a) shear stress-shear displacement behavior, (b) volumetric behavior of unsaturated Edosaki soil (suction 20 kPa achieved by following the wetting) Fig. 6. Effects of the net normal stress on, (a) shear stress-shear displacement behavior, (b) volumetric behavior of unsaturated Edosaki soil (suction 20 kPa achieved by following the drying) Fig. 7. Effects of the suction on, (a) shear stress-shear displacement behavior, (b) volumetric behavior of Edosaki soil (the net normal stress is 34 kPa for all tests and the suction was achieved by wetting) Fig. 8. Effects of drying-wetting on shear stress-shear displacement and volumetric behaviors of Edosaki soil (the net normal stress is 84 kPa, the suction is 10 kPa) Fig. 9. Behaviors of volume change (vertical displacement), suction, and degree of saturation during shearing of two identical soil samples with 10 kPa suction achieved by drying and wetting in Chiba soil Fig. 10. Effects of the suction and drying-wetting on (a) the internal friction angle and (b) the apparent cohesion of Edosaki soil and Chiba soil

0.1 1 10 1000.0
0.1
0.2
0.3
0.4
0.5
Chiba Soil (ρd=1.25 g/cm3)Edosaki Soil (ρd= 1.35 g/cm3)
V
olum
etric
wat
er c
onte
nt, θ
w
Suction [kPa]
Drying (Chiba) Wetting (Chiba) Drying (Edosaki) Wetting (Edosaki)
Lines are F&X fitting

0 200 400 600 800 1000 1200-80
-60
-40
-20
0
20000 40000 60000 80000-80
-60
-40
-20
0
2670
2672
2674
2676
2678
Sample preparationP
ore-
wat
er p
ress
ure
[kP
a]
Time [sec]
She
arin
g th
e sp
ecim
en
Control pore-water pressure to bring the sample to a constant suction of 10 kPa
Change in the weight of the tank
constant suction (ua-uw) =10 kPa
Time [sec]
Por
e-w
ater
pre
ssur
e [k
Pa]
Bal
ance
read
ing
[g]
0 40000 80000 120000 160000-60
-50
-40
-30
-20
-10
0
10
2660
2662
2664
2666
2668
2670
2672
2674
2676
Por
e-w
ater
pre
sure
[kP
a]
Time [sec]
Bal
ance
read
ing
[g]
shea
ring
the
spec
imen
Balance reading
Equalization of suctioninside the specimen
Application of the constant suctionof 10 kPa by following the drying processSample preparation
and saturation

0
40
80
120
160
0 2 4 6 8 10 12-0.6
-0.4
-0.2
0.0
0.2(b)
(a)
(σn-ua)=34 kPa
(σn-ua)=84 kPa
(σn-ua)=135 kPa
(σn-ua)=185 kPa
Edosaki soilρd=1.35 g/cm3
(ua-uw)=20 kPa
Wetting
S
hear
stre
ss [k
Pa]
Contraction
Dilation
(σn-ua)=84 kPa
(σn-ua)=135 kPa
(σn-ua)=34 kPa
(σn-ua)=185 kPa
Wetting
Ver
tical
dis
plac
emen
t [m
m]
Shear displacement [mm]

0 2 4 6 8 10 12-0.6
-0.4
-0.2
0.0
0.2
0.4
0.60
40
80
120
160
200
(σn-ua)=185 kPa
(σn-ua)=135 kPa
(σn-ua)=84 kPa
(σn-ua)=34 kPa
Ver
tical
dis
plac
emen
t [m
m]
Shear displacement [mm]
(b)
(a)
(σn-ua)=185 kPa
(σn-ua)=135 kPa
(σn-ua)=84 kPa
(σn-ua)=34 kPa
Edosaki soilρd=1.35 g/cm3
(ua-uw)=20 kPa
(Drying)
S
hear
stre
ss [k
Pa]

0
10
20
30
40
50
0 2 4 6 8 10 12-0.8
-0.6
-0.4
-0.2
0.0
0.2
0.4
0.6(b)
(a)
ua-uw = 50 kPa
ua-uw = 20 kPa
ua-uw = 10 kPa ua-uw = 0 kPa
Wetting
Edosaki soilρd=1.35 g/cm3
(σn-ua)=34 kPa
S
hear
stre
ss [k
Pa]
ua-uw = 50 kPa
ua-uw = 20 kPa
ua-uw = 10 kPa
ua-uw = 0 kPa
Ver
tical
dis
plac
emen
t [m
m]
Shear displacement [mm]

0 2 4 6 8 10 12
0
20
40
60
80
V. dis. Drying
V. dis. Wetting
DryingWetting
Edosaki soilρd=1.35 g/cm3
(σn-ua)=84 kPa(ua-uw)=10 kPa
She
ar s
tress
[kP
a]
Shear displacement [mm]
Contraction
Dilation
-0.6
-0.4
-0.2
0.0
0.2
Ver
tical
dis
plac
emen
t [m
m]

0 2 4 6 8 10 12
44
46
48
50
3
4
5
6
-0.8
-0.6
-0.4
-0.2
0.0
Wetting
Drying
D
egre
e of
sa
tura
tion
[%]
Shear displacement [mm]
Difference of degree of saturation of two samples (suction achieved by drying and wetting) during shearing
Diff
eren
ce o
f deg
ree
of s
atur
atio
n [%
]
(b)
(a)
Suction in Wetting
Suction in Drying
V. displacement in Drying
V. displacement in Wetting
ρd=1.25 g/cm3
(σn-ua)=50 kPa(ua-uw)=10 kPa
V
ertic
al
disp
lace
men
t [m
m]
8
9
10
11
12
13
Suc
tion
[kP
a]

0 10 20 30 40 5005
10152025
30323436384042
App
aren
t co
hesi
on, C
[kP
a]
Suction, (ua-uw) [kPa]
(b)
Chiba Soil (ρd=1.25 g/cm3) Wetting Drying
Inte
rnal
fri
ctio
n an
gle,
φ' [
deg.
]Edosaki Soil (ρd=1.35 g/cm3)
Wetting Drying(a)