c copyright 2013 international council on hotel ... · perceptions-based cbbe model also appears...
TRANSCRIPT

This is the author’s version of a work that was submitted/accepted for pub-lication in the following source:
Pike, Steven & Bianchi, Constanza(2016)Destination brand equity for Australia : testing a model of CBBE in shorthaul and long haul markets.Journal of Hospitality and Tourism Research, 40(1), pp. 114-134.
This file was downloaded from: https://eprints.qut.edu.au/59273/
c© Copyright 2013 International Council on Hotel, Restaurant and In-stitutional Education
Notice: Changes introduced as a result of publishing processes such ascopy-editing and formatting may not be reflected in this document. For adefinitive version of this work, please refer to the published source:
https://doi.org/10.1177/1096348013491604

1
DESTINATION BRAND EQUITY FOR AUSTRALIA: TESTING A MODEL OF
CBBE IN SHORT HAUL AND LONG HAUL MARKETS
ABSTRACT
The study of destination brand performance measurement has only emerged in earnest
as a field in the tourism literature since 2007. The concept of consumer-based brand equity
(CBBE) is gaining favour from services marketing researchers as an alternative to the
traditional ‘net-present-value of future earnings’ method of measuring brand equity. The
perceptions-based CBBE model also appears suitable for examining destination brand
performance, where a financial brand equity valuation on a destination marketing
organisation’s (DMO) balance sheet is largely irrelevant. This is the first study to test and
compare the model in both short and long haul markets. The paper reports the results of tests
of a CBBE model for Australia in a traditional short haul market (New Zealand) and an
emerging long haul market (Chile). The data from both samples indicated destination brand
salience, brand image, and brand value are positively related to purchase intent for Australia
in these two disparate markets.
Key Words:
Destination branding, consumer-based brand equity, destination loyalty, destination image,
Australia, New Zealand.

2
INTRODUCTION
The notion of branding began during the 1700s as a means to identify the maker of the
product. Despite its early roots, the discussion and study of the concept of branding did not
emerge as a central part of the marketing discipline until well into the twentieth century
(Bastos & Levy, 2012). Stern (2006) suggested that the term ‘brand’ entered marketing
discourse in 1922, as an expression of a trade or proprietary name. The Second World War
had a great impact on the competitive situation in the marketplace, which led to intensive
competition and proliferation of brands. Since the 1950s, the study of brands and branding
grew gradually, and in the second half of the twentieth century the branding concept
expanded in terms of both application and thinking. Gardner and Levy (1955) pointed out that
consumers were confronted with making choices among brands, often in instances when they
could not discern differences among the products.
The first published research related to tourism destination branding did not appear until the
late 1990s (see for example Dosen, Vranesevic, & Prebezac, 1998). A literature review of the
first decade of destination branding publications, from 1998 to 2007 identified 74 publications
(see Pike, 2009). Of these, only four were concerned with the measurement of brand
performance. This is a major gap in the literature, given the increasing investment in branding
initiatives by destination marketing organizations (DMO). Traditional financial accounting
means of measuring brand effectiveness, such as the net-present-value of future earnings on
corporate balance sheets, are largely irrelevant for DMOs, with the possible exception of
brand/merchandise licensing revenue. There is a need for measures of brand performance that
are more appropriate for DMOs and their stakeholders, and in particular indicators that
capture effectiveness of past marketing communications as well as pointers to future
performance such as consumers’ purchase intent.

3
Branding emerged as a means to gain differentiation in markets crowded with competitors
offering similar products or services. In the evolution of marketing, branding explicitly
recognizes the competitive requirement to adapt from a sales orientation to a marketing
orientation. A marketing orientation recognizes consumers are spoilt for choice and thus all
company decisions should be made with consumer’s needs in mind. The most common
definition of branding, by Aaker (1991, p.7) focuses on the concept of differentiation:
A brand is a distinguishing name and/or symbol (such as a logo, trademark, or package
design) intended to identify the goods or services of either one seller or a group of sellers,
and to differentiate those goods from those of competitors.
However destination branding is more complex than merely the design of product names
and symbols (see Pike, 2005). Destination branding should: i) feature DMO marketing
communications that consistently reinforce brand identity elements to differentiate the
destination, ii) be based on a small set of determinant attributes that appeal to the needs of the
target segment, iii) be supported and delivered by stakeholders. The aim of destination
branding should be to stimulate intent to visit and revisit, which are indicators of brand
loyalty.
In terms of visitation intent, consumers from short haul destinations might consider
different factors when deciding about a destination preference compared to long haul travelers
which consider mostly airfare costs and travel time (McKercher, 2008; McKercher, Chan, &
Lam, 2008). This implies that short haul travelers may visit a preferred destination several
times compared to long haul visitors. In addition, a few recent studies suggest that short haul
tourists may be a fundamentally different group of people from long haul tourists in terms of
income level, sensitivity of demand, and tourism consumer behavior (Bao & McKercher,

4
2008; Ho & McKercher, 2012). According to these studies, short haul travelers tend to be
younger people and more likely females, with lower income and education, and are more
price sensitive compared to long haul travelers (Bao & McKercher, 2008; Crouch, 1994; Ho
& McKercher, 2012).
Overall, the literature suggests differences between short haul and long haul travelers, yet
these studies tend to focus predominantly on demographic and differences of tourists using
secondary travel data. Little or no emphasis has been placed on the short and long haul tourist’s
perceptions of the elements and factors of destination brand identity that might lead to
destination brand loyalty. Additionally, to date, little has been published outside of the
destination image literature about destination brand performance measures over time (Pike,
2009). This is essential for destination marketers to reinforce salient brand attributes that can
stimulate on a permanent basis potential tourists to visit and revisit the destination.
It is proposed in the branding literature that the model of consumer-based brand equity
(CBBE), developed by Aaker (1991, 1996) and Keller (1993, 2003), offers destination
marketers a performance instrument with which to evaluate and measure consumer perceptions
of a destination brand. The proposed CBBE model integrates five related dimensions to obtain
a measure of brand equity: brand salience, brand image, brand quality, brand value, and brand
loyalty (Aaker, 1991, 1996; Keller, 1993, 2003). Developing and testing such measures will
offer practical value to DMOs who have been increasing investment in brand identity
development.
Thus, the purpose of this study is to test the suitability of the CBBE model for benchmarking
brand performance of Australia. It was conducted at the time of the launch of a new brand
campaign, and thus provides an opportunity to benchmark future performance over time. To
test the model we used samples from a traditional short haul market (New Zealand) and an
emerging long haul market (Chile). These two countries were chosen for this study because

5
they are both located in the southern hemisphere within the Pacific Rim region, and both have
direct flights to Australia, although they are located 9,000 kilometers apart. New Zealand has
traditionally been Australia’s largest single source of visitors. The country is a three hour flight
from Australia’s east coast destinations such as Sydney, Brisbane, and the Gold Coast, and
shares a sporting rivalry, and similar language and culture. Australia is also home to the largest
number of New Zealand expatriates. Chile, on the other hand, is over 16 hours flying time, and
the predominant language is Spanish. Tourism Research Australia (2011) acknowledges that
while visitors from Latin America represent only one percent of total annual arrivals, Chile is
one of the fastest growing. This market has recently emerged as a tourism market for Australia,
with 2009 ushering in a free trade agreement and direct flights between Sydney and Santiago.
The number of Chilean visitors to Australia grew 23% for the year 2011 and this market is
considered important for Australia because of its high level of development and growth within
the Latin-American region and improved air connectivity (Tourism Research Australia, 2011).
Some aspects of the first stage of the study, which involved only the Chilean sample, have
previously been reported (reference withheld).
CONSUMER BASED BRAND EQUITY (CBBE)
CBBE Model Development
There have been relatively few applications testing the CBBE model in relation to
destination branding. Modeling of CBBE in the wider tourism and hospitality literature has
included: conferences (Lee & Back, 2008), hotels (Cobb-Walgren, Beal, & Donthu, 1995;
Kim, 2003, Kayaman and Arasli, 2007; Kim, Jin-Sun & Kim, 2008), restaurants (Kim & Kim,
2005), wineries (Lockshin & Spawton, 2001), and airlines (Chen & Tseng, 2010). The first
published journal article related to the measurement of destination brand equity appears to be

6
that by Kim (2001, cited in Kim, Han, Holland, & Byon, 2009). Since then there have been at
least eight published papers: Croatian-based brand equity for Slovenia (Konecnik & Gartner,
2007), short break destination brand equity for an emerging destination (Pike 2007), CBBE
for Las Vegas and Atlantic City, in the context of gambling destinations (Boo, Busser, &
Baloglu, 2009), host community brand equity (Pike & Scott, 2009), international visitors to
Korea (Kim et al., 2009), international visitors to Mongolia (Chen & Myagmarsuren, 2010),
and short haul international travelers to Slovenia (Ruzzier, 2010). This shows that the
application and testing of the CBBE model is in its infancy and needs further work. The
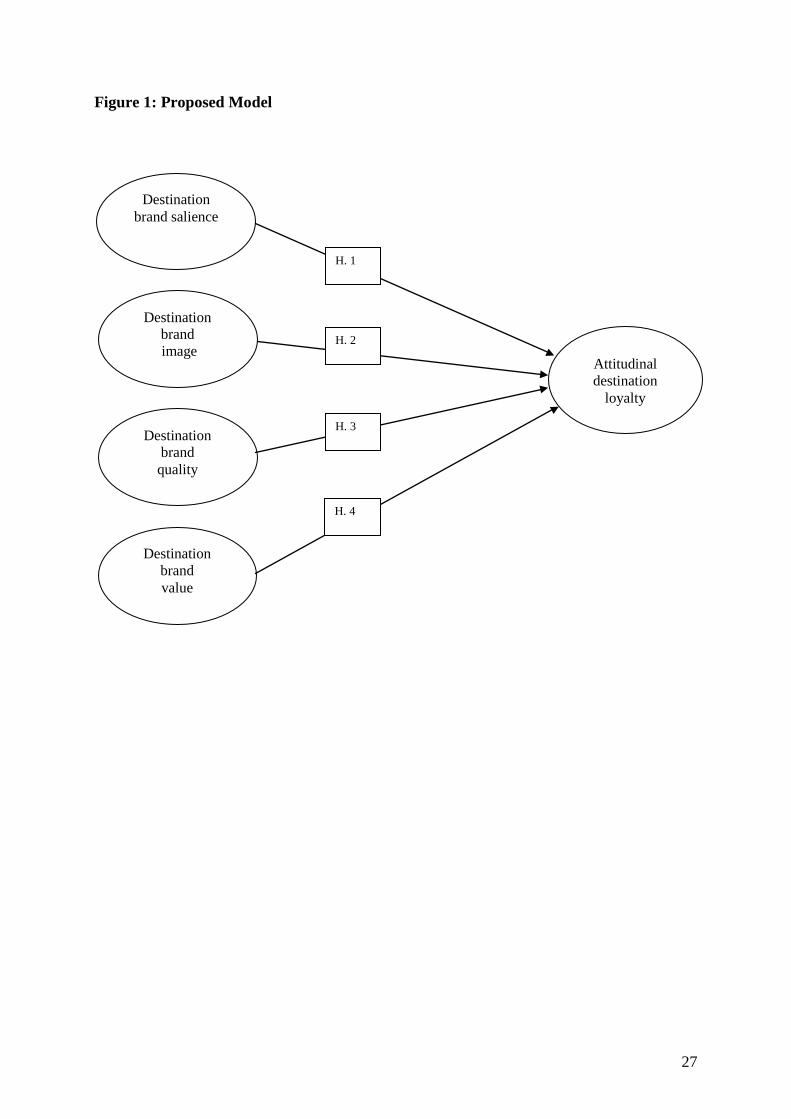
CBBE conceptual model is shown in Figure 1, and features five latent variables: destination
brand loyalty, brand salience, brand image, brand quality and brand value. These variables are
consistent with previous destination studies.
Insert Figure 1 here
Dependent Variable - Attitudinal Loyalty
There is a compelling argument for using attitudinal loyalty as the dependent variable in
modeling destination brand equity. Destination loyalty is vital for achieving repeat visitation
and positive word of mouth among visitors (Gartner & Hunt, 1987, Li & Petrick, 2008b).
Although attracting new customers is essential, it is more desirable and much less expensive
to retain current customers (Reichheld, Markey, & Hopton, 2000). Research shows that in the
short run, loyal customers are more profitable because they spend more and are less price
sensitive (Reichheld et al., 2000). Loyal customers can also lead to increased positive word of
mouth for the service provider (Jones & Taylor, 2007). Nevertheless, despite these
advantages, few studies attempt to identify the key determinants of destination brand loyalty
for travelers from long haul markets (Li & Petrick, 2008a).

7
Although brand loyalty was first reported in the literature during the early 1900s (Bastos &
Levy, 2012; Guest, 1942), only a few studies of destination brand loyalty are found in the
tourism literature before the millennium (Oppermann, 2000). The topic of repeat visitors to
destinations has started to attract increased interest from researchers only in the last decade
(Alegre & Cladera, 2006; Chen & Gursoy, 2001; Chi & Qu, 1998; Chitty, Ward, & Chua,
2007; Li & Petrick, 2008b; McKercher & Guillet, 2011; Mechinda, Serirat, & Guild, 2009;
Niininen, Szivas, & Riley, 2004; Oppermann, 2000; Yoona & Uysalb, 2005). These studies
assert that the measurement of destination loyalty, especially in a long haul travel context, is
difficult since the purchase of a tourism product is often infrequent, or even once in a lifetime,
and/or part of a multi-destination travel experience (Martin and Woodside, 2008; Oppermann,
1999). However, following the conceptual work of Aaker (1991, 1993) and Keller (1993,
2003), the loyalty construct in CBBE is suitable for application with prospective visitors as
well as previous visitors. Therefore the aim of this study was to test the appropriateness of
this dependent variable in both long haul and short haul markets.
Previous research suggests that the loyalty construct is composed of two dimensions;
behavioral loyalty and attitudinal loyalty (Jones & Taylor, 2007; Li & Petrick, 2008b). Hence,
loyalty implies a commitment to the specific brand and goes beyond repetitive behavior
(Jacoby & Kyner, 1973). Behavioral loyalty refers to the frequency of repeat purchase or
relative volume of same brand purchase. Attitudinal loyalty refers to the dispositional
commitment or attitude a consumer-traveler has toward a destination, measured by intent to
visit and positive word of mouth recommendations. Both items are relevant to prospective
visitors as well as previous visitors. This study employs attitudinal loyalty as the dependent
variable since it is a measure of future travel preference or intent to visit.
Brand Salience

8
Brand salience is the foundation of the CBBE model (Keller, 2003), with the aim being to be
remembered for the reasons intended rather than just achieve general awareness per se (Aaker,
1996). Since most consumers will be aware of a multitude of destinations, we conceptualize
destination brand salience as the strength of awareness of the destination in the mind of an
individual when a given travel situation is considered. Previous studies demonstrate that
consumers will usually only actively consider between two to four brands in their decision set
(Howard, 1963, Howard & Sheth, 1969; Pike, 2006; Thompson & Cooper, 1979; Woodside &
Sherrell, 1977). Brand salience is commonly measured by unaided awareness or aided brand
recall. It is proposed that membership in a consumer’s decision set for a given travel context,
elicited through unaided awareness, represents a source of competitive advantage. Previous
research suggests an indirect relationship between destination brand salience and destination
brand loyalty for short haul destinations (Boo et al., 2009). Thus, we propose that destination
brand salience will positively influence destination brand loyalty for short and long haul
visitors. Yet we predict that destination brand salience will be stronger for short haul travellers,
due to the geographical proximity.
Hypothesis 1: Destination brand salience will positively influence destination brand loyalty
Brand Image
Brand image, in accordance with the associative network memory model (Anderson, 1983),
is anything linked to a brand in the consumer’s memory (Aaker, 1991), which consists of nodes
and links. A node contains information about a concept, and is part of a network of links to
other nodes. When a given node concept is recalled, strength of association determines what
other nodes will be activated from memory. A destination can therefore be conceptualized as a
node to which a number of other node concepts are linked. While destination image research is
well established in the tourism literature, there is no universally accepted measurement scale

9
index. Following Boo et al. (2009), this study limits destination image to social and self image.
Using this approach, Boo et al. (2009) found a positive relationship between brand image and
brand destination loyalty. This was supported by Chitty et al. (2007), who examined the
antecedents of backpacker loyalty to Australia and found brand image to be an important
predictor. Thus, we propose that destination brand image will positively influence destination
brand loyalty for short and long haul travelers.
Hypothesis 2: Destination brand image will positively influence destination brand loyalty.
Perceptions of Quality
Brand quality is a key dimension of brand equity for product manufacturers and service
providers (Aaker, 1996; Keller, 2003). Perceived quality is defined as the “perception of the
overall quality or superiority of a product or service relative to relevant alternatives and with
respect to its intended purpose” (Keller, 2003, p.238). Destination brand quality, therefore,
refers to perceptions of quality of the facilities and non-physical aspects of the destinations.
Previous research reports that elements of perceived quality, such as destination infrastructure,
impact brand performance (Buhalis, 2000) and have a positive effect on brand loyalty (Boo et
al., 2009). Thus, we propose that destination brand infrastructure elements of quality will
positively influence destination brand loyalty for short and long haul travelers.
Hypothesis 3: Destination brand quality is positively related to destination brand loyalty.
Perceptions of Value
The perceived value of a service pertains to the benefits customers believe they receive
relative to the costs associated with its consumption (McDougall & Levesque, 2000). Zeithaml
and Bitner (2000) suggest that perceived value is an overall evaluation of a service’s utility,
based on customers’ perceptions of what is received at what price. Heskett, Sasser and

10
Schlesinger (1997) argue that high perceived value is positively associated with satisfaction and
loyalty. In a tourism context, Mechinda et al. (2009) examined the antecedents of consumer
loyalty towards a destination in Thailand and found that destination attitudinal loyalty was
driven mainly by perceived value. This finding was supported by Boo et al. (2009) and Chitty
et al. (2007), who also found a positive relationship between perceived value and destination
loyalty. Thus, we propose that destination brand value will positively influence destination
brand loyalty for short and long haul visitors, yet we predict that destination brand value will
have a stronger effect for short haul travelers.
Hypothesis 4: Destination brand value will positively influence destination brand loyalty.
METHODOLOGY
This section discusses the second stage of the study, which tested the proposed model with
a sample of New Zealand residents, to examine CBBE for Australia in a traditional short haul
market. As indicated, the model was previously tested in a similar way with a Spanish version
of the questionnaire and a sample of 341 Chilean travelers to examine CBBE for Australia as
a long haul destination in an emerging market (reference withheld).
The New Zealand sample consisted of members of a panel from a locally based marketing
research company. Panel members were sent an email invitation to participate in an online
survey. As well as the usual benefits that panel members are offered as an incentive to
participate in surveys by the marketing research firm, an additional $500 travel voucher prize
was offered.
No mention of Australia was made on the opening page of the online survey. Two filter
questions were firstly used to identify: i) if participants had visited another country during the
previous five years, and ii) the likelihood of taking an international holiday during the

11
following 12 months. Next, two open ended questions were used to identify unaided
destination salience; top of mind awareness (ToMA) preferred destination, and the other
destinations in their decision set.
The next page asked participants to indicate if they had previously visited Australia and to
evaluate the destination on the five dimensions of the CBBE model using seven-point scale
anchored at (1) ‘Very strongly disagree’ to (7) ‘Very strongly agree’. Brand salience was
measured with five items derived from Boo et al. (2009) and Konecknic and Gartner (2007).
Brand quality was measured with four items based on Konecknic and Gartner (2007). Brand
value was measured by four items adapted from Boo et al. (2009). Brand image and brand
loyalty were both measured using four items each from Boo et al. (2009), Konecknic and
Gartner (2007), and Chi and Qu (1998).
RESULTS
Data Analysis
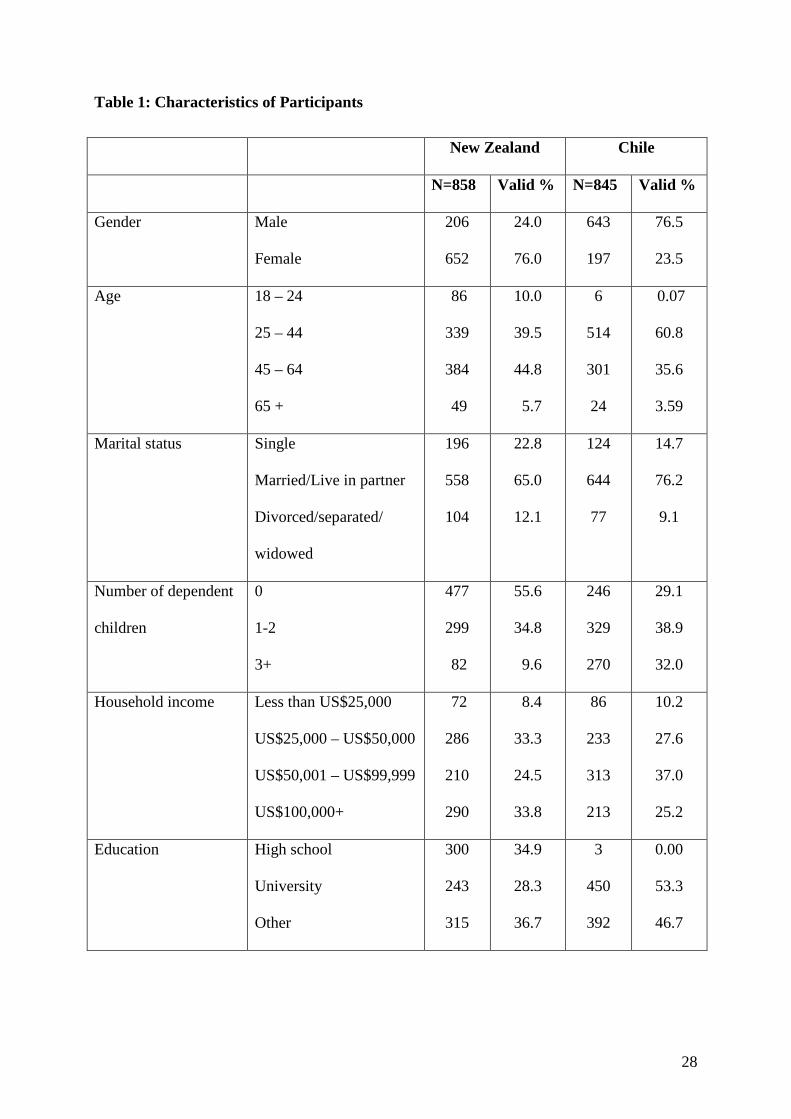
The characteristics of the New Zealand and Chilean participants are shown in Table 1. The
New Zealand sample (N = 858) comprised 24% males and 76% females. Whilst these
characteristics possibly affect the generalizability of the data, a purposeful sample of residents
with international travel experience was achieved. That is, it is argued that the sample is
suitable for assessing the destination brand equity model given that 764 respondents (89%) had
taken a holiday in another country during the previous five years. The mean likelihood of
participants taking a holiday in another country during the following 12 months was 5.8 on a
seven-point scale anchored at (1) ‘Definitely not’ and (7) ‘Definitely’. The majority of
participants (84%) were aged between 25 and 64 years.
12
The Chile sample (N = 845) comprised 76% males and 24% females. While the
characteristics do not enable the data to be generalized to the wider Chilean population, the aim
was to achieve a purposeful sample of residents with recent international travel experience. It is
suggested the sample is suitable for destination brand equity model testing, given that 758
participants (90%) had taken a holiday in another country during the previous five years. The
mean likelihood of participants taking a holiday in another country during the following 12
months was 5.2 on a seven-point scale anchored at (1) ‘Definitely not’ and (7) ‘Definitely’. The
majority of participants (87%) were aged between 25 and 64 years.
Insert Table 1 here
Participants’ ToMA (top of mind awareness) preferred destinations are listed in Table 2.
This table includes the data from the Chilean study as well. Australia was listed as the top of
mind destination by 40% of participants from the New Zealand sample (short haul). While it
might be expected that Australia would receive a high level of ToMA elicitation from such a
contiguous market, it is important to note the majority of participants (60%) identified other
preferred destinations. This differs when looking at the Chilean sample (long haul), where
Australia was listed as the top of mind destination by only 2.8% of participants. The mean
number of destinations in both participants’ decision sets is 3.4, which is consistent with
previous studies reported in the tourism and marketing literature (Woodside & Sherrell, 1977).
Insert Table 2 here
Table 3 presents the destination performance means, standard deviation, and Cronbach
Alpha scores for each construct for both the New Zealand and Chile sample. This table also
includes the data from the Chilean study for comparative purposes. The Cronbach Alpha
coefficients for both samples, which ranged from 0.81 to 0.93, indicating good internal
consistency and reliability (Kline, 2005). This is despite differences in the destination
performance means. Brand salience means for the Chilean sample are lower than the New

13
Zealand sample except for the item ‘This destination has a good name and reputation’, which is
higher. Interestingly, the means for brand image and perceived quality were all higher in the
Chilean data, except for the item ‘Accommodation’, which had a higher mean in the New
Zealand data. Finally, as would be expected, the means for brand value were lower for the long
haul sample compared to the short haul sample.
Insert Table 3 here
Item-to-total correlations, standardized Cronbach Alpha, exploratory factor analysis (EFA)
(all in SPSS), single measurement models, and CFA (using AMOS 16) were used for construct
purification. Based on these analyses, eight measurement indicators from the five constructs
were dropped. The authors tested the proposed model with the refined measures using
structural equation modeling (SEM) techniques (Anderson & Gerbing, 1991). Table 4 shows
the correlations, means, and standard deviations for the construct measures of the New Zealand
and Chile samples. The standardized regression weights for both the New Zealand and Chile
samples are shown in Table 5. The estimates are similar in both countries and higher than 0.6,
which demonstrates convergent validity for the constructs (except for one item of brand
salience which is lower than 0.6 in both countries).
Insert Tables 4, 5 and 6 here
To examine the model structure, confirmatory factor analysis (CFA), using Amos 16.0, was
undertaken. Results from the New Zealand data indicate a good model fit. The Chi square
statistic was significant (χ2/df=3.99, IFI=.966, TLI=.959, CFI=.966 and RMSEA=.059). The
RMSEA was over .05, which is considered a reasonably good fit (Bollen, 1989). Further, IFI,
TLI, and CFI exceeded the recommended level of 0.90 (Bollen, 1989). All items are
significantly associated with their hypothesized factors, evidence of convergent validity. In
addition, the potential for acquiescence bias was minimized by including both positively and
negatively worded items in the questionnaire. Further, a combination of semantic differential

14
scales and seven-point Likert-type scales were utilized to reduce common method bias
(Podsakoff, Mackenzie, Lee, & Podsakoff, 2003). Finally, no single factor accounted for most
of the variance in the independent and dependent variables. This result provides support for the
absence of common method bias variance (Podsakoff & Organ, 1986).
Hypotheses Testing
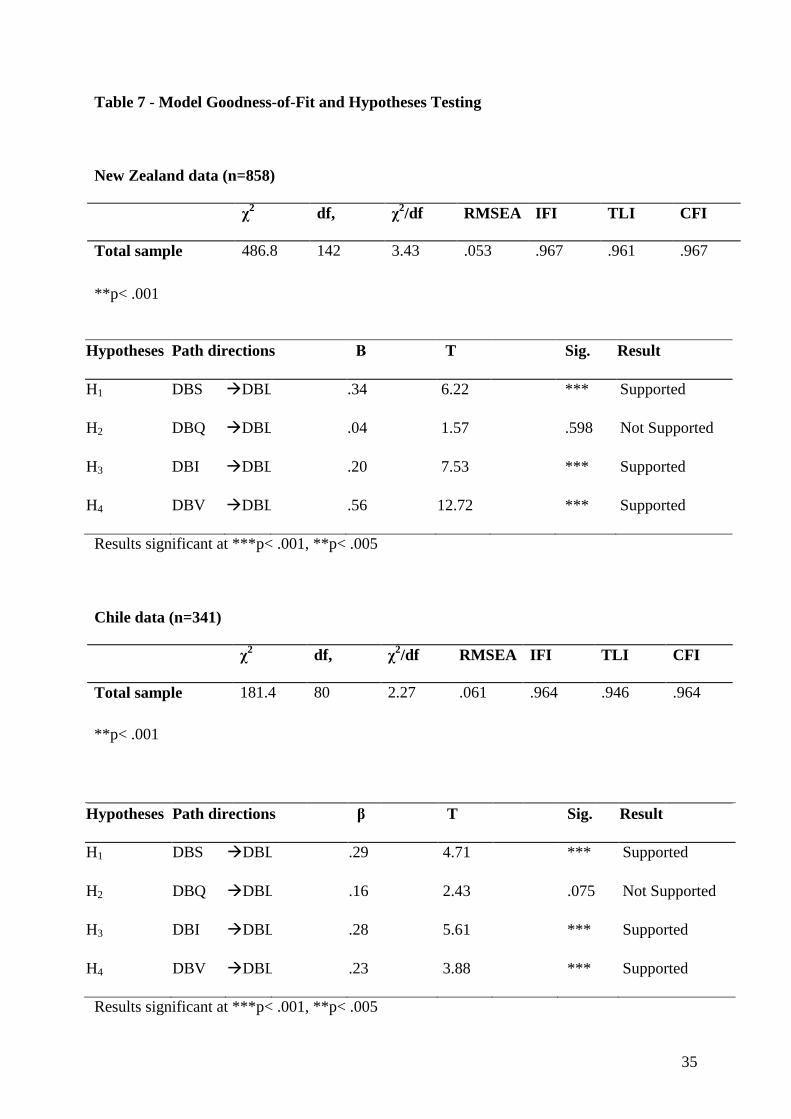
The results from the hypotheses testing on the New Zealand data indicate that destination
brand salience is significantly and positively related to destination brand loyalty (β=.34,
p<.001). Therefore, the data supports Hypothesis 1. This is consistent with the Chilean sample
(long haul), which found a positive statistical relationship between destination brand salience
and destination brand loyalty (β=.29, p<.001).
Regarding Hypotheses 2, the data indicates that destination brand quality is not significantly
related to destination brand loyalty (β=.04, p=.60). Therefore, Hypothesis 2 is not supported
in the New Zealand sample. This is also matches the Chilean study which finds a non-
significant relationship between destination brand quality and destination brand loyalty (β=.16,
p=.075).
Further, the results indicate that destination brand image is significantly and positively
related to destination brand loyalty (β=.20, p<.001). Therefore, the data supports Hypothesis 3
for the New Zealand sample. This is consistent with the Chilean sample, which also found a
positive statistical relationship between destination brand salience and destination brand loyalty
(β=.28, p<.001).
Finally, in reference to Hypotheses 4, the data indicates that destination brand value is
significantly and positively related to destination brand loyalty (β=.56, p<.001). Therefore,
Hypothesis 4 is supported for the New Zealand sample. This is also consistent with the

15
Chilean sample which also found a positive statistical relationship between destination brand
salience and destination brand loyalty (β=.23, p<.001).
Overall, three out of four hypotheses were supported by both the New Zealand (short haul)
and Chilean (long haul) data. The final model is shown in Table 7. It is interesting to note that
for Hypotheses 3, the relationship between destination brand image and destination brand
loyalty is stronger for the Chilean sample than for the New Zealand sample. As predicted, when
looking at destination brand value, the relationship with destination brand loyalty is much
stronger for the New Zealand sample. In fact, destination brand value is the strongest driver of
destination brand loyalty for the New Zealand data, yet destination brand salience is the
strongest driver for the Chilean data.
Insert table 7 here
DISCUSSION AND CONCLUSION
There has been limited research addressing the drivers and modeling of destination brand
performance. This study contributes to the tourism destination branding literature by testing a
conceptual model of destination brand performance in two disparate markets. Key constructs
from the consumer-based brand equity (CBBE) model, championed by Aaker (1991, 1996) and
Keller (1993, 2003), were trialed. The data from both the emerging long haul market (Chile)
and traditional short haul market (New Zealand) found brand salience, brand image, and brand
value to be positively related to brand loyalty. In addition, the results of this study supported
our prediction that destination brand salience is higher and has a stronger effect on destination
brand loyalty for short haul travelers (New Zealand β=.34), than long haul travelers (Chile
β=.29, p<.001), mainly due to geographic proximity. The findings also support our prediction
that destination brand value has a stronger effect for short haul travelers (New Zealand β=.54)
16
compared to long haul travellers (Chile β=.23, p<.001), probably because short haul travelers
tend to be more price sensitive compared to long haul travelers (Bao & McKercher, 2008;
Crouch, 1994; Ho & McKercher, 2012).
We argued the case for attitudinal destination loyalty as the dependent variable in the
proposed model. This construct measures stated intent to visit and likelihood of personal
recommendations to others. One of the key aims of DMOs is to stimulate intent to visit and
revisit. In this regard, while all the constructs provide performance measures in terms of the
effectiveness of past marketing communications, the intent to visit data also provides a future
orientation. For any individual business, strong levels of purchase intent represent a form of
‘goodwill’ on the balance sheet. For DMOs, intent to visit represents an important barometer
for future performance.
This is the first study to model and compare a destination’s CBBE in short haul and long
haul markets. Most published research in this field has focused on destination brand initiatives
aimed at travelers from geographically close markets (McKercher, 2008), particularly for
Australia (Prosser, 2000), such as China and Taiwan (e.g., Huang & Gross, 2010; Kao,
Patterson, Scott, & Li, 2008; Li & Carr, 2004; Pan & Laws, 2003). Attracting visitors from
long haul destinations entails distinctive challenges; including mitigating higher airfare costs,
travel time, and consumer confidence or risk (McKercher, 2008; McKercher et al., 2008). Long
travel distances have an influence on tourism demand due to higher levels of consumer
involvement in planning and expenditure (McKercher & Lew, 2003). In fact, some studies
suggest that many people may be precluded from long haul travel due to the longer distances
and higher costs (McKercher, 2008; McKercher et al., 2008). For example, McKercher et al.
(2008) report that relatively few people are willing to travel more than 2,000 km from their
home country and as a result, most destinations’ ability to attract long haul markets is limited.
Indeed it has been suggested that 70% of international travelers visit only 10 countries, so over

17
90 National Tourism Offices (NTOs) around the world compete for 30% of total international
arrivals (Morgan, Pritchard, & Pride, 2002).
The negative relationship between distance and demand has been termed distance decay.
This is apparent in the results of the brand value scale items, where the means for the Chile
sample were all below the scale midpoint, while the means for the New Zealand sample were
all above the scale midpoint.
On the other hand, Nicolau (2008) contends that the journey itself can lead to satisfaction
and thus, longer distances can sometimes be preferred. This is consistent with Goh, Law and
Mok (2008), who found that the decision to traveling to a long haul destination can also be
affected by the consumer’s perceptions of a destination, its cultural background, and climatic
conditions. As highlighted in Table 2, over half the New Zealand sample (64%) and around
half the Chilean sample (48%) elicited long haul destinations as ToMA preferences for their
next international holiday. On a positive note for the tourism industry, Australia was
perceived well in both markets across many of the brand salience and brand quality items.
The highest mean (6.1) for any scale item was Chileans’ respondent’s perception that
Australia has a good name and reputation as a holiday destination. Clearly this image has
been formed organically rather than induced by marketing (see Gunn, 1988), since the mean
for ‘I have seen a lot of advertising promoting Australian holidays’ was 3.1 for the Chilean
sample. This organic image provides a solid base for future brand building.
The study took place at the commencement of a new brand campaign by Tourism
Australia. The Chilean data was also collected at the same time as the commencement of
direct air services between Sydney and Santiago. The data therefore provides a performance
benchmark, for future studies of Australia’s performance in this, and the New Zealand
market.
18
Finally, it is important to reflect on the relevance of structural equation modeling (SEM)
for destination marketing practitioners. While the model we have tested contributes towards
our understanding of the complexities of brand performance measurement, we do not
necessarily advocate this method for tracking performance over time. While SEM helps
identify antecedents of destination loyalty as the dependent variable, we suggest that future
destination brand performance tracking include: i) unaided awareness questions to elicit
ToMA position and decision set composition. This data identifies the competitive set of
brands for a travel segment, as well as providing an indicator of future competitiveness given
the higher probability of travel to places listed in decision sets. ii) Brand salience, brand
image, and brand value scale items should not be measured for the destination in isolation.
Rather, perceptions of the other destinations in the competitive set are required to provide a
relative measure of the brand’s competitive position in the market.
Limitations and Future Research
Several limitations might have affected the generalizability of the results of this study. First,
this empirical investigation considers only the perceptions of Chilean and New Zealand
consumers with regards to Australia as a holiday destination. Thus, the analysis was limited to
two countries. More research needs to be undertaken with consumers in other markets of
interest to Australia, such as the Asia-Pacific region. Second, both samples differ in their
gender and educational characteristics, however we argue that both data sets represents the
typical traveler and holiday decision maker for New Zealand and Chile. Finally this study only
considers attitudinal destination loyalty and not behavioral loyalty.
Our literature review found scant research on the travel motivations and preferences of Latin
American consumers, other than the ‘purpose of visit’ data published by Tourism Research
Australia (e.g., Tourism Research Australia, 2009). Thus, more insights are required into the

19
motivations of long haul North and South American as well as European travelers. Replications
of this study in such markets could deliver additional performance indicators for current
branding efforts by Tourism Australia and its stakeholders.

20
REFERENCES
Aaker, D. A. (1991). Managing brand equity. New York: Free Press.
Aaker, D. A. (1996). Building strong brands. New York: Free Press.
Alegre, J., & Cladera, M. (2006). Repeat visitation in mature sun and sand holiday
destinations. Journal of Travel Research, 44, 288-297.
Anderson, J. C., & Gerbing, D. W. (1991). Predicting the performance of measures in a
confirmatory factor analysis with a pretest assessment of their substantive validities.
Journal of Applied Psychology, 76, 732-740.
Anderson, J. R. (1983). The architecture of cognition. Cambridge, M.A: Harvard University
Press.
Bao, Y. F., & Mckercher, B. (2008). The effect of distance on tourism in Hong Kong: A
comparison of short haul and long haul visitors. Asia Pacific Journal of Tourism Research,
13, 101-111.
Bastos, W., & Levy, S. J. (2012). A history of the concept of branding: Practice and theory.
Journal of Historical Research in Marketing. 4, 347-368.
Bollen, K. A. (1989). Structural equations with latent variables. New York: Wiley.
Boo, S., Busser, J., & Baloglu, S. (2009). A model of customer-based brand equity and its
application to multiple destinations. Tourism Management, 30, 219-213.
Buhalis, D. (2000). Marketing the competitive destination of the future. Tourism
Management, 21, 97-116.
Chen, C.-F., & Myagmarsuren, O. (2010). Exploring relationships between Mongolian
destination brand equity, satisfaction and destination loyalty. Tourism Economics, 16, 981-
994.

21
Chen, C. F., & Tseng, W. S. (2010). Exploring customer-based airline brand equity: Evidence
from Taiwan. Transportation Journal, 49, 24-35.
Chen, J. S., & Gursoy, D. (2001). An investigation of tourists' destination loyalty and
preferences. International Journal of Contemporary Hospitality Management, 13, 79.
Chi, C. G.-Q. & Qu, H. (1998). Examining the structural relationship of destination image,
tourist satisfaction and destination loyalty. Tourism Management, 29, 624-636.
Chitty, B., Ward, S., & Chua, C. (2007). An application of the ECSI model as a predictor of
satisfaction and loyalty for backpacker hostels. Marketing Intelligence & Planning, 25,
563-580.
Cobb-Walgren, C. J., Beal, C., & Donthu, N. (1995). Brand equity, brand preferences, and
purchase intent. Journal of Advertising, 24, 25-40.
Crouch, G. I. (1994). Demand elasticities for short-haul versus long-haul yourism. Journal of
Travel Research, 33, 2-7.
Dosen, D. O., Vranesevic, T., & Prebezac, D. (1998). The importance of branding in the
development of marketing strategy of Croatia as touristic destination. Acta Turistica, 10,
93-182.
Gardner, B. B., & Levy, S. J. (1955). The product and the brand. Harvard Business Review,
March-April, 33-39.
Gartner, W. C., & Hunt, J. D. (1987). An analysis of state image change over a twelve-year
period (1971-1983). Journal of Travel Research, 26, 15-19.
Goh, C., Law, R., & Mok, H. M. K. (2008). Analyzing and forecasting tourism demand: A
rough sets approach. Journal of Travel Research, 46, 327-338.
Guest, L. P. (1942). The genesis of brand awareness. Journal of Applied Psychology, 26, 800-
808.

22
Gunn, C. (1988). Vacationscape: Designing Tourist Regions, (2nd Ed.). Bureau of Business
Research, University of Texas, Austin, Texas.
Heskett, J. L., Sasser Jr., W. E., & Schlesinger, L. A. (1997). The service profit chain: How
leading companies link profit and growth to loyalty, satisfaction and value, New York:
Free Press.
Ho, G., & Mckercher, B. (2012). A comparison of long-haul and short-haul business tourists
of Hong Kong. Asia Pacific Journal of Tourism Research,
DOI:10.1080/10941665.2012.746235
Howard, J. A. (1963). Marketing management: Analysis and planning, Homewood, Ill: Irwin.
Howard, J. A., & Sheth, J. N. (1969). The theory of buyer behavior, New York: John Wiley &
Sons.
Huang, S., & Gross, M. J. (2010). Australia's destination image among mainland Chinese
travelers: An exploratory study. Journal of Travel and Tourism Marketing, 27, 63-81.
Jacoby, J., & Kyner, D. B. (1973). Brand loyalty vs. repeat purchasing behavior. Journal of
Marketing Research, 10, 1-9.
Jones, T., & Taylor, S. F. (2007). The conceptual domain of service loyalty: How many
dimensions? Journal of Services Marketing, 21, 36-51.
Kao, M. P., Patterson, I., Scott, N., & Li, C. (2008). Motivations and satisfactions of
Taiwanese tourists who visit Australia: An exploratory study. Journal of Travel & Tourism
Marketing, 24, 17-33.
Kayaman, R., & Arasli, H. (2007). Customer based brand equity: Evidence from the hotel
industry. Managing Service Quality, 17, 92-109.
Keller, K. L. (1993). Conceptualizing, measuring and managing customer-based brand equity.
Journal of Marketing, 57, 1-22.
Keller, K. L. (2003). Strategic brand management, Upper Saddle River , N.J.: Prentice Hall.

23
Kim, H., & Kim, W. G. (2005). The relationship between brand equity and firms'
performance in luxury hotels and chain restaurants. Tourism Management, 26, 549-560.
Kim, H., Kim, W. G., & An, J. A. (2003). The effect of customer-based brand equity on firm's
financial performance. Journal of Consumer Marketing, 20, 335-351.
Kim, W.G., Jin-Sun, B., Kim, H.J. (2008). Multidimensional customer-based brand equity
and its consequences in midpriced hotels. Journal of Hospitality & Tourism Research, 32,
235-54.
Kim, S. H., Han, H. S., Holland, S., & Byon, K. K. (2009). Structural relationships among
involvement, destination brand equity, satisfaction and destination visit intentions: The
case of Japanese outbound travellers. Journal of Vacation Marketing, 15, 349-365.
Kim, W. G., Jin-Sun, B., & Kim, H. J. (2008). Multidimensional customer-based brand equity
and its consequences in midpriced hotels. Journal of Hospitality and Tourism Research,
32, 235-254.
Kline, R. B. (2005). Principles and practise of structural equation modelling. New York:
Guilford.
Konecnik, M., & Gartner, W. C. (2007). Customer-based brand equity for a destination.
Annals of Tourism Research, 34, 400-421.
Lee, J. S., & Back, K. J. (2008). Attendee-based brand equity. Tourism Management, 29, 331-
344.
Li, J. W., & Carr, N. (2004). Visitor satisfaction: An analysis of mainland Chinese tourists on
the Australian Gold Coast. International Journal of Hospitality and Tourism
Administration, 5, 31-48.
Li, X., & Petrick, J. (2008a). Examining the antecedents of brand loyalty from an investment
model perspective. Journal of Travel Research, 47, 25-34.

24
Li, X., & Petrick, J. F. (2008b). Reexamining the dimensionality of brand loyalty: A case of
the cruise industry. Journal of Travel and Tourism Marketing, 25, 68-85.
Lockshin, L., & Spawton, T. (2001). Using involvement and brand equity to develop a wine
tourism strategy. International Journal of Wine Marketing, 13, 72-81.
Martin, D., & Woodside, A. (2008). Grounded theory of international tourism behavior.
Journal of Travel & Tourism Marketing, 24, 245-258.
Mcdougall, G. H. G., & Levesque, T. (2000). Customer satisfaction with services: Putting
perceived value into the equation. Journal of Services Marketing, 47, 9-20.
Mckercher, B. (2008). The implicit effect of distance on tourist behavior: A comparison of
short and long haul pleasure tourists to Hong Kong. Journal of Travel & Tourism
Marketing, 25, 367-381.
Mckercher, B., Chan, A., & Lam, C. (2008). The impact of distance on international tourist
movements. Journal of Travel Research, 47, 208-224.
Mckercher, B., & Guillet, B. D. (2011). Are tourists or markets destination loyal? Journal of
Travel Research, 50, 121-132.
Mckercher, B., & Lew, A. A. (2003). Distance decay and the impact of effective tourism
exclusion zones on international travel flows. Journal of Travel Research, 42, 159-165.
Mechinda, P., Serirat, S., & Guild, N. (2009). An examination of tourist's attitudinal and
behavioral loyalty: Comparison between domestic and international tourists. Journal of
Vacation Marketing, 15, 129-148.
Morgan, N., Pritchard, A., & Pride, R. (2002). Destination branding – Creating the unique
destination proposition. Oxford: Butterworth-Heinemann.
Nicolau, J. (2008). Characterizing tourist sensitivity to distance. Journal of Travel Research,
47, 43-52.

25
Niininen, O., Szivas, E., & Riley, M. (2004). Destination loyalty and repeat behaviour: An
application of optimum stimulation measurement. International Journal of Tourism
Research, 6, 439-447.
Oppermann, M. (1999). Predicting destination choice: A discussion of destination loyalty.
Journal of Vacation Marketing, 5, 51-65.
Oppermann, M. (2000). Tourism destination loyalty. Journal of Travel Research, 39(1), 78-
84.
Pan, G. W., & Laws, E. (2003). Tourism development of Australia as a sustained preferred
destination for Chinese tourists. Asia Pacific Journal of Tourism Research, 8, 37-47.
Pike, S. (2005). Tourism destination branding complexity. The Journal of Product and Brand
Management, 14, 258-259.
Pike, S. (2006). Destination decision sets: A longitudinal comparison of stated destination
preferences and actual travel. Journal of Vacation Marketing, 12, 319-328.
Pike, S. (2007). Consumer-based brand equity for destinations: Practical DMO performance
measures. Journal of Travel & Tourism Marketing, 22, 51-61.
Pike, S. (2009). Destination brand positions of a competitive set of near-home destinations.
Tourism Management, 30, 857-866.
Pike, S., & Scott, N. (2009). Destination brand equity among the host community - A
potential source of competitive advantage for DMOs: The case of Brisbane, Australia. Acta
Turistica, 21, 160-183.
Podsakoff, P. M., Mackenzie, S. B., Lee, J.-Y., & Podsakoff, N. P. (2003). Common method
biases in behavioral research: A critical review of the literature and recommended
remedies. Journal of Applied Psychology, 88, 879-903.
Podsakoff, P. M., & Organ, D. (1986). Self-Reports in organizational research: Problems and
prospects. Journal of Management, 12, 531-543.

26
Prosser, G. (2000). Regional tourism research: A scoping study. Lismore: Center for Regional
Tourism Research.
Reichheld, F. F., Markey, R. G., J. & Hopton, C. (2000). The loyalty effect - The relationship
between loyalty and profits. European Business Journal, 12, 134-139.
Ruzzier, M. K. (2010). Extending the tourism destination image concept into customer-based
brand equity for a tourism destination. Ekonomska Istraživanja, 23, 24-42.
Stern, B. B. (2006). What does brand mean? Historical-analysis method and construct
definition. Journal of the Academy of Marketing Science, 34, 216-223.
Thompson, J. R., & Cooper, P. D. (1979). Additional evidence on the limited size of evoked
and inept sets of travel destination. Journal of Travel Research, 17, 23-25.
Tourism Research Australia (2012), Latin American short-term visitor arrivals: the trends
and outlooks for Australia, available at
http://www.ret.gov.au/tourism/Documents/tra/Forecasts/2012/LatinAmericaConsultancy22
May.pdf. [Online]. [Accessed November 12, 2012].
Tourism Research Australia (2011). The international visitor survey.
http://www.tourism.australia.com/en-au/research/3930.aspx [Online]. [Accessed May 20,
2012].
Woodside, A. G., & Sherrell, D. (1977). Traveler evoked, inept, and inert sets of vacation
destinations. Journal of Travel Research, 16, 14-18.
Yoona, Y., & Uysalb, M. (2005). An examination of the effects of motivation and satisfaction
on destination loyalty: A structural model. Tourism Management, 26, 45-56.
Zeithaml, V., & Bitner, M. J. (2000). Service marketing: Integrating customer focus across
the firm, 2nd ed., New York: Irwin McGraw-Hill.
27
Figure 1: Proposed Model
Destination brand image
Destination brand
quality
Destination brand value
Destination brand salience
Attitudinal destination
loyalty
H. 2
H. 3
H. 4
H. 1
28
Table 1: Characteristics of Participants
New Zealand Chile
N=858 Valid % N=845 Valid %
Gender Male
Female
206
652
24.0
76.0
643
197
76.5
23.5
Age 18 – 24
25 – 44
45 – 64
65 +
86
339
384
49
10.0
39.5
44.8
5.7
6
514
301
24
0.07
60.8
35.6
3.59
Marital status Single
Married/Live in partner
Divorced/separated/
widowed
196
558
104
22.8
65.0
12.1
124
644
77
14.7
76.2
9.1
Number of dependent
children
0
1-2
3+
477
299
82
55.6
34.8
9.6
246
329
270
29.1
38.9
32.0
Household income Less than US$25,000
US$25,000 – US$50,000
US$50,001 – US$99,999
US$100,000+
72
286
210
290
8.4
33.3
24.5
33.8
86
233
313
213
10.2
27.6
37.0
25.2
Education High school
University
Other
300
243
315
34.9
28.3
36.7
3
450
392
0.00
53.3
46.7

29
Table 2: Top of Mind Awareness Preferred Destination
Rank New Zealand
sample
n % Chile sample n %
1 Australia 340 39.8 USA 138 16.3
2 UK 71 8.3 Brazil 114 13.5
3 USA 67 7.8 Mexico 71 8.4
4 Rarotonga 30 3.5 Italy 54 6.4
5 Fiji 28 3.3 Spain 53 6.3
6 Samoa 22 2.6 Argentina 49 5.8
7 Italy 21 2.5 Caribbean 38 4.5
8 Canada 19 2.2 France 27 3.2
9 France 18 2.1 Greece 25 3.0
10 Greece 12 1.4 Australia 24 2.8

30
Table 3: Destination Performance Means
NZ
Mean
Std. Αlpha Chile
Mean
Std. Alpha
Brand salience
• This destination has a good name and
reputation (Boo et al., 2009).
• The characteristics of this destination come
to my mind quickly (Boo et al., 2008;
Konecknic & Gartner 2007).
• This destination is very famous (Boo et al.,
2008).
• When I am thinking of an international
holiday, this destination comes to my mind
immediately (Boo et al., 2008).
• I have seen a lot of advertising promoting
Australian holidays (Konecknik & Gartner,
2007).
5.6
5.6
5.3
4.8
5.6
1.1
1.2
1.3
1.7
1.3
0.82
6.1
4.8
4.7
2.7
3.1
1.1
1.8
1.6
1.6
1.6
0.81
Perceived quality
• High quality accommodation (Konecknic &
Gartner, 2007).
• High levels of cleanliness (Konecknic &
Gartner, 2007).
• High level of personal safety (Konecknic &
Gartner, 2007).
• High quality infrastructure (Konecknic &
Gartner, 2007).
5.8
5.7
5.5
5.6
1.1
1.1
1.1
1.1
0.93
5.6
5.8
5.8
5.9
1.3
1.2
1.2
1.1
0.93

31
Brand image
• This destination fits my personality (Boo et
al., 2008).
• My friends would think highly of me if I
visited this destination (Boo et al., 2008).
• The image of this destination is consistent
with my own self image (Boo et al., 2008).
• Visiting this destination reflects who I am
(Boo et al., 2008).
3.8
3.6
3.7
3.4
1.7
1.6
1.6
1.7
0.92
4.0
4.3
4.3
3.6
1.7
1.8
1.7
1.6
0.92
Brand loyalty
• This destination would be my preferred
choice for a vacation (Boo et al., 2008).
• I would advise other people to visit this
destination (Boo et al., 2008; Konecknic &
Gartner 2007; Chi & Qu 2008).
• I intend visiting this destination in the future
(Konecknic & Gartner 2007; Chi & Qu,
2008).
• This destination provides more benefits than
other destinations (Konecknic & Gartner,
2007).
4.4
5.0
4.6
4.4
1.7
1.4
1.5
1.4
0.88
3.2
4.0
4.6
3.5
1.6
1.8
1.9
1.5
0.88
Brand value
• This destination has reasonable prices.
• Considering what I would pay for a trip, I will
get much more than my money’s worth by
visiting this destination (Boo et al., 2008).
• The costs of visiting this destination are a
bargain relative to the benefits I receive (Boo
et al., 2008).
Visiting this destination is good value for money
(Boo et al., 2008).
5.2
4.9
4.6
4.9
1.29
1.35
1.38
1.30
0.92
3.0
3.7
2.8
3.4
1.3
1.5
1.3
1.4
0.85

32
Table 4: Means, Standard Deviations and Correlations New Zealand Sample
Mean Std. Dev. DBS DBQ DBI DBV DBL
DBS 5.54 0.97 1.00 0.27* 0.36* 0.56* 0.56*
DBQ 5.46 1.15 0.27* 1.00 0.10* 0.28* .027*
DBI 3.62 1.47 0.36* 0.10* 1.00 0.44* 0.52*
DBV 4.89 1.19 0.56* 0.28* 0.44* 1.00 0.70*
DBL 5.00 1.31 0.56* 0.27* 0.52* 0.70* 1.00*
DBS=Destination Brand Salience; DBQ=Destination Brand Quality; DBI=Destination Brand
Image; DBV =Destination Brand Value; DBL=Destination Brand Loyalty
* Correlation is significant at the 0.01 level (2-tailed).
Table 5: Means, Standard Deviations and Correlations Chile Sample
Mean Std. Dev. DBS DBQ DBI DBV DBL
DBS 4.32 1.16 1.00 0.45* 0.49* 0.48* 0.66*
DBQ 5.76 1.06 0.45* 1.00 0.38* 0.21* 0.43*
DBI 4.10 1.59 0.49* 0.38* 1.00 0.33* 0.60*
DBV 3.07 1.09 0.48* 0.21* 0.33* 1.00 0.52*
DBL 3.82 1.44 0.66* 0.43* 0.60* 0.52* 1.00
DBS=Destination Brand Salience; DBQ=Destination Brand Quality; DBI=Destination Brand
Image; DBV =Destination Brand Value; DBL=Destination Brand Loyalty
* Correlation is significant at the 0.01 level (2-tailed).

33
Table 6- Standardized regression weights
NZ Chile
Brand salience
This destination has a good name and reputation
The characteristics of this destination come to my mind
This destination is very famous
I have seen a lot of advertising promoting Australian
holidays
.80
.83
.75
.57
.78
.79
.79
.56
Perceptions of brand quality
High quality accommodation
High levels of cleanliness
High level of personal safety
High quality infrastructure
.87
.94
.84
.95
.83
.92
.88
.93
Brand image
This destination fits my personality
My friends would think highly of me if I visited this
destination
The image of this destination is consistent with my own self
image
Visiting Australia would reflect who I am
.86
.76
.92
.94
.88
.77
.93
.92
Brand value
This destination has reasonable prices
Considering what I would pay for a trip, I will get much more
than my money’s worth by visiting this destination
The costs of visiting this destination are a bargain relative to
.78
.88
.88
.77
.88
.88

34
the benefits I receive
Visiting this destination is good value for money
.89
.89
Brand loyalty
This destination would be my preferred choice for a
vacation
I would advise other people to visit this destination
I intend visiting this destination in the future
.77
.86
.70
.76
.84
.69
35
Table 7 - Model Goodness-of-Fit and Hypotheses Testing
New Zealand data (n=858)
χ2 df, χ2/df RMSEA IFI TLI CFI
Total sample 486.8 142 3.43 .053 .967 .961 .967
**p< .001
Hypotheses Path directions Β T Sig. Result
H1 DBS DBL .34 6.22 *** Supported
H2 DBQ DBL .04 1.57 .598 Not Supported
H3 DBI DBL .20 7.53 *** Supported
H4 DBV DBL .56 12.72 *** Supported
Results significant at ***p< .001, **p< .005
Chile data (n=341)
χ2 df, χ2/df RMSEA IFI TLI CFI
Total sample 181.4 80 2.27 .061 .964 .946 .964
**p< .001
Hypotheses Path directions β T Sig. Result
H1 DBS DBL .29 4.71 *** Supported
H2 DBQ DBL .16 2.43 .075 Not Supported
H3 DBI DBL .28 5.61 *** Supported
H4 DBV DBL .23 3.88 *** Supported
Results significant at ***p< .001, **p< .005