c# and asp.net projects
DESCRIPTION
materialTRANSCRIPT

C# and ASP.NET Projects
By Shivprasad Koirala
Sham Shaikh Visit us http://www.questpond.com for free interview question e-book. Mail [email protected] to buy the book Write to the author directly at [email protected] The e-Book is free but below are the limitation of this free e-book:- -- The book has only 5 projects which are far less than what the actual book contains. -- Practical Videos and code walkthrough of the projects is not available for download. -- The book also has lot of installations provided in CD even that is not available for Download. Finally hard copy is a hard copy if you are interested below are the ways you can buy the Book:- • Buy directly from the Author call 09867628636. If you are buying from the Author You get a chance to meet him and believe us you will enjoy it. Please send DD of Rupees 300 in favor of (Please send us detail that you want a hard copy or E-book CD) Shivprasad Bist E – 8, Amar Nager , Hoechst Colony , Opposite ShreeRam towers Mulund West Mumbai 82. • Call your city book shop MUMBAI-22078296/97/022-22070989, KOLKATA- 22826518/19,HYDERABAD-24756967,24756400,BANGALORE- 25587923,25584641,AHMEDABAD-26421611, BHATINA(PUNJAB)- 2237387,CHENNAI-28410796,28550491,DELHI/NEWDELHI- 23254990/91,23325760,26415092,24691288
• Are you a Pakistani reader then contact M/s. Vanguard Books P Ltd, 45 The Mall, Lahore, Pakistan (Tel: 0092-42- 7235767, 7243783 and 7243779 and Fax: 7245097) E- mail: [email protected]
• If you are not from india or pakistan :-

Ray McLennan, director,Motilal (UK) Books of India,367 High Street. London Colney, St.Albans, Hertfordshire,AL2 1EA, U.K. Tel. +44 (0)1727 761 677,Fax.+44 (0)1727 761 357, [email protected] , www.mlbduk.com • mail at [email protected] Other books written by the Shivprasad Koirala and Team
Prakash books http://www.prakashbooks.com/details.php3?id=17875&c=Computer Books

Amazon http://www.amazon.co.uk/NET-Interview-Questions-Shivprasad- Koirala/dp/8183331475/sr=1-1/qid=1171080126/ref=sr_1_1/026-1891118- 8556445?ie=UTF8&s=books
You can buy the above book from Prakash books http://www.prakashbooks.com/details.php3?id=19008&c=Computer Books Amazon http://www.amazon.co.uk/exec/obidos/ASIN/8183331033/qid%3D1136610981/026- 1344994-2263615#product-details

You can buy the above book from Prakash books http://www.prakashbooks.com/details.php3?id=23073&c=Computer%20Books If you want to buy from Amazon http://www.amazon.co.uk/JAVA- interview-Questions-Koirala- Shivprasad/dp/8183331734/ref=pd_ecc_rvi_2/203-1007750-6035147

INTRODUCTION Dedication Foreword About the authors Who should read this book Details of the book What’s in the CD PART I – THE FUNDAMENTALS CHAPTER 1 SDLC AND PROJECT DOCUMENTATION What does this book target The growth of a software professional SDLC (Software development Life Cycle) Waterfall Iterative model Evolutionary model V-model Which is the best model? Essential documentation in projects UML Three views of the project from UML perspective Structure diagram Behavior diagram Model management diagram Overall Explanation of the UML diagrams Class diagram Object diagram Composite structure diagram Deployment diagram Component diagram Package diagram Activity diagram Use case diagram State machine diagram / Protocol state machine diagram Overview diagram Sequence diagram Communication diagram Timing diagram

Which diagram is important Use case diagram over view Actors and Goals Detail Explanation of the Use Case template Included and Extended use case Differentiate between Included use case and extended use cases? Class diagram Associations in Class diagrams Multiplicity Aggregation and composition Composite structure diagram Reflexive associations Generalization and specialization Estimation in projects Introduction to Function Points Basics of Function Points Application Boundary Elementary Process Dynamic and static elementary process Elements of Function Points Internal Logical Files (ILF) External Interface File (EIF) Record Element Type (RET) DET (Data element types) Data Communications Distributed data p rocessing Performance Heavily used configuration On-Line data entry End-user efficiency On-Line update Complex processing Reusability Installation ease Operational ease Multiple sites Facilitate change Function point template explanation Testing Document UPDATE ADDRESS CHAPTER 2 OOPS PRIMER Why OOPs

Fundamentals of OOPS Abstract classes and Interfaces CHAPTER 3 UNDERSTANDING THE IDE The IDE Windows form Code walk through The IIS Web Application Code walk through CHAPTER 4 DATABASES AND ADO.NET MSDE Basics Difference between SQL and MSDE Installation of MSDE Basic SQL Commands ADO.NET basics Introducing the .NET Data Providers OLE DB.NET data provider SQL Server.NET data provider ODBC.NET data provider The Command Object The Command Object’s Methods Understanding DataReader Understanding Dataset Sample code Microsoft Data Application blocks PART II – THE FUN PART INTRODUCTION TO THE FUN PART CHAPTER 5 – LETS ROCK: - THE MANDELBROT PROJECT What will you learn in this project Overview of Mandelbrot project How to start the Mandelbrot project Code explanation CHAPTER 6 – FILE SEARCH MODULE Explanation Enhancement in What will you learn in this project

Overview of File search Application Fundamentals to complete the project File System Threading Concepts Delegates and event concept Class Diagram of File search Application Code File Search Project PART III – PROFESSIONAL PROJECTS CHAPTER 7 – RELIABLE COMPUTER CHAT APPLICATION What will you learn in this project Deliverables in CD for this Project Overview of Chat application How to start the chat application Starters Chat code Whats wrong with the above code Estimation of the Chat Application External Input (EI) explanation External Inquiry (EQ) explanation Internal Logical File (ILF) explanation Explanation of Total Estimation Use Case Details of the Use Case Caching fundamentals in ASP.NET Class diagram Code explanation Consuming the class library Auto refresh fundamentals Login page explanation Login button click logic Displaying the chat message and the users Change room and Send messages CHAPTER 8 – JOB SITE APPLICATION What will you learn in this project Deliverables in CD for this Project How to load the jobsite Overview of the Job Site Application Estimation of the Job Site Application Explanation of ILF Explanation of EIF and EO Explanation for EQ

Explanation for EI Explanation for GSC Final Estimation Use Case Explanation E-R Diagram Explanation Architecture Explanation Class Diagram Explanation Code Explanation Entity collection relation ship Explanation of clsMenu and clsMenus Explanation of the user class Calling the validation bridge Explanation of the businessvalidation bridge Explanation of the reflection Explanation of Validation library Setobject to validate Explanation of Data access Explanation of UI CHAPTER 9 – QUADRA CLIENT WEB SERVICES What will you learn in this project Deliverables in CD for this Project How to start the Quadra client Web service Fundamentals Overview of the Quadra Client Application Estimation of the Quadra Client Application Use Case Explanation Class Diagram Explanation Setting up the quadra client webservice Code Explanation CHAPTER 10 – POINTS TO BE NOTED IN PROJECTS PROJECTS COMING UP IN SECOND EDITION Call centre project MSC Accounting package INTERVIEW QUESTIONS .NET Interview Questions Book SQL Server Interview Questions Book JAVA Interview Questions Book

Introduction Dedication From Shivprasad koirala This book is dedicated to my kid Sanjana, whose dad’s play time has been stolen and given to this book.I am thankful to my wife for constantly encouraging me and also to BPB Publication to give new comer a platform to perform. Finally at the top of all thanks To two old eyes my mom and dad for always blessing me. I am blessed to have Raju as my Brother who always keeps my momentum moving on. From Shaam This book is dedicated to my mom and dad for all the hard work done to see this day where I am today.
Foreword From Shivprasad Koirala First thing I never thought that I will be able to complete this book. It was the worst phase of career which I had gone through.Thanks to my family to support me, give me confidence to make this book a success. This book has seen its own ups and downs to reach the final light. I started this book with one of my friends Rajesh Nair and Pravin Joshi. Rajesh nair is almost the co-author of the book. But because of their own software project dead lines they had to fall of in between. But yes that does not upset me a bit. The value they had put in the initial stages has made this book matured to a huge extent. I am also grateful to Mr. Sainath to put his experience which has brought the value of book to an elite level. Thanks to Shaam for all the effort. It was his tiresome three months of continuous writing that we have finally made it. I hope this book really serves as a good bed for freshers to make hands on and feel how projects are accomplished in international companies.
About the authors Shivprasad Koirala He works in a big multinational company and has over 8 years of experience in software industry. He is working presently as project lead and in past has led projects in Banking, travel and financial sectors. But on the top of all, I am a simple developer like you all guys there doing an 8 hour job.

Writing is something I do extra and I love doing it. No one is perfect and same holds true for me .So anything you want to comment, suggest, point typo / grammar mistakes or Technical mistakes regarding the book you can mail me at [email protected]. Believe me guys your harsh words would be received with love and treated to the top most priority. Without all you guys I am not an author.
Who should read this book
• Developers who want to understand how project are completed using SDLC and proper documentation.
• Developers who want to know how estimation, use cases, requirement analysis, test cases and design documents are executed in live projects.
• Programmers who are looking for quick hands on projects. • Senior and junior developers who are looking of how to do practical
implementation of OOPS in project. • Developers who are looking at practically implementing UML. • Developers who are looking at how estimation is done practically in software
projects.
Details of the book
• Book has in all six projects (Job Site, Chat application, File search, Job Site client, Mandel brot and batch uploading) with three professional projects completed with proper controlled SDLC and documentation.
• This book will give you a three dimension view of the project i.e from the developer, architecture and project manager perspective.
• Full source code of all six projects with proper documentation included in the CD. • All professional projects have Use cases, UML, Estimation and proper test plan.
This not only makes you practically confortable from coding point but also from project point of view.
• There are decent videos which explain the source code and some basic fundamentals in a detail fashion thus making you comfortable for real projects.
• MSDE is provided in the CD so that you can exploit sql server to the maximum during database projects.
• Other than technical aspects this book also provides important points to be noted in the project. For instance your attitude and behavior during the project.
• This book shows in depth of how to increase reusability by using Microsoft Application blocks. This is excercised by using microsft data application blocks in the job site project.
• Interview questions to judge yourself during interview. After completing the project you would like to have a glance through the questions so that you are in a better position during .NET interviews.

• Threading, Session management, webservices, ADO.NET and many such features are explained with a project implementation which gives clearer idea of the subject.
• Before the projects detail theory explanation of UML, Estimation, and SDLC and design documentation is provided to the reader which will make him more confortable while executing the project.
• Some applications are coded from two perspective one from an ok developer perspective and the other from a good programmer perspective. Thus giving two view points of the development perspective.
What’s in the CD The CD has stuffs which will make you rock.
• Source code folder: - This folder has basically all the source code of projects present in this book.
o Mandelbrot project o Windows file search project o Chat application project. o Job site project ( Quadra job site) o Job site client project ( Quadra client)
• Videos folder: - This folder contains videos from the perspective of this book. Watching those videos will make you confident about the project. Below are the various videos with what they explain :-
o IISPractical: - Gives a practical understanding of what exactly IIS is. o IISTheoryExplanation :- Gives you theoritcial explanation of IIS. o WindowsIDE :- Explains how to use VS.NET IDE in a efficient way. o FunctionPointTemplate :- Explains how to use the function point template
for estimation. o MandelBrotCodeWalkthrough :- Explains the Mandel brot code
walkthrough. o BadChatApplicationCodeWalkThrough :- Explains the bad chat code
walkthrough. o StarttheJobSiteProject :- This video will help you to make job site project
up and running. o JobWebSiteFunctionalWalkThrough :- Gives functionality walkthrough
for the Job site application. o JobSiteCodeUnderstanding :- Gives a code walkthrough of the jobsite
application. o QuadraClientExplanation :- Gives a detail functionality explanation of the
quadr client project. o QuadraClientCodeUnderstaing :- Gives a code walkthrough of the quadra
client code walkthrough.
Note: - In the installable folder windows media player is provided in
case you have issues viewing the videos.

• Installable folder: - This folder contains following necessary installable required
for this project. o Windows Media player and codec installable to view videos of this book. o Data access application blocks for the DAL component of the project. o MSDE 2000 Database (MSDE2000A.exe) as a database for this book. o SQL Server 2000 Evaluation version. This software is in the CD so that
we can install the SQL Client to connect to MSDE 2000.
Part I – The fundamentals
Chapter 1 SDLC and Project documentation
What does this book target The prime goal of this book is to make a programmer comfortable to work practically on C# projects adhering to proper software quality processes. In my childhood times I wanted to learn cycling. That’s because all the village girls liked boys who can ride cycle :-). So I some how managed to get myself in my village cycle training school, it was a four day course. In the cycle training school I was taught theory for three days and then on the fourth day I touched the cycle. But I was never confident enough to drive the cycle independently. But one fine day one of my good friend just made me sit on the cycle and continuously made me drive the cycle for three hours. LOL!!! I learnt it. The same holds true for Software field one actual implementation is 1000 times worth than big GURU talks. But there is one more important thing – Software quality process. I did learn riding the cycle but for one week continuously I was struggling to manage brakes, turns etc. In short I learnt to ride the cycle but not in a controlled and quality manner. That’s a different thing I learnt to control the cycle over a period of time. So the second aspect this book will target is not only to enable you practically but in a controlled fashion so that you give quality code rather than quantity code. Note: - The biggest difference between an ok programmer and good
programmer is quality coding.
So here's my equation for this book. THIS BOOK = INSTANT PRACTICAL + PROPER QUALITY SOFTWARE PROCESS
The growth of a software professional

If you are self taught programmer or working in a company which is not process oriented the title of this section can sound a bit bureaucratic to you. A good software product other than source code has proper documentation and process at place. Every young developer in his initial part of the software career is hot blooded and full of enthusiasm. The only goal he has in his mind is to complete the project. For these kind of young developers source code is the most important section in the complete project. As time passes by and the young developer starts gaining experience depending on the type of the company and his number of year of exp his view point changes. As the developer becomes senior source code becomes an insignificant entity and documentation forms the most important part of the project from his perspective. Below is the breakup and view point depending on maturity level of software professional. 0-2 Years of experience: - Developers having experience in this range give importance to source code. They take pride and enjoyment to write cryptic and heroic logic. Developers falling in this category think documentation as bureaucratic. If not controlled properly they rarely will think to even comment codes. But yes software professionals in this experience range have great technical enthusiasm. They love to get involved technically. 3-5 Year of experience: - Software professional in this category have lot of maturity in technical section. They take pride in architecture work of the project. In fact many of the developers would like to see themselves as architecture in the coming times. That’s a different thing as they get to more senior position they want to see themselves as project managers rather than in to technical. Software professional in this range think source code with proper comments and technical documentation as the most important deliverable. They have less focus on project planning, estimation and testing. 6 - 8 Years of experience: - Software professional in this experience range give importance to technical documentation, estimation and source code. But they are bit soft when it comes to project planning and testing. 9 and above Years: - This is the time he becomes a complete senior (he becomes a bit fat). Source code deliverable becomes one of the smallest entities of the project. Planning, monitoring, People issues, escalation and estimation become prime focus for him. He starts following processes like CMMI and SIX SIGMA religiously. From this book i am not trying to communicate that estimation, planning or project management is not a important part. But as people become seniors why is that they start loosing technical touch. When we know technical forms an important aspect of software projects. In short the right proportion between management and technical is important. When a software professional starts his career technical is the only thing for him and when he is at his peak management is everything. If a professional makes a proper balance of both

these entities we have the MR Perfect with us.....And I know there are still many MR Perfect in the software industry or else we would not have come so far.
Figure 1.1 : - Viewpoints of software developer Above figure shows how senior and junior view project deliverables. Projects in this book will have all the above documents which will give us a complete view of the project. If we do not have documentation in project you will probably complete the project but when new people join knowledge transition becomes a huge task. The biggest advantage of documentation is that the project becomes resource independent and which is a huge success for any project. I know how difficult it is to convince juniors and developers working in small scale software house the importance of documentation and proper process to complete a project. How many times it has happened that you wanted to

change your project and your project manager did not allow you?. Yes because he knew that you are a hero of the project and your leaving will create him problems. So first thing never be a hero on a project rather work in co-coordinated fashion and make project independent of you. The best way to attain independency in project is by proper documentation. Clear cut documentation makes new developers to join the project in much easy fashion and you can move to new heights in the organization. Now two cents!!!! For the seniors who do over documentation the project ;-). I still remember one of my seniors who told me to document how a developer should behave in the project. The above said document is related to project, but if it is not there it will not affect the project in any way. In short introduce documents in project which are really needed rather than just pushing something for namesake.
SDLC (Software development Life Cycle) Every activity has a life cycle and software development process is not an exception for the same. Even if you are not aware of SDLC you still must be following it unknowingly. But if a software professional is aware about SDLC he can execute the project in a much controlled fashion. One of the big benefits of this awareness is that hot blooded developers will not start directly execution (coding) which can really lead to project running in an uncontrolled fashion. Second it helps customer and software professional to avoid confusion by anticipating the problems and issues before hand. In short SDLC defines the various stages in a software life cycle. But before we try to understand what SDLC is all about. We need to get a broader view of the start and end of SDLC. Any project started if it does not have a start and end then its already in trouble. It’s like if you go out for a drive you should know where to start and where to end or else you are moving around endlessly.
Figure 1.2 : - Entry, SDLC and Exit in action

Above is a more global view of the how the start and end of SDLC. Any project should have entry criteria and exit criteria. For instance a proper estimation document can be an entry criteria condition. That means if you do not have a proper estimation document in place the project will not start. It can be more practical, if half payment is not received the project will not start. So there can be list of points which needs to be completed before a project starts. Finally there should be end of the project also which defines saying that this is when the project will end. For instance if all the test scenarios given by the end customer is completed that means the project is finished. In the above figure we have the entry criteria as an estimation document and exit criteria as a signed document by the end client saying the software is delivered. Below is the figure that shows typical flow in SDLC which has five main models .As per use developers can select model for their project.
• Waterfall - Big Bang and Phased model. • Iterative - Spiral and Incremental model.
Waterfall Let’s have a look on Waterfall model which is basically divided into two subtypes:-
• Big Bang waterfall model. • Phased waterfall model.
As the name suggests Waterfall means flow of water always goes in one direction so when we say waterfall model we expect every phase/stage is freezed. Big Bang waterfall model The figure shows waterfall BigBang model which has several stages and are described as below:-
• Requirement stage: - This stage takes basic business needs required for the project which is from a user perspective so this stage produces typical word documents with simple points or may be in a form of complicated use case documents. In this book we will be using use case documents to describe this stage.
Note: use case are explained in detail in UML section
• Design stage: - Use case document / requirement document is the input for this
stage. Here we decide how to design the project technically and produce technical document which has Class diagram, pseudo code etc.
• Build stage:-This stage follows the technical documents as an input so code can be generated as an output by this stage. This is where the actual execution of the project takes place.
• Test stage:-Here testing is done on the source code produced by the build stage and final software is given a green flag. In this book we will have a test plan documents for this stage.

• Deliver stage: - After succeeding in Test stage the final product/project is finally installed at client end for actual production. This stage is start for the maintenance stage.
Figure 1.3: - SDLC in action (Waterfall big bang model)
In this model, it is assumed that all stages are freezed that means it’s a perfect world. But in actual projects such processes are impractical. Phased Waterfall model In this model the project is divided into small chunks and delivered at intervals by different teams. In short, chunks are developed in parallel by different teams and get integrated in the final project. But the disadvantage of this model is there is improper planning may lead to fall of the project during integration or any mismatch of co-ordination between the team may cause huge failure.
Iterative model Iterative model was introduced because of problems faced in Waterfall model.

Now let’s try to have a look on Iterative model which also has two basic subtype as follows:- Incremental model In this model work is divided into chunks like phase waterfall model but the difference is that in Incremental model one team can work on one or many chunks which was unlike in phase waterfall model. Spiral model This model uses series of prototype which refine on understanding of what we are actually going to deliver. Plans are changed if required as per refining of the prototype. So every time in this model refining of prototype is done and again the whole process cycle is repeated.
Evolutionary model In Incremental and Spiral model the main problem is for any changes in between SDLC cycle we need to iterate through the whole new cycle. For instance, During the final(Deliver)stage customer demands for change we retreat the whole cycle again that means we need to update all the previous (Requirement, Technical documents, Source code & Test plan) stages. In Evolutionary model, we divide software into small units which can be earlier delivered to the customer’s end which means we try to fulfill the customer’s needs. In the later stages we evolve the software with new customers needs.
V-model This type of model was developed by testers to emphasis the importance of early testing. In this model testers are involved from requirement stage itself. So below is the diagram which shows how for every stage some testing activity is done to ensure that the project is moving as planned. For instance,
• In requirement stage we have acceptance test documents created by the testers. Acceptance test document outlines that if these test pass then customer will accept the software.
• In specification stage testers create the system test document. In the coming section system testing is explained in more elaborate fashion.
• In design stage we have integration documents created by the testers. Integration test documents define testing steps of how the components should work when integrated. For instance you develop a customer class and product class. You have tested the customer class and the product class individually. But in practical

scenario the customer class will interact with the product class. So you also need to test is the customer class interacting with product class properly.
• In implement stage we have unit documents created by the programmers or testers.
Lets try to understand every of this testing phase in more detail. Unit Testing Starting from the bottom the first test level is "Unit Testing". It involves checking that each feature specified in the "Component Design" has been implemented in the component. In theory an independent tester should do this, but in practice the developer usually does it, as they are the only people who understand how a component works. The problem with a component is that it performs only a small part of the functionality of a system, and it relies on co-operating with other parts of the system, which may not have been built yet. To overcome this, the developer either builds, or uses special software to trick the component into believe it is working in a fully functional system. Integration Testing As the components are constructed and tested they are then linked together to check if they work with each other. It is a fact that two components that have passed all their tests, when connected to each other produce one new component full of faults. These tests can be done by specialists, or by the developers. Integration Testing is not focused on what the components are doing but on how they communicate with each other, as specified in the "System Design". The "System Design" defines relationships between components. The tests are organized to check all the interfaces, until all the components have been built and interfaced to each other producing the whole system. System Testing Once the entire system has been built then it has to be tested against the "System Specification" to check if it delivers the features required. It is still developer focused, although specialist developers known as systems testers are normally employed to do it. In essence System Testing is not about checking the individual parts of the design, but about checking the system as a whole. In fact it is one giant component. System testing can involve a number of specialist types of test to see if all the functional and non-functional requirements have been met. In addition to functional requirements these may include the following types of testing for the non-functional requirements:
• Performance - Are the performance criteria met? • Volume - Can large volumes of information be handled? • Stress - Can peak volumes of information be handled? • Documentation - Is the documentation usable for the system?

• Robustness - Does the system remain stable under adverse circumstances? There are many others, the need for which is dictated by how the system is supposed to perform. Acceptance Testing Acceptance Testing checks the system against the "Requirements". It is similar to systems testing in that the whole system is checked but the important difference is the change in focus: Systems testing checks that the system that was specified has been delivered. Acceptance Testing checks that the system will deliver what was requested. The customer should always do acceptance testing and not the developer. The customer knows what is required from the system to achieve value in the business and is the only person qualified to make that judgment. This testing is more of getting the answer for whether is the software delivered as defined by the customer. It’s like getting a green flag from the customer that the software is up to the expectation and ready to be used.
Figure 1.4: - V model cycle flow
Which is the best model? In the previous section we looked through all the models. But in real projects, hardly one complete model can fulfill the entire project requirement. In real projects, tailor model are proven to be the best because they share features from all models such as Waterfall,

Iterative, Evolutionary models etc and can fit in to real life time projects. Tailor model are most productive and benefited for many organization. As it is an educational book we will build up virtual project for clear understanding the process so we will use Big Bang waterfall model. In waterfall project output of every stage will be freezed as explained earlier no changes will be accepted once the requirement document is freezed.
Essential documentation in projects In the previous section we discussed the various SDLC lifecycle models. For every stage in the model we have documents created according to phases such as:-
• Requirement stage we have the Use case document • Design stage we have the Technical document • Build stage we have the source code • Test stage we have the Test result document • Deliver stage we have the sign off document
There are different documentation for every project and these documents change from company to company and project to project. For instance, some company will have 3 documents and some will have 12 documents in a project depending upon project manager or the policy of the company to execute a project. This book will include only 5 documents in a project which are as follows:-
• Requirement document • Estimation document • Use case document • Technical document • Test plan document • Source code
Let’s try to understand in detail each document used in a software project • Requirement document:-A requirement document can be a single English
document, probably a recorded audio or video conversation or can be a complicated use case. In short it’s something raw which comes from the end client.
• Estimation document: - After getting requirement from the user we can judge cost for the project. In this book we will be using the function point estimation model. There is a complete chapter which is dedicated to function point in this book.
• Use case document:- This is a section of UML which basically describes in detail the requirement document which serves as an input to the Design stage
• Technical document:-This document contains detail of how the project being executed such as pseudo code, class diagram, objects diagram, etc.

• Test result document: - This document is written by the testers which describe the test plan which needs to be executed and thus giving project a green flag to production.
• Source code: - This is not basically a document but one of the important deliverable which maps to the execution phase of SDLC cycle.
Note: - See the SDLC in action figure given above which shows how the
documents are mapped to SDLC cycle.
UML The main object of UML is to make the project understanding more crisp and clear. It is a global computer industry modeling language to communicate between software professional in a project. UML helps us to create documents, artifacts & also give visualization so that we can understand the complex software engineering process of a project.
Three views of the project from UML perspective There are 12 diagrams in UML they are divided into 3 main views as below:-
• Structure diagram • Behavior diagram • Model management diagram
Structure diagram They are used to show static structure of an application. Let’s try to understand what the word static signifies. For instance in a civil construction when the engineer makes a model of a civil construction. The outer structure of the building and bridge will remain same but yes the inner part of the structure for instance the structure of room and passages (one room, two rooms etc) can vary. Same holds true when we talk about software industry there are static part and dynamic part of project. For example classes in project will rarely change. Yes the attributes and methods in the class will change as user adds new functionalities. For instance in the below figure you can see the Invoice header will have multiple invoice details. The structure and relation between Invoice header and Invoice detail will never change. But yes the invoice can pass through multiple stages like open invoice, closed invoice or pending invoice which is dynamic.

Figure 1.5: - Project static nature
UML has four types of structure diagram :-
1) Class diagrams 2) Object diagrams 3) Component diagrams 4) Deployment diagrams
Behavior diagram UML gives us five Behavior diagram. They are used to show dynamic structure of an application. Let’s try to understand what does a dynamic structure of a project means. In a typical software project we can have business validations. Business validations of a project are of very dynamic nature. For instance an invoice can have lot of states for instance open invoice, closed invoice and paid invoice. And your software will change the invoice object from one state to other state. This is a dynamic nature of the project.
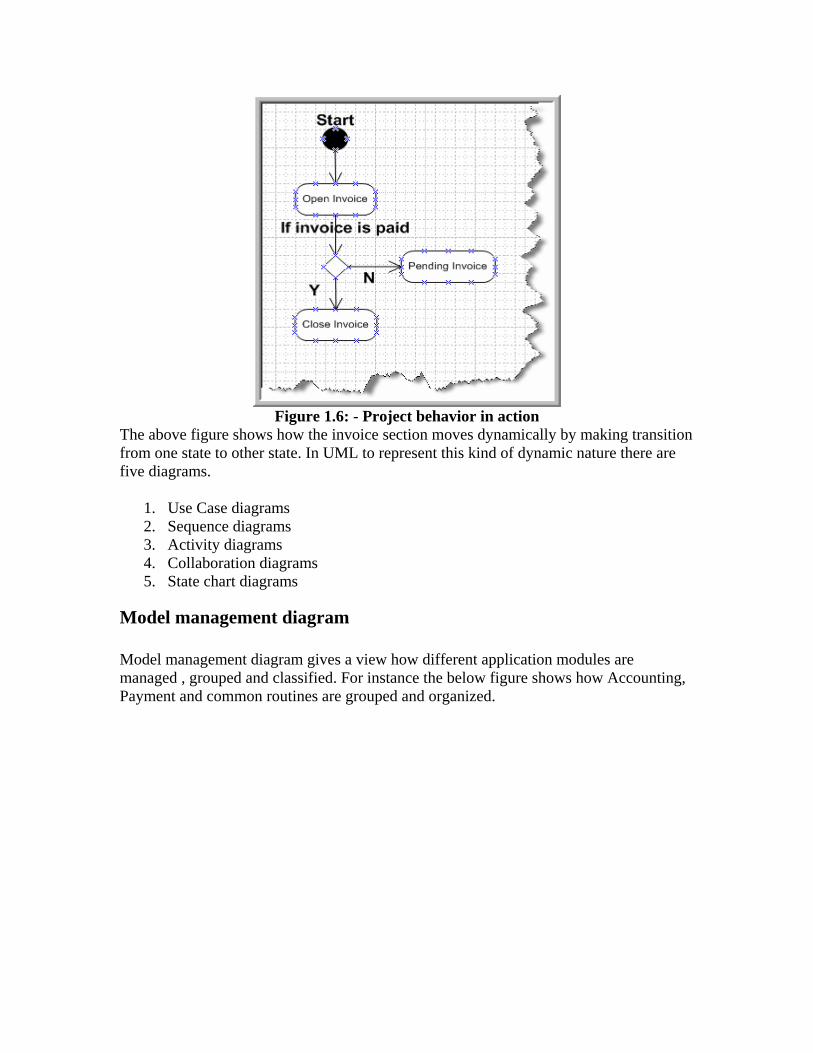
Figure 1.6: - Project behavior in action
The above figure shows how the invoice section moves dynamically by making transition from one state to other state. In UML to represent this kind of dynamic nature there are five diagrams.
1. Use Case diagrams 2. Sequence diagrams 3. Activity diagrams 4. Collaboration diagrams 5. State chart diagrams
Model management diagram Model management diagram gives a view how different application modules are managed , grouped and classified. For instance the below figure shows how Accounting, Payment and common routines are grouped and organized.
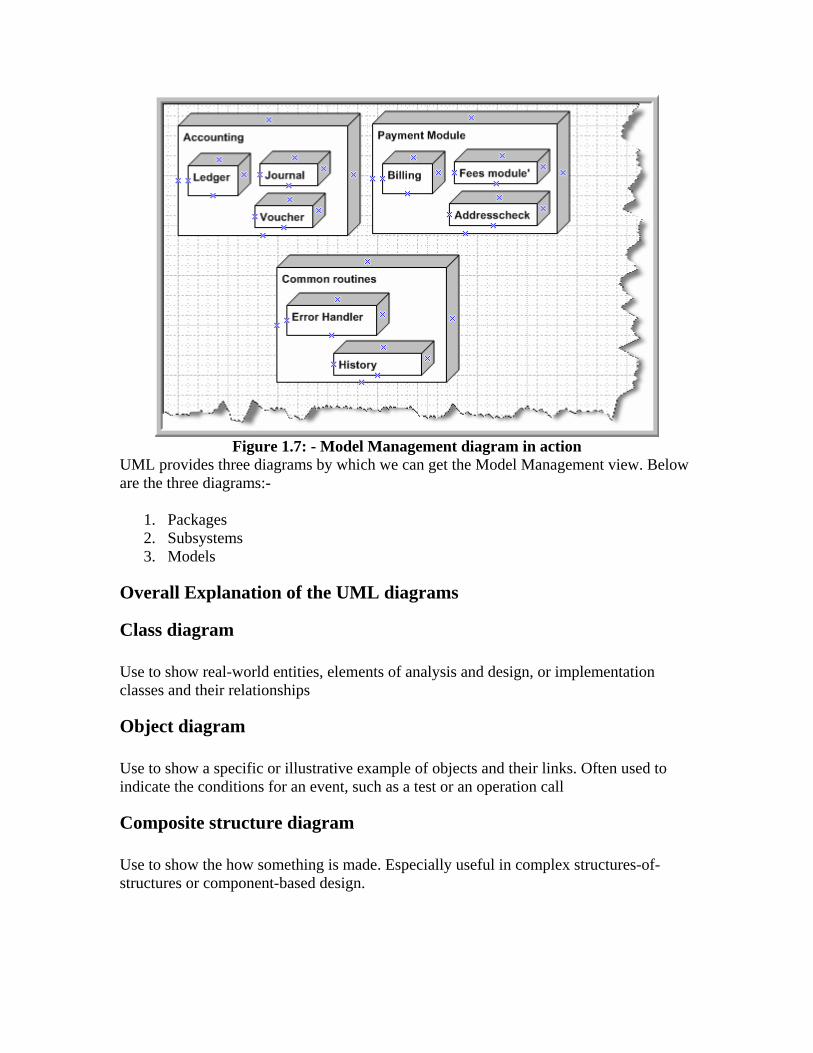
Figure 1.7: - Model Management diagram in action
UML provides three diagrams by which we can get the Model Management view. Below are the three diagrams:-
1. Packages 2. Subsystems 3. Models
Overall Explanation of the UML diagrams
Class diagram Use to show real-world entities, elements of analysis and design, or implementation classes and their relationships
Object diagram Use to show a specific or illustrative example of objects and their links. Often used to indicate the conditions for an event, such as a test or an operation call
Composite structure diagram Use to show the how something is made. Especially useful in complex structures-of-structures or component-based design.
Deployment diagram Use to show the run-time architecture of the system, the hardware platforms, software artifacts (deliverable or running software items), and software environments (like operating systems and virtual machines).
Component diagram Use to show organization and relationships among the system deliverables
Package diagram Use to organize model elements and show dependencies among them
Activity diagram Use to the show data flow and/ or the control flow of a behavior Captures workflow among cooperating objects
Use case diagram Use to show the services that actors can request from a system in actor and role form.
State machine diagram / Protocol state machine diagram Use to show the life cycle of a particular object, or the sequences an object goes through or that an interface must support.
Overview diagram Use to show many different inter- action scenarios (sequences of behavior) for the same collaboration (a set of elements working together to accomplish a goal)
Sequence diagram Use to focus on message exchange between a group of objects and the order of the messages.
Communication diagram Use to focus on the messages between a group of objects and the underlying relationship of the objects
Timing diagram Use to show changes and their relationship to clock times in real-time or embedded Systems work
Which diagram is important In above section we have seen the basic definitions of all the UML diagrams. But in real projects we do not draw all the diagrams instead we look towards the complexity of the project or necessity of the project and accordingly we decide the diagrams and then

diagrams are added to the technical document or the requirement document. So in this book we will use two basic diagrams extensively:-
• Use case diagrams • Class diagrams The other diagram will be used if required and their respective explanation will be provided at the same time. Let’s try to understand in detail the two basic diagram used in the project. The first one is the Use case diagram and explained as the follows
Use case diagram over view It’s a user functionality which the user wants to be completed by the system. For example Travel Company’s director wants to book ticket, cancel ticket, refund ticket done by the system. So basically it defines the actions of the user in the system. It basically defines verbs of the system. The best way to identify a use case is by extracting verbs of the requirement document given by the end customer.
Actors and Goals Every use case will have the below two components actors and goals. Actors are stake holders of the system. Stake holders provide requirement to your project and oppose in case of any issues. Normally software users are the actors. For instance in an accounting application accountant forms as an actor and for the same accounting application we have cashier and charted accountant as another form of actors for the system. Every actor has goal to perform when using the system. There are two types of actors:-
• Primary Actor:-This actor actually initiates the use case on the system. • Secondary Actor:-While Secondary Actor contacts other actors or use cases to
meet the Primary Actor’s goal. In the below example we have Ticket Reservation system here travel agent is a actor who is using reserving ticket application and booking a ticket, canceling a ticket and refunding a ticket. So booking, canceling and refunding of a ticket are goals performed by an actor. The figure below shows the diagrammatic view to represent relationship between actors and goals. But the diagram does not show the details of the goals.
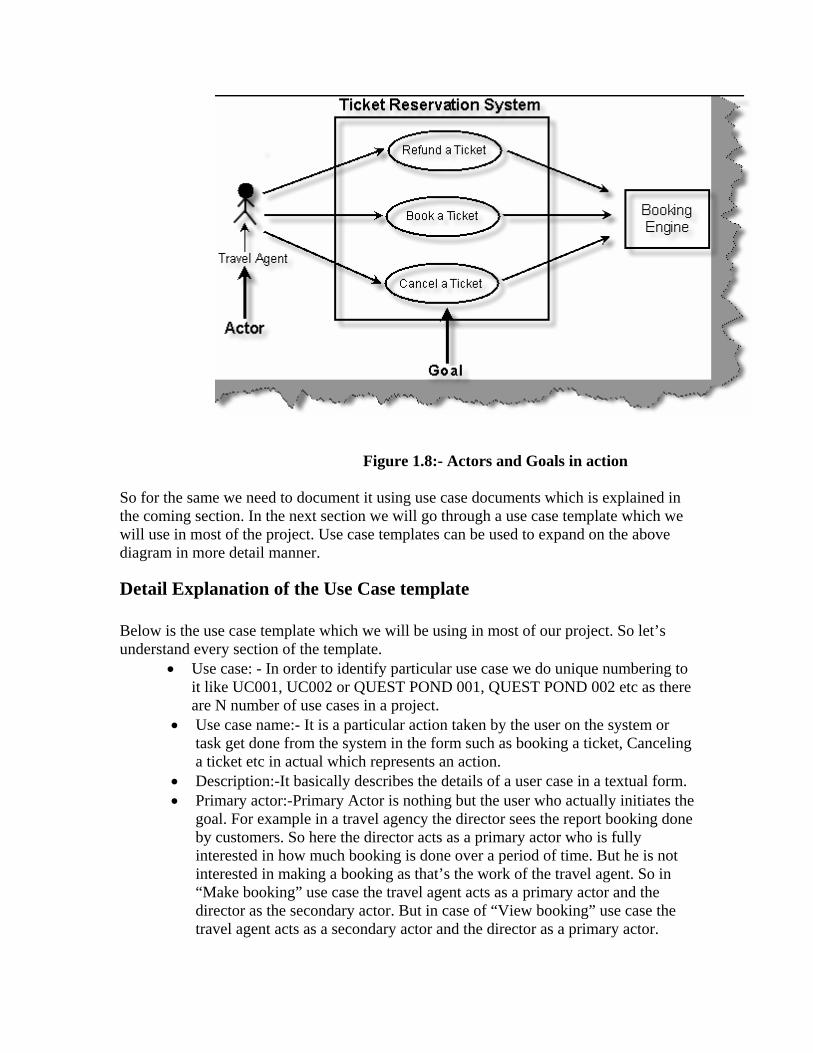
Figure 1.8:- Actors and Goals in action So for the same we need to document it using use case documents which is explained in the coming section. In the next section we will go through a use case template which we will use in most of the project. Use case templates can be used to expand on the above diagram in more detail manner.
Detail Explanation of the Use Case template Below is the use case template which we will be using in most of our project. So let’s understand every section of the template.
• Use case: - In order to identify particular use case we do unique numbering to it like UC001, UC002 or QUEST POND 001, QUEST POND 002 etc as there are N number of use cases in a project.
• Use case name:- It is a particular action taken by the user on the system or task get done from the system in the form such as booking a ticket, Canceling a ticket etc in actual which represents an action.
• Description:-It basically describes the details of a user case in a textual form. • Primary actor:-Primary Actor is nothing but the user who actually initiates the
goal. For example in a travel agency the director sees the report booking done by customers. So here the director acts as a primary actor who is fully interested in how much booking is done over a period of time. But he is not interested in making a booking as that’s the work of the travel agent. So in “Make booking” use case the travel agent acts as a primary actor and the director as the secondary actor. But in case of “View booking” use case the travel agent acts as a secondary actor and the director as a primary actor.

• Trigger:-Things which makes use case starts through an actor is called Trigger. For example user starts the application.
• Pre-condition:-These are conditions in a use case to be considered as pre-requirements such as to book a air ticket we need to have server connection and also we have to validate in to the system then only the actor can book a ticket for the customer.
• Assumptions: - These are assumptions which we define for the system. • Failed end conditions:-This state signifies when the use case will fail. For
when User Id and Password is not proper id displayed on the Login screen it signifies login failed condition.
• Actions: - This is the basic action by which the main scenario of the use case starts such as login onto the system or to make booking of tickets we actually perform actions like click on Login----File----New----Booking menu which in return opens the page of booking section.
• Main scenario:-It describes the basic step which should be executed by the user.
For instance below steps show the main scenario steps :-
o Travel agent logs in to the system. o Travel agent goes to the ticket booking form. o He enters Ticket Number, Travel routes of the customer, details of the
customer etc. o Finally he adds the ticket to the system and prints the ticket.
• Alternate scenario: - Alternate scenarios are steps which have a slight different flow other than the main scenario. The main scenario and the alternate scenario have many steps in common but with a slight difference.
For instance below is the alternate scenario step which is different than the main scenario:-
o Travel agent logs in to the system. o Travel agent goes to the ticket booking form and enters the ticket
number. o Travel agent is then popped with all details regarding the ticket
booking. o Travel agent makes changes to the existing information. o Once the changes are done the travel agent updates the information
and prints out the ticket. • Success scenario:-Success scenarios indicate when this use case is successful.
For example the ticket is printed successfully, email is sent to the customer etc etc.
• Note and open issues: - Some pending task about the use case which the
customer needs to make more clarification. For example from where does

exactly the booking of air tickets happens, is it directly from the customer itself or from the traveling agency.
Figure 1.9:- Use Case template
Note: - In every project we have use case documents as a part of
requirement gathering. So once you go through those use case you will
have good understanding of the same.
Included and Extended use case In use cases we come across identical sequences between the actors and the system if such kind of common sequence is not identified in use case document it can lead to redundancy in the project. Because the requirement document trickles down to the technical document which can lead to lot of redundancy coding. Included and extended are the types of use cases which can be used to club together such common sequences. Included use case:-Below figure shows the included use case in an shoppingmall.com project and uses the Included use case in the form of “check credit cards” for customers. Let’s try to understand the following example of a customer where he orders the flowers, greeting cards and cassettes but the payment is always done through the credit card. So here flowers, greeting cards and cassettes always have to execute the check credit card (common use case). So we make the check credit card use case as an included use case.

Figure 1.10:- Included Use case in action This kind of common interaction can be put in a common use case and called whenever needed. Extended use case system:-While writing use case it is possible to have multiple version of the same use case. For instance you have to add a new customer and then you can also update a customer. So update customer use case is an Extension of add new customer use case.
Figure 1.11: - Extended Use Case

Differentiate between Included use case and extended use cases? If you need to deliver the use case with the base use case then it will form an included use case type of relationship. But if use case can be delivered later and have steps in common then its base use case forms an Extended use case type of relationship. The one thing in common is that they have some common steps in sequence.
Class diagram In this book for all projects the other diagram that will be extensively used is the class diagram.Class is basically prototype which helps us create objects. Class defines the static structure of the project. A class represents family of an object. By using Class we can create uniform objects. In the below figure you can see how the class diagram looks. Basically there are three important sections which are numbered as shown in the below. Let’s try to understand according to the numbering:-
• Class name:-This is the first section or top most section of the Class which represents the name of the Class (clsCustomer).
• Attributes:-This is the second section or the middle section of the class which represents the properties of the system.
• Methods: - This section carries operation or method to act on the attributes.
Figure 1.12: - Three sections of the class In the previous section we have seen what basically the class is. Now in the next section we will have a look on Association relationship between these classes
Associations in Class diagrams A single Class cannot represent the whole module in a project so we need one or more classes to represent a module. For instance, a module named ‘customer detail’ cannot be completed by customer class in order to complete the whole module we need customer class, address class, phone class in short there is relationship between the classes. So by grouping and relating between the classes we create module and these are termed as Association. In order to associate them we need to draw the arrowed lines between the classes as shown in the below figure.

In this figure, we can see Order class and the Payment class and arrowed line showing relationship that order class is paid using payment class in other words order class is going to be used by payment class to pay the order. The left to right marked arrow basically shows the flow that order class uses the payment class. In case payment class using the order class then the marked arrow should be right to left showing the direction of the flow.
Figure 1.13:- Order is paid by Payments class There are four signs showing the flow:-
Figure 1.14:- Direction signs in UML
Multiplicity Multiplicity can be termed as classes having multiple associations or one class can be linked to instances of many other classes. If you look at the below figure the customer class is basically associated with the address class and also observes the notations (*, 0 and 1).If you look at the right hand side the (1….*) notation indicates that at least one or many instance of the address class can be present in the customer class. Now towards left hand side we have (0….*) notation indicating that address class can exist without or many customer class can link him. In order to represent multiplicity of classes we have to show notations like (1….*), (0….*) as shown in below figure. Note: ‘*’ means “many” where as ‘(0, 1)’ means “(zero or at least one)”
respectively.
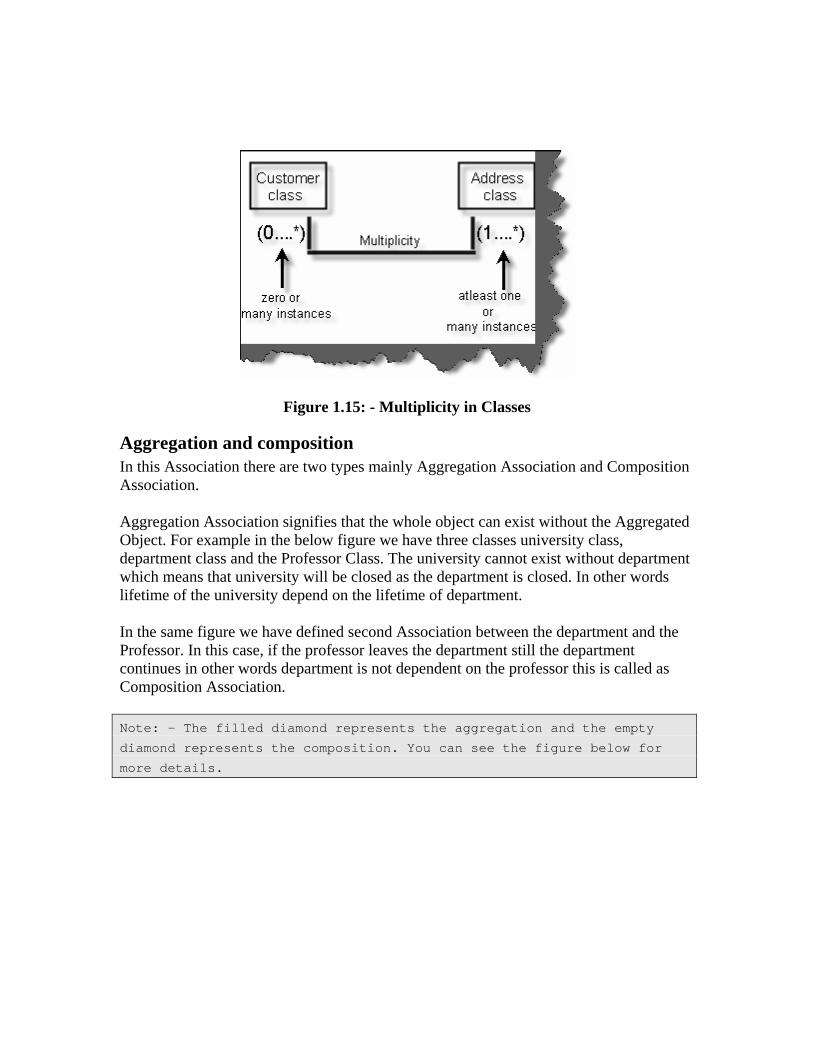
Figure 1.15: - Multiplicity in Classes
Aggregation and composition In this Association there are two types mainly Aggregation Association and Composition Association. Aggregation Association signifies that the whole object can exist without the Aggregated Object. For example in the below figure we have three classes university class, department class and the Professor Class. The university cannot exist without department which means that university will be closed as the department is closed. In other words lifetime of the university depend on the lifetime of department. In the same figure we have defined second Association between the department and the Professor. In this case, if the professor leaves the department still the department continues in other words department is not dependent on the professor this is called as Composition Association. Note: - The filled diamond represents the aggregation and the empty
diamond represents the composition. You can see the figure below for
more details.

Figure 1.16: - Aggregation and composition in action
Composite structure diagram When we try to show Aggregation and Composition in a complete project the diagram becomes very complicated so in order to keep it simple we can use Composite structure diagram. In the below figure we have shown two diagrams one is normal diagram other is Composite structure diagram and the simplicity can easily be identified. In the composite diagram the aggregated classes are self contained in the main class which makes it simpler to read.
Figure 1.17: - Composite Structure diagram

Reflexive associations In many scenarios you need to show that two instances of the same class are associated with each other and this scenario is termed as Reflexive Association. For instance in the below figure shows Reflexive Association in the real project. Here you can see customer class has multiple address class and addresses can be a Head office, corporate office or Regional office. One of the address objects is Head office and we have linked the address object to show Reflexive Association relationship. This is the way we can read the diagram Regional address object is blocked by zero or one instance of Head office object.
Figure 1.18: - Reflexive association
Generalization and specialization In Generalization and Specialization we define the parent-child relationship between the classes. In many instance you will see some of the classes have same properties and operation these classes are called super class and later you can inherit from super class and make sub classes which have their own custom properties. In the below figure there are three classes to show Generalization and Specialization relationship. All phone types have phone number as a generalized property but depending upon landline or mobile you can have wired or simcard connectivity as specialized property. In this diagram the clsphone represent Generalization whereas clslandline and clsmobile represents specialization.

Figure 1.19:- Generalization and Specialization Note: - In all the projects in the book we will be using class diagram
heavily.
Estimation in projects One of the important sections in any project is estimation. Any project started with out estimation means the software company has already decided to work for charity. In this book we will be using one of the most used estimation technology function points to do estimation. Please read this chapter again and again so that you do not have issues while going through the estimation sheets in every project.
Introduction to Function Points “This document contains material which has been extracted from the
IFPUG Counting Practices Manual. It is reproduced in this document with
the permission of IFPUG.”
Function Point Analysis was developed first by Allan J. Albrecht in the mid 1970s. It was an attempt to overcome difficulties associated with lines of code as a measure of software size, and to assist in developing a mechanism to predict effort associated with software development. The method was first published in 1979, then later in 1983. In 1984 Albrecht refined the method and since 1986, when the International Function Point User Group (IFPUG) was set up, several versions of the Function Point Counting Practices Manual have been coming out.

“The best way to understand any complicated system is breaking the
system in to smaller subsystem and try to understand those smaller sub-
systems . In Function Point you break complicated huge system into
smaller systems and estimate those smaller pieces, then total up all
the subsystem estimate to come up with final estimate.”
Basics of Function Points Following are some terms used in FPA [Function Point analysis].
Application Boundary The first step in FPA is defining boundary. There are two types of major boundaries:
• Internal Application Boundary • External Application Boundary
I will state features of external application boundary, so that internal application boundary would be self explained. External Application Boundary can be identified using following litmus test:
• Does it have or will have any other interface to maintain its data, which is not developed by you. Example: Your Company is developing an “Accounts Application” and at the end of accounting year, you have to report to tax department. Tax department has his own website where companies can connect and report there Tax transaction. Tax department application has other maintenance and reporting screens been developed by tax software department. These maintenance screens are used internally by the Tax department. So Tax online interface has other interface to maintain its data which is not your scope, thus we can identify Tax website reporting as External Application.
• Does your program have to go through a third party API or layer? In order your application interacts with Tax Department Application probably your code have to interact through Tax Department API.
• The best litmus test is to ask yourself do you have full access over the system. If you have full rights or command to change then its internal application boundary or else external application boundary.
Elementary Process As said in introduction FPA is breaking huge systems in to smaller pieces and analyzing them. Software application is combination of set of elementary processes. EP is smallest unit of activity that is meaningful to the user. EP must
be self contained and leave the application in a consistent state.
When elementary processes come together they form a software application.

Note:-Elementary process is not necessarily completely independent or
can exist by itself.So, we can define elementary process as small units
of self contained functionality from user perspective.
Dynamic and static elementary process There are two types of elementary process: -
• Dynamic Elementary process. • Static Elementary process.
Dynamic elementary process moves data from internal application boundary to external Application boundary or vice-versa. Examples of dynamic elementary process: -
• Input data screen where user inputs data in to application. Data moves from the input screen inside application.
• Transaction exported in export files in XML or any other standard. • Display reports which can come from external application boundary and internal
application boundary. Static elementary process maintains data of application either inside application boundary or in external application boundary. Examples of static elementary process: -
• In a customer maintenance screen maintaining customer data is static elementary process.
Elements of Function Points Following are the elements of FPA.
Internal Logical Files (ILF) Following are points to be noted for ILF: -
• ILF are logically related data from user point of view. • They reside in Internal Application boundary and are maintained through
elementary process of application. • ILF can have maintenance screen or probably not.
Caution: - Do not make a mistake of mapping one to one relationship
between ILF and technical database design, then FPA can go very
misleading. The main difference between ILF and technical database is
ILF is logical view and database is physical structure (Technical
Design). Example Supplier database design will have tables like

Supplier, Supplier Address, SupplierPhonenumbers, but from ILF point of
view its only Supplier. As logically they are all Supplier details.
Figure 1.20: - ILF logical relationship
External Interface File (EIF) • They are logically related data from user point of view. • EIF reside in external application boundary. • EIF is used only for reference purpose and are not maintained by internal application. • EIF is maintained by external application.
Record Element Type (RET) Following are points to be noted for RET • RET are sub-group element data of ILF or EIF. • If there is no sub-group of ILF then count the ILF itself as one RET. • A group of RET’s within ILF are logically related. Most probably with a parent child relationship. Example: - Supplier had multiple addresses and every address can have multiple phone numbers (See detail image below which shows database diagrams).So Supplier, Supplier Address and Supplier phone numbers are RET’s.

Figure 1.21:- ILF logical relationship
Please note the whole database is one supplier ILF as all belong to one logical section. RET quantifies the relationship complexity of ILF and EIF.
DET (Data element types) Following are the points to be noted for DET counting: -
• Each DET should be User recognizable. Example in the above given figure we have kept auto increment field (Supplierid) for primary key. Supplierid field from user point of view never exists at all , its only from software designing aspect, so does not qualifies for DET.
• DET should be non-recursive field in ILF. DET should not repeat in the same ILF again, it should be counted only once.
• Count foreign keys as one DET. “Supplierid” does not qualifies as DET but its relationship in “supplieraddress” table is counted as DET. So “Supplierid_fk” in supplieraddress table is counted as DET. Same folds true for “Supplieraddressid_fk”. File Type Reference (FTR) Following are points to be noted for FTR: -

• FTR is files or data referenced by a transaction. • FTR should be ILF or EIF. So count each ILF or EIF read during process. • If the EP is maintaining an ILF then count that as FTR. So by default you will always have one FTR in any EP.
External Input (EI) Following are points to be noted for EI: -
• It’s a dynamic elementary process [For definition see “Dynamic and Static Elementary Process” Section] in which data is received from external application boundary. Example: - User Interaction Screens, when data comes from User Interface to Internal Application.
• EI may maintain ILF of the application, but it’s not compulsory rule. Example: - A calculator application does not maintain any data, but still the screen of calculator will be counted as EI.
• Most of time User Screens will be EI, again no hard and fast rule. Example: - An import batch process running from command line does not have screen, but still should be counted as EI as it helps passing data from External Application Boundary to Internal Application Boundary. External Inquiry (EQ) Following are points to be noted for EQ: -
• It’s a dynamic elementary process in which result data is retrieved from one or more ILF or EIF.
• In this EP some input request has to enter the application boundary. • Output results exits the application boundary. • EQ does not contain any derived data. Derived data means any complex
calculated data. Derived data is not just mere retrieval but are combined with additional formulae to generate results. Derived data is not part of ILF or EIF, they are generated on fly.
• EQ does not update any ILF or EIF. • EQ activity should be meaningful from user perspective. • EP is self contained and leaves the business in consistent state. • DET and processing logic is different from other EQ’s. • Simple reports form good base as EQ.
Note:- No hard and fast rules that only simple reports are EQ’s.Simple
view functionality can also be counted as EQ.
External Output (EO) Following are points to be noted for EO: -
• It’s a dynamic elementary process in which derived data crosses from Internal Application Boundary to External Application Boundary.

• EO can update an ILF or EIF. • Process should be the smallest unit of activity that is meaningful to end user in
business. • EP is self contained and leaves the business in a consistent state. • DET is different from other EO’s.So this ensures to us that we do not count EO’s twice. • They have derived data or formulae calculated data.
Major difference between EO and EQ is that data passes across application boundary. Example: - Exporting Accounts transaction to some external file format like XML or some other format. Which later the external accounting software can import. Second Important difference is in EQ its non-derived data and EO has derived data. Which means EQ is a simple report but EO can have complex derived data like sum, count, summary etc. General System Characteristic Section (GSC) This section is the most important section. All the above discussed sections are counting Sections. They relate only to application. But there are other things also to be considered while making software, like are you going to make it an N-Tier application, what's the Performance level the user is expecting etc these other factors are called GSC. These are external factors which affect the software a lot and also the cost of it. When you submit a function point to a client, he normally will skip everything and come to GSC first. GSC gives us something called as VAF (Value Added Factor). There are 14 points considered to come out with VAF (Value Added factor) and its Associated rating table.
Data Communications
How many communication facilities are there to aid in the transfer or exchange of information with the application or system?
Rating Description 0 Application is pure batch processing or a standalone PC. 1 Application is batch but has remote data entry or remote Printing. 2 Application is batch but has remote data entry and remote Printing. 3
Application includes online data collection or TP (Teleprocessing) front end to a batch process or query system.
4
Application is more than a front-end, but supports only one Type of TP communications protocol.
5 Application is more than a front-end, and supports more than One type of TP communications protocol.

Table :- Data Communication
Distributed data processing
How are distributed data and processing functions handled?
Rating Description 0
Application does not aid the transfer of data or processing Function between components of the system.
1 Application prepares data for end user processing on another component of the system such as PC spreadsheets and PC DBMS
2 Data is prepared for transfer, then is transferred and processed on another component of the system (not for end-user Processing).
3 Distributed processing and data transfer are online and in One direction only.
4 Distributed processing and data transfer are online and in Both directions. 5 Processing functions are dynamically performed on the most Appropriate
component of the system
Table :- Distributed data processing
Performance Did the user require response time or throughput?
Rating Description 0 No special performance requirements were stated by the
User. 1 Performance and design requirements were stated and
Reviewed but no special actions were required. 2 Responsetimeorthroughputiscriticalduringpeakhours.Nospec
ialdesignforCPU utilization was required. Processing deadline is for the next business day.
3 Response time or through put is critical during all business hours. No special design for CPU utilizationwasrequired.Processingdeadlinerequirementswithinterfacing systems Are constraining.
4 In addition, stated user performance requirements are stringent enough to require performance analysis tasks in the Design phase.
5 In addition, performance analysis tools were used in the design, development, and/or implementation phases to meet The stated user performance requirements.
Table :- Performance

Heavily used configuration How heavily used is the current hardware platform where the application will be executed? Rating Description 0 No explicit or implicit operational restrictions are included. 1 Operational restrictions do exist, but are less restrictive than a typical
application. No special effort is needed to meet the Restrictions. 2 Some security or timing considerations are included. 3 Specific processor requirement for a specific piece of the Application is
included. 4 Stated operation restrictions require special constraints on the application
in the central processor or a dedicated Processor. 5 In addition, there are special constraints on the application in The
distributed components of the system.
Table :- Heavily used configuration Transaction rate How frequently are transactions executed; daily, weekly, monthly, etc.? Rating Description 0 No peak transaction period is anticipated. 1 Peak transaction period (e.g., monthly, quarterly, seasonally, Annually) is
anticipated. 2 Weekly peak transaction period is anticipated. 3 Daily peak transaction period is anticipated. 4 High transaction rate(s) stated by the user in the application requirements or
service level agreements are high enough to Require performance analysis tasks in the design phase.
5 High transaction rate(s) stated by the user in the application requirem ents or service level agreements are high enough to require perform ance analysis tasks and, in addition, require the use of performance analysis tools in the design, Development, and/or installation phases.
Table :- Transaction rate
On-Line data entry What percentage of the information is entered On-Line?
Rating Description 0 All transactions are processed in batch mode. 1 1% to7% of transactions is interactive data entry. 2 8% to15% of transactions is interactive data entry. 3 16% to23% of transactions is interactive data entry. 4 24% to30% of transactions is interactive data entry. 5 M orethan30% of transactions is interactive data entry.

Table :- Online data entry
End-user efficiency Was the application designed for end-user efficiency? There are seven end-user efficiency factors which govern how this point is rated. Sr no End-user Efficiency Factor 1 Navigational aids(for example, function keys, jumps, dynamically
generated menus) 2 Menus 3 Online help and documents 4 Automated curs or movement 5 Scrolling 6 Remote printing(via online transactions) 7 Preassigned function keys 8 Batch jobs submitted from online transactions 9 Cursor selection of screen data 10 Heavy use of reverse video, highlighting, colors underlining, and other
indicators 11 Hard copy user documentation of online transactions 1 2 Mouse interface 1 3 Pop-up windows 14 .As few screens as possible to accomplish a business function 15 Bilingual support(supports two languages; count as four items) 16 Multilingual support (supports more than two languages; count as six
items). Table :- End user efficiency factor
Rating Description 0 None of the above. 1 One to three of the above. 2 Four to five of the above. 3 Six or more of the above, but there are no specific user Requirements related
to efficiency. 4 Six or more of the above, and stated requirements for end-user efficiency are
strong enough to require design tasks for human factors to be included (for example, minimize keystrokes, maximize defaults, use of templates).
5 Six or more of the above, and stated requirements for end-user efficiency are strong enough to require use of special tools and processes to demonstrate that the objectives have been achieved.
Table : End user efficiency On-Line update How many ILF’s are updated by On-Line transaction?

Rating Description 0 None of the above. 1 Online update of one to three control files is included. Volume of
updating I slow and recovery is easy. 2 Online update off our or more control files is included. Volume of
updating is low and recovery easy. 3 Online update of major internal logical files is included. 4 In addition, protection against data lost is essential and has been
specially designed and programmed in the system. 5 In addition, high volumes bring cost considerations into the
Recovery process. Highly automated recovery procedures With minimum operator intervention are included.
Table :- Online update
Complex processing Does the application have extensive logical or mathematical processing?
S r no Complex Processing Factor 1 Sensitive control(for example, special audit
processing)and/or application specific security Processing 2 Extensive logical processing 3 Extensive mathematical processing 4 Much exception processing resulting in incomplete
transactions that must be processed again, for example, incomplete ATM transactions caused by TP interruption, missing data values, or failed edits
5 Complex processing to handle multiple input/output possibilities, for example, multimedia, or device independence
Table :- Complex processing factor Rating Description 0 None of the above. 1 Any one of the above. 2 Any two of the above. 3 Any three of the above. 4 Any four of the above. 5 All five of the above
Table :- Complex processing
Reusability Was the application developed to meet one or many user’s needs?
Rating Description

0 No reusable code. 1 Reusable code is used within the application. 2 Less than 10% of the application considered
more than one user's needs. 3 Ten percent (10%) or more of the application
considered more than one user's needs. 4 The application was specifically packaged
and/or documented to ease re-use, and the application is customized by the user at source code level.
5 The application was specifically packaged and/or documented to ease re-use, and the application is customized for use by means of user parameter maintenance.
Table :- reusability
Installation ease How difficult is conversion and installation
Description Rating 0 No special considerations were stated by the user, and no special
setup is required for installation. 1 No special considerations were stated by the user but special
setup is required for installation. 2 Conversion and installation requirements were stated by the user
and conversion and installation guides were provided and tested. The impact of conversion on the project is not considered to be important.
3 Conversion and installation requirements were stated by the user, and conversion and installation guides were provided And tested. The impact of conversion on the project is Considered to be important.
4 In addition to 2 above, automated conversion and installation Tools were provided and tested.
5 In addition to 3 above, automated conversion and installation Tools were provided and tested.
Table : Installation ease
Operational ease How effective and/or automated are start-up, back up, and recovery procedures?
Rating Description 0 No special operational considerations so other than the normal

Back- up procedures were stated by the user. One, some, or all of the following items apply to the Application. Select all that apply. Each item has a point Value of one, except as noted otherwise. Effective start-up, back-up, and recovery processes were Provided, but operator intervention is required. Effective start-up, back-up, and recovery processes were provided, but no operator intervention is required(count as Two items). The application minimizes the need for tape mounts.
1-4
The application minimizes the need for paper handling. 5 The application is designed for unattended operation. Unattended
operation means no operator intervention is required to operate the system other than to startup or shutdown the application. Automatic error recovery is a feature Of the application.
Table: - operational ease
Multiple sites Was the application specifically designed, developed, and supported to be installed at multiple sites for multiple organizations? Description Rating 0 User requirements do not require considering the needs of More than one
user/installation site. 1 Needs of multiple sites were considered in the design, and the application
is designed to operate only under identical Hardware and software environments.
2 Needs of multiple sites were considered in the design, and the application is designed to operate only under similar Hardware and or software environments.
3 Needs of multiple sites were considered in the design, and the application is designed to operate under different Hardware and or software environments.
4 Documentation and support plan are provided and tested to support the application at multiple sites and the application is as described by 1 or 2.
5 Documentation and support plan are provided and tested to support the application at multiple sites and the application is as described by 3.
Table :- Multiple sites Facilitate change Was the application specifically designed, developed, and supported to facilitate change?. The following characteristics can apply for the application Sr no Facilitate factors 0 None of above

1 Flexible query and report facility is provided that can handle simple requests; for example, and/or logic applied to only one internal logical file (count as one item).
2 Flexible query and report facility is provided that can handle requests of average complexity for example, and/or logic applied to more than one internal logical file (count as two items).
3 Flexible query and report facility is provided that can handle complex requests, for example, and/or logic combinations on one or more internal logical files (count as three items).
4 Business control data is kept in tables that are maintained by the user with online interactive Processes, but changes take effect only on the next business day.
5 Business control data is kept in tables that are maintained by the user with online interactive Processes and the changes take effect immediately (count as two items)
Table : Facilitate change factors
Rating Description 0 None of the above. 1 Any one of the above. 2 Any two of the above. 3 Any three of the above. 4 Any four of the above. 5 All five of the above
Table :- Facilitate change All the above GSC are rated from 0-5.Then VAF is calculated from the equation below:-
VAF = 0.65 + ((sum of all GSC factor)/100).
Note: - GSC has not been accepted in software industry widely. Many
software companies use Unadjusted Function point rather than adjusted.
ISO has also removed GSC from its books and only kept unadjusted
function points as the base for measurement. Read GSC acceptance in
software industry Rating Tables for All elements of Function Points
Below shown are look up tables which will be referred during counting.
EI Rating Table
Data Elements FTR 1to 4 5 to 15 Greater than 15 Less than 2 3 3 4

Equal to 2 3 4 6 Greater than 2 4 4 6
Table :- EI rating table
This table says that in any EI (External Input), if your DET count (Data Element) and FTR (File Type Reference) exceed these limits, then this should be the FP (Function Point). Example, if your DET (data element) exceeds >15 and FTR (File Type Reference) is greater than 2, then the Function Point count is 6. The rest down tables also show the same things. These tables will be there before us when we are doing function point count. The best is put these values in Excel with formulae so that you have to only put quantity in the appropriate section and you get the final value. Note :- We have provided a excel template for estimation. You can also
see the video of how to use the estimation sheet which will automate
your estimation to a great extent.
EO Rating Table Data Elements FTR 1 to 5 6 to 19
Greater than 19
Less than 2 4 4 5 2 or 3 4 5 7 Greater than 2 5 7 7
Table :- EO rating table
EQ Rating Table Data Elements FTR 1 to 5 6 to 19 Greater than 19 Less than 2 3 3 4 2 or 3 3 4 6 Greater than 2 4 6 6
Table :- EQ rating table
ILF Rating Table Data Elements RET 1 to 19 20 to 50 51 or more 1 RET 7 7 10 2 to 5 7 10 15 Greater than 6 10 15 15 EIF Rating Table RET 1 to 19 20 to 50 51 or more
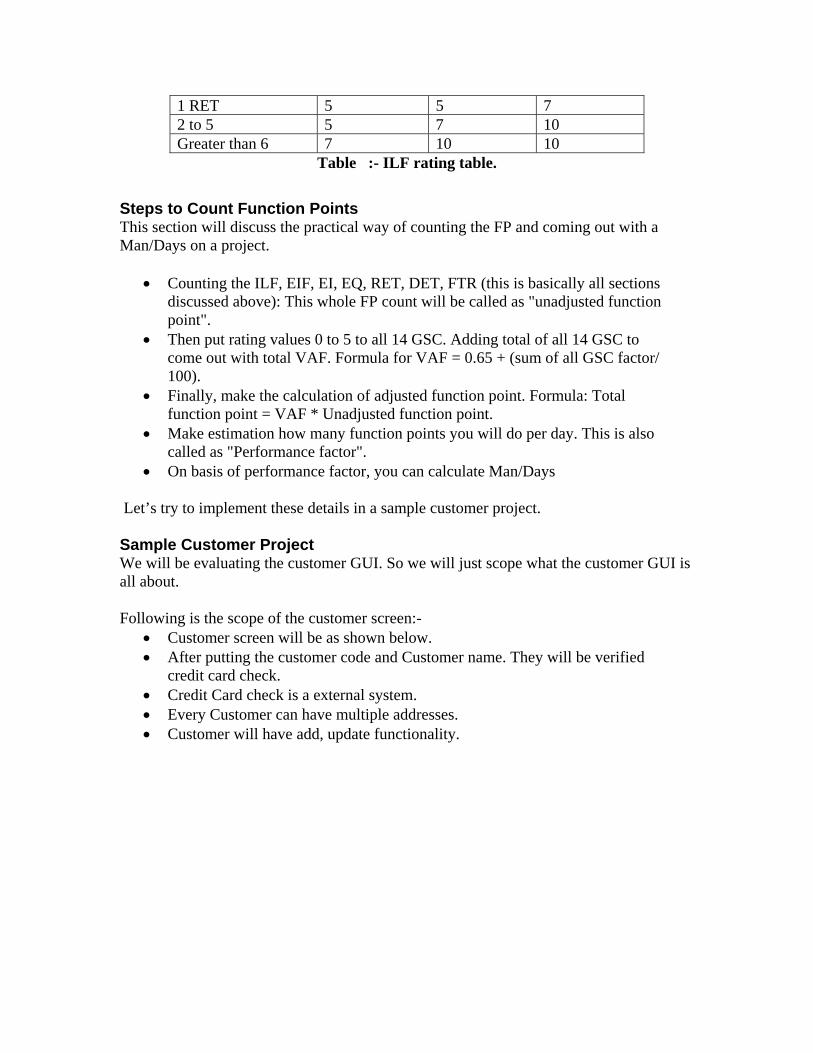
1 RET 5 5 7 2 to 5 5 7 10 Greater than 6 7 10 10
Table :- ILF rating table. Steps to Count Function Points This section will discuss the practical way of counting the FP and coming out with a Man/Days on a project.
• Counting the ILF, EIF, EI, EQ, RET, DET, FTR (this is basically all sections discussed above): This whole FP count will be called as "unadjusted function point".
• Then put rating values 0 to 5 to all 14 GSC. Adding total of all 14 GSC to come out with total VAF. Formula for VAF = 0.65 + (sum of all GSC factor/ 100).
• Finally, make the calculation of adjusted function point. Formula: Total function point = VAF * Unadjusted function point.
• Make estimation how many function points you will do per day. This is also called as "Performance factor".
• On basis of performance factor, you can calculate Man/Days
Let’s try to implement these details in a sample customer project. Sample Customer Project We will be evaluating the customer GUI. So we will just scope what the customer GUI is all about. Following is the scope of the customer screen:-
• Customer screen will be as shown below. • After putting the customer code and Customer name. They will be verified credit card check. • Credit Card check is a external system. • Every Customer can have multiple addresses. • Customer will have add, update functionality.

Figure:- 1.22 Custom screen
There is one ILF in the above screen: • The customer ILF.
There is one EIF in the above form.
• Credit Card System Following the ILF counting rules
• ILF are logically related data from user point of view. Customer and Customer addresses belong logically to customer category.
• ILF reside in Internal Application boundary and are maintained through Elementary process of application. Customer resides in inside application boundary as we have full access over it. So hence goes the counting below for ILF ILF Customer Description Number of DET Number of RET There are total 9 DETs, all add and update buttons, even the credit check button, the address list box, check box active, all text boxes. There is only one RET, the customer addresses.
9 1
So according to the above ILF ranking table
Total function 7
Table :- ILF for the customer

EIF lie outside the application boundary. EI Credit Card Information Number of DET Number of RET Description The credit card information referenced is EIF. Note this file is only referenced for credit card check. There's only one textbox credit card number and hence one DET is put in the side column. And RET 0.Looking at the above rating table the total FP is 5.
1
1
So according to the above ranking table Total function 5
Table :- EI for the customer Following EIF rules define in the previous sections:
• It’s a dynamic elementary process [For definition see “Dynamic and Static Elementary Process” Section] in which data is received from external Application boundary. Customer detail is received from external boundary that is customer input screen.
• EI may maintain ILF of the application, but it’s not compulsory rule. In this sample project Customer ILF is maintained.
• So there are two EI one for Add and one from update. It is two because processing logic for add and update is different. EI Add Customer Number of DET Number of FTR Description There are total 9 DETs, all add and update buttons, even the credit check button, the address list box, check box active, all text boxes. There are 3 FTRs, one is the address and the second is the credit card information and third is customer himself.
9
3
So according to the above ranking table Total function 6
Table :- EI for the add customer
EI Update Customer Description Number of DET Number of RET
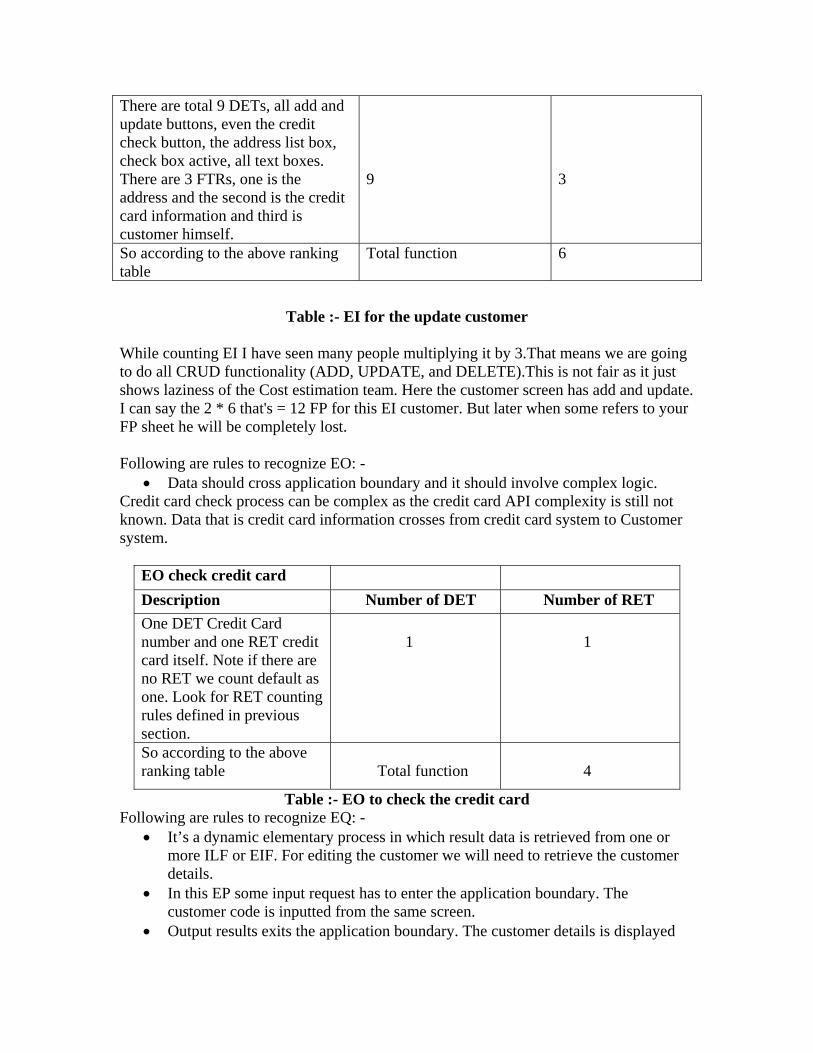
There are total 9 DETs, all add and update buttons, even the credit check button, the address list box, check box active, all text boxes. There are 3 FTRs, one is the address and the second is the credit card information and third is customer himself.
9
3
So according to the above ranking table
Total function 6
Table :- EI for the update customer
While counting EI I have seen many people multiplying it by 3.That means we are going to do all CRUD functionality (ADD, UPDATE, and DELETE).This is not fair as it just shows laziness of the Cost estimation team. Here the customer screen has add and update. I can say the 2 * 6 that's = 12 FP for this EI customer. But later when some refers to your FP sheet he will be completely lost. Following are rules to recognize EO: -
• Data should cross application boundary and it should involve complex logic. Credit card check process can be complex as the credit card API complexity is still not known. Data that is credit card information crosses from credit card system to Customer system.
EO check credit card Description Number of DET Number of RET One DET Credit Card number and one RET credit card itself. Note if there are no RET we count default as one. Look for RET counting rules defined in previous section.
1
1
So according to the above ranking table
Total function
4
Table :- EO to check the credit card Following are rules to recognize EQ: -
• It’s a dynamic elementary process in which result data is retrieved from one or more ILF or EIF. For editing the customer we will need to retrieve the customer details.
• In this EP some input request has to enter the application boundary. The customer code is inputted from the same screen.
• Output results exits the application boundary. The customer details is displayed
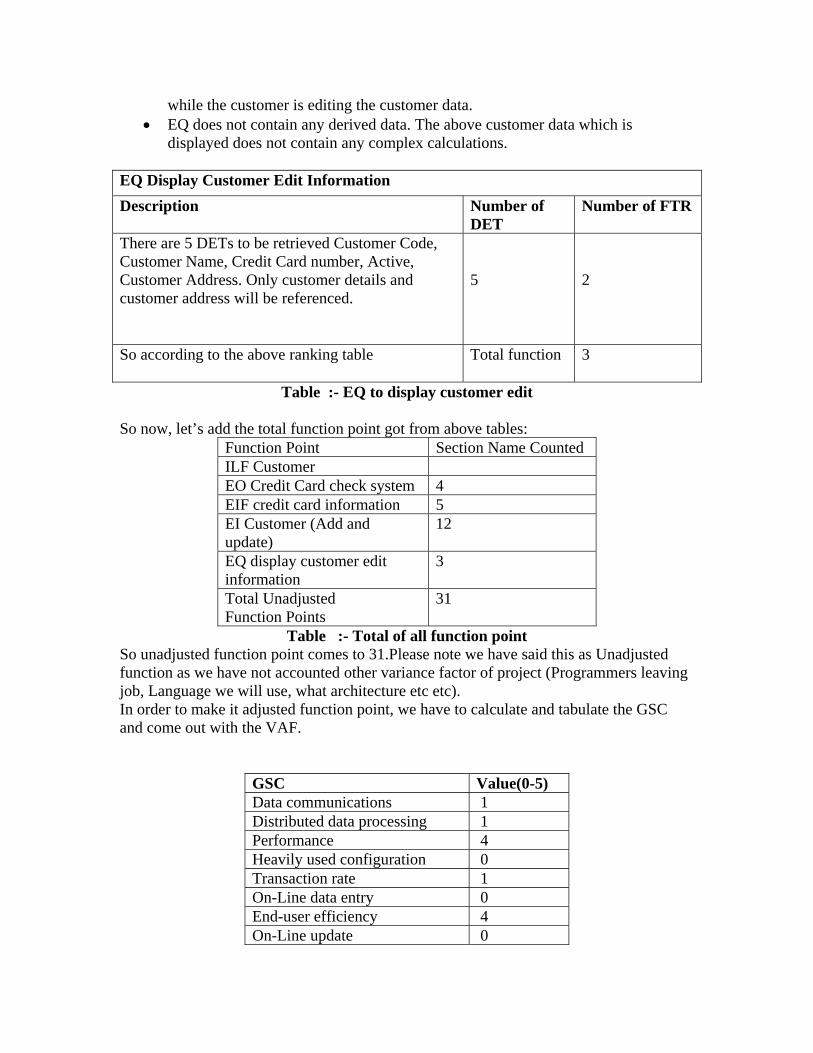
while the customer is editing the customer data. • EQ does not contain any derived data. The above customer data which is
displayed does not contain any complex calculations. EQ Display Customer Edit Information Description Number of
DET Number of FTR
There are 5 DETs to be retrieved Customer Code, Customer Name, Credit Card number, Active, Customer Address. Only customer details and customer address will be referenced.
5
2
So according to the above ranking table
Total function 3
Table :- EQ to display customer edit
So now, let’s add the total function point got from above tables: Function Point Section Name Counted ILF Customer EO Credit Card check system 4 EIF credit card information 5 EI Customer (Add and update)
12
EQ display customer edit information
3
Total Unadjusted Function Points
31
Table :- Total of all function point So unadjusted function point comes to 31.Please note we have said this as Unadjusted function as we have not accounted other variance factor of project (Programmers leaving job, Language we will use, what architecture etc etc). In order to make it adjusted function point, we have to calculate and tabulate the GSC and come out with the VAF.
GSC Value(0-5) Data communications 1 Distributed data processing 1 Performance 4 Heavily used configuration 0 Transaction rate 1 On-Line data entry 0 End-user efficiency 4 On-Line update 0

Complex processing 0 Reusability 3 Installation ease 4 Operational ease 4 Multiple sites 0 Facilitate change 0 Total 22
Table :- GSC VAF = 0.65 + ((sum of all GSC factor)/100). = 0.65 + (22/100) = 0.87. This factor affects the whole FP like anything, be very particular with this factor. So now, Calculating the Adjusted FP = VAF * Total unadjusted FP = 0.87 * 31 = 26.97 = rounded to 27 FP. Now we know that the complete FP for the customer GUI is 27 FP. Now calculating the Efficiency factor, we say that we will complete 3 FP per day that is 9 working days. So, the whole customer GUI is of 9 working days (Note do not consider Saturday and Sundays in this). I know upper manager people will say make it 7 FP per day and over load the programmer. That’s why programmer works at night. Considering SDLC (System Development Life Cycle) Before reading this section please refers to different SDLC cycles in previous chapters. The main intention of introducing this section is because estimations are heavily affected by which software life cycle you follow. Because deliverables change according to SLDC model the project manager chooses for the project. Example for waterfall model we will have Requirement documents, Design documents, Source code and testing plans. But for Prototyping models in addition to the documents above we will also need to deliver the Rough prototype. For build and fix model we will not deliver any of the documents and the only document delivered will be source code. So according to SDLC model deliverables change and hence the quotation. We will divide the estimation across requirement, design, implementation (coding) and testing .In what way the estimation has to divide across all deliverables is all up to the project manager and his plans.
Phase Percentage distribution effort Requirements 10% of total effort Design Phase 20% of total effort Coding Total effort given by
unadjusted FP Testing 10% of total effort
Table :- Phase wise distribution of effort The above sample is total 100 % distribution of effort across various phases. But as said it up to the project manager to change according to scenarios.Ok now from the above function point estimation the estimation is 9 days let’s try to divide it across all phases.

Phase
Percentage distribution effort
Distribution of man/ days across phases
Requirements
10 % of total effort
0.9 days
Design Phase
20 % of total effort
1.8 days
Coding
100 % as given by the unadjusted FP
9 Days
Testing
10 % of total effort 0.9 days
Total 12.6 Days
Table :- Phase wise effort distribution of man days The above table shows the division of project man/days across project. One of the important point to note is the estimation derived from unadjusted FP is 9 days and percentage of that man days is distributed across the total SDLC cycle. But for execution we have taken the 100 % of the man days derived from unadjusted FP. Any estimation technology (COCOMO, Use case points , FP , SMC) gives you total estimation of execution and not for other activities like documentation etc. So we have allocated total man days derived from unadjusted FP in coding and then percentage of it is distributed across other phases. Now let’s put down the final quotation. Just a small comment about test cases. Total number of Test Cases = (Function Point) raised to power of 1.2.This is as suggested from caper Jones. Number of Acceptance Test Cases = 1.2 * Function Points
20-25 % of total effort can be allocated to testing phase. Test cases are non-deterministic. That means if test passes it takes “X” amount of time and if it does not then to amend it take “Y” amount of time etc etc. Final Estimation One programmer will sit on the project with around 1000 $ salary / Month. So his 12.6 days salary comes to 290 dollars approx. The upper quotation format is in its simplest format. Every company has his quotation format accordingly. So no hard and fast rule of quotation template. But still if interested http://www.microsoft.com/mac/resources/ templates.aspx?pid=templates has good collection of decent templates.
XYZ SOFTWARE COMPANY

To: TNC Limited, Western road 17, California. Quotation number: 90 Date: 1/1/2004 Customer ID: Z- 20090DATAENTRY Quantity Description Discount Taxable Total 1 Customer Project 0% 0% 466 dollars Quotation Valid for 100 days Goods delivery date with in 25 days of half payment Quotation Prepared by: - XYZ estimation department Approved by :- SPEG department XYZ.
Table – Final bill CustomerSampleFP.xls is provided with the CD which has all estimation details which you can refer for practical approach. Note: - In this book we have shipped a complete book “How to prepare
software Quotation”. This free E-book basically explains in detail
manner other estimation technology widely used in projects.
GSC Acceptance in Software industry GSC factors have been always a controversial topic. Most of the software companies do not use GSC, rather than they base line UAFP or construct there own table depending on company project history. ISO has also adopted function point as unit of measurement, but they also use UAFP rather than AFP. Let’s do a small experiment to view relationship between FP, AFP, GSC and VAF. In this experiment we will assume UAFP = 120 and then lot graph with GSC increment of five. So the formulae is VAF = 0.65 + (GS/100). Here’s the table with every five incremental values in formulae and plot.
FP GSC 78 0 84 5 90 10 96 15 102 20 108 25 114 30 120 35 126 40 132 45 138 50 144 55 150 60 156 65

162 70
Table :- GSC acceptance
Figure 1.23:- FP versus VAF
The following are the observation from the table and plot:- • Graph is linear. It also captures that nature of complexity is linear. • If the GSC value is zero then VAF is 0.65. So the graph starts from
UAFP*0.65.GSC = 35 AFP = UAFP. So the VAF = 1. • When GSC < 35 then AFP < UAFP. That means complexity decreases. • When GSC > 35 then AFP > UAFP. That means complexity increases.
Readers must be wondering why 0.65? There are fourteen GSC factor from zero to five. So the maximum value of VAF = 0.65 + (70/100) = 1.35. In order that VAF does not have any affect i.e. UAFP = FP VAF should be one. VAF will be one when GSC is 35 i.e. half of 70. So in order to complete value “1” value “0.65” is taken. Note value is 0.35 when GSC is 35 to complete the one factor “0.65” is required. But following is the main problem related to GSC. GSC is applied throughout FP even when some GSC does not apply to whole function points. Here’s the example to demonstrate GSC problem.

Let’s take 11th GSC factor “installation ease”. The project is of 100 UAFP and there is no consideration of installation previously by client so the 11th factor is zero.
GSC with installation ease with ZERO GSC Value(0-5) Data communications 1 Distributed data processing 1 Performance 4 Heavily used configuration 0 Transaction rate 1 On-Line data entry 0 End-user efficiency 4 On-Line update 0 Complex processing 0 Reusability 3 Installation ease 0 Operational ease 4 Multiple sites 0 Facilitate change 0 Total 18
Table : GSC with installation ease zero
VAF = 0.65 + (18/100) = 0.83. So the FP = 100 * 0.83 = 83 Function Points. But later the client demanded for full blown installation for the project with auto updating when new version is released. So we change out GSC table with installation ease to 5. GSC with installation eases “5”
GSC with installation ease with FIVE GSC Value(0-5) Data communications 1 Distributed data processing 1 Performance 4 Heavily used configuration 0 Transaction rate 1 On-Line data entry 0 End-user efficiency 4 On-Line update 0 Complex processing 0 Reusability 3 Installation ease 5 Operational ease 4 Multiple sites 0 Facilitate change 0 Total 23

Table :- GSC with Installation ease 5
So VAF = 0.65 + (23/100) = 0.88 so the FP = 100 * 0.88 = 88. The difference is of only 5 FP which from no way a proper effort estimate. To make an auto updation for a software versioning can no way be done in 5 function points , just think downloading new version, deleting the old version , updating any database structure changes etc etc. So that’s the reason GSC is not accepted in software industry. Best ways is baseline you’re UAFP and make your estimation on base of UAFP. Enhancement Function Points Major software project fail not because of programmer’s or project managers but due to moody and changing customers. In one of our huge projects we had good programmers, very enthusiastic. The project started of well but customer called ten times in a day to change something or other. Believe me programmers get pissed if the customer is changing his plans every fortnight. Well from this book point of view we have to evaluate this changes which can be addition or deletion of requirements. Function point group has come out with a methodology called as “Enhancement Function Points”. Down is the formulae Formulae of EFP (Enhanced Function Points) = (ADD + CHGA) * VAFA +
(DELFP) * VAFB
ADD: - This is new function points added. This value is achieved by counting all new EP (Elementary process) given in change request. CHGA: - Function points which are affected due to CR. This value is achieved by counting all DET, FTR, ILF, EI, EO and EQ which are affected. Do not count elements which are not affected. VAFA: - This is VAF factor which is because of CR. Example previously the application was desktop and now is changed to web so the GSC factor is affected. DELFP: - When CR is for removing some functionality this value is counted. It’s rare that customer removes functionalities (at least in India), but if they ever estimator has to take note of it by counting the deleted elementary process. VAFB: - Again removal affects Value added factor. Once we are through with calculating enhanced function points, it time to count total Function points of the application.

Total Function points = [UFPB + ADD + CHGA] – [CHGB – DELFP]
UFPB: - Function points previously counted before enhancement. ADD: - Newly added functionality which leads to new function points after enhancements. CHGA: - Changed function points counted after enhancements. CHGB: - Changed function points before enhancements. DELFP: - Deleted function points. Enhancement function points is not covered from practical angle in this book and is left to the user’s as exercise. CR (Change request) is covered in more detail in Change request chapter.
Function point template explanation In order to use FP in our project in easy fashion we will be using function point excel template to automate our estimation. In both Jobsite and chat application you can find the estimation sheet. When you open the sheet you can see the below section as shown in figure below. Total Estimation has the full consolidation of the estimation.ILF, EIF, EO, EQ, EI and GSC serves as an entry sheet for all the necessary inputs.
Figure 1.25 :- Different sections in FP template
The main Action takes place in total estimation sheet. Below is the image snippet which shows the various sections in the total estimation sheet. Let’s try to understand in numbered fashion what exactly the sheet means:- 1 - These columns are pulled from individual ILF, EIF, EI, EO and EQ sheets. 2 - This column (Unadjusted function points) is the total of ILF, EIF, EO, EQ and EI. 3 - GSC is the total of all GSC section from the GSC sheet. 4 - Based on GSC we get the total adjusted function points. Please refer the function point chapter in case you have doubts regarding what is EI, EO, EQ etc. We also input how much FP a programmer can complete in one day. This depends on what kind of
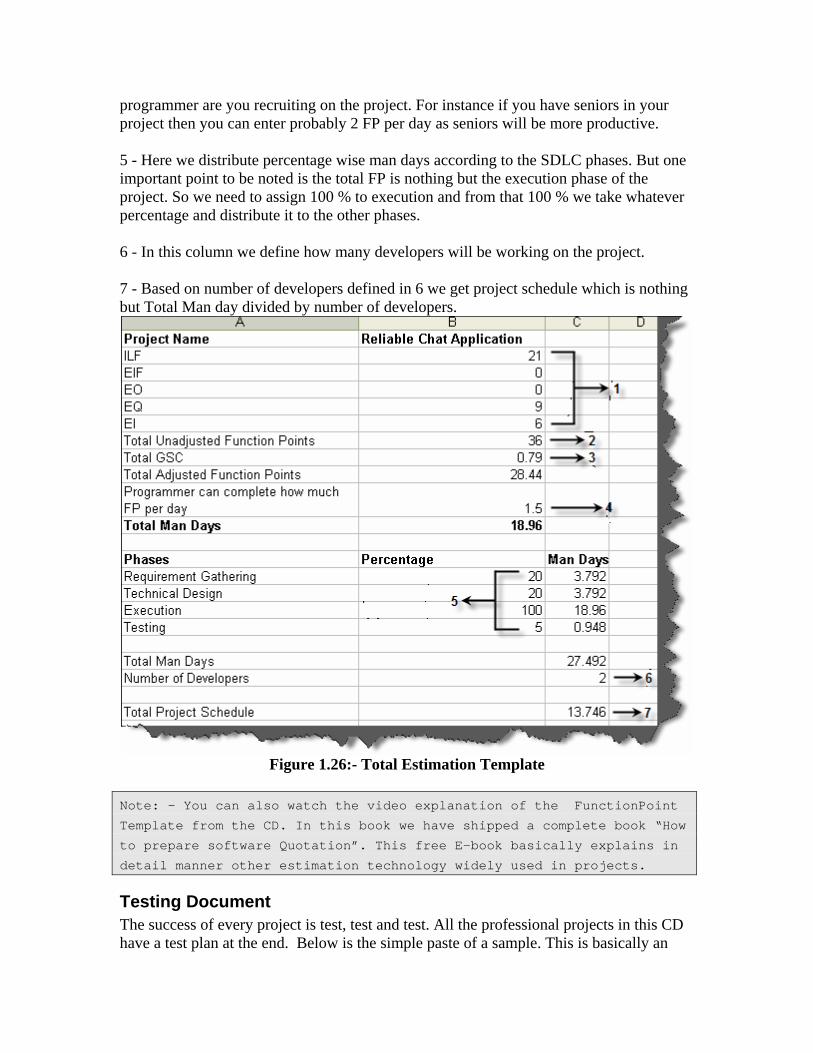
programmer are you recruiting on the project. For instance if you have seniors in your project then you can enter probably 2 FP per day as seniors will be more productive. 5 - Here we distribute percentage wise man days according to the SDLC phases. But one important point to be noted is the total FP is nothing but the execution phase of the project. So we need to assign 100 % to execution and from that 100 % we take whatever percentage and distribute it to the other phases. 6 - In this column we define how many developers will be working on the project. 7 - Based on number of developers defined in 6 we get project schedule which is nothing but Total Man day divided by number of developers.
Figure 1.26:- Total Estimation Template
Note: - You can also watch the video explanation of the FunctionPoint
Template from the CD. In this book we have shipped a complete book “How
to prepare software Quotation”. This free E-book basically explains in
detail manner other estimation technology widely used in projects.
Testing Document The success of every project is test, test and test. All the professional projects in this CD have a test plan at the end. Below is the simple paste of a sample. This is basically an
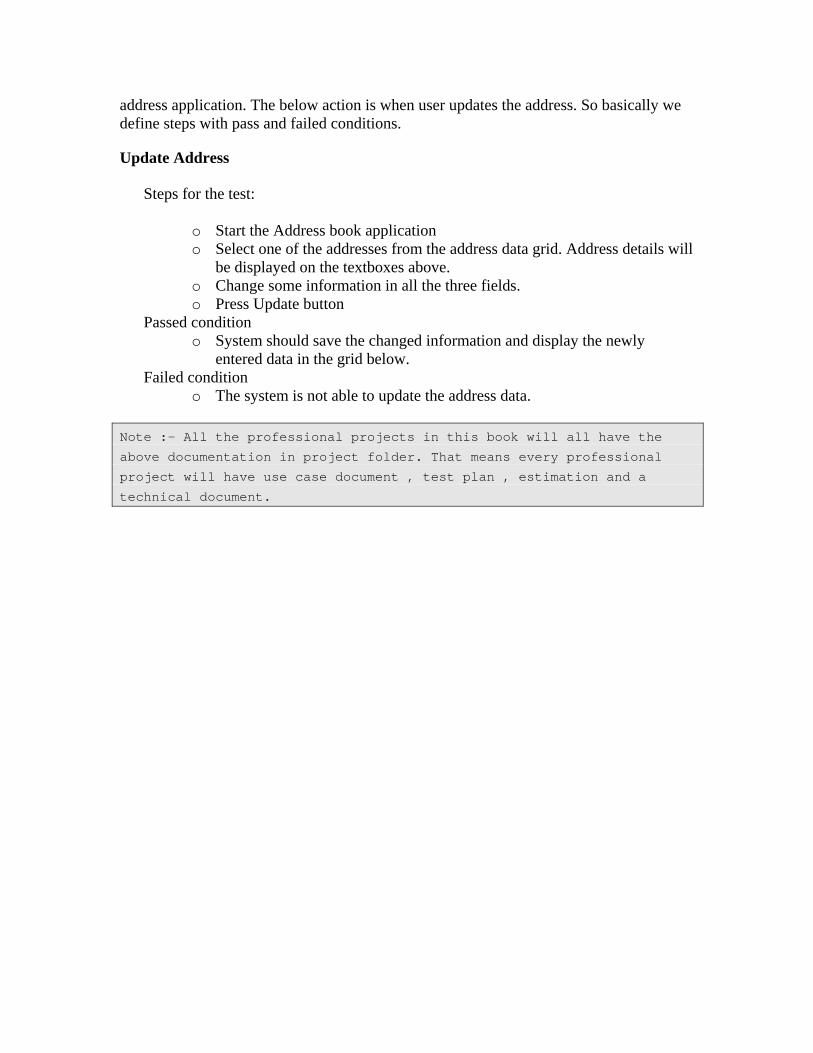
address application. The below action is when user updates the address. So basically we define steps with pass and failed conditions.
Update Address
Steps for the test:
o Start the Address book application o Select one of the addresses from the address data grid. Address details will
be displayed on the textboxes above. o Change some information in all the three fields. o Press Update button
Passed condition o System should save the changed information and display the newly
entered data in the grid below. Failed condition
o The system is not able to update the address data.
Note :- All the professional projects in this book will all have the
above documentation in project folder. That means every professional
project will have use case document , test plan , estimation and a
technical document.