c ‑a rc‑ explosions
TRANSCRIPT
Vol.:(0123456789)1 3
International Journal of Advanced Structural Engineering (2018) 10:421–437 https://doi.org/10.1007/s40091-018-0206-0
ORIGINAL RESEARCH
Coupled vs uncoupled analysis of one‑way RC‑slabs under nearby air explosions
Alireza Rasouli1 · Hamid Toopchi‑Nezhad1
Received: 24 April 2017 / Accepted: 1 November 2018 / Published online: 14 November 2018 © The Author(s) 2018
AbstractThe numerical techniques used for blast analysis of structures are categorized in “coupled” and “uncoupled” analysis methods. In a coupled analysis, the fluid–structure interaction is taken into account. Such analysis, although more accurate, is often complex and time consuming. In an “uncoupled” analysis, the blast loads are estimated by empirical equations and then applied to the structure in a separate analysis. Such an analysis is more cost effective, and of more interest for most practical design applications. The main objective of this study is to assess the efficiency of the empirical graphs prescribed by the UFC Code for uncoupled analysis of structures under the nearby air explosions of scaled distances between 0.4 and 0.7 kg/m1/3. The main characteristic of such explosions is the highly nonuniform distribution of blast-reflected pressure on the surface of structure. A method has been developed by the authors to address this nonuniform distribution in the uncoupled analysis. To examine the accuracy of analysis, the response values and the pattern of damages introduced on several reinforced concrete slabs under blast loads are compared with the results of a corresponding coupled analysis, and experimental observations. The uncoupled analysis described in this paper can be reasonably employed in the blast analysis and design of many structures.
Keywords Uncoupled analysis · Coupled analysis · Fluid–structure interaction · Nearby air explosions · Blast loads · Reinforced concrete slabs
Introduction
Detonation of a high-explosive material results in a very rapid release of energy which often produces a significant light, heat, sound, and impulsive wave. The impulsive wave (i.e., a highly compressed spherical air that spreads outward from the source of explosion) may lead to catastrophic fail-ure or progressive collapse and fragmentation. The numeri-cal blast analysis of structures is categorized in “coupled” and “uncoupled” analysis methods. In a “coupled” analysis, the fluid–structure interaction (FSI) is taken into account. In fact, in addition to the structure itself, the finite-element model includes the explosive material (charge) and the air surrounding the structure in the analysis. The blast wave propagation and the structural response are coupled in such
analysis. Therefore, it is required to account for interac-tion between the fluid (as a Eulerian material) and the solid domains in the finite-element analysis (Winget 2003). This requirement adds to the sophistications and cost of analysis. Alternatively, an “uncoupled” analysis may be employed in the response simulation of structures to blast loads as a more cost-effective analysis method. In an “uncoupled” analysis, the blast loads are evaluated with the aid of empiri-cal equations and then applied separately on the structure. In fact, the fluid–structure interaction is eliminated in such analysis. An uncoupled analysis may be carried out in a static or a dynamic analysis approach. However, a coupled analysis is always a dynamic analysis. AUTODYN (2014) and LS-DYNA (Hollquist 2012) are two explicit dynamic finite-element software packages that have been successfully employed in both coupled and uncoupled blast response analysis of structures by many scholars.
A large number of research studies can be found in the literature, where in the response behavior of structures to blast loads or the impact of high-speed projectiles have been evaluated using the software packages mentioned in the pre-vious paragraph. Given the focus of this paper, the recent
* Hamid Toopchi-Nezhad [email protected]; [email protected]
Alireza Rasouli [email protected]
1 Department of Civil Engineering, Razi University, Kermanshah 67149-67346, Iran
422 International Journal of Advanced Structural Engineering (2018) 10:421–437
1 3
studies relevant to the blast response of reinforced concrete (RC) slabs are reviewed as follows.
Zhou and Hao (2009) simulated the failure patterns induced in RC-slabs by contact detonations. Tai et al. (2011) examined the influence of the reinforcement ratio on the deflection and damage pattern of concrete slabs subjected to explosions of various charge weights. The dynamic response including the deflection and damages induced in RC-slabs to air explosions have been investigated by Kong et al. (2018), Yao et al. (2016), Zhao and Chen (2013), Wang et al. (2013), and Wei et al. (2007). Tham (2005) simulated the response of a RC-slab to the impact of a projectile, and concluded that the damage patterns at both sides of the slab were in good agreement with experimental observations. Nam et al. (2010) investigated the dynamic response of RC-slabs ret-rofitted by GFRP sheets through an experimental study that was followed by numerical simulation of the response. Li and Hao (2014) simulated the damages introduced in RC-slabs and RC-columns by explosives of various charge weights. Thiagarajan et al. (2015) investigated experimen-tally the central deflection and damages occurred in doubly reinforced concrete slabs using a shock tube to simulate the blast pressure. Dragos and Wu (2014) studied the interac-tion of direct shear and flexural deformations in the RC-slabs under blast loads. Xu et al. (2014) employed MATLAB (1996) to study the direct shear failure mode of RC-slabs under blast loads. Low and Hao (2002) studied numerically the shear and flexural failure modes of RC-slabs under blast loads. Koneshwaran et al. (2015) investigated the surface blast waves effect on tunnels buried under soil using two ALE and SPH numerical techniques. The response behav-ior of RC-slabs under blast loads has also been investigated by performing an uncoupled dynamic analysis on an SDOF model of the slab (Maazoun et al. 2018; Dragos and Wu 2014; Xu et al. 2014; Low and Hao 2002; Jones et al. 2009).
The response of structures in the research studies mentioned above has been either simulated by a coupled dynamic analysis (Zhao et al. 2018; Iannitti et al. 2018; Zhou and Hao 2009; Tai et al. 2011; Zhao and Chen 2013; Wang et al. 2013; Tham 2005; Koneshwaran et al. 2015) or an uncoupled dynamic analysis method (Yang et al. 2018; Wei et al. 2007; Nam et al. 2010; Li and Hao 2014; Thiagarajan et al. 2015). A coupled analysis usually leads to more accu-rate results; however, it is significantly more expensive and time consuming as compared to uncoupled analysis methods (Winget 2003). In the design of a structure to resist blast loads, it is not normally critical to control serviceability-related criteria such as deflection, crack width, and vibra-tion. The primary design objective is to prevent catastrophic structural failure and hazardous fragmentations (Razaqpur et al. 2007). As such, uncoupled analysis methods are pre-ferred in most design applications due to their lower com-putational complexity (UFC 2008). However, the accuracy
of these methods may be highly affected by the flexibility of the target structure, the scaled distance, Z, of explosion, and the empirical equations that are used to evaluate both the magnitude of blast positive reflected pressure and the duration of the positive phase of blast pressure (UFC 2008).
The main objective of this paper is to examine the effec-tiveness of the uncoupled analysis method that is specified by the UFC Code (2008) in response analysis of RC-slabs under nearby air explosions with scaled distance values of 0.4 ≤ Z ≤ 0.7 kg/m1/3. Under such relatively small Z values, the distribution of blast-reflected pressure on the surface of structure will be highly nonuniform. A simplified approach is developed by the authors to account for this nonuniform distribution in the uncoupled analysis. The efficiency of the proposed simplified approach in improving the accuracy of the uncoupled analysis method prescribed by the UFC Code (2008) is examined through comparing the analysis results with the results of a corresponding coupled analysis, as well as previous experimental observations. The following sec-tion briefly introduces the RC-slabs that are investigated in this study.
Experimental study
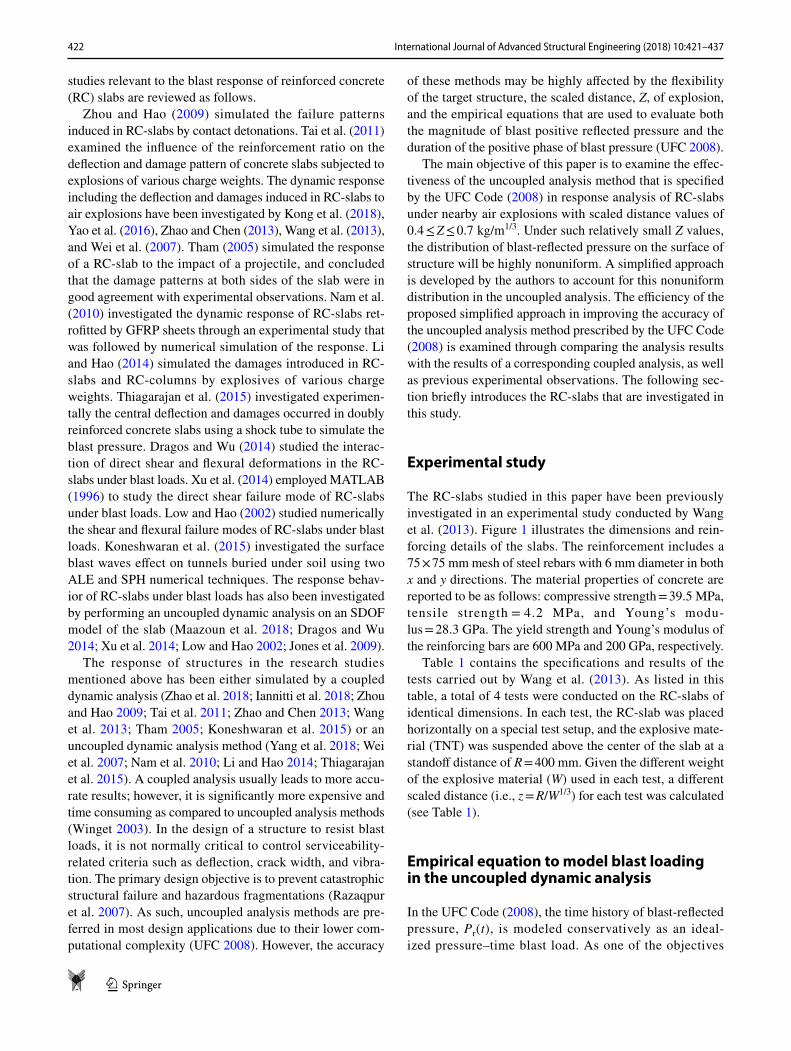
The RC-slabs studied in this paper have been previously investigated in an experimental study conducted by Wang et al. (2013). Figure 1 illustrates the dimensions and rein-forcing details of the slabs. The reinforcement includes a 75 × 75 mm mesh of steel rebars with 6 mm diameter in both x and y directions. The material properties of concrete are reported to be as follows: compressive strength = 39.5 MPa, tensile strength = 4.2 MPa, and Young’s modu-lus = 28.3 GPa. The yield strength and Young’s modulus of the reinforcing bars are 600 MPa and 200 GPa, respectively.
Table 1 contains the specifications and results of the tests carried out by Wang et al. (2013). As listed in this table, a total of 4 tests were conducted on the RC-slabs of identical dimensions. In each test, the RC-slab was placed horizontally on a special test setup, and the explosive mate-rial (TNT) was suspended above the center of the slab at a standoff distance of R = 400 mm. Given the different weight of the explosive material (W) used in each test, a different scaled distance (i.e., z = R/W1/3) for each test was calculated (see Table 1).
Empirical equation to model blast loading in the uncoupled dynamic analysis
In the UFC Code (2008), the time history of blast-reflected pressure, Pr(t), is modeled conservatively as an ideal-ized pressure–time blast load. As one of the objectives
423International Journal of Advanced Structural Engineering (2018) 10:421–437
1 3
of current study is to compare the results of the uncou-pled analysis with a corresponding coupled FSI analy-sis method, the time history of reflected pressure that is applied on the surface of the target structure is modeled using Eq. (1) as a more accurate equation (Friedlander 1946):
where parameters Pr� , td , and tA in Eq. (1) indicate the peak reflected pressure at an angle of incidence, α, the positive phase duration of blast pressure, and the time of arrival of blast wave, respectively. The coefficient b is a decay param-eter defined as (Kinney and Graham 1985):
Equation (2) provides a reliable prediction for the decay parameter of blast loads (Wei et al. 2007). For a bulk of TNT material of weight W located at a standoff distance of R from the target structure, the value of parameters Pr� , td , and tA can be obtained using the UFC Code (2008).
(1)Pr(t) = Pr�
(1 −
t − tA
td
)e
−b(t−tA)td ,
(2)b = 0.3306Z4 − 3.1838Z3 + 11.755Z2 − 20.308Z + 15.12
For Z < 3.0m/kg1∕3.
Finite‑element modeling of RC‑slabs
This section deals with FE modeling of the experimental tests, as listed in Table 1. The response behavior of the RC-slabs to blast loads is simulated by both uncoupled and coupled finite-element (FE) dynamic analysis methods. The ANSYS AUTODYN software (2014) as an explicit non-linear finite-element program has been used for FE modeling of the RC-slabs. To examine the accuracy of FE analysis, the damage pattern and residual deflection at the center of the RC-slabs are simulated by the FE model and then compared with the experimental observations. The following subsections provide further details relevant to the FE modeling of the slabs.
Distribution of reflected pressure on the surface of specimens
Uncoupled analysis
In an uncoupled analysis, the reflected pressure on the slab is simulated by empirical methods. When a rigid slab is
Fig. 1 Geometry and the reinforcement of RC-slab test specimen (L = 1000 mm, h = 40 mm, d = 28 mm)
Table 1 Experimental program (Wang et al. 2013)
a RC-slabs in all tests are identical
Testa Explosive mass (kg)
Scaled distance (m
kg1∕3
) Central deflec-tion � (mm)
�∕h Spall radius (mm)
Damage level
NRC-1 0.2 0.684 10 0.250 – LowNRC-2 0.31 0.591 15 0.375 90 ModerateNRC-3 0.46 0.518 35 0.875 120 ModerateNRC-4 0.55 0.488 – – 150 High
424 International Journal of Advanced Structural Engineering (2018) 10:421–437
1 3
subjected to an explosion with a scaled distance value, Z, of greater than 3 m/kg1/3, one may assume a uniform distribution for the reflected pressure across the surface of slab (Wu et al. 2009). However, this assumption may not be reasonable for Z < 3 m/kg1/3.
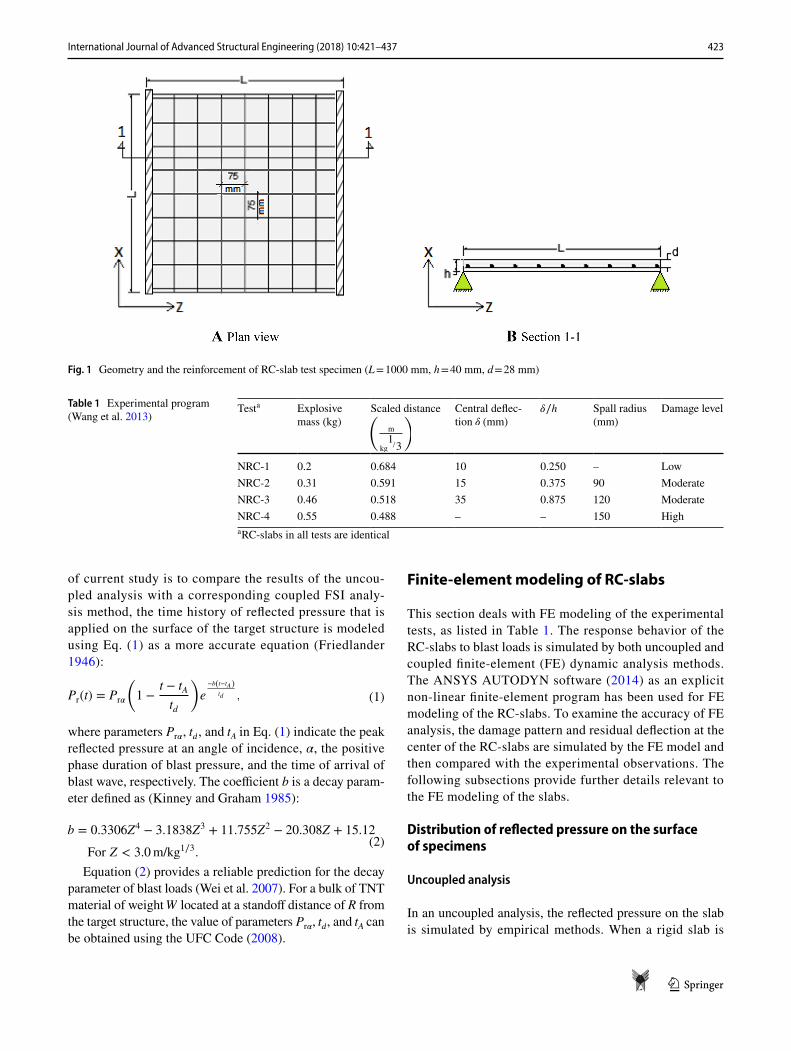
A simplified method is developed to simulate the nonu-niform distribution of the reflected pressure across the sur-face of a RC-slab. In the proposed method, the surface of slab is discretized into a set of square area segments of limited dimensions, as shown in Fig. 2. Next, a series of concentric arc circles are plotted such to intersect the area segments of the slab. The angle of incidence, �i , and the scaled distance, Zi, of each area segment i, are calculated using Eqs. (3) and (4), respectively:
where d represents the dimension of the area segment, and j is the order of the arc circle that intersects the area segment of interest. Parameters RA and Ri are the standoff distances of the explosive material from the center of slab and the area segment i, respectively. W is the total weight of explosive material.
Having the scaled distance ZA (where ZA= RA/W1/3), and the angle of incidence, �i , evaluated for the area segment i,
(3)�i = tan−1
⎛⎜⎜⎜⎝
�d(2j−1)
2
�
RA
⎞⎟⎟⎟⎠
(4)Zi =Ri
W1∕3
=
√R2A+[d(2j−1)
2
]2
W1∕3
,
the peak reflected pressure at the given angle of incidence, and Pr� can be evaluated using the graphs provided by the UFC Code (2008). Furthermore, for any area segment i of scaled distance Zi, the time duration of positive phase of blast pressure, td , and the time of arrival of the blast wave, tA, can be evaluated by the UFC Code (2008). The decay param-eter for any area segment i may be calculated using Eq. (2). Finally, the reflected pressure of the blast that is experienced by the area segment i is calculated using Eq. (1). On the basis of a sensitivity analysis carried out by Rasouli (2015), the area segments are selected to be squares of 75 × 75 mm in this paper.
Coupled analysis
A coupled analysis accounts for the nonuniform pressure distribution of blast loading in the analysis. Due to sym-metry, only a quarter of the RC-slab, the explosive mate-rial, and the ambient air between the two are modeled in the finite-element (FE) analysis. In addition, the ambient air at the backward of concrete slab has been included in the finite-element model. The thickness of ambient air at the backward of the concrete slab is approximately twice of the maximum deflection expected to be experienced by the slab. This is to ensure that the deflected slab remains within the domain of the finite-element model. Figure 3 shows the 3D finite-element model of a quarter of the RC-slab in Test NRC-1, and the contour of air pressure at an early stage (approxi-mately 0.4 ms) after detonation of the explosive material. As shown in this figure, the distribution of reflected pressure on the slab is nonuniform, as the fluid structure interaction is taken into account in the analysis.
Material model for concrete
Strength and failure model
Under blast loads, the mechanical properties of concrete will be significantly altered due to the high straining (loading) rate of material. Thus, it is quite essential to use a constitu-tive material model that addresses the high strain rate effects. The FE models presented in this paper employ the Riedel, Hiermaier and Thoma (RHT) (1999) dynamic damage model for the concrete material. The RHT model addresses various response mechanisms that are found in brittle materials. These include pressure and strain hardening, strain rate effects, third invariant dependence for compressive and tensile meridians, strain softening, and cumulative damage. The RHT model employs three strength surfaces which are: an elastic limit surface, a failure surface, and the remaining strength surface for the crushed material (Riedel et al. 1999). Figure 4 shows the strength surfaces of the model.
Fig. 2 Discretization of a ¼ of the RC-slab (L = 1000 mm, t = 40 mm, and d = 75 mm (into area segments to simulate nonuniform blast-reflected pressure

425International Journal of Advanced Structural Engineering (2018) 10:421–437
1 3
The failure surface Y is defined as a function of pressure P, the load angle θ, and strain rate ἐ:
where Y(p) = fc
[A(P∗ − P∗
spallFRate(
,�))N
] , with fc being the
compressive strength. Parameter A is a failure surface con-stant, N is a failure surface exponent, and P∗ is the pressure value normalized by fc , and P∗
spall= P∗(fc∕ft) . In addition,
FRate(,�) is a function that accounts for the strain rates. The
parameter R(�) defines the third invariant dependency of the model as a function of the second and third stress invariants and a meridian ratio Q2 . The elastic limit surface is scaled from the failure surface:
(5)Yf = Y(p) ⋅ R(�) ⋅ FRate(,�),
(6)Ye = Yf ⋅ Fe. ⋅ FCAP(p),
where Fe is the ratio of the elastic strength to failure surface strength. FCAP(p) is a function that limits the elastic deviatoric stresses under hydrostatic compression, varying within the range of (0, 1) for pressure between initial compaction and solid compaction pressures. A residual (frictional) failure surface is defined as
where B is the residual failure surface constant, and M is the residual failure surface exponent. Following the hardening phase, additional plastic straining of the material results in damage and strength reduction. Damage is accumulated by
(7)Y∗residual
= B ⋅ P∗M ,
(8)D =∑ Δ�p
�failurep
=∑ Δ�p
D1(P∗ − P∗
spall)D2
,
Fig. 3 Finite-element modeling of a ¼ of the RC-slab in Test NRC-1; a propagation of reflected pressure on the slab surface; b shockwave propagation in the air
Fig. 4 Strength surfaces defined for concrete material in the RHT model
426 International Journal of Advanced Structural Engineering (2018) 10:421–437
1 3
where D1 and D2 are damage constants. The post-damage failure surface is then interpolated by
and the post-damage shear modulus is interpolated via
where Ginitial , Gresidual , and Gfracture are shear moduli.The strength and failure parameters adopted in this paper
are as follows (AUTODYN 2014; Tu and Lu 2009): the ref-erence density, � = 2.75 g/cm3; shear modulus, G = 11.79 GPa; compressive strength, fc = 39.5 MPa; tensile strength, ft = 4.2 MPa; failure surface constant, A = 1.6; fail-ure surface exponent, N = 0.61; meridian ratio, Q = 0.6805; the fractured strength constant, B = 1.6; the fractured strength exponent, M = 0.61; damage constants, D1 = 0.04, and D2 = 1, �min
f = 0.008; and residual shear modulus fraction
is 0.13.
Equation of state
Concrete has a complex non-linear compression behavior because of its large-scale heterogeneity and a porosity of typically 10%. For this reason, the porous Equation of State (EOS) proposed by Herrmann (1969) is well adapted to capture the major macroscopic phenomena of concrete. In Herrmann’s p − � model, the parameter � , which indicates the porosity of the material, is defined as
where � is the specific volume of the porous material and �s is the specific volume of the material in the solid state at the same pressure and temperature. The magnitude of �s is equal to 1/�s at zero pressure, where �s is the solid density of material which is the density at zero pressure of a fully compacted solid. The magnitude of � becomes unity when the material compacts to a solid. The compaction path, � (p, e), represents the volumetric stiffness of the porous material between initial compaction pressure pe and the fully com-pacted pressure ps as follows (Herrmann 1969):
In Eq. (12), �p is the porosity corresponding to the initial plastic yield, as shown in Fig. 5a, p is current pressure, and n is the compaction exponent, which can be 2 or 3 to allow for more flexibility to fit experimental data. In the present study, n is assumed to be 3. The solid EOS used here is polynomial, which has different analytic forms for states of compression and tension. The pressure is determined by compression after full compaction �̄� and specific internal
(9)Y∗fracture
= (1 − D)Y∗failure
+ DY∗residual
(10)Gfracture = (1 − D)Ginitial + DGresidual,
(11)� =�
�s,
(12)� = 1 + (�p − 1)
[ps − p
ps − pe
]n.
energy e. The full compaction is defined as �̄� = 𝜌∕𝜌s − 1 , where � is density, and �s is density at zero pressure and is related to full compaction (as shown in Fig. 5). For �̄� > 0 , the material is under compression, and
For �̄� < 0 , the material is under tension, and
Table 2 includes the default values of parameters used by AUTODYN (2014) for the equation of state (EOS) of concrete. These values are utilized in the FE modeling of the concrete slabs of this study.
Material model for reinforcing steel
This study employs the Johnson and Cook Material Model (1983) as a commonly used model to simulate the mechani-cal behavior of steel material by taking into account the influences of strain amplitude and rate, and temperature effects. The yield stress in Johnson and Cook Model (1983) is defined as follows:
where A represents the basic yield stress at low strains, B and n account for the effect of strain hardening, �p is an effective plastic strain. The second bracket in Eq. (15) represents the
(13)p = A1�̄� + A2�̄�2 + A3�̄�
3 + (B0 + B1�̄�)𝜌se.
(14)p = T1�̄� + T2�̄�2 + B0𝜌se.
(15)𝜎 =[A + B ⋅ 𝜀n
p
][1 + C ln
�̇�p
�̇�0
][1 − Tm
H
],
Fig. 5 Porous equation of state

427International Journal of Advanced Structural Engineering (2018) 10:421–437
1 3
effect of strain rate. C is a material constant, the ratio of �̇�p�̇�0
represents the normalized effective plastic strain rate for �0 = 1 s−1, the third bracket in Eq. (15) represents the effect of temperature, and TH (the homologous temperature) is defined as (T − Troom)∕(Tmelt − Troom) , where T is the abso-lute temperature, Troom is room temperature, and Tmelt is melt-ing temperature of steel. Parameter m in Eq. (15) is a mate-rial constant. The material constants adopted in current paper are as follows (AUTODYN 2014):reference density, �= 7.83 g/cm3; bulk modulus, K = 167 GPa; reference room temperature, Troom = 300 K; specific heat = 477 J/kg K; Ther-mal conductivity = 0.00 J/kg K; shear modulus, G = 76.92 GPa; basic yield stress, A = 600 MPa; strain hard-ening constants, B = 510 MPa, strain hardening exponent, n = 0.26; strain rate constant, C = 0.014; thermal softening exponent, m = 1.03; and melting temperature, Tmelt = 1793 K.
Material model for air and high explosive
In a coupled FSI analysis, in addition to the structure (i.e., the reinforced concrete slab), the explosive material and its ambient air are simulated in the FE model. In the FE model developed in this paper, the air is treated as an ideal gas that can be modeled by a linear polynomial equation of state (EOS) and a linear internal energy. The relationship between pressure and energy developed in the air can be expressed as follows:
where e is the specific internal energy, � is the ratio of current density to the reference density, and � = � − 1 . The parameters Ci (i = 0–6) are constant coefficients. The
(16)P = C0 + C1� + C2�
2 + C3�3 + (C4 + C5� + C6�
2)e,
constant coefficients in the EOS of an ideal gas are as fol-lows: C0 = C1 = C2 = C3 = C6 = 0 , and C4 = C5 = � − 1 , where � is the polytropic ratio of the specific heat. The pres-sure that is developed in the air is then given by AUTODYN (2014)
where � is a constant representing the ratio of specific heat, and � represents the ratio of current density to the reference density. e is the specific internal energy, with the gamma law EOS under standard atmospheric pressure. The authors have employed the default values recommended by the material library of AUTODYN (2014) for the parameters � and � . These values are as follows: � = 1.4, and ρ = 1.225 kg/m3. In addition, the initial internal energy of the air is assumed to be 2.068E5 kJ/kg.
The high-explosive material (TNT) in a coupled FSI analysis is typically modeled using the Jones–Wilkins–Lee (JWL) equation of state (EOS). In the JWL EOS model, the hydrostatic pressure, P, that is generated by the chemical energy of an explosion is defined as follows (AUTODYN 2014):
In Eq. (18), V and e are the specific volume and specific internal energy of the explosive, respectively. Parameters A, B, R1, R2, and � are the constant coefficients that can be evaluated experimentally for any high-explosive material. The numerical values of the constant coefficients of Eq. (18) for many conventional explosive materials are available in AUTODYN (2014). For a TNT explosive charge, the cor-responding values of A, B, R1, R2, and � are 3.7377E5 MPa,
(17)P = (� − 1)�e,
(18)P = A
(1 −
�
R1V
)e−R1V + B
(1 −
�
R2V
)e−R2V +
�E
V.
Table 2 Parameters of the equation of state (EOS) for concrete (AUTODYN 2014)
P-alpha EOS parameters
Parameter Value
Porous density, �0
2.314 (g/cm3)Porous sound speed, C0 2.92E3 (m s−1)Initial compaction pressure, Pe 23.3E3 (kPa)Solid compaction pressure, Ps 6E6 (kPa)Compaction exponent 3.00
Polynomial EOS parameters
Parameter Value Parameter Value
Bulk modulus, A1 3.527E7 (kPa) T1 3.527E7 (kPa)A2 3.958E7 (kPa) T2 0.00A3 9.04E6 (kPa) Reference temperature 300 (K)B0 1.22 Specific heat 654 (J/kg K)B1 1.22 Thermal conductivity 0.00 (J/mKs)

428 International Journal of Advanced Structural Engineering (2018) 10:421–437
1 3
4.15, 3.747E3 MPa, 0.9, and 0.35, respectively (AUTODYN 2014).
Finite‑element modeling
For the uncoupled analysis runs of this research study, the loading effects of the explosive material on the slab are sim-ulated using empirical equations, as described in “Empirical equation to model blast loading in the uncoupled dynamic analysis”. Furthermore, only a quarter of the concrete slab is modeled due to symmetry. In the coupled FSI dynamic analysis carried out in this paper, in addition to the the con-crete slab, the explosive material, and an appropriate volume of the air that encompasses the slab and explosive material are also taken into account in the finite-element model (see Fig. 6). Again, due to symmetry, only a quarter of the slab and explosive material are modeled. It should be noted that the RC-slabs in both analysis types share the same material properties.
In the finite-element model, a Lagrangian solver is used for the concrete slab, whereas the air and explosive mate-rial are modeled using an Eulerian solver. In a Lagrangian solver, the finite-element mesh is updated during analysis, if the finite elements are highly distorted. The Euler (multi-material) solver utilizes a fixed mesh, allowing materials to flow from one element to the next. An Euler–Lagrange inter-face is required to model the fluid–structure interaction (FSI) in the finite-element model of the coupled FSI analysis. It is worth to note that the Lagrange subgrid imposes a geometric constraint on the Euler subgrid, whereas the Euler subgrid provides with a pressure boundary on the Lagrange subgrid.
In this research study, an “outflow” boundary condition is considered for the Euler subgrid. To simulate the bound-ary conditions of the slab, all of the translational degrees of freedoms for the nodes located on the edges of the slab are restrained.
In the model created in AUTODYN (2014), the rein-forcing bars are discretized by beam elements of 12.5 mm length. Table 3 includes the residual deflection of the con-crete slabs that are calculated by three different uncoupled finite-element analysis runs that simulate the Test NRC-1 (Table 1). The error values indicate the deviation of the analysis results from the experimental data. According to Table 3, the accuracy of analysis is significantly improved when the concrete material is modeled with finite elements of 6.25 × 6.25 × 5 mm3. However, this level of accuracy is achieved at the expense of a significant increase in the analy-sis runtime as compared to the case, where finite elements of 12.5 × 12.5 × 5 mm3 are utilized in the model. In the analysis runs carried out in this paper, with a compromise between time and accuracy, the concrete material is desensitized by finite elements of 12.5 × 12.5 × 5 mm3. In the coupled FSI analysis runs, the air and explosive are modeled using finite elements of 6.25 × 6.25 × 10 mm3 dimensions.
The finite-element model simulates the serious damages imposed on concrete slab by the explosion using the “ero-sion technique” available in AUTODYN (2014). The ero-sion technique is a numerical method that eliminates the degenerated elements, or those elements that cause the time step to be reduced below a minimum required value. Erosion criteria can be defined based on a minimum time step size, material or strain failure. The eroded element can optionally
Fig. 6 Three-dimensional finite-element model used for coupled FSI analysis runs

429International Journal of Advanced Structural Engineering (2018) 10:421–437
1 3
be retained in the model as a point mass. This will enable more accurate momentum conservation and potential load-ing from the eroded nodes (AUTODYN 2014). It should be noted that the erosion technique must be utilized when damages are significant. For instance, this technique can be utilized to simulate the significant spalling that may occur at the bottom face of the slab. The erosion technique is not effective when damages are minor (AUTODYN 2014). The formation of minor cracks on the surface of slab is an exam-ple of minor damages.
Analysis results and discussion
This section reviews the analysis results obtained for the uncoupled as well as the coupled finite-element models of the tests, as listed in Table 1. The analysis results of interest include the peak value of positive reflected pressure, dura-tion of positive phase of blast pressure, pattern of damages introduced into the slabs, and the central deflection at the RC-slabs.
Peak pressure and the duration of positive phase of blast wave
The dynamic response of a structure is highly affected by the impulse of the blast wave. The area under the blast time–pressure diagram represents the impulse. As such, in this section, the magnitude of positive peak pressure and the time duration of the positive phase of blast pressure that is evaluated by the coupled and uncoupled analysis methods are examined.
Table 4 includes the magnitude of positive peak incident and reflected pressure evaluated at the center of the top face of concrete slabs. As seen in this table, in all cases, a good correlation exists between the peak pressure values evalu-ated by the coupled and uncoupled analysis methods. The results of uncoupled analysis are slightly overestimated as compared with those of the coupled analysis.
Time history of positive incident pressure evaluated by the coupled analysis method for each slab is shown in Fig. 7a. The incident pressure represents the blast pressure in the air right above the center of slab. A comparison between
the time duration of positive pressure evaluated by the UFC code (as an uncoupled analysis method) and the coupled FSI method for each test (RC-slabs) is provided in Fig. 7b. As shown in this figure, the method employed by the UFC Code underestimates the time duration of positive pressure in all of the analysis cases (tests). The maximum difference exists for the Test NRC-2, where the time duration of the UFC code is calculated to be approximately 11% lower than that of coupled analysis.
Damage pattern and mid‑deflection of the slab
Figures 8, 9, 10, 11, 12, 13, 14 and 15 indicate the dam-ages occurred at the top and bottom faces of the concrete slabs. Figure “a” shows the sketch of observed damage on the face of the slabs in the experimental tests. Results of uncoupled and coupled analysis runs are shown in Figs. “b” and “c”, respectively. The values of residual deflection and the approximate radius of concrete spall at the center of the slabs are cited in Table 5. The accuracy of coupled and uncoupled analysis models can be examined by comparing the magnitudes of errors, as listed in this table.
Figures 8 and 9 show the damages introduced in the slab in test NRC-1, where 0.2 kg TNT charge was detonated at a standoff distance of 0.4 m from the center of the slab. The scaled distance of explosion in this test is calculated to be 0.684 m/kg1/3. According to Fig. 8a, only few minor cracks were observed at the central region of the slab in the experimental test. No significant damage was found on the other regions of the slab. Figure 8b, c shows the results
Table 3 Influence of the size of finite elements on the accuracy of analysis for the slab employed in Test NRC-1
Number of elements to model concrete
Size of elements (mm3) Analysis error (residual deflec-tion of the slab center) (%)
Normal-ized analysis runtime
3200 25 × 25 × 5 − 27.73 0.4412,800 12.5 × 12.5 × 5 − 7.20 1.0051,200 6.25 × 6.25 × 5 − 5.33 6.27
Table 4 Comparison of positive peak pressure evaluated by various analysis methods
Slab Analysis method
Uncoupled Coupled
Incident pres-sure (MPa)
Reflected pressure (MPa)
Incident pres-sure (MPa)
Reflected pressure (MPa)
NRC-1 2.33 14.79 2.28 14.67NRC-2 3.19 22.28 3.07 22.06NRC-3 4.01 31.11 3.93 30.92NRC-4 4.47 35.56 4.31 35.33
430 International Journal of Advanced Structural Engineering (2018) 10:421–437
1 3
of coupled and uncoupled analysis models, where minor damages are predicted by both models at central region of the slab. According to Table 5, in test NRC-1, the residual deflections predicted by the coupled and uncoupled analy-sis models are approximately 4.6% and 6.4% smaller than the experimental test data, respectively.
A close examination of Fig. 8a–c indicates that the level of damage at the supported edges of slab has been overes-timated by the numerical models. It should be noted that in the finite-element models, the slab supports are considered
to be fully restrained. It is postulated that an ideal fully restrained boundary condition was not achieved for the slab in the experimental test.
Figure 9a indicates the damages introduced on the bottom face of the slab in test NRC-1. The damage pattern includes the formation of a few cracks of approximately 5 mm width at the center of slab. These cracks have been propagated toward the free edges of the slab. In addition, some minor damages are observed at the center of slab. Figure 9b shows the damages simulated by the uncoupled analysis. Damages
Fig. 7 Blast loading parameters; a time history of incident pressure evaluated by the coupled FSI analysis; b comparisons between the time dura-tion of positive pressure estimated by the UFC Code and the coupled FSI analysis
Fig. 8 Test NRC-1, damage on the upper side of the slab; a sketch of experimental observation (Wang et al. 2013); b uncoupled analysis; c cou-pled analysis

431International Journal of Advanced Structural Engineering (2018) 10:421–437
1 3
include the minor cracks that are distributed at a relatively broader surface of the slab. In addition, the level of damage at the center of slab is more intensive as compared with the other areas of slab. The damage pattern predicted by the coupled analysis is shown in Fig. 9c. As shown in this figure, consistent with the experimental observation, the coupled analysis has simulated the longitudinal crack at the center of slab. In addition, the corners of slab in the coupled analysis have experienced more damages than uncoupled analysis.
Figures 10 and 11 indicate that the damages occurred in the slab after the detonation of 0.31 kg TNT charge in test NRC-2. Figure 10a shows the damages observed on the top face of slab, which include a spall localized at the
center of slab, a series of longitudinal cracks parallel to the supported edges of slab, and some circular and radial cracks, as shown in Fig. 10a. The damage pattern simu-lated by the uncoupled analysis is shown in Fig. 10b. As shown in this figure, the damages are mainly localized on the central region of slab. In addition, the corners of slab to some extent have experienced damage. The dam-ages predicted by coupled analysis are in better agreement with the experimental observation. The longitudinal and circular cracks predicted by the coupled analysis on the top face are similar to the cracks observed in the experimental study (compare Fig. 10a–c). The uncoupled analysis is not as effective as the coupled analysis in damage prediction of
Fig. 9 Test NRC-1, damage on the bottom face of the slab; a sketch of experimental observation (Wang et al. 2013); b uncoupled analysis; and c coupled analysis
Fig. 10 Test NRC-2, damage on the upper side of the slab; a sketch of experimental observation (Wang et al. 2013); b uncoupled analysis; and c coupled analysis
432 International Journal of Advanced Structural Engineering (2018) 10:421–437
1 3
the concrete slab. Although the radial and circular cracks are to some extent simulated by the uncoupled analysis, the longitudinal crack that is formed at the mid-span of the slab due to the flexural deformations cannot be simu-lated effectively by this analysis. According to Table 5, the residual deflection calculated at the center of slab by the uncoupled analysis is lower than both the values calculated by the coupled analysis and experimental observation.
On the bottom face, a considerable spall area with a radius of approximately 90 mm is observed at the center of slab after the testing program (Fig. 11a). In addition, due to the significant flexural deformation of slab, several longitudinal cracks are developed at the mid-span. The
damages predicted by the uncoupled analysis (Fig. 11b) are lighter than the experimental observations. The radius of spall evaluated by this analysis is approximately 80 mm. The damage pattern predicted by the coupled analysis is shown in Fig. 11c. The radius of spall is calculated to be approximately 95 mm, which is around 5.5% greater than the experimental observation. The damages predicted by the coupled and uncoupled analysis methods are generally consistent with experimental observations in test NRC-2; however, results of coupled analysis are in better agreement with the experimental results.
Figures 12 and 13 indicate the damages introduced on top and bottom faces of slab in test NRC-3 under the explosion
Fig. 11 Test NRC-2, damage on the bottom face of the slab; a sketch of experimental observation (Wang et al. 2013); b uncoupled analysis; and c coupled analysis
Fig. 12 Test NRC-3, damage on the upper side of the slab; a sketch of experimental observation (Wang et al. 2013); b uncoupled analysis; and c coupled analysis
433International Journal of Advanced Structural Engineering (2018) 10:421–437
1 3
of 0.46 kg TNT charge. Due to the increased weight of explosive, the level of damage including the area of spall, the number of radial and circular cracks is significantly larger than the previous tests (compare Figs. 10a, 12a). Figure 12b shows the damage pattern simulated by the uncoupled analy-sis. As shown in this figure, the level of damage localized at the center of slab is smaller than the experimental observa-tions. In addition, the radius of circular cracks formed on the top face of slab is relatively larger than experimental obser-vations. The longitudinal crack at the mid-span of slab has started to develop, as shown in Fig. 12b. Figure 12c shows the simulation carried out by the coupled analysis. As shown in this figure, the damage pattern predicted by the model is in good agreement with the experimental observations, in
terms of the area of spall, the radius of circular cracks, and the formation of the longitudinal crack at the mid-span of the slab. Both models predict damage along the two oppo-site supported edges of the slab which cannot be seen in the experimental observation. As stated earlier in this paper, it is postulated that the support condition in the experimental setup has allowed some rotational flexibility as compared to the finite-element model of the slab.
Figure 13a shows the damage pattern introduced on the bottom face of the slab, where the spall area with an approxi-mate radius of 120 mm has been formed at the center of slab as a result of weak tensile strength of concrete. In addition, due to flexural deformation, a series of longitudinal cracks have propagated outward the center. The damages simulated
Fig. 13 Test NRC-3, damage on the bottom face of the slab; a sketch of experimental observation (Wang et al. 2013); b uncoupled analysis; and c coupled analysis
Fig. 14 Test NRC-4, damage on the upper side of the slab; a sketch of experimental observation (Wang et al. 2013); b uncoupled analysis; and c coupled analysis
434 International Journal of Advanced Structural Engineering (2018) 10:421–437
1 3
by the numerical models are in general in good agreement with experimental observation (compare Fig. 13a–c). The radius of spall predicted by the uncoupled analysis is approx-imately 110 mm that is 8.3% lower than the experimental observation. The radius of spall in Fig. 13c is evaluated to be approximately 130 mm that is 8.3% larger than experimental observation. The residual deflection values observed in the experimental study, and calculated by the numerical mod-els at the center of slab are cited in Table 5. According to this table, both numerical models underestimate the residual deflection. In test NRC-3, the residual deflection evaluated by the uncoupled model is approximately 8.2% off, and the value calculated by the coupled analysis is around 3.3% off.
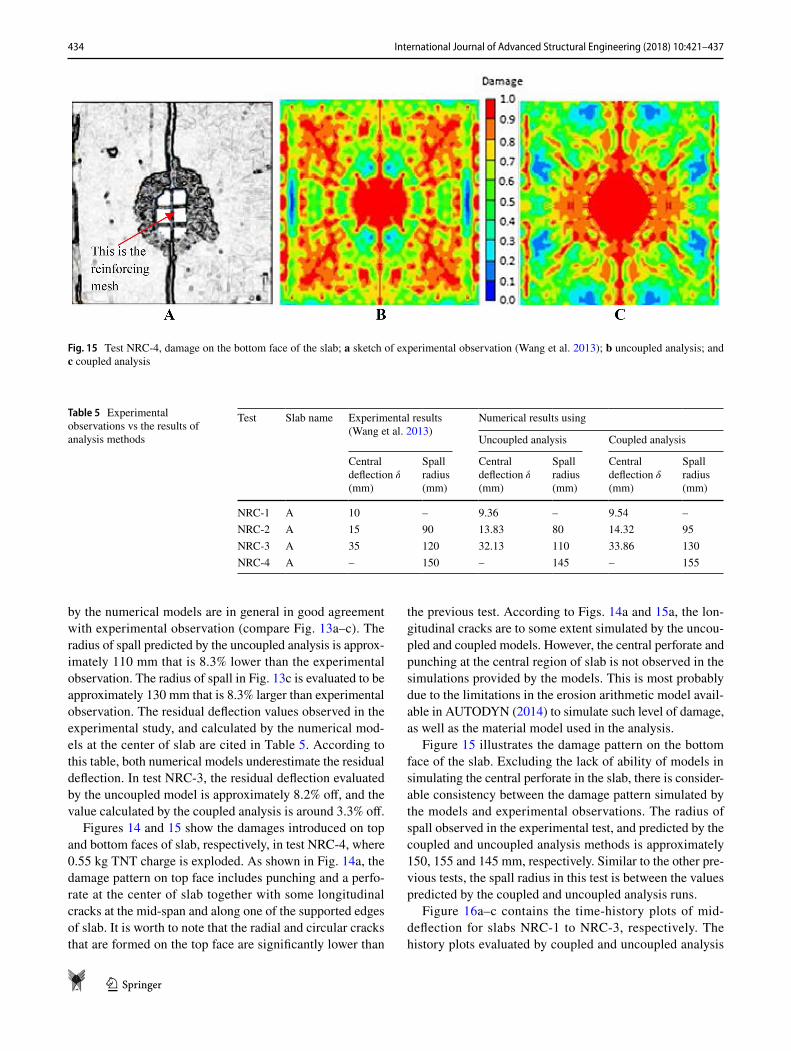
Figures 14 and 15 show the damages introduced on top and bottom faces of slab, respectively, in test NRC-4, where 0.55 kg TNT charge is exploded. As shown in Fig. 14a, the damage pattern on top face includes punching and a perfo-rate at the center of slab together with some longitudinal cracks at the mid-span and along one of the supported edges of slab. It is worth to note that the radial and circular cracks that are formed on the top face are significantly lower than
the previous test. According to Figs. 14a and 15a, the lon-gitudinal cracks are to some extent simulated by the uncou-pled and coupled models. However, the central perforate and punching at the central region of slab is not observed in the simulations provided by the models. This is most probably due to the limitations in the erosion arithmetic model avail-able in AUTODYN (2014) to simulate such level of damage, as well as the material model used in the analysis.
Figure 15 illustrates the damage pattern on the bottom face of the slab. Excluding the lack of ability of models in simulating the central perforate in the slab, there is consider-able consistency between the damage pattern simulated by the models and experimental observations. The radius of spall observed in the experimental test, and predicted by the coupled and uncoupled analysis methods is approximately 150, 155 and 145 mm, respectively. Similar to the other pre-vious tests, the spall radius in this test is between the values predicted by the coupled and uncoupled analysis runs.
Figure 16a–c contains the time-history plots of mid-deflection for slabs NRC-1 to NRC-3, respectively. The history plots evaluated by coupled and uncoupled analysis
Fig. 15 Test NRC-4, damage on the bottom face of the slab; a sketch of experimental observation (Wang et al. 2013); b uncoupled analysis; and c coupled analysis
Table 5 Experimental observations vs the results of analysis methods
Test Slab name Experimental results (Wang et al. 2013)
Numerical results using
Uncoupled analysis Coupled analysis
Central deflection � (mm)
Spall radius (mm)
Central deflection � (mm)
Spall radius (mm)
Central deflection � (mm)
Spall radius (mm)
NRC-1 A 10 – 9.36 – 9.54 –NRC-2 A 15 90 13.83 80 14.32 95NRC-3 A 35 120 32.13 110 33.86 130NRC-4 A – 150 – 145 – 155

435International Journal of Advanced Structural Engineering (2018) 10:421–437
1 3
methods can be compared in these figures. The experimen-tally evaluated residual deflections in tests NRC-1 to NRC-3 have been measured to be 10, 15, and 35 mm, respectively. The residual deflection obtained by the coupled analysis is found to be in better agreement with experimental obser-vations. A close examination of Fig. 16 indicates that the number of reciprocating cycles in the time-history plot of coupled analysis is larger than that of uncoupled analysis method. The number of reciprocating cycles is decreased with increasing weight of the explosive material, as the plas-tic deformations of slab dissipate the vibration.
Table 5 contains the radius of spall and the residual deflections of the tests, as cited in Table 1. A comparison between the experimental values, and the values obtained by the coupled and uncoupled analysis methods is pro-vided in this table. The maximum error in the evaluation of residual deflection in the coupled and uncoupled analysis methods is − 4.6% and − 8.2%, respectively. In addition, the radius of spall is calculated to be off by + 8.3% in the coupled analysis and − 11.1% in the uncoupled analysis.
According to the analysis runs conducted by the authors, application of the uncoupled analysis of UFC
Fig. 16 Time history of mid-deflection at the RC-slabs evaluated by coupled and uncoupled analysis runs; a Test NRC-1; b Test NRC-2; and c Test NRC-3
436 International Journal of Advanced Structural Engineering (2018) 10:421–437
1 3
code, using the assumption of a uniform distribution for the blast-reflected pressure, for cases, where the z values are below 3 m/kg1/3, will lead to above 25% error. As such, the nonuniform pressure distribution developed in this paper is effective in improving the accuracy of uncoupled analysis by decreasing the error values to approximately 11% by most. Nonetheless, according to Table 5, the accuracy of coupled analysis is superior to the uncoupled analysis.
Computational efforts
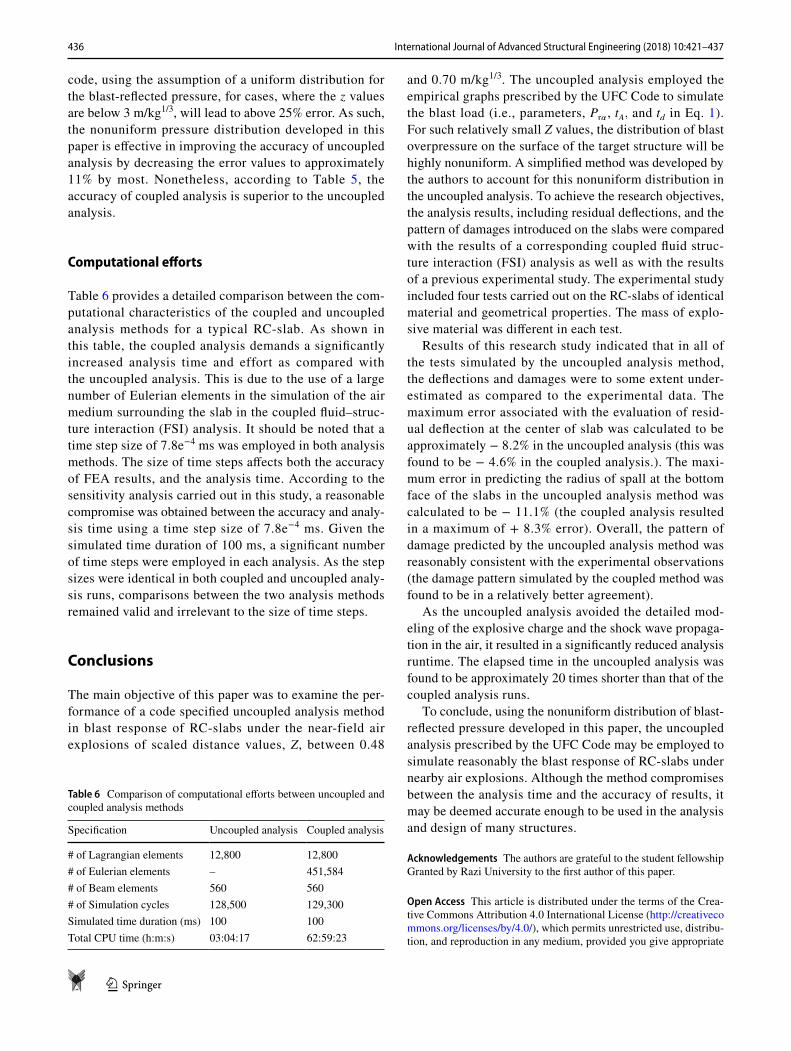
Table 6 provides a detailed comparison between the com-putational characteristics of the coupled and uncoupled analysis methods for a typical RC-slab. As shown in this table, the coupled analysis demands a significantly increased analysis time and effort as compared with the uncoupled analysis. This is due to the use of a large number of Eulerian elements in the simulation of the air medium surrounding the slab in the coupled fluid–struc-ture interaction (FSI) analysis. It should be noted that a time step size of 7.8e−4 ms was employed in both analysis methods. The size of time steps affects both the accuracy of FEA results, and the analysis time. According to the sensitivity analysis carried out in this study, a reasonable compromise was obtained between the accuracy and analy-sis time using a time step size of 7.8e−4 ms. Given the simulated time duration of 100 ms, a significant number of time steps were employed in each analysis. As the step sizes were identical in both coupled and uncoupled analy-sis runs, comparisons between the two analysis methods remained valid and irrelevant to the size of time steps.
Conclusions
The main objective of this paper was to examine the per-formance of a code specified uncoupled analysis method in blast response of RC-slabs under the near-field air explosions of scaled distance values, Z, between 0.48
and 0.70 m/kg1/3. The uncoupled analysis employed the empirical graphs prescribed by the UFC Code to simulate the blast load (i.e., parameters, Pr� , tA, and td in Eq. 1). For such relatively small Z values, the distribution of blast overpressure on the surface of the target structure will be highly nonuniform. A simplified method was developed by the authors to account for this nonuniform distribution in the uncoupled analysis. To achieve the research objectives, the analysis results, including residual deflections, and the pattern of damages introduced on the slabs were compared with the results of a corresponding coupled fluid struc-ture interaction (FSI) analysis as well as with the results of a previous experimental study. The experimental study included four tests carried out on the RC-slabs of identical material and geometrical properties. The mass of explo-sive material was different in each test.
Results of this research study indicated that in all of the tests simulated by the uncoupled analysis method, the deflections and damages were to some extent under-estimated as compared to the experimental data. The maximum error associated with the evaluation of resid-ual deflection at the center of slab was calculated to be approximately − 8.2% in the uncoupled analysis (this was found to be − 4.6% in the coupled analysis.). The maxi-mum error in predicting the radius of spall at the bottom face of the slabs in the uncoupled analysis method was calculated to be − 11.1% (the coupled analysis resulted in a maximum of + 8.3% error). Overall, the pattern of damage predicted by the uncoupled analysis method was reasonably consistent with the experimental observations (the damage pattern simulated by the coupled method was found to be in a relatively better agreement).
As the uncoupled analysis avoided the detailed mod-eling of the explosive charge and the shock wave propaga-tion in the air, it resulted in a significantly reduced analysis runtime. The elapsed time in the uncoupled analysis was found to be approximately 20 times shorter than that of the coupled analysis runs.
To conclude, using the nonuniform distribution of blast-reflected pressure developed in this paper, the uncoupled analysis prescribed by the UFC Code may be employed to simulate reasonably the blast response of RC-slabs under nearby air explosions. Although the method compromises between the analysis time and the accuracy of results, it may be deemed accurate enough to be used in the analysis and design of many structures.
Acknowledgements The authors are grateful to the student fellowship Granted by Razi University to the first author of this paper.
Open Access This article is distributed under the terms of the Crea-tive Commons Attribution 4.0 International License (http://creat iveco mmons .org/licen ses/by/4.0/), which permits unrestricted use, distribu-tion, and reproduction in any medium, provided you give appropriate
Table 6 Comparison of computational efforts between uncoupled and coupled analysis methods
Specification Uncoupled analysis Coupled analysis
# of Lagrangian elements 12,800 12,800# of Eulerian elements – 451,584# of Beam elements 560 560# of Simulation cycles 128,500 129,300Simulated time duration (ms) 100 100Total CPU time (h:m:s) 03:04:17 62:59:23

437International Journal of Advanced Structural Engineering (2018) 10:421–437
1 3
credit to the original author(s) and the source, provide a link to the Creative Commons license, and indicate if changes were made.
References
AUTODYN (2014) Theory manual. Century Dynamics Ltd, HorshamDragos J, Wu C (2014) Interaction between direct shear and flexural
responses for blast loaded one-way reinforced concrete slabs using a finite element model. Eng Struct 72:193–202
Friedlander FG (1946) The diffraction of sound pulses I. Diffraction by a semi-infinite plane. Proc R Soc Lond A 186:322–344
Herrmann W (1969) Constitutive equation for the dynamic compaction of ductile porous materials. J Appl Phys 40:2490–2499
Hollquist JO (2012) LS-DYNA keyword user’s manual. Livermore Software Technology Corporation, Livermore, pp 11–12
Iannitti G, Bonora N, Curiale G, Muro SD, Marfia S, Ruggiero A, Sacco E, Scafati S, Testa G (2018) Analysis of reinforced concrete slabs under blast loading. Proced Struct Integr 9:272–278
Johnson GR, Cook WH (1983) A constitutive model and data for met-als subjected to large strains, high strain rates and high tempera-tures. In: Proceedings of the seventh international symposium on ballistics, The Hague, The Netherlands, pp 541–548
Jones J, Wu C, Oehlers DJ, Whittaker AS, Sun W, Marks S, Coppola R (2009) Finite difference analysis of simply supported RC slabs for blast loadings. Eng Struct 31:2825–2832
Kinney GF, Graham KJ (1985) Explosive shocks in air. Springer, New York
Koneshwaran S, Thambiratnam DP, Gallage C (2015) Response of segmented bored transit tunnels to surface blast. Adv Eng Softw 89:77–89
Kong X, Qi X, Gu A, Lawan IA, Qu Y (2018) Numerical evaluation of blast resistance of RC slab strengthened with AFRP. Constr Build Mater 178:244–253
Li J, Hao H (2014) Numerical study of concrete spall damage to blast loads. Int J Impact Eng 68:41–55
Low HY, Hao H (2002) Reliability analysis of direct shear and flexural failure modes of RC slabs under explosive loading. Eng Struct 24:189–198
Maazoun A, Belkassem B, Reymen B, Matthys S, Vantomme J, Lecompte D (2018) Blast response of RC slabs with externally bonded reinforcement: experimental and analytical verification. Compos Struct 200:246–257
MATLAB (1996) Theory manual. The MathWorks, Inc, NatickNam JW, Kim HJ, Kim SB, Yi NH, Kim JHJ (2010) Numerical evalu-
ation of the retrofit effectiveness for GFRP retrofitted concrete slab subjected to blast pressure. Compos Struct 92:1212–1222
Rasouli AR (2015) The performance evaluation of RC water tanks under air-blast loads. MSc Thesis, University of Razi, Kerman-shah, Iran (in Persian)
Razaqpur AG, Tolba A, Contestabile E (2007) Blast loading response of reinforced concrete panels reinforced with externally bonded GFRP laminates. Compos B Eng 38:535–546
Riedel W, Thoma K, Hiermaier S (1999) Numerical analysis using a new macroscopic concrete model for hydro codes. In: Proceed-ings of 9th international symposium on interaction of the effects of munitions with structures, pp 315–322
Tai YS, Chu TL, Hu HT, Wu JY (2011) Dynamic response of a rein-forced concrete slab subjected to air blast load. Theor Appl Fract Mech 56:140–147
Tham CY (2005) Reinforced concrete perforation and penetra-tion simulation using AUTODYN-3D. Finite Elem Anal Des 41:1401–1410
Thiagarajan G, Kadambi AV, Robert S, Johnson CF (2015) Experimen-tal and finite element analysis of doubly reinforced concrete slabs subjected to blast loads. Int J Impact Eng 75:162–173
Tu ZG, Lu Y (2009) Evaluation of typical concrete material models used in hydro codes for high dynamic response simulations. Int J Impact Eng 36(1):32–46
UFC 3–340-02 (2008) Structures to resist the effects of accidental explosions. US Department of Defense, Washington, DC
Wang W, Zhang D, Lu F, Wang SC, Tang F (2013) Experimental study and numerical simulation of the damage mode of a square reinforced concrete slab under close-in explosion. Eng Fail Anal 27:41–51
Wei J, Quintero R, Galati N, Nanni A (2007) Failure modeling of bridge components subjected to blast loading. Int J Concr Struct Mater 1(1):19–28
Winget DG (2003) Design of critical bridges for security against ter-rorist attacks. MSc Thesis, University of Texas, Austin
Wu C, Oehlersa DJ, Rebentrostb M, Leachc J, Whittakerd AS (2009) Blast testing of ultra-high performance fiber and FRP-retrofitted concrete slabs. Eng Struct 31:2060–2069
Xu J, Wu C, Li ZX (2014) Analysis of direct shear failure mode for RC slabs under external explosive loading. Int J Impact Eng 69:136–148
Yang JQ, Smith ST, Wang Z, Lim YY (2018) Numerical simulation of FRP-strengthened RC slabs anchored with FRP anchors. Constr Build Mater 172:735–750
Yao S, Zhang D, Chen D, Lu F, Wang W (2016) Experimental and numerical study on the dynamic response of RC slabs under blast loading. Eng Fail Anal 66:120–129
Zhao CF, Chen JY (2013) Damage mechanism and mode of square reinforced concrete slab subjected to blast loading. Theor Appl Fract Mech 63–64:54–62
Zhao X, Wang G, Lu W, Yan P, Chen M, Zhou C (2018) Damage fea-tures of RC slabs subjected to air and underwater contact explo-sions. Ocean Eng 147:531–545
Zhou XQ, Hao H (2009) Mesoscale modeling and analysis of damage and fragmentation of concrete slab under contact detonation. Int J Impact Eng 36:1315–1326
Publisher’s Note Springer Nature remains neutral with regard to jurisdictional claims in published maps and institutional affiliations.