c a l i f ornia transportation concept report 180 · transportation concept report. ... 34 f....
TRANSCRIPT
CALIFORNIACIA
180
®
®
STATE ROUTE
Office of System Planning · District 6 · February 2014
TransportationTransportation ConceptConcept ReportReport


TABLE OF CONTENTS
I. Introduction ............................................................................................................. 1 A. Purpose and Need .......................................................................................... 1 B. SR 180 Background ....................................................................................... 2
II. Route Description ................................................................................................... 4 A. Route Limits................................................................................................... 4 B. Route Description .......................................................................................... 4 C. Route Function ............................................................................................... 5
1. SR 180 Segment Details ....................................................................... 13 a) Segments 1- 4: Fresno County line to Panoche Road ................... 13 b) Segments 5 - 8: Panoche Road to Brawley Avenue ..................... 14 c) Segments 9 - 12: Brawley Avenue to SR 168 .............................. 15 d) Segments 13 - 16: SR 168 to Academy Avenue ........................... 17 e) Segments 17 - 20: Academy Avenue to Clingan’s Corner ........... 18 f) Segments 21 - 24: Clingan’s Corner to the end of the route at
Kings Canyon National Park ........................................................ 19 D. The Transportation Network ........................................................................ 21
1. Goods Movement ................................................................................ 22 a) Freight Rail ................................................................................ 22 b) Rail Intermodal Facilities ........................................................... 24 c) Air Freight Service ..................................................................... 24 d) Inland Port .................................................................................. 25 e) Trucking ..................................................................................... 25
2. Mass Transportation............................................................................ 26 a) Aviation...................................................................................... 26 b) Passenger Rail ............................................................................ 27 c) High Speed Rail ......................................................................... 28 d) Transit ........................................................................................ 29 e) High-Occupancy Vehicle Lanes (HOV) .................................... 30
3. Non-Motorized Transportation ........................................................... 31 a) Bikes .......................................................................................... 32 b) Walking ...................................................................................... 32
E. Route Inventory ........................................................................................... 33 1. Traffic Volumes and Type .................................................................. 33 2. Characteristics ..................................................................................... 34
a) Park and Ride Lots ..................................................................... 34 b) Intelligent Transportation Systems (ITS) ................................... 34
F. Specific Environmental Considerations ....................................................... 44 III. Concept Rationale ................................................................................................. 45

A. Route Concept LOS: .................................................................................... 45 1. Concept Facility/Ultimate Transportation Corridor (UTC): ............... 46
IV. SR 180 Performance: Current and Future ............................................................. 48 V. Planned and Programmed Improvements to State Route 180 .............................. 49 VI. Appendices ............................................................................................................ 53 Appendix A: References ................................................................................................ 54 Appendix B: Level Of Service (LOS) ........................................................................... 55 Appendix C: Non-Motorized Facilities ......................................................................... 58 Appendix D: Intelligent Transportation Systems (ITS) ................................................. 61 Appendix E: Documents Used in the Preparation of this TCR ..................................... 65 Appendix F: Acronyms and Definitions ........................................................................ 66 Figures Figure 1 ............................................................................................................................ 1 Maps Map 1: Location Map........................................................................................................ i Map 2: Ethnographic Territories in Eight County Study Area ........................................ 3 Map 3: Segment Map ..................................................................................................... 11 Tables Table 1: Summary Chart .................................................................................................. 7 Table 2: Exixting ITS..................................................................................................... 37 Table 3: Proposed ITS ................................................................................................... 43 Table 4: Status of Facility Completion .......................................................................... 49 Table 5: Planned and Programmed Projects .................................................................. 50
LEGEND
District 6Boundary
Caltrans
Indicates Unconstructedsegments of SR 180
Madera
Kern
i
FR
ES
NO
T U L A R E
Sequoia National Park
KingsCanyonNational
Park
CALIFORNIA
41
CALIFORNIA
99
CALIFORNIA
99
CALIFORNIA
168
CALIFORNIA
145
CALIFORNIA
198 CALIFORNIA
33
CALIFORNIA
269
CALIFORNIA
198
CALIFORNIA
198
CALIFORNIA
43
CALIFORNIA
201
CALIFORNIA
245
CALIFORNIA
137
CALIFORNIA
190
CALIFORNIA
65
Madera
Kern
Kings
Tulare
CALIFORNIA
63
CALIFORNIA
33
Fresno
CALIFORNIA
180
®
®
TRANSPORTATION CONCEPT REPORTSTATE ROUTE CALIFORNIA
180L O C A T I O N M A P
MAP #1LOCATION MAP

February 2014
Page 1
Transportation Concept Report
State Route 180
I. Introduction
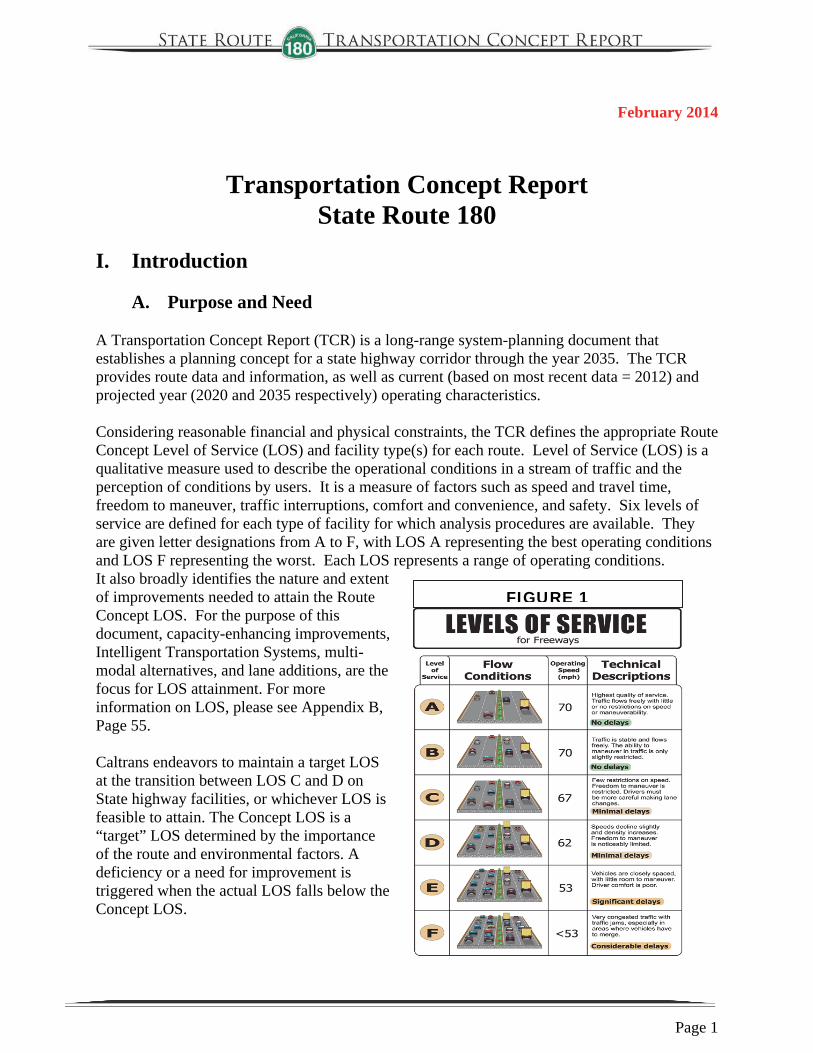
A. Purpose and Need A Transportation Concept Report (TCR) is a long-range system-planning document that establishes a planning concept for a state highway corridor through the year 2035. The TCR provides route data and information, as well as current (based on most recent data = 2012) and projected year (2020 and 2035 respectively) operating characteristics. Considering reasonable financial and physical constraints, the TCR defines the appropriate Route Concept Level of Service (LOS) and facility type(s) for each route. Level of Service (LOS) is a qualitative measure used to describe the operational conditions in a stream of traffic and the perception of conditions by users. It is a measure of factors such as speed and travel time, freedom to maneuver, traffic interruptions, comfort and convenience, and safety. Six levels of service are defined for each type of facility for which analysis procedures are available. They are given letter designations from A to F, with LOS A representing the best operating conditions and LOS F representing the worst. Each LOS represents a range of operating conditions. It also broadly identifies the nature and extent of improvements needed to attain the Route Concept LOS. For the purpose of this document, capacity-enhancing improvements, Intelligent Transportation Systems, multi-modal alternatives, and lane additions, are the focus for LOS attainment. For more information on LOS, please see Appendix B, Page 55. Caltrans endeavors to maintain a target LOS at the transition between LOS C and D on State highway facilities, or whichever LOS is feasible to attain. The Concept LOS is a “target” LOS determined by the importance of the route and environmental factors. A deficiency or a need for improvement is triggered when the actual LOS falls below the Concept LOS.
FIGURE 1

February 2014
Page 2
Operational improvements, such as intersection modifications, are discussed as interim measures. The TCR also identifies transit, the proposed High Speed Rail, and the deployment of Intelligent Transportation Systems (ITS) as integral to route corridor development. The Ultimate Transportation Corridor (UTC), as identified in this TCR, ensures that adequate right-of-way (ROW) is preserved for ultimate facility projects beyond 2035. However, the UTC does not consider funding as a constraint. Caltrans District 6 System Planning staff should be consulted for the interim right-of-way (prior to ultimate construction) for a specific location along the corridor. Please note: The number of lanes needed to meet the UTC for this route is only a guideline. Additional right-of-way may be necessary in urban and suburban areas to accommodate improved access to serve local circulation needs. The need to widen the roadway beyond the UTC may be necessary to maintain safety and the target LOS. The local jurisdictions should endeavor to maintain the target LOS, which in an urban setting could exceed the UTC number of lanes. Where the State legislature has designated the route as part of the Freeway and Expressway System, interchange and right-of-way should be part of the General Plan so as not to adversely impact future changes in land use. This document identifies the initial and conceptual planning phase that leads to subsequent programming and the project development process. Consequently, the specific nature of proposed improvements, such as roadway width, number of lanes, and access control may change in later project development stages. This TCR for State Route (SR) 180 was prepared and completed by the Caltrans District 6 System Planning unit in cooperation with local and regional agencies, in consultation with Tribal Governments and Communities, environmental justice communities, and other Caltrans functional units. As such, it will serve as a guide in cooperative planning and implementation of transportation and land use decisions. Final determinations are normally made during the project report and design phases. Therefore, a TCR is a “living document,” subject to amendments as conditions change and projects are completed. As such, the TCR will serve as a guide in cooperative planning and implementation of transportation and land use decisions. Caltrans District 6 System Planning staff will update the TCR as needed to keep the information up-to-date and relevant.
B. SR 180 Background Many California roads and highways originated along Tribal hunting and trading routes. The study, “California Central Valley Tribal Transportation Environmental Justice Collaborative Project,” identified a number of Tribes that consider portions of the counties of the Central Valley as their ancestral lands. This study was funded by a Caltrans Environmental Justice grant and was prepared for the Kern County Council of Governments (KCOG) and the Tubatulabals of Kern Valley Tribe on behalf of the eight San Joaquin Valley Metropolitan Planning Organizations (MPOs). These consist of the San Joaquin Council of Governments (SJCOG), Stanislaus Council of Governments (StanCOG), Merced County Association of Governments (MCAG), Madera County Transportation Commission (MCTC), Fresno Council of Governments

February 2014
Page 3
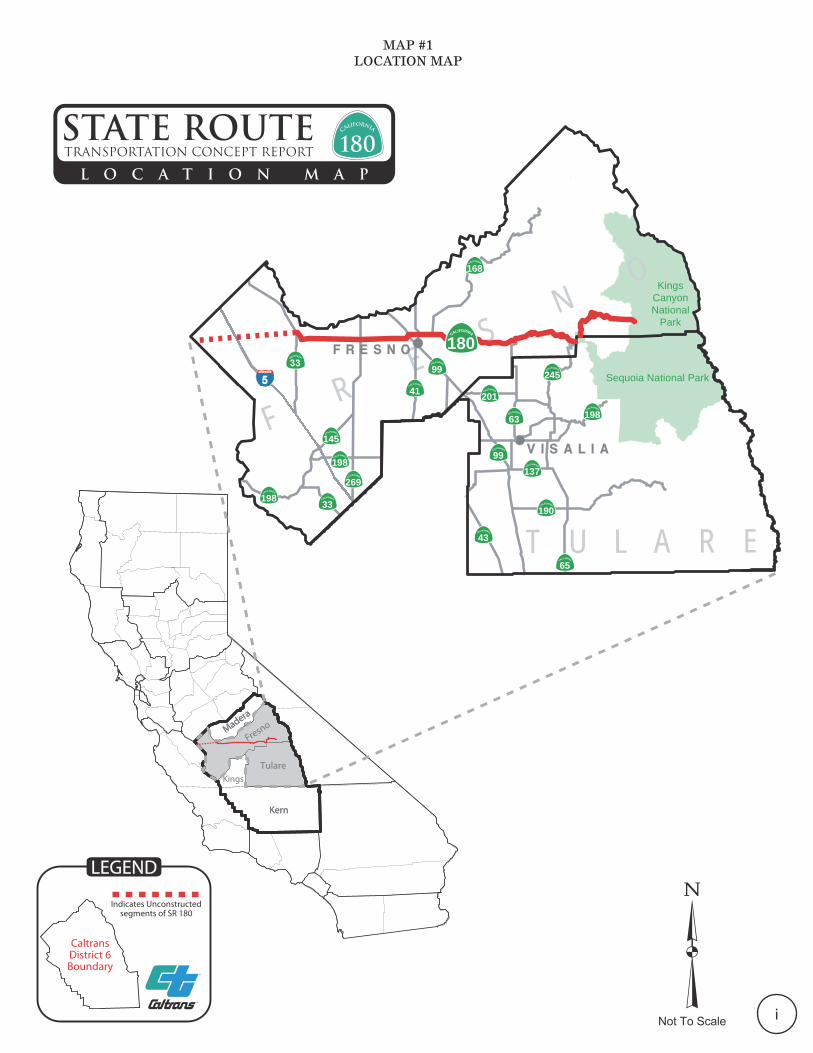
(FCOG), Kings County Association of Governments (KCAG), KCOG, and Tulare County Association of Governments (TCAG), in coordination with the tribal governments and communities of the region. According to the “Map of Ethnographic Territories in Eight County Study Area” (See Map 2, reprinted here), SR 180 passes through areas considered to be the traditional indigenous territories of the Southern Valley Yokuts, Foothill Yokuts, and the Monache. The Northern Valley Yokuts territory touches on the northwest edge of Fresno County, close to the location of an approved western extension of SR 180. Please note that many of the ethnographic territories overlap. See the following link for the final report: http://www. kerncog.org/attachments/265_SJVTribalEJSummary.pdf). Caltrans consults and coordinates with Tribal Governments and communities during the development of the TCR. In 1905, the easternmost portion of what is now SR 180 became Legislative Route 41 (LR 41). This portion extended from the General
Grant Grove in Kings Canyon National Park to the Kings River Canyon. In 1919, a bond measure funded the extension and upgrade of the route, extending it to the City of Fresno. Also in 1919, Segments 3-21 were adopted into the State highway system (please see the Segment Map, Page 11). In 1959, SR 180 was added to the California Freeway and Expressway System. The only excluded area is the portion east of General Grant Grove in Kings Canyon National Park. The route originally passed through the core of the City of Fresno’s business district, winding around on local streets. The route then exited the downtown area, becoming Kings Canyon Boulevard. When SR 99 moved to a freeway bypass in 1962, SR 180 was co-routed with it. The bypassed route was relinquished to the City of Fresno. In 1963, California converted all of its Legislative Routes to State Routes, and LR 41 became SR 180. The new route was legally extended to US 101 in the City of Hollister, then truncated at SR
Map 2: Ethnographic Territories in Eight County Study Area; from “California Central Valley Tribal Transportation Environmental Justice
Collaborative Project”
February 2014
Page 4
25 in 1984 after construction of SR 156. None of this portion of the route has been improved, and is signed only as County Route J1 for most its length. In 1984, Segments 22-23 (from the North Boundary of the General Grant Grove to the end of the route at Kings National Park) were adopted into the State highway system. Construction of the SR 180 and SR 41 freeways was delayed due to a lack of funds, but in 1988 funds from the County of Fresno’s local sales tax, known as Measure C, allowed construction of the viaduct between SR 99 and SR 41 in 1995, then to SR 168 in 1999. The route was eventually extended east of SR168 and west of SR99 in the 2000s.
II. Route Description A. Route Limits
Begins: At the SR 25 junction near Paicines in San Benito County in Caltrans District 5. Ends: In Caltrans District 6 at the Kings Canyon National Park boundary (near Cedar Grove) in Fresno County. Length: In District 6, the constructed portion of the route extends from SR 33 in the City of Mendota, then traversing for approximately 114 miles through Fresno County, Tulare County, and the Kings Canyon National Park. A northerly realignment from Brawley Avenue along with the proposed extension of the SR 180 corridor for approximately 24 miles between the existing West Panoche Road/SR 180 intersection and I-5 was adopted by the California Transportation Commission (CTC) on May 7, 2013 and is not constructed. The CTC has not adopted the segment of SR 180 between SR 25 and I-5. Therefore, the length of the unconstructed portion of SR 180 is unknown. Please see Map #1, Location Map, Page i.
B. Route Description
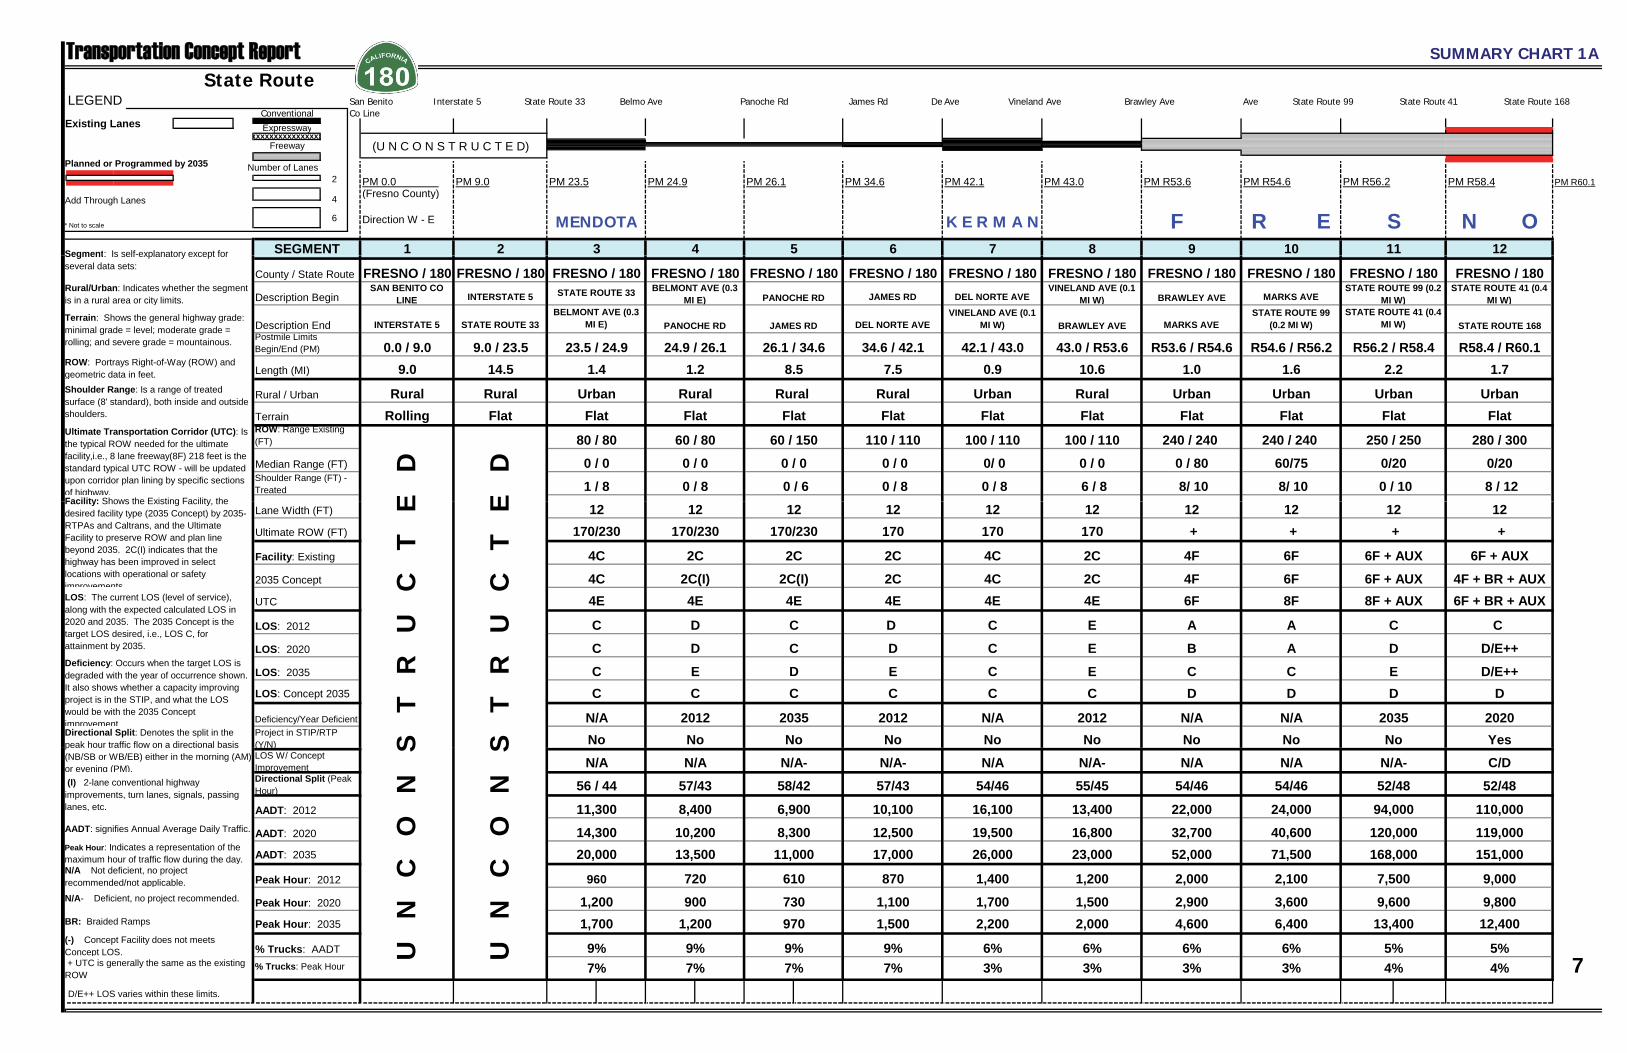
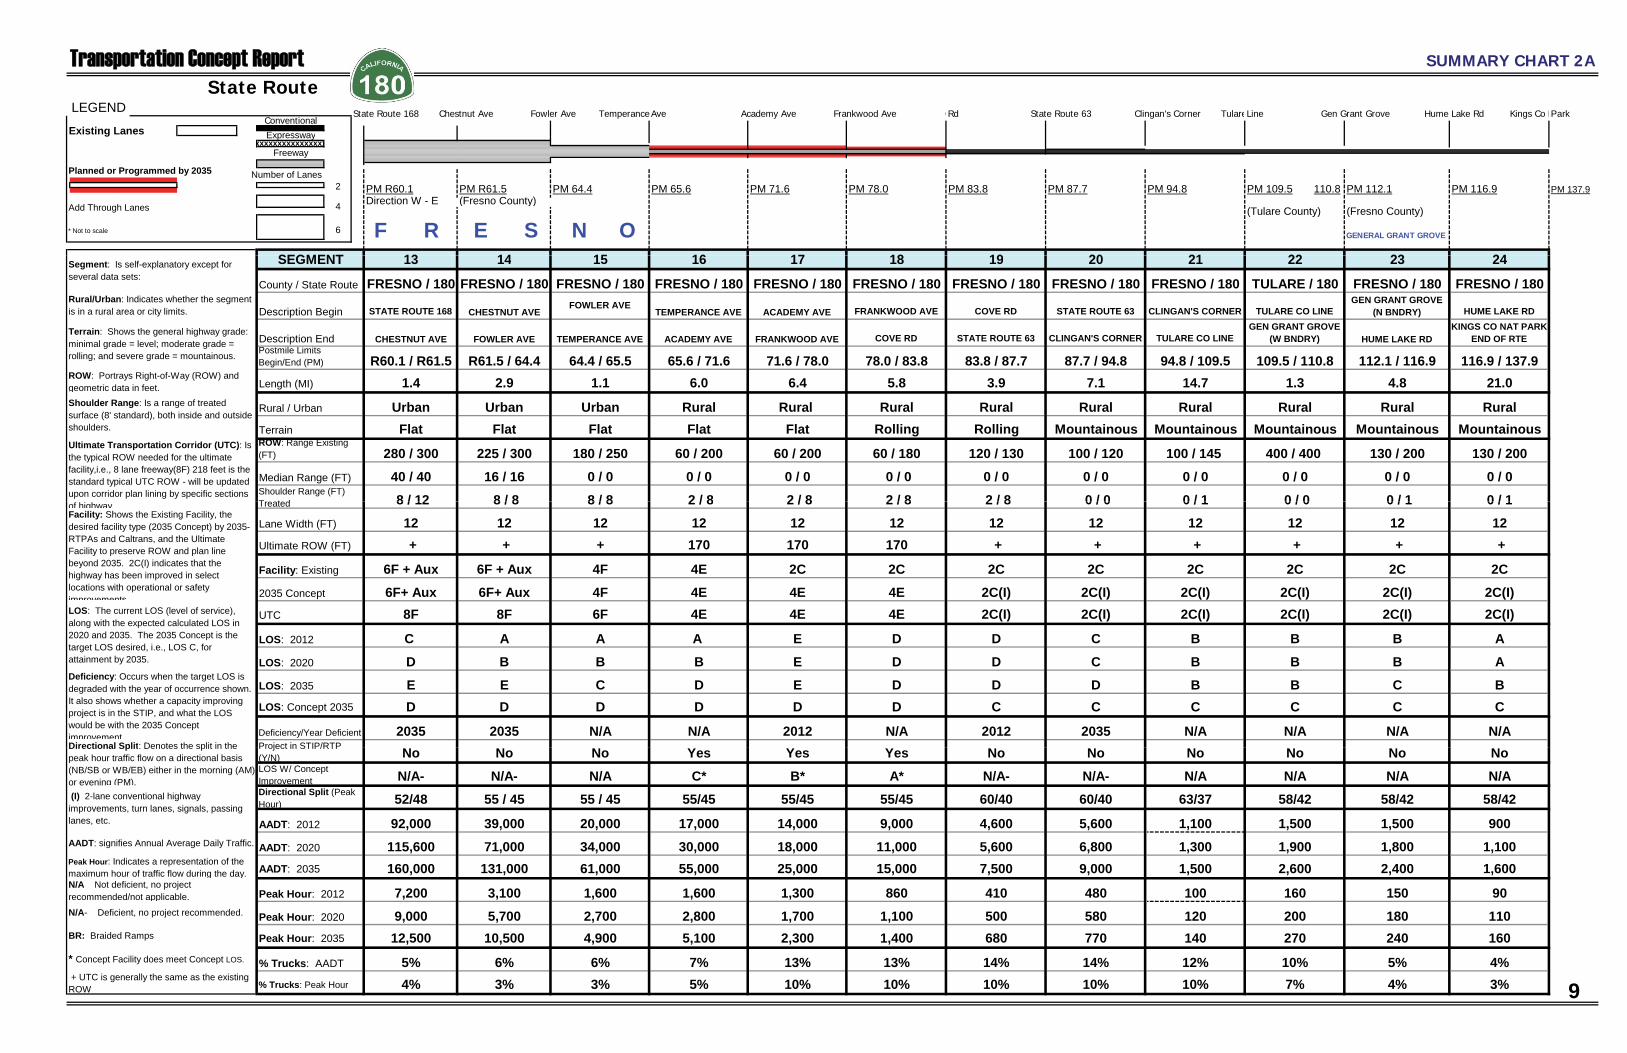
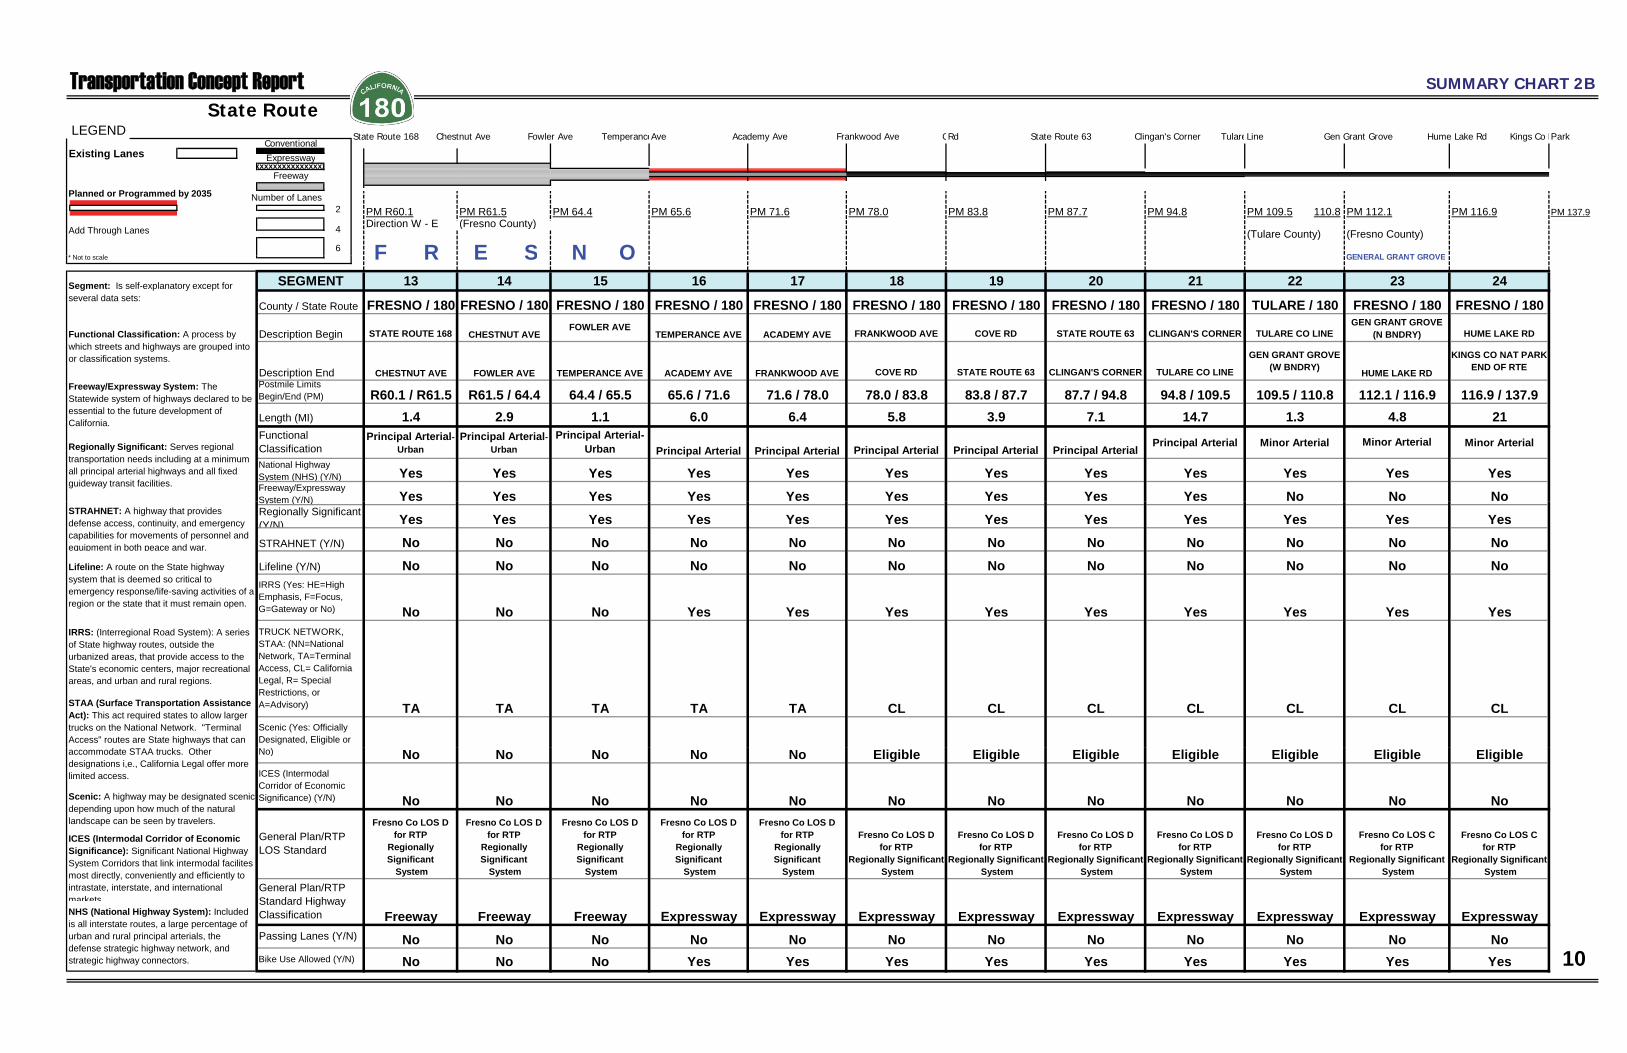
Table 1, Summary Chart, beginning on Page 7, provides information on SR 180, dividing it into twenty-four segments. Descriptive and technical information for the current and forecast years are provided. The chart also has a linear geographic diagram that illustrates the major State and local highway facilities, key natural features, City/County boundaries, and current highway geometrics (i.e., conventional highway, expressway, freeway). A “Chart Explanation” bar on the left hand side of the page defines what is shown on the Chart. The Summary Chart also delineates the functional classification, various highway designations, environmental information, and General Plan information. Map 3, Segment Map, is presented on Page 11. The map shows the 24 segments of SR 180 in District 6. Each segment is discussed individually in the section following the Segment Map.

February 2014
Page 5
C. Route Function SR 180 runs through the heart of the San Joaquin Valley from Mendota through the City of Fresno to Kings Canyon National Park. It serves many different purposes, being a significant route for urban commuters in the Cities of Clovis, Fresno, and outlying communities. The route is a busy commercial route along most of its urban length, serving as a main street for the Cities of Mendota and Kerman, as well as the communities of Minkler and Squaw Valley. SR 180 also provides access to two National Parks: Kings Canyon and Cedar Grove, and is therefore used for recreational travel. Within the National Parks, the route is managed and maintained by the National Park Service. SR 180 passes through Giant Sequoia National Monument both before and after it passes through Kings Canyon National Park. The highway is a designated National Forest Scenic Byway, complete with signs for 50 miles that includes Segment 20 through the end of route at Kings Canyon National Park. East of SR 99, SR 180 is designated as part of the National Highway System (NHS) to Kings Canyon National Park. The route then continues on from the General Grant Grove (north boundary) to Cedar Grove in the Park. SR 180 west of SR 99 is under the Federal-aid Surface Transportation Program. The constructed portion of SR 180 is on the Truck Network System: Surface Transportation Assistance Act (STAA) over the California Legal Network. The part of the route from Temperance Avenue and the end of the route at Kings Canyon National Park is on the Interregional Road system. Elements of this State highway between Hume Lake Road and Cedar Grove may have historical importance, as the Civilian Conservation Corps (CCC) in the mid-1930s constructed them and as they contain several beautiful examples of historic rockwork. The preservation of this rockwork and the general historic character of the road have been, and continue to be, a consideration during maintenance and upgrading. The road has additional significance as it is a corridor splitting the Monarch Wilderness and is within the Kings River Wild and Scenic River corridor. Wilderness and Wild and Scenic Rivers are both congressionally designated areas with strict mandates for management.
February 2014
Page 6
Transportation Concept Report State Route
1 2 6 7 8 9 10 12
PM R56.2
11
Freeway
4
Conventional
Expressway
PM 34.6
LEGEND
Existing Lanes
Planned or Programmed by 2035
* Not to scale
PM 0.0
6
San Benito Interstate 5 State Route 33 Belmon
(Fresno County)
MENDOTA
xxxxxxxxxxxxxxxx
Number of Lanes
PM 9.0
Direction W - E
4
PM 23.5
SEGMENT
Add Through Lanes
PM 24.9
Segment: Is self-explanatory except for 3
2 PM R60.1PM R58.4
N O5
F R E
PM R54.6PM 42.1
SUMMARY CHART 1A
PM 43.0 PM R53.6PM 26.1
K E R M A N S
41 State Route 168
(U N C O N S T R U C T E D)
Co Line Ave Panoche Rd James Rd De Ave Vineland Ave Brawley Ave Ave State Route 99 State Route
FRESNO / 180 FRESNO / 180 FRESNO / 180 FRESNO / 180 FRESNO / 180 FRESNO / 180 FRESNO / 180 FRESNO / 180SAN BENITO CO
LINE INTERSTATE 5 JAMES RD DEL NORTE AVEVINELAND AVE (0.1
MI W) BRAWLEY AVE MARKS AVESTATE ROUTE 41 (0.4
MI W)
INTERSTATE 5 STATE ROUTE 33 DEL NORTE AVEVINELAND AVE (0.1
MI W) BRAWLEY AVE MARKS AVESTATE ROUTE 99
(0.2 MI W) STATE ROUTE 168
0.0 / 9.0 9.0 / 23.5 34.6 / 42.1 42.1 / 43.0 43.0 / R53.6 R53.6 / R54.6 R54.6 / R56.2 R58.4 / R60.1
9.0 14.5 7.5 0.9 10.6 1.0 1.6 1.7
Rural Rural Rural Urban Rural Urban Urban Urban
Rolling Flat Flat Flat Flat Flat Flat Flat
110 / 110 100 / 110 100 / 110 240 / 240 240 / 240 280 / 300
0 / 0 0/ 0 0 / 0 0 / 80 60/75 0/20
0 / 8 0 / 8 6 / 8 8/ 10 8/ 10 8 / 12 0 / 10
1.4
Urban
80 / 80
Flat
Shoulder Range: Is a range of treated surface (8' standard), both inside and outside shoulders.
Length (MI)ROW: Portrays Right-of-Way (ROW) and geometric data in feet.
E
D
Rural / Urban
Terrain
0 / 0
1 / 8
E
D
Facility: Shows the Existing Facility the
Ultimate Transportation Corridor (UTC): Is the typical ROW needed for the ultimate facility,i.e., 8 lane freeway(8F) 218 feet is the standard typical UTC ROW - will be updated upon corridor plan lining by specific sections of highway.
ROW: Range Existing (FT)
Shoulder Range (FT) - Treated
Median Range (FT)
Terrain: Shows the general highway grade: minimal grade = level; moderate grade = rolling; and severe grade = mountainous.
BELMONT AVE (0.3 MI E)
23.5 / 24.9
FRESNO / 180
Postmile Limits Begin/End (PM)
County / State Route
Description Begin
Description End
STATE ROUTE 33
FRESNO / 180BELMONT AVE (0.3
MI E)Rural/Urban: Indicates whether the segment is in a rural area or city limits.
Segment: Is self explanatory except for several data sets:
FRESNO / 180FRESNO / 180
JAMES RD
250 / 250
0/20
0 / 6
26.1 / 34.6
PANOCHE RD
Rural
1.2
Rural
PANOCHE RD
24.9 / 26.1
Flat
60 / 80
0 / 0
0 / 8
2.2
Urban
Flat
0 / 0
STATE ROUTE 99 (0.2 MI W)
STATE ROUTE 41 (0.4 MI W)
R56.2 / R58.4
8.5
Flat
60 / 150
12 12 12 12 12 12
170 170 170 + + +
2C 4C 2C 4F 6F 6F + AUX
2C 4C 2C 4F 6F 4F + BR + AUX
4E 4E 4E 6F 8F 6F + BR + AUX
D C E A A C
D C E B A D/E++
E C E C C D/E++
C C C D D D
2012 N/A 2012 N/A N/A 2020
No No No No No YesNo
C
D
E
D
2035
+
12S
T
R
U
C
T
E
S
T
R
U
C
T
E
Project in STIP/RTP (Y/N)
C
C
C
Facility: Shows the Existing Facility, the desired facility type (2035 Concept) by 2035- RTPAs and Caltrans, and the Ultimate Facility to preserve ROW and plan line beyond 2035. 2C(I) indicates that the highway has been improved in select locations with operational or safety improvements
LOS: Concept 2035
2035 Concept
2C
2C(I)
E
C
2012
4E
D
D
No
Facility: Existing
Ultimate ROW (FT)
Deficiency: Occurs when the target LOS is degraded with the year of occurrence shown. It also shows whether a capacity improving project is in the STIP, and what the LOS would be with the 2035 Concept improvement.
LOS: The current LOS (level of service), along with the expected calculated LOS in 2020 and 2035. The 2035 Concept is the target LOS desired, i.e., LOS C, for attainment by 2035.
LOS: 2012
LOS: 2035
Directional Split: Denotes the split in the peak hour traffic flow on a directional basis
12
LOS: 2020
UTC
Lane Width (FT)
Deficiency/Year Deficient
4E
4C
N/A
No
170/230
4C
C
6F + AUX
6F + AUX
8F + AUX
2C(I)
C
D
C
2035
No
4E
C
170/230
12
170/230
12
2C
N/A- N/A N/A- N/A N/A C/D
57/43 54/46 55/45 54/46 54/46 52/48
10,100 16,100 13,400 22,000 24,000 110,000
12,500 19,500 16,800 32,700 40,600 119,000
17,000 26,000 23,000 52,000 71,500 151,000
870 1,400 1,200 2,000 2,100 9,000
1,100 1,700 1,500 2,900 3,600 9,800
1,500 2,200 2,000 4,600 6,400 12,400
9% 6% 6% 6% 6% 5%
7% 3% 3% 3% 3% 4% 75%
4%7%
960
1,200
1,700
9% 9%
7% 7%
120,000
168,000
7,500
9,600
N/A-
13,400
52/48
94,000
U
N
C
O
N
S
N/A- Deficient, no project recommended.
U
N
C
O
N
S( )
20,000
56 / 44
11,300
10,200
1,200
57/43
13,500
720
900
8,400
N/A
BR: Braided Ramps
+ UTC is generally the same as the existing ROW
% Trucks: Peak Hour
AADT: 2035
Peak Hour: 2012
Peak Hour: 2020
p(NB/SB or WB/EB) either in the morning (AM) or evening (PM).
(I) 2-lane conventional highway improvements, turn lanes, signals, passing lanes, etc.
(-) Concept Facility does not meets Concept LOS.
AADT: signifies Annual Average Daily Traffic.
Peak Hour: Indicates a representation of the maximum hour of traffic flow during the day.N/A Not deficient, no project recommended/not applicable.
Peak Hour: 2035
% Trucks: AADT
Directional Split (Peak Hour)
AADT: 2012
AADT: 2020
LOS W/ Concept Improvement N/A
14,300
6,900
8,300
9%
970
610
730
11,000
N/A-
58/42
D/E++ LOS varies within these limitsD/E++ LOS varies within these limits.

Transportation Concept Report State Route
Existing LanesConventional Co Line
SUMMARY CHART 1B
LEGEND San Benito Interstate 5 State Route 33 BelmAve Panoche Rd James Rd Del Ave Vineland Ave Brawley Ave MAve State Route 99 State Rout41 State Route 168
Expressway
Freewayxxxxxxxxxxxxxxxx
(U N C O N S T R U C T E D)
PM R56.2 PM R58.4 PM R60.12
O
PM R54.6PM 42.1 PM 43.0 PM R53.6
Planned or Programmed by 2035
4(Fresno County)
PM 24.9 PM 26.1 PM 34.6Number of Lanes
PM 0.0 PM 9.0 PM 23.5
N OF R E SAdd Through Lanes
1 2 6 7 8 9 10 12
FRESNO / 180 FRESNO / 180 FRESNO / 180 FRESNO / 180 FRESNO / 180 FRESNO / 180 FRESNO / 180 FRESNO / 180SAN BENITO CO
LINE INTERSTATE 5 JAMES RD DEL NORTE AVEVINELAND AVE (0.1 MI
W) BRAWLEY AVE MARKS AVESTATE ROUTE 41 (0.4
MI W)
INTERSTATE 5 STATE ROUTE 33 DEL NORTE AVEVINELAND AVE (0.1
MI W) BRAWLEY AVE MARKS AVESTATE ROUTE 99
(0.2 MI W) STATE ROUTE 168
0.0 / 9.0 9.0 / 23.5 34.6 / 42.1 42.1 / 43.0 43.0 / 53.6 53.6 / 54.6 54.6 / R56.2 R58.4 / R60.1
9.0 14.5 7.5 0.9 10.6 1.0 1.6 1.7
Minor Arterial Principal Arterial Principal Arterial
Principal Arterial- Urban
Principal Arterial- Urban
Principal Arterial- Urban
No No No No No Yes
Yes Yes Yes Yes Yes Yes
MENDOTA* Not to scale
Segment: Is self-explanatory except for several data sets:
SEGMENT 3 4 5
County / State Route
6 N ODirection W - E
11
K E R M A N F R E S
Description EndBELMONT AVE (0.3
MI E) PANOCHE RD JAMES RD
STATE ROUTE 41 (0.4 MI W)
FRESNO / 180 FRESNO / 180 FRESNO / 180 FRESNO / 180
Description Begin STATE ROUTE 33 BELMONT AVE (0.3 MI E) PANOCHE RD
STATE ROUTE 99 (0.2 MI W)
26.1 / 34.6 R56.2 / R58.4
Length (MI) 1.4 1.2 8.5 2.2
Postmile Limits Begin/End (PM) 23.5 / 24.9 24.9 / 26.1
Yes
National Highway System (NHS) (Y/N) No No
Functional Classification Principal Arterial Minor Arterial Minor Arterial
Principal Arterial- Urban
No YesFreeway/Expressway System (Y/N)R i ll Si ifi t
E
D
E
D
Yes Yes Yes
Functional Classification: A process by which streets and highways are grouped into or classification systems.
Regionally Significant: Serves regional transportation needs including at a minimum all principal arterial highways and all fixed guideway transit facilities.
STRAHNET: A highway that provides
Freeway/Expressway System: The Statewide system of highways declared to be essential to the future development of California.
Yes Yes Yes Yes Yes Yes
No No No No No No
No No No No No No
TA
No No No
No
Regionally Significant (Y/N) Yes Yes Yes Yes
STRAHNET (Y/N) No No No No
No
TRUCK NETWORK, STAA: (NN=National Network, TA=Terminal Access, CL= California Legal, R= Special Restrictions, or A=Advisory) TA TA TA TA TA TA
IRRS (Yes: HE=High Emphasis, F=Focus, G=Gateway or No)
S
T
R
U
C
T
Lifeline (Y/N) No No
No No No S
T
R
U
C
T
No No No No
TA TA
STRAHNET: A highway that provides defense access, continuity, and emergency capabilities for movements of personnel and equipment in both peace and war.
Lifeline: A route on the State highway system that is deemed so critical to emergency response/life-saving activities of a region or the state that it must remain open.
IRRS: (Interregional Road System): A series of State highway routes, outside the urbanized areas, that provide access to the State's economic centers, major recreational areas, and urban and rural regions.
No No
STAA (Surface Transportation Assistance Act): This act required states to allow larger trucks on the National Network. "Terminal Access" routes are State highways that can accommodate STAA trucks. Other
TA
No
NoNo
No No
Scenic (Yes: Officially Designated, Eligible or No) No No No
No No Yes No No No
Yes Yes Yes No No No 8
NHS (National Highway System): Included is all interstate routes, a large percentage of urban and rural principal arterials, the defense strategic highway network, and strategic highway connectors.
Passing Lanes (Y/N) No No No No
Freeway Freeway Freeway
ICES (Intermodal Corridor of Economic Significance): Significant National Highway System Corridors that link intermodal facilites most directly, conveniently and efficiently to intrastate, interstate, and international markets
Fresno Co LOS Dfor RTP
Regionally Significant System
Fresno Co LOS Dfor RTP
Regionally Significant System
Fresno Co LOS Dfor RTP
Regionally Significant System
Expressway Freeway Expressway
Bike Use Allowed (Y/N) Yes Yes Yes U
N
C
O
N
U
N
C
O
N
No
No No NoScenic: A highway may be designated scenic depending upon how much of the natural landscape can be seen by travelers.
Fresno Co LOS Dfor RTP
Regionally Significant System
General Plan/RTP Standard Highway Classification Expressway Expressway Expressway Freeway
No
General Plan/RTP LOS Standard
Fresno Co LOS Cfor RTP
Regionally Significant
System
designations i,e., California Legal offer more limited access. ICES (Intermodal Corridor
of Economic Significance) (Y/N) No
Fresno Co LOS Cfor RTP
Regionally Significant
System
Fresno Co LOS Cfor RTP
Regionally Significant
System
Fresno Co LOS Cfor RTP
Regionally Significant System
Fresno Co LOS Cfor RTP
Regionally Significant System
Fresno Co LOS Cfor RTP
Regionally Significant System
NoNo No No No
Transportation Concept Report
* Not to scale
13 14 18 19 20 21 22 24
SUMMARY CHART 2A
LEGEND
(Tulare County) (Fresno County)
Existing LanesConventional
Ave Academy Ave Frankwood Ave CState Route 168 Chestnut Ave Fowler Ave Temperance Rd State Route 63 Clingan's Corner Tulare
Expresswayxxxxxxxxxxxxxxxx
Freeway
PM 87.7 PM 94.8
Planned or Programmed by 2035 Number of Lanes
PM R60.1 PM R61.5 PM 83.8
Add Through Lanes
PM 64.4 PM 71.6 PM 78.0 PM 109.5 110.8 PM 112.1
GENERAL GRANT GROVE
SEGMENT 15 16 17 23
Line Gen Grant Grove Hume Lake Rd Kings Co NPark
F R N O
State Route
(Fresno County)
6 E S
PM 137.92
4Direction W - E
PM 65.6 PM 116.9
13 14 18 19 20 21 22 24
FRESNO / 180 FRESNO / 180 FRESNO / 180 FRESNO / 180 FRESNO / 180 FRESNO / 180 TULARE / 180 FRESNO / 180
STATE ROUTE 168 CHESTNUT AVE FRANKWOOD AVE COVE RD STATE ROUTE 63 CLINGAN'S CORNER TULARE CO LINE HUME LAKE RD
CHESTNUT AVE FOWLER AVE COVE RD STATE ROUTE 63 CLINGAN'S CORNER TULARE CO LINEGEN GRANT GROVE
(W BNDRY)KINGS CO NAT PARK
END OF RTE
R60.1 / R61.5 R61.5 / 64.4 78.0 / 83.8 83.8 / 87.7 87.7 / 94.8 94.8 / 109.5 109.5 / 110.8 116.9 / 137.9
1.4 2.9 5.8 3.9 7.1 14.7 1.3 21.0
Urban Urban Rural Rural Rural Rural Rural Rural
Flat Flat Rolling Rolling Mountainous Mountainous Mountainous Mountainous
280 / 300 225 / 300 60 / 180 120 / 130 100 / 120 100 / 145 400 / 400 130 / 200
40 / 40 16 / 16 0 / 0 0 / 0 0 / 0 0 / 0 0 / 0 0 / 0
8 / 12 8 / 8 2 / 8 2 / 8 0 / 0 0 / 1 0 / 0 0 / 1
ROW: Portrays Right-of-Way (ROW) and geometric data in feet.
FRESNO / 180 FRESNO / 180 FRESNO / 180 FRESNO / 180Rural/Urban: Indicates whether the segment is in a rural area or city limits. Description Begin
FOWLER AVETEMPERANCE AVE ACADEMY AVE
GEN GRANT GROVE (N BNDRY)
Segment: Is self-explanatory except for several data sets:
SEGMENT 15 16 17 23
County / State Route
Description End TEMPERANCE AVE ACADEMY AVE FRANKWOOD AVE HUME LAKE RDTerrain: Shows the general highway grade: minimal grade = level; moderate grade = rolling; and severe grade = mountainous.
Postmile Limits Begin/End (PM) 64.4 / 65.5 65.6 / 71.6 71.6 / 78.0
Flat Flat Flat
112.1 / 116.9
Length (MI) 1.1 6.0 6.4 4.8
0 / 0 0 / 0Shoulder Range (FT) Treated 8 / 8 2 / 8 2 / 8 0 / 1
MountainousUltimate Transportation Corridor (UTC): Is the typical ROW needed for the ultimate facility,i.e., 8 lane freeway(8F) 218 feet is the standard typical UTC ROW - will be updated upon corridor plan lining by specific sections
ROW: Range Existing (FT) 180 / 250 60 / 200 60 / 200 130 / 200
Median Range (FT) 0 / 0 0 / 0
Shoulder Range: Is a range of treated surface (8' standard), both inside and outside shoulders.
Rural / Urban Urban Rural Rural Rural
Terrain
8 / 12 8 / 8 2 / 8 2 / 8 0 / 0 0 / 1 0 / 0 0 / 1
12 12 12 12 12 12 12 12
+ + 170 + + + + +
6F + Aux 6F + Aux 2C 2C 2C 2C 2C 2C
6F+ Aux 6F+ Aux 4E 2C(I) 2C(I) 2C(I) 2C(I) 2C(I)
8F 8F 4E 2C(I) 2C(I) 2C(I) 2C(I) 2C(I)
C A D D C B B A
D B D D C B B A
E E D D D B B B
D D D C C C C C
2035 2035 N/A 2012 2035 N/A N/A N/ADirectional Split: Denotes the split in the
Treated 8 / 8 2 / 8 2 / 8 0 / 1of highway.
+
Facility: Existing 4F 4E 2C 2C
Facility: Shows the Existing Facility, the desired facility type (2035 Concept) by 2035- RTPAs and Caltrans, and the Ultimate Facility to preserve ROW and plan line beyond 2035. 2C(I) indicates that the highway has been improved in select locations with operational or safety improvements
Lane Width (FT) 12 12 12 12
Ultimate ROW (FT) + 170 170
2035 Concept 4F 4E 4E 2C(I)LOS: The current LOS (level of service), along with the expected calculated LOS in 2020 and 2035. The 2035 Concept is the target LOS desired, i.e., LOS C, for attainment by 2035.
UTC 6F 4E 4E
Deficiency: Occurs when the target LOS is degraded with the year of occurrence shown. It also shows whether a capacity improving project is in the STIP, and what the LOS would be with the 2035 Concept improvement.
LOS: 2035 C D E
Deficiency/Year Deficient N/A N/A 2012
2C(I)
LOS: 2012 A A E B
C
LOS: Concept 2035 D D D C
LOS: 2020 B B E B
N/AProject in STIP/RTP
No No Yes No No No No No
N/A- N/A- A* N/A- N/A- N/A N/A N/A
52/48 55 / 45 55/45 60/40 60/40 63/37 58/42 58/42
92,000 39,000 9,000 4,600 5,600 1,100 1,500 900
115,600 71,000 11,000 5,600 6,800 1,300 1,900 1,100
160,000 131,000 15,000 7,500 9,000 1,500 2,600 1,600
7,200 3,100 860 410 480 100 160 90
9,000 5,700 1,100 500 580 120 200 110
12,500 10,500 1,400 680 770 140 270 160
5% 6% 13% 14% 14% 12% 10% 4%
4% 3% 10% 10% 10% 10% 7% 3%
Directional Split: Denotes the split in the peak hour traffic flow on a directional basis (NB/SB or WB/EB) either in the morning (AM) or evening (PM).
(I) 2-lane conventional highway improvements, turn lanes, signals, passing lanes, etc.
58/42
AADT: 2012 20,000 17,000 14,000 1,500
Project in STIP/RTP (Y/N) No Yes Yes NoLOS W/ Concept Improvement N/A C* B* N/A
18,000
N/A Not deficient, no project recommended/not applicable. Peak Hour: 2012 1,600 1,600 1,300
Directional Split (Peak Hour) 55 / 45 55/45 55/45
150
1,800Peak Hour: Indicates a representation of the maximum hour of traffic flow during the day. AADT: 2035 61,000 55,000 25,000 2,400
BR: Braided Ramps Peak Hour: 2035 4,900 5,100 2,300 240
N/A- Deficient, no project recommended. Peak Hour: 2020 2,700 2,800 1,700 180
AADT: signifies Annual Average Daily Traffic. AADT: 2020 34,000 30,000
9 + UTC is generally the same as the existing ROW % Trucks: Peak Hour 3% 5% 10% 4%
* Concept Facility does meet Concept LOS. % Trucks: AADT 6% 7% 13% 5%
9
Transportation Concept Report
* N t t l
PM 112.1
Add Through Lanes
GENERAL GRANT GROVE
PM 137.92
4Direction W - E (Fresno County)
(Tulare County) (Fresno County)6 F R E S N O
PM 116.9PM 94.8 PM 109.5 110.8
Planned or Programmed by 2035 Number of Lanes
PM R60.1 PM R61.5 PM 64.4 PM 65.6 PM 71.6 PM 78.0 PM 83.8 PM 87.7
SUMMARY CHART 2B
State RouteLEGEND State Route 168 Chestnut Ave Fowler Ave TemperanceAve Academy Ave Frankwood Ave CRd State Route 63 Clingan's Corner TulareLine Gen Grant Grove Hume Lake Rd Kings Co NPark
Existing LanesConventional
Expresswayxxxxxxxxxxxxxxxx
Freeway
13 14 18 19 20 21 22 24
FRESNO / 180 FRESNO / 180 FRESNO / 180 FRESNO / 180 FRESNO / 180 FRESNO / 180 TULARE / 180 FRESNO / 180
STATE ROUTE 168 CHESTNUT AVE FRANKWOOD AVE COVE RD STATE ROUTE 63 CLINGAN'S CORNER TULARE CO LINE HUME LAKE RD
CHESTNUT AVE FOWLER AVE COVE RD STATE ROUTE 63 CLINGAN'S CORNER TULARE CO LINE
GEN GRANT GROVE (W BNDRY)
KINGS CO NAT PARK END OF RTE
R60.1 / R61.5 R61.5 / 64.4 78.0 / 83.8 83.8 / 87.7 87.7 / 94.8 94.8 / 109.5 109.5 / 110.8 116.9 / 137.9
1.4 2.9 5.8 3.9 7.1 14.7 1.3 21
Principal Arterial- Urban
Principal Arterial- Urban Principal Arterial Principal Arterial Principal Arterial
Principal Arterial Minor Arterial Minor Arterial
Yes Yes Yes Yes Yes Yes Yes Yes
Yes Yes Yes Yes Yes Yes No NoFreeway/Expressway System (Y/N) Yes Yes Yes No
Regionally Significant: Serves regional transportation needs including at a minimum all principal arterial highways and all fixed guideway transit facilities.
ACADEMY AVE
112.1 / 116.9
Length (MI) 1.1 6.0 6.4
GEN GRANT GROVE (N BNDRY)
Description End TEMPERANCE AVE ACADEMY AVE FRANKWOOD AVE HUME LAKE RD
4.8Functional Classification
Principal Arterial- Urban Principal Arterial Principal Arterial
Minor Arterial
National Highway System (NHS) (Y/N) Yes Yes Yes Yes
Freeway/Expressway System: The Statewide system of highways declared to be essential to the future development of California.
Postmile Limits Begin/End (PM) 64.4 / 65.5 65.6 / 71.6 71.6 / 78.0
Functional Classification: A process by which streets and highways are grouped into or classification systems.
* Not to scale
Segment: Is self-explanatory except for several data sets:
SEGMENT 15 16 17
County / State Route FRESNO / 180 FRESNO / 180 FRESNO / 180 FRESNO / 180
Description BeginFOWLER AVE
TEMPERANCE AVE
GENERAL GRANT GROVE
23
F R E S N O
Yes Yes Yes Yes Yes Yes Yes Yes
No No No No No No No No
No No No No No No No No
STRAHNET: A highway that provides defense access, continuity, and emergency capabilities for movements of personnel and equipment in both peace and war.
Lifeline: A route on the State highway system that is deemed so critical to emergency response/life-saving activities of a region or the state that it must remain open.
IRRS: (Interregional Road System): A series of State highway routes, outside the urbanized areas, that provide access to the State's economic centers, major recreational areas, and urban and rural regions.
STAA (Surface Transportation Assistance Act): This act required states to allow larger trucks on the National Network. "Terminal Access" routes are State highways that can
TA
No No
TA
YesTRUCK NETWORK, STAA: (NN=National Network, TA=Terminal Access, CL= California Legal, R= Special Restrictions, or A=Advisory) TA TA TA CL CL
Yes
Scenic (Yes: Officially Designated, Eligible or
CL
Yes Yes
CLCLCLCL
IRRS (Yes: HE=High Emphasis, F=Focus, G=Gateway or No) No Yes Yes Yes Yes Yes
System (Y/N)Regionally Significant (Y/N) Yes
Lifeline (Y/N) No No No No
Yes Yes Yes
STRAHNET (Y/N) No No No No
No No No No No No No No
No No Yes Yes Yes Yes Yes Yes 10
ExpresswayExpressway Expressway
accommodate STAA trucks. Other designations i,e., California Legal offer more limited access.
ExpresswayFreeway
No
No
Fresno Co LOS Dfor RTP
Regionally Significant
System
Scenic: A highway may be designated scenic depending upon how much of the natural landscape can be seen by travelers.
ICES (Intermodal Corridor of Economic Significance): Significant National Highway System Corridors that link intermodal facilites most directly, conveniently and efficiently to intrastate, interstate, and international markets
No
FreewayNHS (National Highway System): Included is all interstate routes, a large percentage of urban and rural principal arterials, the defense strategic highway network, and strategic highway connectors.
General Plan/RTP Standard Highway Classification
No
Bike Use Allowed (Y/N) No Yes Yes
Freeway Expressway Expressway Expressway
Fresno Co LOS Dfor RTP
Regionally Significant
System
No
General Plan/RTP LOS Standard
Fresno Co LOS Dfor RTP
Regionally Significant
System
Fresno Co LOS Dfor RTP
Regionally Significant
System
Fresno Co LOS Dfor RTP
Regionally Significant
System
Fresno Co LOS Dfor RTP
Regionally Significant System
Fresno Co LOS Dfor RTP
Regionally Significant System
Fresno Co LOS Dfor RTP
Regionally Significant System
Fresno Co LOS Dfor RTP
Regionally Significant System
Fresno Co LOS Cfor RTP
Regionally Significant System
No
ICES (Intermodal Corridor of Economic Significance) (Y/N) No NoNo
No) No No No Eligible Eligible EligibleEligible Eligible Eligible
Yes
Passing Lanes (Y/N) No No No No
Eligible
Expressway
No
Fresno Co LOS Dfor RTP
Regionally Significant System
Expressway
Fresno Co LOS Cfor RTP
Regionally Significant System
NoNo No No

INYO
MONO
MARIPOSA
MERCED
MONTEREY
SAN
BENITO
SAN
LUIS
OBISPO
UP R.R.
UP
R.R
.
UP R.R.
UP R.R.
UP R.R.
BNSF R.R.
BNSF R.R.
e
Poso Creek
Ker
Riv
erSouth Fork Kern River
DELANO
SHAFTER
WASCO
RIDGECREST
MCFARLANDW
dfish
t Springs
Oildale Johannesburg
Blackwells Corner
Devils Den
Lost Hills
Pond China Lake
Inyokern
Freeman
Glennville
Weldon
OnyxWofford Heights
Kecks Corner
CALIFORNIA
33
CAL
99
CALIFORNIA
155
CALIFORNIA
43
CALIFORNIA
178US
395
US
395
CALIFORNIA
46
CALIFORNIA
46
CALIFORNIA
14
CALIFORNIA
178
UP R R
UP R.R.
UP
R.R
.
&
&
BNSF R.R.
BN
SF R
.R.
AT R.R.
SF R.R.
UP
R.R
.
Park
Devils PostPile NationalMonument
BassLake
RedingerLakeKerckhoff
MillertonLake
LakeReservoir
Fresno River
Willow
Creek
San Jo
aquin
Rive
r
San Joaquin River
Ea
a
ver
Sugar Pine
Ahwahnee
Oakhurst
Coarsegold
FairmeadBerenda
CHOWCHILLA
CALIFORNIA
41
CALIFORNIA
145
99NIA
152
CALIFORNIA
49
Kin
gs R
iver
Tule River
Kings R
iver
Nor
th F
ork Kings Riv er
Stratford
Avenal
Armona
Kettleman City
Corcoran
HANFORD
LEMOORE
CALIFORNIA
33
CALIFORNIA
41
CALIFORNIA
41
CALIFORNIA
43
CALIFORNIA
198UP R.R.
UP R.R.
BN
SF R
.R.
BNSF R.R.
MA
DE
RA
MONO
MARIPOSAM
MERCED
SAN
BENITO
OBISPOO
UP R.R.
UP R.R..
UP R.R.
BNSF R.R.
B
BNSF R.R.
Poso Creek
Ker
Riv
er
DELALL NO
SHAFTER
WASAA CO
MCFAAARRRLALL NDDWW
dfish
t Sprin
Oildale
Blackwells Corner
Devils Denn
Lost Hills
Pond GlennvilleKecks Corner
CALIFORNIA
33
CAL
99
CALIFORNIA
155
CALIFORNIA
43
CALIFORNIA
46
CALIFORNIA
46
UP R R
UP R.R.R
UP
R.R
.
&
&
BNSF R.R.
B
BN
SF R
.R.
AT R.R.
SF R.R.
Park
Devils PostPile NationalMonument
RedingerLakeKerckhoff
MillertonLake
Willo
San Jo
aquin
Rive
r
ver
Fresno River
San Joaquin River
Ea
eaReservoir
Sugar Pine
AhwahneeAhwahnee
old
FairmeadBerenda
CHOWCHILLAC
CALIFORNIA
41
CALIFORNIA
145
99NIA
152
CALIFORNIA
49
Kin
gs R
iver
Tule River
Kings R
iver
ngs R
ive
Nor
trhFo
rkrr Kings Riv eerr
Stratford
nal
Armonaa
Kettleman City
Corcorann
HANFORDOO
LEMOORE
CALIFORNIA
33
CALIFORNIA
41
CA
41
CALIFORNIA
43
CALIFORNIA
198UP R.R.P
UP R.R.
BN
SF R
.R.
BNSF R.R.
MMMMMA
MA
MAAAA
MAA
MAAA
MA
MAAAAAA
DA
A
ADLakeLakeDDD
EDD
EEEC
DDDEEEECoarsegoCoarsegoCC E
RBassLakeRR
EEEEEOakhurst
segold
RAillow
Creek A
RA
CALIFORNIA
ngs
W
T U L A R ET U L A R EK I N G S
FR
ES
NO
FR
ES
NO
K E R NK E R N
ColonelAllensworth
State HistoricPark
BravoLake
White River
Kern R
iver
Deer Creek
Dry
Cre
ek
LakeSuccess
LakeKaweah
Sequoia National Park
Kin
gs R
iver
Saint Johns
Nor
th F
ork
Kaw
eah
Riv
er
South Fork Kaweah River
Ea st Fork Kaweah River
Middle Fork Kaweah Riv er
Mar
ble F
ork Kaweah River
Nor
th Fork Tule Ri v
er
Little Ke
rn River
South Fork Tule R iver
Tule River
Sou
th F
ork
Ke r
n R
iver
Roaring River
Badger
Three Rivers
Lemoncove
Tagus
Lindcove
Ivanhoe
Traver
CutlerOrosi
Yettem
Goshen
StrathmoreWaukena
Angiola
Pixley
Earlimart Ducor
Terra Bella
Tipton
Allensworth
Springville
WOODLAKE
EXETER
TULARE
VISALIA
DINUBA
LINDSAY
PORTERVILLE
CALIFORNIA
245
CALIFORNIA
201
CALIFORNIA
201
CALIFORNIA
216
CALIFORNIA
99
CALIFORNIA
198
CALIFORNIA
99
CALIFORNIA
137
CALIFORNIA
65
CALIFORNIA
65
CALIFORNIA
190
CALIFORNIA
190
CALIFORNIA
43
BNSF R.R.
UP
R.R
.
UP R.R.
UP R.R.
UP R.R.
UP
R.R.
UP
R.R.
BNSF
R.R
.
BN
SF R
.R.
&
BNSF R.R.
BNSF R.R.
CALIFORNIA
63
Millerton Lake StateRecreation Area Kings
CanyonNational
Park
Kings Canyon National Park
Kingsburg
Pinehurst
CourtrightReservoir
PineflatReservoir
WishonReservoir
ShaverLake
FlorenceLake
LakeThomas A Edison
MammothPool
Reservoir
HuntingtonLake
San Joaquin
Kings
Riv
er
Mill Flat C
r
Kings River
River Mill Creek
Mid
dle
Fork Kings River
N Fk K i n gs R
iver
Mana Creek
Big Creek
N Fk Kings River
S Fk S
an Joaquin River
South Fork San Joaquin
S F
k K
ing
s R
iver
Los Gatos Creek
Pinehurst
Tollhouse
Centerville
Orange CoveEaston
Highway City
Calwa
MalagaMinkler
Shaver Lake
Cedar Grove
Squaw Valley
Pinedale
Herndon
Five Points
FRESNO SANGERKERMAN
FIREBAUGH
COALINGA
HURON
FOWLER
SELMA
REEDLEY
MENDOTA
CALIFORNIA
41
CALIFORNIA
99
CALIFORNIA
43
CALIFORNIA
168
CALIFORNIA
180
CALIFORNIA
180
CALIFORNIA
180
CALIFORNIA
145
CALIFORNIA
33
CALIFORNIA
269
CALIFORNIA
145
CALIFORNIA
198
CALIFORNIA
33
CALIFORNIA
33
CALIFORNIA
63
UP R.R.
UP R.R.
UP R.R.
UP R.R.
UP R.R.
UP
R.R
.
UP R.R.
BNSF R.R.
BN
SF R
.R.
BNSF R.R.
2424
2323
2222
21212020
1919
1818
1717
16161313
15151414
87
6
543
12
CALIFORNIA
180
CALIFORNIA
180
CALIFORNIA
180
11111212
91010
11
N
TRANSPORTATION CONCEPT REPORTSTATE ROUTE CALIFORNIA
180S E G M E N T M A P
MONTEREY
SAN
LLUUIISS
AAven
CCAALLIFOORRNNIA
333333333333
1
Indicates segments of SR 180
Corresponds with the symbolsbelow to provide segmentinformation.
LEGEND
PkwyMiSR
R
====
ParkwayMileState RouteRealignment
JctSepPMCo
====
JunctionSeparationPost MileCounty
National Park Highway
Indicates an unconstructed segment,(alignment not determined)
Segment 1: SR 180 PM 0.0 / 9.0San Benito County line / Jct I - 5
Segment 8: SR 180 PM 43.0 / 53.60.1 Mi W of Vineland Ave / Brawley Ave
Segment 16: SR 180 PM 65.5 / 71.6Temperance Ave / Academy Ave
Segment 21: SR 180 PM 94.8 / 109.5Clingan's Corner / Tulare County line
Segment 22: SR 180 PM 109.5 / 110.82Tulare County line / N boundary GeneralGrant Grove
Segment 23: SR 180 PM 112.1 / 116.9 N boundary General Grant Grove / HumeLake RdSegment 24: SR 180 PM 116.9 / 137.9Hume Lake Rd / End of Route at Kings Canyon Nat'l Park
Segment 20: SR 180 PM 87.7 / 94.8SR 63 / Clingan's Corner
Segment 19: SR 180 PM 83.8 / 87.7Cove Rd / SR 63
Segment 18: SR 180 PM 78.0 / 83.8Frankwood Ave / Cove Rd
Segment 17: SR 180 PM 71.6 / 78.0Academy Ave / Frankwood Ave
Segment 7: SR 180 PM 42.1 / 43.0Del Norte Ave / 0.1 Mi W of Vineland Ave
Segment 6: SR 180 PM 34.6 / 42.1James Rd / Del Norte Ave
Segment 4: SR 180 PM 24.9 / 26.10.3 Mi E of Belmont Ave / Panoche Rd
Segment 5: SR 180 PM 26.1 / 34.6Panoche Rd / James Rd
Segment 3: SR 180 PM 23.5 / 24.9SR 33 / 0.3 Mi E of Belmont Ave
Segment 2: SR 180 PM 9.0 / 23.5Jct I - 5 / SR 33
Segment 15: SR 180 PM 64.4 / 65.5Fowler Ave / Temperance Ave
Segment 14: SR 180 PM 61.5 / 64.4Chestnut Ave UC / Fowler Ave
Segment 13: SR 180 PM 60.1 / 61.5SR 168 / Chestnut Ave UC
Segment 11: SR 180 PM 56.2 / 58.40.2 Mi W of SR 99 / 0.4 Mi W of SR 41
Segment 10: SR 180 PM 54.6 / 56.2Marks Ave / 0.2 Mi W JCT SR 99
Segment 9: SR 180 PM 53.6 / 54.6Brawley Ave / Marks Ave
Fresno County
Fresno County
Tulare County
Note: Segments 9 thru 12 have been recently constructed as a new facility on new alignment, with Segments 13-14 to follow. See segment maps for more detail.
1
8
16
21
22
23
24
20
19
18
17
7
6
4
5
3
2
15
14
11
12
13
10
9
Segment 12: SR 180 PM R 58.4 / 60.10.4 Mi W of SR 41 / SR 168
To SR 25and Paicines

February 2014
Page 12
February 2014
Page 13
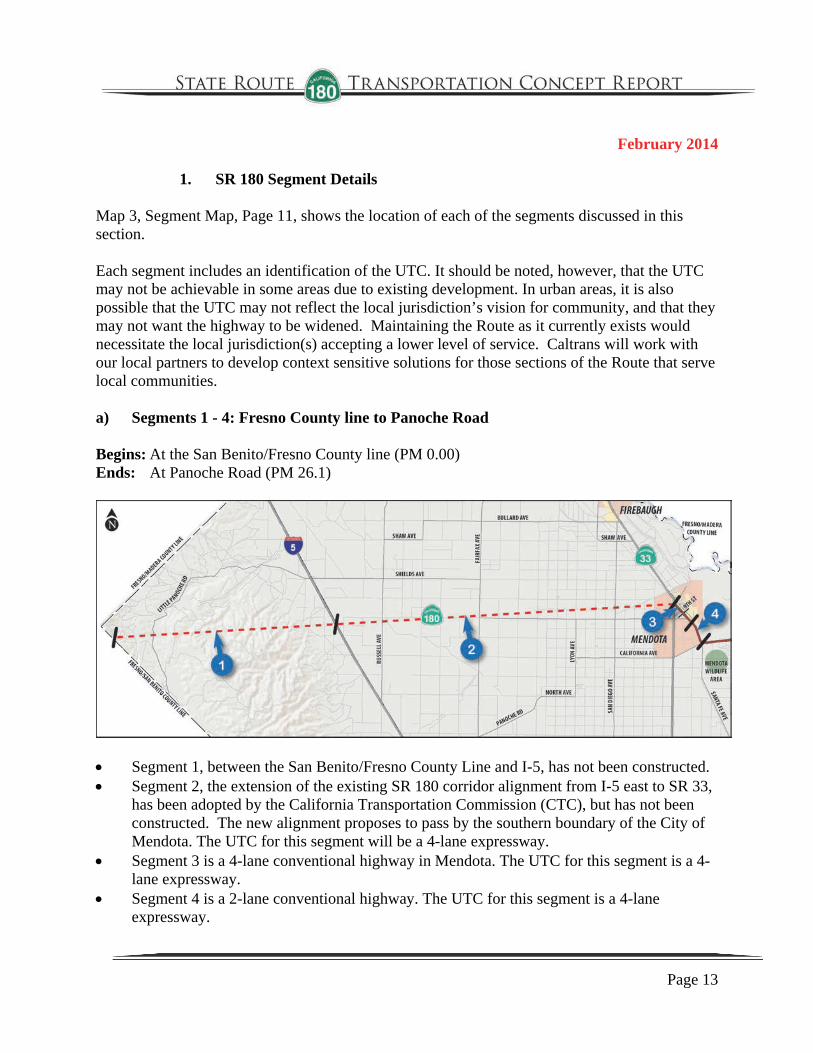
1. SR 180 Segment Details Map 3, Segment Map, Page 11, shows the location of each of the segments discussed in this section. Each segment includes an identification of the UTC. It should be noted, however, that the UTC may not be achievable in some areas due to existing development. In urban areas, it is also possible that the UTC may not reflect the local jurisdiction’s vision for community, and that they may not want the highway to be widened. Maintaining the Route as it currently exists would necessitate the local jurisdiction(s) accepting a lower level of service. Caltrans will work with our local partners to develop context sensitive solutions for those sections of the Route that serve local communities. a) Segments 1 - 4: Fresno County line to Panoche Road Begins: At the San Benito/Fresno County line (PM 0.00) Ends: At Panoche Road (PM 26.1)
Segment 1, between the San Benito/Fresno County Line and I-5, has not been constructed. Segment 2, the extension of the existing SR 180 corridor alignment from I-5 east to SR 33,
has been adopted by the California Transportation Commission (CTC), but has not been constructed. The new alignment proposes to pass by the southern boundary of the City of Mendota. The UTC for this segment will be a 4-lane expressway.
Segment 3 is a 4-lane conventional highway in Mendota. The UTC for this segment is a 4-lane expressway.
Segment 4 is a 2-lane conventional highway. The UTC for this segment is a 4-lane expressway.

February 2014
Page 14
Land Use: From SR 33 to Panoche Road, the land use is primarily agricultural with numerous commercial and residential properties in the City of Mendota. Open tilled fields, orchards, farm machinery, and housing for migrant workers are noticeable along this section. SR 180 skirts three wildlife areas. The first one, shown on the map above, is the Mendota Wildlife Area. It is located on the south side of the route. The other two are shown on the map for Segments 5 – 8, below. State Route to State Route at-grade intersections: SR 33, T intersection with traffic stop, NB/SB turn lanes. Signalized State Route to local road intersection: 9th Street; City of Mendota. b) Segments 5 - 8: Panoche Road to Brawley Avenue Begins: At Panoche Road (at the junction with Santa Fe Avenue) (PM 26.1) Ends: At Brawley Avenue (PM R53.6)
Segments 5 and 6 are 2-lane conventional highway. The UTC is a 4-lane expressway for
both segments. Segment 7 within the City of Kerman is approximately 2.0 miles long and consists of a 4-
lane conventional highway with left and right turn lanes. The UTC for this segment is also a 4-lane expressway. There is consideration for a future northerly realignment through

February 2014
Page 15
these segments. The proposal was based on projected increases in economic growth and traffic volumes in the west Central Valley.
Segment 8 is a 2-lane conventional highway. From a point 0.3 mile east of Goldenrod Avenue to 0.2 mile west of Bishop Avenue (PM 43.94/45.44), there is a one-mile long passing lane. There is another passing lane located from 0.1 mile west of Polk Avenue to 0.1 mile west of Bryan Avenues (PM 51.00/52.00). Cornelia and Hayes Avenues have west bound to south bound and east bound to north bound left turn lanes. The UTC is for a 4-lane expressway.
Land Use: From Panoche Road to Brawley Avenue, the land use is primarily agricultural with numerous commercial and residential properties in the City of Kerman. Open tilled fields, orchards, farm machinery, and housing for migrant workers are noticeable along this section. SR 180 skirts three wildlife areas, all of which are shown on the map on the previous page. The Mendota Wildlife Area is on the south side of the route, just west of the railroad tracks in Segment 5 near Mendota. The Alkali Sink Ecological Reserve is located to the east of the Mendota Wildlife Area while the Kerman Ecological Reserve is located east of James Road. Between Cornelia and Brawley Avenues, SR 180 provides access to numerous mixed industrial uses, cemeteries, and the Chandler Executive Airport via the interchange at Marks Avenue. State Route to State Route at-grade intersections: SR 145, signalized intersection with right/left turn lanes and acceleration lanes; Interchanges and other State highway connections:
Marks Avenue. Signalized State Route to local road intersections:
Brawley Avenue. c) Segments 9 - 12: Brawley Avenue to SR 168 Begins: At Brawley Avenue (PM R53.6) Ends: At SR 168 (PM R60.1)
February 2014
Page 16
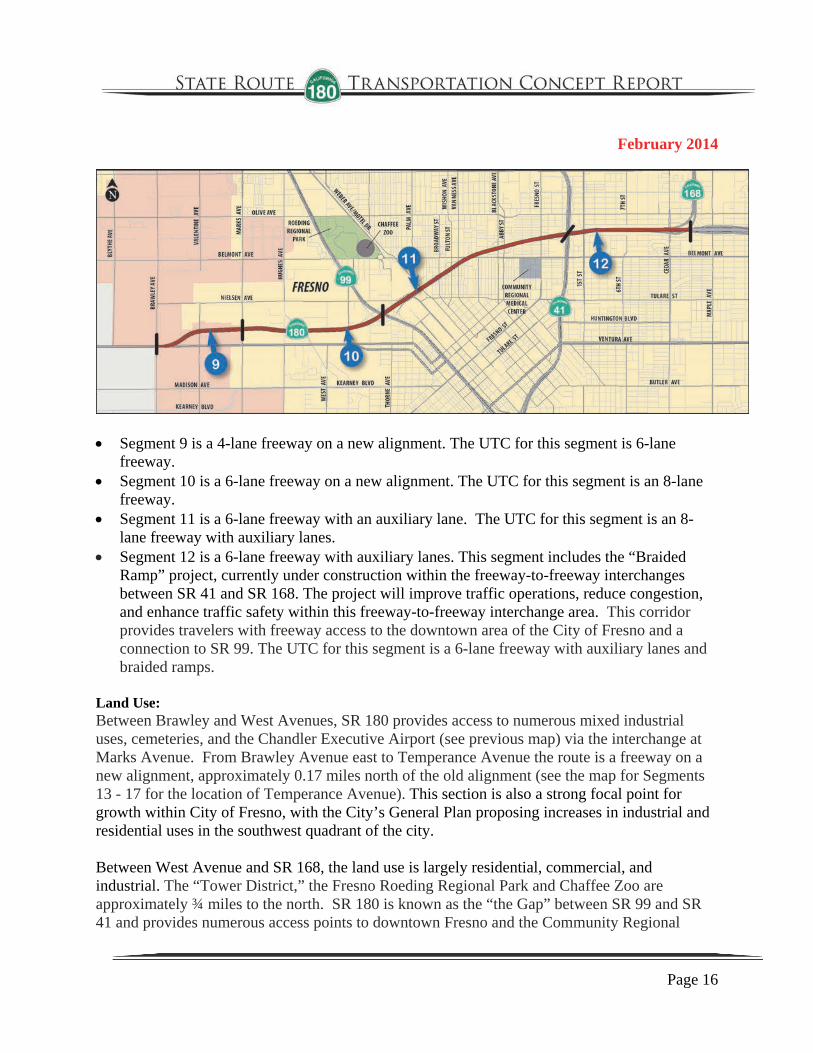
Segment 9 is a 4-lane freeway on a new alignment. The UTC for this segment is 6-lane
freeway. Segment 10 is a 6-lane freeway on a new alignment. The UTC for this segment is an 8-lane
freeway. Segment 11 is a 6-lane freeway with an auxiliary lane. The UTC for this segment is an 8-
lane freeway with auxiliary lanes. Segment 12 is a 6-lane freeway with auxiliary lanes. This segment includes the “Braided
Ramp” project, currently under construction within the freeway-to-freeway interchanges between SR 41 and SR 168. The project will improve traffic operations, reduce congestion, and enhance traffic safety within this freeway-to-freeway interchange area. This corridor provides travelers with freeway access to the downtown area of the City of Fresno and a connection to SR 99. The UTC for this segment is a 6-lane freeway with auxiliary lanes and braided ramps.
Land Use: Between Brawley and West Avenues, SR 180 provides access to numerous mixed industrial uses, cemeteries, and the Chandler Executive Airport (see previous map) via the interchange at Marks Avenue. From Brawley Avenue east to Temperance Avenue the route is a freeway on a new alignment, approximately 0.17 miles north of the old alignment (see the map for Segments 13 - 17 for the location of Temperance Avenue). This section is also a strong focal point for growth within City of Fresno, with the City’s General Plan proposing increases in industrial and residential uses in the southwest quadrant of the city. Between West Avenue and SR 168, the land use is largely residential, commercial, and industrial. The “Tower District,” the Fresno Roeding Regional Park and Chaffee Zoo are approximately ¾ miles to the north. SR 180 is known as the “the Gap” between SR 99 and SR 41 and provides numerous access points to downtown Fresno and the Community Regional
February 2014
Page 17
Medical Center via local streets or SR 41. East of SR 41, industrial activities are prevalent south of McKinley Avenue. In the City of Fresno, the Average Annual Daily Traffic (AADT) on SR 180 ranges from 20,000 to 110,000 with truck traffic constituting 5 – 6%, depending on the segment. Interchanges and other State highway connections:
SR 99; Fulton Street; Blackstone Avenue; SR 41; and SR 168.
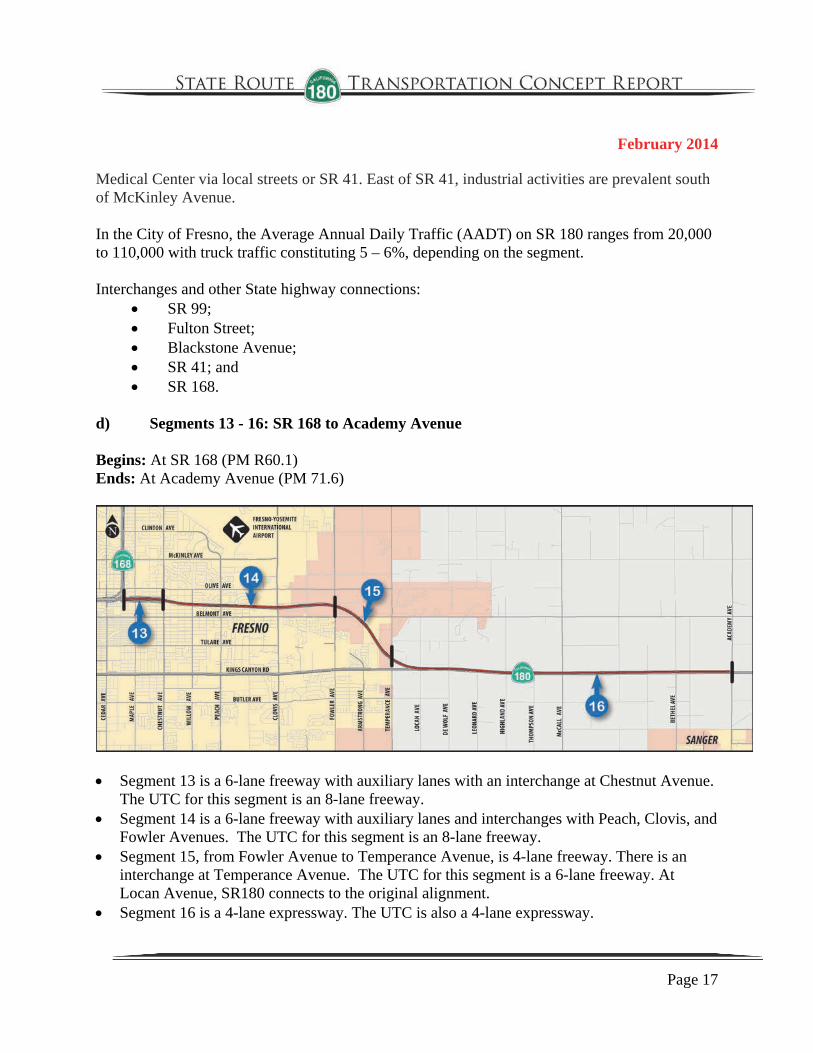
d) Segments 13 - 16: SR 168 to Academy Avenue Begins: At SR 168 (PM R60.1) Ends: At Academy Avenue (PM 71.6)
Segment 13 is a 6-lane freeway with auxiliary lanes with an interchange at Chestnut Avenue.
The UTC for this segment is an 8-lane freeway. Segment 14 is a 6-lane freeway with auxiliary lanes and interchanges with Peach, Clovis, and
Fowler Avenues. The UTC for this segment is an 8-lane freeway. Segment 15, from Fowler Avenue to Temperance Avenue, is 4-lane freeway. There is an
interchange at Temperance Avenue. The UTC for this segment is a 6-lane freeway. At Locan Avenue, SR180 connects to the original alignment.
Segment 16 is a 4-lane expressway. The UTC is also a 4-lane expressway.

February 2014
Page 18
Land Uses East of Chestnut Avenue and ¾ miles north of SR 180 is the Fresno-Yosemite International Airport. The Airport serves as a major growth and economic engine for the region. Between Clovis and Temperance Avenues the land use is primarily a combination of agriculture and residential. Interchanges and other State highway connections:
Chestnut Avenue; Peach Avenue; Clovis Avenue; Fowler Avenue; and Temperance Avenue.
Signalized State Route-to-local road intersections:
DeWolf Avenue Leonard Avenue McCall Avenue Academy Avenue
d) Segments 17 - 20: Academy Avenue to Clingan’s Corner Begins: At Academy Avenue (PM 71.6) Ends: At Clingan’s Corner (PM 94.8)
February 2014
Page 19
Segment 17 transitions to a 2-lane conventional highway just east of Academy Avenue. The UTC for this segment is a 4-lane expressway. A project to convert SR 180 to a 4-lane expressway from approximately Quality Avenue to Smith Avenue is in construction. Another project for the section from Smith Avenue to Frankwood Avenue would convert SR 180 from a 2-lane conventional highway to a 4-lane expressway; that project is programmed.
Segment 18 is a 2-lane conventional highway. At post mile 87.70, SR 180 intersects with SR 63 at a T-intersection with a west bound to south bound left turn lane. The UTC for this segment is a 4-lane expressway.
Segment 19 and 20 are 2-lane conventional highway. The UTC for these segments is a 2-lane conventional with improvements.
Land Uses: SR 180 at Academy Avenue serves the City of Sanger. East of Academy Avenue, SR 180 is a conventional 2-lane highway. It serves agriculture uses and is the recreational access route to the foothills and the Kings Canyon National Park (see map for Segments 21 – 24, next page). Grazing land is prevalent in the foothill areas, particularly from Cove Road to Clingan's Corner. State Route-to-State Route at-grade intersections are at:
SR 63, T intersection with traffic stop; SR 180, SB left turn The communities of Centerville, Minkler, and Squaw Valley are located in the foothills and mountainous areas of this route. d) Segments 21 - 24: Clingan’s Corner to the end of the route at Kings Canyon
National Park Begins: At Clingan’s Corner (PM 94.8) Ends: At Kings Canyon National Park (PM 137.9)

February 2014
Page 20
Segment 21 is a 2-lane conventional highway. The UTC is for a 2-lane conventional with
operational improvements. There is a T-intersection with SR 245 at PM 108.12. This segment is in the County of Tulare.
Segments 22 – 24 are 2-lane conventional highway. A 4.6-mile section of this roadway traverses the Kings Canyon National Park and is not a part of SR 180. The UTC for these segments is a 2-lane conventional with improvements.
Although there are projected increases in recreational activities at the Kings Canyon and Sequoia National Parks, the highway segments in the eastern Sierra Nevada will continue to remain a 2-lane conventional highway due to relatively low traffic volumes and topographical constraints with selected operational and intersection improvements. Land Uses: Some timber harvesting occurs beyond Clingan's Corner and within the Sierra National Forest. There is recreational access to the Giant Sequoia National Monument, the Kings Canyon and Sequoia National Parks from the foothills and the Sierra Nevada Mountains. State Route-to-State Route at-grade intersections are at:
SR 245, T intersection with traffic stop

February 2014
Page 21
SR 198, T intersection with traffic stop, WB/EB turn lanes; SR 180, SB left turn lane, SB right turn lane
D. The Transportation Network
As populations in the region increase, more creative alternatives to capacity-enhancing improvements will be necessary. This section looks at some possible alternatives to the traditional approach of focusing on capital improvements. There are a number of alternatives that have the potential to increase the movement of both people and goods without increasing capacity on State Highways. Opportunities exist to design facilities that will optimize pedestrian, bike, and transit usage, and that will create more connectivity among various modes. Such approaches have the potential to reduce congestion on State Highways and local roads by providing alternatives to the traditional single-occupancy vehicle. The Regional Transportation Plans (RTPs) prepared by local agencies identify improvements to existing transportation systems. These improvements are aimed at reducing existing traffic, improving safety, and resolving other circulation conflicts. Implementation of planned improvements to the street and highway network, improvement of county airports, provisions for mass transportation services and facilities, identification of additional bikeways and pedestrian improvements, and improved transportation systems that accommodate goods movement, will have beneficial effects on a region-wide basis. Caltrans has the responsibility for developing, maintaining, and operating a multi-modal transportation network. This network must function at a high level with respect to goods movement, interregional, interstate, and cross-border travel. In addition to continuing support for the regional Blueprint Planning programs, Caltrans is developing a statewide interregional, multi-modal blueprint to be known as the California Interregional Blueprint (CIB). It will be incorporated into the existing California Transportation Plan (CTP) at the time that plan is updated. The CIB will analyze the benefits of multi-modal, interregional projects on the transportation system, and will expand understanding of the interactions between land use and transportation investments in meeting critical strategic growth and sustainability goals. The benefit of this effort will be stronger partnerships with regional agencies, local agencies, and tribal governments, as well as better data for improved decision making at the State, regional, and local level. The CIB will establish a basis for integrating the interregional system into the Smart Mobility Framework, described in Smart Mobility 2010: A Call to Action for the New Decade, and to deliver support for economic stewardship, connectivity, and reliability valued by freight shippers and carriers. The Inter-regional Blueprint will synthesize the Blueprint Planning work by regional agencies while focusing on the interregional system that is Caltrans’ responsibility.
February 2014
Page 22
In addition to concepts presented in the local agencies’ RTPs, this TCR includes many ideas found in Smart Mobility 2010: A Call to Action for the New Decade.
1. Goods Movement Various modes are used in California to move goods, including seaports, airports, railways, dedicated truck lanes, logistics centers, and border crossings. California’s economy relies heavily on the efficient and safe delivery of goods to and from our ports and borders, as well as distribution within the State. This includes the movement of raw materials to manufacturing and processing plants, as well as the movement of finished products to market. Goods Movement is critical to the State’s economy. Our quality of life depends on the efficient and safe delivery of goods to and from our ports and borders. Goods movement also represents an increasingly important employment sector for Californians. It is important to ensure a dependable level of service for movement into and through major gateways and to ensure connectivity to key intermodal transfer facilities, seaports, air cargo terminals, and freight distribution centers. The San Joaquin Valley is one of four major international trade regions in California, as designated in the 2002 Global Gateways Development Program, and, as a result, a high priority has been placed on goods movement by Caltrans and local agencies. Improving goods movement infrastructure, and thereby providing alternatives to the reliance on trucking, will also aid in relieving congestion on freeways and will increase mobility for everyone in California. a) Freight Rail In the San Joaquin Valley, approximately 25% of shippers are currently using rail for transporting freight. Rail is limited by travel speed and by fixed routes that offer fewer choices; however, it can provide an economical means of transporting bulk goods. While trains demand heavy fuel consumption, they can be less expensive than trucking for long-haul loads. Shipping freight by rail is more energy-efficient than by truck, making preservation and expansion of rail freight facilities vital for both the preservation of natural resources and the development of a sustainable economy. Trains have the ability to haul large amounts of cargo, making the overall energy requirement per unit of weight less than with trucking or air transport. Rail can also provide specialized transport with a variety of rail cars such as flatbeds, refrigerated boxcars, fuel tankers, and piggyback cars, allowing the transport of a large variety of goods. Rail facilities are located throughout the San Joaquin Valley. Many of these facilities provide for long distance movement of goods. In particular, several facilities owned by Union Pacific (UP) and Burlington Northern & Santa Fe (BNSF) stretch for significant lengths north-south through the Valley. These are connected at locations up and down the Valley by several shorter lines, owned, leased, and/or operated by a number of different companies. The San Joaquin Valley
February 2014
Page 23
Railroad (SJVRR) is one rail operator that serves the short-line rail transport needs of the region. SJVRR carries a diversified range of goods including citrus, recycled glass, fertilizer, paper products, lumber, and many other products. The SJVRR operates regional freight service on leased UP branch lines, providing a connection to mainline carriers for outlying areas throughout the Valley. This service benefits the region by reducing congestion, helping to reduce air pollution, and making safe, efficient use of transportation corridors. BNSF and UP operate in Kern, Kings, Fresno, and Madera counties. SJVRR operates in Kern, Kings, and Fresno counties. According to the San Joaquin Valley Regional Goods Movement Plan, August 2013 (which incorporates, by reference, a number of previous Goods Movement Studies), UP operates an average of 19 trains per day through the San Joaquin Valley carrying food products, general freight, grain, and lumber. UP has teamed up with CSX Transportation, a company providing rail, intermodal, and rail-to-truck services for coast-to-coast intermodal transportation, linking customers to railroads via trucks and terminals. This provides perishable goods transport as well as refrigerated service from the San Joaquin Valley to New York and Boston. The UP Coalinga Branchline had been proposed for abandonment. In an effort to preserve the rail corridor, funding was obtained for the rehabilitation of the Coalinga Branchline between Huron and Visalia. The Cross Valley Rail Corridor Project was completed in 2003. The project restored and upgraded 47 miles of track between the cities of Visalia and Huron to accommodate 286,000-pound railcars and facilitate the growth of industrial development in the area. It is anticipated that this short-line railroad service would ultimately take approximately 100 heavy trucks per day off the roadways. Actively pursuing the expansion of short haul rail as demonstrated with the Cross Valley Rail Corridor Project is a strategy that could help to preserve rail infrastructure not only for intraregional goods movement but also for future passenger service. Hauling unsubsidized freight on conventional passenger corridors could help to off-set the cost of subsidized passenger service.
Many counties throughout California have been faced with the issue of rail abandonment. Abandonment of railroad branch lines is detrimental to users relying solely on rail freight service. There is also the potential to impact other facilities in the transportation system. Abandonment proposals additionally result in the loss of potential light or commuter rail corridors that would be difficult to replace. With abandonments being a Valley wide issue, State Senator Rubio prepared legislation (SB 325) that allowed the creation of a Central California Railroad Authority that initially included Kern, Tulare, Kings, and Fresno counties but could be expanded to include all eight Valley counties. The Authority's primary focus is to identify and protect short-haul rail lines in Kern, Kings, Tulare, Fresno and Merced counties from abandonment. The Authority is governed by a Board of Directors consisting of elected officials by each participating COG.
February 2014
Page 24
San Joaquin Valley food processors continue to show interest in rail as a preferred shipping mode for bulk products. It is expected that rail shipment volumes in the Valley will increase. Local agencies have indicated that preservation of rail facilities is a high priority. b) Rail Intermodal Facilities Intermodal, or rail plus truck service, can be an efficient alternative to traditional truck transport. Intermodal terminals are starting and ending points for trains, and provide a central point for distribution of goods between various transportation modes, offering the ability to move freight seamlessly between modes of transport. These facilities have the potential to reduce highway congestion, improve safety by reducing truck movements, reduce roadway deterioration, energy consumption, and emissions, and to provide greater flexibility for shippers to both export and receive goods. However, for these benefits to be realized, it is essential that such facilities be located near highways, freeways, and local roads that can accommodate ease of access. The railroads have consolidated their intermodal service networks into fewer, larger hubs, in part to provide sufficient volume at one location to justify lift machines. The UP Railroad has intermodal facilities in both Fresno and Lathrop. BNSF has Intermodal facilities in Bakersfield, Fresno, Modesto, and Stockton. These facilities are located near major highways, and in some cases, ports, to provide interconnectivity to other modes of transportation. While none of these are within the SR 180 TCR corridor, these facilities have a regional benefit. c) Air Freight Service
Air freight service provides fast shipment of small items of high value over long distances. Typically, this is at a high cost. Air freight represents a specialized transportation mode, with its major advantages being dependability and a very short in-transit time. Air carriers depend heavily on truck transportation for the delivery of the goods they transport. The largest airport within District 6 is Fresno-Yosemite International Airport (FYI), located in the City of Fresno. FYI features an air cargo park, located on approximately 87 acres on the north side of the airport. The park includes two aircraft ramps and over 500,000 square feet of air cargo building space to accommodate the needs of air freight companies and to capitalize on Fresno’s mid-state location. The park was built to consolidate air cargo in that strategic location and provide room to expand, as cargo needs demand. It is feasible that, with the current facilities and an opportunity to expand, air freight carriers will consider FYI a favorable alternative location as the Los Angeles basin continues to grow. Air freight service is also available at the Visalia Municipal Airport and the Hanford Municipal Airport.

February 2014
Page 25
d) Inland Port
Foreign Trade Zone and/or Enterprise Zone designations provide “Inland Ports” serving as cargo facilitation centers, where a number of import, export, manufacturing, packing, warehousing, forwarding, customs, and other activities could take place in close proximity or at the same site. Such a facility could function as an inland sorting and depository center for ocean containers transported to the inland port via truck or rail. The City of Shafter has an inland port status facility at its International Trade and Transportation Center. The facility has a container hub allowing distributors to drop empty trailers at the site for pick up by other drivers, thus eliminating a large number of truck trips over the Grapevine and through the Los Angeles basin. While the City of Shafter is south of SR 180, the inland port still has the potential to benefit regional air quality, in addition to creating jobs. The Port of Stockton has expanded its Foreign Trade Zone designation to include the nearly 475-acre Opus Logistics Center in East Stockton. This is the eighth such site approved for Stockton. The new facility is strategically located next to the BNSF railroads intermodal facility, and presents a number of benefits to shippers, including direct transfer from ship to rail. While this facility is north of SR 180, such strategies as this have the potential to reduce some truck trips through the Central Valley, benefiting the SR 180 corridor as well. e) Trucking Trucking is the most commonly used mode for transporting freight in the San Joaquin Valley, providing flexibility, timely delivery, and efficiency. The San Joaquin Valley Goods Movement Study, prepared for Caltrans and the eight counties of the San Joaquin Valley (Kern, Fresno, Tulare, Kings, Madera, San Joaquin, Stanislaus, and Merced), determined that trucking is the dominant mode for moving freight (see truck percentages, Table 1, Summary Chart, Page 7). Trucking provides flexibility, timely delivery, and efficiency. The increase in freight movement by trucks on State highways is growing faster than can be accommodated by the existing capacity on many routes in the Central Valley. In the case of SR 180, trucks constitute up to 14% of the Average Annual Daily Traffic (AADT) in some sections. This is above the State average of 9%. The high volume of truck traffic within the Central Valley raises issues of highway maintenance, capacity, and safety. This has led Valley Regional Transportation Planning Agencies (RTPAs) to share a goal of finding ways to encourage a shift of some commodity movement to rail. While the truck volumes on County roads and regional streets will still be a major factor to be addressed, highway systems would be relieved. This would allow the use of existing capacity on that system, freeing up comparable capacity on State highways and lowering maintenance costs for the highway system.
February 2014
Page 26
2. Mass Transportation
The success of any mass transit service is largely dependent on the proximity of the service to where the population is located. To encourage the use of mass transit as an alternative to single-occupancy vehicles, it is essential that these facilities are linked to the appropriate land uses, with adequate parking facilities. The California Interregional Blueprint to be prepared by Caltrans will provide an analysis of the benefits of multi-modal, interregional projects on the transportation system, and will expand understanding of the interactions between land use and transportation investments in meeting critical strategic growth and sustainability goals. This will provide a valuable tool for both Caltrans and local partner agencies.
a) Aviation General aviation airports provide a variety of important services, not just in the communities within which they are located, but also to surrounding areas. Airports provide for recreational, business, and charter air travel. Some also serve police and sheriff helicopter patrols, air cargo flights, fire suppression (air tankers), and flight and aircraft mechanical instruction. The report “Aviation in California: Benefits to Our Economy and Way of Life” completed by Caltrans Division of Aeronautics in June 2003, provided a comprehensive evaluation of the economic benefits of aviation and airports to California communities and the overall State economy. The report noted that aviation’s overall contribution to the California economy (including direct, indirect, and induced impacts) amounts to nearly 9% of both total State employment and total State output. There are eight public use/general aviation airports in Fresno County. These include the Coalinga Municipal Airport; Firebaugh Airport; Chandler Executive Airport (classified a Regional General Aviation Airport in the California Aviation system Plan); Harris Ranch Airport (classified a Limited Use Airport in the California Aviation System Plan); Mendota Airport; Reedley Municipal Airport; Selma Aerodrome; and Sierra Sky Park. Mendota Airport, Chandler Executive Airport, and Fresno-Yosemite International airport are all within in the corridor of this TCR. Mendota Airport: The Mendota Airport is a city-owned public-use airport located in the City of Mendota. It is categorized it as a general aviation facility. It is accessible from SR 180 via 9th Street. Chandler Executive Airport: Chandler Executive Airport is a public use airport owned by the City of Fresno and is located in the City, approximately two miles west of the central business district. It is a general aviation airport. It is accessible from SR 180 via the Hughes-West diagonal.

February 2014
Page 27
Fresno Yosemite International Airport: The largest airport in Fresno County is FYI. FYI is designated as a Primary Commercial Service Hub Airport in the California Aviation System Plan. It is the major air transportation center in the San Joaquin Valley, drawing from six counties including Fresno, Kings, Madera, Mariposa, Merced and Tulare. This airport is accessible from SR 180 via Peach Avenue. Tulare County’s airport system can be subdivided into three components: publicly owned and operated airports; privately owned airports open to public general aviation use; and private “special use” airfields and airstrips. There are five public airports and two privately owned airports open to public use in operation within the county. The remaining airstrips in the County are used for agricultural aviation activities. Only Visalia Municipal Airport has regularly scheduled commercial service. Visalia Municipal Airport is south of the SR 180 corridor. b) Passenger Rail
In most states, inter-city passenger train service is provided solely by Amtrak. This service is provided with no assistance of any sort from state or local governments. California, through Caltrans, is one state that has been assisting Amtrak in order to allow Amtrak to provide more than just basic service. California has provided Amtrak with capital grants and support for station and track improvements (including signaling), locomotives and cars, and connecting Amtrak bus service. The Pacific Surfliner, San Joaquins, and Capitol Corridor Amtrak lines are funded primarily by the State of
California, with Amtrak and Caltrans operating as partners, helping to reduce ticket fares. These trains operate in addition to Amtrak's own interstate trains: the Coast Starlight, the California Zephyr, the Southwest Chief, and the Sunset Limited, that provide a passenger rail connection for California to the rest of the country. Amtrak provides accessible Thruway Motorcoach (bus) service on some routes. Portions of the trip may be by bus, depending on the line. Amtrak Thruway Motorcoaches also extend Amtrak’s services, providing connectivity to areas not served by passenger rail. The Amtrak line known as the San Joaquins runs north-south, linking Bakersfield and the Bay Area with stops in Wasco, Corcoran, Hanford, Fresno, Madera, Stockton, and Sacramento. The line, via Amtrak Thruway Motorcoach service, provides connections in Bakersfield for travel south to Los Angeles and San
Amtrak Capitol Corridor Route Photo: Amtrak California

February 2014
Page 28
Diego, and connections for travel to the east to Tehachapi, Mojave, Barstow, Baker, and Las Vegas. Californians are riding trains in unprecedented numbers. In 2012-13, Amtrak California carried a record 3.9 million passengers on its thriving Pacific Surfliner and San Joaquin rail lines. Over the past ten years, ridership on the Pacific Surfliner, the second-busiest rail corridor in the nation, and the San Joaquin, the fifth-busiest, increased by nearly one million passengers, and ticket revenues skyrocketed from $44 million to $102 million. In November 2006, Proposition 1B, the “Highway Safety, Traffic Reduction, Air Quality, and Port Security Bond Act of 2006” was passed by voters and to provide new funds to expand passenger services. As of August 2013, $213 million has been allocated to railroad crossing projects and $190 million to intercity rail. These funds are to provide all passenger and freight services the ability to operate more efficiently by improving capacities, sidings, and track signals. c) High Speed Rail
The California High Speed Rail Authority (CHSRA) is a State agency responsible for planning, designing, building, and operating the first high-speed rail system in the nation. As such, CHSRA has developed a plan to build a high-speed rail line to service the major metropolitan areas of California by connecting San Diego and Los Angeles to San Francisco and Sacramento via the Central Valley. Extensive portions of the system will lie within, or adjacent to, existing rail or highway right-of-way to reduce potential environmental impacts and minimize land acquisition. A large part of the Initial Operating Section (IOS) will be constructed in the San Joaquin Valley and will connect proposed stops in Fresno, Kings County (servicing Hanford/Tulare/Visalia), and Bakersfield, all of which lie within Caltrans District 6. The future of California’s High-Speed Rail (HSR) service will be a part of the State’s transportation system and should be considered in concert with local and regional non-motorized transportation, transit, airports, and highways. Moreover, the HSR stations are envisioned to be multimodal transportation hubs, and the success of the HSR service will be critically affected by the degree to which healthy, sound multimodal transportation connections are established. The Caltrans Division of Transportation Planning’s High-Speed Rail Transit Connectivity Program was created on July 1, 2012 to assist Caltrans California Intercity Rail (CIR), CHSRA, regional and local agencies, and transit operators in providing connectivity to HSR and feeder services. Caltrans District contacts are available to provide support of connectivity activities.

February 2014
Page 29
d) Transit Public transportation in the United States is a crucial part of the solution to the nation’s economic, energy, and environmental challenges. An increased investment in public transportation creates jobs and boosts economic growth, as well as potentially improving air quality and helping to alleviate our nation’s overcrowded network of roads by providing transportation choices. A major advantage of transit over single-occupancy vehicle (SOV) facilities is that adding transit, such as an additional bus, to a corridor that has reached capacity is more economical than it is to add another roadway lane. The bus is only needed during peak periods, making it more efficient than providing a travel lane that is under-used during non-peak hours. However, transit can only provide relief for congestion if the bus is not stuck in the same traffic as the SOVs. To reduce the amount of time buses are stuck in congestion, a dedicated transit lane could be established. Investment in carpool and bus lanes on freeways, ramps, and arterial streets is not much more expensive than adding free-flow lanes; however, these alternatives can provide vital relief from the congestion associated with peak travel times. The dedicated transit lane would allow buses to move much faster than the congested traffic in other lanes, possibly making this an attractive alternative to commuters. A dedicated transit lane could also support Bus Rapid Transit (BRT). Southern California Association of Governments defines BRT in their Regional Transportation Plan as: “Bus rapid transit (BRT) is designed to provide fast, high-quality bus service. BRT operates in mixed traffic or in dedicated guide-ways, utilizing low-floor buses, taking advantage of signal priority at intersections, boarding and alighting passengers through streamlined processes, and improving bus stop spacing at planned stations. BRT combines the routing flexibility of bus systems with some of the features of rail transit such as limited stops and streamlined boarding and alighting procedures. It uses specially identified buses stopping only at major intersections/destinations.” BRT would be a possible alternative in highly urbanized areas, connecting major residential areas with job centers. Coordination with Transit operators on implementation of traffic signal green-light extension technology would be a first step toward implementation of BRT and peak period bus/carpool lanes on arterial streets. This dedicated lane would not need to be on SR 180; a local parallel road could be utilized. At the local level, continuous bus service that extends along the entire length of the TCR corridor does not exist. For the interregional travelers within the SR 180 corridor, the existing transit service consists of Orange Belt Stages. Orange Belt Stages has numerous stops in the Central Valley, providing connections to local transit services as well as to Greyhound and Amtrak. For travel outside of the SR 180 corridor, Orange Belt provides service to San Luis Obispo County, as well as to eastern Kern County and Las Vegas. Transit Services: Both fixed-route and dial-a-ride buses serve the local traveler within Fresno and Tulare Counties as shown below.

February 2014
Page 30
Greyhound Bus Lines provide interregional trips along the State Route 180 corridor for travelers from Firebaugh,
Mendota, Kerman, and the Fresno-Clovis Metropolitan Area.
Fresno County: Limited interregional trips are available daily through Greyhound Bus Lines along the SR 180 corridor for travelers from Firebaugh, Mendota, Kerman, and the Fresno-Clovis Metropolitan Area. Urban trips are available through Fresno Area Express (FAX), Clovis Transit, and the Fresno County Rural Transit Agency. A number of these services offer a combination of demand/response and fixed route transit systems.
While the Kerman Transit provides a demand responsive service to Kerman residents, the Westside Transit provides scheduled, multiple round-trip, inter-city service to Mendota and Firebaugh and the Fresno-Clovis Metropolitan Area. The Sanger Transit provides scheduled, fixed route service to the community and a demand responsive service for the elderly and disabled passengers of Sanger. In addition, the Orange Cove Transit provides a demand responsive service to its residents as well as scheduled multiple round-trip, inter-city services to Fresno-Clovis Metropolitan Area, Sanger, Parlier, Reedley, within Orange Cove. With the exception of tour buses, there are no transit services for the eastern half of Segment 20 (eastern Fresno County), and Segments 22 and 23 (in the vicinity of Kings Canyon National Park). Within Kings Canyon National Park, a free shuttle operates daily between Wuksachi Lodge, Lodgepole Visitor Center, and the General Sherman Tree on November 22-25 and from December 26-January 1. Tulare County: Except for tour buses, there are no regularly scheduled transit services for Segment 21, the only segment of SR 180 outside of Fresno County. f) High-Occupancy Vehicle Lanes (HOV)
Projected growth in the Valley will necessitate the consideration of some form of congestion relief. HOV facilities are one alternative. HOV lanes are facilities that have been designated for a specific use by the traveling public. Criteria for using these facilities include the number of
February 2014
Page 31
passengers per vehicle (two or more), transit vehicles, trucks, and motorcycles. These facilities emphasize “person movement” rather than vehicle movement, with an emphasis on increasing the number of persons per vehicle via transit, vanpool, and all forms of ridesharing. This provides for a more efficient utilization of the existing freeway capacity. HOV facilities may result in not only relieving congestion, but may also play a role in improving the overall air quality in the San Joaquin Valley. Currently, SR 180 does not include any HOV lanes. The Department’s Policy and Procedures Memorandum (P89-01) states that the “Department will consider an HOV lane alternative for projects which add capacity to metropolitan freeways or proposed new metropolitan freeways,” if certain criteria are met. These criteria include freeways with 6 or more lanes in and around urban areas, recurrent congestion, and facilities falling below LOS “D.” In December 2004, Caltrans Districts 6 and 10 completed the “High Occupancy Vehicle Lane Viability for the San Joaquin Valley” study to identify potential HOV corridors. HOV lanes were not found to be feasible for SR 180, even in the urban area of the City of Fresno due to a low level of delay and/or delay only at isolated locations. One of the most efficient uses of HOV lanes is to provide priority access to express bus service. Buses are able to move more freely, speeding past congested traffic. This can provide a strong inducement for commuters to take advantage of transit, helping to relieve congestion and extending the service capacity of a freeway by providing an alternative means to get through a congested corridor. The success of an HOV facility does not rely solely on the identification of a road segment that meets specific criteria, but is also contingent on public involvement and education, supporting policy and programs, and interagency coordination. Caltrans will continue to evaluate, in collaboration with local partner agencies, the possibility of HOV facilities within the San Joaquin Valley. Such a facility, or facilities, may prove viable in the future.
3. Non-Motorized Transportation
In transportation planning, more emphasis is being placed on solving traffic issues without resorting to expansion of highway and freeway facilities. Two possible solutions include providing both improved pedestrian access and improved bicycle facilities. The Central Valley is especially well-suited for both of these alternatives, and both can make a meaningful contribution to the overall transportation system. Residential developments are often within walking distance of commercial centers and/or transit stops. The climate and terrain of the region includes many clear, dry days and moderate temperatures. Bicycling, walking, and equestrian activities can reduce traffic congestion, air and noise pollution, and consumption of fuel. As a result, these modes effectively contribute to the quality of life in the region.
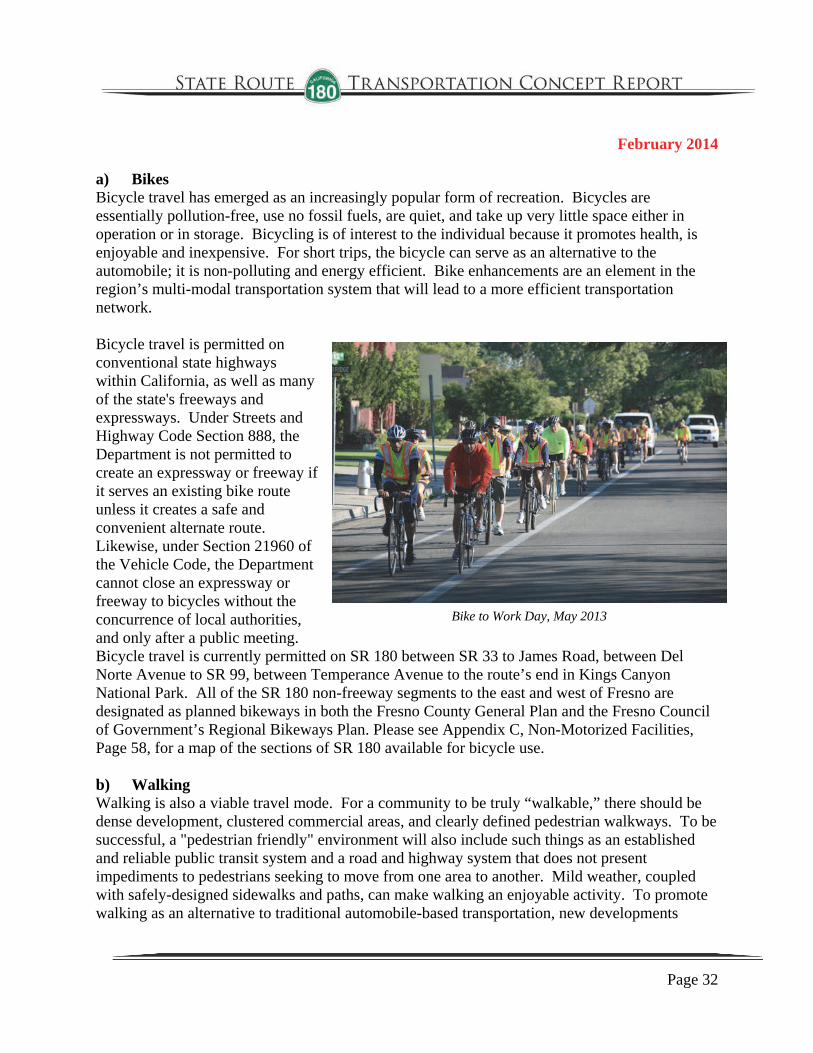
February 2014
Page 32
a) Bikes Bicycle travel has emerged as an increasingly popular form of recreation. Bicycles are essentially pollution-free, use no fossil fuels, are quiet, and take up very little space either in operation or in storage. Bicycling is of interest to the individual because it promotes health, is enjoyable and inexpensive. For short trips, the bicycle can serve as an alternative to the automobile; it is non-polluting and energy efficient. Bike enhancements are an element in the region’s multi-modal transportation system that will lead to a more efficient transportation network. Bicycle travel is permitted on conventional state highways within California, as well as many of the state's freeways and expressways. Under Streets and Highway Code Section 888, the Department is not permitted to create an expressway or freeway if it serves an existing bike route unless it creates a safe and convenient alternate route. Likewise, under Section 21960 of the Vehicle Code, the Department cannot close an expressway or freeway to bicycles without the concurrence of local authorities, and only after a public meeting. Bicycle travel is currently permitted on SR 180 between SR 33 to James Road, between Del Norte Avenue to SR 99, between Temperance Avenue to the route’s end in Kings Canyon National Park. All of the SR 180 non-freeway segments to the east and west of Fresno are designated as planned bikeways in both the Fresno County General Plan and the Fresno Council of Government’s Regional Bikeways Plan. Please see Appendix C, Non-Motorized Facilities, Page 58, for a map of the sections of SR 180 available for bicycle use. b) Walking Walking is also a viable travel mode. For a community to be truly “walkable,” there should be dense development, clustered commercial areas, and clearly defined pedestrian walkways. To be successful, a "pedestrian friendly" environment will also include such things as an established and reliable public transit system and a road and highway system that does not present impediments to pedestrians seeking to move from one area to another. Mild weather, coupled with safely-designed sidewalks and paths, can make walking an enjoyable activity. To promote walking as an alternative to traditional automobile-based transportation, new developments
Bike to Work Day, May 2013

February 2014
Page 33
should be designed to incorporate ready ingress/egress of subdivisions. Planning pedestrian connectivity to transit stops can also promote walking as a mode of transportation. It is particularly important to improve bicycle and pedestrian access to intermodal facilities (rail stations and transit centers). Using non-motorized forms of transportation reduce engine cold starts and short vehicle trips, which contribute significantly to air pollution. The provision of new or improved access to such facilities could be made by bicycle or pedestrian modes and replace short automobile trips. To increase the bicycle mode share, in particular, significant publicity and marketing efforts are necessary, as well as a new approach by transportation agencies to planning facilities for both bicyclists and pedestrians. This approach increases attention to these modes and focuses on intermodal connections. Establishing a comprehensive pedestrian/bicycle program that will coordinate engineering, education, enforcement, encouragement, and environmental programs will enhance the viability of both of these alternative modes. Goals of encouraging the incorporation of both pedestrian and bicycle facilities into the local planning process are included in the RTPs of local agencies. Establishing a comprehensive pedestrian/bicycle program that will coordinate engineering, education, enforcement, encouragement, and environmental programs will enhance the viability of both of these alternative modes of transportation. The RTPs of our local partners all include the goal of promoting more pedestrian and bike uses as an alternative to driving. The RTPs for Our local partners all include lists of proposed bicycle and pedestrian projects. These proposals, whether planned or recommended, will result in improvements to the transportation network, including constructing additional bikeways and pedestrian improvements. The improvements will have beneficial effects on a region-wide basis. Additional information on bicycles and pedestrians is presented in Appendix C, Page 58.
E. Route Inventory
1. Traffic Volumes and Type
The high rate of growth in the San Joaquin Valley is quickly using and exceeding the capacity of the SR 180 corridor. In the next 20 years, Goods Movement is expected to increase, creating even greater pressure on highways within the Central Valley. The existing facilities do not have the capacity to accommodate the growth in population or the increase in goods movement. The economic vitality of the region is dependent on the efficient flow of goods and services to and from this area and a reduction in traffic delays. Efficient goods movement also plays a role in efforts to reduce the region's high unemployment rate. To maintain the ability to support ongoing development, facilitate efficient goods movement, and improve the quality of life in the Central Valley, a substantial investment is needed to maintain and improve transportation.
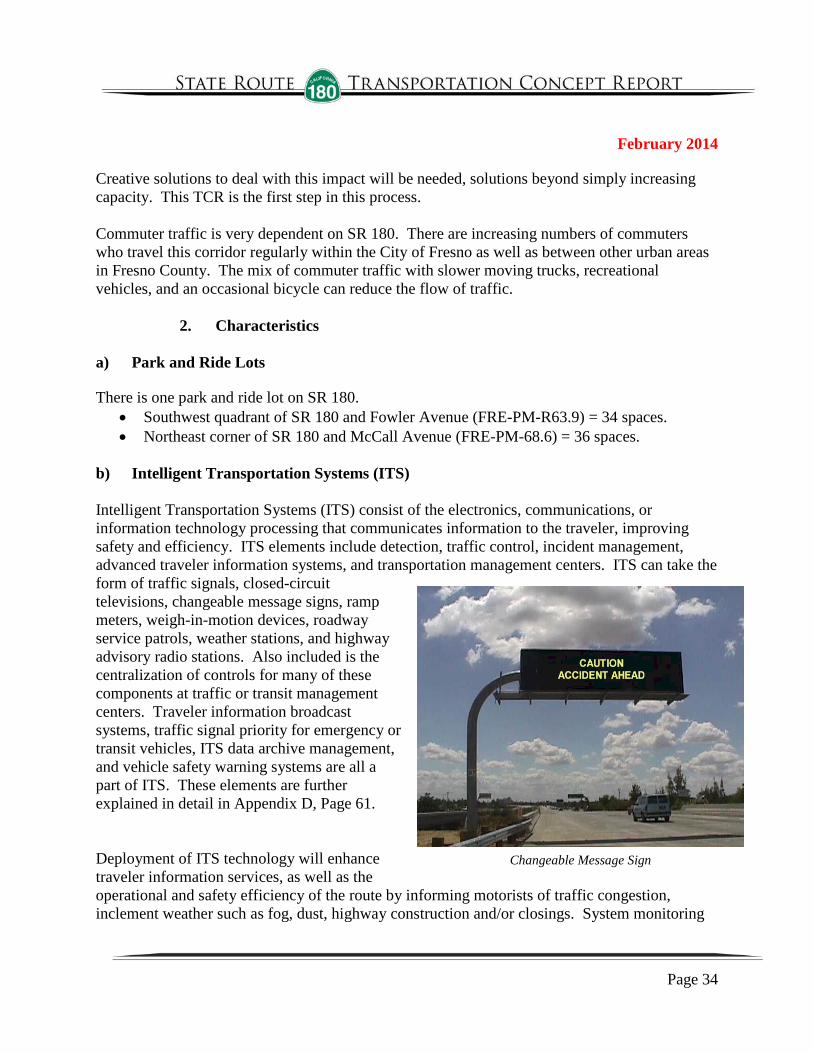
February 2014
Page 34
Creative solutions to deal with this impact will be needed, solutions beyond simply increasing capacity. This TCR is the first step in this process. Commuter traffic is very dependent on SR 180. There are increasing numbers of commuters who travel this corridor regularly within the City of Fresno as well as between other urban areas in Fresno County. The mix of commuter traffic with slower moving trucks, recreational vehicles, and an occasional bicycle can reduce the flow of traffic.
2. Characteristics a) Park and Ride Lots There is one park and ride lot on SR 180.
• Southwest quadrant of SR 180 and Fowler Avenue (FRE-PM-R63.9) = 34 spaces. • Northeast corner of SR 180 and McCall Avenue (FRE-PM-68.6) = 36 spaces.
b) Intelligent Transportation Systems (ITS) Intelligent Transportation Systems (ITS) consist of the electronics, communications, or information technology processing that communicates information to the traveler, improving safety and efficiency. ITS elements include detection, traffic control, incident management, advanced traveler information systems, and transportation management centers. ITS can take the form of traffic signals, closed-circuit televisions, changeable message signs, ramp meters, weigh-in-motion devices, roadway service patrols, weather stations, and highway advisory radio stations. Also included is the centralization of controls for many of these components at traffic or transit management centers. Traveler information broadcast systems, traffic signal priority for emergency or transit vehicles, ITS data archive management, and vehicle safety warning systems are all a part of ITS. These elements are further explained in detail in Appendix D, Page 61. Deployment of ITS technology will enhance traveler information services, as well as the operational and safety efficiency of the route by informing motorists of traffic congestion, inclement weather such as fog, dust, highway construction and/or closings. System monitoring
Changeable Message Sign
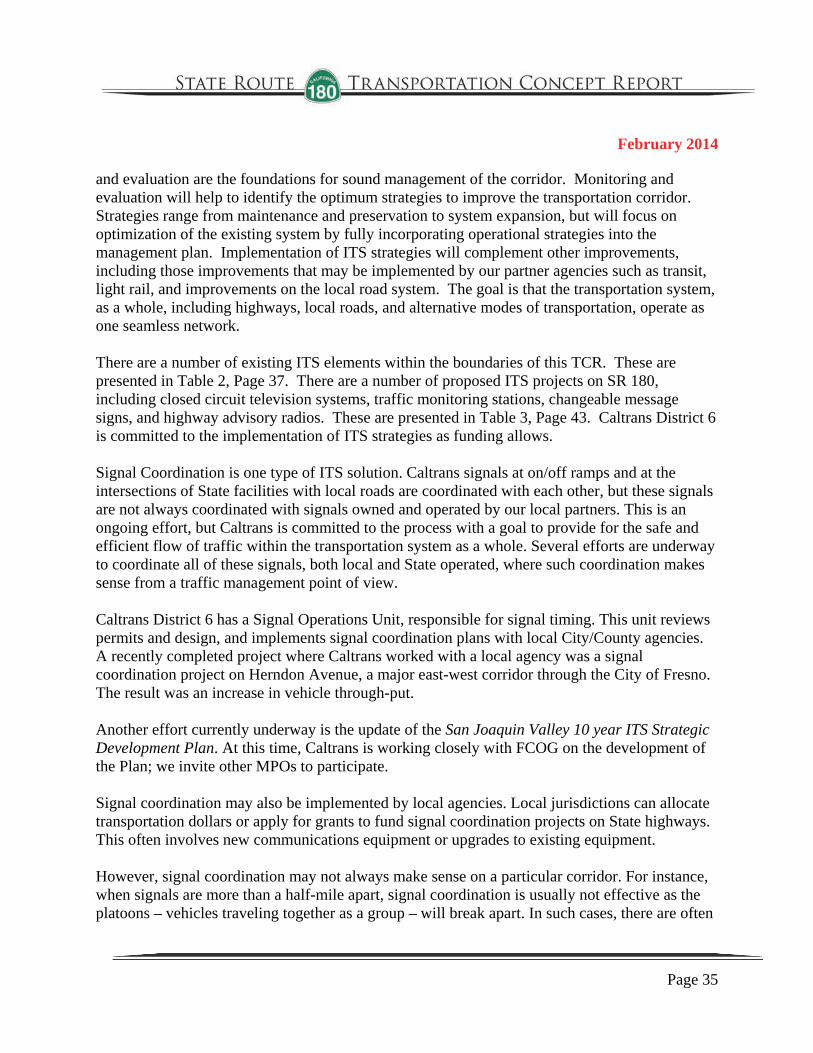
February 2014
Page 35
and evaluation are the foundations for sound management of the corridor. Monitoring and evaluation will help to identify the optimum strategies to improve the transportation corridor. Strategies range from maintenance and preservation to system expansion, but will focus on optimization of the existing system by fully incorporating operational strategies into the management plan. Implementation of ITS strategies will complement other improvements, including those improvements that may be implemented by our partner agencies such as transit, light rail, and improvements on the local road system. The goal is that the transportation system, as a whole, including highways, local roads, and alternative modes of transportation, operate as one seamless network. There are a number of existing ITS elements within the boundaries of this TCR. These are presented in Table 2, Page 37. There are a number of proposed ITS projects on SR 180, including closed circuit television systems, traffic monitoring stations, changeable message signs, and highway advisory radios. These are presented in Table 3, Page 43. Caltrans District 6 is committed to the implementation of ITS strategies as funding allows. Signal Coordination is one type of ITS solution. Caltrans signals at on/off ramps and at the intersections of State facilities with local roads are coordinated with each other, but these signals are not always coordinated with signals owned and operated by our local partners. This is an ongoing effort, but Caltrans is committed to the process with a goal to provide for the safe and efficient flow of traffic within the transportation system as a whole. Several efforts are underway to coordinate all of these signals, both local and State operated, where such coordination makes sense from a traffic management point of view. Caltrans District 6 has a Signal Operations Unit, responsible for signal timing. This unit reviews permits and design, and implements signal coordination plans with local City/County agencies. A recently completed project where Caltrans worked with a local agency was a signal coordination project on Herndon Avenue, a major east-west corridor through the City of Fresno. The result was an increase in vehicle through-put. Another effort currently underway is the update of the San Joaquin Valley 10 year ITS Strategic Development Plan. At this time, Caltrans is working closely with FCOG on the development of the Plan; we invite other MPOs to participate. Signal coordination may also be implemented by local agencies. Local jurisdictions can allocate transportation dollars or apply for grants to fund signal coordination projects on State highways. This often involves new communications equipment or upgrades to existing equipment. However, signal coordination may not always make sense on a particular corridor. For instance, when signals are more than a half-mile apart, signal coordination is usually not effective as the platoons – vehicles traveling together as a group – will break apart. In such cases, there are often
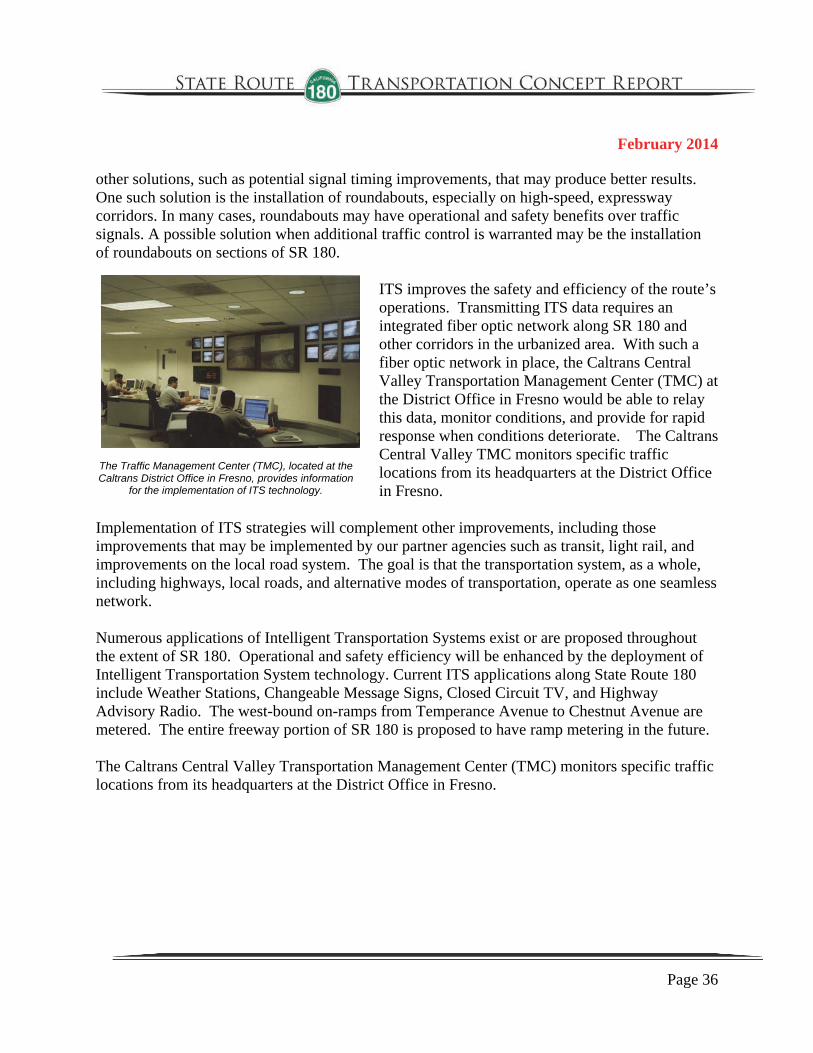
February 2014
Page 36
The Traffic Management Center (TMC), located at the Caltrans District Office in Fresno, provides information
for the implementation of ITS technology.
other solutions, such as potential signal timing improvements, that may produce better results. One such solution is the installation of roundabouts, especially on high-speed, expressway corridors. In many cases, roundabouts may have operational and safety benefits over traffic signals. A possible solution when additional traffic control is warranted may be the installation of roundabouts on sections of SR 180.
ITS improves the safety and efficiency of the route’s operations. Transmitting ITS data requires an integrated fiber optic network along SR 180 and other corridors in the urbanized area. With such a fiber optic network in place, the Caltrans Central Valley Transportation Management Center (TMC) at the District Office in Fresno would be able to relay this data, monitor conditions, and provide for rapid response when conditions deteriorate. The Caltrans Central Valley TMC monitors specific traffic locations from its headquarters at the District Office in Fresno.
Implementation of ITS strategies will complement other improvements, including those improvements that may be implemented by our partner agencies such as transit, light rail, and improvements on the local road system. The goal is that the transportation system, as a whole, including highways, local roads, and alternative modes of transportation, operate as one seamless network. Numerous applications of Intelligent Transportation Systems exist or are proposed throughout the extent of SR 180. Operational and safety efficiency will be enhanced by the deployment of Intelligent Transportation System technology. Current ITS applications along State Route 180 include Weather Stations, Changeable Message Signs, Closed Circuit TV, and Highway Advisory Radio. The west-bound on-ramps from Temperance Avenue to Chestnut Avenue are metered. The entire freeway portion of SR 180 is proposed to have ramp metering in the future. The Caltrans Central Valley Transportation Management Center (TMC) monitors specific traffic locations from its headquarters at the District Office in Fresno.
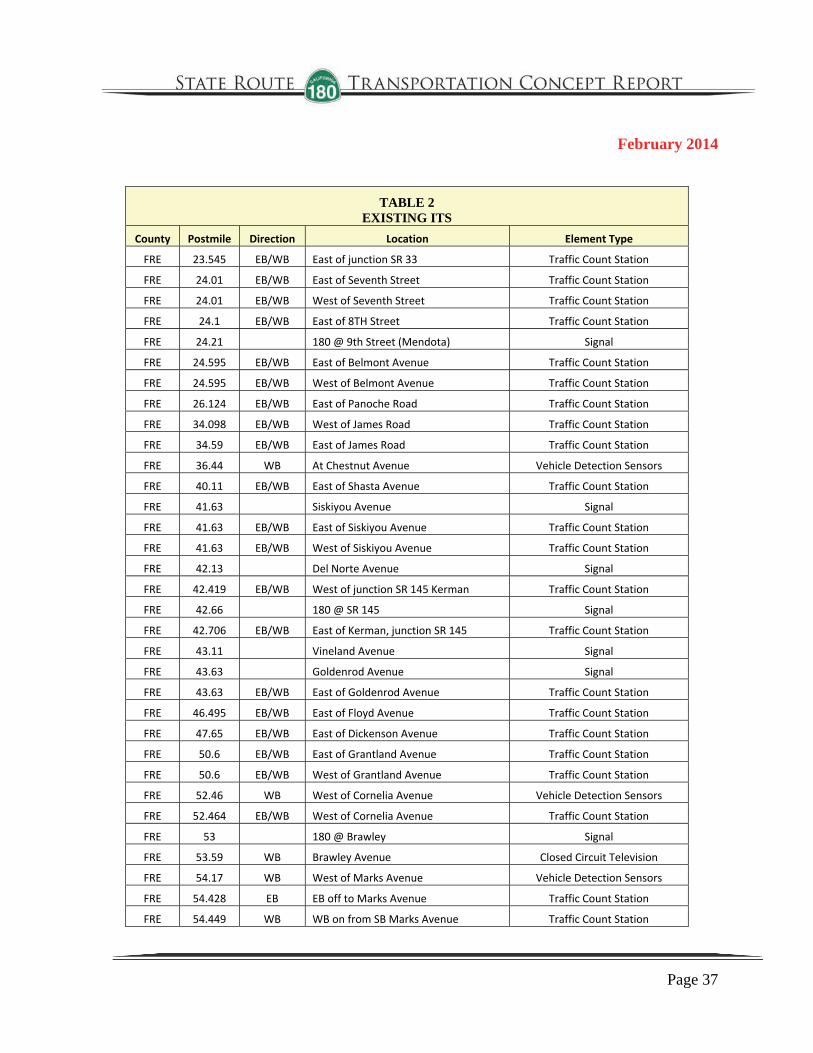
February 2014
Page 37
TABLE 2 EXISTING ITS
County Postmile Direction Location Element Type
FRE 23.545 EB/WB East of junction SR 33 Traffic Count Station
FRE 24.01 EB/WB East of Seventh Street Traffic Count Station
FRE 24.01 EB/WB West of Seventh Street Traffic Count Station
FRE 24.1 EB/WB East of 8TH Street Traffic Count Station
FRE 24.21 180 @ 9th Street (Mendota) Signal
FRE 24.595 EB/WB East of Belmont Avenue Traffic Count Station
FRE 24.595 EB/WB West of Belmont Avenue Traffic Count Station
FRE 26.124 EB/WB East of Panoche Road Traffic Count Station
FRE 34.098 EB/WB West of James Road Traffic Count Station
FRE 34.59 EB/WB East of James Road Traffic Count Station
FRE 36.44 WB At Chestnut Avenue Vehicle Detection Sensors
FRE 40.11 EB/WB East of Shasta Avenue Traffic Count Station
FRE 41.63 Siskiyou Avenue Signal
FRE 41.63 EB/WB East of Siskiyou Avenue Traffic Count Station
FRE 41.63 EB/WB West of Siskiyou Avenue Traffic Count Station
FRE 42.13 Del Norte Avenue Signal
FRE 42.419 EB/WB West of junction SR 145 Kerman Traffic Count Station
FRE 42.66 180 @ SR 145 Signal
FRE 42.706 EB/WB East of Kerman, junction SR 145 Traffic Count Station
FRE 43.11 Vineland Avenue Signal
FRE 43.63 Goldenrod Avenue Signal
FRE 43.63 EB/WB East of Goldenrod Avenue Traffic Count Station
FRE 46.495 EB/WB East of Floyd Avenue Traffic Count Station
FRE 47.65 EB/WB East of Dickenson Avenue Traffic Count Station
FRE 50.6 EB/WB East of Grantland Avenue Traffic Count Station
FRE 50.6 EB/WB West of Grantland Avenue Traffic Count Station
FRE 52.46 WB West of Cornelia Avenue Vehicle Detection Sensors
FRE 52.464 EB/WB West of Cornelia Avenue Traffic Count Station
FRE 53 180 @ Brawley Signal
FRE 53.59 WB Brawley Avenue Closed Circuit Television
FRE 54.17 WB West of Marks Avenue Vehicle Detection Sensors
FRE 54.428 EB EB off to Marks Avenue Traffic Count Station
FRE 54.449 WB WB on from SB Marks Avenue Traffic Count Station

February 2014
Page 38
TABLE 2, CONTINUED EXISTING ITS
County Postmile Direction Location Element Type
FRE 54.59 WB Marks Avenue Closed Circuit Television
FRE 54.59 EB Marks Avenue Ramp Metering system
FRE 54.612 EB EB on from SB Marks Avenue Traffic Count Station
FRE 54.62 180 (EB) and Marks S. Signal
FRE 54.64 180 (WB) and Marks N. Signal
FRE 54.668 WB WB on from NB Marks Avenue Traffic Count Station
FRE 54.84 EB Marks Avenue Ramp Metering system
FRE 54.843 WB WB off to Marks Avenue Traffic Count Station
FRE 54.886 EB EB on from NB Marks Avenue Traffic Count Station
FRE 55.05 EB Just west of Hughes Avenue Vehicle Detection Sensors
FRE 55.08 EB EB 1.5 miles just west of SR 99(Hughes) Changeable Message Sign
FRE 55.897 WB WB on from SR 99 Traffic Count Station
FRE 56.058 EB EB off to SR 99 Traffic Count Station
FRE 56.1 WB West of SR 99 Vehicle Detection Sensors
FRE 56.31 WB Just west of SR 99 Closed Circuit Television
FRE 56.48 EB East of SR 99 Vehicle Detection Sensors
FRE 56.518 WB WB off to SR 99 Traffic Count Station
FRE 56.52 EB/WB West of junction SR 99 Traffic Count Station
FRE 56.67 EB EB on from SR 99 Traffic Count Station
FRE 57.02 WB At Broadway Vehicle Detection Sensors
FRE 57.04 EB/WB West of Broadway Street Traffic Count Station
FRE 57.085 EB EB off to N Fulton Street Traffic Count Station
FRE 57.16 WB WB on from N Fulton Street Traffic Count Station
FRE 57.19 WB Fulton Street Ramp Metering system
FRE 57.28 180 (EB) @ Van Ness S. Signal
FRE 57.28 180 (WB) @ Fulton S. Signal
FRE 57.3 EB Fulton/Van Ness Changeable Message Sign
FRE 57.33 180 (WB) @ Van Ness N. Signal
FRE 57.33 180 (EB) @ Fulton N. Signal
FRE 57.336 WB WB off to N Fulton Street Traffic Count Station
FRE 57.37 Belmont @ Fulton Signal
FRE 57.37 Belmont @ Van Ness Signal
FRE 57.4 EB Van Ness Avenue Ramp Metering system
FRE 57.455 EB EB on from N Van Ness Avenue Traffic Count Station

February 2014
Page 39
TABLE 2, CONTINUED EXISTING ITS
County Postmile Direction Location Element Type
FRE 57.71 EB Abby Avenue Ramp Metering system
FRE 57.737 WB WB on from N Blackstone Traffic Count Station
FRE 57.86 Belmont @ Abby Signal
FRE 57.86 Belmont @ Blackstone Signal
FRE 57.87 Blackstone @ Bremmer Signal
FRE 57.87 Abby@ Bremmer Signal
FRE 57.891 EB EB off to N Abby Street Traffic Count Station
FRE 57.892 WB WB off to N Blackstone Traffic Count Station
FRE 57.9 Blackstone @ White Signal
FRE 57.9 Abby @ White Signal
FRE 58 WB Blackstone Avenue Ramp Metering system
FRE 58.032 EB EB on from N Abby Street Traffic Count Station
FRE 58.06 WB At Diana Changeable Message Sign
FRE 58.242 EB/WB East of Blackstone Avenue Traffic Count Station
FRE 58.25 WB West of Fresno Street/Thesta Avenue Vehicle Detection Sensors
FRE 58.534 EB EB off to NB SR 41 segment Traffic Count Station
FRE 58.535 EB EB off to SB SR 41 segment Traffic Count Station
FRE 58.538 WB WB on from SB SR 41 Traffic Count Station
FRE 58.66 EB Just west of SR 41 Closed Circuit Television
FRE 58.73 EB Just east of SR 41 Closed Circuit Television
FRE 59 East of 1st Street Vehicle Detection Sensors
FRE 59.122 WB WB off to NB SR 41 Traffic Count Station
FRE 59.81 West of Cedar Avenue Vehicle Detection Sensors
FRE 59.815 EB EB off to EB SR 168S Traffic Count Station
FRE 59.895 WB WB on from WB ret. 168S Traffic Count Station
FRE 59.92 180 (EB) @ Cedar S. Signal
FRE 59.93 180 (WB) @ Cedar N. Signal
FRE 59.988 EB EB off to North Cedar Avenue Traffic Count Station
FRE 59.992 WB WB on from North Cedar Avenue Traffic Count Station
FRE 60.143 EB EB off to Chestnut Avenue Traffic Count Station
FRE 60.201 EB Segment EB off to Chestnut Avenue Traffic Count Station
FRE 60.202 EB EB on from North Cedar Avenue Traffic Count Station
FRE 60.217 WB WB on from S Chestnut Avenue Traffic Count Station
FRE 60.26 EB West of Maple Avenue Vehicle Detection Sensors

February 2014
Page 40
TABLE 2, CONTINUED EXISTING ITS
County Postmile Direction Location Element Type
FRE 60.271 WB WB on from N Chestnut Avenue Traffic Count Station
FRE 60.272 WB WB segment off to Cedar Traffic Count Station
FRE 60.3 WB SR 168 Closed Circuit Television
FRE 60.447 WB WB off to EB SR 168S Traffic Count Station
FRE 60.486 EB EB on from WB SR 168S Traffic Count Station
FRE 60.686 EB Segment EB on to SR 180 FR Cedar Traffic Count Station
FRE 60.687 EB Segment EB off to Chestnut Avenue Traffic Count Station
FRE 60.692 WB Segment WB on from Chestnut to SR 180 Traffic Count Station
FRE 60.693 WB Segment WB on from Chestnut Traffic Count Station
FRE 60.73 WB Chestnut Avenue Ramp Metering system
FRE 60.85 WB Chestnut Avenue Closed Circuit Television
FRE 60.91 180 (WB) @ Chestnut N. Signal
FRE 60.92 180 (EB) @ Chestnut S. Signal
FRE 60.925 WB Segment WB on from NB Chestnut Traffic Count Station
FRE 60.99 WB Chestnut Avenue Ramp Metering system
FRE 61.016 EB Segment EB on from Chestnut Traffic Count Station
FRE 61.061 WB Segment WB off to Cedar Traffic Count Station
FRE 61.062 WB Segment WB off to Chestnut Traffic Count Station
FRE 61.18 WB WB off to Chestnut/Cedar Traffic Count Station
FRE 61.218 EB EB on from Chestnut Traffic Count Station
FRE 61.34 WB At Willow Avenue Vehicle Detection Sensors
FRE 61.57 WB Peach Avenue Ramp Metering system
FRE 61.619 EB EB off to Peach Avenue Traffic Count Station
FRE 61.702 WB WB on from N. Peach Avenue Traffic Count Station
FRE 61.817 EB EB on from N. Peach Avenue Traffic Count Station
FRE 61.89 180 (WB) @ Peach N. Signal
FRE 61.9 180 (EB) @ Peach S. Signal
FRE 61.98 WB Peach Avenue Closed Circuit Television
FRE 62 WB East of Peach Avenue Vehicle Detection Sensors
FRE 62.106 WB WB off to N. Peach Avenue Traffic Count Station
FRE 62.641 EB EB off to Clovis Avenue Traffic Count Station
FRE 62.67 WB Just west of Clovis Avenue Changeable Message Sign
FRE 62.67 WB Clovis Avenue Ramp Metering system
FRE 62.737 WB WB on from NB Clovis Avenue Traffic Count Station

February 2014
Page 41
TABLE 2, CONTINUED EXISTING ITS
County Postmile Direction Location Element Type
FRE 62.94 WB At Sunnyside Avenue Vehicle Detection Sensors
FRE 62.948 WB WB on from SB Clovis Avenue Traffic Count Station
FRE 62.97 WB Clovis Avenue Closed Circuit Television
FRE 62.97 WB Clovis Avenue Ramp Metering system
FRE 63.097 EB EB on from Clovis Avenue Traffic Count Station
FRE 63.104 WB WB off to Clovis Avenue Traffic Count Station
FRE 63.15 WB off Fowler Signal
FRE 63.159 WB WB on from SB Fowler Avenue Traffic Count Station
FRE 63.162 EB EB off to Fowler Avenue Traffic Count Station
FRE 63.263 WB WB on from NB Fowler Avenue Traffic Count Station
FRE 63.287 EB EB on from Fowler Avenue Traffic Count Station
FRE 63.307 WB WB off to Fowler Avenue Traffic Count Station
FRE 63.44 Clovis Avenue Highway Advisory Radio
FRE 63.45 180 (EB) @ Clovis off ramp Signal
FRE 63.45 EB/WB West of Clovis Avenue Traffic Count Station
FRE 63.566 EB EB off to Temperance Avenue Traffic Count Station
FRE 63.584 WB WB on from SB Temperance Avenue Traffic Count Station
FRE 63.62 EB off Fowler Signal
FRE 63.64 WB At Belmont Avenue Vehicle Detection Sensors
FRE 63.667 WB WB on from NB Temperance Avenue Traffic Count Station
FRE 63.738 WB WB off to Temperance Avenue Traffic Count Station
FRE 63.744 EB EB on from NB Temperance Avenue Traffic Count Station
FRE 63.96 WB Fowler Avenue Ramp Metering system
FRE 64.14 WB Fowler Avenue Ramp Metering system
FRE 64.16 EB/WB Fowler Avenue Closed Circuit Television
FRE 65.32 WB Temperance Avenue Ramp Metering system
FRE 65.34 EB off Temperance Signal
FRE 65.34 WB off Temperance Signal
FRE 65.54 EB/WB Temperance Avenue Closed Circuit Television
FRE 65.6 WB Temperance Avenue Ramp Metering system
FRE 66.011 EB/WB East of Temperance Avenue Traffic Count Station
FRE 66.05 WB At Locan Avenue Vehicle Detection Sensors
FRE 66.26 WB West of DeWolf Avenue Changeable Message Sign
FRE 66.28 WB W/O DeWolf Avenue Vehicle Detection Sensors

February 2014
Page 42
TABLE 2, CONTINUED EXISTING ITS
County Postmile Direction Location Element Type
FRE 66.57 EB/WB DeWolf Avenue Signal
FRE 67.14 EB/WB Leonard Avenue Signal
FRE 68.62 180 (Kings Canyon) @ McCall Signal
FRE 70.63 EB/WB Bethel Avenue Signal
FRE 70.88 WB E/O Fairbanks Avenue Vehicle Detection Sensors
FRE 71.6 180 (Kings Canyon) @ Academy Signal
FRE 71.61 EB/WB East of Academy Avenue Traffic Count Station
FRE 71.919 EB/WB West of Academy Avenue Traffic Count Station
FRE 74.61 EB/WB East of Centerville, Smith Avenue Traffic Count Station
FRE 74.61 EB/WB West of Centerville, Smith Avenue Traffic Count Station
FRE 74.95 EB/WB West of Trimmer Springs Road Traffic Count Station
FRE 75.107 EB/WB East of Trimmer Springs Road Traffic Count Station
FRE 77.436 EB/WB West of Reed Avenue Traffic Count Station
FRE 77.87 EB/WB East of Reed Avenue Traffic Count Station
FRE 83.89 EB At Cove Road Changeable Message Sign
FRE 87.706 EB/WB East of junction SR 63 south Traffic Count Station
FRE 87.706 EB/WB West of junction SR 63 south Traffic Count Station
FRE 95.596 EB/WB East of Dunlap Road Traffic Count Station
FRE 108.128 EB/WB West of junction SR 245 south Traffic Count Station
FRE 108.145 EB/WB East of junction SR 245 south Traffic Count Station
FRE 112.1 EB/WB East of Grant Grove Traffic Count Station
FRE 116.85 EB/WB East of Hume Lake Road Traffic Count Station
FRE 136.64 EB/WB West of Deer Cove Creek Traffic Count Station

February 2014
Page 43
TABLE 3
PROPOSED ITS
County Postmile Direction Location Element Type
FRE 0 I‐5 Closed Circuit Television
FRE 0 East of I‐5 Changeable Message Sign
FRE 3 Harlan Avenue Roadside Weather Information System
FRE 9 East of I‐5 Vehicle Detection Sensors
FRE 23.51 EB West of SR 33 Changeable Message Sign
FRE 23.54 WB East of SR 33 Changeable Message Sign
FRE 24.7 Mendota Maintenance Station Roadside Weather Information System
FRE 26.38 East of SR 33 Vehicle Detection Sensors
FRE 32.59 2 miles west of James Vehicle Detection Sensors
FRE 34.59 James Road Highway Advisory Radio
FRE 41.63 Just west of SR 145 Closed Circuit Television
FRE 42.14 EB just east of SR 145 Changeable Message Sign
FRE 42.63 East of SR 145 Vehicle Detection Sensors
FRE 42.63 SR 180/SR 145 Vehicle Detection Sensors
FRE 42.98 WB just west of SR 145 Changeable Message Sign
FRE 43.63 Just east of SR 145 Closed Circuit Television
FRE 47.65 Dickenson Avenue Vehicle Detection Sensors
FRE 49.6 EB just west of SR 99 Changeable Message Sign
FRE 49.62 Dickenson/Cornelia Vehicle Detection Sensors
FRE 53.6 Brawley Avenue Highway Advisory Radio
FRE 56 WB NB/SB SR 99 to WB SR 180 Ramp Metering system
FRE 56.5 EB NB/SB SR 99 to EB SR 180 Ramp Metering system
FRE 57.29 EB/WB Fulton Street Closed Circuit Television
FRE 57.4 Belmont Avenue Vehicle Detection Sensors
FRE 58.54 WB SB SR 41 to WB SR 180 Ramp Metering system
FRE 58.6 WB NB SR 41 to WB SR 180 Ramp Metering system
FRE 58.8 EB NB SR 41 to EB SR 180 Ramp Metering system
FRE 59.1 EB SB SR 41 to EB SR 180 Ramp Metering system
FRE 59.53 At N. Milbrook Avenue Vehicle Detection Sensors
FRE 59.87 WB Cedar Avenue Closed Circuit Television
FRE 60.02 WB Cedar Avenue Ramp Metering system
FRE 60.75 West of Chestnut Avenue Vehicle Detection Sensors
FRE 62.41 WB just east of Peach Changeable Message Sign

February 2014
Page 44
TABLE 3, CONTINUED PROPOSED ITS
County Postmile Direction Location Element Type
FRE 64.55 EB Just west of Temperance Changeable Message Sign
FRE 71.62 EB/WB Academy Closed Circuit Television
FRE 71.82 WB E/O Academy Avenue Vehicle Detection Sensors
FRE 72.61 EB Just east of Academy Changeable Message Sign
FRE 74.2 WB Just east of Academy Changeable Message Sign
FRE 74.61 EB/WB East of Smith Avenue Vehicle Detection Sensors
FRE 74.77 EB/WB At Oliver Avenue Closed Circuit Television
FRE 74.95 EB/WB West of Trimmer Springs Road Vehicle Detection Sensors
FRE 76.25 EB/WB Kings River Roadside Weather Information System
FRE 76.25 EB/WB Kings River Vehicle Detection Sensors
FRE 77.1 EB/WB West of Reed Avenue Vehicle Detection Sensors
FRE 77.22 EB/WB Reed Avenue Closed Circuit Television
FRE 77.49 EB/WB East of Reed Avenue Vehicle Detection Sensors
FRE 83.81 EB/WB Cove Road Vehicle Detection Sensors
FRE 83.88 Cove Road Highway Advisory Radio
FRE 83.88 At Cove Road Roadside Weather Information System
FRE 87.7 East of SR 63 Changeable Message Sign
FRE 87.7 EB/WB Junction SR 63/SR 180 Vehicle Detection Sensors
FRE 91.87 EB/WB Squaw Creek Vehicle Detection Sensors
FRE 93.78 EB/WB Just west of Dunlap Road Vehicle Detection Sensors
FRE 95.78 EB/WB Dunlap Road Closed Circuit Television
FRE 95.78 EB/WB Just east of Dunlap Road Vehicle Detection Sensors
FRE 116.85 At Hume Road Roadside Weather Information System
F. Specific Environmental Considerations
In the urban areas, environmental considerations include impacts from right-of-way acquisition, noise issues, and landscape removal. In the rural areas, the considerations include potential impacts to endangered species and archeological sites. From SR 33 to Brawley Avenue the highway crosses specific areas impacted by noise, hazardous waste, sensitive habitat, and right-of-way issues. Highway segments crossing populated areas have social and economic displacement issues.
February 2014
Page 45
There are several national register eligible properties along the existing route in Centerville and in Minkler. There are also numerous archeological sites from east of Minkler to route’s end. Within Kings Canyon National Park, there are historic resources in Wilsonia, General Grant Grove, and Cedar Grove. Biological resources such as the San Joaquin Kit Fox, Swainson’s Hawk, vernal pools, vernal pool fairy shrimp, valley elderberry longhorn beetle, and cliff swallows can be found along this corridor. Several hazardous waste sites listed on the Cal-EPA site’s list exist east of Temperance Avenue. Caltrans archaeologists in consultation with the State Historical Preservation Office (SHPO) have determined that the upper section of SR 180, Hume Lake Road to End of Route at Kings Canyon National Park, is not eligible for the National Historic Register. However, it is significant to point out the rockwork that was done by the Civilian Conservation Corps in the 1930s and to emphasize the importance of making sure that future upgrades to the upper section of this highway blends in with this rockwork. In addition, the mandate for management of the Wild and Scenic River designation basically precludes any diversion of the river for any reason. Measures to protect the clarity of the water and riparian habitat and fisheries, as well as the scenic quality of the area while providing for outdoor recreation use and enjoyment of the area would be necessary. This is in compliance with Public Law 100-150, which designates this as the Kings River Special Management Area and a Wild and Scenic River Corridor.
III. Concept Rationale
A. Route Concept LOS: The Route Concept LOS varies due to the nature of the area surrounding SR 180 and the type of usage the route experiences. Concept LOS refers to the year 2035. Route Concept LOS C was assigned to the rural western portion of SR 180 from SR 33 to Brawley Avenue (Segments 3-8) due to the low traffic volumes, the importance of the agricultural industry to the communities of Firebaugh, Mendota, San Joaquin, Kerman and the region as well as the economic support for these communities and the I-5 Business Development Corridor.
Route Concept LOS D was assigned to the Fresno Metropolitan Area, between Brawley Avenue and Cove Road (Segments 9-18). This concept level of service reflects the high volume urban character of the route.

February 2014
Page 46
Route Concept LOS C was assigned to the segments from Cove Road to the end of the route at Kings Canyon National Park (Segments 19-24) due to low existing and low projected future traffic volumes. Segments 22 and 23, from North Boundary General Grant Grove to End of Route at Kings Canyon National Park, only have seasonal access and are closed during winter months.
1. Concept Facility/Ultimate Transportation Corridor (UTC):
The 2035 Concept facility and the ultimate transportation corridor (UTC, beyond 2035) for SR 180 are as follows: Segments 1: The 2035 concept facility and the UTC for Segment 1 from the San Benito
County Line to I-5 have not yet been defined. This will require further study. Segment 2: The 2035 concept facility for Segment 2 from I-5 to SR 33 (PM 9.00-23.50), is a
4-lane expressway. The UTC is also a 4-lane expressway, as defined by the Route Adoption Study completed in March 2013.
Segment 3: The 2035 concept facility for Segment 3 from SR 33 to 0.3 miles east of
Belmont Avenue (PM 23.50-24.89), is a 4-lane conventional highway. The UTC for this segment is a 4-lane expressway.
Segments 4 and 5: The 2035 concept facility for Segments 4 and 5 from 0.3 miles east of
Belmont Avenue near Mendota to James Road (PM 24.89-34.59) is a 2-lane conventional highway with operational improvements. The UTC for this segment is a 4-lane expressway.
Segments 6: The 2035 concept facility for Segment 6 from James Road to Del Norte Avenue
(PM 34.6-42.1) is a 2-lane conventional highway. The UTC is a 4-lane expressway. Segment 7: The 2035 concept facility for Segment 7 from Del Norte Avenue to Vineland
Avenue (PM 42.1-43.0) through the City of Kerman will remain a 4-lane conventional highway. The UTC for Segment 7 is a 4-lane expressway. The City of Kerman’s General Plan includes constructing a 4-lane expressway realignment (bypass) to the north of existing SR 180.
Segment 8: The 2035 concept facility for Segment 8 from Vineland Avenue to Brawley
Avenue (PM 43.0-R53.6) is for a 2-lane conventional highway. The UTC is for a 4-lane expressway.
Segment 9: The concept facility for Segment 9 from Brawley Avenue to Marks Avenue (PM
53.60-54.58) is a 4-lane freeway. The UTC for this segment is a 6-lane freeway.
February 2014
Page 47
Segment 10: The concept facility for Segment 10 from Marks Avenue to the SR 99/180
Interchange (PM 54.58-R56.52) is a 6-lane freeway. The UTC for this segment is an 8-lane freeway.
Segment 11: The concept facility for Segment 11 from the SR 99/180 Interchange to the SR
41/180 interchange (PM R56.52-R58.68) is a 6-lane freeway plus auxiliary lanes. The UTC for this segment is an 8-lane freeway plus auxiliary lanes.
Segment 12: The concept facility for Segment 12 from the SR 41/180 interchange to the SR
168/180 interchange (PM R58.68-R60.07) is a 4-lane freeway plus auxiliary lanes and braided ramps. The UTC for this segment is a 6-lane freeway plus auxiliary lanes and braided ramps.
Segment 13: The concept facility for Segment 13 from the SR 168/180 interchange to
Chestnut Avenue (PM R60.07-61.44) is a 6-lane freeway plus auxiliary lanes. The UTC for this segment is an 8-lane freeway.
Segment 14: The concept facility for Segment 14 from Chestnut Avenue to Fowler Avenue
(PM 61.41-64.41) is a 6-lane freeway plus auxiliary lanes. The UTC for this segment is an 8-lane freeway.
Segment 15: The concept facility for Segment 15 from Fowler Avenue to Temperance
Avenue (PM 64.41-65.60) is for a 4-lane freeway. The UTC for this segment is a 6-lane freeway.
Segments 16 - 18: The concept facility for Segments 16 - 18 from Temperance Avenue to
Cove Road (PM 65.60-83.81) is for a 4-lane expressway. The UTC for these segments is also a 4-lane expressway.
Segments 19 to 24: The concept facility for Segments 18 – 24 from Cove Road to the end of
the route at Kings Canyon National Park (PM 83.81-137.90) is for a 2-lane conventional highway with operational improvements. The UTC for these segments is also a 2-lane conventional highway with operational improvements.
For more details on the Concept Facility and UTC, please see the Summary Chart on Page 7. For definitions of facility types, please see Appendix D, Acronyms and Definitions, Page 66.
February 2014
Page 48
IV. SR 180 Performance: Current and Future A comparison of the current and future operating traffic LOS to the designated Route Concept LOS is a way of measuring the existing and future performance levels on a State highway. For purposes of this review, a segment on SR 180 is deficient when it operates below the designated Route Concept LOS of C or D. The Route Concept LOS is based on the nature of the route through a particular area. The designation of C will be assigned in more rural areas, while D will be assigned for more urbanized areas. Except for Segments 4, 6, 8, 17, and 19, SR 180 is currently operating at or above the designated Route Concept LOS of C or D. Without improvements, a number of Segments will operate below the designated Route Concept LOS of C or D by 2020 or by 2035 (please see Summary Chart, Page 7). The drop in the performance level is attributed to growth occurring primarily in the Fresno metropolitan area and the increase in regional travel. A Route Adoption Study was completed in March 2013 that analyzed a plan line to connect SR 180 (beginning at SR 33) to I-5. In 2002, the policy board of the Council of Fresno County Governments (COFCG) supported the Caltrans District 6 proposal to add SR 180-West between Route 99 and I-5, to the National Highway System (NHS) routes. The Route Adoption Study with its ensuing projects would address the long-term need for additional capacity and enhanced connectivity between eastern Fresno County and I-5. Without adequate capacity improvements Segments 4 - 8, 11 - 14, and 19 - 20, will continue to operate below the Concept LOS through 2030.

February 2014
Page 49
Table 4 Status of Facility Completion
SEGMENT COUNTY EXISTING
FACILITY PROPOSED
ON NEW ALIGNMENT STATUS
9 FRE 2C 4F Open to Traffic
10 FRE - 6F Open to Traffic
11 FRE - 6F+Aux Open to Traffic
12 FRE - 6F+Aux Braided ramp: In construction
13 FRE 4C 6F Open to Traffic
14 FRE 2C 4F Open to Traffic
15 FRE 2C 4E Open to Traffic
16 FRE 2C 2E Open to Traffic
V. Planned and Programmed Improvements to State Route 180 The primary funding for SR 180 highway projects comes from the Fresno County Transportation Authority - Measure “C” sales tax, the State Transportation Improvement Program (STIP), or the State Highway Operation Protection Program (SHOPP) funds. The following tables show both the planned and programmed projects for SR 180 through 2030. The planned projects include candidate projects for the STIP and SHOPP, as well as ITSP and RTP projects. The programmed projects include actual projects in the STIP, SHOPP, or TCRP that are partially or fully funded. It should be noted that STIP projects are capacity increasing only while SHOPP projects can include maintenance, safety, and operational improvements.

February 2014
Page 50
TABLE 5 PLANNED AND PROGRAMMED PROJECTS
Segment PM/KP
From/To
SR 180 Planned Projects
SR 180 Programmed Projects
1 - 2
Fresno PM 0.00/23.50
San Benito Co Line (Unconstructed) to SR 33
A Route Adoption Study has been completed to determine an alignment between Interstate 5 and Route 33. There is $35 million included in Federal appropriations designated for improvements from Interstate 5 to State Route 33. These funds are not yet programmed.
There are no programmed projects for these segments of highway.
3
Fresno PM 23.50/24.90
SR 33 to 0.3 Mi E of Belmont Ave
There are no planned projects for this segment of highway.
There are no programmed projects for this segment of highway.
4
Fresno PM 24.90/26.10
0.3 Mi E of Belmont Ave to
Panoche Rd There are no planned projects for this segment of highway.
There are no programmed projects for this segment of highway.
5
Fresno PM 26.10/34.60 Panoche Rd to
James Rd
Future SHOPP Funding: Scour mitigation; candidate project in Fresno County at the Fresno Slough Bridge, BR 42-0041.
There are no programmed projects for this segment of highway.
6
Fresno PM 34.60/42.10
James Rd to Del Norte Ave
2004 Measure “C” Expenditure Plan – Fre-180 PM 35/36.60, KP 56.30/58.90. Add Passing Lanes (Future).
2004 Measure “C” Expenditure Plan – Fre-180 PM 35/36.60, KP 56.30/58.90. Add Passing Lanes (Future).
7-10
Fresno PM 42.10/R56.20
Del Norte Ave to 0.2 Mi W of
SR 99
2012 STIP Funding: Highway planting in and near Fresno from 0.2 mil west of Brawley Avenue to 0.2 Mi east of Teilman Ave; PM R53.4 – R 56.0.
In and near Fresno from 0.2 mil west of Brawley Avenue to 0.2 Mi east of Teilman Ave; PM R53.4 – R 56.0.
11
Fresno PM R56.20/R58.40
0.2 Mi W of SR 99 To 0.4 Mi W of SR 41
There are no planned projects for this segment of highway.
There are no programmed projects for this segment of highway.

February 2014
Page 51
TABLE 5 PLANNED AND PROGRAMMED PROJECTS
Segment PM/KP
From/To
SR 180 Planned Projects
SR 180 Programmed Projects
12 - 14 Fresno
PM R58.40/R64.40 0.4 MI W of SR 41 to
Fowler Avenue
Measure C Expenditure Plan: SR 41 to SR 168 PM 59.13/R60.1; Add braided ramps; Under Construction. Measure C Expenditure Plan: 180 Braided Ramps Landscape: From 0.25 Mi west of SR 180s/41 separation to 0.5 Mi east of Beach Avenue: Freeway Landscaping, PM R57.9 – R62.4.
Measure C Expenditure Plan: SR 41 to SR 168 PM 59.13/R60.1, KP 95.16/96.72 – Add braided ramps; Under Construction Measure C Expenditure Plan: 180 Braided Ramps Landscape:From 0.25 Mi west of SR 180s/41 separation to 0.5 Mi east of Beach Avenue: Freeway Landscaping, PM R57.9 – R62.4.
14 - 15 Fresno
PM R64.40/65.5 Chestnut Ave UC to
Temperance Ave
2008 STIP Funding: Highway planting and irrigation in Fresno County from 0.3 Mi west of Clovis Ave OC to 0.8 Mi east of Temperance Ave, PM R62.6 – R66.3; 180 Freeway Landscape; in construction. PID, Future STIP Funding: Water conversion in the City of Fresno from 0.2 Mi west of Fowler Ave UC to Temperance Ave, PM S64.2 – S65.5; Surface Water Pump and Filtration System. Inactive.
2008 STIP Funding: Highway planting and irrigation in Fresno County from 0.3 Mi west of Clovis Ave OC to 0.8 Mi east of Temperance Ave, PM R62.6 – R66.3; 180 Freeway Landscape; in construction. PID, Future STIP Funding: Water conversion in the City of Fresno from 0.2 Mi west of Fowler Ave UC to Temperance Ave, PM S64.2 – S65.5; Surface Water Pump and Filtration System. Inactive.
16 - 17 Fresno
PM 71.60/78.0 Academy Ave to Frankwood Ave
2000 STIP Funding: Construct a new expressway from 0.6 Mi west of Quality Ave to 0.2 Mi west of Smith Avenue; PM R71.8 – 74.5; Kings Canyon Expressway Seg. 2; In construction. 2000 STIP Funding: Construct 2C to 4E on new alignment near Centerville and Minkler, from west of Smith Ave to east of Frankwood Ave; PM R75.0 – R78.2; Kings Canyon Expressway Seg. 3.
2000 STIP Funding: Construct a new expressway from 0.6 Mi west of Quality Ave to 0.2 Mi west of Smith Avenue; PM R71.8 – 74.5; Kings Canyon Expressway Seg. 2; In construction. 2000 STIP Funding: Construct 2C to 4E on new alignment near Centerville and Minkler, from west of Smith Ave to east of Frankwood Ave; PM R75.0 – R78.2; Kings Canyon Expressway Seg. 3.
18
Fresno PM 78.0/83.8
Frankwood Ave to Cove Road
Future STIP Funding: Convert 2C to 4E between Frankwood Avenue and Cove Road
There are no programmed projects for these segments of highway.
19 Fresno
PM 83.8/87.7 Cove Road to SR 63
There are no planned projects for this segment of highway.
There are no programmed projects for these segments of highway.
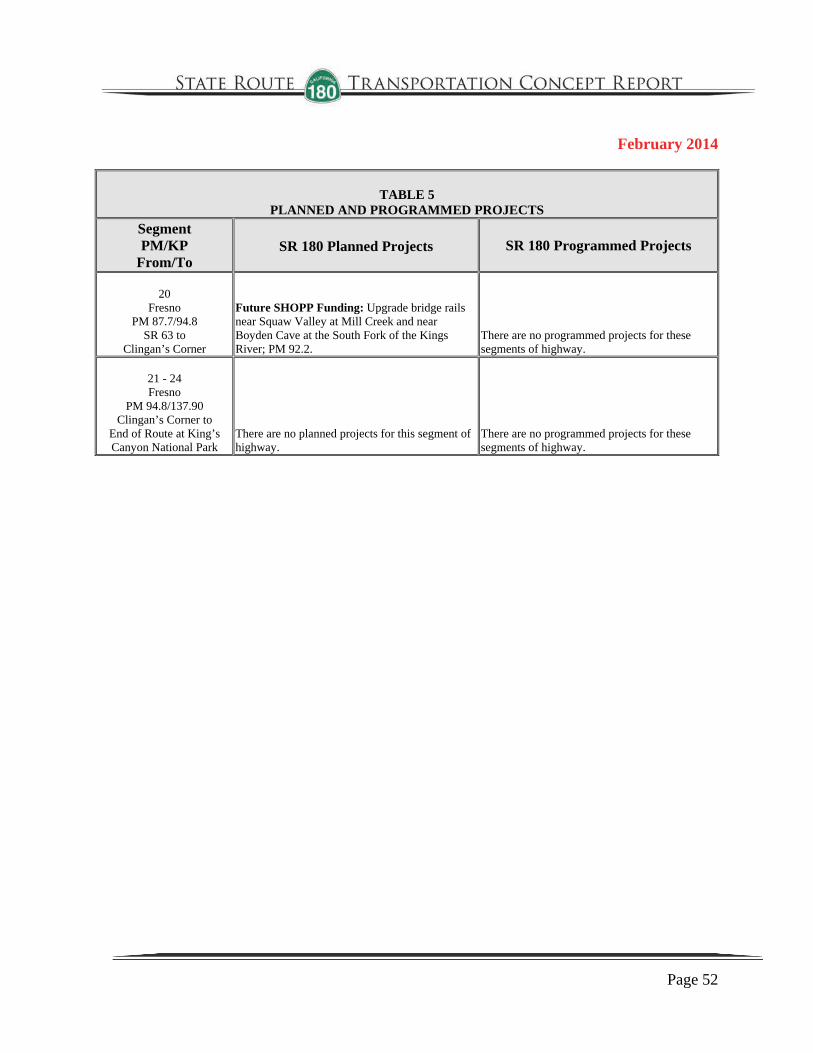
February 2014
Page 52
TABLE 5 PLANNED AND PROGRAMMED PROJECTS
Segment PM/KP
From/To
SR 180 Planned Projects
SR 180 Programmed Projects
20
Fresno PM 87.7/94.8
SR 63 to Clingan’s Corner
Future SHOPP Funding: Upgrade bridge rails near Squaw Valley at Mill Creek and near Boyden Cave at the South Fork of the Kings River; PM 92.2.
There are no programmed projects for these segments of highway.
21 - 24 Fresno
PM 94.8/137.90 Clingan’s Corner to
End of Route at King’s Canyon National Park
There are no planned projects for this segment of highway.
There are no programmed projects for these segments of highway.
February 2014
Page 53
VI. Appendices Reference Sheet includes MPO/Air Quality District contact information, references used in the TCR,
transit services and traffic accident information.
Level of Service
Non-Motorized Facilities Intelligent Transportation Systems information
Documents used in the preparation of this TCR Acronyms and definitions used throughout the TCR

February 2014
Page 54
Appendix A: References Local Jurisdictions Fresno Council of Governments (FCOG) 2035 Tulare Street, Suite 201 Fresno, California 93721 (559) 233-4148 Tulare County Association of Governments (TCAG) 210 N. Church Street, Suite B| Visalia, CA 93291 (559) 623-0450
County of Fresno 2220 Tulare Street, Suite 300 Fresno, California 93721 (559) 488 3546
City of Clovis 1033 Fifth Street Clovis, CA 93612 (559) 324-2000 City of Fresno 2600 Fresno Street Fresno, CA 93721 (559) 621-8650 City of Kerman 850 S. Madera Avenue Kerman, California 93630 (559) 846-9384 City of Mendota City Hall 643 Quince Street Mendota, Ca. 93640
Air Quality District: San Joaquin Valley Air Pollution Control District 1990 E Gettysburg Ave Fresno, CA 93726 (559) 230-6000
Air Basin: San Joaquin Valley
Transit Services: For inquiries on transit services, please contact the MPO or local agency (listed above) for more information.
February 2014
Page 55
Appendix B Level Of Service (LOS)
Level of Service (LOS) is a qualitative measure of operating conditions within a traffic stream, and their perception by motorists and/or passengers. A LOS definition generally describes these conditions in terms of such factors as speed, travel time, freedom to maneuver, comfort, convenience, and safety. LOS A on freeways describes primary free-flow operations. Average operating speeds at the freeflow speed generally prevail. Vehicles are almost unimpeded in their ability to maneuver within the traffic stream. On intersections LOS A describes operations with very low delay, up to 5 seconds per vehicle. This LOS occurs when progression is extremely favorable and most vehicles arrive during the green phase. LOS B represents a reasonable free-flow, and speeds are generally maintained. The ability to maneuver within the traffic stream is only slightly restricted, and the general level of physical and psychological comfort provided to drivers is still high. For intersections, LOS B describes operations with delay greater than 5 and up to 15 seconds per vehicle. This level generally occurs with good progression, short cycle lengths, or both. LOS C provides for flow with speeds still at or near the freeway flow speed of the freeway. Freedom to maneuver within the traffic stream is noticeably restricted at LOS C, and lane changes require more vigilance on the part of the driver. For intersections, LOS C describes operations with delay greater than 15 and up to 25 seconds per vehicle. LOS D is the level at which speeds begin to decline slightly with increasing flows. In this range, density begins to deteriorate somewhat more quickly with increasing flow. Freedom to maneuver within the traffic stream is more noticeably limited, and the driver experiences reduced physical and psychological comfort levels. Even minor incidents can be expected to create queuing, because the traffic stream has little space to absorb disruptions. For intersections, LOS D describes operations with delay greater than 25 and up to 40 seconds per vehicle. LOS E on freeways is the value that corresponds to the maximum flow rate, or capacity, on the facility. Operations in this level are volatile, because there are virtually no usable gaps in the traffic stream. For intersections, LOS E describes operations with delay greater than 40 and up to 60 seconds per vehicle. LOS F on freeways represents a stop and go, low speed conditions with little or poor maneuverability. Speed and traffic flow may drop to zero and considerable delays occur. For intersections, LOS F describes operations with delay in excess of 60 seconds per vehicle. This

February 2014
Page 56
level, considered by most drivers unacceptable often occurs with oversaturation, that is, when arrival flow rates exceed the capacity of the intersection. Levels of Service for different facilities can generally be categorized as follows:
Used for all freeways and expressways
LOS
Demand/Capacity Ratio
Congestion or Delay
Traffic Description
F0 1.01-1.25 Considerable; 0-1 hour delay
Forced Flow, heavy congestion, long queues form behind breakdown points, stop and go
F1 1.26-1.35 Severe, 1-2 hour delay
Very heavy congestion, very long queues
F2 1.36-1.45 Very severe 2-3 hour delay
Extremely heavy congestion, longer queues, more numerous breakdown points, longer stop periods
F3 >1.46 Extremely severe; 3+ hours of delay
Gridlock
Used for two and four lane freeways and expressways
LOS
Demand/Capacity Ratio
Congestion or Delay
Traffic Description
A <0.34 None Free flow B 0.35-0.52 None Free to stable flow, light to moderate
volumes C 0.53-0.69 None to minimal Stable flow, moderate volumes, freedom to
maneuver noticeable restricted D 0.70-0.92 Minimal to
substantial Approaches unstable flow, heavy volumes, very limited freedom to maneuver
E 0.93-1.00 Significant Extremely unstable flow, maneuverability and psychological comfort extremely poor
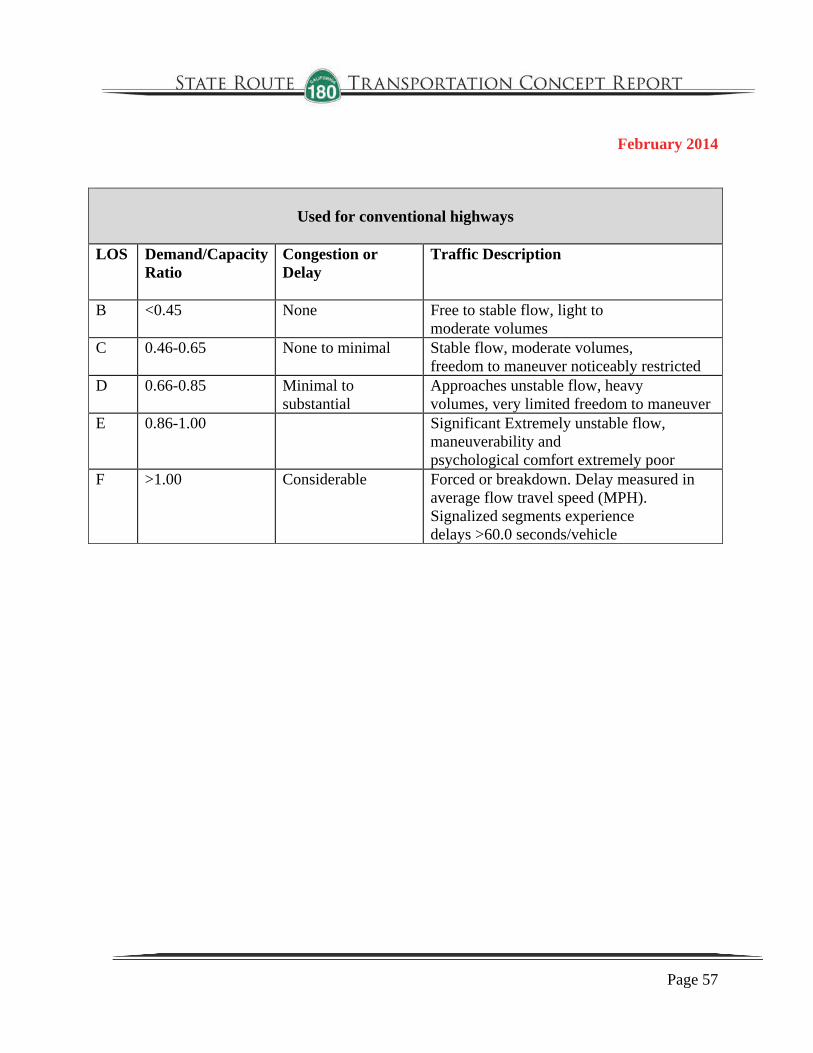
February 2014
Page 57
Used for conventional highways
LOS
Demand/Capacity Ratio
Congestion or Delay
Traffic Description
B <0.45 None Free to stable flow, light to moderate volumes
C 0.46-0.65 None to minimal Stable flow, moderate volumes, freedom to maneuver noticeably restricted
D 0.66-0.85 Minimal to substantial
Approaches unstable flow, heavy volumes, very limited freedom to maneuver
E 0.86-1.00 Significant Extremely unstable flow, maneuverability and psychological comfort extremely poor
F >1.00 Considerable Forced or breakdown. Delay measured in average flow travel speed (MPH). Signalized segments experience delays >60.0 seconds/vehicle

Location (Postmile) Facility (Lanes)
Rural/Urban
Shoulder (Treated) Terrain
Speed Limit Posted Facility Description
(PM 0.0 – 23.50) Unconstructed; State Route 33 to Del Norte Avenue (PM 23.50 – 42.14)
2/4 Lane Highway
Urban/Rural 0 ‐ 8 feet Level 35 & 55
Wide shoulders from Kings Slough to Del Norte Ave PM 27 – 42, City of Mendota PM 23.50 – 24.38, Agricultural land surroundings
Del Norte Avenue to Brawley Avenue (PM 42.14 – R53.60)
2/4 Lane Highway
Urban/Rural 8 feet Level
40, 50 & 55
Wide Shoulders, City of Kerman PM 42.14 – 43.60, Surrounding agricultural land use
Brawley Avenue to Temperance Avenue (PM R53.60 – 65.55)
4/6 Lane Freeway Urban 8 – 10 feet Level 65
BICYCLE AND PEDESTRIAN ACCESS PROHIBITED ON FREEWAY, City of Fresno city limits, Alternate bicycle route available
Temperance Avenue to Frankwood Avenue (PM 65.55 – 78.99)
2 Lane Highway/ 4 Lane
Expressway Rural 0 ‐ 8 feet Level 55 & 65
Narrow shoulders mostly, 4 Lane expressway construction in future, Communities of Centerville and Minkler, Grazing and agricultural land alongside route
Frankwood Avenue to Kings Canyon Nat. Park (PM 78.99 – 137.94)
2 Lane Highway Rural 0 ‐ 8 feet
Level to Mountain‐
ous 55
Mostly narrow shoulders, Agricultural land, Mountainous winding road, 1 mi section in Tulare Co, Squaw Valley PM 90, At PM 110 Grant Grove ‐ Restaurant, foodmart and lodging
STATE ROUTE 180 Fresno/Tulare County Bicycle Map
Unconstructed (PM0.0‐23.50) SR 33 Del Norte Ave BrawleyAve Temperance Ave Frankwood Ave Kings Canyon Nat. Park
PM 0.0 PM 23.50 PM 42.14 PM R53.60 PM 65.55 PM R78.20 PM 137.94
Appendix C: Non-Motorized Facilities
Page | 58
February 2014
Page 59
Bicycle Facilities: Bicycle facilities within the state are classified into four categories: Class 1 Bikeways (Bike Paths): Bike Paths are separate off-highway facilities for the exclusive use of bicyclists and with cross flow by motor vehicles minimized. Class 2 Bikeways (Bike Lanes): Bike Lanes are for preferential use by bicyclists and can be established within the paved area of state highways. Such facilities are approved by, and subsequently maintained by, local jurisdictions and/or Caltrans. Bike lanes are separated from traffic lanes on California highways by the use of a painted 6” stripe on the pavement and are designated as bike lanes by the use of white R81 (Bike Lane), R-81A (Begin) and R81-B (End) “regulatory” signs (MUTCD Chapter 9 - California Supplement - 2004). Class 3 Bikeways (Bike Routes): Bike Routes are shared facilities which serve either to (a) provide continuity to other bike facilities (usually a Class 1 or Class 2 bikeway); or (b) to designate a preferred route through a high demand corridor. Such facilities are approved by, and subsequently maintained by, local jurisdictions and/or Caltrans. Bike Routes are not separated from traffic lanes but are designated as bike routes through the use of green D11-1 (Bike Route), M4-11 (Begin) and M4-12 (End) “guide” signs. (MUTCD - Chapter 9 - 2003). Shared Roadway (No Bikeway Designation): Most bicycle travel on conventional state highways and local streets occurs on facilities without any bikeway designations, signs or striping. Virtually all highways in use by bicyclists for inter-city and recreational travel fall under this “share-the-road” scenario.
(1) Deputy Directive 64-R1 (DD-64-R1) - (Policy) The Department provides for the needs of travelers of all ages and abilities in all programming, planning, design,, construction, operations and maintenance activities and products on the State highway system. The Department views all transportation improvements as opportunities to improve safety, access, and mobility for all travelers in California and recognizes bicycles, pedestrians and transit modes as integral elements of the transportation system.” (2) PDPM - Chapter 31 (Non-motorized Transportation Facilities) Section 1 - General - Introduction “.... State and federal laws require Caltrans to promote and facilitate increased use of non-motorized transportation. The purpose of this chapter is to outline pertinent statutory requirements, planning policies, and implementing procedures regarding non-motorized transportation facilities.” (3) Streets and Highway Code - Section 888 - “The department shall not construct a state highway as a freeway that will result in the severance or destruction of an existing major route for non-motorized transportation traffic and light motorcycles, unless it provides a reasonable, safe, and convenient alternate route, or such a route already exists.” (4) California Vehicle Code - Section 21960 (Bikes & Pedestrians on Freeways) (a) The Department of Transportation and local authorities [i.e. acting together - not separately], [may] by order, ordinance, or resolution, with respect to freeways, expressways ... prohibit or restrict the use of the freeways, expressways, or any portion thereof by pedestrians, bicycles or other non-motorized traffic...”

February 2014
Page 60
Complete Streets and Context Sensitive Solutions
Complete Street: A transportation facility that is planned, designed, operated, and maintained to provide safe mobility for all users, including bicyclists, pedestrians, transit riders, and motorists appropriate to the function and context of the facility. In towns and cities across California, the State highway may be the only through street or may function as a local street. These communities desire that their main street be an economic, social, and cultural asset as well as provide for the safe and efficient movement of people and goods. In urban areas, communities want transportation projects to provide opportunities for enhanced non-motorized travel and visual quality.
(1) Deputy Directive 64-R1 (DD-64-R1) - (Policy) “The Department develops integrated multimodal projects in balance with community goals, plans, and values. Addressing the safety and mobility needs of bicyclists, pedestrians, and transit users in all projects, regardless of funding, is implicit in these objectives. Bicycle, pedestrian, and transit travel is facilitated by creating “complete streets” beginning early in system planning and continuing through project delivery and maintenance and operations.” (2) Director’s Policy – “The Department uses ‘Context Sensitive Solutions’ as an approach to plan, design, construct, maintain, and operate its transportation system. These solutions use innovative and inclusive approaches that integrate and balance community, aesthetic, historic, and environmental values with transportation safety, maintenance, and performance goals.”
February 2014
Page 61
Appendix D Intelligent Transportation Systems (ITS)
ITS are any electronic transportation system that communicates information to the traveler that will improve safety and efficiency. ITS includes traffic signals, closed-circuit televisions, changeable message signs, ramp meters, weigh-in-motion devices, roadway service patrols, weather stations, highway advisory radio stations, and transportation management centers. Traveler Information Broadcast Systems, traffic signal priority for emergency or transit vehicles, ITS data archive management, and vehicle safety warning systems are all a part of ITS. Also included is centralizing the control of many of these components from traffic or transit management centers. Deployment of ITS technology will enhance traveler information services, as well as the operational and safety efficiency of the route by informing motorists of traffic congestion, inclement weather such as fog, dust, highway construction and/or closings. Currently, there is a regional architecture in existence called the “San Joaquin Valley ITS.” This architecture covers the 8 counties within the San Joaquin Valley (San Joaquin, Stanislaus, Merced, Madera, Fresno, Kings, Tulare, and Kern). This Plan is available at: http://www.kimleyhorn. com/Caarchitecture/task9/sjintro.htm. 511 Traveler Information System On July 21, 2000, the Federal Communications Commission (FCC) designated 511 as the single travel information telephone number to be made available to states and local jurisdictions across the country. The 511 system provides information about travel conditions, allowing travelers to make better choices: choice of time, choice of route, and choice of mode of transportation. It can also be expanded to provide transit information and rideshare options. SAFETEA-LU mentions provisions for the 511 system to be implemented at the regional level as the urban metropolitan areas convert their existing traveler systems or establish enhanced 511 services. The state is divided into nine sections on the CalTrans Quickmap website:
San Diego (also located on the Web at www.511sd.com) Southern California Ventura Bay Area (also located on the Web at www.511.com) Yosemite (also located on the Web at www.yosemite.com) North Coast Northern California Central California (also located on the Web at www.511sjv.org Travelers in the Sacramento region may visit www.sacregion511.org. At this time, the Central Coast is still unavailable.

February 2014
Page 62
Detection Detection is one of the most important components of ITS. Detection refers to the real-time measurement of transportation movements and conditions. In the past, measurements have been conducted periodically (such as once per year) and those measurements were used to determine the need for infrastructure expansion. Optimizing management strategies will require that accurate, on-going data collection be provided by detection systems placed throughout the corridor. Without detection systems, transportation agencies cannot implement advanced traffic control strategies, cannot inform the public about traffic conditions, expected delays and options, and cannot detect and react to incidents quickly enough to minimize the impacts created by those incidents. The State Route within the limits of this TCR does not currently include a sufficient detection system to fully optimize these strategies. Improvement projects are typically planned to include detection units as part of the construction. Caltrans commitment to the installation of detection units includes installing wireless radar units at the first available opportunity. Even though these wireless units would be part of the project, they can be installed before construction, without the effort and cost of disturbing a more traditional system when the road construction begins. Traffic Control Traffic control, another element of ITS, includes signal strategies for managing traffic flows on arterials as well as ramp metering on the freeway system. These strategies offer great promise to improve the productivity of the transportation system. There are, however, challenges for Caltrans in utilizing some of these options. Local agencies are often concerned that traffic control devices will cause additional traffic to choose local streets as an alternative. Caltrans will need to work with local partners to reach solutions that will be agreeable to all parties. Incident Management Incident Management is a significant component of ITS. Most studies in the United States suggest that incidents such as accidents, special events, and severe weather conditions are responsible for about half of the delay on our freeway system. Motorists are accustomed to normal delays. However, traffic incidents disrupt the motorist’s normal routine, creating unplanned delays. Such delays can cause negative impacts to motorists. Unanticipated delays may also create frustration, aggressive driving, and the potential for “Road Rage.” Such aggressive behavior poses a danger not only to other motorists but also to emergency response personnel. The goal of effective Traffic Incident Management (TIM) is to reduce the time it takes to clear traffic incidents from the roadway. The less time it takes to clear an incident, the less congestion and delay the motorist experiences. Safety for both the emergency response personnel and the traveling public is improved. Even small improvements in this process can

February 2014
Page 63
yield significant benefits. Effective TIM relies on advanced technologies to allow for expedited incident detection, verification, coordination among necessary emergency response agencies, and the subsequent clearance of an incident as rapidly as possible. Collision and/or natural causes will often require lane or road closures. Changeable Message Signs (CMS) systems are used to inform travelers of the road closure, and, if applicable, existing traffic control [such as one-way controlled traffic, California Highway Patrol (CHP) pace vehicles] and the estimated amount of delay. CMS systems are also used to warn of high winds and accidents. Advanced Traveler Information Systems One of the more progressive components of ITS is the Advanced Traveler Information System (ATIS). Most commuters get information about traffic conditions from the media; for instance, radio stations. ATIS will provide modal-specific, time-of-day demand data that will allow travelers to get the most out of the transportation system. The system would allow travelers to manage their trips in the most efficient manner. Implementing advanced traveler information systems requires a partnership between transportation agencies and the public. However, it is clear that the framework is not yet fully developed and that, at this time, current detection systems are not adequate for real-time, tailored information. Transportation Management Centers Effective ITS implementation requires coordination of all components. TMCs play an important role in day-to-day system management, providing coordinated incident responses, as well as integration of various systems. An example of integration would be the coordination of ramp metering and arterial signal management. Traveler information also requires sharing data with both public and private partners. Different agencies, such as Caltrans, CHP, and the media, play different roles and have different systems for incident management. The TMC integrates these roles and systems in one location to optimize performance. TMCs are used in emergencies, Amber Alerts, and provide an Emergency Operations Center function during natural disasters, such as earthquakes. TMCs also serve a security preparedness function; staff can monitor the urban freeway system, quickly activate response strategies (such as changeable message signs), or notify the proper authorities when security risks are identified. Logical phasing for implementing the components of an effective Traffic Management System would be:
1. Installing simple, adaptive-scheme ramp metering; 2. Optimizing the meter rates; 3. Implementing a corridor adaptive ramp-metering scheme within urbanized areas;

February 2014
Page 64
4. Advanced arterial signal actuation strategies and improved incident management; and 5. With all of these in place, a comprehensive traveler information system as the final goal.
Monitoring and evaluation are the foundations for sound management of the corridor and will help to identify the optimum strategies to improve the transportation corridor. Strategies range from maintenance and preservation to system expansion, but will focus on optimization of the existing system by fully incorporating operational strategies into the management plan. Implementation of ITS strategies will complement other improvements, including those improvements that may be implemented by partner agencies such as transit, light rail, and improvements on the local road system. The goal is that the whole of the transportation system, including highways, local roads, and alternative means of transportation, operate as one seamless network. Transportation Demand Management Transportation Demand Management is designed to reduce vehicle trips during peak hours. Transportation Demand Management is specifically targeted at the work force, as commuters generate the majority of peak hour traffic. Incorporating these strategies is a part of land use decisions, the prerogative of local government. Strategies include:
Rideshare programs Transit usage Flex hours Vanpools Bicycling and walking Telecommuting Mixed land uses (jobs – housing balance)
Transportation Demand Management programs could be required by local jurisdictions for any large commercial or office project and could be tied to incentives of some sort to encourage the development of such programs.
February 2014
Page 65
Appendix E Documents Used in the Preparation of this TCR
1) 2002 Global Gateways Development Program; Caltrans 2) 2011 Regional Transportation Plan; Fresno County; July 2010 3) 2011 Regional Transportation Plan; Tulare County; July 2010 4) California State Rail Plan; Caltrans; March 2008 5) Caltrans District 6 SR 180 Transportation Concept Report, Caltrans, August 2004 6) Central California Regional Aviation System Plan, Phase I; Kern Council of Governments;
September 1994 7) City of Clovis General Plan; Clovis; 1993 8) City of Fresno General Plan; Fresno; February 2002 9) City of Kerman General Plan; Kerman, 2007 10) City of Mendota General Plan; Mendota, 2011 11) County of Fresno General Plan; Fresno County; August 2010 12) District 6 Bicycle Route Inventory for California State Highways (District 6 Edition),
Caltrans, May 2004 13) Goods Movement Action Plan; Business, Transportation and Housing Agency and
California Environmental Protection Agency, January 2007 14) Interregional Improvement Track-Interregional Road System Plan (ITSP), 1998, 2000 15) Interregional Transportation Strategic Plan; Caltrans, June 1998 16) Mainstreaming ITS and Use in the Planning and Programming Environment, Caltrans;
November 2002 17) Regional Transportation Plan; Fresno Council of Governments; July 2010 18) Regional Transportation Plan; Tulare County Association of Governments; July 2010 19) Route Adoption Study Report, SR 180 near Fresno, from Interstate 5 to Brawler Avenue;
Caltrans District 6; March 2013 20) San Joaquin Valley Regional Goods Movement Plan, San Joaquin Valley Regional
Transportation Planning Agencies; August 2013 21) Transportation Management System (TMS) Master Plan; Caltrans, February 2004 22) Traffic Operations Strategic Plan, Caltrans, September 1999

February 2014
Page 66
Appendix F Acronyms and Definitions
Acronyms 2C – Two-lane conventional highway 2E – Two-lane expressway 4C – Four-lane conventional highway 4E – Four-lane expressway 6C – Six-lane conventional highway (rare) 6E – Six-lane expressway 6F – Six-lane freeway 8E – Eight-lane expressway (rare) 8F – Eight-lane freeway 10F – Ten-lane freeway AADT - Average Annual Daily Traffic ADA - Americans with Disabilities Act ADT- Average Daily Traffic ARRA - American Recovery and Reinvestment Act ATIS - Advanced Traveler Information System ATMIS - Advanced Transportation Management Information Systems BNSF - Burlington Northern Santa Fe BRT - Bus rapid transit CALTRANS – California Department of Transportation CAPM - Capital Preventive Maintenance CCTV - Closed Circuit Television Cameras CEQA- California Environmental Quality Act CHP - California Highway Patrol CIB - California Interregional Blueprint CL - California Legal CMA- Congestion Management Agencies CMAQ - Congestion Mitigation and Air Quality CMIA-Corridor Mobility Improvement Account CMS - Changeable Message Sign COG-Council of Governments CSMP-Corridor System Management Plan CSS – Context Sensitive Solutions CT - Caltrans CTC - California Transportation Commission CTP - California Transportation Plan EB - Eastbound F - Focus
February 2014
Page 67
FAX - Fresno Area Express FCOG - Fresno Council of Governments FCRTA - Fresno County Regional Transit Agency FHWA – Federal highway Administration FSR – Feasibility Study Report FSTIP- Federal Statewide Transportation Improvement Program FTIP – Federal Transportation Improvement Program FRE - Fresno County FYI - Fresno Yosemite International Airport GET - Golden Empire Transit GHG- Green House Gas GIS – Geographic Information System GRS - Growth Response Study HAR - Highway Advisory Radio HCP- Habitat Conservation Plan HE - High Emphasis HOT-High occupancy toll lane HOV - High-Occupancy Vehicle Lanes HSRA - High Speed Rail Authority I-5 - Interstate 5 IGR-Intergovernmental Review IIP - Interregional Improvement Program IRRS - Interregional Road System ITIP-Interregional Transportation Improvement Program ITMS-Intermodal Transportation Management System ITS - Intelligent Transportation System ITSP - Interregional Transportation Strategic Plan JPA - Joint Powers Authority KART - Kings Area Rural Transit KCAG - Kings County Association of Governments KCAPTA - Kings County Area Public Transit Agency KCOG - Kern Council of Governments KER - Kern County KIN - Kings County LNAS - Lemoore Naval Air Station LOS - Level of Service MAD - Madera County MAP-21-Moving Ahead for Progress in the 21st Century Act MAX - Madera Area Express MCAG - Merced County Association of Governments MCC - Madera County Connection MCLTC - Mariposa County Local Transportation Commission
February 2014
Page 68
MCTC - Madera County Transportation Commission MPA - Mariposa County MPO - Metropolitan Planning Organization MPO- Metropolitan Planning Organizations MTC-Metropolitan Transportation Commission MTCE-Maintenance (State program) NA-Not available NB – Northbound NCCP- Natural Community Conservation Plan ND - Not Determined NEPA- National Environmental Policy Act NHN - National Highway Network NHS-National Highway System NOA – Naturally Occurring Asbestos OC - Overcrossing OH – Overhead PID-Project Initiation Document PM – Postmile PSR- Project Study Report PSSR-Project Scope Summary Report RCR-Route Concept Report RHNA- Regional Housing Needs Allocation RIP - Regional Improvement Program ROW or R/W - Right-of-Way RPU-Remote Processing Unit – was known as RWIS (Remote Weather Information Station) RTIP – Regional Transportation Improvement Program RTP - Regional Transportation Plan RTPA - Regional Transportation Planning Agencies RWIS - Remote Weather information Station SAFETEA - Safe, Accountable, Flexible and Efficient Transportation Equity Act of 2005 SB – Southbound SCS- Sustainable Community Strategies SHOPP - State Highway Operation Protection Program SJCOG - San Joaquin Council of Governments SJUAPCD - San Joaquin Unified Air Pollution Control District SJV - San Joaquin Valley SJVRR - San Joaquin Valley Railroad SJVTPA - San Joaquin Valley Regional Transportation Planning Agencies SOV - Single Occupancy Vehicle SR - State Route STAA - Surface Transportation Assistance Act StanCOG - Stanislaus Council of Governments

February 2014
Page 69
STIP - State Transportation Improvement Program TA - Terminal Access TASAS-Traffic Accident Surveillance and Analysis System TCAG - Tulare Association of Governments TCM - Transportation Control Measure TCR - Transportation Concept Report TCRP - Transportation Congestion Relief Program TCS-Traffic Count Station TDM - Transportation Demand Management TEA-21 Transportation Equity Act for the 21st Century TIM - Traffic Incident Management TMC - Transportation Management Center TMS - Transportation Management System TSN- Transportation System Network UC - Undercrossing UP - Union Pacific UTC - Ultimate Transportation Concept VDS-Vehicle Detection System VHT - Vehicle Hours Traveled VMT - Vehicle Miles Traveled WB - Westbound YARTS - Yosemite Area Regional Transportation System Definitions AADT – Annual Average Daily Traffic is the total volume for the year divided by 365 days. The traffic count year is from October 1st through September 30th. Traffic counting is generally performed by electronic counting instruments moved from location throughout the state in a program of continuous traffic count sampling. The resulting counts are adjusted to an estimate of annual average daily traffic by compensating for seasonal influence, weekly variation and other variables which may be present. Annual ADT is necessary for presenting a statewide picture of traffic flow, evaluating traffic trends, computing accident rates, planning and designing highways and other purposes. Arterial Highway - A general term denoting a highway primarily for through travel usually on a continuous route. Auxiliary Lane – The portion of the roadway for weaving, truck climbing, speed change, or for other purposes supplementary to through movement. Base year – The year that the most current data is available to the Districts

February 2014
Page 70
Bikeway Class I (Bike Path) – Provides a completely separated right of way for the exclusive use of bicycles and pedestrians with cross flow by motorists minimized. Bikeway Class II (Bike Lane) – Provides a striped lane for one-way bike travel on a street or highway. Bikeway Class III (Bike Route) – Provides for shared use with pedestrian or motor vehicle traffic. Bottlenecks – A bottleneck is a location where traffic demand exceeds the effective carrying capacity of the roadway. In most cases, the cause of a bottleneck relates to a sudden reduction in capacity, such as a lane drop, merging and weaving, driver distractions, a surge in demand, or a combination of factors. Bypass – An arterial highway that permits users to avoid part or all of a city or town center, a suburban area or an urban area. Capacity – The maximum sustainable hourly flow rate at which persons or vehicles reasonably can be expected to traverse a point or a uniform section of a lane or roadway during a given time period under prevailing roadway, environmental, traffic, and control conditions. Capital Facility Concept – The 20-25 year vision of future development on the route to the capital facility. The capital facility can include capacity increasing, State Highway, bicycle facility, pedestrian facility, transit facility (Intercity Passenger Rail, Mass Transit Guideway etc.), grade separation, and new managed lanes. Channelization - The separation or regulation of conflicting movements into definite paths of travel by the use of pavement markings, raised islands, or other suitable means to facilitate the safe and orderly movement of vehicles, bicycles, and pedestrians. Collector Road – A route that serves travel of primarily intracountry rather than statewide importance in rural areas or a route that serves both land access and traffic circulation within a residential neighborhood, as well as commercial and industrial areas in urban and suburban areas. Concept LOS – The minimum acceptable LOS over the next 20-25 years Conceptual Project – A conceptual improvement or action is a project that is needed to maintain mobility or serve multimodal users, but is not currently included in a fiscally constrained plan and is not currently programmed. It could be included in a General Plan or in the unconstrained section of a long-term plan.

February 2014
Page 71
Conventional Highway - A highway without control of access which may or may not be divided. Grade separations at intersections or access control may be used when justified at spot locations. Corridor – A broad geographical band that follows a general directional flow connecting major sources of trips that may contain a number of streets, highways, bicycle, pedestrian, and transit route alignments. Off system facilities are included as informational purposes and not analyzed in the TCR. Crosswalk – That portion of a roadway included within the prolongation or connection of the boundary lines of sidewalks at intersections where the intersecting roadways meet at approximately right angles, except the prolongation of such lines from an alley across a street. Any portion of a roadway distinctly indicated for pedestrian crossing by lines or other markings on the surface. Divided Highway – A highway with separated roadbeds for traffic traveling in opposing directions. Expressway – An arterial highway with at least partial control of access, which may or may not be divided or have grade separations at intersections. Facility Concept – Describe the Facility and strategies that may be needed within 20-25 years. This can include capacity increasing, State Highway, bicycle facility, pedestrian facility, transit facility, Non-capacity increasing operational improvements, new managed lanes, conversion of existing managed lanes to another managed lane type or characteristic, TMS field elements, Transportation Demand Management and Incident Management. Facility Type – The facility type describes the State Highway facility type. The facility could be freeway, expressway, conventional, or one-way city street. Freeway – A highway in respect to which the owners of abutting lands have no right or easement of access to or from their abutting lands or in respect to which such owners have only limited or restricted right or easement access. A divided arterial highway with full control of access and with grade separations at intersections. Freight Generator – Any facility, business, manufacturing plant, distribution center, industrial development, or other location (convergence of commodity and transportation system) that produces significant commodity flow, measured in tonnage, weight, carload, or truck volume. Frontage Street or Road – A local street or road auxiliary to and located on the side of an arterial highway for service to abutting property and adjacent areas and for control of access.

February 2014
Page 72
Grade Separation – A crossing of two highways, highway and local road, or a highway and a railroad at different levels. Headway – The time between two successive vehicles as they pass a point on the roadway, measured from the same common feature of both vehicles. Horizon Year – The year that the future (20-25 years) data is based on. Intermodal Freight Facility – Intermodal transport requires more than one mode of transportation. An intermodal freight facility is a location where different transportation modes and networks connect and freight is transferred (or “transloaded”) from one mode, such as rail, to another, such as truck. ITS – Intelligent Transportation System improves transportation safety and mobility and enhances productivity through the integration of advanced communications technologies into the transportation infrastructure and in vehicles. Intelligent transportation systems encompass a broad range of wireless and wire line communications-based information and electronics technologies to collect information, process it, and take appropriate actions. LOS – Level of Service is a qualitative measure describing operational conditions within a traffic stream and their perception by motorists. A LOS definition generally describes these conditions in terms of speed, travel time, freedom to maneuver, traffic interruption, comfort, and convenience. Six levels of LOS can generally be categorized as follows:
LOS A describes free flowing conditions. The operation of vehicles is virtually unaffected by the presence of other vehicles, and operations are constrained only by the geometric features of the highway.
LOS B is also indicative of free-flow conditions. Average travel speeds are the same as in LOS A, but drivers have slightly less freedom to maneuver.
LOS C represents a range in which the influence of traffic density on operations becomes marked. The ability to maneuver with the traffic stream is now clearly affected by the presence of other vehicles.

February 2014
Page 73
LOS D demonstrates a range in which the ability to maneuver is severely restricted because of the traffic congestion. Travel speed begins to be reduced as traffic volume increases.
LOS E reflects operations at or near capacity and is quite unstable. Because the limits of the level of service are approached, service disruptions cannot be damped or readily dissipated.
LOS F a stop and go, low speed conditions with little or poor maneuverability. Speed and traffic flow may drop to zero and considerable delays occur. For intersections, LOS F describes operations with delay in excess of 60 seconds per vehicle. This level, considered by most drivers unacceptable often occurs with oversaturation, that is, when arrival flow rates exceed the capacity of the intersection.
Median – The portion of a divided highway separating the traveled ways in opposite directions. Multi-modal – The availability of transportation options using different modes within a system or corridor, such as automobile, subway, bus, rail, or air. Shoulder – The portion of the roadway contiguous with the traveled way for the accommodation of stopped vehicles, for emergency use, for errant vehicle recovery, and for lateral support of base and surface courses. The shoulder may accommodate bicyclists and pedestrians. Sidewalk – A surfaced pedestrian way contiguous to a roadbed used by the public where the need for which is created primarily by the local land use. System Operations and Management Concept – Describe the system operations and management elements that may be needed within 20-25 years. This can include Non-capacity increasing operational improvements (Aux. lanes, channelization’s, turnouts, etc.), conversion of existing managed lanes to another managed lane type or characteristic (e.g. HOV land to HOT lane), TMS Field Elements, Transportation Demand Management, and Incident Management.

February 2014
Page 74
Peak Hour – The hour of the day in which the maximum volume occurs across a point on the highway. Peak Hour Volume – The hourly volume during the highest hour traffic volume of the day traversing a point on a highway segment. It is generally between 6 percent and 10 percent of the ADT. The lower values are generally found on roadways with low volumes. Peak Period – Is a part of the day during which traffic congestion on the road is at its highest. Normally, this happens twice a day, once in the morning and once in the evening; the time periods when the most people commute. Peak Period is defined for individual routes, not a District or statewide standard. Planned Project – A planned improvement or action is a project in a fiscally constrained section of a long-term plan, such as an approved Regional or Metropolitan Transportation Plan (RTP or MTP), Capital Improvement Plan, or measure. Post-25 Year Concept – This dataset may be defined and re-titled at the District’s discretion. In general, the Post-25 Year concept could provide the maximum reasonable and foreseeable roadway needed beyond a 20-25 year horizon. The post-25 year concept can be used to identify potential widening, realignments, future facilities, and rights-of-way required to complete the development of each corridor. Post Mile – A post mile is an identified point on the State Highway System. The milepost values increase from the beginning of a route within a count to the next county line. The milepost values start over again at each county line. Milepost values usually increase from south to north or west to east depending upon the general direction the route follows within the state. The milepost at a given location will remain the same year after year. When a section of road is relocated, new milepost (usually noted by an alphabetical prefix such as "R" or "M") are established for it. If relocation results in a change in length, "milepost equations" are introduced at the end of each relocated portion so that mileposts on the reminder of the route within the county will remain unchanged. Programmed Project – A programmed improvement or action is a project in a near-term programming document identifying funding amounts by year, such as the State Transportation Improvement Program or the State Highway Operations and Protection Program. Railroad Class I – The Surface Transportation Board (STB) defines a Class I railroad in the U.S. as a carrier having annual operating revenues of $250 million or more. This class includes the nation’s major railroads. In California, Class I railroads include Union Pacific Railroad (UP) and Burlington Northern Santa Fe Railway (BNSF).

February 2014
Page 75
Railroad Class II – STB defines a Class II railroad in the U.S. as having annual carrier operating revenues of less than $250 million but more than $20 million. Class II railroads are considered mid-sized freight-hauling railroad in terms of operating revenues. They are considered “regional railroads” by the Association of American Railroads. Railroad Class III – Railroads with annual carrier operating revenues of $20 million or less. The typical Class III is a short line railroad, which feeds traffic to or delivers traffic from a Class I or Class II railroad. Roadbed – That portion of the roadway extending from curb line to curb line or shoulder line to shoulder line. Divided highways are considered to have two roadbeds. Roadway – That portion of the highway included between the outside lines of the sidewalks, or curbs and gutters, or side ditches including the appertaining structures, and all slopes, ditches, channels, waterways, and other features necessary for proper drainage and protection. Route Designation – A route’s designation is adopted through legislation and identifies what system the route is associated with on the State Highway System. A designation denotes what design standards should apply during project development and design. Typical designations include but not limited to National Highway System (NHS), Interregional Route System (IRRS), Scenic Highway System, Rural – Fewer than 5,000 in population designates a rural area. Limits are based upon population density as determined by the U.S. Census Bureau. Scenic Highway – A State or county highway, in total or in part, that is recognized for its scenic value, protected by a locally adopted corridor protection program, and has been officially designated by the Department. Segment – A portion of a facility between two points. TDM – Transportation Demand Management programs designed to reduce or shift demand for transportation through various means, such as the use of public transportation, carpooling, telework, and alternative work hours. Transportation Demand Management strategies can be used to manage congestion during peak periods and mitigate environmental impacts. TMS – Transportation Management System is the business processes and associated tools, field elements and communications systems that help maximize the productivity of the transportation system. TMS includes, but is not limited to, advanced operational hardware, software, communications systems and infrastructure, for integrated Advanced Transportation Management Systems and Information Systems, and for Electronic Toll Collection System.

February 2014
Page 76
Urban – 5,000 to 49,999 in population designates an urban area. Limits are based upon population density as determined by the U.S. Census Bureau. Urbanized – Over 50,000 in population designates an urbanized area. Limits are based upon population density as determined by the U.S. Census Bureau. VMT – Is the total number of miles traveled by motor vehicles on a road or highway segments.