c-17 slidedeck november 2018 powerpoint
TRANSCRIPT

BIS/OTE C-17 Aircraft Supply Chain Impact Assessment
Source: U.S. Department of Commerce, Bureau of Industry and Security, Office of Technology Evaluation. UNCLASSIFIED
U.S. Air Force C-17 Aircraft Supply Chain Impact
Assessment
Final ResultsNovember 2018
1
U.S. Department of Commerce Bureau of Industry and SecurityOffice of Technology Evaluation

BIS/OTE C-17 Aircraft Supply Chain Impact Assessment
Source: U.S. Department of Commerce, Bureau of Industry and Security, Office of Technology Evaluation. UNCLASSIFIED
2
• Office of Technology Evaluation (OTE)
Mission: OTE is the focal point within BIS for assessing the capabilities of the U.S. industrial base to support the national defense and the effectiveness of export controls
• Bureau of Industry and Security (BIS)
Mission: Advance U.S. national security, foreign policy, and economic objectives by ensuring an effective export control and treaty compliance system and promoting continued U.S. strategic technology leadership
Develops export control policies Issues export licenses Prosecutes violators to heighten national securityDevelops and implements programs that ensure a technologically
superior defense industrial base
Who We Are:

BIS/OTE C-17 Aircraft Supply Chain Impact Assessment
Source: U.S. Department of Commerce, Bureau of Industry and Security, Office of Technology Evaluation. UNCLASSIFIED
OTE Industry Surveys & Assessments Background:
3
• Under Section 705 of the Defense Production Act of 1950 and Executive Order 13603, ability to survey and assess:Economic health and competitivenessDefense capabilities and readiness
• Data is exempt from Freedom of Information Act (FOIA) requests
• Enable industry and government agencies to:Share data and collaborate in order to ensure a healthy and
competitive industrial baseMonitor trends, benchmark industry performance, and raise
awareness of diminishing manufacturing and technological capabilities

BIS/OTE C-17 Aircraft Supply Chain Impact Assessment
Source: U.S. Department of Commerce, Bureau of Industry and Security, Office of Technology Evaluation. UNCLASSIFIED
4
OTE/OEA C-17 Project Overview
• Partnership with the U.S. Department of Defense, Office of Economic Adjustment (OEA), and in coordination with the City of Long Beach, to conduct a comprehensive survey and assessment of the C-17 aircraft supply chain industrial base
• Three Phase Project:• Phase I: C-17 Excess Tooling and Equipment Transfer Completed - 2015 • Phase II: Survey Development and Industry Deployment• Phase III: Survey Compliance and Final Results

BIS/OTE C-17 Aircraft Supply Chain Impact Assessment
Source: U.S. Department of Commerce, Bureau of Industry and Security, Office of Technology Evaluation. UNCLASSIFIED
5
Achievements of the C-17 Program• The C-17 Globemaster III is the most flexible cargo aircraft to enter
the airlift force• The C-17 flew half of the strategic airlift missions in the Kosovo and
Operation Allied Force• The C-17 was awarded U.S. aviation's most prestigious award, the
Collier Trophy, in 1994
C-17 Aircraft Program
• The first C-17 production model was delivered to Joint Base Charleston, S.C. on June 14, 1993
• The USAF capped its C-17 fleet at 223 aircraft; its final delivery was on 12 September 2013
• Notable C-17 MissionsOperation Allied ForceOperation Iraqi FreedomOperation Enduring Freedom
What is the C-17 Globemaster III Aircraft?
2010 Earthquake Humanitarian Relief
2011 Pakistan Flood Relief

BIS/OTE C-17 Aircraft Supply Chain Impact Assessment
Source: U.S. Department of Commerce, Bureau of Industry and Security, Office of Technology Evaluation. UNCLASSIFIED
C-17 Aircraft Production by Year
6
0
2
4
6
8
10
12
14
16
18
Num
ber o
f C-1
7 A
ircra
ft
USAF Royal Air Force(UK) Royal Australian Air Force
Canadian Armed Forces Qatari Emiri Air Force NATO Strategic Airlift Capability
UAE Air Force Indian Air Force Kuwait Air Force
Boeing Storage

BIS/OTE C-17 Aircraft Supply Chain Impact Assessment
Source: U.S. Department of Commerce, Bureau of Industry and Security, Office of Technology Evaluation. UNCLASSIFIED
7
• Survey Development and Outreach• Develop survey data collection topics such as production, employment, financials, R&D, and
competitive outlook
• Conduct initial site visits to better understand the impact of the loss of C-17 aircraft sales on the industrial supply chain
• Design, develop, and circulate the draft survey template for feedback from select organizations
• Survey Approval • Formally field test final version of C-17 aircraft supply chain survey
• Obtain Office of Management and Budget (OMB) C-17 aircraft survey approval
• Survey Deployment• Format and code approved survey template
• Distribute survey to all identified C-17 aircraft suppliers
• Conduct respondent compliance to ensure quality and timely data analysis
Phase II: Survey Development and Deployment

BIS/OTE C-17 Aircraft Supply Chain Impact Assessment
Source: U.S. Department of Commerce, Bureau of Industry and Security, Office of Technology Evaluation. UNCLASSIFIED
• Organization size was established based on sales from C-17 related products manufactured in the U.S.• Small: Under $10M in annual sales• Medium: $10M-$50M in annual sales• Large: Over $50M in annual sales
• BIS received responses from over 420 organizations, representing 544 facilities. Organizations were categorized by business type:
• Distributor• Engineering Firm• Holding Company• Laboratory• Manufacturer
8
Methodology - C-17 Aircraft Assessment
• Non-Profit• Research & Development Firm• Service Provider• Testing Facility

BIS/OTE C-17 Aircraft Supply Chain Impact Assessment
Source: U.S. Department of Commerce, Bureau of Industry and Security, Office of Technology Evaluation. UNCLASSIFIED
Methodology - C-17 Aircraft Assessment
• Scope of survey and assessment was limited to organizations with U.S. operations that supported the C-17 program
• OTE used a list of suppliers provided by the prime contractor and combined it with an internal list, which was accumulated through previous Defense Industrial Base studies and other suppliers identified by C-17 supplier organizations
• Survey exemption requests were handled individually and The Boeing Company was consulted on some cases
• If Boeing and the USAF was not a customer since 2012 and the respondent’s products/services were generic, an exemption would be provided
• Respondents that had Boeing and/or the USAF as a customer since 2012 but were unaware of specific C-17 support were NOT provided an exemption generally
9

BIS/OTE C-17 Aircraft Supply Chain Impact Assessment
Source: U.S. Department of Commerce, Bureau of Industry and Security, Office of Technology Evaluation. UNCLASSIFIED
10
QRP, A1 376 Respondents
Type of Supply Chain Support Self-Identified Support of C-17 Program by Type and Time Period (1991-2018)
36
47
38
37
78
58
12
17
53
0 20 40 60 80 100 120 140 160
Current
Former
BothFormer and
Current
# of Respondents
Tim
e Pe
riod
of S
uppo
rt (1
991-
2018
)
Direct Only Indirect Only Both Direct and Indirect
149 Total
142 Total
85 Total

BIS/OTE C-17 Aircraft Supply Chain Impact Assessment
Source: U.S. Department of Commerce, Bureau of Industry and Security, Office of Technology Evaluation. UNCLASSIFIED
Primary Customer: USAF or BoeingPrimary Customers for Known Support of C-17 Program
6
39
46
291
0 50 100 150 200 250 300 350
US
AF
Onl
yO
ther
Both
Boe
ing
and
US
AF
Boe
ing
Onl
y
# of Respondents
Prim
ary
Cus
tom
er
11
QRP, A1 382 Respondents
10% of respondents did not list Boeing or USAF as a primary customer

BIS/OTE C-17 Aircraft Supply Chain Impact Assessment
Source: U.S. Department of Commerce, Bureau of Industry and Security, Office of Technology Evaluation. UNCLASSIFIED
Respondent ProfileType of Support to USAF or Boeing
63
91
95
47
7
17
1
17 2
4
0 20 40 60 80 100 120 140
Bot
h D
irect
and
Indi
rect
Indi
rect
Dire
ct
# of Respondents
Type
of S
uppo
rt
Boeing Only Both Boeing and USAF Other USAF Only
12
QRP, A2 344 Respondents

BIS/OTE C-17 Aircraft Supply Chain Impact Assessment
Source: U.S. Department of Commerce, Bureau of Industry and Security, Office of Technology Evaluation. UNCLASSIFIED
Respondent ProfilePrimary Customers of Suppliers to Boeing and USAF
6
19
71
251
0 50 100 150 200 250
USAF
Other
Both
Boeing
# of Respondents
Prim
ary
Cus
tom
er
72% of all primary customers surveyed were suppliers to Boeing
13
QRP, A2 347 Respondents

BIS/OTE C-17 Aircraft Supply Chain Impact Assessment
Source: U.S. Department of Commerce, Bureau of Industry and Security, Office of Technology Evaluation. UNCLASSIFIED
Support of C-17 ProgramSuppliers of USAF or Boeing with C-17 Support
71, 17%
82, 19%
78, 19%
189, 45%
Former
Current
Has Never Supplied toUSAF or BoeingBoth Current andFormer
14
QRP, A2 420 Respondents

BIS/OTE C-17 Aircraft Supply Chain Impact Assessment
Source: U.S. Department of Commerce, Bureau of Industry and Security, Office of Technology Evaluation. UNCLASSIFIED
Respondent ProfileInvolvement with the Maintenance, Repair, and Overhaul of C-17
Program by Time Period and Primary Customer
23
31
38
283
14
12
2
2
8
3
0 50 100 150 200 250 300
Form
erC
urre
ntB
oth
Cur
rent
and
Form
erN
ever
Invo
lved
with
MR
O
# of Respondents
Tim
e Pe
riod
of In
volv
emen
t
Boeing
Never Involved with MRO
Both
Other
USAF
15
QRP, A3 416 Respondents

BIS/OTE C-17 Aircraft Supply Chain Impact Assessment
Source: U.S. Department of Commerce, Bureau of Industry and Security, Office of Technology Evaluation. UNCLASSIFIED
Small Business QualificationsDoes Your Business Qualify as any of the Following Types?
16
Q1a, C 414 Respondents
217, 52%
197, 48%
Yes No
Types of Business
Small Business 194
8 (a) Firm 4
HUBZone 17
Minority-owned 26
Woman-owned 48
Veteran-owned/service-disabled veterans 15
Several respondents qualified for more than one of the drop downs
194 out of 420 respondents identified as a small business

BIS/OTE C-17 Aircraft Supply Chain Impact Assessment
Source: U.S. Department of Commerce, Bureau of Industry and Security, Office of Technology Evaluation. UNCLASSIFIED
C-17 Facility SupportNumber of Facilities That Have Supported C-17 Program By State
8
8
11
11
14
14
15
17
21
21
21
21
22
29
191
0 50 100 150 200 250
Oklahoma
Michigan
Connecticut
New Jersey
Illinois
Arizona
Kansas
Ohio
Florida
Georgia
Texas
New York
Washington
Missouri
California
# of Facilities
Stat
e
17
Q1b, B420 Respondents
Out of 518 facilities, 191 or 45% of C-17 Facilities are located in California
Most respondents had at least 1 facility that supported the C-17 Program

BIS/OTE C-17 Aircraft Supply Chain Impact Assessment
Source: U.S. Department of Commerce, Bureau of Industry and Security, Office of Technology Evaluation. UNCLASSIFIED
Business Functions With C-17 SupportNumber of C-17 Respondents By Type of Business Function
18
Q1c, B 420 Respondents
5
12
18
27
52
57
69
238
9
4
9
7
16
39
4
3
15
0 50 100 150 200 250 300 350
HoldingCompany/Headquarters
Laboratory
Research & Development
Testing Facility
Service Provider
Distributor
Engineering
Manufacturer
# of Respondents
Bus
ines
s Fu
nctio
n
Both Other Aircraft Only C-17 Only

BIS/OTE C-17 Aircraft Supply Chain Impact Assessment
Source: U.S. Department of Commerce, Bureau of Industry and Security, Office of Technology Evaluation. UNCLASSIFIED
Types of Company Restructuring per YearMergers, Acquisitions, and Divestitures from 2012-2017
2
1
3
1
1
1
16
21
33
15
8
10
8
8
9
5
1
2
0 5 10 15 20 25 30 35 40 45 50
2017
2016
2015
2014
2013
2008-2012
# of Financial Activities
Year
Mergers Acquisitions Divestitures
2015 accounted for 30% of all recorded restructuring
19
Q2, A & B 420 Respondents

BIS/OTE C-17 Aircraft Supply Chain Impact Assessment
Source: U.S. Department of Commerce, Bureau of Industry and Security, Office of Technology Evaluation. UNCLASSIFIED
Acquisitions, Divestitures, and MergersPrimary Objectives
49 48
40
1812 12
54 3 2
0
10
20
30
40
50
60
# of
Fin
anci
al A
ctiv
ities
Objective
20
Q2, A 420 Respondents
“Other” responses include buyouts, equity restructuring, and portfolio shaping
BIS/OTE C-17 Aircraft Supply Chain Impact Assessment
Source: U.S. Department of Commerce, Bureau of Industry and Security, Office of Technology Evaluation. UNCLASSIFIED
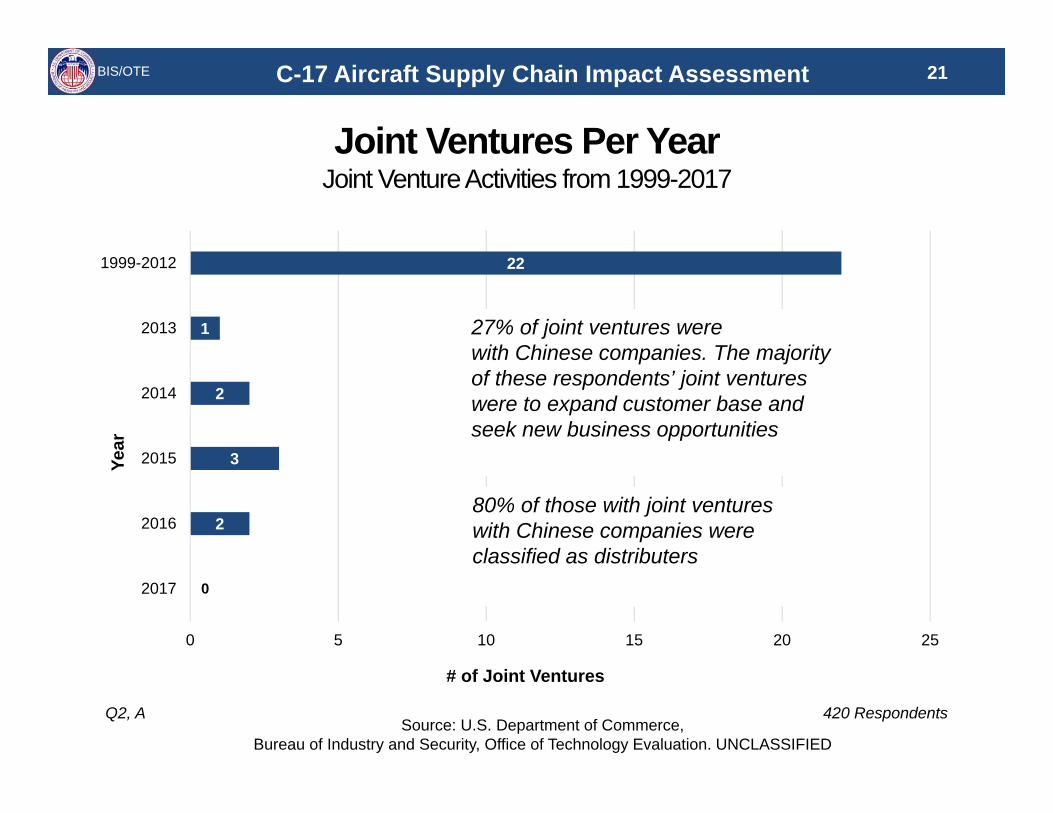
Joint Ventures Per YearJoint Venture Activities from 1999-2017
2
3
2
1
22
0 5 10 15 20 25
2017
2016
2015
2014
2013
1999-2012
# of Joint Ventures
Year
0
80% of those with joint ventures with Chinese companies were classified as distributers
27% of joint ventures werewith Chinese companies. The majority of these respondents’ joint ventures were to expand customer base andseek new business opportunities
21
Q2, A 420 Respondents

BIS/OTE C-17 Aircraft Supply Chain Impact Assessment
Source: U.S. Department of Commerce, Bureau of Industry and Security, Office of Technology Evaluation. UNCLASSIFIED
Products and ServicesTop Products and Services Provided
67881010131623
4664
141
3137423730
4199
2650
3427
3325
5958
0 50 100 150 200 250
I: Auxiliary Power Unit SystemsC: Horizontal Stabilizer
D: Vertical StabilizerK: Landing Gear, Braking System and Loadmaster System
S: Environmental and Oxygen SystemE: Engine Build-Up Assembly and Nacelle
B: Airframe - WingsT: Cargo Compartment and Crew Accomodations
X: Aircraft Servicing, Repair and OverhaulF: Fuel Systems
G: Hydraulic SystemsW: Testing, Evaluation and Professional Services
V: Material Processing/FinishingA: Airframe - Forward, Center, and Aft Fuselages
U: Raw Materials and Purchased Parts
# of Respondents
Prod
uct a
nd S
ervi
ce C
ateg
ory
Primary Business Line Additional Business Line
Respondents had 24 choices (A-X) to list their product and services
22
Q3, A 420 Respondents

BIS/OTE C-17 Aircraft Supply Chain Impact Assessment
Source: U.S. Department of Commerce, Bureau of Industry and Security, Office of Technology Evaluation. UNCLASSIFIED
Primary Business LinesTop 5 Out of 24 Business Lines
31
80
249
401
405
48
73
26
24
22
38
24
33
36
71
0 100 200 300 400 500 600
X: Aircraft Servicing, Repair andOverhaul
V: Material Processing/Finishing
B: Airframe: Wings
A: Airframe: Fuselages
U: Raw Materials/Purchased Parts
# of Respondents
Prod
uct a
nd S
ervi
ce C
ateg
ory
Product Service Both
23
Q3, C-E 420 Respondents

BIS/OTE C-17 Aircraft Supply Chain Impact Assessment
Source: U.S. Department of Commerce, Bureau of Industry and Security, Office of Technology Evaluation. UNCLASSIFIED
Program ParticipationNumber of Federal, State, and Local Programs Supported Since 2012
23
59
34
35 5
2737
61
175
3 45
38
74
9 3 3 20
10
20
30
40
50
60
70
80
0 1-10 11-20 21-30 31-40 41-50 >51
# of
Res
pond
ents
# of Federal, State, & Local ProgramsLarge Companies Medium Companies Small Companies
24
Q4, A 420 Respondents
30% of respondents support more than 10 Federal, State,
and Local programs
0

BIS/OTE C-17 Aircraft Supply Chain Impact Assessment
Source: U.S. Department of Commerce, Bureau of Industry and Security, Office of Technology Evaluation. UNCLASSIFIED
Program ParticipationRevenue Attributable to Federal, State, and Local Programs
2719
1117
12 11
37
19
615
6 42
62
2113 12 10
40
10
20
30
40
50
60
70
0% 1-10% 11-20% 21-30% 31-40% 41-50% >50%
# of
Res
pond
ents
% Revenue
Small Companies Medium Companies Large Companies
25
Q4, B2 420 Respondents
Nearly 60% of respondents noted that Federal, State, and
Local programs account for 20% or less of total revenue
00

BIS/OTE C-17 Aircraft Supply Chain Impact Assessment
Source: U.S. Department of Commerce, Bureau of Industry and Security, Office of Technology Evaluation. UNCLASSIFIED
Program ParticipationTop Federal, State, Local Customers Since 2012 by Support Type
5
2
41
122
155
4
6
30
98
136
1
8
11
25
50
0 50 100 150 200 250 300 350 400
Intelligence Community (non-DoD)
State/Local Government
Non-Defense USG
U.S. Air Force
All other DoD Operations
# of Respondents
Cus
tom
er T
ype
Indirect Support Both Direct Support
26
Q4, B3 420 Respondents
84% of respondents supported DoD related
programs
16% of respondents supported Non-DoD
related programs
BIS/OTE C-17 Aircraft Supply Chain Impact Assessment
Source: U.S. Department of Commerce, Bureau of Industry and Security, Office of Technology Evaluation. UNCLASSIFIED
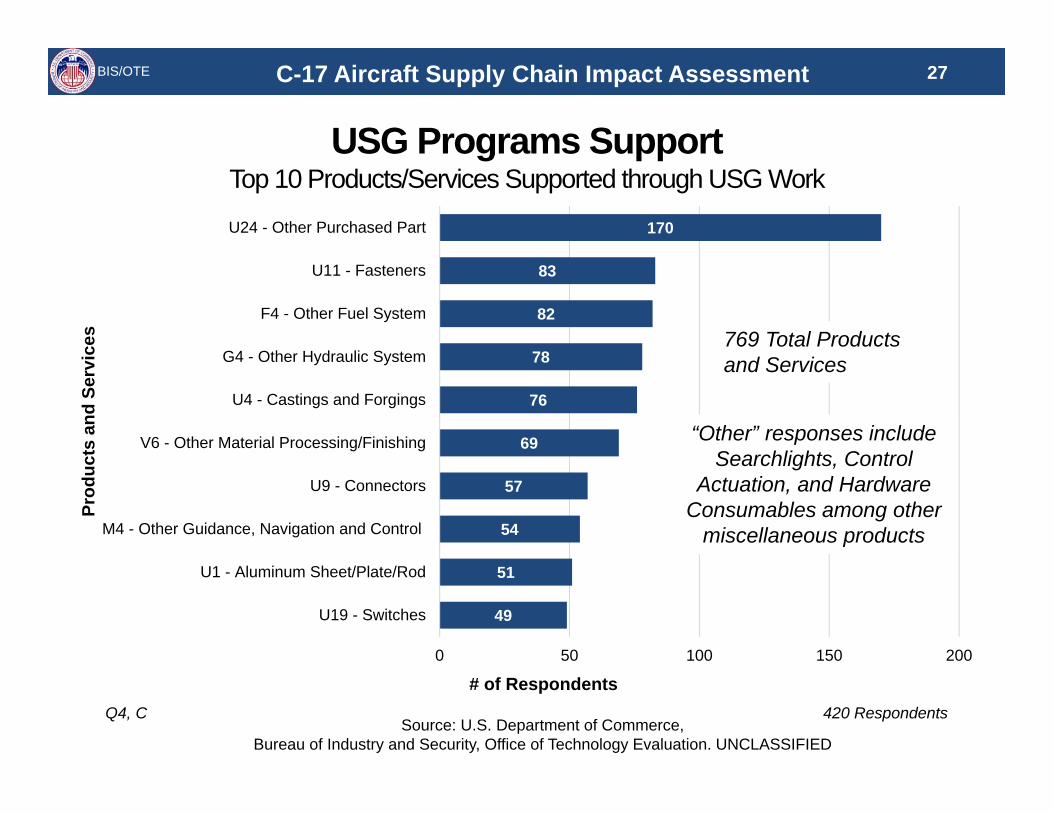
USG Programs SupportTop 10 Products/Services Supported through USG Work
49
51
54
57
69
76
78
82
83
170
0 50 100 150 200
U19 - Switches
U1 - Aluminum Sheet/Plate/Rod
M4 - Other Guidance, Navigation and Control
U9 - Connectors
V6 - Other Material Processing/Finishing
U4 - Castings and Forgings
G4 - Other Hydraulic System
F4 - Other Fuel System
U11 - Fasteners
U24 - Other Purchased Part
# of Respondents
Prod
ucts
and
Ser
vice
s27
Q4, C 420 Respondents
“Other” responses include Searchlights, Control
Actuation, and Hardware Consumables among other
miscellaneous products
769 Total Products and Services

BIS/OTE C-17 Aircraft Supply Chain Impact Assessment
Source: U.S. Department of Commerce, Bureau of Industry and Security, Office of Technology Evaluation. UNCLASSIFIED
USG Program SupportTop 10 DoD Programs Supported
91
95
97
101
132
136
139
140
155
156
0 20 40 60 80 100 120 140 160 180
Sikorsky Helicopter (MH-53E Sea Dragon, Black Hawk, etc.)
Boeing P-8 Poseidon
Lockheed Martin F-22 Raptor
Boeing KC-46
Boeing F-15 Eagle
Lockheed C-130 Hercules
Bell Boeing V-22 Osprey
Boeing (McDonnell Douglas) F/A-18 Hornet
Lockheed Martin F-35 Lightning II
Boeing Helicopter (Chinook, Apache, etc.)
# of Respondents
USG
Pro
gram
28
Q4, C 420 Respondents

BIS/OTE C-17 Aircraft Supply Chain Impact Assessment
Source: U.S. Department of Commerce, Bureau of Industry and Security, Office of Technology Evaluation. UNCLASSIFIED
USG Program SupportTop 3 Primary Products/Services Supported by DoD Program
8
7
12
7
11
9
13
9
12
17
6
5
7
7
9
7
6
5
7
7
5
6
5
7
7
5
5
7
6
0 10 20 30 40
Sikorsky Helicopter (MH-53E Sea Dragon,Black Hawk, etc.)
Boeing P-8 Poseidon
Lockheed Martin F-22 Raptor
Boeing KC-46
Boeing F-15 Eagle
Lockheed C-130 Hercules
Bell Boeing V-22 Osprey
Boeing (McDonnell Douglas) F/A-18Hornet
Lockheed Martin F-35 Lightning II
Boeing Helicopter (Chinook, Apache, etc.)
# of Respondents
USG
Pro
gram
U24 - Purchased Part
F4 - Fuel System
G4 - Hydraulic System
U11 - Fasteners
U4 - Castings and Forgings
U9 - Connectors
M4 -Guidance, Navigation andControl
A6 - Center FuselageOther/Boeing Part Numberstarting with 17B2, 17N2 and 17P2
29
Q4, C 420 Respondents

BIS/OTE C-17 Aircraft Supply Chain Impact Assessment
Source: U.S. Department of Commerce, Bureau of Industry and Security, Office of Technology Evaluation. UNCLASSIFIED
USG Program SupportTop DoD Programs Supported and C-17 Termination Impact
82
85
82
86
111
115
115
121
132
131
4
5
7
9
12
10
11
11
12
15
5
5
8
6
8
7
12
7
11
7
2
1
1
2
0 20 40 60 80 100 120 140 160 180
Sikorsky Helicopter (MH-53E Sea Dragon, Black Hawk,etc.)
Boeing P-8 Poseidon
Lockheed Martin F-22 Raptor
Boeing KC-46
Boeing F-15 Eagle
Lockheed C-130 Hercules
Bell Boeing V-22 Osprey
Boeing (McDonnell Douglas) F/A-18 Hornet
Lockheed Martin F-35 Lightning II
Boeing Helicopter (Chinook, Apache, etc.)
# of Respondents
USG
Pro
gram
No Change Unknown Negative Impact Positive Impact
30
Q4, C 420 Respondents
BIS/OTE C-17 Aircraft Supply Chain Impact Assessment
Source: U.S. Department of Commerce, Bureau of Industry and Security, Office of Technology Evaluation. UNCLASSIFIED
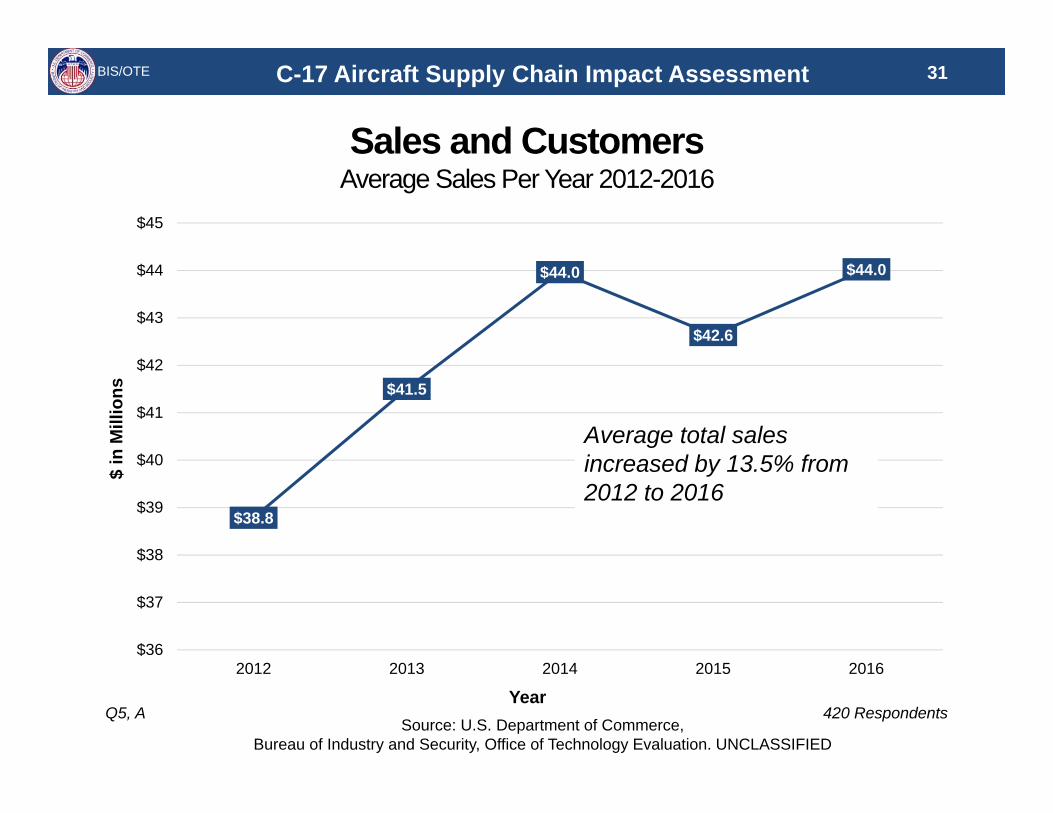
Sales and CustomersAverage Sales Per Year 2012-2016
$38.8
$41.5
$44.0
$42.6
$44.0
$36
$37
$38
$39
$40
$41
$42
$43
$44
$45
2012 2013 2014 2015 2016
$ in
Mill
ions
Year
Average total sales increased by 13.5% from 2012 to 2016
31
Q5, A 420 Respondents

BIS/OTE C-17 Aircraft Supply Chain Impact Assessment
Source: U.S. Department of Commerce, Bureau of Industry and Security, Office of Technology Evaluation. UNCLASSIFIED
Sales and CustomersAggregate Sales Per Year: 2012-2016
$153.9
$173.7$183.4 $181.0 $185.7
$0
$20
$40
$60
$80
$100
$120
$140
$160
$180
$200
2012 2013 2014 2015 2016
$ in
Bill
ions
Year
32
Q5, A 420 Respondents
Total sales increased by 20% from 2012 to
2016

BIS/OTE C-17 Aircraft Supply Chain Impact Assessment
Source: U.S. Department of Commerce, Bureau of Industry and Security, Office of Technology Evaluation. UNCLASSIFIED
Sales and CustomersAggregate U.S. and Non-U.S. Sales: 2012-2016
$19.8 $23.0 $24.7 $24.8 $25.9
$134.1
$150.7$158.7 $156.2 $159.8
$0
$20
$40
$60
$80
$100
$120
$140
$160
$180
2012 2013 2014 2015 2016
$ in
Bill
ions
YearNon-U.S. Sales U.S. Sales
33
Q5, A-B 396 Respondents
Between 2012-2016, Non-U.S. sales grew by 31%
U.S. sales grew by 19%

BIS/OTE C-17 Aircraft Supply Chain Impact Assessment
Source: U.S. Department of Commerce, Bureau of Industry and Security, Office of Technology Evaluation. UNCLASSIFIED
Average Percentage of Attributable SalesBroken Down By Category: 2012-2016
6% 6% 5% 3% 3%
13% 13% 13% 14% 14%
37% 37% 36% 36% 35%
63% 64% 64% 64% 64%
0%
10%
20%
30%
40%
50%
60%
70%
2012 2013 2014 2015 2016
% o
f Sal
es
YearC-17 Non-US Defense Aircraft
34
Q5, B-E 420 Respondents
Revenue streams can be accounted for in more than one production category

BIS/OTE C-17 Aircraft Supply Chain Impact Assessment
Source: U.S. Department of Commerce, Bureau of Industry and Security, Office of Technology Evaluation. UNCLASSIFIED
Sales and CustomersEstimated Direct Customers Per Respondent: 2012-2016
• 420 respondents supported an estimated 433,000 direct customers
• The average respondent supported 182 direct customers
• Only 77 respondents reported over 1,000 direct customers• 57% (44) of these respondents were categorized as
distributers
35
Q5, A 420 Respondents

BIS/OTE C-17 Aircraft Supply Chain Impact Assessment
Source: U.S. Department of Commerce, Bureau of Industry and Security, Office of Technology Evaluation. UNCLASSIFIED
Type of Customer SupportedNumber of Respondents By Type of Customer 2012-2016
Commercial, 2585, 87%
Government Defense, 325,
11%
Other Customers, 39, 1%
Government Non-Defense,
13, 1%
Other, 52
36
Q5, B 420 Respondents

BIS/OTE C-17 Aircraft Supply Chain Impact Assessment
Source: U.S. Department of Commerce, Bureau of Industry and Security, Office of Technology Evaluation. UNCLASSIFIED
Type of Aircraft SupportedNumber of Customers By Aircraft Supported: 2012-2016
Other aircraft only, 2328, 73%
Unknown, 503, 16%
C-17 and other
aircraft, 320, 10%
C-17 only, 42, 1%
37
Q5, B 420 Respondents
1.3% of identified customers were
exclusively involved with C-17 production

BIS/OTE C-17 Aircraft Supply Chain Impact Assessment
Source: U.S. Department of Commerce, Bureau of Industry and Security, Office of Technology Evaluation. UNCLASSIFIED
Sales and CustomersTop 15 Non-U.S. Customers by Country 2012-2016
7
7
8
8
8
11
13
13
16
23
26
26
59
70
91
0 10 20 30 40 50 60 70 80 90 100
Mexico
Netherlands
Taiwan
Turkey
Ireland
Israel
Italy
Sweden
South Korea
Japan
Brazil
Germany
United Kingdom
France
Canada
# of Respondents
Cou
ntry
38
Q5, B 420 Respondents
Out of 445 Non-U.S. customers, 35% or 156
are attributable to European Union members

BIS/OTE C-17 Aircraft Supply Chain Impact Assessment
Source: U.S. Department of Commerce, Bureau of Industry and Security, Office of Technology Evaluation. UNCLASSIFIED
C-17 TerminationImpacts Due To The Termination of The C-17 Program 2012-2016
39
Q5, C 420 Respondents
No Effect/Neutral, 349, 83%
Lost Customers,
63, 15%
Gained Customers,
8, 2%
15% of respondents lost customers due to the termination of the C-17 program

BIS/OTE C-17 Aircraft Supply Chain Impact Assessment
Source: U.S. Department of Commerce, Bureau of Industry and Security, Office of Technology Evaluation. UNCLASSIFIED
Pre-Termination Business ModelRespondents’ Most Recent Year of C-17-Related Activities
716 15 16
37 30
51
208
30
50
100
150
200
250
Pre 2000 2000-2012 2012 2013 2014 2015 2016 2017 2018
# of
Res
pond
ents
Year
The spike in 2017 can be attributed to spare parts, repairs, maintenance, and
repurposing for foreign orders of the C-17 aircraft
Domestic production of the C-17 aircraft ended in 2013
40
Q6, A1 420 Respondents

BIS/OTE C-17 Aircraft Supply Chain Impact Assessment
Source: U.S. Department of Commerce, Bureau of Industry and Security, Office of Technology Evaluation. UNCLASSIFIED
C-17 Production by Company SizeWhat type of businesses were involved in the C-17 Aircraft Supply Chain?
41
Q6, A1 420 Respondents
Large, 158, 38%
Medium, 132, 31%
Small, 130, 31%
Approximately 30% of companies involved in C-17
aircraft production were small businesses

BIS/OTE C-17 Aircraft Supply Chain Impact Assessment
Source: U.S. Department of Commerce, Bureau of Industry and Security, Office of Technology Evaluation. UNCLASSIFIED
C-17 Termination NotificationWas your organization notified in advance of the C-17 aircraft program
termination?
Yes, 185, 44%
No, 102, 24%
Unknown, 133, 32%
42
Q6, A1 420 Respondents
25% of respondents were not notified of the termination of the C-17 program

BIS/OTE C-17 Aircraft Supply Chain Impact Assessment
Source: U.S. Department of Commerce, Bureau of Industry and Security, Office of Technology Evaluation. UNCLASSIFIED
C-17 Termination NotificationSource of Notification of the Termination of C-17 Production
Boeing, 155, 84%Other, 29, 16%
USAF, 1, 0.54%
43
Q6, A2 185 Respondents
“Other” - respondents commonly indicated they were notified by
either lower-tier customers or the media

BIS/OTE C-17 Aircraft Supply Chain Impact Assessment
Source: U.S. Department of Commerce, Bureau of Industry and Security, Office of Technology Evaluation. UNCLASSIFIED
C-17 Termination Business TransitionDid the termination of the C-17 program change your organization's involvement
in the defense industry?
Yes, 56, 13%No, 343, 82%
Not Applicable, 21, 5%
44
Q6, B1
How was your participation in the defense industry affected?
Reduced Involvement in Defense 49
Increased Involvement in Defense 3
Left Defense Industry 4
Total: 56
420 Respondents

BIS/OTE C-17 Aircraft Supply Chain Impact Assessment
Source: U.S. Department of Commerce, Bureau of Industry and Security, Office of Technology Evaluation. UNCLASSIFIED
C-17 Termination Business TransitionDid the termination of the C-17 program change your organization's involvement
in the aerospace industry?
Yes, 33, 8%No , 364, 87%
Not Applicable,
23, 5%
45
Q6, B2
How was your participation in the aerospace industry affected?
Reduced Involvement in Aerospace 24
Increased Involvement in Aerospace 7
Left Aerospace Industry 2
Total: 33
420 Respondents

BIS/OTE C-17 Aircraft Supply Chain Impact Assessment
Source: U.S. Department of Commerce, Bureau of Industry and Security, Office of Technology Evaluation. UNCLASSIFIED
C-17 Termination Business TransitionDid your organization substitute your C-17 sales with a new or different
program?
Yes, 193, 46%
No, 109, 26%
Haven't Tried/Don't Know,
118, 28%
46
Q6, B3
Platform for C-17 sales substitutionsUSG 21
Commercial 60
Both USG and Commercial
112
Total 193
420 Respondents

BIS/OTE C-17 Aircraft Supply Chain Impact Assessment
Source: U.S. Department of Commerce, Bureau of Industry and Security, Office of Technology Evaluation. UNCLASSIFIED
C-17 Termination Business TransitionCommercial Platforms Used as Substitute for C-17 Program
30
58
66
78
149
0 20 40 60 80 100 120 140 160
Other Transport Aircraft (Illyushin ll-96, Bombardier Cseries,etc.)
Other Commuter Aircraft (Bombardier DHC-8, Embraer 145,etc.)
Other Small Aircraft
Airbus Commercial Jets/Aircraft
Boeing Commercial Jets/Aircraft
# of Respondents
Com
mer
cial
Pla
tform
s
47
Q6, B4 420 Respondents
“Even still, these platforms haven't been much of a
substitute. We don't do near the volume we did with C-17.”
-Small Business

BIS/OTE C-17 Aircraft Supply Chain Impact Assessment
Source: U.S. Department of Commerce, Bureau of Industry and Security, Office of Technology Evaluation. UNCLASSIFIED
C-17 Termination Business TransitionTop 15 DoD Platforms Used as Substitute for C-17 Program
799
131314
1620
27272728
3335
76
0 10 20 30 40 50 60 70 80
Lockheed Martin F-22 Raptor
Northrop Grumman E-2 Hawkeye
Other - Cargo/Transport
Other - Drone
Sikorsky Helicopter (MH-53E Sea Dragon, Black Hawk, etc.)
Bell Helicopter (AH-1 SuperCobra, UH-1, etc.)
Boeing P-8 Poseidon
Boeing KC-46
Boeing F-15 Eagle
Boeing Helicopter (Chinook, Apache, etc.)
Lockheed C-130 Hercules
All Other DoD
Boeing F/A-18 Hornet
Bell Boeing V-22 Osprey
Lockheed Martin F-35 Lightning II
# of Respondents
USG
Pla
tform
48
Q6, B4 420 Respondents
The top 15 out of 37 categories
accounted for 28% of total substitutes

BIS/OTE C-17 Aircraft Supply Chain Impact Assessment
Source: U.S. Department of Commerce, Bureau of Industry and Security, Office of Technology Evaluation. UNCLASSIFIED
C-17 Termination Lessons LearnedDid your organization adjust its business plan in response to the C-17 Aircraft
program's termination?
Yes, 57, 14%
No, 319, 76%
Not Applicable, 25, 6%
Unknown, 19, 4%
49
Q6, C1A 420 Respondents
14% of organizations adjusted their business plans due to the C-17 programs termination

BIS/OTE C-17 Aircraft Supply Chain Impact Assessment
Source: U.S. Department of Commerce, Bureau of Industry and Security, Office of Technology Evaluation. UNCLASSIFIED
C-17 Termination Lessons LearnedLeading Actions Used for Business Plan Alterations After C-17 Termination
7
7
14
18
18
31
0 5 10 15 20 25 30 35
Increased Investment
Liquidation of High Value Assets
Repurpose of Equipment
Retraining of Employees
Reorganization
Other
# of Respondents
Stra
tegy
50
Q6, C1B 420 Respondents
“Other” frequently included laying off employees and adding more facilities in foreign countries

BIS/OTE C-17 Aircraft Supply Chain Impact Assessment
Source: U.S. Department of Commerce, Bureau of Industry and Security, Office of Technology Evaluation. UNCLASSIFIED
C-17 Termination Lessons LearnedSelf-Scoring of Organizations’ Response to C-17 Termination
20
60 70
236
0
50
100
150
200
250
Managed with significantdifficulties
Managed with only minordifficulties
Handled Moderately Well Handled Well
# of
Res
pond
ents
Organization Responses
16%18%
61%
51
Q6, C2 386 Respondents
Many companies were unaware of project
termination while working on the C-17 program
5%

BIS/OTE C-17 Aircraft Supply Chain Impact Assessment
Source: U.S. Department of Commerce, Bureau of Industry and Security, Office of Technology Evaluation. UNCLASSIFIED
C-17 Termination Lessons LearnedLeading Advice for Vendors Experiencing the Loss of a USG Program
7 32 41
301
0
50
100
150
200
250
300
350
IncreaseMinimum Buys
Other ReduceDependency
on USG
Diversify
# of
Res
pond
ents
Leading Advice
52
Q6, C3 420 Respondents
“Less concentration of customers and products offers less risk.”
-Small Business
“Try to implement a balance of commercial work with multiple defense programs.”
-Large Business
“Find other programs, sell, sell, sell.”
-Small Business
Other responses include: providing transition
assistance, and providing earlier notice of termination

BIS/OTE C-17 Aircraft Supply Chain Impact Assessment
Source: U.S. Department of Commerce, Bureau of Industry and Security, Office of Technology Evaluation. UNCLASSIFIED
C-17 Termination Lessons LearnedSupplier Advice for Government and Defense Prime Contractors when Handling
the Closure of a Major Program
206187
60 53
2514
0
50
100
150
200
250
Assist with theidentification ofnew substitute
programs
Providemore/earlier notice
Other Provide TransitionAssistance toMRO phase
Facilitate/aid inrequalification
Recognition/Awardfor Service
# of
Res
pond
ents
Leading Advice
53
Q6, C4 420 Respondents
“Consumables bought for one government aerospace program should be able to be
used on others.”- Large Business
“Due to the lead times for raw materials, earlier notice of the
cancellation would have prevented us from buying raw material for the C17
Program.”-Medium Business

BIS/OTE C-17 Aircraft Supply Chain Impact Assessment
Source: U.S. Department of Commerce, Bureau of Industry and Security, Office of Technology Evaluation. UNCLASSIFIED
Full Time Equivalent EmploymentAverage Number of FTE Employees Reporting at the Corporate and Division
Level from 2012-2017
248 244 246 252 254 254
85 91 95 92 92 90
0
50
100
150
200
250
300
2012 2013 2014 2015 2016 2017
# of
Em
ploy
ees
YearBusiness Unit/Division FTEs Corporate/Whole Organization FTEs
54
Q7a, A 420 Respondents
64% of respondents reported FTE Employment at the Corporate/Whole
Organization level

BIS/OTE C-17 Aircraft Supply Chain Impact Assessment
Source: U.S. Department of Commerce, Bureau of Industry and Security, Office of Technology Evaluation. UNCLASSIFIED
Full Time Equivalent EmploymentAverage FTE Employment by Company Size
55
Q7a, A 420 Respondents
213 223 237 226 236 240
671 691 694 711 699 69473 73
71
68
6564
58
60
62
64
66
68
70
72
74
0
100
200
300
400
500
600
700
800
2012 2013 2014 2015 2016 2017
# O
f Em
ploy
ees
(Sm
all B
usin
esse
s)
# O
f Em
ploy
ees
(Med
ium
and
Lar
ge B
usin
esse
s)
Year
Medium Large Small

BIS/OTE C-17 Aircraft Supply Chain Impact Assessment
Source: U.S. Department of Commerce, Bureau of Industry and Security, Office of Technology Evaluation. UNCLASSIFIED
Full Time Equivalent EmploymentAggregate FTE Employment by Company Size
20,31020,643
21,09020,590 20,561
20,356
19,65819,877
21,230
21,75722,087
22,4323,189
3,1743,156
3,136
3,080
3,016
2,900
2,950
3,000
3,050
3,100
3,150
3,200
3,250
18,000
18,500
19,000
19,500
20,000
20,500
21,000
21,500
22,000
22,500
23,000
2012 2013 2014 2015 2016 2017
# O
f Em
ploy
ees
(Sm
all B
usin
esse
s)
# O
f Em
ploy
ees
(Med
ium
and
Lar
ge B
usin
esse
s)
Year
Medium Large Small
56
Q7a, A 420 Respondents

BIS/OTE C-17 Aircraft Supply Chain Impact Assessment
Source: U.S. Department of Commerce, Bureau of Industry and Security, Office of Technology Evaluation. UNCLASSIFIED
FTE Employee Work DesignationsAverage Percentage of Defense, Aircraft, and C-17 Related Employees from
2012-2017
41% 41% 41% 41% 41% 41%
65% 65% 66% 67% 67% 67%
10% 10% 9% 8% 7% 7%
0%
10%
20%
30%
40%
50%
60%
70%
80%
2012 2013 2014 2015 2016 2017
% o
f Rel
ated
Em
ploy
ees
Year% of Defense Related Employees % of Aircraft Related Employees % of C-17 Related Employees
57
Q7a, A 420 Respondents
Employees can be categorized by more than one field
BIS/OTE C-17 Aircraft Supply Chain Impact Assessment
Source: U.S. Department of Commerce, Bureau of Industry and Security, Office of Technology Evaluation. UNCLASSIFIED
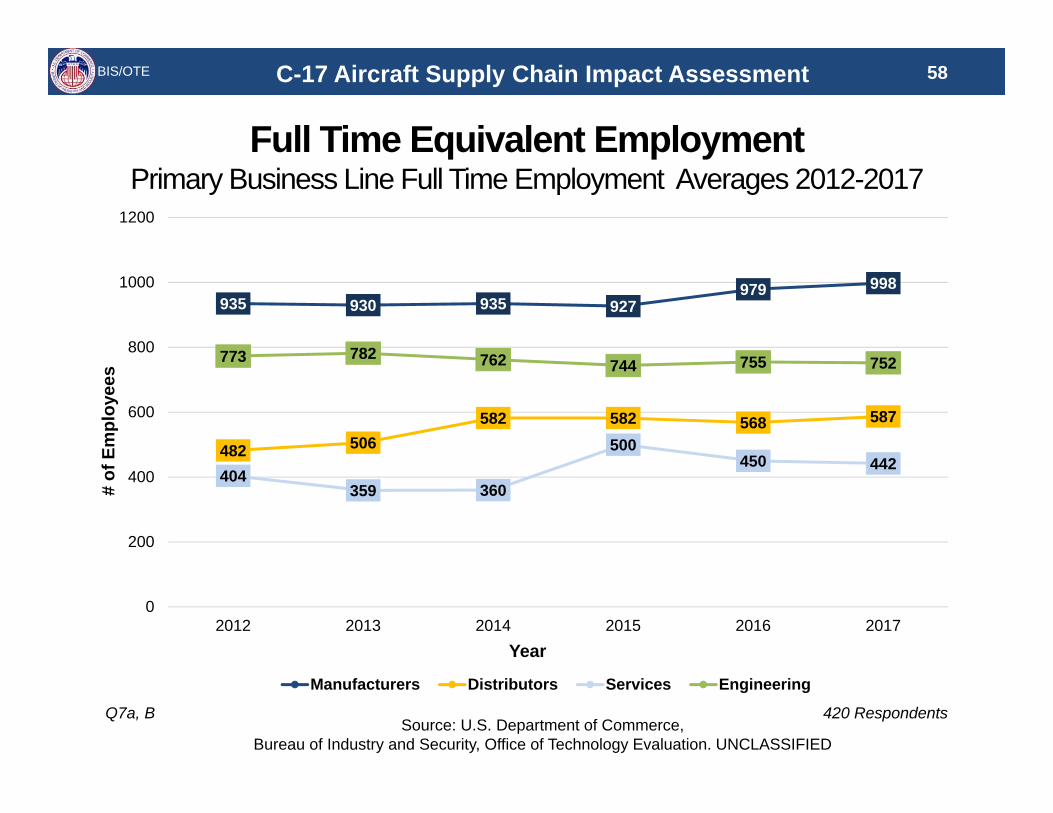
Full Time Equivalent EmploymentPrimary Business Line Full Time Employment Averages 2012-2017
935 930 935 927979 998
482 506582 582 568 587
404359 360
500450 442
773 782 762 744 755 752
0
200
400
600
800
1000
1200
2012 2013 2014 2015 2016 2017
# of
Em
ploy
ees
Year
Manufacturers Distributors Services Engineering
58
Q7a, B 420 Respondents

BIS/OTE C-17 Aircraft Supply Chain Impact Assessment
Source: U.S. Department of Commerce, Bureau of Industry and Security, Office of Technology Evaluation. UNCLASSIFIED
Workforce OperationsPrimary Business Operation Lines of Employment
44.2
52.3
43.8
28.6
15.3
15.6
18.2
25.7
6.4
5.5
7.7
30.3
15.9
10.5
13.5
6.3
9.6
11.1
12.3
10.9
4.2
2.4
2.6
2.6
2.2
3.4
2.7
3.3
2.0
1.6
2.2
2.7
0% 10% 20% 30% 40% 50% 60% 70% 80% 90% 100%
Engineering
Manufacturing
Services
Distributor
% of Employment
Bus
ines
s O
pera
tion
Machinists Admin Marketing Engineers Testing/Support Design Facility/Maintenance IT
59
Q7a, B 420 Respondents

BIS/OTE C-17 Aircraft Supply Chain Impact Assessment
Source: U.S. Department of Commerce, Bureau of Industry and Security, Office of Technology Evaluation. UNCLASSIFIED
Difficulties Hiring and Retaining WorkforceWorkforce Difficulties Stratified by Occupation
21 18
54
17 1825
60
35
169 10 9 6 6
1115
2420
48
2116
21
66
52
0
10
20
30
40
50
60
70
# of
Res
pond
ents
Workforce Difficulties
Hiring Retaining Both
60
Q7a, B 420 Respondents

BIS/OTE C-17 Aircraft Supply Chain Impact Assessment
Source: U.S. Department of Commerce, Bureau of Industry and Security, Office of Technology Evaluation. UNCLASSIFIED
Impact of C-17 Termination on WorkforceRespondent Self-Identified Impact Severity on Workforce
Change Un-Related to C-17, 41, 10%
Minimally Negative, 47, 11%
Negative, 42, 10%
Neutral/No Impact, 290, 69%
61
Q7b, A1 420 Respondents
Respondents indicated layoffs, reduction in benefits, reduction in overtime, and forced time off as the leading workforce impact they experienced
Some large companies indicated that the C-17 termination allowed them to reallocate resources to new business opportunities, and to develop new technological advancements to replace losses in employment

BIS/OTE C-17 Aircraft Supply Chain Impact Assessment
Source: U.S. Department of Commerce, Bureau of Industry and Security, Office of Technology Evaluation. UNCLASSIFIED
Workforce Preservation PlanDo you have a workforce preservation plan for the post C-17 environment?
Not Sure, 71, 17%
Yes, 133, 32%
No, 216, 51%
“We have additional contracts to sustain the workforce.”-Large Company
62
Q7b, A2 420 Respondents
“Headcount is adjusted commensurate with sales volume to maintain profitability required by our investors.”-Large Company
“[We implemented] redeployment to project work for other customers, including non-aerospace customers.”-Large Company

BIS/OTE C-17 Aircraft Supply Chain Impact Assessment
Source: U.S. Department of Commerce, Bureau of Industry and Security, Office of Technology Evaluation. UNCLASSIFIED
Implemented Workforce ModificationsChanges Made In Response to C-17 Termination
14
12
9
43
2
0
2
4
6
8
10
12
14
16
Repurpose Other Retraining Reduction in USGTrained personnel
Automation Outsourcing
# of
Res
pond
ents
Workforce Modifications
63
Q7b, A3 420 Respondents
“Other” included layoffs of personnel
92 of 420 respondents indicated they made changes to their workforce

BIS/OTE C-17 Aircraft Supply Chain Impact Assessment
Source: U.S. Department of Commerce, Bureau of Industry and Security, Office of Technology Evaluation. UNCLASSIFIED
Loss of Critical Skills/CapabilitiesBroken Down by Product or Service Line
374, 89%35, 8%
5, 1%4, 1%
2, 1%
No Loss UnknownYes - Aircraft-related Yes - BothYes - Non-aircraft-related
64
Q7b, A4 394 Respondents
Product or Service Losses Indicated
Airframe: Forward, Center
and Aft Fuselage3
Testing, Evaluation and
Professional Services1
Engineering Expertise 1
Flight Control Systems 1
Fuel Systems 1
Machining 1
Unknown 38
Total 46

BIS/OTE C-17 Aircraft Supply Chain Impact Assessment
Source: U.S. Department of Commerce, Bureau of Industry and Security, Office of Technology Evaluation. UNCLASSIFIED
Developmental Work With Outside InstitutionsRespondents’ Indication of Work with Outside Institutions on
Development/Training
No, 232, 57%
Yes, 178, 43%
“[We] work with local colleges on employee skills training.”- Large Business
“We visit classrooms, host interns, host MFGDAY, contribute to school programs and equipment.”-Medium Business
65
Q7b, B1 420 Respondents
“[We conduct] thorough outreach of Colleges, Trade Schools, High Schools and Veterans/Disabled/Minority groups.”-Large Business

BIS/OTE C-17 Aircraft Supply Chain Impact Assessment
Source: U.S. Department of Commerce, Bureau of Industry and Security, Office of Technology Evaluation. UNCLASSIFIED
Developmental Work With Outside InstitutionsParticipation Broken Down by Business Size
Small, 37
Medium, 53
Large, 88
66
Q7b, B1 178 Respondents
Total Participation With Outside Institutions
56% of Large Businesses
40% of Medium Businesses
28% of Small Businesses
42% of all businesses participated

BIS/OTE C-17 Aircraft Supply Chain Impact Assessment
Source: U.S. Department of Commerce, Bureau of Industry and Security, Office of Technology Evaluation. UNCLASSIFIED
Workforce Development ProgramsParticipation in Workforce Development Programs
225
182
149128 127
107
7151
2 10
34
7 8 11 4 13
0
50
100
150
200
250
# of
Res
pond
ents
Workforce ProgramsCurrent Participation Past Participation
67
Q7b, B2 420 Respondents

BIS/OTE C-17 Aircraft Supply Chain Impact Assessment
Source: U.S. Department of Commerce, Bureau of Industry and Security, Office of Technology Evaluation. UNCLASSIFIED
Workforce Development ProgramsDevelopmental Programs Deemed Most and Least Useful Among Respondents
in Post C -17 Transition
35
1816
14 13 1210
4
1915
11 1115
7
12
7
2521
23
1012
9 8 9
0
5
10
15
20
25
30
35
40
# of
Res
pond
ents
Developmental Programs
Very Useful Somewhat Useful Not Useful
68
Q7b, B2 420 Respondents

BIS/OTE C-17 Aircraft Supply Chain Impact Assessment
Source: U.S. Department of Commerce, Bureau of Industry and Security, Office of Technology Evaluation. UNCLASSIFIED
Critical Vendors & SuppliersTotal Supplier Support
• 1,307 unique suppliers supported 420 respondents
• The top 15 most cited suppliers only accounted for 7% of all supplier support
• 97% (1,267) of all identified unique suppliers are considered domestic
69
Q8, A 420 Respondents

BIS/OTE C-17 Aircraft Supply Chain Impact Assessment
Source: U.S. Department of Commerce, Bureau of Industry and Security, Office of Technology Evaluation. UNCLASSIFIED
Critical Vendors & SuppliersSuppliers by Country
11111
2222
333
55
67
89
0 1 2 3 4 5 6 7 8 9 10
CameroonIreland
MalaysiaSouth Korea
SpainChina
SingaporeSwedenTaiwan
IndiaMexico
SwitzerlandIsrael
JapanGermany
FranceUnited Kingdom
Canada
# of Suppliers
Cou
ntry
70
Q8, A 420 Respondents
420 respondents were supported by a total of 62 Non-US suppliers

BIS/OTE C-17 Aircraft Supply Chain Impact Assessment
Source: U.S. Department of Commerce, Bureau of Industry and Security, Office of Technology Evaluation. UNCLASSIFIED
Critical Vendors & SuppliersSuppliers by Top 15 State
24
25
25
25
27
31
34
46
47
49
52
60
61
66
459
0 50 100 150 200 250 300 350 400 450 500
Michigan
Arizona
Georgia
Massachusetts
New Jersey
Connecticut
Florida
Texas
Missouri
Illinois
Washington
Ohio
New York
Pennsylvania
California
# of Respondents
Stat
e
71
Q8, A 420 Respondents
An estimated 1,307 unique suppliers supported 420 respondents
California accounts for 35% of all identified vendors and suppliers
Respondents could list multiple suppliers

BIS/OTE C-17 Aircraft Supply Chain Impact Assessment
Source: U.S. Department of Commerce, Bureau of Industry and Security, Office of Technology Evaluation. UNCLASSIFIED
Critical Vendors & SuppliersTop 10 Supplier Input Categories
16
17
18
22
23
28
28
56
259
1,113
0 500 1000 1500
Communication and Recording Systems
Landing Gear, Braking System and Loadmaster System
Flight Control Systems
Fuel Systems
Electrical Power System
Aircraft Servicing, Repair and Overhaul
Airframe: Forward, Center and Aft Fuselage
Testing, Evaluation and Professional Services
Material Processing/Finishing
Raw Materials and Purchased Parts
# of Respondents
Inpu
t Cat
egor
y
Over 70% of identified suppliers provide raw materials and purchased parts
72
Q8, A 420 Respondents

BIS/OTE C-17 Aircraft Supply Chain Impact Assessment
Source: U.S. Department of Commerce, Bureau of Industry and Security, Office of Technology Evaluation. UNCLASSIFIED
Critical Vendors & SuppliersTop 5 Supplier Input Product/Service Areas
87
103
118
181
360
0 100 200 300 400
V1 - Coating and Painting
V6 - Other Material Processing/Finishing
U1 - Aluminum Sheet/Plate/Rod
U23 - Other Raw Material
U24 - Other Purchased Part
# of Respondents
Prod
uct/S
ervi
ce A
reas
73
Q8, A 420 Respondents
Other Purchased Parts include Hydraulic Systems, and Switches
Other Raw Materials include Castings & Forgings, and Composites

BIS/OTE C-17 Aircraft Supply Chain Impact Assessment
Source: U.S. Department of Commerce, Bureau of Industry and Security, Office of Technology Evaluation. UNCLASSIFIED
Supplier Association With C-17 ProgramNumber of Respondent Suppliers Associated With C-17 Program
C-17 Specific, 127, 8%
Unknown, 637, 38%C-17 and other aircraft, 897, 54%
74
Q8, A 420 Respondents
8% of 1,661 identified suppliers were exclusively involved in C-17 specific operations

BIS/OTE C-17 Aircraft Supply Chain Impact Assessment
Source: U.S. Department of Commerce, Bureau of Industry and Security, Office of Technology Evaluation. UNCLASSIFIED
Supplier ImpactsImpact of C-17 Termination On Domestic Supplier Shut Downs
Only one respondent indicated that one or more of their suppliers ceased operations following the termination of the
C-17 program. Both suppliers were located in California. Both sold raw materials and purchased parts.
“Less income. Had to lay off long time employees.”-Small Business
75
Q8, B 420 Respondents

BIS/OTE C-17 Aircraft Supply Chain Impact Assessment
Source: U.S. Department of Commerce, Bureau of Industry and Security, Office of Technology Evaluation. UNCLASSIFIED
Operating Profit MarginAverage Operating Profit Margin Across Small, Medium, and Large Businesses
2012-2016
13.1%12.6%
11.6%
9.8%
15.4%
14.3% 14.2%
12.7%
7.4%
13.7% 13.9%
12.7%
11.5%
7%
8%
9%
10%
11%
12%
13%
14%
15%
16%
2012 2013 2014 2015 2016
Ope
ratin
g Pr
ofit
Mar
gin
YearSmall Business Medium Business Large Business
76
Q9 396 Respondents
The average operating profit margin was 12.7% across all business sizes in 2015

BIS/OTE C-17 Aircraft Supply Chain Impact Assessment
Source: U.S. Department of Commerce, Bureau of Industry and Security, Office of Technology Evaluation. UNCLASSIFIED
Financial Risk LevelsNumber of Companies and Financial Risk Level
357 356 362 350 341
45 49 42 5467
5 6 12 10 913 10 4 6 30
50
100
150
200
250
300
350
400
2012 2013 2014 2015 2016
# of
Res
pond
ents
Year
Low/Neutral Risk Moderate/Elevated RiskHigh/Severe Risk Insufficient Data
77
Q9 420 Respondents
Financial Risk calculation based primarily on profit margins, debt levels, liquidity
Reasons for lack of measurement:
Source data mismatches (e.g. reporting income statement data at the facility level and balance sheet data at the corporate level)
Unavailable or missing data (e.g. no assets or sales listed, newly formed business)

BIS/OTE C-17 Aircraft Supply Chain Impact Assessment
Source: U.S. Department of Commerce, Bureau of Industry and Security, Office of Technology Evaluation. UNCLASSIFIED
117
31
0
10
108
13
29
93
26
5 6
0
20
40
60
80
100
120
140
Low/Neutral Risk Moderate/Elevated Risk High/Severe Risk Insufficient Data
# of
Res
pond
ents
Large Medium Small
78
Q9 420 Respondents
25% of all respondents were financially categorized as moderate/elevated or high/severe risk
Financial Risk LevelsCompany Sizes for Overall Financial Risk Status 2012-2016

BIS/OTE C-17 Aircraft Supply Chain Impact Assessment
Source: U.S. Department of Commerce, Bureau of Industry and Security, Office of Technology Evaluation. UNCLASSIFIED
Financial ImpactsSelf-Assessed Financial Impacts Experienced Due To The End of C-17 Program
79
Q9, C1 420 Respondents
3
48
102
267
0 50 100 150 200 250 300
Positive Impact
Unknown
Negative Impact
No Change
# of Respondents
Fina
ncia
l Im
pact
3 respondents indicated that the C-17 program’s closure had a positive effect on their business
Negative Impacts:
“Loss of revenue and jobs.”-Medium Business
“Stock (inventory) became obsolete.”-Small Business
“Unable to pay back loans.”-Small Business

BIS/OTE C-17 Aircraft Supply Chain Impact Assessment
Source: U.S. Department of Commerce, Bureau of Industry and Security, Office of Technology Evaluation. UNCLASSIFIED
Financial Risk Level vs. Financial ImpactFinancial Impact Due To Termination of C-17 Program According To Financial
Risk Levels
0 1 208
34
6
26
63
1
34
218
0
50
100
150
200
250
High/Severe Risk Moderate/Elevated Risk Low/Neutral Risk
# of
Res
pond
ents
Financial RiskPositive Change Unknown Negative Impact No Change
80
Q9, C1 393 Respondents

BIS/OTE C-17 Aircraft Supply Chain Impact Assessment
Source: U.S. Department of Commerce, Bureau of Industry and Security, Office of Technology Evaluation. UNCLASSIFIED
Financial Risk Level vs. Financial ImpactHigh/Severe Risk and Moderate/Elevated Risk Companies
High/Severe Risk, 7
Moderate/Elevated Risk, 69
81
Q9, C1 76 Respondents
High/Severe Risk Commonalities:
6 out of 7 Respondents have known C-17 support and all production is aircraft-related
Primary business line is manufacturing
Locations in different states, Only 2 are in California
Majority small businesses
Moderate/Elevated Risk Commonalities:
Majority large businesses
44% stated C-17 termination had a negative impact on their business

BIS/OTE C-17 Aircraft Supply Chain Impact Assessment
Source: U.S. Department of Commerce, Bureau of Industry and Security, Office of Technology Evaluation. UNCLASSIFIED
82
Q10, A 420 Respondents
Capital Expenditures ReportingNumber of Respondents with Capital Expenditures 2012 - 2016
Capital Expenditures,
310, 74%
No Capital Expenditures,
110, 26%
26% (110) of respondents had no capital expenditures
Over 50% (55) with no capital expenditures were small businesses

BIS/OTE C-17 Aircraft Supply Chain Impact Assessment
Source: U.S. Department of Commerce, Bureau of Industry and Security, Office of Technology Evaluation. UNCLASSIFIED
Capital ExpendituresAverage Capital Expenditures 2012-2016
$949
$1,139$1,239
$1,300
$1,462
$0
$200
$400
$600
$800
$1,000
$1,200
$1,400
$1,600
2012 2013 2014 2015 2016
$ in
Tho
usan
ds
Year
83
Q10, A 310 Respondents
Average Capital Expenditures increased by 54% from 2012 to 2016

BIS/OTE C-17 Aircraft Supply Chain Impact Assessment
Source: U.S. Department of Commerce, Bureau of Industry and Security, Office of Technology Evaluation. UNCLASSIFIED
Capital ExpendituresAverage Capital Expenditures Broken Down By Allocation
2.7% 2.4% 2.5% 1.7% 1.4%
26.1% 26.8% 26.7% 26.2% 26.9%
50.5%53.0%
55.0% 53.9% 54.7%
0%
10%
20%
30%
40%
50%
60%
2012 2013 2014 2015 2016
% o
f Cap
ital E
xpen
ditu
re
YearC-17 Related Defense Related Aircraft Related
84
Q10, A 310 Respondents

BIS/OTE C-17 Aircraft Supply Chain Impact Assessment
Source: U.S. Department of Commerce, Bureau of Industry and Security, Office of Technology Evaluation. UNCLASSIFIED
Average of Attributable Capital ExpendituresBroken Down By Allocation
$25 $27 $30 $23 $20
$248$306 $331 $341
$393
$479
$604
$681 $700
$799
$0
$100
$200
$300
$400
$500
$600
$700
$800
$900
2012 2013 2014 2015 2016
$ in
Tho
usan
ds
YearC-17 Defense Aircraft
85
Q10, A 310 Respondents

BIS/OTE C-17 Aircraft Supply Chain Impact Assessment
Source: U.S. Department of Commerce, Bureau of Industry and Security, Office of Technology Evaluation. UNCLASSIFIED
Reduction of USG Defense SpendingImpact of Reductions In USG Defense Spending on Capital Expenditures
Not Impacted, 298, 71%
Unknown, 88, 21%
Negatively Impacted,
34, 8%
86
Q10, B 420 Respondents
16 of the 34 respondents who were negatively impacted are small business enterprises.
“We had no reason for growth. We just needed to survive, and we have so far.-Small, Moderate/Elevated Risk Business
“From 2013 through 2015, there was little need for more equipment as government procurement was flat.”-Medium, Low/Neutral Risk Business

BIS/OTE C-17 Aircraft Supply Chain Impact Assessment
Source: U.S. Department of Commerce, Bureau of Industry and Security, Office of Technology Evaluation. UNCLASSIFIED
Use of 3D Printing for ObsolescenceNumber of Respondents Utilizing 3D Printing To Manage Obsolescence Issues and
Aircraft Program Applicability
No, 289, 69%
No Obsolescense
Issues, 54, 13%
Not Aircraft Related, 9, 2%
General Aircraft Related, 68, 16%
Other, 77
87
Q10, C 420 Respondents

BIS/OTE C-17 Aircraft Supply Chain Impact Assessment
Source: U.S. Department of Commerce, Bureau of Industry and Security, Office of Technology Evaluation. UNCLASSIFIED
General 3D Printing CapabilitiesNumber of Respondents With 3D Printing Capabilities 2012-2016
No33379%
Yes65
16%
Unknown225%
88
Q10, C 420 Respondents
Only 7 of the 65 respondents with 3D printing capabilities experienced a decline in aircraft-related capital expenditures due to a reduction in USG defense spending
None of the 65 respondents who have 3D printing capabilities are classified as high/severe risk companies

BIS/OTE C-17 Aircraft Supply Chain Impact Assessment
Source: U.S. Department of Commerce, Bureau of Industry and Security, Office of Technology Evaluation. UNCLASSIFIED
3D PrintingTop 10 3D Printing Product/Service Categories
2
2
3
4
4
4
4
9
12
16
0 2 4 6 8 10 12 14 16 18
Airframe: Forward, Center and Aft Fuselage
Emergency Systems and Fire Detection
Flight Control Systems
Engine Build-Up Assembly and Nacelle
Propulsion Systems
Fuel Systems
Communication and Recording Systems
Material Processing/Finishing
Raw Materials and Purchased Parts
Testing, Evaluation and Professional Services
# of Respondents
Prod
uct/S
ervi
ce
Respondents were asked to list up to two products or services which have 3D printing capabilities
89
Q10, C 420 Respondents

BIS/OTE C-17 Aircraft Supply Chain Impact Assessment
Source: U.S. Department of Commerce, Bureau of Industry and Security, Office of Technology Evaluation. UNCLASSIFIED
3D PrintingTop 5 3D Printing Product/Service Areas
2
2
2
2
5
0 1 2 3 4 5 6
L6 - Other Communication and Recording
F4 - Other Fuel System
W10 - Other Testing Service
W9 - Engineering Services
U24 - Other Purchased Part
# of Respondents
Prod
uct/S
ervi
ce A
reas
90
Q10, C 420 Respondents
Other Systems/Services listed cover a wide array of product and service areas
Examples include:
Flight simulators, interior lighting systems, aircraft and engine level fuel components, component testing, and prototyping

BIS/OTE C-17 Aircraft Supply Chain Impact Assessment
Source: U.S. Department of Commerce, Bureau of Industry and Security, Office of Technology Evaluation. UNCLASSIFIED
58%
33%
14%
0% 10% 20% 30% 40% 50% 60% 70% 80%
Large
Medium
Small
% of Respondents
Com
pany
Siz
e
18 respondents
43 respondents
91 respondents
91
Q11, A1 152 Respondents
152 of the 420 respondents (36%) indicated that they conduct research and development
Research and DevelopmentPercent of Respondents That Conduct R&D

BIS/OTE C-17 Aircraft Supply Chain Impact Assessment
Source: U.S. Department of Commerce, Bureau of Industry and Security, Office of Technology Evaluation. UNCLASSIFIED
Research and DevelopmentWould Your Organization Conduct R&D if the U.S. Government Provided Funding?
44%
41%
30%
51%
58%
66%
5%
2%
4%
0% 10% 20% 30% 40% 50% 60% 70% 80% 90% 100%
Large
Medium
Small
% of Respondents
Com
pany
Siz
e
Yes No Yes but not aircraft-related
92
Q11, A1 152 Respondents

BIS/OTE C-17 Aircraft Supply Chain Impact Assessment
Source: U.S. Department of Commerce, Bureau of Industry and Security, Office of Technology Evaluation. UNCLASSIFIED
$721
$978$1,046
$1,218
$1,058
$0
$200
$400
$600
$800
$1,000
$1,200
$1,400
2012 2013 2014 2015 2016
$ in
Tho
usan
ds
Year
Small Business R&D Expenditures have increased by 47% from 2012 to 2016
93
Q11, B1 18 Respondents
Research and DevelopmentAverage Small Business R&D Expenditures 2012-2016

BIS/OTE C-17 Aircraft Supply Chain Impact Assessment
Source: U.S. Department of Commerce, Bureau of Industry and Security, Office of Technology Evaluation. UNCLASSIFIED
$4.0
$4.9 $5.1
$6.7
$5.2
$0
$1
$2
$3
$4
$5
$6
$7
$8
2012 2013 2014 2015 2016
$ in
Mill
ions
Year
94
Q11, B1 43 Respondents
Research and DevelopmentAverage Medium Business R&D Expenditures 2012-2016
Medium Business R&D Expenditures have increased by 29% from 2012 to 2016

BIS/OTE C-17 Aircraft Supply Chain Impact Assessment
Source: U.S. Department of Commerce, Bureau of Industry and Security, Office of Technology Evaluation. UNCLASSIFIED
$92.4
$93.1$92.9
$93.7
$96.7
$90
$91
$92
$93
$94
$95
$96
$97
2012 2013 2014 2015 2016
$ in
Mill
ions
Year
95
Q11, B1 43 Respondents
Research and DevelopmentAverage Large Business R&D Expenditures 2012-2016
Large Business R&D Expenditures have increased by 5% from 2012 to 2016

BIS/OTE C-17 Aircraft Supply Chain Impact Assessment
Source: U.S. Department of Commerce, Bureau of Industry and Security, Office of Technology Evaluation. UNCLASSIFIED
Research and DevelopmentAverage Annual R&D Expenditure By Area of Research 2012-2016
2% 2% 2% 1% 1%
34% 34% 34% 34% 35%
63%60%
64% 65% 64%
0%
10%
20%
30%
40%
50%
60%
70%
2012 2013 2014 2015 2016
% o
f R&
D E
xpen
ditu
res
Year
C-17 Defense Aircraft
96
Q11, B2-4 152 Respondents

BIS/OTE C-17 Aircraft Supply Chain Impact Assessment
Source: U.S. Department of Commerce, Bureau of Industry and Security, Office of Technology Evaluation. UNCLASSIFIED
Research and DevelopmentAverage R&D Expenditure By Area of Research and Company Size 2012-2016
97
Q11, B2-4 152 Respondents
40% 41%
6%
32%
70%
33%
64%
2%
45%42%
2%
36%
74%
31%
63%
2%0%
10%
20%
30%
40%
50%
60%
70%
80%
90%
% o
f R&
D E
xpen
ditu
res
2012 2016
DefenseDefenseDefense Aircraft C-17 Aircraft C-17 Aircraft C-17
Medium Businesses
Small Businesses
Large Businesses
0% 0%

BIS/OTE C-17 Aircraft Supply Chain Impact Assessment
Source: U.S. Department of Commerce, Bureau of Industry and Security, Office of Technology Evaluation. UNCLASSIFIED
Research and DevelopmentTop R&D Funding Sources 2012-2016
14
12
135
1
1
2
5
17
14
16
49
0 50 100 150 200
Non-U.S. Investors
Universities
State and Local Government
Other USG
Other
U.S. Industry
DoD
Internal/Self-Funded
# of Respondents
R&
D F
undi
ng S
ourc
e
Primary Funding Source Secondary Funding Source
98
Q11, C1 152 Respondents
“Our equipment can be applied to commercial as well as military aircraft part construction, so our R&D efforts are equally applicable to both segments.”-Large Business

BIS/OTE C-17 Aircraft Supply Chain Impact Assessment
Source: U.S. Department of Commerce, Bureau of Industry and Security, Office of Technology Evaluation. UNCLASSIFIED
Research and DevelopmentTop Aircraft-Related R&D Funding Sources 2012-2016
3
9
98
11
12
27
0 20 40 60 80 100 120 140
U.S. Industry
DoD
Internal/Self-Funded
# of Respondents
R&
D F
undi
ng S
ourc
e
Primary Funding Source Secondary Funding Source
Approximately 72% of respondents that conduct R&D utilize their primary source of funding for aircraft-related activities
99
Q11, C1 152 Respondents

BIS/OTE C-17 Aircraft Supply Chain Impact Assessment
Source: U.S. Department of Commerce, Bureau of Industry and Security, Office of Technology Evaluation. UNCLASSIFIED
Security ExpendituresAverage Aircraft-Related Physical and Cyber Security Expenditures
$1.3 $1.4 $1.6 $1.6 $1.5 $1.7
$1.0
$1.6 $1.5 $1.5 $1.7$1.8
$0.0
$0.5
$1.0
$1.5
$2.0
$2.5
$3.0
$3.5
$4.0
2012 2013 2014 2015 2016 2017
$ in
Mill
ions
Cyber Security Expenditures Physical Security Expenditures
100
Q12, A 420 Respondents

BIS/OTE C-17 Aircraft Supply Chain Impact Assessment
Source: U.S. Department of Commerce, Bureau of Industry and Security, Office of Technology Evaluation. UNCLASSIFIED
Security ExpendituresAverage Small Business Cyber and Physical Security Expenditures
$2.1
$2.8
$3.4$3.6
$4.1
$5.8
$0.7 $0.8 $0.7$0.9 $1.0
$0.7
$0
$1
$2
$3
$4
$5
$6
$7
2012 2013 2014 2015 2016 2017
$ in
Tho
usan
ds
YearCyber Security Expenditures Physical Security Expenditures
101
Q12, A 130 Respondents

BIS/OTE C-17 Aircraft Supply Chain Impact Assessment
Source: U.S. Department of Commerce, Bureau of Industry and Security, Office of Technology Evaluation. UNCLASSIFIED
Security ExpendituresAverage Medium Business Cyber and Physical Security Expenditures
$4.8
$7.8
$10.0
$12.2
$18.1
$23.9
$2.5 $2.4 $2.6 $3.0 $3.8
$6.1
$0
$5
$10
$15
$20
$25
$30
2012 2013 2014 2015 2016 2017
$ in
Tho
usan
ds
YearCyber Security Expenditures Physical Security Expenditures
102
Q12, A 132 Respondents

BIS/OTE C-17 Aircraft Supply Chain Impact Assessment
Source: U.S. Department of Commerce, Bureau of Industry and Security, Office of Technology Evaluation. UNCLASSIFIED
Security ExpendituresAverage Large Business Cyber and Physical Security Expenditures
$56.0
$159.3
$238.6
$280.2 $288.7
$324.1
$69.9 $73.0 $69.8 $66.6$86.5
$0
$50
$100
$150
$200
$250
$300
$350
2012 2013 2014 2015 2016 2017
$ in
Tho
usan
ds
YearCyber Security Expenditures Physical Security Expenditures
103
Q12, A 158 Respondents

BIS/OTE C-17 Aircraft Supply Chain Impact Assessment
Source: U.S. Department of Commerce, Bureau of Industry and Security, Office of Technology Evaluation. UNCLASSIFIED
Cyber Security PoliciesCyber Security Policies in Place for All Respondents
35.2%
60.7%
67.6%
77.1%
78.1%
78.8%
96.0%
Two-Factor Authentication
Annual Cybersecurity Training Requirement
Written Protocols for Security Breach
Maintain, Monitor, and Analyze Audit Logs
Inventory of Authorized and Unauthorized Devices
Inventory of Authorized and Unauthorized Software
Restrict IT Priviliges to Specific Employees
% of Respondents
Secu
rity
Polic
y
104
Q12, B 420 Respondents

BIS/OTE C-17 Aircraft Supply Chain Impact Assessment
Source: U.S. Department of Commerce, Bureau of Industry and Security, Office of Technology Evaluation. UNCLASSIFIED
Cyber Security Policies Cyber Security Policies in Place By Company Size
24%
36%
43%
55%
65%
62%
89%
0% 100%
Two-FactorAuthentication
Annual CybersecurityTraining Requirement
Written Protocols forSecurity Breach
Maintain, Monitor, andAnalyze Audit Logs
Inventory of Authorizedand Unauthorized
Devices
Inventory of Authorizedand Unauthorized
Software
Restrict IT Priviliges toSpecific Employees
Small
105
Q12, B 420 Respondents
33%
56%
67%
80%
80%
86%
98%
0% 100%
Medium
46%
85%
89%
93%
87%
87%
99%
0% 100%
Large50-75%Under 50% 75-100%
% of Respondents
Cyb
er S
ecur
ity M
easu
res

BIS/OTE C-17 Aircraft Supply Chain Impact Assessment
Source: U.S. Department of Commerce, Bureau of Industry and Security, Office of Technology Evaluation. UNCLASSIFIED
Cyber Security Policies Cyber Security Policies in Place By Company Size
27%
34%
44%
54%
71%
0% 100%
Encrypt CSI TransmittedInternally
Encrypt CSI in Storage
Encrypt CSI TransmittedExternally
Data ExfiltrationSafeguards
Restriction Against NonU.S. Storage of CSI
Small
106
Q12, B 420 Respondents
34%
50%
64%
67%
80%
0% 100%
Medium
56%
53%
77%
71%
80%
0% 100%
Large50-75%Under 50% 75-100%
% of Respondents
Cyb
er S
ecur
ity M
easu
res

BIS/OTE C-17 Aircraft Supply Chain Impact Assessment
Source: U.S. Department of Commerce, Bureau of Industry and Security, Office of Technology Evaluation. UNCLASSIFIED
Outreach and AssistanceEffectiveness of Assistance from Outside Organizations
41
4
8
3
2
2
43
14
3
4
1
15
9
4
5
1
2
3
1
1
0 20 40 60 80 100 120
Industry
Non-Profit
Both Government and Industry
Other
State and Local Government
Federal Government
# of Respondents
Type
of O
rgan
izat
ion
Very Effective Somewhat Effective Neutral Not Useful
107
Q13, B 420 Respondents

BIS/OTE C-17 Aircraft Supply Chain Impact Assessment
Source: U.S. Department of Commerce, Bureau of Industry and Security, Office of Technology Evaluation. UNCLASSIFIED
108
Q13, C 420 Respondents
8.8%
10.0%
10.7%
11.7%
12.9%
13.3%
13.3%
17.6%
17.9%
19.0%
0% 5% 10% 15% 20% 25%
Design for Manufacturability
Technology Acceleration
Vendor/Material Sourcing
Quality Management and Control
Supply Chain Organization
Export Licensing (ITAR/EAR)
Government Procurement Guidelines
Contrinuous Improvement/LeanManufacturing
Cybersecurity
Market Expansion/Business Growth
% of Respondents
Gov
ernm
ent P
rogr
am
ITAR: International Traffic in Arms RegulationsEAR: Export Administration Regulations
Outreach and Government ProgramsTop 10 Government Programs selected by Organization’s Interest

BIS/OTE C-17 Aircraft Supply Chain Impact Assessment
Source: U.S. Department of Commerce, Bureau of Industry and Security, Office of Technology Evaluation. UNCLASSIFIED
Organizational ChallengesTop 15 Organizational Challenges
464349
4360596873
6590105108
124118
144
4461
3860
5061514774
5145
5849
5255
114
2513
115
824
1823
2328
4766
43
0 50 100 150 200 250 300
Export Controls/ITAR & EAREnvironmental Regulations/Remediation
Government Purchasing VolatilityCybersecurity
Qualifications/CertificationsGovernment Regulatory Burden
Reduction in USG DemandAging Equipment, Facilities, or Infrastructure
TaxesForeign Competition
Aging WorkforceWorker/Skills RetentionLabor Availability/Costs
Domestic CompetitionHealthcare
# of Respondents
Org
aniz
atio
nal C
halle
nge
Other Ranked Concern Unranked Concern Primary Concern
109
Q14 420 Respondents

BIS/OTE C-17 Aircraft Supply Chain Impact Assessment
Source: U.S. Department of Commerce, Bureau of Industry and Security, Office of Technology Evaluation. UNCLASSIFIED
110
U.S. Department of Commerce, Bureau of Industry and SecurityHCHB 1093, 1401 Constitution Avenue, Northwest
Washington, D.C. 20230http://www.bis.doc.gov/DIB
Brad BotwinDirector, Industrial Studies
(202) [email protected]
Erika MaynardSpecial Projects Manager
(202) [email protected]
Trade and Industry Analyst: Moriah PhillipsResearch Fellow: Jean Thompson
Intern Support: Andrea Garcia, Caela Mandigo, Christopher Whittle, Emily Festa, Fahmiya Ismail, Ian Kearns, Lily Shultz, Ormond Derrick, Sagar
Sharma, William Helfrich
BIS/OTE Contact Information
Alexander WernerResearch Fellow(202) 482-4615
Marina GayedResearch Fellow(202) 482-7980