byd electronic (international) co. ltd. (285 hk, buy) nov
TRANSCRIPT
BYD Electronic (International) Co. Ltd. (285 HK, BUY) China Telecom Sector
Nov 2, 2020
1
BYD Electronic (International) Co. Ltd. (285 HK)
Positive business outlook; initiate with BUY
Company Report
Initiation
Nov 2, 2020
Rating: BUY
TP: HK$42.0
Analyst : Ricky Lai
Tel: (852) 2147 8895
Overall revenue is projected to grow at a CAGR of 35.1% in FY19-22E. Thanks to new customer acquisition and improving market share, revenue is expected to grow 68.4% YoY in FY20E amid depressing smartphone shipment, international trade tensions, and the COVID-19 pandemic Gross profit margin to improve. The Company’s gross profit margin is expected to improve 6.3ppt/0.1ppt/0.2ppt YoY to 13.8%/13.9%/14.1% in FY20E-22E, respectively, thanks to better product mix with higher demand for 5G products, intelligent systems, PCs, and vehicles amid the COVID-19 pandemic. Net profit to grow at a CAGR of 85.4% in FY19-22E. Driven by 5G smartphones, stay-at-home economy demand and gross margin improvement, we forecast the Company’s net profit to grow at a CAGR of 85.4% in FY19-22E. Strong ROAE and ROAA ratio. We forecast BYDE’s ROAE and ROAA ratios to reach 30.2% and 19.4% in FY20E, which are much higher than the sector average with 17.1% and 8.5%, respectively. Valuation. We initiate the Company with BUY rating with TP of HK$42.0, representing 13.8x/10.8x FY20E/21E P/E. Risks: (1) Slowdown in 5G network development; (2) Revenue highly dependent on Android smartphone shipments; (3) Business may be affected by international trade tensions. Results and Valuation
FY ended Dec 31 FY18A FY19A FY20E FY21E FY22E
Revenue (RMB mn) 41,047 53,028 89,295 107,281 130,695
Chg (%,YoY) 5.9% 29.2% 68.4% 20.1% 21.8%
Net profit (RMB mn) 2,189 1,598 5,948 7,652 10,183
Chg (%,YoY) (15.3%) (27.0%) 272.3% 28.7% 33.1%
EPS (RMB) 0.971 0.709 2.640 3.396 4.519
Chg (%,YoY) (15.3%) (27.0%) 272.3% 28.7% 33.1%
BPS (RMB) 7.02 7.54 9.92 12.97 17.04
Chg (%,YoY) 11.5% 7.4% 31.5% 30.8% 31.4%
P/E (x) 30.1 41.8 11.0 8.5 6.4
P/B (x) 4.2 3.9 2.9 2.2 1.7
ROAE (%) 14.6% 9.7% 30.2% 29.7% 30.1%
ROAA (%) 8.5% 5.9% 19.4% 21.0% 23.0%
DPS (RMB) 0.195 0.071 0.264 0.340 0.453
Dividend Yield (%) 0.150% 0.417% 0.110% 0.085% 0.064%
Source(s): Bloomberg, ABCI Securities estimates
*Exchange rate assumption for FY20E-22E: HKD 1 = RMB 0.87
Share price (HK$) 33.30
Est. share price return 26.1%
Est. dividend yield 0.1%
Est. total return 26.2%
Source(s): Bloomberg, ABCI Securities estimates
Key Data
52Wk H/L(HK$) 42.0/10.3
Issued shares (mn) 2,253.2
Market cap (HK$ mn) 75,031.6
Avg daily turnover
(HK$ mn) 485.0
Major shareholder(s)
BYD Company Ltd 65.76%
BF Trustee 6.08%
Source(s): Company, ABCI Securities estimates
Share Performance (%)
Absolute Relative*
1-mth 4.0 (0.0)
3-mth (7.2) (10.7)
6-mth (3.9) 9.6
*Relative to HSI
Source(s): Bloomberg
BYD Electronic (International) Co. Ltd. (“the Company” or “BYDE”) has a good
business model with major smartphone and PC makers as customers.
Driven by market expansion, new customer acquisition, and the rise of
stay-at-home economy, we forecast BYDE’s revenue to grow at a CAGR of
35.1% in FY19-22E.
Net profit is estimated to grow at a CAGR of 85.4% in FY19-22E
Initiate BUY and TP of HK$42.0, implying 13.8x/10.8x FY20E/21E P/E

BYD Electronic (International) Co. Ltd. (285 HK, BUY) China Telecom Sector
Nov 2, 2020
2
Contents
Company Overview ............................................................................................................................................................... 3
Industry analysis ................................................................................................................................................................... 6
Financial forecasts ................................................................................................................................................................ 7
Valuations ............................................................................................................................................................................ 10
Recommend BUY with TP at HK$42.0 ................................................................................................................................ 10
Risk factors ......................................................................................................................................................................... 11
Financial Statements ........................................................................................................................................................... 12
Disclosures .......................................................................................................................................................................... 15

BYD Electronic (International) Co. Ltd. (285 HK, BUY) China Telecom Sector
Nov 2, 2020
3
Company Overview
BYD Electronic (International) Corporation Ltd. (the “Company” or “BYDE”) was listed
on HKEx (285 HK) in 2007 and is a subsidiary of BYD Company Ltd (1211 HK). The
Company is one of the constituents of Hang Seng Internet & Information Technology
Index, with businesses related to a wide range of devices such as smartphones,
wearables, computers, automotive intelligent system, the Internet of Things (IoT),
smart home, gaming hardware, robots, communication equipment, and medical
products.
BYDE has three major business segments – (1) smartphone and PC business, (2) new
intelligent products business (the Internet of things [IoT], robotics, artificial intelligence
and new types of smart products), and (3) automotive intelligent system business
(central control system, communication modules, multimedia modules, etc.). The
Company produces products for many famous handset makers such as Huawei,
Xiaomi (1810 HK), OPPO, Samsung (5930 KS) and Apple (AAPL US). In 2020, BYDE
started to produce medical protection products with the emergence of the COVID-19
pandemic.
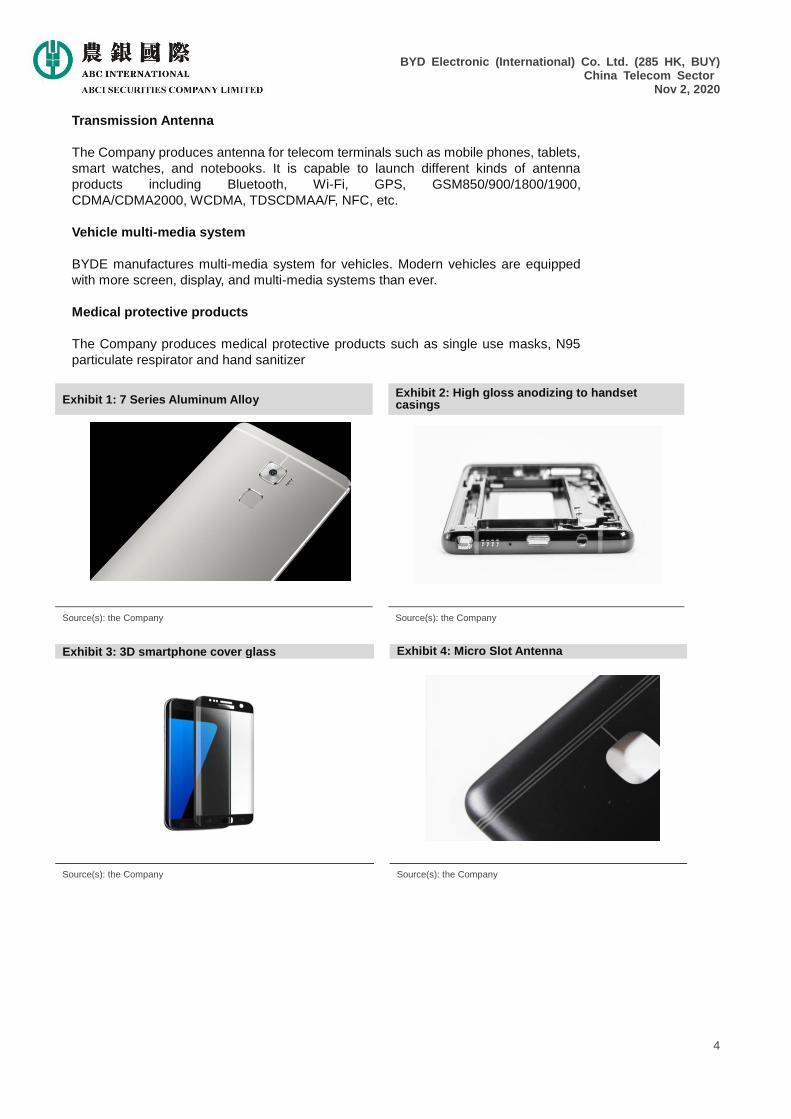
The Company’s major businesses include:
7 series aluminum alloy
BYDE has developed the 7 series aluminum alloy with better features such as anodic
oxidation, higher yield strength, and rich colors, which are suitable for lightweight
electronic products.
Assembly business
BYDE helps its customers to assembly electronic devices with customized
specifications and features to suit for specified needs
Casings
The Company has technology to fit for customers’ requirements for handset and other
electronic devices castings to improve appearance with brighter and shining aesthetic
effect on metal surfaces
Metal frames
Metal frames are being used in many electronic devices such as smartphone,
wearables, tablets, PC, etc.
Smartphone cover glass
The Company produces 3D glass, front cover glass, rear cover glass, with seamlessly
curve on surface sides, which can improve users’ touching experiences
Micro slot antenna
Micro slot antenna with one or more micro-slots designed as decorative patterns are
made in metal casings and the antennas are put in the slots to replace the wide plastic
strip.
BYD Electronic (International) Co. Ltd. (285 HK, BUY) China Telecom Sector
Nov 2, 2020
4
Transmission Antenna
The Company produces antenna for telecom terminals such as mobile phones, tablets,
smart watches, and notebooks. It is capable to launch different kinds of antenna
products including Bluetooth, Wi-Fi, GPS, GSM850/900/1800/1900,
CDMA/CDMA2000, WCDMA, TDSCDMAA/F, NFC, etc.
Vehicle multi-media system
BYDE manufactures multi-media system for vehicles. Modern vehicles are equipped
with more screen, display, and multi-media systems than ever.
Medical protective products
The Company produces medical protective products such as single use masks, N95
particulate respirator and hand sanitizer
Exhibit 1: 7 Series Aluminum Alloy Exhibit 2: High gloss anodizing to handset casings
Source(s): the Company
Source(s): the Company
Exhibit 3: 3D smartphone cover glass Exhibit 4: Micro Slot Antenna
Source(s): the Company
Source(s): the Company

BYD Electronic (International) Co. Ltd. (285 HK, BUY) China Telecom Sector
Nov 2, 2020
5
Exhibit 5: Smartphone antenna Exhibit 6: Vehicle multi-media system
Source(s): the Company
Source(s): the Company
Exhibit 7: Protective mask Exhibit 8: Hand sanitizer
Source(s): the Company
Source(s): the Company
85.6% of total revenue generated from smartphone and PC business in
2019
Smartphone and PC business is the Company’s core business segment accounting for
85.6% of total revenue in 2019. In 2019, over 82.2% of its total revenue was generated
from the PRC region.
Exhibit 9: Revenue breakdown by region in 2019 Exhibit 10: Revenue breakdown by business segment in 2019
Source(s): the Company
Source(s): the Company
PRC 82.2% Asia Pacific
(excluding PRC) 11.3%
US 4.0%
Others 2.5%
Smartphone
and PC
business
85.6%
New intelligent product
business 11.4%
Automotive intelligent system
business 3.0%

BYD Electronic (International) Co. Ltd. (285 HK, BUY) China Telecom Sector
Nov 2, 2020
6
Industry analysis
IDC forecasts global smartphone shipments to drop by 9.5% YoY in 2020E
According to IDC data announced on Aug 27, 2020, global smartphone shipments
are expected to drop by 9.5% YoY to 1.2bn in 2020E due to the COVID-19 pandemic
suppressing economic growth and expenditure worldwide. Many smartphone makers
have launched their 5G smartphone models in 2020. IDC expects China to be the
largest market for 5G smartphone in 2020 with a 67.7% market share, followed by the
US’s 12.2%. Due to economic uncertainties, smartphone ASP is expected to face
downward pressure and consumers will prefer the mid-to-low range models. IDC
expects the fastest growth for the US$ 400-600 average selling price (ASP) price
band for 2020E; also, the ASP for 5G smartphones will drop to US$ 465 in 2024E.
Exhibit 11: Global smartphone shipments and
growth
Exhibit 12: 5G Smartphone market share estimates for 2020E
Source(s): IDC
Source(s): IDC
IDC forecasts personal computing devices (PCD) market, which includes
traditional PCs, tablets, and workstations shipments to grow 3.3% YoY in 2020E
According to IDC, the demand of PC in 2020E is estimated to be strong, driven from
the demand from home office, home education and home entertainment due to the
COVID-19 pandemic. Business usage PC shipments are also rising as enterprises
and corporations are using more video conferences and online applications. The
cases of COVD-19 are rebounding in Europe which may further stimulate demand of
PC and tablets with the shift to home office under curfew. IDC expects the personal
computing devices (PCD) market, which includes traditional PCs, tablets, and
workstations, will grow 3.3% YoY in 2020E with shipment reaching 425.7 mn. The
COVID-19 pandemic accelerated demand for PCs and tablets from both the
commercial segment and the consumer segment.
China 67.7%
US 12.2%
Asia Pacific
(exclude
China)
7.5%
Western
Europe 7.1%
Others
6.0%
1.47
1.40
1.37
(0.1%)
(4.1%)
(2.3%)
-8.0%
-4.0%
0.0%
1.20
1.40
1.60
2017 2018 2019
Smartphone shipments YoY
bn
BYD Electronic (International) Co. Ltd. (285 HK, BUY) China Telecom Sector
Nov 2, 2020
7
Financial forecasts
BYDE’s businesses cover a wide range of consumer electronics, automotive intelligent
system, IoT, manufacturing molds, metal, plastic parts, 3D glass, ceramics and others.
BYDE’s core businesses include (1) smartphones and PC; (2) new intelligent product;
(3) automotive intelligent system; (4) Others
(1) Smartphone and PC business
The smartphone and PC business is the Company’s largest revenue driver accounting
for 85.6% of total in FY19. The revenue amounted to RMB45.4 bn in 2019, up 24.9%
YoY, driven by solid strategic partnership with many Android smartphone makers and
PC makers. We expect BYDE to benefit for more assembly demand for tablets, PCs,
and smartphones in FY20E.
We expect BYDE’s smartphone and PC revenue to grow at a CAGR of 26.8% in
FY19-22E, driven by market share improvement and new customer acquisitions.
(2) New intelligent product business
Thanks to the acquisition of new customers, revenue from the new intelligent business
rose 38.8% YoY in FY19. BYDE engaged in a series of marketing activities and
partnered with customers in the fields of intelligent home, gaming, commerce and IoT.
The COVID-19 pandemic benefited the Company’s new intelligent business with
increased demand from the stay-at-home economy, which involves remote work,
remote education, and indoor entertainment, boosting shipment of electronic devices
and gaming consoles. We project new intelligent product business to grow at a CAGR
of 40.6% in FY19-22E with the increased demand from stay-at-home economy.
(3) Automotive intelligent system business
Modern vehicles are equipped with multimedia systems, touch pads, and screens to
improve user experience and provide interactive services. The Company’s automotive
intelligent system business has been benefiting from vehicle demand from its parent
company. The segment’s revenue grew 33.9% YoY in FY19, and more capital has
been allocated for hardware and software development required for the business.
We forecast its automotive intelligent system business revenue to grow at a CAGR of
34.9% in FY19-22E, supported by solid demand from its parent company and overseas
development plan.
(4) Others business
The Company produces protective masks in 2020 in light of the shortage early in the
COVID-19 pandemic. BYDE produces medical protective products such as single-use
masks, N95 particulate respirator, and hand sanitizers. We project the Company to
record RMB 20.3bn/ RMB 18.3 bn in revenue from the segment in FY20E-21E.
BYD Electronic (International) Co. Ltd. (285 HK, BUY) China Telecom Sector
Nov 2, 2020
8
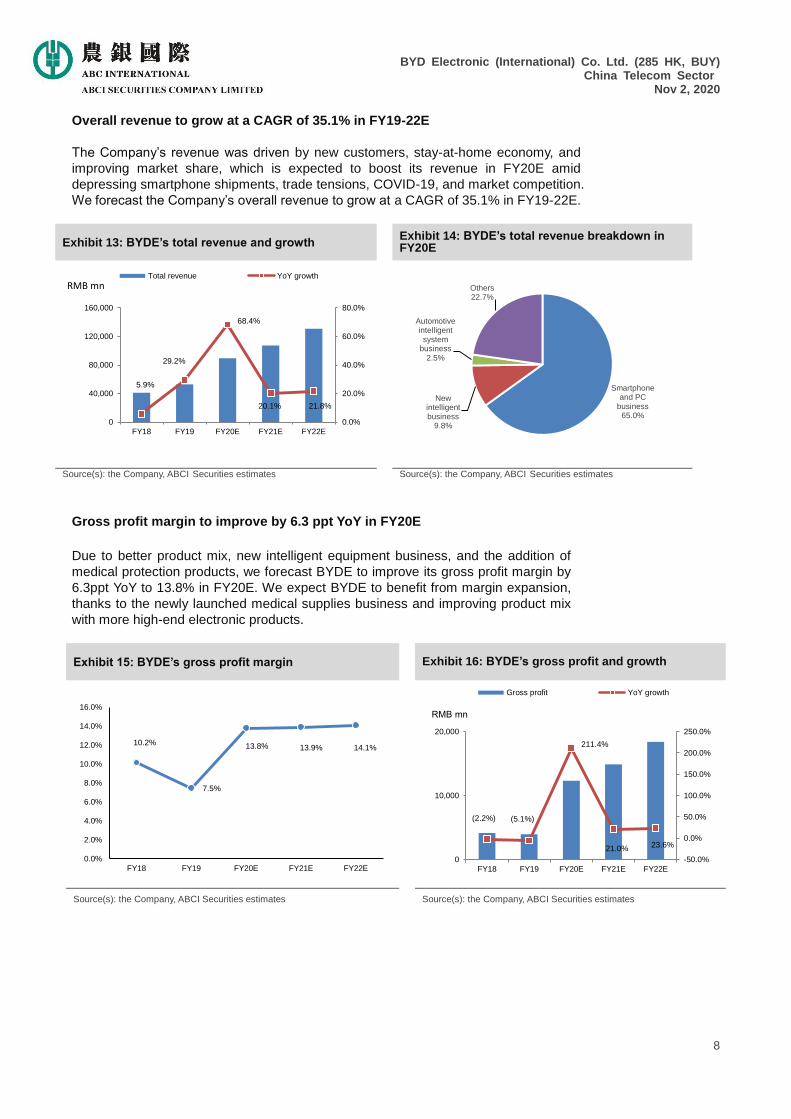
Overall revenue to grow at a CAGR of 35.1% in FY19-22E
The Company’s revenue was driven by new customers, stay-at-home economy, and
improving market share, which is expected to boost its revenue in FY20E amid
depressing smartphone shipments, trade tensions, COVID-19, and market competition.
We forecast the Company’s overall revenue to grow at a CAGR of 35.1% in FY19-22E.
Exhibit 13: BYDE’s total revenue and growth Exhibit 14: BYDE’s total revenue breakdown in FY20E
Source(s): the Company, ABCI estimatesSecurities Source(s): the Company, ABCI estimatesSecurities
Gross profit margin to improve by 6.3 ppt YoY in FY20E
Due to better product mix, new intelligent equipment business, and the addition of
medical protection products, we forecast BYDE to improve its gross profit margin by
6.3ppt YoY to 13.8% in FY20E. We expect BYDE to benefit from margin expansion,
thanks to the newly launched medical supplies business and improving product mix
with more high-end electronic products.
Exhibit 15: BYDE’s gross profit margin Exhibit 16: BYDE’s gross profit and growth
Source(s): the Company, ABCI Securities estimates Source(s): the Company, ABCI Securities estimates
5.9%
29.2%
68.4%
20.1% 21.8%
0.0%
20.0%
40.0%
60.0%
80.0%
0
40,000
80,000
120,000
160,000
FY18 FY19 FY20E FY21E FY22E
Total revenue YoY growth
RMB mn
Smartphone and PC
business 65.0%
New intelligent business
9.8%
Automotive intelligent
system business
2.5%
Others 22.7%
10.2%
7.5%
13.8% 13.9% 14.1%
0.0%
2.0%
4.0%
6.0%
8.0%
10.0%
12.0%
14.0%
16.0%
FY18 FY19 FY20E FY21E FY22E
(2.2%) (5.1%)
211.4%
21.0% 23.6%
-50.0%
0.0%
50.0%
100.0%
150.0%
200.0%
250.0%
0
10,000
20,000
FY18 FY19 FY20E FY21E FY22E
Gross profit YoY growth
RMB mn

BYD Electronic (International) Co. Ltd. (285 HK, BUY) China Telecom Sector
Nov 2, 2020
9
Net profit to grow at a CAGR of 85.4% in FY19-22E
Benefited from scale effect, we forecast BYDE’s R&D expenses/ revenue ratio to lower
from 3.9% in FY19 to 3.7% in FY20E. BYDE’s net profit margin is expected to reach
6.7%/7.1%/7.8% in FY20E-22E, respectively. We forecast BYDE’s net profit to grow at
a CAGR of 85.4% in FY19-22E, driven by better revenue growth and gross margin
improvement.
Exhibit 17: BYDE’s net profit margin Exhibit 18: BYDE’s net profit and growth
Source(s): the Company, ABCI estimatesSecurities Source(s): the Company, ABCI estimatesSecurities
5.3%
3.0%
6.7% 7.1%
7.8%
0.0%
2.0%
4.0%
6.0%
8.0%
10.0%
FY18 FY19 FY20E FY21E FY22E
(15.3%) (27.0%)
272.3%
28.7% 33.1%
-50.0%
0.0%
50.0%
100.0%
150.0%
200.0%
250.0%
300.0%
0
10,000
20,000
FY18 FY19 FY20E FY21E FY22E
net profit YoY growth
RMB mn

BYD Electronic (International) Co. Ltd. (285 HK, BUY) China Telecom Sector
Nov 2, 2020
10
Valuations
Recommend BUY with TP at HK$42.0
Our DCF-derived TP of the Company is HK$ 42.0 (WACC: 12.1%; perpetuity growth
rate: 2.3%), representing 13.8x/10.8x FY20E/21E P/E. We expect to have 26.1%
potential upside to the stock price and initiate the Company with BUY rating.
Exhibit 19: Peers Comparison Table
P/E P/B ROE ROA EV/EBITDA
Ticker Price* 19A 20E 21E 22E 19A 20E 21E 22E 20E 20E 20E
BYD Electronic Ltd 285 HK 33.30 36.6 11.1 10.8 9.9 3.5 2.7 2.5 2.1 19.7 12.9 8.3
AAC Technologies
Holdings In
2018 HK 40.85 42.0 27.3 19.5 16.5 3.0 2.8 2.5 2.3 10.5 6.0 12.4
Sunny Optical Tech 2382 HK 128.2
0
30.2 27.8 21.4 17.4 9.8 7.5 5.8 4.5 30.0 13.6 17.8
TCL Electronics
Holdings Ltd
1070 HK 5.24 5.8 12.8 10.6 8.5 1.2 1.1 1.0 0.9 8.8 3.1 14.9
Cowell E Holdings Inc 1415 HK 3.40 11.4 6.8 5.7 5.1 1.0 1.0 0.9 0.9 11.2 9.3 2.8
Q Technology Group
Co Ltd
1478 HK 8.53 19.6 15.1 12.2 10.4 3.8 3.1 2.6 2.2 22.5 6.2 9.4
Average 20.6 16.8 14.4 12.4 3.2 3.0 2.6 2.2 17.1 8.5 10.9
*Based on closing price on Oct 30, 2020
Source(s): Bloomberg

BYD Electronic (International) Co. Ltd. (285 HK, BUY) China Telecom Sector
Nov 2, 2020
11
Risk factors
High customer concentration risk
The revenue proportion contributed from the largest customer increased from 30.2% in
2018 to 51.3% in 2019.
Revenue highly dependent on Android smartphone shipments
Most of BYDE’s customers are Android smartphone makers. The Company’s business
is highly dependent on the shipment of Android smartphones. Decline in global
smartphone shipments will affect the Company’s earnings.
Our forecasts may deviate from actual results
We make our forecasts relies on a number of assumptions. The actual results may
deviate from our estimates.
Highly dependent on smartphones and PCs business
BYDE generated over 85.6% of total revenue from smartphones and PCs business in
FY19. The Company will face significant impact to its revenue if there is any change in
smartphone and PC shipments.
Slowdown in 5G network development may affect earnings
The Company’s business may be affected if there are any changes in 5G network
development progress.
Business may be affected by international trade tension
International trade tension or disputes may affect the Company’s product shipments.

BYD Electronic (International) Co. Ltd. (285 HK, BUY) China Telecom Sector
Nov 2, 2020
12
Financial Statements Consolidated income statement (2018A-2022E)
FY Ended Dec 31 (RMB mn) 2018A 2019A 2020E 2021E 2022E
Smartphone and PC business revenue 35,517 45,409 58,011 73,769 92,667
New Intelligent business revenue 4,340 6,025 8,736 12,231 16,756
Automotive intelligent system business revenue 1,190 1,594 2,248 3,012 3,915
Others revenue 0 0 20,300 18,270 17,357
Total revenue 41,047 53,028 89,295 107,281 130,695
Cost of revenue (36,875) (49,071) (76,972) (92,369) (112,267)
Gross profit 4,172 3,957 12,323 14,912 18,428
R&D expenses (1,589) (2,088) (3,304) (3,862) (4,574)
Selling and distribution expenses (229) (257) (432) (520) (523)
Admin expenses (536) (619) (1,072) (1,287) (1,438)
Others 718 703 (979) (834) (703)
Profit before tax 2,536 1,696 6,536 8,409 11,190
Tax (347) (99) (588) (757) (1,007)
Net profit 2,189 1,598 5,948 7,652 10,183
EPS (RMB) 0.971 0.709 2.640 3.396 4.519
DPS (RMB) 0.195 0.071 0.264 0.340 0.453
Source(s): Company, ABCI Securities estimates

BYD Electronic (International) Co. Ltd. (285 HK, BUY) China Telecom Sector
Nov 2, 2020
13
Consolidated balance sheet (2018A-2022E)
As of Dec 31 (RMB mn) 2018A 2019A 2020E 2021E 2022E
PPE 7,634 8,617 9,221 9,866 10,557
Prepayments, other receivables
and other assets 399 567 617 671 730
Others 929 1,761 5,016 9,643 16,371
Total non-current assets 8,962 10,945 14,853 20,180 27,657
Cash & cash equivalents 4,741 1,651 1,486 1,337 1,203
Inventories 4,768 5,401 5,876 6,393 6,956
Trade receivables 7,209 9,567 10,428 11,367 12,390
Others 371 463 511 565 625
Total current assets 17,089 17,082 18,301 19,662 21,174
Total assets 26,051 28,027 33,155 39,842 48,832
Trade and bill payables 7,892 7,340 6,973 6,624 6,293
Others 2,170 3,059 3,198 3,345 3,498
Total current liabilities 10,062 10,399 10,171 9,969 9,791
Deferred tax liabilities 45 18 17 17 16
Others 120 620 625 629 634
Total non-current liabilities 164 639 642 646 649
Total liabilities 10,226 11,038 10,813 10,615 10,441
Total equity 15,825 16,989 22,341 29,227 38,391
Source(s): Company, ABCI Securities estimates
BYD Electronic (International) Co. Ltd. (285 HK, BUY) China Telecom Sector
Nov 2, 2020
14
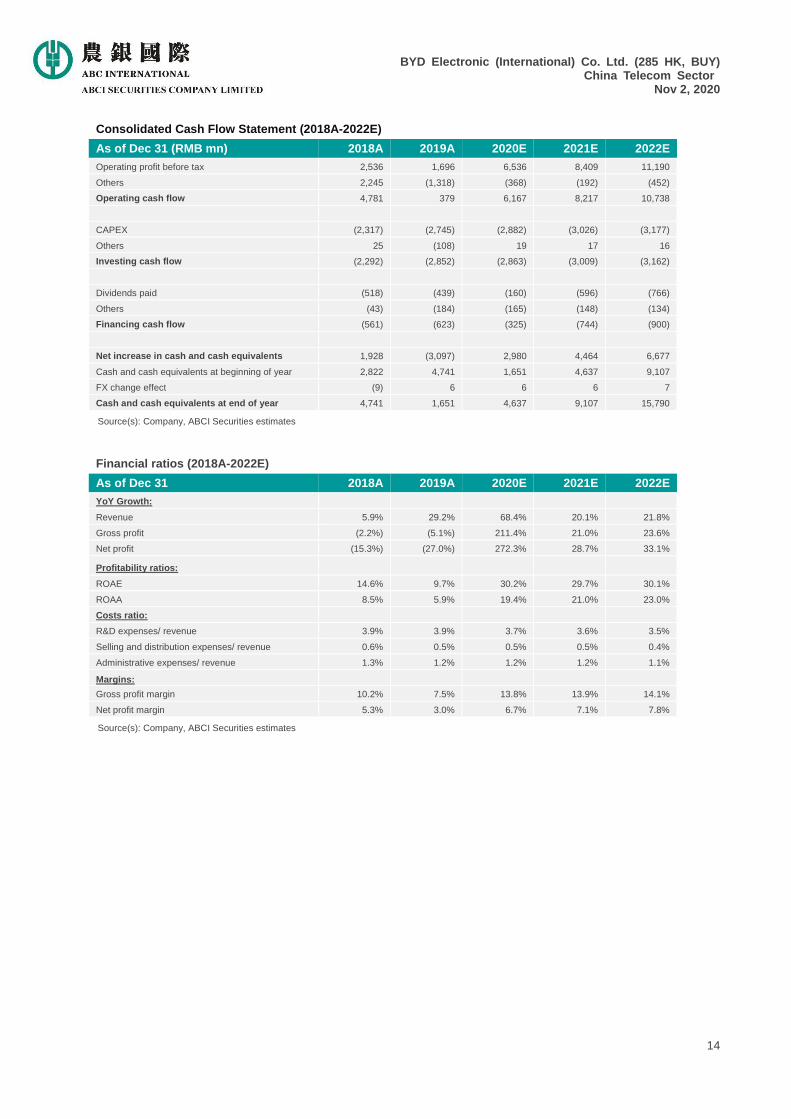
Consolidated Cash Flow Statement (2018A-2022E)
As of Dec 31 (RMB mn) 2018A 2019A 2020E 2021E 2022E
Operating profit before tax 2,536 1,696 6,536 8,409 11,190
Others 2,245 (1,318) (368) (192) (452)
Operating cash flow 4,781 379 6,167 8,217 10,738
CAPEX (2,317) (2,745) (2,882) (3,026) (3,177)
Others 25 (108) 19 17 16
Investing cash flow (2,292) (2,852) (2,863) (3,009) (3,162)
Dividends paid (518) (439) (160) (596) (766)
Others (43) (184) (165) (148) (134)
Financing cash flow (561) (623) (325) (744) (900)
Net increase in cash and cash equivalents 1,928 (3,097) 2,980 4,464 6,677
Cash and cash equivalents at beginning of year 2,822 4,741 1,651 4,637 9,107
FX change effect (9) 6 6 6 7
Cash and cash equivalents at end of year 4,741 1,651 4,637 9,107 15,790
Source(s): Company, ABCI Securities estimates
Financial ratios (2018A-2022E)
As of Dec 31 2018A 2019A 2020E 2021E 2022E
YoY Growth:
Revenue 5.9% 29.2% 68.4% 20.1% 21.8%
Gross profit (2.2%) (5.1%) 211.4% 21.0% 23.6%
Net profit (15.3%) (27.0%) 272.3% 28.7% 33.1%
Profitability ratios:
ROAE 14.6% 9.7% 30.2% 29.7% 30.1%
ROAA 8.5% 5.9% 19.4% 21.0% 23.0%
Costs ratio:
R&D expenses/ revenue 3.9% 3.9% 3.7% 3.6% 3.5%
Selling and distribution expenses/ revenue 0.6% 0.5% 0.5% 0.5% 0.4%
Administrative expenses/ revenue 1.3% 1.2% 1.2% 1.2% 1.1%
Margins:
Gross profit margin 10.2% 7.5% 13.8% 13.9% 14.1%
Net profit margin 5.3% 3.0% 6.7% 7.1% 7.8%
Source(s): Company, ABCI Securities estimates
BYD Electronic (International) Co. Ltd. (285 HK, BUY) China Telecom Sector
Nov 2, 2020
15
Disclosures
Analyst Certification The analyst, LAI Pak Kin, primarily responsible for the content of this research report, in whole or in part, hereby certify that all of the views expressed in this report accurately reflect my personal view about the subject company or companies and its or their securities. I also certify that no part of my compensation was, is, or will be, directly or indirectly, related to the specific recommendations or views expressed in this report. I and/or my associates have no financial interests in relation to the listed company(ies) covered in this report, and I and/or my associates do not serve as officer(s) of the listed company (ies) covered in this report.
Disclosures of Interests
ABCI Securities Company Limited and/or its affiliates may pursue financial interests to the companies mentioned in the report.
Definition of equity rating
Rating Definition
Buy Stock return rate≥ Market return rate (10%)
Hold - Market return rate (-10%) ≤ Stock return rate < Market return rate (+10%)
Sell Stock return < - Market return (-10%)
Notes: Stock return rate: expected percentage change of share price plus gross dividend yield over the next 12 months
Market return rate: average market return rate since 2008 (HSI total return index 2008-19 CAGR at 10%)
Time horizon of share price target: 12-month
Stock rating, however, may vary from the stated framework due to factors including but not limited to: corporate governance, market
capitalization, historical price volatility relative to corresponding benchmark index, average daily turnover of the stock relative to market
capitalization of the stock, competitive advantages in corresponding industry, etc. Disclaimers
This report is for our clients only and is for distribution only under such circumstances as may be permitted by applicable law. It has no
regard to the specific investment objectives, financial situation or particular needs of any specific recipient. It is published solely for
informational purposes and is not to be construed as a solicitation or an offer to buy or sell any securities or related financial instruments.
No representation or warranty, either expresses or implied, is provided in relation to the accuracy, completeness or reliability of the
information contained herein. This report should not be regarded by recipients as a substitute for the exercise of their own judgment. Any
opinions expressed in this report are subject to change without notice and may differ or be contrary to opinions expressed by other
business areas as a result of using different assumptions and criteria. The analysis contained herein is based on numerous assumptions.
Different assumptions could result in materially different results. The analyst(s) responsible for the preparation of this report may interact
with trading desk personnel, sales personnel and other constituencies for the purpose of gathering, synthesizing and interpreting market
information. ABCI Securities Company Limited is under no obligation to update or keep current the information contained herein. ABCI
Securities Company Limited relies on information barriers to control the flow of information contained in one or more areas within ABCI
Securities Company Limited, into other areas, units, groups or affiliates of ABCI Securities Company Limited. The compensation of the
analyst who prepared this report is determined exclusively by research management and senior management (not including investment
banking). Analyst compensation is not based on investment banking revenues, however, compensation may relate to the revenues of ABCI
Securities Company Limited as a whole, of which investment banking, sales and trading are a part. The securities described herein may
not be eligible for sale in all jurisdictions or to certain categories of investors. The price and value of the investments referred to in this
research and the income from them may fluctuate. Past performance is not necessarily indicative of future results. Foreign currency rates
of exchange may adversely affect the value, price or income of any security or related instrument mentioned in this report. For investment
advice, trade execution or other enquiries, clients should contact their local sales representative. Neither ABCI Securities Company Limited
nor any of its affiliates, directors, employees or agents accepts any liability for any loss or damage arising out of the use of all or any part of
this report. Additional information will be made available upon request.
Copyright 2020 ABCI Securities Company Limited
No part of this material may be (i) copied, photocopied or duplicated in any form by any means or (ii) redistributed without the prior written
consent of ABCI Securities Company Limited.
Office address: ABCI Securities Company Limited, 13/F Fairmont House, 8 Cotton Tree Drive, Central, Hong Kong.
Tel: (852) 2868 2183