by wayne h. sonntag - usgs · by wayne h. sonntag u.s. geological survey water-resources...
TRANSCRIPT

SUBSURFACE STORAGE OF FRESHWATER IN SOUTH FLORIDA:
EVALUATION OF SURFACE-WATER DISCHARGE DATA
AT SELECTED SITES
By Wayne H. Sonntag
U.S. GEOLOGICAL SURVEY
Water-Resources Investigations Report 84-4008
Prepared in cooperation with the
U.S. ARMY CORPS OF ENGINEERS
Tallahassee, Florida
1984

UNITED STATES DEPARTMENT OF THE INTERIOR
WILLIAM P. CLARK, Secretary
GEOLOGICAL SURVEY
Dallas L. Peck, Director
For additional information write to:
District ChiefU.S. Geological SurveySuite 3015227 North Bronough StreetTallahassee, Florida 32301
Copies of the report can be purchased from:
Open-File Services Section Western Distribution Branch U.S. Geological Survey Box 25425, Federal Center Denver, Colorado 80225 (Telephone: [303] 234-5888)
CONTENTS
Page
Abstract 1Introduction 2Availability of surplus water 3Presentation of discharge data 5
St. Lucie Canal at lock near Stuart, site 1 8West Palm Beach Canal at West Palm Beach, site 2 12Hillsboro Canal near Deerfield Beach, site 3 17Cypress Creek Canal at S-37A near Pompano Beach, site 4 20Middle River Canal at S-36 near Fort Lauderdale, site 5 22Plantation Road Canal at S-33 near Fort Lauderdale, site 6 24North New River Canal near Fort Lauderdale, site 7 26South New River Canal at S-13 near Davie, site 8 ; 28Snake Creek Canal at S-29, North Miami Beach, site 9 30Biscayne Canal at S-28 near Miami, site 10 33Little River Canal at S-27, Miami, site 11 35Miami Canal at N.W. 36th Street, Miami, site 12 37Tamiami Canal outlets, Monroe to Carnestown, site 13 38Tamiami Canal outlets, 40-Mile Bend to Monroe, site 14 42 Tamiami Canal outlets, Levee 67A to 40-Mile Bend, near Miami,
site 15 44Tamiami Canal outlets, Levee 30 to Levee 67A, near Miami, site 16 47Tamiami Canal near Coral Gables, site 17 49Snapper Creek Canal at S-22 near south Miami, site 18 52Black Creek Canal at S-21 near Goulds, site 19 54Mowry Canal at S-20F, site 20 56Canal 111 above S-18C near Florida City, site 21 58Barren River Canal near Everglades City, site 22 60Fahka Union Canal near Cope land, site 23 63Henderson Creek Canal near Naples, site 24 65Golden Gate Canal at Naples, site 25 67Cocohatchee River Canal at Willoughby Acre Bridge, site 26 69Caloosahatchee River at S-79 near Olga, site 27 71
Summary and conclusions 74Selected references 74
ILLUSTRATIONS
Figure 1. Map showing location of the area of investigation, rainfallstations, and selected canal sites 4
2. Map showing location of canal, canal site, and controlsin Martin County 9
3. Flow-duration curve for water years 1970-80, St. LucieCanal at lock near Stuart, site 1 10
4. Map showing location of canals, canal site, controls, andmajor roads in Palm Beach County 13
III
ILLUSTRATIONS -Cent inued
Page
Figure 5. Flow-duration curves for water years 1970-80 and the June through November periods 1970-80, West Palm Beach Canal at West Palm Beach, site 2 14
6. Frequency curves for the indicated number of consecutive days, June through November 1970-80, West Palm Beach Canal at West Palm Beach, site 2 14
7. Map showing location of canals, canal sites, controls,and major roads in Broward County 18
8. Flow-duration curves for water years 1970-80 and the June through November periods 1970-80, Hillsboro Canal near Deerfield Beach, site 3 19
9. Frequency curves for the indicated number of consecutive days, June through November 1970-80, Hillsboro Canal at Deerfield Beach, site 3 - 19
10. Flow-duration curves for water years 1970-80 and the June through November periods 1970-80, Cypress Creek Canal at S-37A near Pompano Beach, site 4 21
11. Frequency curves for the indicated number of consecutivedays, June through November 1970-80, Cypress Creek Canalat S-37A near Pompano Beach, site 4 21
12. Flow-duration curves for water years 1970-80 and the May through October periods 1970-80, Middle River Canal at S-36 near Fort Lauderdale, site 5 23
13. Frequency curves for the indicated number of consecutive days, May through October 1970-80, Middle River Canal at S-36 near Fort Lauderdale, site 5 23
14. Flow-duration curves for water years 1970-80 and the June through November periods 1970-80, Plantation Road Canal at S-33 near Fort Lauderdale, site 6 25
15. Frequency curves for the indicated number of consecutive days, June through November 1970-80, Plantation Road Canal at S-33 near Fort Lauderdale, site 6 25
16. Flow-duration curves for water years 1970-80 and the June through November periods 1970-80, North New River Canal near Fort Lauderdale, site 7 27
17. Frequency curves for the indicated number of consecutive days, June through November 1970-80, North New-River Canal near Fort Lauderdale, site 7 27
IV

ILLUSTRATIONS Cont inued
Page
Figure 18. Flow-duration curves for water y^ars 1970-80 and the June through November periods 1970-80, South New River Canal at S-13 near Davie, site 8 29
19. Frequency curves for the indicated number of consecutive days, June through November 1970-80, South New River Canal at S-13 near Davie, site 8 29
20. Map showing location of canals, canal sites, controls, andmajor roads in northeast Dade County 31
21. Flow-duration curves for water years 1970-80 and the June through November periods 1970-80, Snake Creek Canal at S-29, North Miami Beach, site 9 32
22. Frequency curves for the indicated number of consecutive days, June through November 1970-80, Snake Creek Canal at S-29, North Miami Beach, site 9 32
23. Flow-duration curves for water years 1970-80 and the May through October periods 1970-80, Biscayne Canal at S-28 near Miami, site 10 34
24. Frequency curves for the indicated number of consecutive days, May through October 1970-80, Biscayne Canal at S-28 near Miami, site 10 34
25. Flow-duration curves for water years 1974-80 and the May through October periods 1974-80, Little River Canal at S-27, Miami, site 11 36
26. Frequency curves for the indicated number of consecutive days, May through October 1974-80, Little River Canal at S-27, Miami, site 11 36
27. Flow-duration curves for water years 1970-80 and the June through November periods 1970-80, Miami Canal at N.W. 36th Street, Miami, site 12 39
28. Frequency curves for the indicated number of consecutive days, June through November 1970-80, Miami Canal at N.W. 36th Street, Miami, site 12 39
29. Map showing location of the Tamiami Canal outlets 40
30. Flow-duration curves for water years 1970-80 and the July through October periods 1970-80, Tamiami Canal outlets, Monroe to Carnestown, site 13 41

ILLUSTRATIONS Cont inued
Page
Figure 31. Frequency curves for the indicated number of consecutive days, July through October 1970-80, Tamiami Canal outlets, Monroe to Carnestown, site 13 41
32. Flow-duration curves for water years 1970-80 and the July through October periods 1970-80, Tamiami Canal outlets, 40-Mile Bend to Monroe, site 14 43
33. Frequency curves for the indicated number of consecutive days, July through October 1970-80, Tamiami Canal outlets, 40-Mile Bend to Monroe, site 14 43
34. Flow-duration curves for water years 1970-80 and the Sep tember through December periods 1970-80, Tamiami Canal outlets, Levee 67A to 40-Mile Bend near Miami, site 15 45
35. Frequency curves for the indicated number of consecutive days, September through December 1970-80, Tamiami Canal outlets, Levee 67A to 40-Mile Bend near Miami, site 15 45
36. Flow-duration curves for water years 1970-80 and the Sep tember through February periods 1970-81, Tamiami Canal outlets, Levee 30 to Levee 67A near Miami, site 16 48
37. Frequency curves for the indicated number of consecutive days, September through February 1970-81, Tamiami Canal outlets, Levee 30 to Levee 67A near Miami, site 16 48
38. Map showing location of selected canals, canal sites,controls, and major roads in Dade Couny 50
39. Flow-duration curves for water years 1970-80 and the July through December periods 1970-80, Tamiami Canal near Coral Gables, site 17 51
40. Frequency curves for the indicated number of consecutive days, July through December 1970-80, Tamiami Canal near Coral Gables, site 17 J-L
41. Flow-duration curves for water years 1970-80 and the June through November periods 1970-80, Snapper Creek Canal at S-22 near south Miami, site 18 53
42. Frequency curves for the indicated number of consecutivedays, June through November 1970-80, Snapper Creek Canalat S-22 near south Miami, site 18 53
VI

ILLUSTRATIONS Cont inued
Page
Figure 43. Flow-duration curves for water years 1970-77, 1979-80, and October through December 1977, and the June through No vember periods 1970-77, 1979-80, and October and November 1978, Black Creek Canal at S-21 near Goulds, site 19 55
44. Frequency curves for the indicated number of consecutive days, June through November 1970-77 and 1979-80, Black Creek Canal at S-21 near Goulds, site 19 55
45. Flow-duration curves for March 1970 through September 1980 and the June through November periods 1970-80, Mowry Canal at S-20F, site 20 57
46. Frequency curves for the indicated number of consecutive days, June through November 1970-80, Mowry Canal at S-20F, site 20 57
47. Flow-duration curves for water years 1970-80 and the May through October periods 1970-80, Canal 111 above S-18C near Florida City, site 21 59
48. Frequency curves for the indicated number of consecutivedays, May through October 1970-80, Canal 111 above S-18C near Florida City, site 21 - 59
49. Map showing location of canals, canal sites, controls,and major roads in Collier County 61
50. Flow-duration curves for water years 1970-80 and the July through December periods 1970-80, Barron River Canal near Everglades City, site 22 62
51. Frequency curves for the indicated number of consecutive days, July through December 1970-80, Barron River Canal near Everglades City, site 22 62
52. Flow-duration curves for water years 1970-80 and the June through November periods 1970-80, Fahka Union Canal near Copeland, site 23 64
53. Frequency curves for the indicated number of consecutive days, June through November 1970-80, Fahka Union Canal near Copeland, site 23 64
54. Flow-duration curves for water years 1970-80 and the June through October periods 1970-80, Henderson Creek Canal near Naples, site 24 66
VII

ILLUSTRATIONS Cont inued
Page
Figure 55. Frequency curves for the indicated number of consecutive days, June through October 1970-80, Henderson Creek Canal near Naples, site 24 66
56. Flow-duration curves for water years 1970-80 and the June through October periods 1970-80, Golden Gate Canal at Naples, site 25 68
57. Frequency curves for the indicated number of consecutive days, June through October 1970-80, Golden Gate Canal at Naples, site 25 68
58. Flow-duration curves for water years 1970-80 and the July through October periods 1970-80, Cocohatchee River Canal at Willoughby Acre Bridge, site 26 70
59. Frequency curves for the indicated number of consecutive days, July through October 1970-80, Cocohatchee River Canal at Willoughby Acre Bridge, site 26 70
60. Map showing location of canal, canal site, control, andmajor roads in Lee County 72
61. Flow-duration curves for water years 1970-80 and the June through October periods 1970-80, Caloosahatchee River at S-79 near Olga, site 27 73
62. Frequency curves for the indicated number of consecutivedays, June through October 1970-80, Caloosahatchee Riverat S-79 near Olga, site 27 73
TABLES
Table 1. Canals and structures for which data are presented 6
2. Monthly percentage of average annual discharge at 27 sitesfor water years 1970-80 7
3. Summary of flow-duration data at 27 canal sites for wateryears 1970-80 H
4. Summary of flow-duration data at selected sites for selectedperiods of consecutive months during 1970-81 water years 15
5. Discharges to the Everglades National Park through Tamiami Canal outlets, Levee 67A to 40-Mile Bend near Miami, site 15 46
VIII
SUBSURFACE STORAGE OF FRESHWATER IN SOUTH FLORIDA:
EVALUATION OF SURFACE-WATER DISCHARGE DATA AT SELECTED SITES
By Wayne H. Sonntag
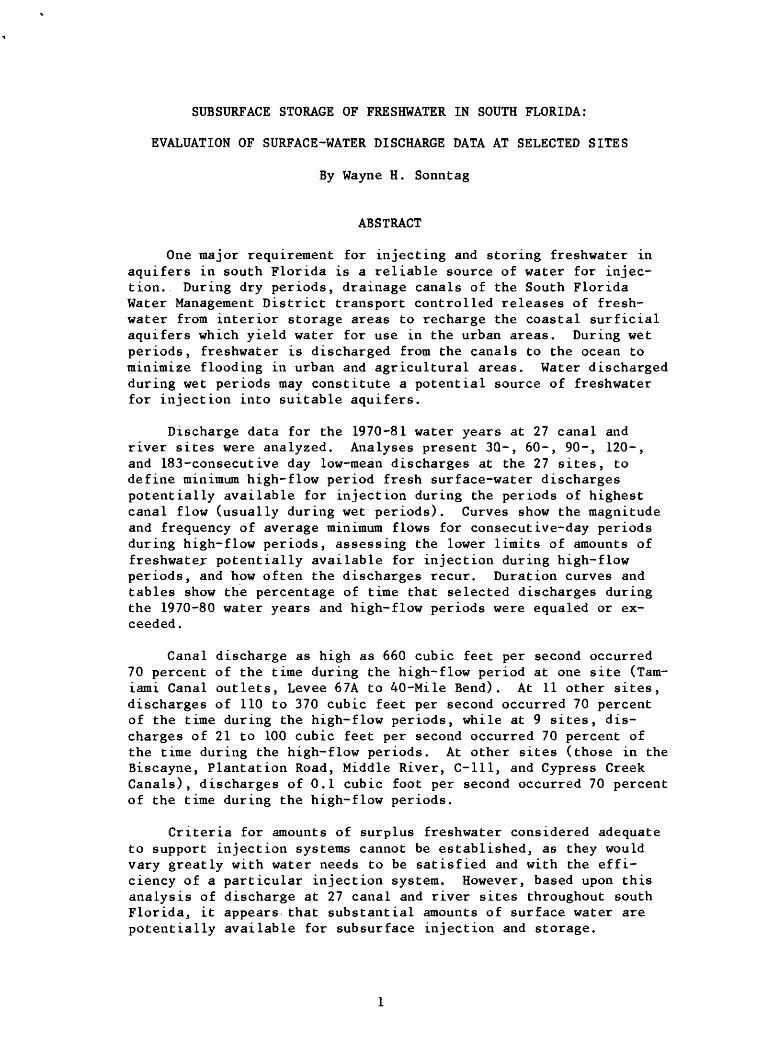
ABSTRACT
One major requirement for injecting and storing freshwater in aquifers in south Florida is a reliable source of water for injec tion. During dry periods, drainage canals of the South Florida Water Management District transport controlled releases of fresh water from interior storage areas to recharge the coastal surficial aquifers which yield water for use in the urban areas. During wet periods, freshwater is discharged from the canals to the ocean to minimize flooding in urban and agricultural areas. Water discharged during wet periods may constitute a potential source of freshwater for injection into suitable aquifers.
Discharge data for the 1970-81 water years at 27 canal and river sites were analyzed. Analyses present 3Q-, 60-, 90-, 120-, and 183-consecutive day low-mean discharges at the 27 sites, to define minimum high-flow period fresh surface-water discharges potentially available for injection during the periods of highest canal flow (usually during wet periods). Curves show the magnitude and frequency of average minimum flows for consecutive-day periods during high-flow periods, assessing the lower limits of amounts of freshwater potentially available for injection during high-flow periods, and how often the discharges recur. Duration curves and tables show the percentage of time that selected discharges during the 1970-80 water years and high-flow periods were equaled or ex ceeded.
Canal discharge as high as 660 cubic feet per second occurred 70 percent of the time during the high-flow period at one site (Tam- iami Canal outlets, Levee 67A to 40-Mile Bend). At 11 other sites, discharges of 110 to 370 cubic feet per second occurred 70 percent of the time during the high-flow periods, while at 9 sites, dis charges of 21 to 100 cubic feet per second occurred 70 percent of the time during the high-flow periods. At other sites (those in the Biscayne, Plantation Road, Middle River, C-lll, and Cypress Creek Canals), discharges of 0.1 cubic foot per second occurred 70 percent of the time during the high-flow periods.
Criteria for amounts of surplus freshwater considered adequate to support injection systems cannot be established, as they would vary greatly with water needs to be satisfied and with the effi ciency of a particular injection system. However, based upon this analysis of discharge at 27 canal and river sites throughout south Florida, it appears that substantial amounts of surface water are potentially available for subsurface injection and storage.
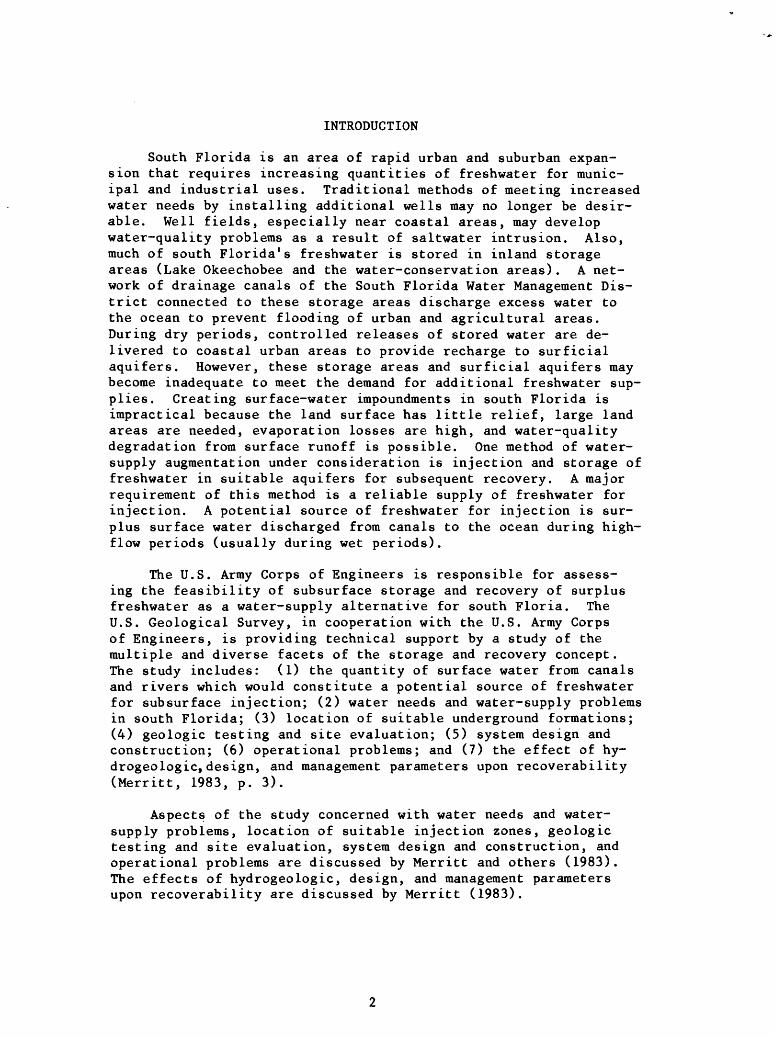
INTRODUCTION
South Florida is an area of rapid urban and suburban expan sion that requires increasing quantities of freshwater for munic ipal and industrial uses. Traditional methods of meeting increased water needs by installing additional wells may no longer be desir able. Well fields, especially near coastal areas, may develop water-quality problems as a result of saltwater intrusion. Also, much of south Florida's freshwater is stored in inland storage areas (Lake Okeechobee and the water-conservation areas). A net work of drainage canals of the South Florida Water Management Dis trict connected to these storage areas discharge excess water to the ocean to prevent flooding of urban and agricultural areas. During dry periods, controlled releases of stored water are de livered to coastal urban areas to provide recharge to surficial aquifers. However, these storage areas and surficial aquifers may become inadequate to meet the demand for additional freshwater sup plies. Creating surface-water impoundments in south Florida is impractical because the land surface has little relief, large land areas are needed, evaporation losses are high, and water-quality degradation from surface runoff is possible. One method of water- supply augmentation under consideration is injection and storage of freshwater in suitable aquifers for subsequent recovery. A major requirement of this method is a reliable supply of freshwater for injection. A potential source of freshwater for injection is sur plus surface water discharged from canals to the ocean during high- flow periods (usually during wet periods).
The U.S. Army Corps of Engineers is responsible for assess ing the feasibility of subsurface storage and recovery of surplus freshwater as a water-supply alternative for south Floria. The U.S. Geological Survey, in cooperation with the U.S. Army Corps of Engineers, is providing technical support by a study of the multiple and diverse facets of the storage and recovery concept. The study includes: (1) the quantity of surface water from canals and rivers which would constitute a potential source of freshwater for subsurface injection; (2) water needs and water-supply problems in south Florida; (3) location of suitable underground formations; (4) geologic testing and site evaluation; (5) system design and construction; (6) operational problems; and (7) the effect of hy- drogeologic, design, and management parameters upon recoverability (Merritt, 1983, p. 3).
Aspects of the study concerned with water needs and water- supply problems, location of suitable injection zones, geologic testing and site evaluation, system design and construction, and operational problems are discussed by Merritt and others (1983). The effects of hydrogeologic, design, and management parameters upon recoverability are discussed by Merritt (1983).

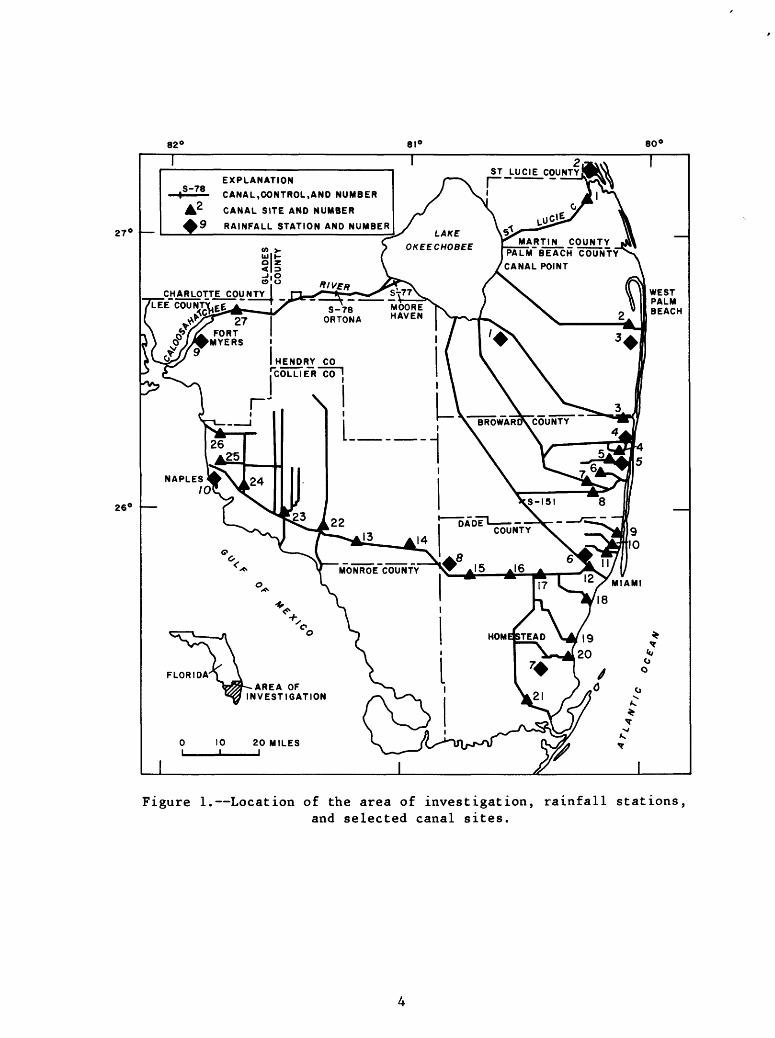
The purpose of this report is to identify, using U.S. Geologi cal Survey discharge data for south Florida, the quantity of fresh surface water discharged from selected canals and rivers that would be potentially available for injection and storage. The area of investigation, referred to as south Florida (fig. 1), includes six of the southernmost counties of the State: Broward, Collier, Dade, Lee, Martin, and Palm Beach Counties.
Discharge data for the 1970-81 water years at 27 canal and river sites throughout south Florida were analyzed to define: (1) the period of time when quantities of fresh surface water are potentially available for injection and storage; (2) the lower lim its or minimum amounts of fresh surface-water discharge potentially available during high-flow periods for injection and storage; and (3) how often the minimum high-flow period discharges recur. The. analysis includes: (1) a general description of each canal system and location of the canal site where discharge data were analyzed; (2) tabulation of monthly percentage of average annual discharge at the 27 sites for the 1970-81 water years, indicating the period of 4 to 6 consecutive months when the greatest percentage of dis charge occurred; (3) maximum, minimum, and mean daily discharges for the period of record analyzed and the period of 4 to 6 consec utive months when the greatest percentage of discharge occurred; (4) number of days when discharge was zero or consisted of esti mated leakage through the control structure during the months of greatest discharge; (5) flow-duration curves for the 1970-80 water years and for the months having the greatest discharge during the 1970-81 water years; (6) lowest mean discharges for 30, 60, 90, 120, and 183 consecutive days for the months having the greatest discharge; and (7) frequency curves for 30, 60, 90, 120, and 183 consecutive days during the months having the greatest discharge.
AVAILABILITY OF SURPLUS WATER
Seasonal variation in rainfall significantly affects the avail ability of surface water. Also affecting the availability of sur face water is the uneven geographical distribution of rainfall in south Florida. The following table shows average rainfall (in in ches) during 1951-81 and 1970-81 at 10 selected rainfall stations in south Florida (shown in fig. 1):
Station Station 1951-81 1970-81No.__________________________________________________
1 Belle Glade Experimental Station 55.38 52.152 Stuart 54.78 51.643 West Palm Beach Airport 59.41 57.394 Pompano Beach 61.02 54.425 Fort Lauderdale 62.07 59.916 Miami Airport 57.32 52.447 Homestead Experimental Station 63.23 59.738 Tamiami Trail at 40-Mile Bend 53.51 47.409 Fort Myers Airport 53.58 52.63
10 Naples 52.42 48.61
82° 80°
27°
26°
CANAL, CONTROL, AND NUMBER
A CANAL SITE AND NUMBER
RAINFALL STATION AND NUMBER
MARTIN COUNTY PALM"BEACH COUNTY CANAL POINT
I HivEft ^"^CHARLOTTE COUNTY HL-X" f- -^-^S-P rrtllMTV -^ .~ I ^^" "* \ ..
HENDRY CO[COLLIER co
I X nomuADrX XftliUTV
Figure 1. Location of the area of investigation, rainfall stations,and selected canal sites.

This table shows the geographical variation in rainfall at the se lected rainfall stations and also shows that average rainfall at the stations during 1970-81 was less than the average long-term rainfall for 1951-81.
The availability of surface water in south Florida also is in fluenced by the character of the supplying watershed, recharge to the watershed, and water-management practices within the watershed. These factors influence the volume of water available, the distri bution of streamflow in time, and the quality of water.
The amount of surface water discharged through coastal-control structures is significantly affected by operation of the struc tures, the principal purpose of which is salinity or flood control. During wet periods, water is discharged through the control struc tures to minimize flooding. During dry periods, water is stored behind the controls to retard saltwater intrusion and to provide lateral recharge by outseepage to well-field areas. Thus, dis charge through the controls is chiefly caused by seasonal regula tion of water levels at the control structures.
With a few exceptions, discharge data for water years 1970-81 were used in this analysis to eliminate the major influences of regulation and management changes on canal discharge and to insure use of a homogeneous period of record. These years were selected because most modifications to the drainage basins and canal sys tems, particularly the construction of levees, canals, and controls that could affect flow in the canal systems, were completed and operational by the late 1960's.
PRESENTATION OF DISCHARGE DATA
Discharge records used in this report are stored in the U.S. Geological Survey's WATSTORE daily values files and are published annually in reports by the U.S. Geological Survey entitled "Water resources data for Florida, 1970, 1971, 1972, 1973, and 1974, Part I, surface-water records," (1972, 1973, 1974a, 1974b, 1975), and "Water resources data for Florida, 1975, 1976, 1977, 1978, 1979, and 1980, south Florida surface water" (1976, 1977, 1978, 1979, 1980, 1981). These reports give the location, drainage area, pe riod of record, notations of previously published records, type and history of gages, general remarks, average discharge, extremes of discharge, and comments for each canal site.
Table 1 lists the canals and structures for which discharge data are presented, their site numbers and downstream order num bers, and periods of record used. Figure 1 shows the location of the canal sites. Discussion of discharge data is by individual site and is in the order listed in table 1. Flow-duration and frequency curves and in-text tables of lowest mean consecutive-day discharges are based on periods of 4, 5, or 6 consecutive months when the greatest percentage of discharge occurred (referred to as the high-flow period). Table 2 presents the percentage of average annual discharge at each site by month for the 1970-80 water years or the period of record indicated in table 1.

Table 1. Canals and structures for which data are presented
Site No.
123
456789101112131415161718192021222324252627
Downstream order No.
022770000227900002281500
022821000228270002283200022850000228610002286300022863400228638002288600022888000228890002289040022890600228950002290700022907100229072502290769022910000229114302291270022913000229139302292900
Canal name and structure
St. Lucie Canal at lock near Stuart, S-80West Palm Beach Canal at S-155Hillsboro Canal at lock near Deerfield
Beach.Cypress Creek Canal at S-37AMiddle River Canal at S-36Plantation Road Canal at S-33North New River Canal at Sewell LockSouth New River Canal at S-13Snake Creek Canal at S-29Biscayne Canal at S-28Little River Canal at S-27Miami Canal at S-26Tamiami Canal, Monroe to CarnestownTamiami Canal, 40-Mile Bend to MonroeTamiami Canal, Levee 67A to 40-Mile BendTamiami Canal, Levee 30 to Levee 67ATamiami Canal near Coral GablesSnapper Creek Canal at S-22Black Creek Canal at S-21Mowry Canal at S-20FCanal 111 above S-18CBarren River CanalFahka Union CanalHenderson Creek CanalGolden Gate CanalCocohatchee River CanalCaloosahatchee River at S-79
Period record
10/69 -10/69 -10/69 -
10/69 -10/69 -10/69 -10/69 -10/69 -10/69 -10/69 -7/73 -10/69 -10/69 -10/69 -10/69 -10/69 -10/69 -10/69 -10/69 -3/70 -10/69 -10/69 -10/69 -10/69 -10/69 -10/69 -10/69 -
of used
9/8011/8011/80
11/8010/8011/8011/8011/8011/8010/8010/8011/8011/8011/8012/802/8112/8011/8011/8011/8010/8012/8011/8010/8010/8010/8010/80

Tabl
e 2. Monthly percentage of
av
erag
e an
nual
di
scha
rge
at 27
sites
for
water
year
s 19
70-8
0
Site
No. 1 2 3 4 5 6 7 8 9 10
1/11 12 13 14 15 16 17 ,18
2/19
3/20 21 22 23 24 25 26 27
Down
stre
am
orde
r No
.
022770
00
02279000
022815
00
02282100
02282700
022832
0002285000
0228
6100
022863
0002286340
02286380
02288600
02288800
022889
00
022890
40
022890
60
02289500
02290700
022907
1002
2907
2502290769
02291000
02291143
0229
1270
02291300
02291300
022929
00
Cana
l na
me and
stru
ctur
e
St.
Luci
e Ca
nal
at lo
ck near
Stuart,
S-80
.West Pa
lm Bea
ch Ca
nal
at S-
155
Hillsboro
Cana
l at
lo
ck near
Deer
fiel
d Be
ach.
Cypr
ess
Cree
k Ca
nal
at S-
37A
Middle Ri
ver
Cana
l at S-36
Plantation Road
Cana
l at
S-33
Nort
h New
Rive
r Ca
nal
at Se
well
Lock
.So
uth Ne
w Ri
ver
Cana
l at S-13
Snak
e Cr
eek
Canal
at S-29
Bisc
ayne
Canal
at S-28
Little R
iver Cana
l at S-27
Miami
Canal
at S-26
Tamiami
Canal, Monroe to
Carnestown.
Tamiami
Canal, 40
-Mil
e Bend to
Monr
oe.
Tami
ami
Canal, Le
vee
67A
to40
-Mil
e Bend.
Tamiami
Canal, Le
vee
30 to
Leve
e 67A.
Tamiami
Cana
l ne
ar Co
ral
Gabl
esSn
appe
r Creek
Canal
at S-22
Black
Cree
k Canal
at S-21
Mowr
y Canal
at S-20F
Cana
l 11
1 ab
ove
S-18
CBarron River Cana
lFahka
Union
Cana
lHe
nder
son
Creek
Canal
Golden Ga
te Ca
nal
Coco
hatc
hee
River
Cana
lCaloosahatchee Ri
ver
at S-79
Oct
14.8
12.7
11.3 9.94
8.93
7.68
9.59
8.20
11.3
11.9 9.67
12.0
15.1 6.6
16.9
15.3
10.2
17.5
12.3
13.9
13.1
14.6
15.0
10.2
11.1
11.8 9.41
Nov
14.2 8.69
10.6
10.2 8.29
10.3
12.4 9.63
8.59
7.34
7.57
10.4 5.23
7.24
15.9
13.2
10.1
10.8
10.5
11.0 5.42
9.90
5.28
3.77
5.43
4.17
5.14
Dec
1.28
5.26
5.83
6.94
4.21
7.68
7.05
7.94
5.50
2.99
6.29
7.08
3.26
3.81
10.5 8.18
9.86
4.21
5.13
7.17
1.33
7.20
2.87
3.98
4.30
2.66
4.22
Jan
7.83
5.93
6.59
3.90
3.25
5.20
4.29
6.97
4.95
3.16
5.83
7.34
1.92
2.41
6.56
6.62
8.23
2.12
2.99
4.29
0.38
6.04
2.93
3.55
3.44
2.37
8.25
Feb
10.2 3.40
4.11
2.59
4.04
5.43
4.01
6.90
3.48
1.87
4.83
5.93
1.65
2.15
7.10
5.53
6.47
2.02
1.97
4.06
1.23
5.70
2.61
3.49
3.35
2.52
8.40
Mar X
12.1 4.90
6.30
5.47
4.23
5.27
6.92
6.92
3.19
1.63
2.93
4.40
4.78
4.16
6.42
3.18
5.21
1.14
1.26
2.16
0.06
5.21
3.49
3.46
3.94
3.57
9.01
Apr
15.6 3.39
5.42
6.69
4.63
7.74
7.79
5.08
4.28
4.55
4.67
5.72
1.31
2.50
4.65
3.16
4.43
1.73
1.65
2.35
2.65
3.29
1.91
1.40
1.99
1.71
6.58
May
2.36
5.98
7.17
7.37
9.76
7.35
5.42
7.70
8.00
10.1
10.0 6.77
0.69
1.48
2.56
4.93
6.74
5.69
7.05
4.58
6.96
2.36
1.36
1.50
3.59
1.66
3.48
June 3.16
10.1 9.58
10.7
14.3
11.6
12.0
10.3
12.7
16.5
11.7 9.24
4.96
5.72
4.71
5.58
8.20
11.2
11.4
12.4
26.8 6.23
6.83
8.80
9.87
4.44
7.27
July 3.04
11.8 9.65
10.3
12.0 8.88
10.8 9.99
11.1
13.3
10.2 8.65
14.5
13.6 5.07
6.66
8.79
9.66
12.0
11.6 9.58
9.99
13.8
16.7
13.9
11.7
11.6
Aug
11.0
10.5 9.03
10.0
11.6 9.81
9.60
9.47
11.4
10.9
12.4 9.29
18.7
18.0 6.63
1.18
9.69
14.1
13.0
12.0
10.6
13.1
18.6
22.3
17.6
23.1
13.8
Sept 4.45
17.5
14.4
16.0
14.7
13.0
10.1
10.9
15.5
15.5
13.9
13.2
27.5
22.3
13.0
15.8
12.1
19.8
20.7
14.4
21.8
16.5
25.3
20.8
21.6
30.3
12.8
Mean
di
s
char
ge
(ftVs)
395
426
177
118 65.7
21.1
176
142
346 77.5
138
225
334
210
685 64.1
131
173
127
204 57.5
102
' 226 24.5
307 29.3
1,40
5
I/ Based
on 7 water-year pe
riod
(1
974-
80).
II Ba
sed
on 10
wat
er-y
ear
period (1
970-
77,
1979
-80)
and
October
thro
ugh De
cemb
er 19
77.
37 Ba
sed
on 10 w
ater
-yea
r pe
riod
(1971-80)
and
March
through
Sept
embe
r 1970.

Tables that show the number of no-flow or leakage-only days and lowest mean discharge for each consecutive day period were gen erated by WATSTORE daily values computer programs. Flow-duration curves and tables and the frequency curves were also derived from WATSTORE programs. Frequency curves were graphically fitted using the plotting position formula:
Recurrence interval = (_n + l)/m
where n_ is the number of years, and in is the order number. The order number is the ranking from the smallest to the largest of an array of values of lowest mean discharge for specified consecutive days during the period of consecutive months having the greatest percentage of annual discharge.
Frequency curves are based upon and represent only those con ditions present during the period of record used. These frequency curves are applicable for the existing patterns of climate, regu lation, and diversions. Extrapolation of flow characteristics for large recurrence intervals should consider the effects that changes in the canal systems, climate, or management practices could have on discharge.
St. Lucie Canal at Lock near Stuart, Site 1
Water in the St. Lucie Canal flows from the east edge of Lake Okeechobee northeasterly to the South Fork of the St. Lucie River (fig. 2). Flow is regulated by navigation locks and control struc tures at Lake Okeechobee (S-308) and near the coast at S-80.
The gaging station is at the upstream end of the Stuart lock chamber (S-80), 6.3 miles southwest of Stuart. Mean daily discharge from October 1969 to September 1980 was 395 ft^/s. The maximum and minimum daily discharges were 11,500 and 4 ft-Vs, respectively. The minimum discharge represents the estimated leakage through the control that occurred for 58 days during 1976, when the locks were closed for repairs. Estimated leakage and lockage discharges, as determined by the U.S. Army Corps of Engineers, vary during the year and range from 12 to 20 ft^/s. There was no well-defined pe riod of high discharge during water years 1970-80 (table 2). For this reason, frequency analyses are not presented for this site. Only the flow-duration analysis for the 1970-80 water years is pre sented. The following table lists the number of days in each water year when discharge consisted of only leakage or lockage:
Water yearsr ye< 1975"__________1970 1971 1972 1973 1974 1973 1976 1977 1978 1979 1980
Number of 12 149 281 365 342 365 365 343 288 192 175days dischargeconsisted ofleakage orlockage only.__________________________________________
Flow-duration data are shown in figure 3 and are listed in table 3.

80°
30'
80°
15'
27
° 15
' -
27°0
0 -
ST.
LUC
IE
CO
UN
TY
M
AR
TIN
C
OU
NT
Y
MA
RT
IN
CO
UN
TY
10 K
ILO
ME
TE
RS
EX
PL
AN
AT
ION
S-80
CANAL,CONTROL,AND NUMBER
A.
CANAL SITE AND NUMBER
__ _MARTIN COUNTY
PALM BEACH COUNTY
Figure 2. Location of ca
nal,
canal
site,
and
cont
rols in
Martin County

o owC/J
wPH
H W W
OM PQ & O
M
W
enM Q
100,000
10,000
000
100
10
J___L6 2 p o
i i i i i i r i m
WATER YEARS
o o o o o o o CJ rO ^- 10 <£) t*-
o00
o o> o>
ooO)
o> o>
PERCENTAGE OF TIME DISCHARGE WAS EQUALED OR EXCEEDED
Figure 3. Flow-duration curve for water years 1970-80, St. Lucie Canalat lock near Stuart, site 1.
10

Tabl
e 3.
Sun
nnar
y of
flow-duration
data at 27
canal
sites
for wa
ter
years
1970-80
[Discharge in
cu
bic
feet per
seco
nd]
Site
No. 1 2 3 4 5 6 7 8 9 10
1/11 12 13 14 15 16 17 18
1/19
3/20 21 22 23 24 25 26 27
Downstream
order
No.
02277000
02279000
02281500
02282100
0228
2700
02283200
0228
5000
02286100
0228
6300
02286340
02286380
02288600
02288800
02288900
02289040
02289060
02289500
02290700
02290710
02290725
02290769
02291000
02291143
02291270
0229
1300
02291393
0229
2900
Canal
name
an
d st
ruct
ure
St.
Lucie
Cana
l at lock ne
arStuart,
S-80.
West Palm Bea
ch Canal
at S-
155
Hillsboro
Cana
l at
lock ne
arDeerfield
Beach.
Cypress
Cree
k Ca
nal
at S-
37A
Middle River
Canal
at S-36
Plan
tati
on Road
Cana
l at
S-33
North Ne
w Ri
ver
Canal
at Sewell
Lock.
Sout
h New
Rive
r Ca
nal
at S-13
Snak
e Cr
eek
Canal
at S-29
Bisc
ayne
Ca
nal
at S-28
Litt
le R
iver
Canal
at S-27
Miami
Canal
at S-
26Tamiami
Canal, Monroe to
Car n
est own.
Tamiami
Canal, 40
-Mil
e Be
nd to
Monr
oe.
Tamiami
Canal, Le
vee
67A
to40
-Mil
e Be
nd.
Tami
ami
Canal, Le
vee
30 to L
evee
67A.
Tamiami
Canal
near Coral
Gabl
esSnapper
Cree
k Canal
at S-22
Black
Cree
k Ca
nal
at S-
21Mowry
Cana
l at
S-20F
Canal
111
abov
e S-18C
Barr
on Riv
er Canal
Fahka Union
Cana
lHe
nder
son
Cree
k Canal
Golden G
ate
Cana
lCo
coha
tche
e Ri
ver
Cana
lCa
loos
ahat
chee
River
at S-79
Mean
dis
charge
395
426
177
118 65.7
21.1
176
142
346 77.5
138
225
334
210
685 64.1
131
173
127
204 57.5
102
226 24.5
307 29.3
1,40
5
Disc
harg
e eq
uale
d or
ex
ceed
ed fo
r indicated
perc
enta
ge of
time
95 10 11 20
.0 .0 .015
.0 .1 .0 .0 .0 .0 .0
30
.0
6.5 .0 .0 .0 .0
5.5 .0 .6
4.6 .9
8.7
90 11 11 21
.0 .0 .016
.1 .1 .0 .12.0 .0 .1
41
.0
28.1 .0 .0 .0
8.9 .0
2.1
251.
69.3
75 13 58 22
.1 .0 .117 42
.4 .060 65 23 17 100 14 75.1 .1 .1 .0
23 23 5.1
77 4.3
12
70 17 90 23
.1 .0 .117 55
.4 .178 95 34 27 140 20 83.2 .1 .1 .0
35 42 6.4
97 5.2
26
50 19 240 66 12.1
16 90 110
240.1
130
210 97 74 380 42 120.3
79 160.1
97 110 12 200 10
300
25
28 640
230
160 80 33 210
220
570
120
200
340
510
300
940 81 190
310
190
340 12 170
330 32 440 29
1,500
10 680
1,100
460
390
240 51 380
310
920
260
260
490
1,000
680
1,900
170
250
530
330
500 48 210
700 65 760 85
5,20
0
I/ Ba
sed
on 7 water-year pe
riod
(1
974-
80).
II Ba
sed
on 10
water-year
peri
od (1
970-
77,
1979
-80)
an
d October
thro
ugh December 1977.
T/ Ba
sed
on 10
water-year
peri
od (1971-80)
and Ma
rch
through
September
1970.

West Palm Beach Canal at West Palm Beach, Site 2
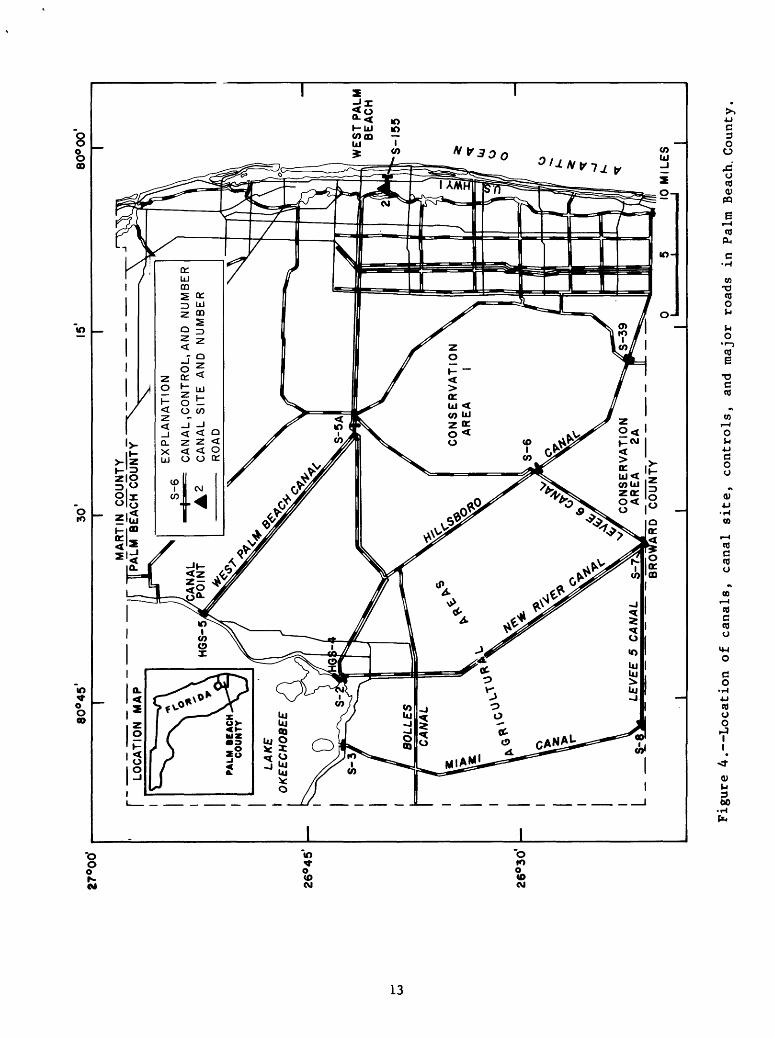
Water in the West Palm Beach Canal flows from Canal Point on the southeast edge of Lake Okeechobee to just south of West Palm Beach (fig. 4). Discharge and the water-surface elevation in the canal are regulated for irrigation and drainage purposes by opera tion of hurricane gate structure 5 (HGS-5) at Canal Point, S-5A control structure, and control structure and gate in the lock cham ber at West Palm Beach (control structure S-155). The lock chamber is not used for navigation.
The gaging station is on the upstream side of the lock and control structure (S-155), 0.6 mile upstream from the bridge on U.S. Highway 1 at West Palm Beach. Mean daily discharge from Oc tober 1969 to September 1980 was 426 ft^/s. The maximum and min imum daily discharges were 4,280 and 10 ftVs, respectively. The 10 ft^/s value is estimated leakage (U.S. Geological Survey Water Data Report FL-78-2A1). Table 2 shows the greatest percentage of discharge for the 1970-80 water years occurred during June through November. Mean daily discharge for June through November 1970-80 was 573 ft^/s. The maximum and minimum daily discharges for the high-flow period were 4,280 and 10 ft-Vs, respectively. The fol lowing table lists the number of days in each June through November period when discharge consisted of leakage only:
_____________June - November periods____________ ___________1970 1971 1972 1973 1974 1975 1976 1977 1978 1979 1980
Number of 006400 35 2000days dischargeconsisted ofleakage only._______________________________________________
Figure 5 shows flow-duration data for the 11 water years and the 11 June through November periods. Tables 3 and 4 list the flow-duration data for the water years and the June through No vember periods, respectively.
The following table shows the lowest mean discharge (in cubic feet per second) for selected periods of consecutive days in each June through November period for West Palm Beach Canal at West Palm Beach:
Number ofconsecutive ____________June - November periods_________________
days 1970 1971 1972 1973 1974 1975 1976 1977 1978 1979 1980
30 205 216 102 235 181 205 70 65 404 181 18660 404 343 197 495 455 270 240 125 556 187 21990 501 331 252 674 522 459 548 196 618 208 458120 559 360 303 695 594 538 693 459 632 581 461183____681 425 544 713 569 591 599 392 697 633 461
Figure 6 shows frequency curves based on the above data.
12
27°0
0'
26°4
5'
26
°30'
80°4
5'
I
30
'
MA
RT
IN
CO
UN
TY
_ _
P
ALM
B
EA
CH
CO
UN
TY
15'
80
° 00*
1
LOC
AT
ION
M
AP
EX
PL
AN
AT
ION
CA
NA
L,C
ON
TR
OL,
AN
D
NU
MB
ER
C
AN
AL
S
ITE
A
ND
N
UM
BE
R
RO
AD
PA
LM B
EA
CH
C
OU
NTY
LA
KE
OK
EE
CH
OB
EE
CO
NS
ER
VA
TIO
N
AR
EA
CO
NS
ER
VA
TIO
N
AR
EA
2
ALE
VE
E 5
C
AN
AL
BR
OW
AR
D
CO
UN
TY
WE
ST
PA
LM
BE
AC
H
S-1
55
Figure 4. Location of
ca
nals
, ca
nal
site
, controls,
and
major
road
s in
Pa
lm Beach. County.

DISCHARGE,IN CUBIC
FEET
PE
R SECOND
DISCHARGE,IN CUBIC
FEET PE
R SE
COND
^2
a. O
Q(D
0>
C
CO
**
< l-J
rr
<n
(D
*T$
O\
c-
C
*| 3
3
I
Cd
>-»
(D
rr
fo
(to
3* J
3 O
1
C
3*
O
(D
«
C
3
00
O
CO
3"
*<
rt
25
O(D
OC
<
1K
» JD
<
3
(Da*
co
(D vO '-J
rr
O
3-
I (D
OO
O
H
"-
3 a.
s: M
.fD
O
CO
0}
rt
rr
(D*0
afa
r-h
O
to
r>3
O
fa
3I 1
01 a>
0)
O
w s 2!
Hj w
O
O
O o
o1.
01
1.05
I.I
I
1.25
10 25 50
00
ii i
Min
i
I I
I 1
Mill
I
I I
I II
(to
3*
C(-
' 1
>-»a
o »
c50
OQ
v-n
(D
3*
O
25
I3*
O
''J
2 o
co
3
<M
- O
* I
rr
fD
O.
<D
^
C
to "
d
(to
H-
O
O
3
Ou
eo
o c
" J »
O
co
I oo
i-t,
o
o
n
&
co
rr
(D (U
)_.
O
vO=r
-j o
o
i&>
O
O3
O
Q)
!-
0» 3(b
a. 3* n>
^>
«
JXI o w S! i w o H M U
H
CO
O O w s CO
W 1 S w X o w g w
o
I I
IIMIII
I
111

Tabl
e 4. Summary of
flow-duration
data
at
selected sites
for
selected pe
riod
s of
consecutive
months du
ring
1970-81
wate
r years
Site
No. 2 3 4 6 7 8 9 12 18
Vl9 20 23 5 10 21
Downstream
orde
r No
.
0227
9000
02281500
0228
2100
02283200
0228
5000
02286100
0228
6300
0228
8600
0229
0700
0229
0710
02290725
02291143
0228
2700
02286340
0229
0769
[Discharge in
cu
bic
Canal
name an
d st
ruct
ure
West Palm B
each Canal
at S-155
Hill
sbor
o Ca
nal
at lo
ck ne
arDe
erfi
eld
Beac
h.Cy
pres
s Cree
k Canal
at S-37A
Plantation Road
Cana
l at
S-33
North Ne
w River
Canal
at Se
well
Lock
Sout
h Ne
w River
Canal
at S-13
Snake
Cree
k Canal
at S-
29Mi
ami
Cana
l at S-
26Snapper
Cree
k Ca
nal
at S-22
Black
Cree
k Ca
nal
at S-21
Mowr
y Canal
at S-
20F
Fahk
a Union
Canal
Midd
le Ri
ver
Canal
at S-36
Biscayne Ca
nal
at S-
28Canal
111
abov
e S-18C
feet per
Mean
di
sch
arge
573
215
148 24.8
207
164
468
264
281
203
304
403 94.8
119 97.7
seco
nd]
Disc
harg
e equaled
or exceeded fo
r indicated
percentage of
ti
me95 50 21.0 .0
16 17.2
2.9 .1 .1 .0
6.5 .0 .0 .0
90 June
98 22.0 .0
19 34.3
35.1 .2 .1
43 May .0 .0 .0
75
through
210 37.1 .1
71 80 180
150.3
85 160
140
thro
ugh
.1 .1 .0
7050
2510
Nove
mber
, 19
70-8
0
240 53.1 .1
92 93 220
170 81 100
180
170
Octo
ber
.1 .1 .1
430
140 66 21 160
150
410
260
270
160
290
300
800
290
230 39 250
230
730
380
440
260
430
570
1,200
480
410 54 390
320
1,000
510
630
420
580
940
, 1970-80
14 78.1
160
190 32
300
310
350
1102
2863
80
Litt
le Ri
ver
Canal
at S-27
185
28
May
thro
ugh Oc
tobe
r, 1974-80
62
120
140
180
240
300
J7 Ba
sed
on J
une
through November 19
70-7
7, 1979-80, an
d Oc
tobe
r th
roug
h No
vemb
er 1978.

Tabl
e 4. Summary of flow-duration
data
at selected si
tes
for
selected pe
riod
s of
cons
ecut
ive
months during 19
70-8
1 water
[Dis
char
ge in cu
bic
feet
pe
r
Site
No.
24
25
27 13
14
26 17
22
Downstream
orde
r No
.
02291270
0229
1300
02292900
02288800
02288900
02291393
02289500
02291000
Canal
name
an
d st
ruct
ure
Rend
er son
Cr
eek
Canal
Golden Gat
e Ca
nal
Calo
osah
atchee Ri
ver
at S-79
Tamiami
Canal, Mo
nroe
to Carnestown
Tamiami
Canal, 40-Mile
Bend
to
Monroe
Coco
hatc
hee
Rive
r Canal
Tami
ami
Canal
near Coral
Gabl
es
Barr
en Riv
er Ca
nal
Mean
di
s
char
ge
46.3
539
1,73
0
739
429 67 156
139
year
s- Continued
second] Disc
harg
e equaled
or ex
ceed
ed fo
r indicated
percentage of
time
95 3.8
110 9.
8
72
55 6.4
58
27
90
June
7 16
0 13
July 120 76 9
July 73
43
75
thro
ugh
.8
18
290
270
thro
ugh
300
170
.8
21
thro
ugh
98
85
7050
Octo
ber,
21
330
340
38
470
780
Octo
ber
,
370
200 24
650
340 40
Dece
mber
110 98
150
140
25
1970
-80
64
690
1 2,000
5
1970
-80
1,100
1 65
0 91
, 19
70-8
0
210
190
10 95,0
00
,000
,500
950
160
260
240
15
02289040
Tamiami
Canal, Levee
67A
to 40
-Mil
eBend.
961
16
02289060
Tamiami
Canal, Le
vee
30 to L
evee
67A
69.4
September
through
Dece
mber
, 19
70-8
0
420
462
620
660
860
1,100
1,60
0
September
thro
ugh
Febr
uary
, 19
70-8
0
7.5
13
28
33
51
84
150

Hillsboro Canal near Deerfield Beach, Site 3
The Hillsboro Canal extends 52 miles south and east from the southeast tip of Lake Okeechobee to the Intracoastal Waterway. At its upper end, it is joined in a common pool at Lake Okeechobee by the North New River Canal. Discharge into and out of Lake Okee chobee is regulated by hurricane gate structure 4 (HGS-4) and pump station 2 (S-2) (fig. 4). Pump station 6 (S-6) downstream from the lake maintains water levels in agricultural areas southeast of the lake. Water removed from the canal by S-6 is transferred into Con servation Area 1. The canal also collects and distributes water between Conservation Areas 1 and 2A. Discharge through the canal is also regulated at control structure 39 (S-39) which releases wa ter into Broward County, 10 miles west of Deerfield Beach (fig. 7). Water then flows eastward to a lock and dam near Deerfield Beach, where discharge to the Intracoastal Waterway is regulated by a con trol structure and gate in the lock chamber. The lock chamber is not used for navigation.
The gaging station is at the upstream end of the lock chamber, 2 miles west of Deerfield Beach and 4.4 miles east of State Road 7. Mean daily discharge from October 1969 to September 1980 was 177 ft^/s. The maximum and minimum daily discharges were 3,030 and 20 ft-Vs, respectively. The 20 ft-Vs is estimated leakage through the control (U.S. Geological Survey Water Data Report FL-78-2A1). Table 2 shows the greatest percentage of discharge for the 1970-80 water years occurred during June through November. Mean daily dis charge for June through November 1970-80 was 215 ft^/s. The max imum and minimum daily discharges for the high-flow period were 2,620 and 20 ft 3 /s, respectively. The following table lists the number of days in each June through November period when discharge consisted of leakage only:
___ June "November periods 1970 1971 1972 1973 1974 1975 1976 1977 1978 1979 1980
Number of 34 days discharge consisted of leakage only.
87 20 13 15 40 22 36 13 38 28
Figure 8 shows flow-duration data for the 11 water years and the 11 June through November periods. Tables 3 and 4 list the flow-duration data for the water years and June through November periods, respectively.
The following table shows the lowest mean discharge (in cubic feet per second) for selected periods of consecutive days in each June through November period for Hillsboro Canal near Deerfield Beach:
Number ofconsecutive ____ __ __
days 1970 19 7 F Wtt WT3June - November periods___
1975" 1976 1978 1979 1980
306090120183
25154194177252
22233470
125
3884123144214
119188307375353
92167216202248
2454122213241
7986158195190
3047140223204
93118161176210
305460
137182
7079
123126141
Figure 9 shows frequency curves based on the above data.
17

25 20 15 10 80*032624'
20
15
10
26°00'
25°55
EXPLANATION
CANAL,CONTROL,AND NUMBER
CANAL SITE AND NUMBER
Figure 7. Location of canals, canal sites, controls, and major roads in Broward County.
18

lopooo owCO
H W W
uHPQ O
MW*
O.
O CO
1000
100
10
~nii i i iWATER YEARS
i JUNE NOVEMBER
WATER YEARS
I =
JUNE NOVEMBER JUNE NOVEMBER
WATER YEARS
i i i i i i i io o o o o o o o
CM K) 5J- lf>o to
oCO
o 0>00
PERCENTAGE OF TIME DISCHARGE WAS EQUALED OR EXCEEDED
Figure 8. Flow-duration curves for water years 1970-80 and the June through November periods 1970-80, Hillsboro Canal near Deerfield Beach, site 3.
I 000
wCO
PM
H W
O H PQ £> O
S3 M
*v
W O
oCOH P
100
10
60 DAY
30 DAY
I I I_ 10 o o
mOJ
IT) OJ
OIT)
Oo
RECURRENCE INTERVAL.IN YEARS
Figure 9. Frequency curves for the indicated number of consecutive days, June through November 1970-80, Hillsboro Canal at Deerfield Beach, site 3.
19

Cypress Creek Canal at S-37A near Pompano Beach, Site 4
The Cypress Creek Canal is connected to the Pompano Canal, 3 miles west of Pompano Beach (fig. 7). At this point, flow either continues eastward through the Pompano Canal or is diverted south eastward in the Cypress Creek Canal. Discharge in the Cypress Creek Canal is regulated by operation of the salinity-control structure 37A (S-37A) and control structure 37B (S-37B), 2.8 miles upstream of S-37A. Discharge into the Cypress Creek Canal is also affected by operation of control structure 38 (S-38) on the Pompano Canal at Levee 36 (fig. 7). Flow at S-37A is affected by tides and occa sionally reverses.
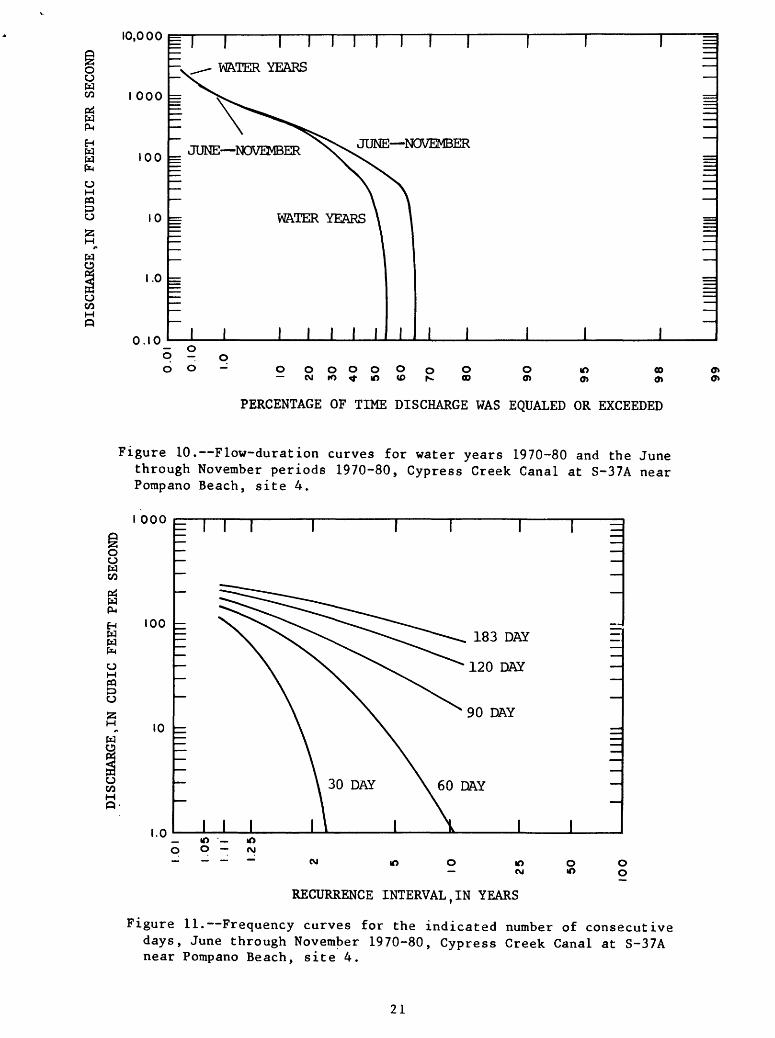
The gaging station is on the upstream side of the bridge on State Road 811, 300 feet upstream from S-37A and 3 miles southwest of Pompano Beach. Mean daily discharge from October 1969 to Sep tember 1980 was 118 ftVs. The maximum and minimum daily dis charges were 2,950 and 0.0 ftVs, respectively. Table 2 shows the greatest percentage of discharge for the 1970-80 water years oc curred during June through November. Mean daily discharge for June through November 1970-80 was 148 ft-Vs. The maximum and minimum daily discharges for the high-flow period were 1,910 and 0.0 ft-Vs, respectively. The following table lists the number of no-flow days in each June through November period:
June - November periods _1970 1971 1972 1973 1974 1975 1976 1977 1978 1979 1980
Number of 20 no-flow days.
91 1 31 26 73 99 111 53 97 85
Figure 10 shows flow-duration data for the 11 water years and the 11 June through November periods. Tables 3 and 4 list the flow-duration data for the water years and June through November periods, respectively.
The following table shows the lowest mean discharge (in cubic feet per second) for selected periods of consecutive days in each June through November period for Cypress Creek Canal at S-37A near Pompano Beach:
Number of consecutive June - November periods
days
306090
120183
1970
6.5556768
214
1971
005
3657
1972
113118122129158
1973
3592
128148136
1974
4995
109104130
1975
02165
116136
1976
01299
167160
1977
018
102153151
1978
114148189230207
1979
0151379
137
1980
6.770
115153142
Figure 11 shows frequency curves based on the above data.
20
o owCO
w
HWw
oM
53 M
COM
10,000
I 000
100
10
1.0
0.10
JUNE NOVEMBER
I___I
o-o oo- o o o o o o CM to 4- in to o
ooo en
IDen
oo en
en en
PERCENTAGE OF TIME DISCHARGE WAS EQUALED OR EXCEEDED
Figure 10. Flow-duration curves for water years 1970-80 and the June through November periods 1970-80, Cypress Creek Canal at S-37A near Porapano Beach, site 4.
I 000
o oW CO
fe
H W W fe
OMPQS53 M
**
W
O CO
100
10
1.0
= 111 I
183 DAY
120 DAY
90 DAY
DAY
I I I IDo o rsi
(M ID (VI
O O
RECURRENCE INTERVAL.IN YEARS
Figure 11. Frequency curves for the indicated number of consecutive days, June through November 1970-80, Cypress Creek Canal at S-37A near Pompano Beach, site 4.
21
Middle River Canal at S-36 near Fort Lauderdale, Site 5
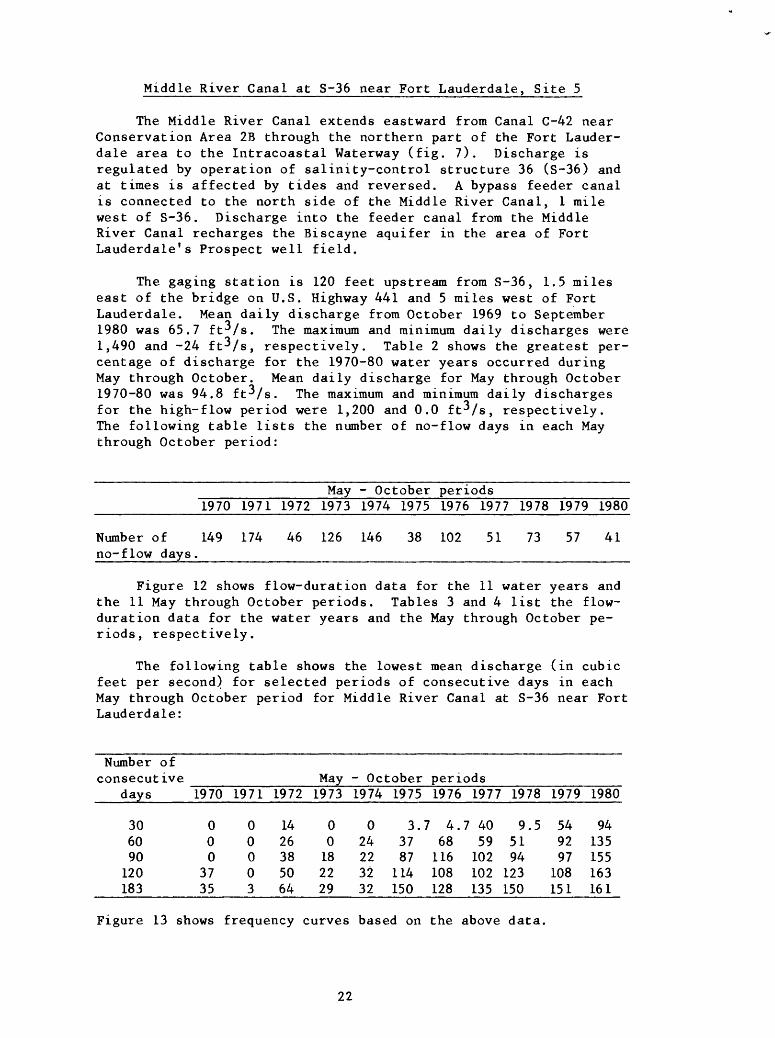
The Middle River Canal extends eastward from Canal C-42 near Conservation Area 2B through the northern part of the Fort Lauder dale area to the Intracoastal Waterway (fig. 7). Discharge is regulated by operation of salinity-control structure 36 (S-36) and at times is affected by tides and reversed. A bypass feeder canal is connected to the north side of the Middle River Canal, 1 mile west of S-36. Discharge into the feeder canal from the Middle River Canal recharges the Biscayne aquifer in the area of Fort Lauderdale 1 s Prospect well field.
The gaging station is 120 feet upstream from S-36, 1.5 miles east of the bridge on U.S. Highway 441 and 5 miles west of Fort Lauderdale. Mean daily discharge from October 1969 to September 1980 was 65.7 ft Vs. The maximum and minimum daily discharges were 1,490 and -24 ft-Vs, respectively. Table 2 shows the greatest per centage of discharge for the 1970-80 water years occurred during May through October. Mean daily discharge for May through October 1970-80 was 94.8 ft-Vs. The maximum and minimum daily discharges for the high-flow period were 1,200 and 0.0 ft-Vs, respectively. The following table lists the number of no-flow days in each May through October period:
_____________May - October periods________________1970 1971 1972 1973 1974 1975 1976 1977 1978 1979 1980
Number of 149 174 no-flow days._________
46 126 146 38 102 51 73 57 41
Figure 12 shows flow-duration data for the 11 water years and the 11 May through October periods. Tables 3 and 4 list the flow- duration data for the water years and the May through October pe riods, respectively.
The following table shows the lowest mean discharge (in cubic feet per second) for selected periods of consecutive days in each May through October period for Middle River Canal at S-36 near Fort Lauderdale:
Number of consecutive May - October periods
days
306090
120183
1970
000
3735
1971
00003
1972
1426385064
1973
00182229
1974
024223232
1975
3.3787
114150
1976
7 4.68116108128
1977
7 4059102102135
1978
9.55194
123150
1979
549297
108151
1980
94135155163161
Figure 13 shows frequency curves based on the above data.
22

o owCO
wPM
awoH PQ
w o.
COH Q
10,000
I 000
00
10
.0
CO
w p-lEH W W
oH PQ
B25HW~
COH Q
0.10
WATER YEARS
MAY OCTOBER
= MAY OCTOBER
WATER YEARS
Oq - o oo- o o o o o o o
ej ro «* in to r»o oo
oo o>
PERCENTAGE OF TIME DISCHARGE WAS EQUALED OR EXCEEDED
Figure 12. Flow-duration curves for water years 1970-80 and the May through October periods 1970-80, Middle River Canal at S-36 near Fort Lauderdale, site 5.
000
100
10
DAY
183 DAY
120 DAY
O O r\jm o
mo o
RECURRENCE INTERVAL,IN YEARS
Figure 13. Frequency curves for the indicated number of consecutive days, May through October 1970-80, Middle River Canal at S-36 near Fort Lauderdale, site 5.
23

Plantation Road Canal at S-33 near Fort Lauderdale, Site 6
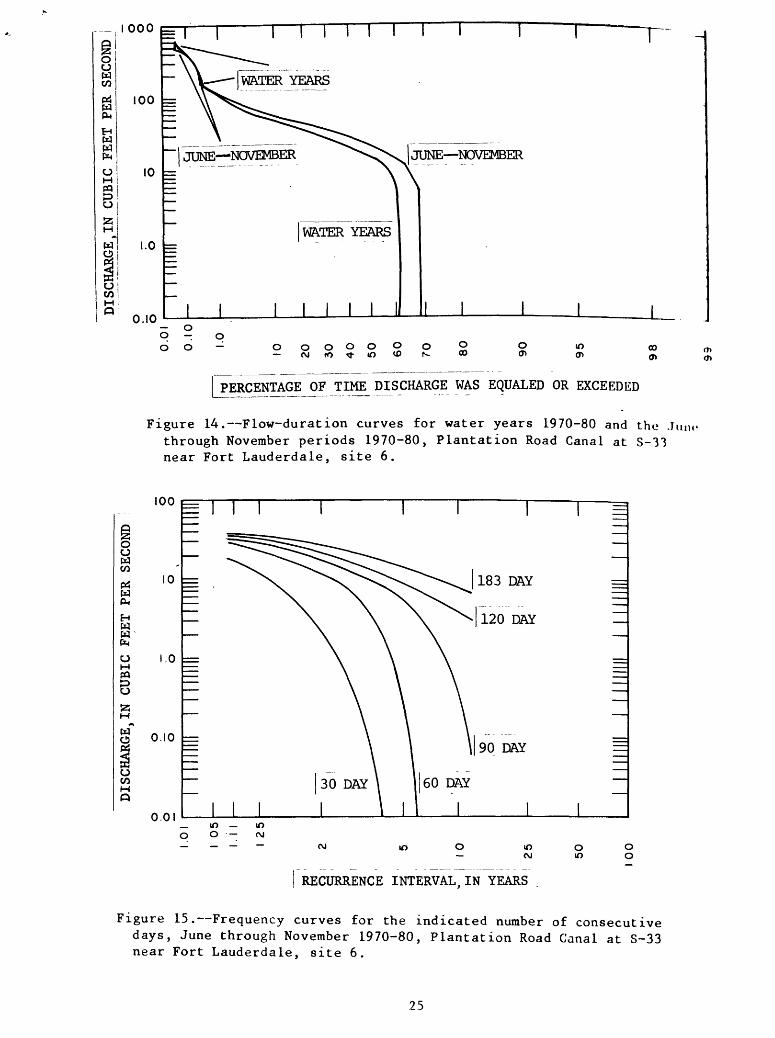
The Plantation Road Canal (fig. 7) is joined to the North Fork of the New River approximately 4 miles downstream of salinity- control structure 33 (S-33). It extends westward to the Holloway Canal which runs north and south about 1 mile west of the Florida Turnpike. Discharge in the Plantation Road Canal is regulated by S-33 and at times is affected by tides and reversed. Seaward flow in Plantation Road Canal at S-33 is generally small because of its relatively small drainage area (Sherwood and others, 1973, p. 24).
The gaging station is 130 feet upstream from S-33, 0.5 mile east of the bridge on U.S. Highway 441 and 4 miles west of Fort Lauderdale. Mean, daily discharge from October 1969 to September 1980 was 21.1 ft^/s. The maximum and minimum daily discharges were 614 and 0.0 ft-Vs, respectively. Table 2 shows the greatest per centage of discharge for the 1970-80 water years occurred during June through November. Mean daily discharge for June through No vember 1970-80 was 24.8 ft^/s. The maximum and minimum daily dis-«* J
charges for the high-flow period were 604 and 0.0 ftj /s. The fol lowing table lists the number of no-flow days in each June through November period:
____________June - November periods________________1970 1971 1972 1973 1974 1975 1976 1977 1978 1979 1980
Number of 61 148 no-flow days.________
29 19 14 70 32 49 24 77 92
Figure 14 shows flow-duration data for the 11 water years and the 11 June through November periods. Tables 3 and 4 list the flow-duration data for the water years and the June through Novem ber periods, respectively.
The following table shows the lowest mean discharge (in cubic feet per second) for selected periods of consecutive days in each June through November period for Plantation Road Canal at S-33 near Fort Lauderdale:
Number of consecutive June - November periods
days
306090
120183
1970
007.99.4
17
1971
000.063.06.5
1972
2.614272933
1973
1426333435
1974
1828293031
1975
09
162024
1976
4.319283637
1977
2.39.1
212029
1978
1116192123
1979
0.1311111825
1980
0.962.64.16.6
12
Figure 15 shows frequency curves based on the above data.
24
.._, 1000 t=
oow
w w
oM PQ t=> O
S3 M
W ,Q I
100 h=
0.10
I PERCENTAGE OF TIME_ DISCHARGE WAS EQUALED OR EXCEEDED
Figure 14. Flow-duration curves for water years 1970-80 and the Jmn through November periods 1970-80, Plantation Road Canal at S-33 near Fort Lauderdale, site 6.
100
O ow
WPL.
Hw
OM PQ
H
10
i.o
o.io
o.oi _ to o o
toCO
toCJ
o too o
RECURRENCE INTERVAL.IN YEARS
Figure 15. Frequency curves for the indicated number of consecutive days, June through November 1970-80, Plantation Road Canal at S-33 near Fort Lauderdale, site 6.
25

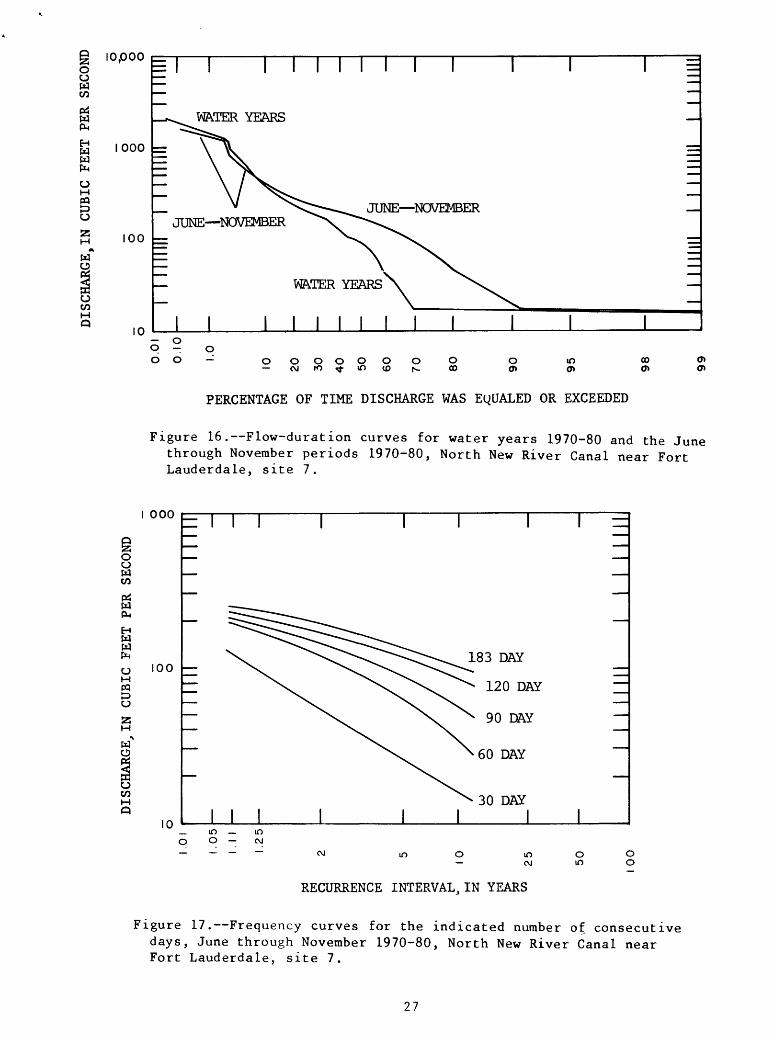
North New River Canal near Fort Lauderdale, Site 7
The North New River Canal extends 60 miles from the lower east ern tip of Lake Okeechobee south and east to New River, and thence to the ocean (figs. 4 and 7). Its headwaters near Lake Okeechobee join those of the Hillsboro Canal. Like the Hillsboro Canal, dis charge between the lake and the canal is regulated by hurricane gate structure 4 (HGS-4) and pump station 2 (S-2). At the Palm Beach- Broward County line, about 30 miles downstream from Lake Okeechobee, the North New River Canal is joined by Levee 5 and 6 canals (fig. 4). At this point, discharge is regulated by pump station 7 (S-7) and gates at S-7 that remove floodwaters from agricultural areas to the north into Conservation Area 2A. Inside Conservation Area 2A, the North New River Canal is divided by levees into an upper and lower segment. The lower canal segment collects and distributes water between Conservation Areas 2A and 3A. From the southern edge of Conservation Area 2B, flow in the North New River Canal is southeastward to the control at Sewell Lock. In this reach, the discharge is augmented by seepage and inflow from several lateral canals. Flow at times is affected by tides.
The gaging station is 20 feet upstream from the salinity- control structure at Sewell Lock, 6 miles southwest of Fort Lauder dale. Mean daily discharge from October 1969 to September 1980 was 176 ft^/s. The maximum and minimum daily discharges were 2,160 and 15 ft^/s, respectively. The 15 ft^/s value is estimated leakage through the control (U.S. Geological Survey Water Data Report FL-78-2A1, 1979). Table 2 shows the greatest percentage of dis charge for the 1970-80 water years occurred during June through November. Mean daily discharge for June through November 1970-80 was 207 ft^/s. The maximum and minimum daily discharges for the high-flow period were 1,700 and 15 ft^/s, respectively. The fol lowing table lists the number of days in each June through November period when flow consisted of leakage only:
June - November periods1970 1971 1972 1973 1974 1975 1976 1977 1978^19 7T 19FOJKW.
Number of 4 days discharge consisted of leakage only.
48 20 23 30 13 11 16
Figure 16 shows the flow-duration data for the 11 water years and the 11 June through November periods. Tables 3 and 4 list the flow-duration data for the water years and the June through Novem ber periods, respectively.
The following table shows the lowest mean discharge (in cubic feet per second) for selected periods of consecutive days in each June through November period for North New River Canal near Fort Lauderdale:
Number ofconsecutive _________________________________________
days 1970 1971 1972 1973 1974 1975 1976 1977 1978 1979 198IJJune - November periods
306090
120183
95197217227540
2527373991
55112149166205
356193
134134
34152141155161
15100139186182
3254
102150149
3872
133202224
137156181184203
68119118145166
146189200227217
Figure 17 shows frequency curves based on the above data.
26
10,000o ow
w
H W W
oH PQ
O
53 HW*
oW M Q
1000
100
10
WATER YEARS
JUNE NOVEMBERJUNE NOVEMBER
I I
q - q oo - o o o o o o o
<M ro ^- in to h_O 00
O O)
in O)
CO O)
PERCENTAGE OF TIME DISCHARGE WAS EQUALED OR EXCEEDED
Figure 16. Flow-duration curves for water years 1970-80 and the June through November periods 1970-80, North New River Canal near Fort Lauderdale, site 7.
000
o o w wtfH PH
H W H Fn
CJM PQ &CJ
23 Mw" Q
wH Q
100
10
n I I T I =
_ IOo o
o o
RECURRENCE INTERVAL, IN YEARS
Figure 17. Frequency curves for the indicated number of consecutive days, June through November 1970-80, North New River Canal near Fort Lauderdale, site 7.
27

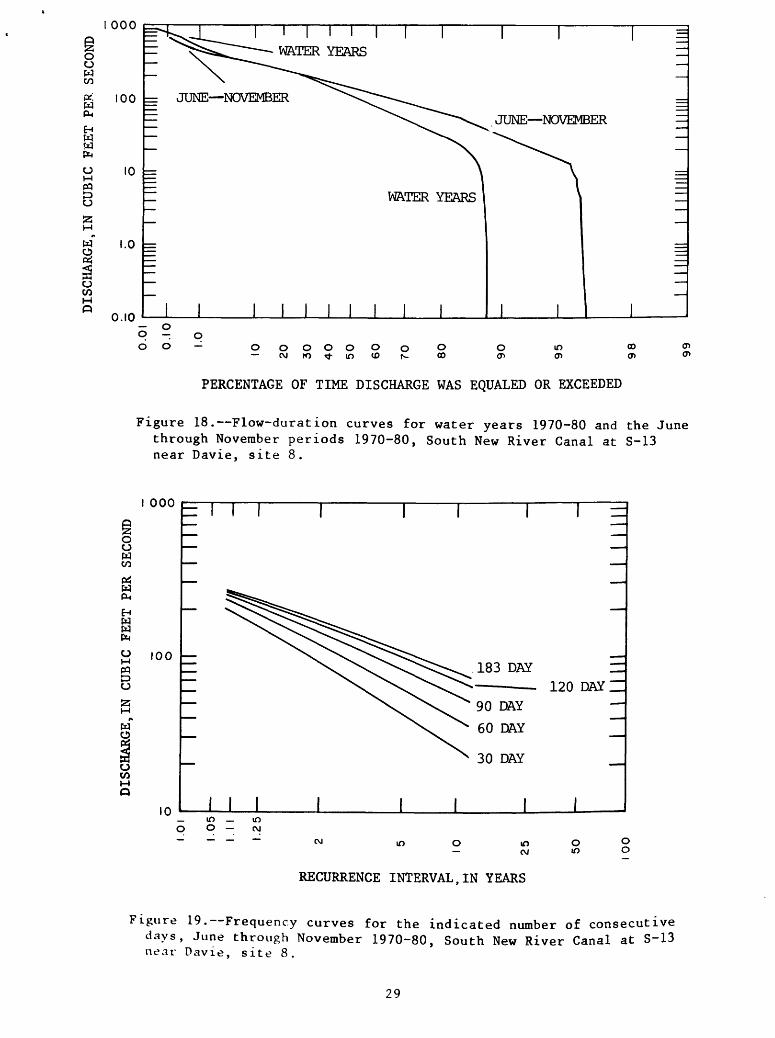
South New River Canal at S-13 near Davie, Site 8
The South New River Canal originates in Conservation Area 3A in western Broward County and flows eastward for 23 miles to the junction with the Dania Cutoff Canal and the South Fork New River (fig. 7). The South Fork New River flows northeastward joining the New River system, whereas the Dania Cutoff Canal continues eastward to the Intracoastal Waterway. Between Conservation Area 3A and the Florida Turnpike, many drainage and irrigation canals enter the South New River Canal from both sides.
The amount and direction of flow in the South New River Canal are regulated by three control structures (fig. 7). Backpumping station 9 (S-9), 15 miles west of U.S. Highway 441, is the only pumping station on the southeast boundary of the conservation areas. Station S-9 re moves floodwaters from the canal into Conservation Area 3A for use dur ing dry periods (Sherwood and others, 1973, p. 27). Control structure 13A (S-13A) regulates flow in the central reach of the canal. Pumping station 13 (S-13) and the gate at S-13 assist gravity flow by pumping seaward excess water during flood periods. During dry periods, S-13 is used to regulate discharge from the South New River Canal. Flow is af fected by tides and sometimes reversed.
The gaging station is 150 feet upstream from S-13, 300 feet west of U.S. Highway 441, and 1.5 miles east of Davie. Mean daily discharge from October 1969 to September 1980 was 142 ft^/s. The maximum and minimum daily discharges were 987 and -111 ft^/s, respectively. The -111 ft^/s discharge represents reverse flow. Table 2 shows the great est percentage of discharge for the 1970-80 water years occurred during June through November. Mean daily discharge for June through November 1970-80 was 164 ft-^/s. The maximum and minimum daily discharges for the high-flow period were 871 and -111 ft^/s, respectively. The fol- following table lists the number of backpumping or no-flow days in each June through November period:
June - November periodsT£ W>_____________1970 1971 1972 19/3 1974 1975 1976 1977 1978 1979 1980
Number of back- 0 17 4 16 9239 102 pumping, no- flow, or reverse
flow days.__________________________________________________
Figure 18 shows flow-duration data for the 11 water years and the 11 June through November periods. Tables 3 and 4 list the flow-duration data for the water years and the June through November periods, respec tively .
The following table shows the lowest mean discharge (in cubic feet per second) for selected periods of consecutive days in each June through November period for South New River Canal at S-13 near Davie:
Number ofconsecutive _____________June-November periods______________
days 1970 1971 1972 1973 1974 1975 1976 1977 1978 1979 1980
30 151 24 72 67 64 78 83 23 114 145 23960 173 31 100 87 82 93 158 50 132 160 25690 183 42 121 108 97 110 185 125 151 174 268
120 189 48 130 116 109 113 197 134 162 180 269183____229 63 152 121 120 120 211 143 167 198 272
Figure 19 shows frequency curves based on the above data.
28
o cjwCO
w
H W
Pn
CJM M
CJ
S3
aCJ CO H P
I 000
100
10
1.0
0.10
I i i i rWATER YEARS
JUNE NOVEMBER
WATER YEARS
5 2 q o o o o o o o o cj K> ^- m <o ^ o00
off>oo
PERCENTAGE OF TIME DISCHARGE WAS EQUALED OR EXCEEDED
Figure 18. Flow-duration curves for water years 1970-80 and the June through November periods 1970-80, South New River Canal at S-13 near Davie, site 8.
000
oCJH CO
CJM
cj!3
CJ CO
100
10
183 DAY120 DAYH
90 DAY
60 DAY
30 DAY
O -
inCJ
O m
O o
RECURRENCE INTERVAL,IN YEARS
Figure 19. Frequency curves for the indicated number of consecutive days, June through November 1970-80, South New River Canal at S-13 near Davie, site 8.
29
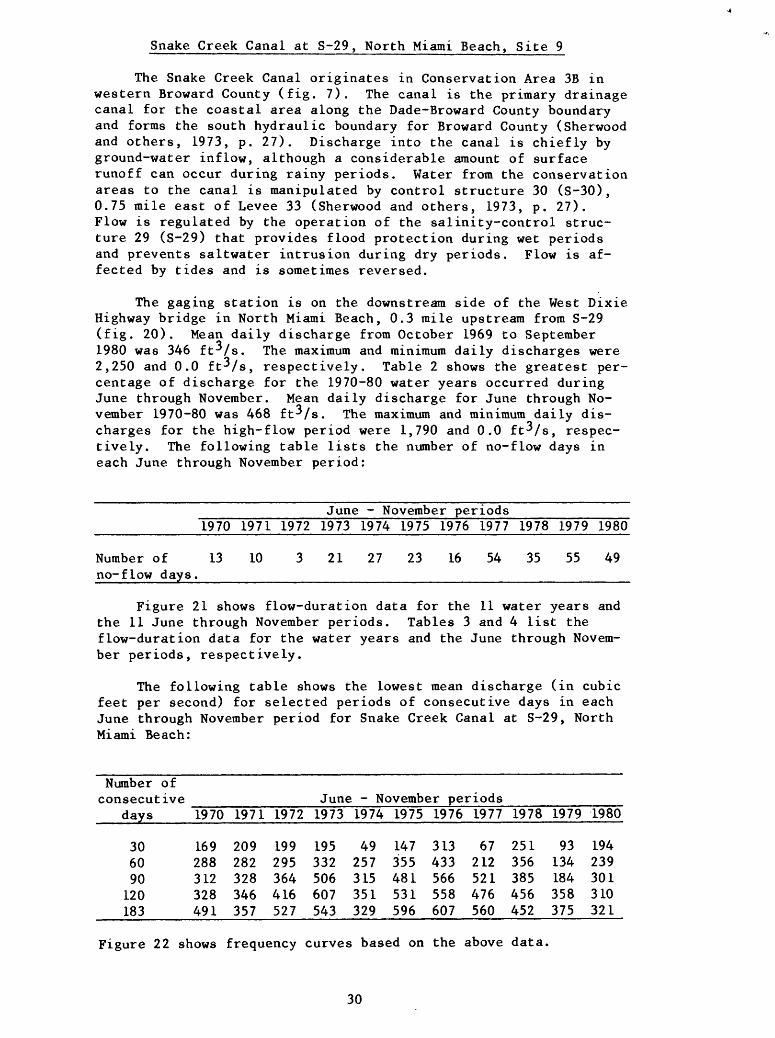
Snake Creek Canal at S-29, North Miami Beach, Site 9
The Snake Creek Canal originates in Conservation Area 3B in western Broward County (fig. 7). The canal is the primary drainage canal for the coastal area along the Dade-Broward County boundary and forms the south hydraulic boundary for Broward County (Sherwood and others, 1973, p. 27). Discharge into the canal is chiefly by ground-water inflow, although a considerable amount of surface runoff can occur during rainy periods. Water from the conservation areas to the canal is manipulated by control structure 30 (S-30), 0.75 mile east of Levee 33 (Sherwood and others, 1973, p. 27). Flow is regulated by the operation of the salinity-control struc ture 29 (S-29) that provides flood protection during wet periods and prevents saltwater intrusion during dry periods. Flow is af fected by tides and is sometimes reversed.
The gaging station is on the downstream side of the West Dixie Highway bridge in North Miami Beach, 0.3 mile upstream from S-29 (fig. 20). Mean daily discharge from October 1969 to September 1980 was 346 ft-Vs. The maximum and minimum daily discharges were 2,250 and 0.0 ft-Vs, respectively. Table 2 shows the greatest per centage of discharge for the 1970-80 water years occurred during June through November. Mean daily discharge for June through No vember 1970-80 was 468 ft-Vs. The maximum and minimum daily dis charges for the high-flow period were 1,790 and 0.0 ft-Vs, respec tively. The following table lists the number of no-flow days in each June through November period:
_____________June - November periods____________ __________1970 1971 1972 1973 1974 1975 1976 1977 1978 1979 1980
Number of 13 10 3 21 27 23 16 54 35 55 49
no-flow days.___________________________________________
Figure 21 shows flow-duration data for the 11 water years and the 11 June through November periods. Tables 3 and 4 list the flow-duration data for the water years and the June through Novem ber periods, respectively.
The following table shows the lowest mean discharge (in cubic feet per second) for selected periods of consecutive days in each June through November period for Snake Creek Canal at S-29, North Miami Beach:
Number of consecutive ____________June - November periods_____________
days 1970 1971 1972 1973 1974 1975 1976 1977 1978 1979 1980
30 169 209 199 195 49 147 313 67 251 93 19460 288 282 295 332 257 355 433 212 356 134 23990 312 328 364 506 315 481 566 521 385 184 301120 328 346 416 607 351 531 558 476 456 358 310183____491 357 527 543 329 596 607 560 452 375 321
Figure 22 shows frequency curves based on the above data.
30

80° 20'
26°55'
ROWARB COUNTY DM)E COUNTY
North M\a m i Beac n\ 9
BISCAYNE I CANAL
LITTLE RIVER CANAL
HIALEAH
1 MIAMI INW 36th Street <
MiamilSpri ngs
MIAMI SPR|NGS- HIALEAH WELLFIEL
Coral Gables
ALEXANDERORR
WELLFIELO
LOCATION MAP
cr^ ^i
2 3 4MILESi__i___i
,S-22EXPLANATION
Canal, Control, and Number Canal Site and Number
Figure 20. Location of canals, canal sites, controls, and major roadsin northeast Bade County.
31

oCJwGO
w
Hw w
Mw~O
00M O
iopoo
1000
100
10
q - q oo-
JUNE NOVEMBER
WATER YEARS
o o o o o o CM rO < in <O
ON-
o oo m oo o>
PERCENTAGE OF TIME DISCHARGE WAS EQUALED OR EXCEEDED
Figure 21. Flow-duration curves for water years 1970-80 and the June through November periods 1970-80, Snake Creek Canal at S-29, North Miami Beach, site 9.
oCJM oo
HM w
CJ
S3M
**
o
00 H
I 000
100
10
= 11 I
_ 10 o o -
in PJ
183 DAY
I =
120 DAY
30 DAY
in CM
O in
O O
RECURRENCE INTERVAL, IN YEARS
Figure 22. Frequency curves for the indicated number of consecutive days, June through November 1970-80, Snake Creek Canal at S-29, North Miami Beach, site 9.
32

Biscayne Canal at S-28 near Miami, Site 10
The Biscayne Canal extends east about 10 miles from State Road 826 and then southeast to upper Biscayne Bay in north Dade County (fig. 20). Discharge is regulated by the operation of salinity-control structure 28 (S-28), 1.2 miles upstream of the canal's mouth. Flow is at times affected by tides and is occa sionally reversed.
The gaging station is 100 feet upstream from S-28, 0.7 mile upstream from U.S. Highway 1, and 1.7 miles north of Miami. Mean daily discharge from October 1969 to September 1980 was 77.5 ft^/s The maximum and minimum daily discharges were 1,260 and 0.0 ft^/s, respectively. Table 2 shows the greatest percentage of discharge for the 1970-80 water years occurred during May through October. Mean daily discharge for May through October 1970-80 was 119 ft^/s the maximum and minimum daily discharges for the high-flow period were 956 and 0.0 ft^/s, respectively. The following table lists the number of no-flow days in each May through October period:
_____________May - October periods___________________1970 1971 1972 1973 1974 1975 1976 1977 1978 1979 1980
Number of 93 no-flow days.
98 63 40 57 70 34 75 83 26 69
Figures 23 shows flow-duration data for the 11 water years and the 11 May through October periods. Tables 3 and 4 list the flow- duration data for the water years and the May through October peri ods, respectively.
The following table shows the lowest mean discharge (in cubic feet per second) for selected periods of consecutive days in each May through October period for Biscayne Canal at S-28 near Miami:
Number of consecutive May through October periods
days
306090
120183
1970
5.514315185
1971
437564784
1972
426067
107135
1973
05297
113130
1974
246496
113123
1975
2036468385
1976
53132154191178
1977
7.58
124114157
1978
1 3862728898
1979
405173
106148
1980
1224618177
Figure 24 shows frequency curves based on the above data.
33
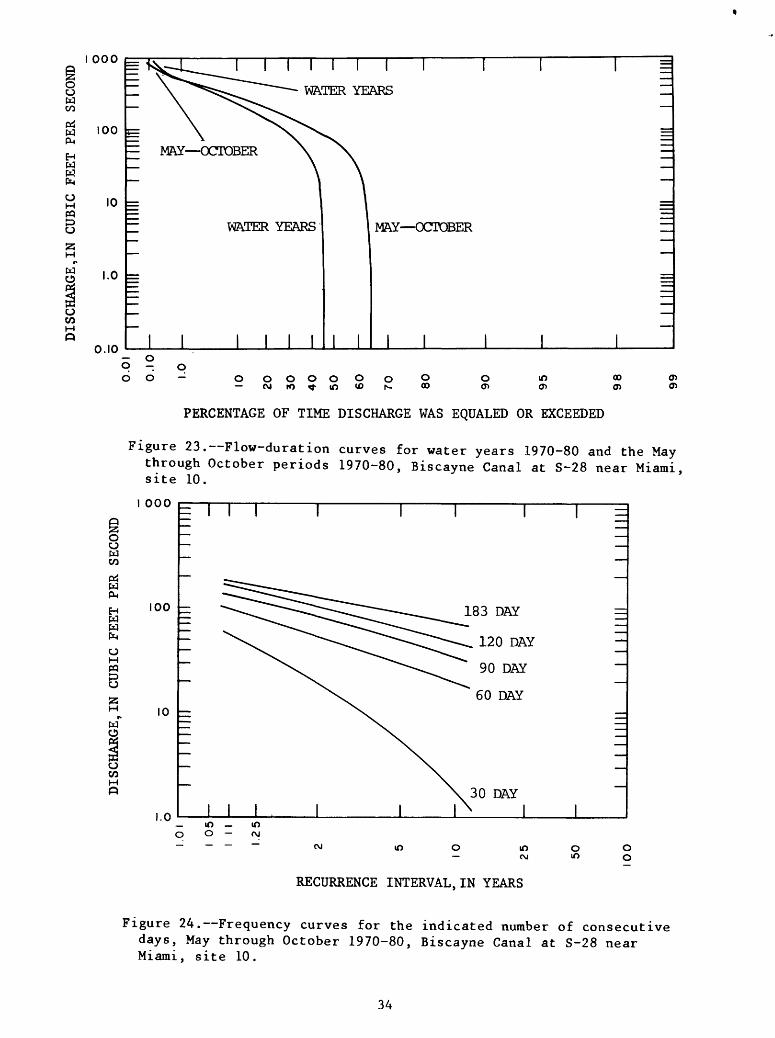
wCO
Pi w
H W W
uM PQ
Mt*
W
oCO
I 000
100
10
1.0
0.10
I I I I I TWATER YEARS
MAY OCTOBER
WATER YEARS MAY OCTOBER
I___I
9-0 oo- o o o o o
CM fO < inoN-
ooo 10 oo
PERCENTAGE OF TIME DISCHARGE WAS EQUALED OR EXCEEDED
Figure 23. Flow-duration curves for water years 1970-80 and the May through October periods 1970-80, Biscayne Canal at S-28 near Miami, site 10.
000
o uwCO
wP-4
H W
CJM PQ
8M
e>
uCOMO
too
10
1.0
till
30 DAY
_ 10 o o -
10 10t\i
O 10
O O
RECURRENCE INTERVAL,IN YEARS
Figure 24. Frequency curves for the indicated number of consecutive days, May through October 1970-80, Biscayne Canal at S-28 near Miami, site 10.
34
Little River Canal at S-27, Miami, Site 11
The Little River Canal is approximately 11 miles long and extends from upper Biscayne Bay 4.5 miles northwesterly and then westerly to 87th Avenue, 0.1 mile northeast of the Miami Canal (fig. 20). Discharge in Little River Canal is affected by inflow from numerous lateral canals and is regulated by operation of salinity-control structure 27 (S-27), 1.6 miles upstream of its mouth. Flow is at times affected by tides and is sometimes re versed.
The gaging station is at N.E. 2nd Avenue in Miami, 0.4 mile upstream from S-27. Mean daily discharge from July 1973 to Septem ber 1980 was 138 ft^/s. The maximum and minimum daily discharges were 921 and 0.0 ft^/s, respectively. Table 2 shows the greatest percentage of discharge for the 1974-80 water years occurred during May through October. Mean daily discharge for May through October 1974-80 was 185 ft^/s. The maximum and minimum daily discharges for the high-flow period were 892 and 0.0 ft^/s, respectively. The following table lists the number of no-flow days in each May through October period:
____________May - October periods____________ ____________1974 1975 1976 1977 1978 1979 1980
No-flow days____5_____9_____0_____4_____4____9_____6_
Figure 25 shows flow-duration data for the 7 water years and the 7 May through October periods. Tables 3 and 4 list the flow- duration data for the water years and the May through October pe riods, respectively.
The following table shows the lowest mean discharge (in cubic feet per second) for selected periods of consecutive days in each May through October period for Little River Canal at S-27, Miami:
Number ofconsecutive
days
306090120183
1974
124196199207205
1975
99129165174176
May - October periods1976
130163170191196
1977
82165174171222
1978
121147147154155
1979
57647399166
1980
100113152160172
Figure 26 shows frequency curves based on the above data.
35

DISCHARGE,IN CUBIC
FEET PER SECOND
DISCHARGE,IN CUBIC
FEET
PER SECOND
a O
QP
i C
en
(D
CO
PJ
rt> i n
o>
(-
O
X>
c c
00
<t>cr
3 n
o^s
o rr
nO
C
cr i
-tft>
<
i ft) CO
00
rrO
=T
f rt)
H-
3rr
a
pd
rt)
H. a
<
<D
3
o c
r0)
0)
0) T
O OCO
3
I co
(O
rt>
«>j
n-
c rr
H-
< 0)
O § O M M M | H
2!
O oo
o
o
1.01
1.0
5
III
1.25
10 25 50
100
I I
II III
O
P
II
rr
00
. cr
C
-)
i-J
O
<D
C'
00
S3
cr
LH
O
*l
n
irr
ht
jO
h
-C
T O
(D
^M
I a
13
C<t)
1-1
O
H.
CX
oco
3
i
O^o
c"«
4 -)
P* <
I (D
00
CO
O ft)
PJ
t
i-J COO PJ
i-
' 3
vO
PJ
-«J
H-
* I
PJ
00
rt
O
CO
PJI
3N
) C
u
3* n>
w ?3
O
W w
o o M (/>
o s M 5 (/> w
o I M
O O
*» W
X o
w s §

Miami Canal at N.W. 36th Street, Miami, Site 12
The Miami Canal is a manmade extension of the Miami River. The Miami River originally extended inland from Biscayne Bay to just west of N.W. 27th Avenue (fig. 20). Dredging of the Miami Canal began in 1909 and proceeded northwestward into the Everglades. The lower section of the canal was completed in 1932 and extended from Miami to the South New River Canal. The middle section extended from the South New River Canal to the Bolles Canal and the upper section from Bolles Canal to Lake Okeechobee. However, because of the poor conveyance capacity of the middle section, the upper and lower sections were essentially independent of each other (Parker and others, 1955, p. 406). Because of this, a new canal was con structed during 1967-69, in place of and parallel to the old Miami Canal to more effectively route water from Lake Okeechobee (Meyer, 1972, p. 46).
Excess water in the upper Miami Canal drainage area is pumped by pumping station 3 (S-3) into Lake Okeechobee (fig. 4). In the middle reach of the canal from the Bolles Canal, 40 miles southward to the L-30 Canal, excess water is pumped southward by pumping sta tion 8 (S-8) and gate into Conservation Area 3A. Control structures 151 (S-151) and 31 (S-31) regulate flow from Conservation Areas 3A and 3B to the lower reach of the Miami Canal, and control struc tures 32 (S-32) and 32A (S-32A) regulate seepage from Conservation Area 3B into the lower reach of the Miami Canal (figs. 1 and 7). The lower reach drains Hialeah and Miami Springs and is an impor tant source of recharge to Miami Springs-Hialeah well fields (fig. 20). Discharge is affected by levee and control structures 31 (S-31), 32 (S-32), and 32A (S-32A) and by salinity-control struc ture 26. Seepage losses above the gaging station occur through the canal bed into the surficial aquifer in the vicinity of the Miami Springs-Hialeah well field also. Flow at times is affected by tides and is sometimes reversed.
The gaging station is at the downstream end of the N.W. 36th Street bridge fender at Miami, 200 feet upstream from S-26. Mean daily discharge from October 1969 to September 1980 was 225 ft 3 /s. The maximum and minimum daily discharges were 1,220 and 0.0 ft^/s, respectively. Table 2 shows the greatest percentage of discharge for the 1970-80 water years occurred during June through Novem ber. Mean daily discharge for June through November 1970-80 was 264 ft^/s. The maximum and minimum daily discharges for the high- flow period were 1,000 and 0.0 ft-Vs, respectively. The following table lists the number of no-flow days in each June through Novem ber period:
_____________June - November periods____________ __________1970 1971 1972 1973 1974 1975 1976 1977 1978 1979 1980
Number of 4000560003 76
no-flow days._____________________________________________
37

Figure 27 shows flow-duration data for the 11 water years and the 11 June through November periods. Tables 3 and 4 list the flow-duration data for the water years and the June through Novem ber periods, respectively.
The following table shows the lowest mean discharge (in cubic feet per second) for selected periods of consecutive days in each June through November period for Miami Canal at N.W. 36th Street, Miami:
Number of consecutive June - November periods
days
306090120183
1970
297380446428493
1971
365068135158
1972
90176228260304
1973
77158215277282
1974
96115149167165
1975
64116131165199
1976
167196230259288
1977
194220287283305
1978
249272305341361
1979
176194222269278
1980
0.3330529075
Figure 28 shows frequency curves based on the above data.
Tamiami Canal Outlets, Monroe to Carnestown, Site 13
The Monroe to Carnestown section is the westernmost section of the Tamiami Canal outlets (fig. 29). Flow is to the south through 19 outlets. Discharge consists of runoff from the Big Cypress Swamp watershed through the Tamiami Canal outlets from Monroe, 55 miles west of Miami to a point 1 mile east of State Highway 29 at Carnes town. Flow at the westernmost outlets is slightly affected by tides.
Mean daily discharge from October 1969 through September 1980 was 334 ft^/s. The maximum and minimum daily discharges were 4,980 and 0.0 ft^/s, respectively. Table 2 shows the greatest percentage of discharge for the 1970-80 water years occurred during July through October. Mean daily discharge for July through Octo ber 1970-80 was 739 ft^/s. The maximum and minimum daily dis charges for the high-flow period were 4,980 and 5.2 ft^/s, respec tively. The following table lists the number of no-flow days in each July through October period:
________________July - October periods__________________________1970 1971 1972 1973 1974 1975 1976 1977 1978 1979 1980
Number of 00000000000
no-flow days._______________________________________________
Figure 30 shows flow-duration data for the 11 water years and the 11 July through October periods. Tables 3 and 4 list the flow- duration data for the water years and the July through October pe riods, respectively.
38

DISCHARGE,IN CUBIC
FEET PER
SECOND
OJ
coH
-a.
OQ
rr
to
C i-JCO
ft
) NJ C»
H-
0>
I
O
CC
0)
00
P
O
O<
c0)
i-J
3 <
cr f
t>0)
COi-j
i-hI-
1 O
VO
i-J
--
JO
rr
I
P4
00
ft)o 3
o.H
- H
-
03
O3
toH
- rr
0)
O
CX
03 P
P
(U
gi-
1 3
crto
o>
rr
i-j
2!
O
HI
S3 CO
S § O w M 1 2!
HJ w
DISCHARGE,IN CUBIC
FEET PER SECOND
o
oo
o
o
1.01
I 05
I. I I
12
5
10
25 50 00
to n
i-jB
o ro
H. c
- OQ
K
Jsr
--J
w H-
2J
Ift
O
I
0)
<
^Jft)
I
1H-
a
oKJ
cr
3.
01
i i-J
CL C
T3
i-J
0)
to
i-J
rr
H-
H-
O
O
Cu
P
wo
!-
CVO
i-J
" J
<O
0)
I CD
00
O
hh
- o I-J
CU
to3
rr
H-
ft)
Co
^<
P
(D
Cu
Oi
H-1
i-J
cn03
00 o
o> P a.
i-J
ft)
0) 0)
t-i
rr
c
- P
TJ
til B W
25 i M
O hd o H
C/3
O O w g C/2 w S o td w X
o
w M o M
O
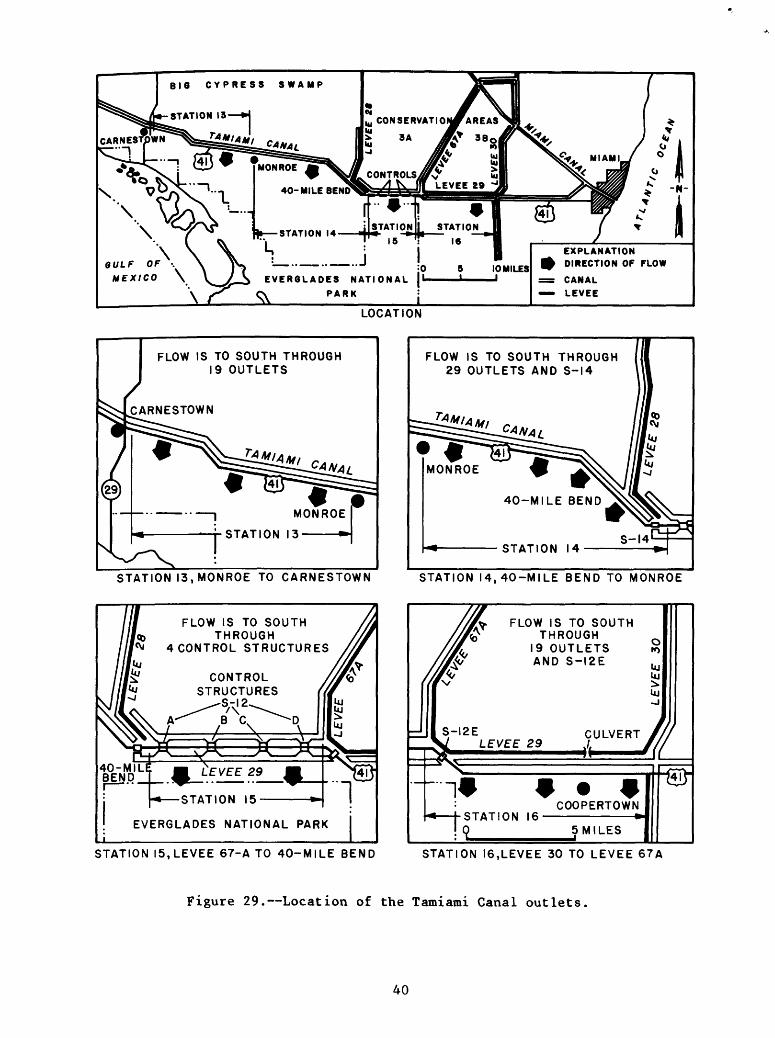
BIG CYPRESS SWAMP
IF"STATION
15
EVERGLADES NATIONAL
Ok PARK
GULF OF ; MEXICO \
EXPLANATION DIRECTION OF FLOW
CANAL LEVEE
LOCATION
FLOW IS TO SOUTH THROUGH 19 OUTLETS
FLOW IS TO SOUTH THROUGH 29 OUTLETS AND S-14
STATION 13, MONROE TO CARNESTOWN STATION 14,40-MILE BEND TO MONROE
FLOW IS TO SOUTHTHROUGH
4 CONTROL STRUCTURES
CONTROL STRUCTURES
40-MIL BEND
STATION 15
EVERGLADES NATIONAL PARK
FLOW IS TO SOUTHTHROUGH
19 OUTLETS AND S-I2E
LEVEE 29CULVERTJ
STATION 16
19________
COOPERTOWN
5MILES
STATION 15,LEVEE 67-A TO 40-MILE BEND STATION 16,LEVEE 30 TO LEVEE 67A
Figure 29. Location of the Tamiami Canal outlets.
40

o owCO
w
H W W
o55
w Q
oCO
o o wCO
wPM
W W
OH PC
O
55
w Q
oCO H Q
10,000
000
00
.0
0.10 I___I
5 2o- o o o o o
OJ rO <fr tooto
O 00
oo
PERCENTAGE OF TIME DISCHARGE WAS EQUALED OR EXCEEDED
Figure 30. Flow-duration curves-for water years 1970-80 and the July through October periods 1970-80, Tamiami Canal outlets, Monroe to Carnestown, site 13.
10,000
000
00
10
90 DAY
_ IO IO O O co
mCVJ
Oino o
RECURRENCE INTERVAL,IN YEARS
Figure 31. Frequency curves for the indicated number of consecutive days, July through October 1970-80, Tamiami Canal outlets, Monroe to Carnestown, site 13.
41.

The following table shows the lowest mean discharge (in cubic feet per second) for selected periods of consecutive days in each July through October period for Tamiami Canal outlets, Monroe to Carnestown:
Number of"~~~
consecutive ^______July - October periods___________________days T970 1971 1972 1973 1974 1975 1976 1977 1978 1979 1980
30 428 283 118 476 171 393 324 277 287 247 4060 660 678 158 825 351 444 630 921 405 416 24290 738 1,140 367 1,000 551 586 859 824 433 746 475120____857 1,250 320 929 611 660 886 937 430 815 451
Figure 31 shows frequency curves based on the above data.
Tamiami Canal Outlets, 40-Mile Bend to Monroe, Site 14
Discharge for Tamiami Canal outlets, 40-Mile Bend to Monroe, consists of runoff from the Big Cypress Swamp watershed. Discharge is to the south through 29 bridges (fig. 29).
Mean daily discharge from October 1969 through September 1980 was 210 ft^/s. The maximum and minimum daily discharges were 1,690 and 0.0 ft^/s, respectively. Table 2 shows the greatest percentage of discharge for the 1970-80 water years occurred during July through October. Mean daily discharge for July through Octo ber 1970-80 was 429 ft^/s. The maximum and minimum daily discharges for the high-flow period were 1,690 and 4.7 ft^/s, respectively. The following table lists the number of no-flow days in each July through October period:
July - October periodsT£ W>__________19/1 1972 1973 19/4 1975 19/61977 1978 1979 1980
Number of 00000000000 no-flow days._____________________________________________
Figure 32 shows flow-duration data for the 11 water years and the 11 July through October periods. Tables 3 and 4 list the flow- duration data for the water years and the July through October pe riods, respectively.
The following table shows the lowest mean discharge (in cubic feet per second) for selected periods of consecutive days in each July through October period for Tamiami Canal outlets, 40-Mile Bend to Monroe:
Number or consecutive u- ~^cer____________ _ ,_
days 1970 1971 1972 1973 1974 1975 1976 1977 1978 1979 1980
30 143 94 65 262 141 227 243 136 219 62 11660 232 361 145 453 191 287 383 178 292 176 25190 342 559 154 589 322 318 518 406 374 261 405
120 ____ 472 606 162 591 368 389 505 396 450 390 355
Figure 33 shows frequency curves based on the above data.
42
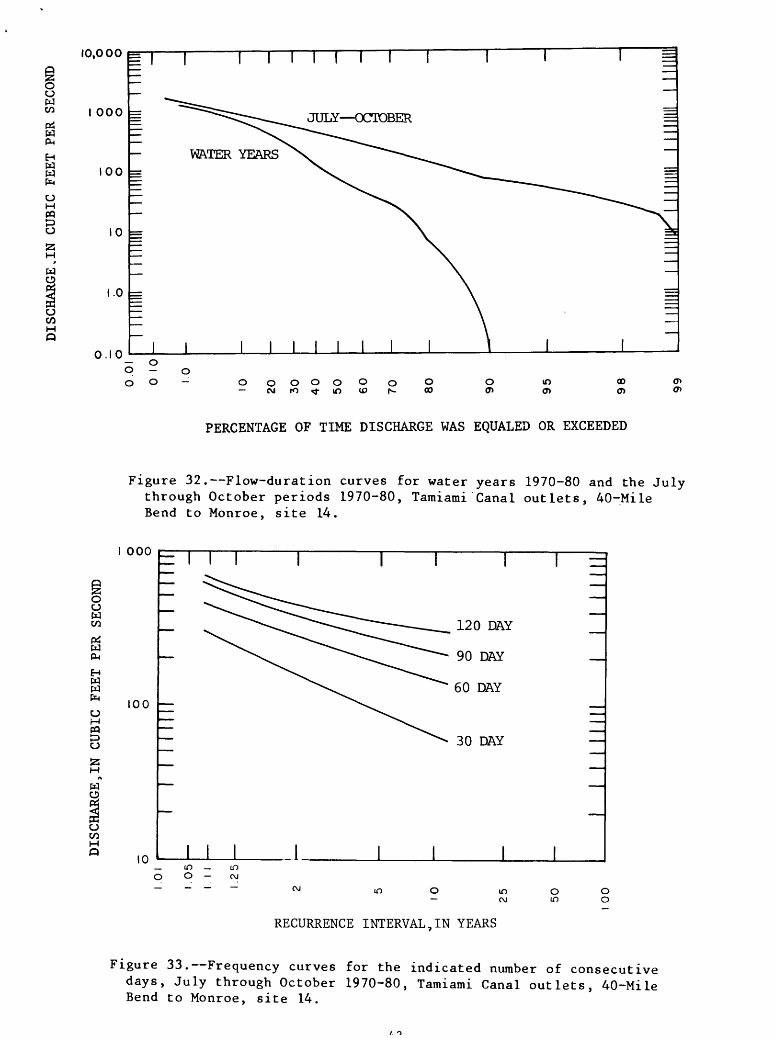
DISCHARGE,IN CUBIC FEET PER SECOND
DISCHARGE,IN CUBIC FEET PER SECOND
W
O.
00re
co c
CL
oo
ft*
rr
u>O
t-
i Lo
C
fl»O fD
ft
*Q»
O
CC
fl»
on
00
3H-
rr
orr
-<
ft)
O
O
o
C*
O
ft
cr <
ft) ft)
"-!
0>
v£>
O
-4
i-!
O I rt
CO
3-
O
ft)
H
3CD
(x
3
H.
I-"
O
(D
(133
rt
M-
ft) a
n
03 3
o n
C rr
o
i 1
H>
fD rr
o
o>
O-
3
en-P
* fl»
O
OI
C
H-
<
ft)
fD
O oo
o o
1.01
1.0
5
I. I
I
1.2
5
S 2
w 25
n
w w I 25
50
00
ft)
3 CL o C
rr
00
O
3*
S
O
O
O
H-
rr O
Q3*
C
fD
ro
*l
O
(-
CT
O
ft)
C
M
I CL
X>
Cfl»
-!
i-j
CoI-1
- rr
O
H-
a o
eo
3
O
<I
<T>
00
0)
O »-
"I
Co rD
3
CoCo
-!
I
0>
O
H-
C
vort
««
4i O
fD
Irt
0
0on
O
\»
Co^>
3
O
CL
C-.
C
^
W 8 W z § w o »n o H
CO
O o
tt g CO w XD a w
o o
j^ t=d 8 w
t=d
O
w
o
0.0
1
o
oo
o
o
o
o
o b o o
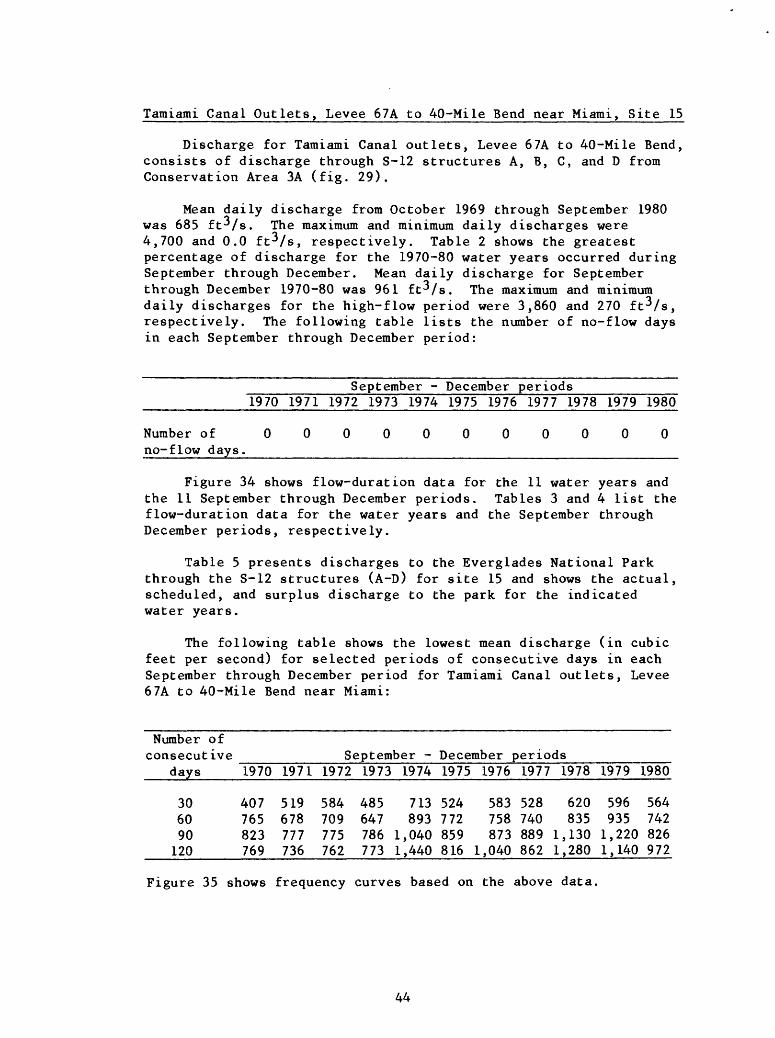
Tamiami Canal Outlets, Levee 67A to 40-Mile Bend near Miami, Site 15
Discharge for Taraiami Canal outlets, Levee 67A to 40-Mile Bend, consists of discharge through S-12 structures A, B, C, and D from Conservation Area 3A (fig. 29).
Mean daily discharge from October 1969 through September 1980 was 685 ft^/s. The maximum and minimum daily discharges were 4,700 and 0.0 ft-Vs, respectively. Table 2 shows the greatest percentage of discharge for the 1970-80 water years occurred during September through December. Mean daily discharge for September through December 1970-80 was 961 ft-Vs. The maximum and minimum daily discharges for the high-flow period were 3,860 and 270 ft^/s, respectively. The following table lists the number of no-flow days in each September through December period:
__________September - December periods___________ __________1970 1971 1972 1973 1974 1975 1976 1977 1978 1979 1980
Number of 00000000000
no-flow days._____________________________________________
Figure 34 shows flow-duration data for the 11 water years and the 11 September through December periods. Tables 3 and 4 list the flow-duration data for the water years and the September through December periods, respectively.
Table 5 presents discharges to the Everglades National Park through the S-12 structures (A-D) for site 15 and shows the actual, scheduled, and surplus discharge to the park for the indicated water years.
The following table shows the lowest mean discharge (in cubic feet per secon<}) for selected periods of consecutive days in each September through December period for Tamiami Canal outlets, Levee 67A to 40-Mile Bend near Miami:
Number of consecutive __________September - December periods
days
306090
120
1970
407765823769
1971
519678777736
1972
584709775762
1973
485647786773
1974
713893
1,0401,440
1975
524772859816
1976
583758873
1,040
1977
528740889862
1978
620835
1,1301,280
1979
596935
1,2201,140
1980
564742826972
Figure 35 shows frequency curves based on the above data.
44

lopooo owCO
W 1000
HW W
100
w o
oC/3
o u w wtf w
Hw w
o525
w o.
10
1 I I I I IWATER YEARS
^SEPTEMBER DECEMBER
WATER YEARS
SEPTEMBER DECEMBER
i i i i o o O
o o o o o o o o CM to ^j- in to r-
o00
m o>
ooo>
PERCENTAGE OF TIME DISCHARGE WAS EQUALED OR EXCEEDED
Figure 34. Flow-duration curves for water years 1970-80 and the September through December periods 1970-80, Tamiami Canal outlets, Levee 67A to 40-Mile Bend near Miami, site 15.
10,000
I 000
100
120 DAY90 DAY
60 DAY
30 DAY
m m O c\j
Oin
oO
RECURRENCE INTERVAL,IN YEARS
Figure 35. Frequency curves for the indicated number of consecutive days, September through December 1970-80, Tamiami Canal outlets, Levee 67A to 40-Mile Bend near Miami, site 15.
45
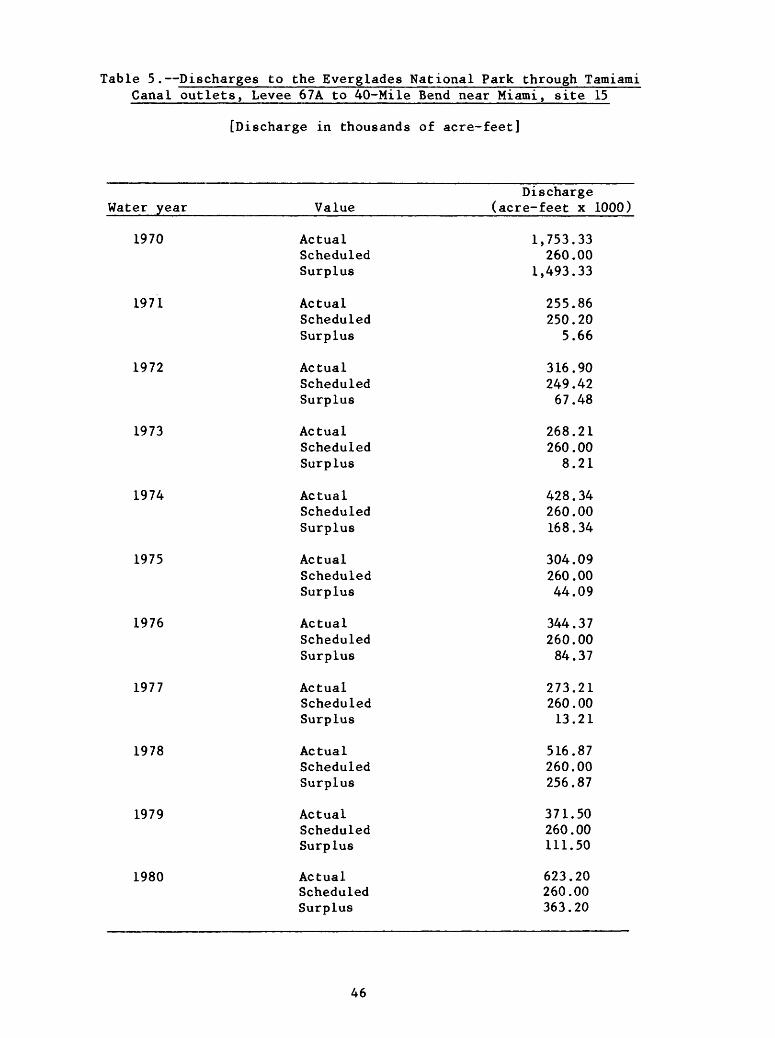
Table 5. Discharges to the Everglades National Park through Tamiami Canal outlets, Levee 67A to 40-Mile Bend near Miami, site 15
[Discharge in thousands of acre-feet]
Water year
1970
1971
1972
1973
1974
1975
1976
1977
1978
1979
1980
Value
Actual ScheduledSurplus
ActualScheduledSurplus
ActualScheduledSurplus
ActualScheduledSurplus
ActualScheduledSurplus
ActualScheduledSurplus
ActualScheduledSurplus
ActualScheduledSurplus
ActualScheduledSurplus
ActualScheduledSurplus
ActualScheduledSurplus
Discharge (acre- feet x 1000)
1,753.33 260.00
1,493.33
255.86250.20
5.66
316.90249.4267.48
268.21260.008.21
428.34260.00168.34
304.09260.0044.09
344.37260.0084.37
273.21260.0013.21
516.87260.00256.87
371.50260.00111.50
623.20260.00363.20
46
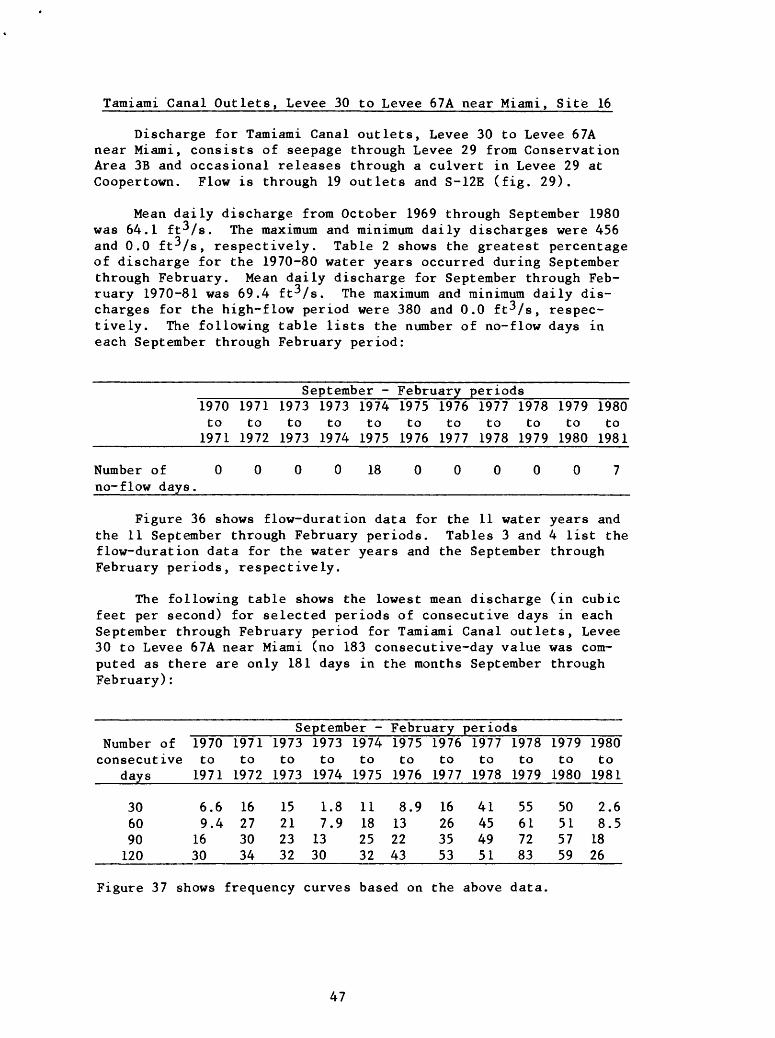
Tamiami Canal Outlets, Levee 30 to Levee 67A near Miami, Site 16
Discharge for Tamiami Canal outlets, Levee 30 to Levee 67A near Miami, consists of seepage through Levee 29 from Conservation Area 3B and occasional releases through a culvert in Levee 29 at Coopertown. Flow is through 19 outlets and S-12E (fig. 29).
Mean daily discharge from October 1969 through September 1980 was 64.1 ft^/s. The maximum and minimum daily discharges were 456 and 0.0 ft-Vs, respectively. Table 2 shows the greatest percentage of discharge for the 1970-80 water years occurred during September through February. Mean daily discharge for September through Feb ruary 1970-81 was 69.4 ft^/s. The maximum and minimum daily dis charges for the high-flow period were 380 and 0.0 ft^/s, respec tively. The following table lists the number of no-flow days in each September through February period:
___________September - February periods___________1970 1971 1973 1973 1974 1975 1976 1977 1978 1979 1980 to to to to to to to to to to to1971 1972 1973 1974 1975 1976 1977 1978 1979 1980 1981
Number of 0 no-flow days.
0 0 0 18 0 0 0 0
Figure 36 shows flow-duration data for the 11 water years and the 11 September through February periods. Tables 3 and 4 list the flow-duration data for the water years and the September through February periods, respectively.
The following table shows the lowest mean discharge (in cubic feet per second) for selected periods of consecutive days in each September through February period for Tamiami Canal outlets, Levee 30 to Levee 67A near Miami (no 183 consecutive-day value was com puted as there are only 181 days in the months September through February):
___________September - February periods_____________Number of 1970 1971 1973 1973 1974 1975 1976 1977 1978 1979 1980 consecutive to to to to to to to to to to to
days 1971 1972 1973 1974 1975 1976 1977 1978 1979 1980 1981
306090120
6.69.4
1630
16273034
15212332
1.87.9
1330
11182532
8.9132243
16263553
41454951
55617283
50515759
2.68.5
1826
Figure 37 shows frequency curves based on the above data.
47
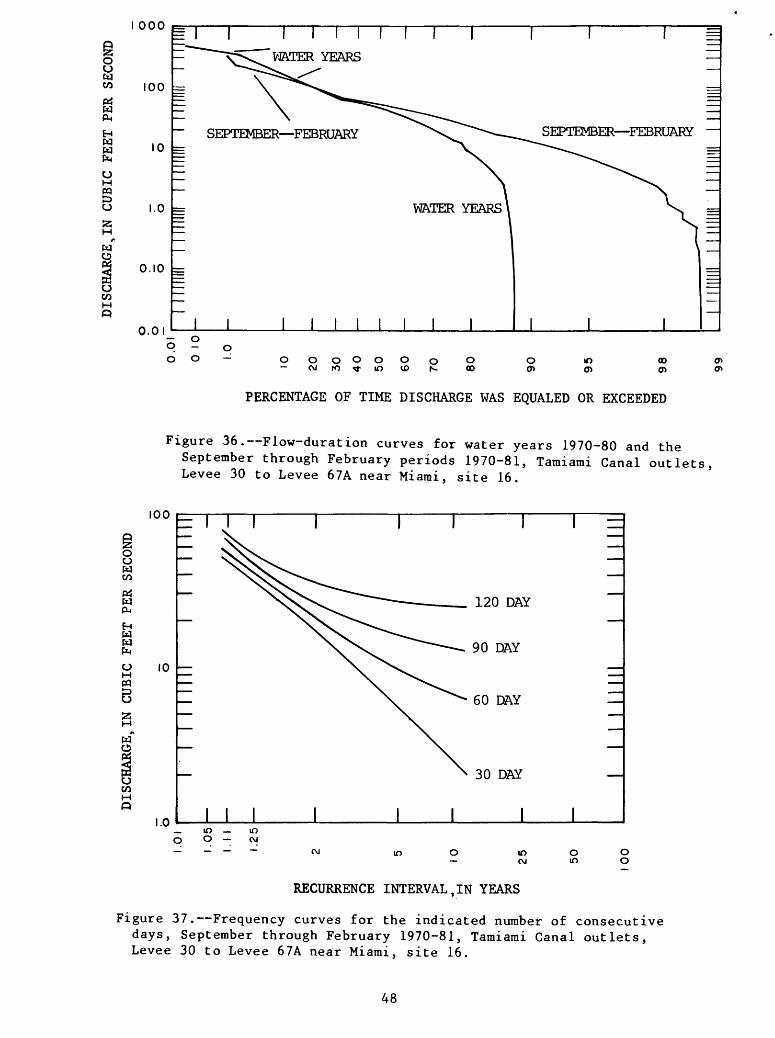
oCJW CO
w
Hw w PnCJH PQ !=> O
w
COMQ
I 000 i=
100 =:
SEPTEMBER FEBRUARYSEPTEMBER FEBRUARY
CJ ro sfr m CO00-
PERCENTAGE OF TIME DISCHARGE WAS EQUALED OR EXCEEDED
Figure 36. Flow-duration curves for water years 1970-80 and the September through February periods 1970-81, Tamiami Canal outlets, Levee 30 to Levee 67A near Miami, site 16.
100
wCO
wP-4
HWw
CJ HPQ8Bw"
oCOH Q
10
1.0
|
30 DAY
J_|__I_ in _ o o -
inCJ
inCJ
o in
o o
RECURRENCE INTERVAL,IN YEARS
Figure 37. Frequency curves for the indicated number of consecutive days, September through February 1970-81, Tamiami Canal outlets, Levee 30 to Levee 67A near Miami, site 16.
48
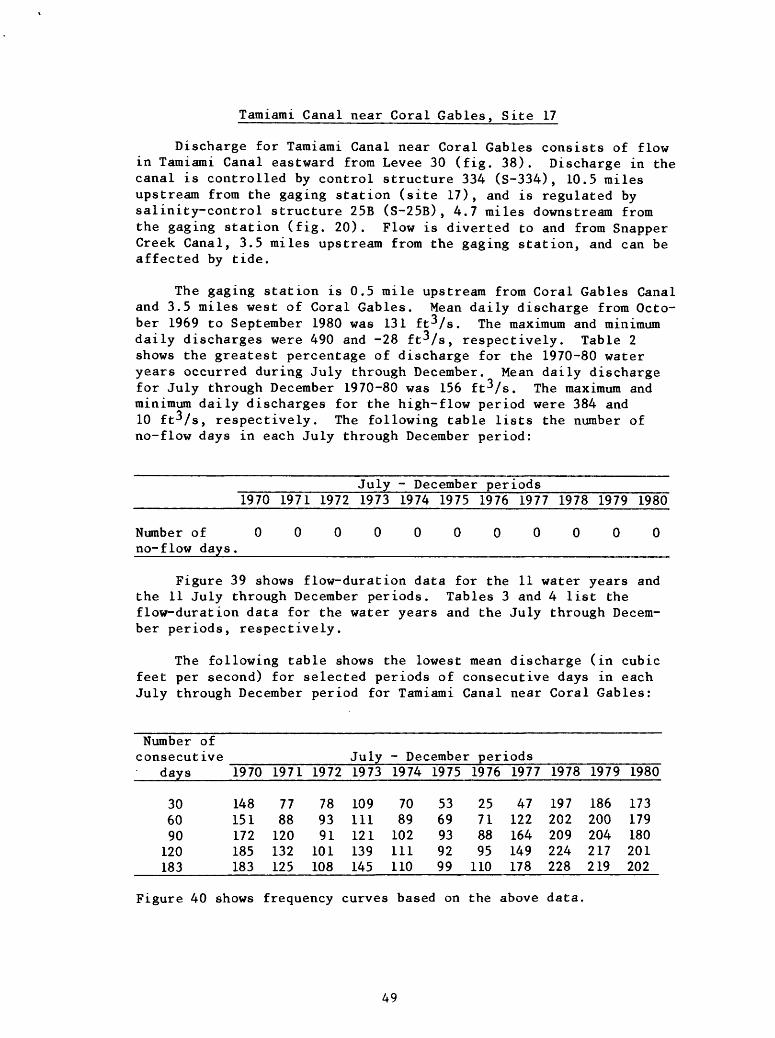
Tamiami Canal near Coral Gables, Site 17
Discharge for Tamiami Canal near Coral Gables consists of flow in Tamiami Canal eastward from Levee 30 (fig. 38). Discharge in the canal is controlled by control structure 334 (S-334), 10.5 miles upstream from the gaging station (site 17), and is regulated by salinity-control structure 25B (S-25B), 4.7 miles downstream from the gaging station (fig. 20). Flow is diverted to and from Snapper Creek Canal, 3.5 miles upstream from the gaging station, and can be affected by tide.
The gaging station is 0.5 mile upstream from Coral Gables Canal and 3.5 miles west of Coral Gables. Mean daily discharge from Octo ber 1969 to September 1980 was 131 ft^/s. The maximum and minimum daily discharges were 490 and -28 ft^/s, respectively. Table 2 shows the greatest percentage of discharge for the 1970-80 water years occurred during July through December. Mean daily discharge for July through December 1970-80 was 156 ft^/s. The maximum and minimum daily discharges for the high-flow period were 384 and 10 ft^/s, respectively. The following table lists the number of no-flow days in each July through December period:
____________July - December periods_____________ __________1970 1971 1972 1973 1974 1975 1976 1977 1978 1979 1980
Number of 00000000000
no-flow days._____________________________________________
Figure 39 shows flow-duration data for the 11 water years and the 11 July through December periods. Tables 3 and 4 list the flow-duration data for the water years and the July through Decem ber periods, respectively.
The following table shows the lowest mean discharge (in cubic feet per second) for selected periods of consecutive days in each July through December period for Tamiami Canal near Coral Gables:
Number of consecutive ____________July - December periods
days
306090
120183
1970
148151172185183
1971
7788
120132125
1972
789391
101108
1973
109111121139145
1974
7089
102111110
1975
5369939299
1976
25718895
110
1977
47122164149178
1978
197202209224228
1979
186200204217219
1980
173179180201202
Figure 40 shows frequency curves based on the above data.
49

80°55 26°00'
80° 05'
COUNTY SNAKE CR
COUNTY
£/ CONSERVATION jfff AREAS
3 A */ 3 B
SEE FIG. 20
EVERGLADES
S-I76«,L MOMESTE
EXPLANATION
CANAL^ONTROLAND NUMBER
19 CANAL SITE AND NUMBER
25 10'-
Figure 38. Location of selected canals, canal sites, controls, and majorroads in Bade County.
50

o o w co
w
Hw w PnoM
S5 M
*»
W O
oCO
o uwCO
PL*
HwW
OH
oS5 Hf
W
oCOH
PERCENTAGE OF TIME DISCHARGE WAS EQUALED OR EXCEEDED
Figure 39. Flow-duration curves, for water years 1970-80 and the July through December periods 1970-80, Taraiami Canal near Coral Gables, site 17.
I 000 r=
100
10
I
DAY120 DAY ZZ
_ to tOO O co
IT) CJ
oIT)
O O
RECURRENCE INTERVAL,IN YEARS
Figure 40. Frequency curves for the indicated number of consecutive days, July through December 1970-80, Tamiami Canal near Coral Coral Gables, site 17.
51

Snapper Creek Canal at S-22 near South Miami, Site 18
Snapper Creek Canal is about 19 miles long and extends from just south of the Pennsuco Canal, due south about 9 miles to a junction with the Tamiami Canal, then south and east to Biscayne Bay (fig. 38). From north to south, the canal is joined by nu merous canals that, depending on head differentials, contribute to the discharge or divert it into other canals. Flow is generally to the south, but because of the lateral canals and regulation of salinity-control structures on the Tamiami and Snapper Creek Ca nals, flow occasionally reverses. Discharge is affected by seepage losses through the canal bed into the Miami-Dade Water and Sewer Authority's Alexander Orr Well Field in southwest Miami (fig. 20).
The gaging station is 300 feet upstream from salinity-control structure 22 (S-22), 1.4 miles upstream from the mouth of the ca nal, and 2.5 miles south of South Miami (fig. 20). Mean daily dis charge from October 1969 to September 1980 was 173 ft^/s. The max imum and minimum daily discharges were 1,280 and 0.0 ft^/s, respec tively. Table 2 shows the greatest percentage of discharge for the 1970-80 water years occurred during June through November. Mean daily discharge for June through November 1970-80 was 281 ft^/s. The maximum and minimum daily discharges for the high-flow period were 1,280 and 0.0 ft^/s, respectively. The following table lists the number of no-flow days in each June through November period:
__________________June - November periods______________________1970 1971 1972 1973 1974 1975 1976 1977 1978 1979 1980
Number of 50 82 12 56 47 24 17 73 32 73 57
no-flow days.___________________________________________
Figure 41 shows flow-duration data for the 11 water years and the 11 June through November periods. Tables 3 and 4 list the flow- duration data for the water years and June through November periods, respectively.
The following table shows the lowest mean discharge (in cubic feet per second) for selected periods of consecutive days in each June through November period for Snapper Creek Canal at S-22 near South Miami:
Number of consecutive _____ June - November periods
days
306090120183
1970
81150198203255
1971
62028120157
1972
224288355361381
1973
0115213310269
1974
082146157181
1975
83209271262321
1975
186340476498507
1977
4.99215300287
1978
5 153201209229246
1979
01344108240
1980
51121203251249
Figure 42 shows frequency curves based on the above data.

o ow
w
H W W
CJHPQCJ
25
C?
O CO
10,000
I 000
00
10
.0
0.10
JUNE NOVEMBER
WATER YEARS
I___I
WATER YEARS
I I I I I
JUNE NOVEMBER
o - o oo- o o o o o o
c\j ro <t m to o o r^. oom oo
O)
PERCENTAGE OF TIME DISCHARGE WAS EQUALED OR EXCEEDED
Figure 41. Flow-duration curves for water years 1970-80 and the June through November periods 1970-80, Snapper Creek Canal at S-22 near south Miami, site 18.
000
o cjwCO
wPL,
H W W
CJH PQfaCJ
WC)
CJ CO
100
10
1.0
183 DAY
120 DAY
_ m in(VJ
in oin o o
RECURRENCE INTERVAL,IN YEARS
Figure 42. Frequency curves for the indicated number of consecutive days, June through November 1970-80, Snapper Creek Canal at S-22 near south Miami, site 18.
53

Black Creek Canal at S-21 near Goulds, Site 19
Black Creek Canal extends from Levee 31-N Canal in central Dade County to Biscayne Bay at Black Point (fig. 38). Flow is regulated by operation of control structure 148 (S-148), by salinity-control structure 21 (S-21), and by pumpage for irrigation. Flow is af fected by tide and is occasionally reversed.
The gaging station is in the control house of S-21, 0.5 mile upstream from the mouth and 3.5 miles east of Goulds. Mean daily discharge from October 1969 to September 1980 was 127 ft 3 /s,not including the period January through September 1978 when no record was available. The maximum and minimum daily discharges were 2,290 and 0.0 ft3 /s, respectively. Table 2 shows the greatest percentage of discharge for the 1970-80 water years occurred during June through November. Mean daily discharge for June through November 1970-77 and 1979-80 was 203 ft3 /s. The maximum and minimum daily discharges for the high-flow period were 2,290 and 0.0 ft 3 /s, re spectively. The following table lists the number of no-flow days in each June through November period:
____________June - November periods__________________1970 1971 1972 1973 1974 1975 1976 1977 1978 1979 1980
Number of no-flow days.
52 11 50 52 22 20
Figure 43 shows flow-duration data for the 10 water years, the 10 June through November periods, plus October and November 1978. Tables 3 and 4 list the flow-duration data for the water years and the June through November periods, respectively.
The following table shows the lowest mean discharge (in cubic feet per second) for selected periods of consecutive days in each June through November period for Black Creek Canal at S-21 near Goulds:
Number of consecutive June - November periods
days
306090
120183
1970
104139152147205
1971
111987
171165
1972
136160188186223
1973
1152
123185157
1974
07793
103114
1975
62122128129153
1976
61142219237255
1977
132191220327297
1978 1979
67 130 135-- 176 199
1980
135169225236236
Figure 44 shows frequency curves based on the above data.
54

oCJwCO
Pi! W
HW W
CJ M PQ
O
S5
W O
CJ COM Q
10,000
I 000
100
10
.0
0.10
JUNE NOVEMBER
I____I
oCJwCO
w
w
M«8
O
CJ COMQ
a 2 o o o - O O O O O O o
cvj ro ^ in to N>o oo
oO)
m oo
PERCENTAGE OF TIME DISCHARGE WAS EQUALED OR EXCEEDED
Figure 43. Flow-duration curves for water years 1970-77, 1979-80, and October through December 1977, and the June through November periods 1970-77, 1979-80, and October and November 1978, Black Creek Canal at S-21 near Goulds, site 19.
I 000 c=
100
10
= 111
183 DAY
30 DAYJ_J__I
_ in _ o o -
mCJ
mCM
o in
O o
RECURRENCE INTERVAL,IN YEARS
Figure 44. Frequency curves for the indicated number of consecutive days, June through November 1970-77 and 1979-80, Black Creek Canal at S-21 near Goulds, site 19.
55

Mowry Canal at S-20F, Site 20
Mowry Canal extends from Levee 31-N Canal in a easterly direc tion to Biscayne Bay, 2 miles north of Turkey Point (fig. 38). Flow in the Mowry Canal is regulated by operation of control struc tures 196 (S-196), 167 (S-167), and 179 (S-179), by salinity-control structure 20F (S-20F), and by pumpage for irrigation. Flow is af fected by tides and is occasionally reversed.
The gaging station is in the control house for S-20F, 0.5 mile upstream from the mouth of Mowry Canal and 8 miles east of Home stead. Mean daily discharge from March 1970 to September 1980 was 204 ft-Vs. The maximum and minimum daily discharges were 1,870 and 0.0 ft-Vs, respectively. Table 2 shows the greatest percent age of discharge for the period March 1970 through September 1980 occurred during June through November. Mean daily discharge for June through November 1970-80 was 304 ft^/s. The maximum and minimum daily discharges for the high-flow period were 1,720 and 0.0 ft-Vs, respectively. The following table lists the number of no-flow days in each June through November period:
_______________June - November periods____________________________1970 1971 1972 1973 1974 1975 1976 1977 1978 1979 1980
Number of 33 60 11 23 43 26 5 11 3 37 10
no-flow days.______________________________________________________
Figure 45 shows flow-duration data for the 10 1/2 water years and the 11 June through November periods. Tables 3 and 4 list the flow-duration data for the water years and the June through Novem ber periods, respectively.
The following table shows the lowest mean discharge (in cubic feet per second) for selected periods of consecutive days in each June through November period for Mowry Canal at S-20F:
Number of consecutive ____________June - November periods________________
days 1970 1971 1972 1973 1974 1975 1976 1977 1978 1979 1980
306090120183
2846129180231
274171
130173
128223265281345
69164241285266
0117163165180
154265275294333
275346427430488
124193274288323
186307417430430
6584102155237
221237270301340
Figure 46 shows frequency curves based on the above data.
56

wCO
Pi w
H W W
H PQ
10,000
1000
100
10
.0oCO
W CO
W
H W W
PQ
B
W Q
COM O
0.10
I I I I T
WATER YEARS
JUNE NOVEMBER
WATER YEARS
o - o o o o o o o o
CM ro <fr 10 U>O 00
o0>
lO 0>
00 O)
PERCENTAGE OF TIME DISCHARGE WAS EQUALED OR EXCEEDED
Figure 45. Flow-duration curves for March 1970 through September 1980 and the June through November periods 1970-80, Mowry Canal at S-20F, site 20.
I 000 rn
100
10
T T
183 DAY
120 DAY
_' in _O O -
O O
RECURRENCE INTERVAL,IN fEARS
Figure 46. Frequency curves for the indicated number of consecutive days, June through November 1970-80, Mowry Canal at S-20F, site 20
57
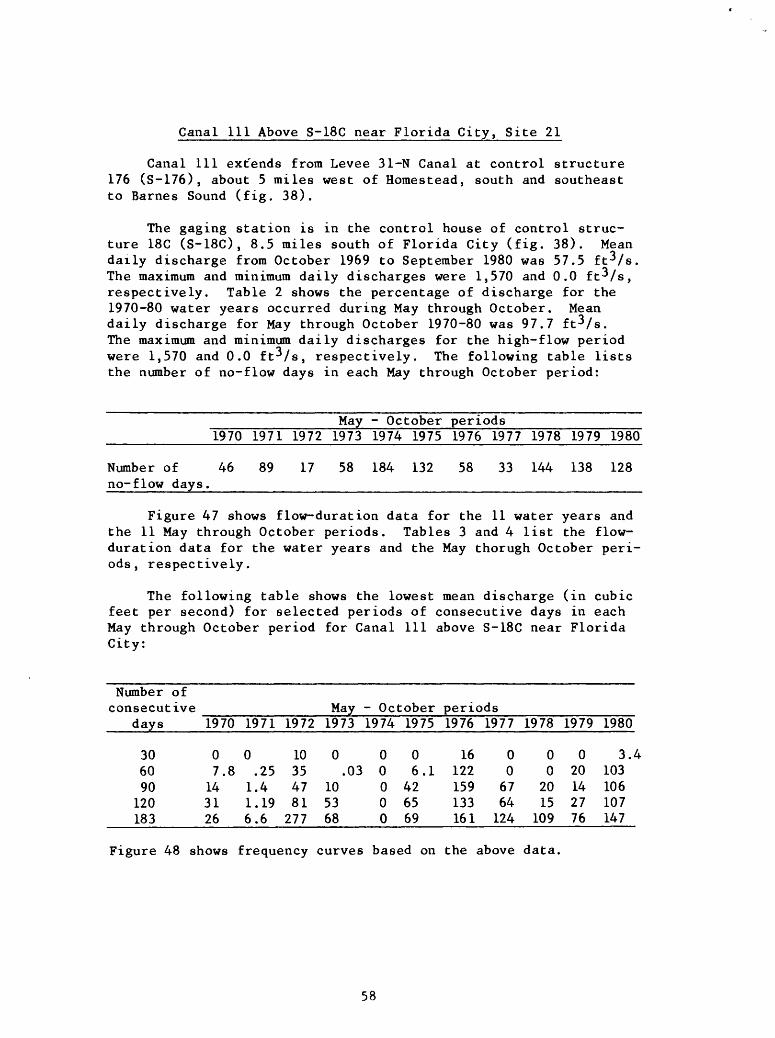
Canal 111 Above S-18C near Florida City, Site 21
Canal 111 ext'ends from Levee 31-N Canal at control structure 176 (S-176), about 5 miles west of Homestead, south and southeast to Barnes Sound (fig. 38).
The gaging station is in the control house of control struc ture 18C (S-18C), 8.5 miles south of Florida City (fig. 38). Mean daily discharge from October 1969 to September 1980 was 57.5 ft-Vs, The maximum and minimum daily discharges were 1,570 and 0.0 ft^/s, respectively. Table 2 shows the percentage of discharge for the 1970-80 water years occurred during May through October. Mean daily discharge for May through October 1970-80 was 97.7 ft^/s. The maximum and minimum daily discharges for the high-flow period were 1,570 and 0.0 ft^/s, respectively. The following table lists the number of no-flow days in each May through October period:
May - October periods _1970 1971 1972 1973 1974 1975 1976 1977 1978 1979 1980
Number of 46 no-flow days.
89 17 58 184 132 58 33 144 138 128
Figure 47 shows flow-duration data for the 11 water years and the 11 May through October periods. Tables 3 and 4 list the flow- duration data for the water years and the May thorugh October peri ods, respectively.
The following table shows the lowest mean discharge (in cubic feet per second) for selected periods of consecutive days in each May through October period for Canal 111 above S-18C near Florida City:
Number of consecutive May - October periods
days
306090
120183
1970
07.8
143126
1971
0.25
1.41.196.6
1972
10354781
277
1973
0.03
105368
1974
00000
1975
06.1
426569
1976
16122159133161
1977
00
6764
124
1978
00
2015
109
1979
020142776
1980
3.4103106107147
Figure 48 shows frequency curves based on the above data.
58
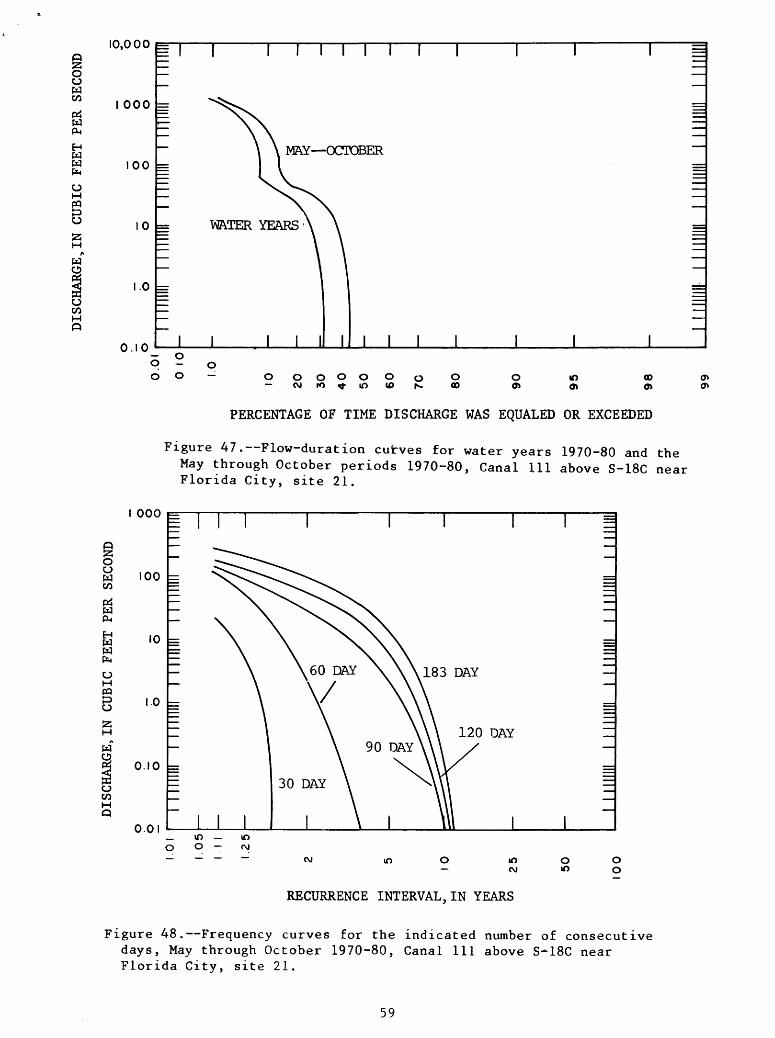
o o w co
wCM
H W W
CO M PQ D CJ
C)
CJ
M P
10,000
I 000
00
.0
0.10
MAY OCTOBER
I I I I I
O-ooo- o o o o o o o
CM ro if if) «> ^O 00
o or>
10or>
oo or>
o> o>
PERCENTAGE OF TIME DISCHARGE WAS EQUALED OR EXCEEDED
Figure 47. Flow-duration curves for water years 1970-80 and the May through October periods 1970-80, Canal 111 above S-18C near Florida City, site 21.
o o
PM
H W
OM PQ
000
100 =
CJ CO
0.10 =
0.01
RECURRENCE INTERVAL,IN YEARS
Figure 48. Frequency curves for the indicated number of consecutive days, May through October 1970-80, Canal 111 above S-18C near Florida City, site 21.
59

Barren River Canal near Everglades City, Site 22
The Barren River Canal originates in north-central Collier County near Immokalee and flows approximately 35 miles southward to the Gulf of Mexico (fig. 49). Discharge in the Barron River Canal is seasonally regulated by operation of control structures at, above, and below the gaging station.
The gaging station is 40 feet upstream from the control struc ture, 0.7 mile north of Copeland, and 7.5 miles upstream from the canal's mouth on the Chokoloskee Bay (fig. 49). Mean daily dis charge from October 1969 to September 1980 was 102 ft 3 /s. The max imum and minimum daily discharges were 283 and 0.0 ft^/s, respec tively. Table 2 shows the greatest percentage of discharge for the 1970-80 water years occurred during July through December. Mean daily discharge for July through December 1970-8X) was 139 ft^/s. The maximum and minimum daily discharges for the high-flow period were 270 and 9.5 ft-Vs, respectively. The following table lists the number of no-flow days in each July through December period:
July - December periods__________ 1970 1971 1972 1973 1974 1975 1976 1977 1978 1979 1980
Number of 00000000000
no-flow days. _____________________________________________
Figure 50 shows flow-duration data for the 11 water years and the 11 July through December periods. Tables 3 and 4 list the flow- duration data for the water years and the July through December pe riods, respectively.
The following table shows the lowest mean discharge (in cubic feet per second) for selected periods of consecutive days in each July through December period for Barron River Canal near Everglades City:
Number of consecutive July - December periods
days
306090
120183
1970
5283
116138170
1971
2674
119146151
1972
8193
103125128
1973
81113152166156
1974
233566
100129
1975
2972
115137133
1976
4583
120136148
1977
245389
119131
1978
355975
105133
1979
93109143166169
1980
4555668782
Figure 51 shows frequency curves based on the above data.
60
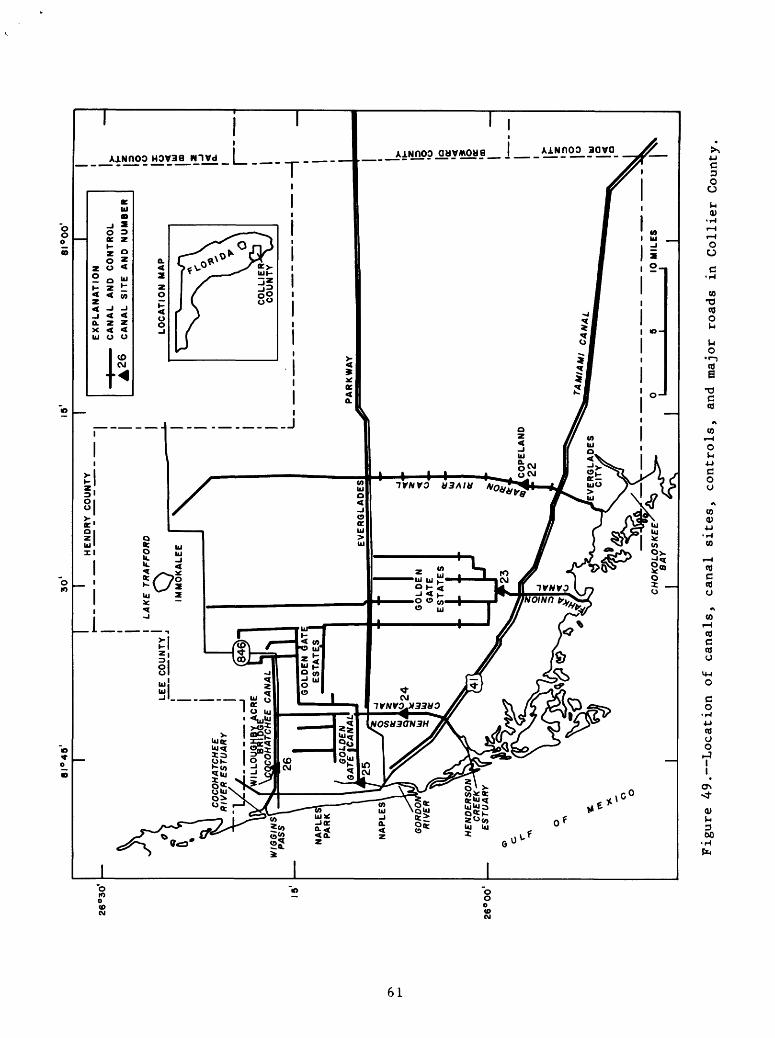
H- 00
o o* a00
o o
o oc
DADE"COUNTY" I BROWARD
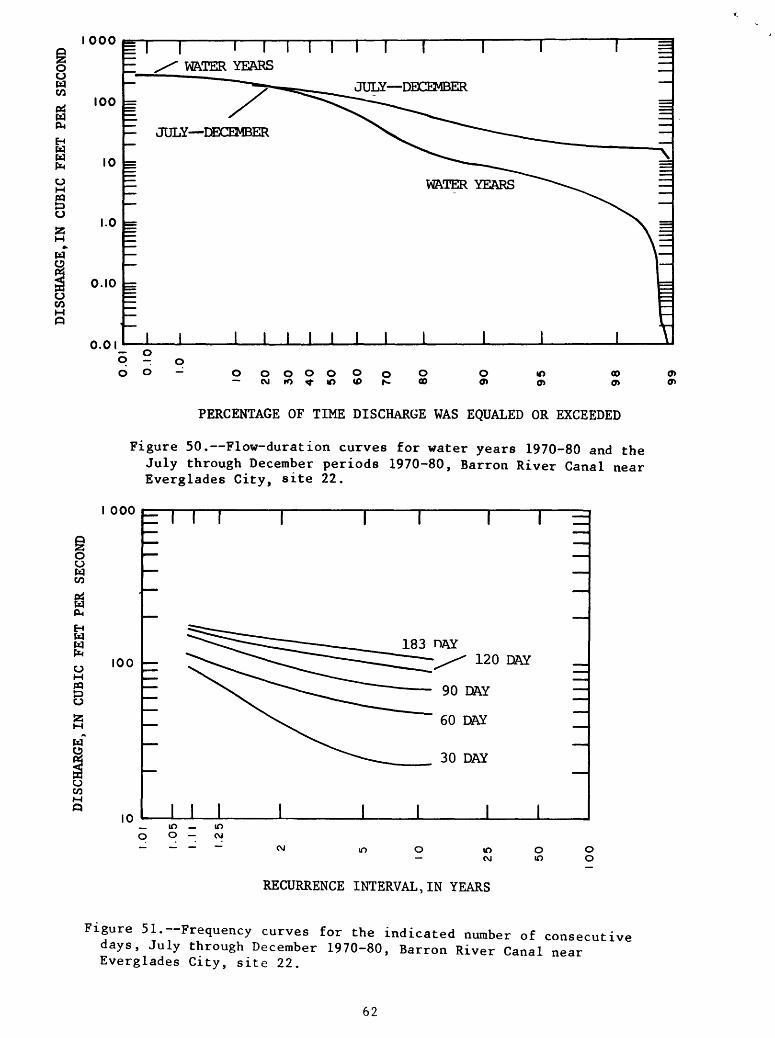
o o w co
w &H
CJM
o53M
oCO
000
100
10
1.0
0.10
0.01q - o oo- o o o o o o o o
CM IO <f in <O N> 00o 0>
IO 00
oO M CO
A.
H
oM W
O
2;
CJ CO
PERCENTAGE OF TIME DISCHARGE WAS EQUALED OR EXCEEDED
Figure 50. Flow-duration curves for water years 1970-80 and the July through December periods 1970-80, Barron River Canal near Everglades City, site 22.
I 000 pz
100
10 _ in _ o o -
IO CVJ
T T T
30 DAY
10CVJ
oin
o o
RECURRENCE INTERVAL,IN YEARS
Figure 51. Frequency curves for the indicated number of consecutive days, July through December 1970-80, Barron River Canal near Everglades City, site 22.
62

Fahka Union Canal near Copeland, Site 23
The Fahka Union Canal in central Collier County extends north ward about 30 miles from the Gulf of Mexico nearly to Lake Trafford (fig. 49). In its northwest reaches, several secondary canals of the Fahka Union Canal system are connected to the Golden Gate Canal system, which helps provide partially controlled drainage of the Golden Gate Estates east of Naples (McCoy, 1962, p. 9). Drainage from the shallow aquifer to the canal is limited by several control structures or weirs. A coastal weir on the main canal just north of U.S. Highway 41 retards saltwater intrusion (Swayze and McPher- son, 1977).
The gaging station is 0.5 mile north of U.S. Highway 41 and 9.3 miles west of Copeland. Mean daily discharge from October 1969 to September 1980 was 226 ft^/s. The maximum and minimum daily discharges were 3,190 and 0.0 ft-Vs, respectively. Table 2 shows the greatest percentage of discharge for the 1970-80 water years oc curred during June through November. Mean daily discharge for June through November 1970-80 was 403 ft-Vs. The maximum and minimum daily discharges for the high-flow period were 3,190 and 0.0 ft3/s, respectively. The following table lists the-number of no-flow days in each June through November period:
_____________June - November periods____________ __________1970 1971 1972 1973 1974 1975 1976 1977 1978 1979 1980
Number x>f 0 17 0 34 6 22 0 0 0 0 0
no-flow days.______________________________________________
Figure 52 shows flow-duration data for the 11 water years and the 11 June through November periods. Tables 3 and 4 list the flow-duration data for the water years and the June through Novem ber periods, respectively.
The following table shows the lowest mean discharge (in cubic feet per second) for selected periods of consecutive days in each June through November period for Fahka Union Canal near Copeland:
Number of consecutive ____________June - November periods______________
days 1970 1971 1972 1973 1974 1975 1976 1977 1978 1979 1980
30 221 115 192 3 47 7.8 43 62 128 62 3060 310 189 265 232 165 298 109 195 268 66 8490 411 356 309 427 456 487 157 244 354 93 150120 468 763 311 591 641 509 172 254 410 191 282183____476 706 338 484 638 517 217 250 379 174 265
Figure 53 shows frequency curves based on the above data.
63

oCJw
6P-i
H W W
CJH PQ
CJ
g*
W
CJ COHQ
10,000
I 000
00
1.0
0.10
i i r 1 =
5 2 o00-
JUNE NOVEMBER.
o o o o o o tvj ro ^- m <o o oo
m oo enCD
oCJ W CO
WPL)
H
W
CJM PQ
CJ
» M
I*
M
CJ CO
PERCENTAGE OF TIME DISCHARGE WAS EQUALED OR EXCEEDED
Figure 52. Flow-duration curves for water years 1970-80 and the June through November periods 1970-80, Fahka Union Canal near Copeland site 23. *
000
100
10
1.0 I i I_ m o o
120 DAY
30 DAY
intv
O in
o o
RECURRENCE INTERVAL. IN YEARS
Figure 53. Frequency curves for the indicated number of consecutive days, June through November 1970-80, Fahka Union Canal near Copeland, site 23.
64

Henderson Creek Canal near Naples, Site 24
The Henderson Creek Canal in western Collier County flows south 7 miles from the main stem of the Golden Gate Canal into the Hen derson Creek estuary (fig. 49). Flow is uncontrolled, except for a structure at the Everglades Parkway. During peak rainy periods, the Henderson Creek Canal may receive some discharge from the Golden Gate Canal (McCoy, 1972, p. 12).
The gaging station is 3.8 miles south of the Everglades Park way, 5 feet downstream of a private bridge, and about 6 miles south east of Naples. Mean daily discharge from October 1969 to Septem ber 1980 was 24.5 ft^/s. The maximum and minimum daily discharges were 353 and 0.0 ft-Vs, respectively. Table 2 shows the greatest percentage of discharge for the 1970-80 water years occurred during June through October. Mean daily discharge for June through Octo ber 1970-80 was 46.3 ft-Vs. The maximum and minimum daily dis charges for the high-flow period were 353 and 0.0 ft-Vs, respec tively. The following table lists the number of no-flow days in each June through October period:
_____________June - October periods_____________ __________1970 1971 1972 1973 1974 1975 1976 1977 1978 1979 1980
Number of 0002 10 002000 no-flow days._________________________________________________________
Figure 54 shows flow-duration data for the 11 water years and the 11 June through October periods. Tables 3 and 4 list the flow- duration data for the water years and the June through October pe riods, respectively.
The following table shows the lowest mean discharge (in cubic feet per second) for selected periods of consecutive days in each June through October period for Henderson Creek Canal near Naples:
Number of consecutive ____________June - October periods
days
306090
120
1970
37424350
1971
4.2162938
1972
26293842
1973
3.5145554
1974
16384748
1975
15465562
1976
19252944
1977
18477489
1978
22425758
1979
5.28.2
1319
1980
3.8101725
Figure 55 shows frequency curves based on the above data.
65

DISCHARGE,IN CUBIC
FEET PER SECOND
o
b(-
52
0.0
0
(b
(b
C*
t-1
05
fD
fD
« 05
tn
« c_«
\j
\C
co
3
IH
. fD
I
rr
^*j
fD
rr
r-j3*
fD
4>
O
C
C
fD00
3
3*
O
O
O
oIT
C
O
i-Jcr
<fD
fD
"-J
CO
o I rr
00
3-
o n
>
0)
(X3
H.
o. o
fD
(U"I
cr
CO
0)o
a3 o
c*
3a>
crro
re
o
oCD
hh
3
01
OH
- O 3
3
»
fD
fD
0>
O
"I
C rr
DISCHARGE,IN CUBIC
FEET PER SECOND
o
o1.
01
1.0
5
1.1
I
1.25
10 25 50
10
0
TITT
TI
I I
I M
M
I I
I I 1
11
0.0
1
0
10
p
6o
o
o
o
o
10 20 30 40 50 50 70 80
90 95 98 99
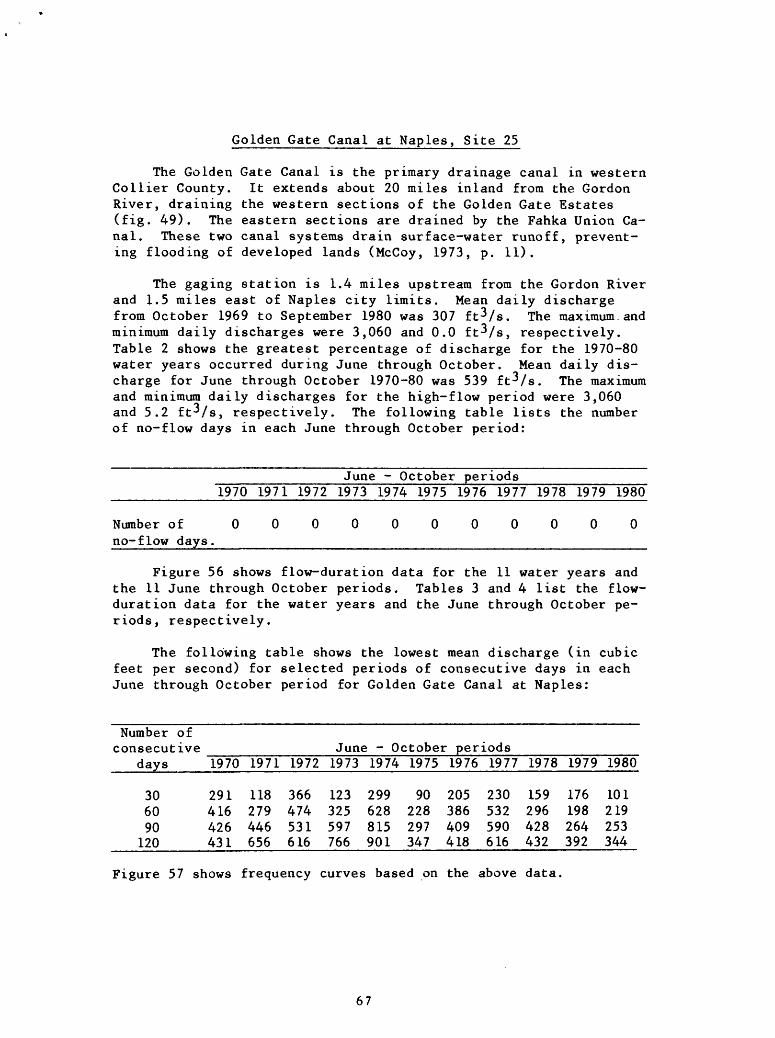
Golden Gate Canal at Naples, Site 25
The Golden Gate Canal is the primary drainage canal in western Collier County. It extends about 20 miles inland from the Gordon River, draining the western sections of the Golden Gate Estates (fig. 49). The eastern sections are drained by the Fahka Union Ca nal. These two canal systems drain surface-water runoff, prevent ing flooding of developed lands (McCoy, 1973, p. 11).
The gaging station is 1.4 miles upstream from the Gordon River and 1.5 miles east of Naples city limits. Mean daily discharge from October 1969 to September 1980 was 307 ft-Vs. The maximum.and minimum daily discharges were 3,060 and 0.0 ft-^/s, respectively. Table 2 shows the greatest percentage of discharge for the 1970-80 water years occurred during June through October. Mean daily dis charge for June through October 1970-80 was 539 ft-Vs. The maximum and minimum daily discharges for the high-flow period were 3,060 and 5.2 ftVs, respectively. The following table lists the number of no-flow days in each June through October period:
____________June - October periods____________ ____________1970 1971 1972 1973 1974 1975 1976 1977 1978 1979 1980
Number of 00000000000
no-flow days._____________________________________________
Figure 56 shows flow-duration data for the 11 water years and the 11 June through October periods. Tables 3 and 4 list the flow- duration data for the water years and the June through October pe riods, respectively.
The following table shows the lowest mean discharge (in cubic feet per second) for selected periods of consecutive days in each June through October period for Golden Gate Canal at Naples:
Number of consecutive _________________June - October periods__________________
days 1970 1971 1972 1973 1974 1975 1976 1977 1978 1979 1980
30 291 118 366 123 299 90 205 230 159 176 10160 416 279 474 325 628 228 386 532 296 198 21990 426 446 531 597 815 297 409 590 428 264 253120____431 656 616 766 901 347 418 616 432 392 344
Figure 57 shows frequency curves based on the above data.
67

O OMCO
&W CM
H H W
MPQ
Mw" C)
O CO
10,000
1000
100
10
1.0
0.10
"I ==
JUNE OCTOBER
o owCO
wPH
H W W
OM
O
S3
COM Q
oo o o o o o o OJ rO ^- 10 «D
O 00
o 0>
in oo en en
PERCENTAGE OF TIME DISCHARGE WAS EQUALED OR EXCEEDED
Figure 56. Flow-duration curves for water years 1970-80 and the June through October periods 1970-80, Golden Gate Canal at Naples, site 25.
I 000
100
10
I I
120 DAY
90 DAY
60 DAY
30 DAY
_ m _ m O O cvj
m cvi
Om
Oo
RECURRENCE INTERVAL,IN YEARS
Figure 57. Frequency curves for the indicated number of consecutive days, June through October 1970-80, Golden Gate Canal at Naples, site 25.
68

Cocohatchee River Canal at Willoughby Acre Bridge, Site 26
The Cocohatchee River Canal is the northernmost outlet for the Gulf American Corporation (GAG) Canal system. It drains most of the area southwest of Lake Trafford, and during peak wet periods aids drainage of the Golden Gate area. Water from the Cocohatchee River Canal discharges into the Cocohatchee River estuary and ulti mately flows into the Gulf of Mexico by way of Wiggins Pass (fig. 49).
The gaging station is on the downstream side of the center of the Willoughby Acre Bridge, 2.3 miles east of the intersection of U.S. Highway 41 and State Highway 846 at Naples Park. Mean daily discharge from October 1969 to September 1980 was 29.3 ft 3 /s. The maximum and minimum daily discharges were 454 and 0.0 ft^/s, re spectively. Table 2 shows the greatest percentage of discharge for the 1970-80 water years occurred during July through October. Mean daily discharge for July through October 1970-80 was 67.0 ft^/s. The maximum and minimum daily discharges for the high-flow period were 454 and 3.0 ft-vs, respectively. The following table lists the number of no-flow days in each July through October period:
_____________July - October periods_____________ __________1970 1971 1972 1973 1974 1975 1976 1977 1978 1979 1980
Number of 00000000000
no-flow days._____________________________________________
Figure 58 shows flow-duration data for the 11 water years and the 11 July through October periods. Tables 3 and 4 list the flow- duration data for the water years and the July through October pe riods, respectively.
The following table shows the lowest mean discharge (in cubic feet per second) for selected periods of consecutive days in each July through October period for Cocohatchee River Canal at Wil loughby Acre Bridge:
Number of consecutive July - October periods
days
306090120
1970
16284539
1971
30528588
1972
27354947
1973
24125182149
1974
1977110129
1975
14303938
1976
18262630
1977
26405852
1978
9.2357370
1979
5.07.2
3347
1980
14265354
Figure 59 shows frequency curves based on the above data.
69

8pa CO
H pa
u
uCOM Q
1000
100
10
1.0
0.109-0 oo- o o o o o o o
<M ro ^- m <o r^o00
m oo en
o> en
PERCENTAGE OF TIME DISCHARGE WAS EQUALED OR EXCEEDED
Figure 58. Flow-duration curves for water years 1970-80 and the July through October periods 1970-80, Cocohatchee River Canal at fcilloughby Acre Bridge, site 26.
000
wCO
W
CJMPQ
M
CO M Q
100
10
= r
90 DAY
50 DAY
30 DAY
in O o- If)CM
toCO
oin O O
RECURRENCE INTERVAL,IN YEARS
Figure 59 . Frequency curves for the indicated number of consecutive days, July through October 1970-80, Cocohatchee River Canal at Willoughby Acre Bridge, site 26.
70

Caloosahatchee River at S-79 near Olga, Site 27
The Caloosahatchee, River flows from spillway and lock S-77 at Lake Okeechobee near Moore Haven along southern Glades and north western Hendry Counties towards the Gulf of Mexico (fig. 1). Flow is regulated by control structures 77 (S-77) and 78 (S-78) at Moore Haven and Ortona, respectively (fig. l), and by salinity-control structure 79 (S-79) at Olga about 15 miles east of Fort Myers (fig. 60).
The gaging station is in the control house of S-79 at the southeast end of the lock and S-79, 1.2 miles east of Olga. Mean daily discharge from October 1969 to September 1980 was 1,405 ft^/s, The maximum and minimum daily discharges were 21,400 and 1.5 ft^/s, respectively. Table 2 shows the greatest percentage of discharge for the 1970-80 water years occurred during June through October. Mean daily discharge for June through October 1970-80 was 1,730 ft^/s. The maximum and minimum daily discharges for the high-flow period were 15,100 and 2.4 ft-Vs, respectively. The following table lists the number of no-flow days in each June through October period:
_____________June - October periods___________' __________1970 1971 1972 1973 1974 1975 1976 1977 1978 1979 1980
Number of 00000000000
no-flow days._____________________________________________
Figure 61 shows flow-duration data for the 11 water years and the 11 June through October periods. Tables 3 and 4 list the flow- duration data for the water years and the June through October pe riods, respectively.
The following table shows the lowest mean discharge (in cubic feet per second) for selected periods of consecutive days in each June through October period for Caloosahatchee River at S-79 near Olga:
Number of consecutive _____________June - October periods
days
306090
120
1970
439540860
2,050
1971
274639783
1,200
1972
87210225236
1973
5481,0901,5801,830
1974
2492,6305,2905,780
1975
6541,1001,0701,270
1976
139610949899
1977
67540 1896 2911 2
1978
633,190,160,110
1979
157225289
1,170
1980
167471717937
Figure 62 shows frequency curves based on the above data.
71
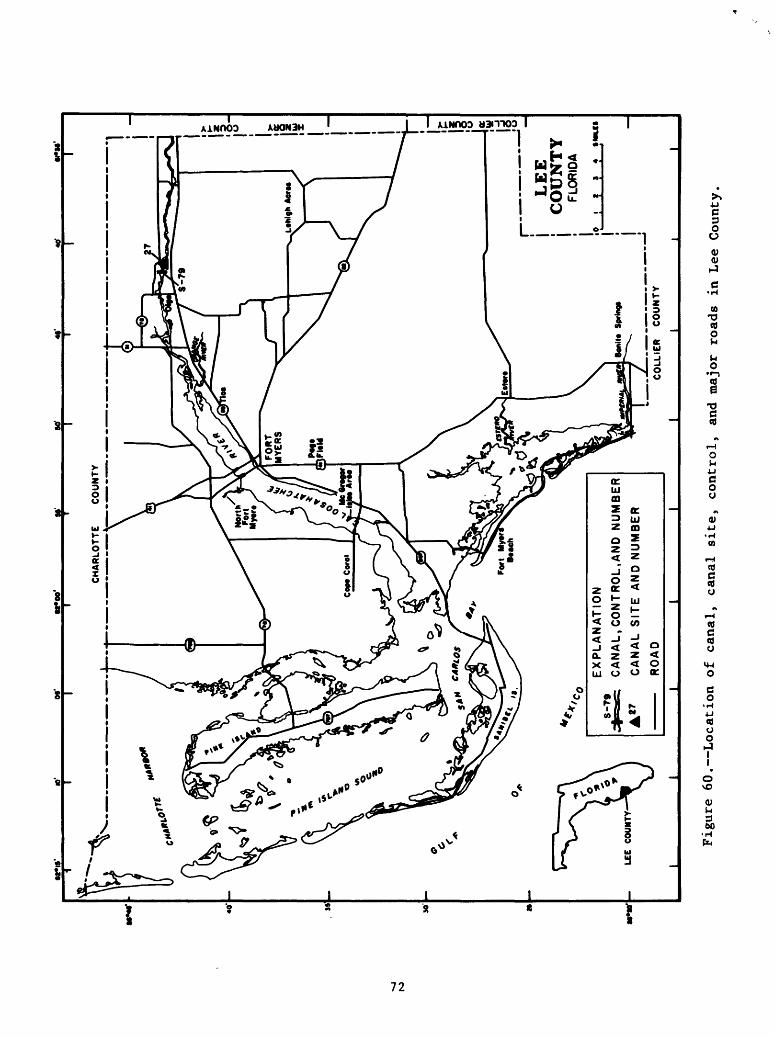
OS'
tt*0
0*
to
CH
AR
LO
TT
E
CO
UN
TY
LE
E
CO
UN
TY
EX
PL
AN
AT
ION
CA
NA
L,
CO
NT
RO
L,A
ND
N
UM
BE
R
CA
NA
L S
ITE
A
ND
N
UM
BE
R
RO
AD
i
LEE
COUN
TY
CO
LL
IER
C
OU
NT
Y
I
o i
t s
4 »*
«>.«
Figure 60.--Location
of canal, ca
nal
site
, co
ntro
l, and
major
road
s in
Lee
County.

o owC/i
w p-lHWw
PQ P O
gA
w
O C/i
100,000
10,000
I 000
100
10
o owen
w P-.H W W
PQ
6
O
O CO
WATER YEARS
JUNE OCTOBER
- oO-o
o o - o o o o o o o (\J lO if if) «3 h-
o00
o o>
COo>
PERCENTAGE OF TIME DISCHARGE WAS EQUALED OR EXCEEDED
Figure 61. Flow-duration curves for water years 1970-80 and the June through October periods 1970-80, Caloosahatchee River at S-79 near Olga, site 27.
10,000 r=
000
100
10
DAY
90 DAY
60 DAY
30 DAY
_ in o o
in(M
If) CVJ
O If)
O O
RECURRENCE INTERVAL,IN YEARS
Figure 62. Frequency curves for the indicated number of consecutive days, June through October 1970-80, Caloosahatchee River at S-79 near Olga, site 27.
73

SUMMARY AND CONCLUSIONS
As south Florida's population increases, so will the demand for additional sources of freshwater. One method of augmenting ex isting freshwater supplies may be by injection into suitable aqui fers of surplus freshwater when available. A major requirement of this method is a reliable supply of freshwater for injection. A potential source of freshwater for injection is surplus surface wa ter discharged from canals and rivers to the ocean during high-flow periods (usually during wet periods).
Analyses of discharge data for the 1970-81 water years at 27 canal and river sites show that canal discharge as high as 660 cubic feet per second occurred 70 percent of the time during the high-flow period at one site (Tamiami Canal outlets, Levee 67A to 40-Mile Bend). At 11 other sites, discharges of 110 to 370 cubic feet per second occurred 70 percent of the time during the high- flow periods, while at 9 sites, discharges of 21 to 100 cubic feet per second occurred 70 percent of the time during the high-flow periods. At other sites (those in the Biscayne, Plantation Road, Middle River, C-lll, and Cypress Creek Canals), discharges of 0.1 cubic foot per second occurred 70 percent of the time during the high-flow periods.
Criteria for amounts of surplus freshwater considered adequate to support injection systems cannot be established, as they would vary greatly with water needs to be satisfied and with the effi ciency of a particular injection system. However, based upon this analysis of discharge at 27 canal and river sites throughout south Florida, it appears that substantial amounts of surface water are potentially available for subsurface injection and storage.
SELECTED REFERENCES
McCoy, H. J., 1962, Ground-water resources of Collier County,Florida: Florida Geological Survey Report of Investigations no. 31, 82 p.
1972, Hydrology of western Collier County, Florida: Florida Bureau of Geology Report of Investigations no. 63, 32 p.
1973, Summary of hydrologic conditions in Collier County, Florida, 1972: U.S. Geological Survey open-file report FL-73022, 118 p.
Merritt, M. L. , 1983, Subsurface storage of freshwater in south Florida: A digital model analysis of recoverability: U.S. Geological Survey Open-File Report 83-536, 73 p.
Merritt, M. L. , Meyer, F. W., Sonntag, W. H., and Fitzpatrick,D. J., 1983, Subsurface storage of freshwater in south Florida: A prospectus: U.S. Geological Survey Water Resources Investi gations 83-4214, 69 p.
74
Meyer, F. W. , 1972, Preliminary evaluation of infiltration from the Miami Canal to well fields in the Miami Springs-Hialeah area, Dade County, Florida: U.S. Geological Survey open-file report FL-72027, 85 p.
Parker, G. G., Ferguson, G. E., and Love, S. K., 1955, Water resources of southeastern Florida: U.S. Geological Survey Water-Supply Paper 1255, 965 p.
Sherwood, C. B., McCoy, H. J., and Galliher, C. F., 1973, Water re sources of Broward County, Florida: Florida Bureau of Geology Report of Investigations no. 65, 141 p.
Swayze, L. J., and McPherson, B. F., 1977, The effect of the Fahka Union Canal system on water levels in the Fahkahatchee Strand, Collier County, Florida: U.S. Geological Survey Water-Resources Investigations 77-61, 26 p.
U.S. Geological Survey, 1972, Water resources data for Florida, 1970, Part I, Surface water records, 202 p.
1973, Water resources data for Florida, 1971, Part I, Surface water records, 234 p.
1974a, Water resources data for Florida, 1972, Part I, Surface water records, 229 p.
1974b, Water resources data for Florida, 1973, Part I, Surface water records, 237 p.
1975, Water resources data for Florida, 1974, Part I, Surface water records, 241 p.
1976, Water resources data for Florida, water year 1975, v. 2, southern Florida: U.S. Geological Survey Water-Data Report FL-75-2, 770 p.
1977, Water resources data for Florida, 1977, Water resources data for Florida, water year 1976, v. 2, south Florida: U.S. Geological Survey Water-Data Report FL-76-2, 634 p.
1978, Water resources data for Florida, water year 1977,v. 2A, southern Florida: U.S. Geological Survey Water-Data Report FL-77-2A, 662 p.
1979, Water resources data for Florida, water year 1978,v. 2A1, south Florida surface water: U.S. Geological Survey Water-Data Report FL-78-2A1, 293 p.
1980, Water resources data for Florida, water year 1979,v. 2A, south Florida surface water: U.S. Geological Survey Water-Data Report FL-79-2A, 688 p.
1981, Water resources data for Florida, water year 1980,v. 2A, south Florida surface water: U.S. Geological Survey Water-Data Report FL-80-2A, 564 p.
75