by using an enzymatic approacht - applied and environmental
TRANSCRIPT

Vol. 57, No. 12
Measurement of Acetate Concentrations in Marine Pore Watersby Using an Enzymatic Approacht
GARY M. KING
Darling Marine Center, University of Maine, Walpole, Maine 04573
Received 10 May 1991/Accepted 16 September 1991
Acetate concentrations in marine and freshwater matrices were measured by an enzymatic technique whichcoupled the synthesis of acetyl coenzyme A to AMP production. The resulting AMP was assayed by a sensitiveand relatively rapid high-pressure liquid chromatography method, using an aqueous, isocratic mobile phase forelution. The method was insensitive to the presence of seawater salts and required no sample prepurificationor distillation. Propionate caused a minor, but statistically insignificant, interference when equimolar withacetate; butyrate caused no interference, even at relatively high concentrations. Detection limits for acetatewere approximately 100 nM with a precision of about 5%. Pore waters from two intertidal sediments containedapproximately 1 to 12 ,iM acetate; the concentrations were linearly but inversely correlated with porewatersulfate.
Acetate is a key intermediate during anaerobic degrada-tion of organic matter (34). In mixed cultures as well as
natural systems, acetate is produced during the fermentationof saccharideg, amino acids, nucleic acids, and lipids, par-ticularly when interspecies hydrogen transfer to either meth-anogenic or sulfidogenic bacteria results in low hydrogenpartial pressures (e.g., see references 17, 20, and 34). Thesignificance of acetate as a fermentation end product and asa carbon source for sulfate reduction and methanogenesishas been documented for sludge digestors and various fresh-water and marine sediments among other systems (e.g., see
references 18-20, 29, 30, and 35).However, while the significance of acetate is undisputed,
the analysis of its concentrations remains problematic. Thelow micromolar concentrations in surface waters and sedi-ments are particularly troublesome. Gas chromatographic(GC) methods have been applied successfully to sampleswith relatively high concentrations, even in difficult matricessuch as sludge (e.g., see references 10 and 12). For salinesamples with low acetate concentrations, GC procedures aremore difficult, often requiring time-consuming purificationand concentration steps (1, 8, 27). Even then, analyticalprecision can be less than desirable. High-pressure liquidchromatographic (HPLC) methods provide alternative ap-proaches, particularly when coupled with conductivity de-tection. Relatively high sensitivity and improved precisionfacilitate the analysis of low concentrations, although pre-
purification steps are still recommended (24, 29).I report here an alternative, enzymatic method for deter-
mining acetate concentrations in both marine pore watersand freshwater samples. The method is based on the reactionof acetate with acetyl coenzyme A (CoA) synthase accordingto the following stoichiometry:
acetyl CoA synthaseacetate + ATP + CoA o acetyl CoA + AMP + PP
The reaction produces AMP, which can be determined byHPLC with a high degree of precision and low detectionlimits. Since enzymes that form AMP instead of ADP fromATP are relatively uncommon, problems with nonspecific
t Contribution 236 from the Darling Marine Center.
interferences are mninimized. The method is simple, requiringno sample purification or concentration, and works equallywell in ionic and nonionic matrices, thus eliminating thedistillations used for other methods and the necessity formodifying sample matrix composition (8, 24). Precision isvery good, and detection limits are submicromolar. In addi-tion, the enzyme reaction goes to completion rapidly (1l h),while the subsequent HPLC procedure is rapid, using onlyan aqueous mobile phase, isocratic elution, and detection ofA260.
MATERIALS AND METHODS
Sample collection. Pore waters for acetate analysis werecollected from two sites, Lowes Cove and Cod Cove, Maine.The organic-poor sediments of the former have been de-scribed in detail elsewhere (e.g., see references 15, 18, and22). The latter site, characterized by a high sedimentationrate, an extensive salt marsh, and organic-rich, sulfidicsediments (unpublished observations), was formerly an openmudfiat that has become a mixed marsh-mudflat system (seeBelknap et al. [4] for a description of the recent sedimento-logical and geological history). Sediments from both siteswere collected with 6.2-cm-inner-diameter acrylic coretubes. At Cod Cove, sediments were collected from an openarea within the marsh; these sediments and those fromLowes Cove were devoid of plant roots. Cores were re-
turned to the laboratory and sectioned at approximately2-cm intervals. The sections were placed into centrifugetubes that were capped afterward. Pore water was obtainedafter centrifugation at a maximum of about 12,000 x g for 10min at 4°C (see Shaw and McIntosh [29] for a discussion ofpossible uncertainties due to methods of porewater collec-tion). No precautions were taken to limit exposure to theatmosphere. The pore waters were subsequently filteredthrough glass fiber filters (Whatman GF/C) that had beenincubated in a muffle oven for >3 h at 550°C. Triplicatesamples for each depth interval were stored frozen in dis-posable polypropylene screw-cap vials until further process-ing.
Acetate analysis. The following stock solutions were pre-pared in distilled deionized water: acetyl CoA synthase, 20U ml-1 (approximately 6 U mg of protein-1); CoA, 10 mM
3476
APPLIED AND ENVIRONMENTAL MICROBIOLOGY, Dec. 1991, p. 3476-34810099-2240/91/123476-06$02.00/0Copyright © 1991, American Society for Microbiology
Dow
nloa
ded
from
http
s://j
ourn
als.
asm
.org
/jour
nal/a
em o
n 26
Jan
uary
202
2 by
164
.70.
243.
47.

ACETATE CONCENTRATIONS IN PORE WATERS 3477
(sodium salt, from yeast); disodium ATP, 10 mM; bovineserum albumin (BSA), 200 ,Ig ml-'. Acetyl CoA synthasewas used as received without further processing. All glass-ware was washed extensively and then heated at 500°C for 3h prior to use. Stock solutions of ATP and BSA were storedfrozen after initial preparation and were stable for months.Acetyl CoA and acetyl CoA synthase were prepared involumes necessary for anticipated sample processing duringa period of about 4 weeks; the solutions were stored frozenin 1.5-ml polypropylene centrifuge tubes and repeatedlythawed and refrozen with no apparent loss of activity.For routine analysis, 10 [lI of each of the above solutions
was added to 1.0 ml of the desired sample matrix containedin a disposable 7-ml screw-cap polypropylene vial, resultingin final concentrations of 100 ,uM for ATP and CoA. The vialcontents were mixed by shaking and then incubated for 1 hat 37°C. Acetyl CoA synthase activity was terminated byimmersing samples in a boiling water bath for 2 min. Theefficacy of this procedure was determined by examining thefollowing parameters with acetate standards (2 to 10 ,uM)prepared in filtered (0.2-,um pore size) artificial seawater(FASW): (i) stability of ATP in the presence of acetyl CoAsynthase but no added CoA; (ii) the stability to boiling (5min) of AMP and ATP in FASW; (iii) the stability to boiling(1 to 5 min) of acetyl CoA synthase; (iv) the effect ofincubation time at 37°C; (v) the effect of incubation temper-ature (23.5, 37, and 50°C); (vi) the effect of matrix pH (6.0 to9.0) at 37°C; (vi) the effect of ionic strength (10 jiM acetatestandards in distilled deionized water versus FASW); (vii)interference from propionate and butyrate (5 and about 100,uM, respectively, versus 5 p.M acetate). Sample blanks wereevaluated by adding heat-inactivated acetyl CoA synthase orby deleting CoA. In addition, the volumes of each of theadded reagents were increased from 10 jil (in 10-jil incre-ments) to 40 ,u1 in a factorial experiment designed to evaluatereagent contamination. Each of these optimization assayswas run in triplicate. The precision of the method wasestimated by using the routine conditions for quadruplicateacetate standards in FASW at 0.2 and 2.0 p.M. The limit ofquantitation was calculated as three times the standarddeviation of the blank value.Pore waters were assayed under the routine conditions
noted above and by direct injection into the HPLC systemdescribed below. The latter analysis was necessary to deter-mine whether AMP occurred at observable concentrations inthe sample matrix prior to addition of acetyl CoA synthase.The relationship between AMP production and acetate con-centration was determined by two methods: (i) pore waterswere assayed before and after addition of a known concen-tration of acetate; (ii) a standard curve (0.1 to 8 jiM) wasgenerated by adding acetate to a batch of pore waterprepared by mixing equal volumes from all available depths.Triplicate samples were typically analyzed for standardiza-tion and for each interval of the sediment depth profile.Chromatography. AMP concentrations were determined
by injecting samples, using a Rheodyne 7125 injection valvefitted with a 20-,ul sample loop. The loop was filled com-pletely by inserting a syringe and needle into the needle portof the injector and pulling a volume of 100 to 200 p.1 througha short length of Teflon tubing attached to port six of thevalve. After injection, a small volume of mobile phase wasused to rinse the injector according to the manufacturer'sinstructions. This procedure eliminated cross-contaminationor ghosting due to the propensity of AMP to adsorb tostainless steel (metal-free injectors offer another solution).AMP was eluted from an analytical column (25 cm by 4.6
ATP, ADP
AMP, 6.9 min
Stanrt
FIG. 1. Typical chromatogram of a marine pore water after theacetyl CoA synthase reaction. Operating and sample reaction con-ditions are given in the text. ATP and ADP peaks are not wellresolved because of the high concentration of added ATP (100 ,uM).The AMP response is for a 1 ,uM concentration.
mm; LC-18-T; Supelco, Inc.) with a mobile phase of 0.1 Mpotassium phosphate (pH 6.0) under isocratic conditions at35°C with a flow rate of 1.0 ml min-' delivered by a solventpump (Rabbit HP; Rainin Instruments, Inc.). Lower temper-atures were acceptable but resulted in longer retention timesand poorer peak geometries. The analytical column was
protected with a Brownlee guard column cartridge (RP-18, 2cm by 4.6 mm). AMP was detected by monitoring either A254or A260 by using a variable-wavelength detector (Spectroflow757; Kratos Analytical Instruments, Inc.) operated at maxi-mum sensitivity (0.005 absorbance unit full scale). Thedetector response was analyzed with a recording integrator(HP 3390A or 3396A; Hewlett-Packard, Inc.) and calibratedwith AMP or by the addition of known concentrations ofacetate to the enzyme reaction mixture.
Other analyses. The HPLC detector output was standard-ized by using AMP at concentrations from 0.05 to 16 jiM;precision was evaluated at 0.2, 2, and 16 p.M. Sulfate,salinity, and pH in the porewater samples were assayed byusing a turbidimetric method (31), a refractometer, and an
ion analyzer (Beckman Instruments, Inc.), respectively.Statistical analyses were based on a microcomputer softwarepackage, Statview SE.
All reagents used for the enzymatic reaction were pur-chased from Sigma Chemical Co. Other chemicals andsolvents were of reagent grade quality or better and pur-chased from various commercial sources.
RESULTS AND DISCUSSION
Preliminary observations indicated that AMP was amena-
ble to a simple and sensitive analysis based on an isocraticelution with a buffered aqueous mobile phase (Fig. 1). AMPwas well separated from other adenylates, and no interfer-ences were observed for natural freshwater or marine ma-
trices relative to standards. Likewise, ionic composition hadno significant effect on adenylate separation (data not
VOL. 57, 1991
Dow
nloa
ded
from
http
s://j
ourn
als.
asm
.org
/jour
nal/a
em o
n 26
Jan
uary
202
2 by
164
.70.
243.
47.

APPL. ENVIRON. MICROBIOL.
shown). Using the operating conditions described earlier,precision (n = 4) was 2.9, 1.0, and 0.1% at 0.2, 2, and 16 ,uMconcentrations, respectively. The limit of quantitation was<0.05 F.M. This limit was determined primarily by thevolume of the sample loop (20 ,ul) and the maximum sensi-tivity of the detector (0.005 absorbance unit full scale), bothof which can be increased if lower detection limits arerequired. Additions of organic modifiers to the mobile phaseappeared to offer little increased chromatographic resolutionor detection.
Preliminary observations also indicated that ATP wasstable in a porewater or FASW matrix in the presence ofacetyl CoA synthase but not acetyl CoA synthase plus CoA.In addition, ATP and AMP were heat stable, with either noor insignificant degradation during boiling for up to 5 min. Incontrast, acetyl CoA synthase activity was lost rapidly after1-ml solutions contained in 7-ml vials were immersed inboiling water. These results suggested that the acetyl CoAsynthase reaction provided a feasible enzymatic approachfor measuring bioavailable acetate concentrations and thatthe key reactant and product, ATP and AMP, were stableunder conditions that facilitated analysis.With an initial acetate concentration of 10 ,uM and an
incubation temperature of 37°C, the synthase reactionreached completion in approximately 45 min. Thus, foranalysis of concentrations of <10 ,uM, 60 min was selectedas a routine incubation time. The time required for comple-tion was, of course, a function of reactant and enzymeconcentrations. Increasing or decreasing the amount ofadded enzyme provided a means for altering predictably thedesired incubation time (data not shown).
Incubation temperature was an important reaction vari-able, with lower AMP production for a given acetate con-centration at both 25 and 50°C. While the decrease at 25°Cwas small (although statistically significant), a more substan-tial decrease was observed at 50°C. As a consequence, allenzymatic incubations were performed at 37°C; lower tem-peratures were deemed suitable with increased incubationtimes or if incubation at elevated temperatures was notfeasible. The pH of the reaction mixture was somewhat lesscritical than incubation temperature over a range from about7.0 to 8.5; at higher or lower values, decreased AMPproduction was observed, especially at pH 6.0.
Since neither 0.01 M bicarbonate, carbonate, 2-(N-mor-pholino)ethanesulfonic acid (MES), N-2-hydroxyethylpiper-azine-N'-2-ethanesulfonic acid (HEPES), nor Tris appearedto adversely affect acetyl CoA synthase activity independentof pH (data not shown), a variety of buffers provide optionsfor sample pH adjustment. Fortunately, this may not benecessary for many marine pore waters. For example, thepore waters from both sites examined in this study variedfrom approximately pH 7.0 to 7.5. This range is typical forsediments not affected significantly by sulfide or metaloxidation (5). Regardless, analysis of sample pH is advisedsince values of less than 6.5 are not uncommon, particularlyin freshwater or salt-marsh sediments, and since significantpH gradients occur as a function of sediment depth (see, forexample, references 11 and 16).
In contrast to the effects of pH and temperature, acetylCoA synthase activity was virtually insensitive to the ionicstrength of the reaction mixture. Identical AMP productionwas observed from 10 p,M acetate standards whether pre-pared in distilled deionized water or FASW. As a result,addition of ionic cofactors was unnecessary for freshwateror marine samples. Moreover, neither deionization nor dis-tillation was necessary to provide a suitable matrix for either
.c
00.0
0
0o
CL.q
4)
(A
1.5 106
1.0 106
5.0 105
0.0 1002
o0)
o 0
Z.+
i iA
2
+ 2a.
FIG. 2. AMP production in FASW containing 5 ,uM acetate only(Control, O); 5 ,uM acetate plus 109 ,uM butyrate (+Buty, 0); 5 ,uMacetate plus 5 ,uM propionate (+Prop [5 ,uM], 13); 5 ,uM acetate plus134 ,uM propionate (+Prop [134 ,uM], *). Each value represents themean of triplicate determinations; error bars are not distinguishable.
the enzymatic reaction or subsequent HPLC. This is aconsiderable advantage relative to the prepurification stepsrecommended (or necessary) for GC analysis of low micro-molar acetate concentrations in marine samples (e.g., seereferences 8 and 25).Although common inorganic solutes had no apparent
effect, the presence of propionate stimulated AMP produc-tion slightly (Fig. 2). However, the molar response forpropionate was substantially lower than that for acetate: 31p,M propionate was equivalent in response to 1 p.M acetate.There was no evidence for AMP production resulting fromlonger-chain fatty acids, e.g., butyrate, even at 109 ,uM.When propionate and acetate were incubated at equimolarconcentrations (e.g., 5 ,uM), there was no statistically signif-icant increase in AMP production relative to acetate only.
Since propionate seldom exceeds or even equals acetateconcentrations in sediments (Table 1), it is unlikely that itwill contribute to >5% uncertainty in the measured acetateconcentration. This level of uncertainty is comparable to thestandard deviations observed for replicate samples of marinepore waters (see below). Of course, in some freshwater orsludge matrices or circumstances in which interspecies hy-drogen transfer is inactive, propionate could accumulate tolevels comparable to those of acetate (e.g., see references12, 17, and 20). However, even if propionate exceeds theacetate concentration by twofold, the resulting error will stillamount to .10%. Since propionate is less difficult to assayby GC than acetate, the potential for interference is readilychecked. Although interference from acrylate was not ex-amined specifically, it is not likely to cause greater interfer-ence than propionate. However, since acrylate might occurat high concentrations in some restricted circumstances(e.g., during rapid hydrolysis of locally high levels of dime-thylsulfoniopropionate), some caution is advised.
Standard curves for acetate in FASW were linear overabout 2 orders of magnitude (Fig. 3), with a detection limit ofabout 0.1 ,uM and a precision of 3.0 and 1.5% at 0.2 and 2.0,uM, respectively (n = 4). Concentrations of >10 ,uM werenot analyzed, but linear responses can be expected assumingthat levels of added ATP and CoA are sufficient and thatincubation times or enzyme concentrations are increased.
3478 KING
Dow
nloa
ded
from
http
s://j
ourn
als.
asm
.org
/jour
nal/a
em o
n 26
Jan
uary
202
2 by
164
.70.
243.
47.
ACETATE CONCENTRATIONS IN PORE WATERS 3479
TABLE 1. Concentrations of acetate and propionate in various sediments and sludgesa
Site location Acetate Propionate Reference(p1M) (pM)
Salt marsh, U.K. 5.3 0.5 Balba and Nedwell (2)Flax Pond salt marsh 15-70 NRb Michelson et al. (23)Limfjord, Denmark 0.1-6 0.1-6 Ansback and Blackburn (1)Santa Barbara Basin 33-471 <0.1 Barcelona (3)Skan Bay, Alaska 1-14 NR Shaw and McIntosh (29)Lowes Cove, Maine 1-3 NR This studyCod Cove, Maine 5-11 NR This studyLoch Eil, Scotland 3-22 NR Parkes and Taylor (24)Cape Lookout Bight 55-660c 1-16 Sansone and Martens (27)Continental slope 10.7-69.0c 1.2-11.4 Sansone and Martens (27Wintergreen Lake 100 14 Lovley and Klug (20)Sludge digestor 400 60 Zinder (35)Sludge digestor 33.956.8d 15.4-31.6 Henderson and Steedman (12)
a All data with the exception of those from this study and references 24 and 29 were based on GC methods. The latter two studies were based on an ionchromatographic technique.
b NR, not reported.c Micromoles per liter of sediment; concentrations based on solvent extraction.d Millimolar.
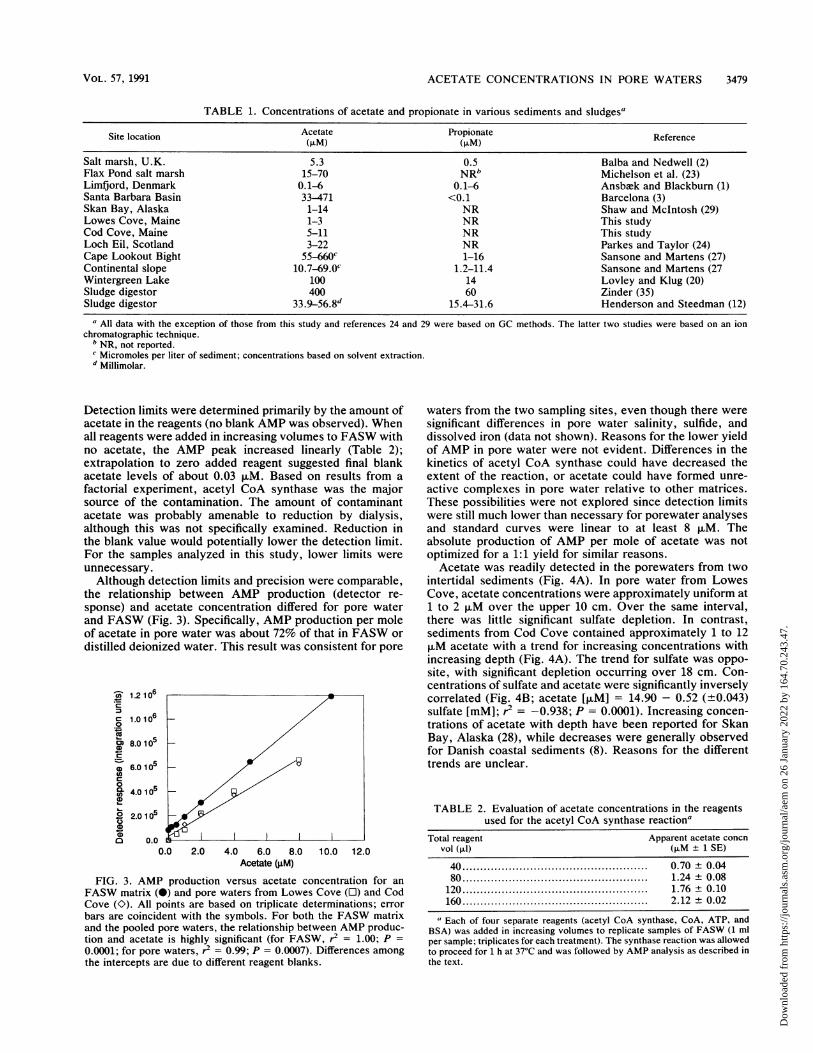
Detection limits were determined primarily by the amount ofacetate in the reagents (no blank AMP was observed). Whenall reagents were added in increasing volumes to FASW withno acetate, the AMP peak increased linearly (Table 2);extrapolation to zero added reagent suggested final blankacetate levels of about 0.03 p.M. Based on results from afactorial experiment, acetyl CoA synthase was the majorsource of the contamination. The amount of contaminantacetate was probably amenable to reduction by dialysis,although this was not specifically examined. Reduction inthe blank value would potentially lower the detection limit.For the samples analyzed in this study, lower limits wereunnecessary.
Although detection limits and precision were comparable,the relationship between AMP production (detector re-sponse) and acetate concentration differed for pore waterand FASW (Fig. 3). Specifically, AMP production per moleof acetate in pore water was about 72% of that in FASW ordistilled deionized water. This result was consistent for pore
r 1.2 10c
O 1.0 10o6
) 8.0 1 05._
X 4.0 105
° 2.0O105c
a)0
PD0o- 2.0o
0.0 2.0 4.0 6.0 8.0 10.0 12.0Acetate (gtM)
FIG. 3. AMP production versus acetate concentration for anFASW matrix (0) and pore waters from Lowes Cove (O) and CodCove (O). All points are based on triplicate determinations; errorbars are coincident with the symbols. For both the FASW matrixand the pooled pore waters, the relationship between AMP produc-tion and acetate is highly significant (for FASW, r = 1.00; P =0.0001; for pore waters, r2 = 0.99; P = 0.0007). Differences amongthe intercepts are due to different reagent blanks.
waters from the two sampling sites, even though there weresignificant differences in pore water salinity, sulfide, anddissolved iron (data not shown). Reasons for the lower yieldof AMP in pore water were not evident. Differences in thekinetics of acetyl CoA synthase could have decreased theextent of the reaction, or acetate could have formed unre-active complexes in pore water relative to other matrices.These possibilities were not explored since detection limitswere still much lower than necessary for porewater analysesand standard curves were linear to at least 8 ,uM. Theabsolute production of AMP per mole of acetate was notoptimized for a 1:1 yield for similar reasons.
Acetate was readily detected in the porewaters from twointertidal sediments (Fig. 4A). In pore water from LowesCove, acetate concentrations were approximately uniform at1 to 2 ,uM over the upper 10 cm. Over the same interval,there was little significant sulfate depletion. In contrast,sediments from Cod Cove contained approximately 1 to 12puM acetate with a trend for increasing concentrations withincreasing depth (Fig. 4A). The trend for sulfate was oppo-site, with significant depletion occurring over 18 cm. Con-centrations of sulfate and acetate were significantly inverselycorrelated (Fig. 4B; acetate [,uM] = 14.90 - 0.52 (±0.043)sulfate [mM]; r2 = -0.938; P = 0.0001). Increasing concen-trations of acetate with depth have been reported for SkanBay, Alaska (28), while decreases were generally observedfor Danish coastal sediments (8). Reasons for the differenttrends are unclear.
TABLE 2. Evaluation of acetate concentrations in the reagentsused for the acetyl CoA synthase reactiona
Total reagent Apparent acetate concnvol (,u1) (p.M + 1 SE)
40 .................................... 0.70 + 0.0480............................... 1.24 + 0.08120 ............................... 1.76 + 0.10160 .................................... 2.12 + 0.02
a Each of four separate reagents (acetyl CoA synthase, CoA, ATP, andBSA) was added in increasing volumes to replicate samples of FASW (1 mlper sample; triplicates for each treatment). The synthase reaction was allowedto proceed for 1 h at 37°C and was followed by AMP analysis as described inthe text.
VOL. 57, 1991
Dow
nloa
ded
from
http
s://j
ourn
als.
asm
.org
/jour
nal/a
em o
n 26
Jan
uary
202
2 by
164
.70.
243.
47.

APPL. ENVIRON. MICROBIOL.
Acetate (gM)A 0°0 2.0 4.0 6.0 8.0 10.0 12.0
A0n n
E
. 1 0
0)0
15
20
B12.010.0
E8.0
X6.0
0< 4.0
2.0
0.0
0.0 5.0 10.0 15.0 20.0 25.0 30.0
Sulfate (mM)
FIG. 4. (A) Concentrations of acetate (E,L) and sulfate (0,0) inpore waters from Lowes Cove (,O) and Cod Cove (0,0). Allpoints are means of triplicate determinations. Coefficients of varia-tion for sulfate in Lowes Cove and Cod Cove are <1.0 and 5.0%,respectively; error bars for acetate are +1 standard error. (B)Correlation between acetate and sulfate concentrations for pooleddata from Lowes Cove and Cod Cove.
The relationship between acetate and sulfate in this studyis also noteworthy because sulfate reduction, the major sinkfor acetate in marine sediments, is not limited at the sulfateconcentrations observed (>5 mM; Boudreau and Westrich[6] report saturation values of about 3 mM for sedimentsfrom Long Island Sound). Thus, the increasing acetate levelscannot be attributed to a substrate-dependent decrease insulfate reduction rates. Other factors, such as decreases inthe biomass of sulfate reducers, decreases in the affinity ofsulfate-reducing bacteria for acetate, or imbalances in therelative rates of acetate production by fermentors and con-
sumption by sulfate-reducing bacteria, must affect the depthprofile. For example, changes in the kinetics of acetate
uptake have been previously invoked to explain acetate
depth profiles in fresh water (21). The changes with depth
have been attributed to transitions from sulfate-reducing to
methanogenic systems. In Cod Cove, changes in affinity maybe linked to seasonal transitions in the depth of the sulfate-reducing zone. During summer, intense sulfate reduction
rates driven by high concentrations of organic matter depletesulfate to micromolar values within 5 to 10 cm (unpublisheddata). This may stabilize relatively low-affinity sulfate-reduc-ing bacteria populations at depths below the permanent
sulfate-reducing zone.
Regardless of the trends with depth, the acetate concen-
trations in Lowes Cove and Cod Cove are among the lowervalues reported for marine sediments (Table 1). The rela-tively low concentrations and variability among replicatessuggest that processing problems as described by Shaw andMcIntosh (29) were minimal. Differences among the concen-trations in this and other studies probably reflect the meth-ods used, with the emphasis here on bioavailable pools, aswell as true variability among sites.The acetate concentrations reported here probably pro-
vide reasonable estimates of the bioavailable pool. Unlikeother HPLC or GC methods, the acetyl CoA synthasetechnique measures only acetate that reacts enzymatically.This would include the free, dissolved pool as well as anyadsorbed pools that equilibrate rapidly with the free pool.Acetate fractions that are kinetically slow to equilibrate orthat require some harsh chemical conditions to desorb boundpools are not measured. These fractions are not bioavailableas defined by their kinetic characteristics, even though theyare detected by other methods. The distinction between thebioavailable pool and total detectable acetate has been madeby others (e.g., see references 1, 8, 25, and 28), who indicatethat about 10 to 80% of the total detectable pool is bioavail-able in marine pore waters. On the other hand, Michelson etal. (23) also provided evidence for a bioavailable fraction butcautioned that artifacts in gel chromatography could lead tounderestimates of its concentration.The significance of the bioavailable fraction is illustrated
by the overestimation of mineralization that results from theuse of total acetate concentrations determined by typical GCor HPLC methods. Ansbek and Blackburn (1), Christensenand Blackburn (8), and Shaw et al. (28) have reported thatacetate mineralization exceeds rates of sulfate reduction orother indices of carbon metabolism measured in parallel (andexpressed on a carbon basis). These results differ markedlyfrom those of Christensen (7), who measured acetate accu-mulation in intact cores after inhibition of sulfate reductionby molybdate. Although Christensen's GC method measurestotal acetate concentrations, the short-term accumulation ofacetate most likely reflected changes in the bioavailablepool. On the basis of the observed accumulation rate,Christensen (7) calculated that acetate oxidation supported65% of sulfate reduction in intact cores. This is consistentwith results from other anoxic systems (e.g., see references20, 27, and 29). However, despite the evidence supporting anunavailable acetate pool, Shaw and McIntosh (29) haveobserved that discrepancies between rates of acetate oxida-tion and other metabolic processes can be attributed toproblems resulting from the method used to collect porewater without the necessity of invoking an unavailable poolof acetate.
In addition to facilitating the analysis of acetate, theHPLC method described here has adequate sensitivity andresolution for determining dissolved or particulate adenylateconcentrations. In fact, ATP, ADP, and AMP have all beenobserved at concentrations up to 100 nM in the pore watersexamined in this study (data not shown). Others havepreviously used the concentrations and dynamics of dis-solved ATP as an indication of heterotrophic activity in thewater column (e.g., see references 13 and 26); similarapplications may be appropriate for sediments (9). Analysisof particulate adenylates for determining biomass is alsofeasible since common extractants such as Tris and bicar-bonate buffers (e.g., see reference 14) do not interfere withthe adenylate chromatography. Given the low adenylatedetection limits possible by monitoring A254 to A260, derivi-tization and fluorescence detection (e.g., see reference 33)
0
H
H
3480 KING
Dow
nloa
ded
from
http
s://j
ourn
als.
asm
.org
/jour
nal/a
em o
n 26
Jan
uary
202
2 by
164
.70.
243.
47.

ACETATE CONCENTRATIONS IN PORE WATERS 3481
may be unnecessary (see also Viarengo et al. [32] for agradient-based absorbance method). Finally, other solutes ofecological interest, including glucose, galactose, gluconate,pyruvate, and succinate, are amenable to analysis by usingsimple modifications (e.g., enzyme substitution, ADP anal-ysis) of the approach described here.
In summary, porewater acetate concentrations are deter-mined by a simple, sensitive enzymatic method subject tofew interferences. Only small volumes and minimal process-ing are required for either freshwater or marine samples; inparticular, prepurification or distillation are unnecessary formarine matricies. The availability of an alternative to abioassay (e.g., see reference 25) should promote a moredetailed understanding of acetate's role in the carbon cycleof marine sediments and a resolution of questions concern-ing bioavailable versus total acetate pools.
ACKNOWLEDGMENTS
I thank two anonymous reviewers and B. F. Taylor for helpfulsuggestions. I also thank T. Pedersen for assistance with theglovebag.
This research was supported by funds from NSF grant OCE-89-00358.
REFERENCES1. Ansbaek, J., and T. H. Blackburn. 1980. A method for the
analysis of acetate turnover in a coastal marine sediment.Microb. Ecol. 5:253-264.
2. Balba, M. T., and D. B. Nedwell. 1982. Microbial metabolism ofacetate, propionate and butyrate in anoxic sediment from theColne Point Saltmarsh, Essex, U.K. J. Gen. Microbiol. 128:1415-1422.
3. Barcelona, M. J. 1980. Dissolved organic carbon and volatilefatty acids in marine sediment pore waters. Geochim. Cosmo-chim. Acta 44:1977-1984.
4. Belknap, D. F., R. C. Shipp, and J. T. Kelley. 1986. Depositionalsetting and quaternary stratigraphy of the Sheepscot Estuary,Maine. Geogr. Phys. Q. 40:55-69.
5. Boudreau, B. P. 1987. A steady-state diagenetic model fordissolved carbonate species and pH in the porewaters of oxicand suboxic sediments. Geochim. Cosmochim. Acta 51:1985-1996.
6. Boudreau, B. P., and J. T. Westrich. 1984. The dependence ofbacterial sulfate reduction on sulfate concentrations in marinesediments. Geochim. Cosmochim. Acta 48:2503-2516.
7. Christensen, D. 1984. Determination of substrates oxidized bysulfate reduction in intact cores of marine sediments. Limnol.Oceanogr. 29:189-192.
8. Christensen, D., and T. H. Blackburn. 1982. Turnover of 14C-labeled acetate in marine sediments. Mar. Biol. 71:113-119.
9. Christensen, J. P., and A. H. Devol. 1980. Adenosine triphos-phate and adenylate energy charge in marine sediments. Mar.Biol. 56:175-182.
10. Collin, D. P., P. G. McCormick, and M. G. Schmitt, Jr. 1974.Quantitative gas-chromatographic determination of short-chainfatty acids in aqueous samples. Clin. Chem. 20:1235-1237.
11. Goodwin, S., and J. G. Zeikus. 1987. Ecophysiological adapta-tions of anaerobic bacteria to low pH: analysis of anaerobicdigestion in acidic bog sediments. AppI. Environ. Microbiol.53:57-64.
12. Henderson, M. H., and T. A. Steedman. 1982. Analysis of C2-C6monocarboxylic acids in aqueous solution using gas chromatog-raphy. J. Chromatogr. 244:337-346.
13. Hodson, R. E., A. E. Maccubbin, and L. R. Pomeroy. 1981.Dissolved adenosine triphosphate utilization by free-living and
attached bacterioplankton. Mar. Biol. 64:43-51.14. Jewson, D. H., and M. Dokulil. 1982. Adenylate energy charge
measurements in freshwater microbial studies. J. Ecol. 70:595-606.
15. King, G. M. 1986. Characterization of glucosidase activity inintertidal marine sediments. Appl. Environ. Microbiol. 51:373-380.
16. King, G. M. 1988. The dynamics of sulfur and sulfate reductionin a South Carolina salt marsh. Limnol. Oceanogr. 33:376-390.
17. King, G. M., and M. J. Klug. 1982. Glucose metabolism insediments of a eutrophic lake: tracer analysis of uptake andproduct formation. Appl. Environ. Microbiol. 44:1308-1317.
18. King, G. M., M. J. Klug, and D. R. Lovley. 1983. Metabolism ofacetate, methanol, and methylated amines in intertidal sedi-ments of Lowes Cove, Maine. Appl. Environ. Microbiol. 45:1848-1853.
19. Laanbroek, J. H., and N. Pfenning. 1981. Oxidation of short-chain fatty acids by sulfate-reducing bacteria in freshwater andmarine sediments. Arch. Microbiol. 128:330-335.
20. Lovley, D. R., and M. J. Klug. 1982. Intermediary metabolism oforganic matter in the sediments of a eutrophic lake. Appl.Environ. Microbiol. 43:522-560.
21. Lovley, D. R., and M. J. Klug. 1986. Model for the distributionof sulfate reduction and methanogenesis in freshwater sedi-ments. Geochim. Cosmochim. Acta 50:11-18.
22. Mayer, L. M. 1989. Extracellular proteolytic activity in sedi-ments of an intertidal mudflat. Limnol. Oceanogr. 34:973-981.
23. Michelson, A. R., M. E. Jacobson, M. I. Scranton, and J. E.Mackin. 1989. Modeling the distribution of acetate in anoxicestuarine sediments. Limnol. Oceanogr. 34:747-757.
24. Parkes, R. J., and J. Taylor. 1983. Analysis of volatile fattyacids by ion-exclusion chromatography, with special referenceto marine pore water. Mar. Biol. 77:113-118.
25. Parkes, R. J., J. Taylor, and D. Jorck-Ramberg. 1984. Demon-stration, using Desulfobacter spp., of two pools of acetate withdifferent biological availabilities in marine pore water. Mar.Biol. 83:271-276.
26. Riemann, B. 1979. The occurrence and ecological importance ofdissolved ATP in fresh water. Freshwater Biol. 9:481-490.
27. Sansone, F. J., and C. S. Martens. 1981. Determination ofvolatile fatty acid turnover rates in organic-rich marine sedi-ments. Mar. Chem. 10:233-247.
28. Shaw, D. G., M. J. Alperin, W. S. Reeburgh, and D. J.McIntosh. 1984. Biogeochemistry of acetate in anoxic sedimentsof Skan Bay, Alaska. Geochim. Cosmochim. Acta 48:1819-1825.
29. Shaw, D. G., and D. J. McIntosh. 1990. Acetate in recent anoxicsediments: direct and indirect measurements of concentrationand turnover rates. Estuarine Coastal Shelf Sci. 31:775-788.
30. S0rensen, J., D. Christensen, and B. B. J0rgensen. 1981. Volatilefatty acids and hydrogen, substrates for sulfate-reducing bacte-ria in anaerobic marine sediment. Appl. Environ. Microbiol.42:5-11.
31. Tabatabai, M. A. 1974. Determination of sulfate in watersamples. Sulphur Inst. J. 10:11-13.
32. Viarengo, A., A. Secondini, P. Scoppa, and M. Orunesu. 1986. Arapid HPLC method for determination of adenylate energycharge. Experientia 42:1234-1235.
33. Walker, G. S., M. F. Covney, M. J. Klug, and R. G. Wetzel.1986. Isocratic HPLC analysis of adenine nucleotides in envi-ronmental samples. J. Microbiol. Methods 5:255-264.
34. Wolin, M. J. 1982. Hydrogen transfer in microbial communities,p. 323-356. In A. T. Bull and J. H. Slater (ed.), Microbialinteractions and communities. Academic Press, Inc., NewYork.
35. Zinder, S. H. 1986. Patterns of carbon flow from glucose tomethane in a thermophilic anaerobic bioreactor. FEMS Micro-biol. Ecol. 38:243-250.
VOL. 57, 1991
Dow
nloa
ded
from
http
s://j
ourn
als.
asm
.org
/jour
nal/a
em o
n 26
Jan
uary
202
2 by
164
.70.
243.
47.