by - u.s. geological survey publications warehouse the area, 3) acoustic vibrations from the vessel,...
TRANSCRIPT

UNITED STATES DEPARTMENT OF THE INTERIOR
GEOLOGICAL SURVEY
SYNTHESIS REPORT: ENVIRONMENTAL GEOLOGY OF LOWER COOK INLET, ALASKA
BY
Monty A. Hampton
U.S. Geological Survey345 Middlefield Road
Menlo Park, California 94025
U.S. Geological Survey Open-File Report 82-197
This report is preliminary andhas not been reviewed for conformity with
U.S. Geological Survey editorial standards.Any use of trade names is for descriptive
purposes only and does not imply endorsementby the U.S. Geological Survey.

INTRODUCTION
Cook Inlet is a large, tidally dominated embayment extending 300 km northeast from the Gulf of Alaska to Anchorage (Fig. 1). From 1976-1979, over 5000 km of seismic reflection profiling lines (Fig. 2) were run in the lower Inlet, which is included in OCS lease area 60. Seismic systems used included 30-160 kilojoule sparker, Uniboom, minisparker, 3.5 kilohertz, 12 kilohertz and side-scanning sonar systems. More than 20 hours of underwater television and 70 mm bottom photography were conducted. Samples of seafloor sediment were collected at 116 stations (Fig. 3, Table 1), mostly using a modified van Veen sampler and a few using a gravity corer and a vibracorer. Profiling current meter readings were also taken at 3 locations.
This report is a synthesis of geologic information of environmental importance to resource activities in lower Cook Inlet.
INSTRUMENTATION AND PROCEDURES
Navigation
Navigational systems consisted of integrated Magnavox satellite-Loran C and Motorola Mini-Ranger units. The data from the integrated system was automatically recorded on magnetic tape, as well as typed out on a keyboard printer. Times and dates were based on Greenwich Mean Time (GMT). Positions were plotted manually on a 1:250,000-scale chart. Dead-reckoning positions based on satellite data, the ship's single-axis speed log and gyro, were computed every two seconds by the integrated system and stored on magnetic tape.
The Mini-Ranger system received its return signals from shore-based transponders positioned at strategic locations. A maximum line-of-sight range over 80 nautical miles was obtained for some transponder locations. The Mini- Ranger was used as the primary navigation system in lower Cook Inlet because of the high frequency and accuracy of the data. Mini-Ranger positions in lower Cook Inlet are probably accurate to within 30 m. Most shore stations were within range limits of the Mini-Ranger system making it convenient to use. LORAN-C was only accurate within small areas of the inlet and signal gaps occurred between adjacent sections.
Seismic Profiling and Visual Format Systems
Sparker; Sparker data were recorded using a Teledyne system, typically at a power of 40 to 80 kilojoules. Seismic signals were received on a Teledyne 100-element, single-channel hydrophone, and the record was printed on a Raytheon model 1900 Precision Recorder. Usually, sweep firing rates were at 2 to 3 seconds. Several different settings were used, but filters generally were adjusted to receive signals between 50 and 200 hertz. Records were annotated at 15-minute intervals with shot-point number, time (Greenwich Mean Time, GMT), and water depth.
Uniboom; The Uniboom system used four EG&G model 234 power sources of 200 joules, each driving hull-mounted plates. The hydrophone was an EG&G
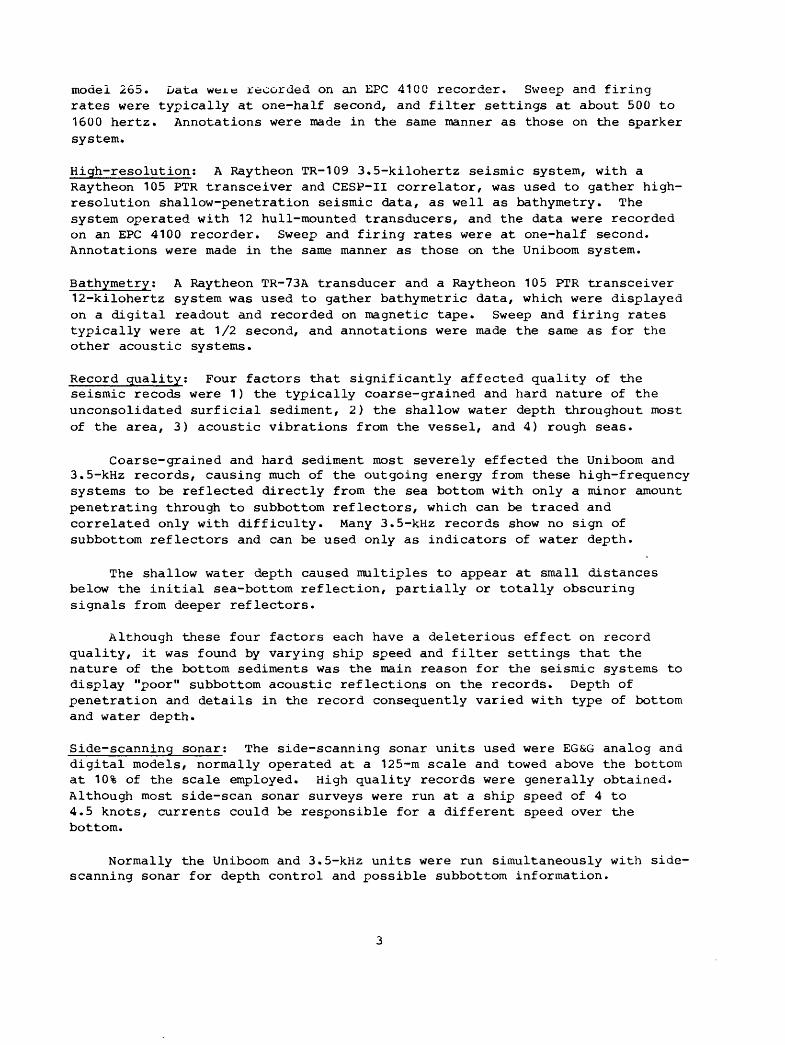
model 265. Data wei.e recorded on an EPC 4100 recorder. Sweep and firing rates were typically at one-half second, and filter settings at about 500 to 1600 hertz. Annotations were made in the same manner as those on the sparker system.
High-resolution; A Raytheon TR-109 3.5-kilohertz seismic system, with a Raytheon 105 PTR transceiver and CESP-II correlator, was used to gather high- resolution shallow-penetration seismic data, as well as bathymetry. The system operated with 12 hull-mounted transducers, and the data were recorded on an EPC 4100 recorder. Sweep and firing rates were at one-half second. Annotations were made in the same manner as those on the Uniboom system.
Bathymetry; A Raytheon TR-73A transducer and a Raytheon 105 PTR transceiver 12-kilohertz system was used to gather bathymetric data, which were displayed on a digital readout and recorded on magnetic tape. Sweep and firing rates typically were at 1/2 second, and annotations were made the same as for the other acoustic systems.
Record quality; Four factors that significantly affected quality of the seismic recods were 1) the typically coarse-grained and hard nature of the unconsolidated surficial sediment, 2) the shallow water depth throughout most of the area, 3) acoustic vibrations from the vessel, and 4) rough seas.
Coarse-grained and hard sediment most severely effected the Uniboom and 3.5-kHz records, causing much of the outgoing energy from these high-frequency systems to be reflected directly from the sea bottom with only a minor amount penetrating through to subbottom reflectors, which can be traced and correlated only with difficulty. Many 3.5-kHz records show no sign of subbottom reflectors and can be used only as indicators of water depth.
The shallow water depth caused multiples to appear at small distances below the initial sea-bottom reflection, partially or totally obscuring signals from deeper reflectors.
Although these four factors each have a deleterious effect on record quality, it was found by varying ship speed and filter settings that the nature of the bottom sediments was the main reason for the seismic systems to display "poor" subbottom acoustic reflections on the records. Depth of penetration and details in the record consequently varied with type of bottom and water depth.
Side-scanning sonar; The side-scanning sonar units used were EG&G analog and digital models, normally operated at a 125-m scale and towed above the bottom at 10% of the scale employed. High quality records were generally obtained. Although most side-scan sonar surveys were run at a ship speed of 4 to 4.5 knots, currents could be responsible for a different speed over the bottom.
Normally the Uniboom and 3.5-kHz units were run simultaneously with side- scanning sonar for depth control and possible subbottom information.

Bottom television and bottom camera: A Hydro Products bottom television unit, underwater mercury lights, and a 70-mm camera were mounted in a large frame. Photographic exposures could be made by remote control by the TV-screen observer. A multiconductor cable, leading to the camera and light, was taped at 5-m intervals to the winch cable.
Sampling Devices
Grab samplers: The normal van Veen grab sampler proved to be too light for adequate sampling of the typically sandy-gravelly bottoms. Generally, successful attempts were obtained with a heavy modified grab sampler designed by Andy Soutar of Scripps Institution of Oceanography.
A four-legged frame housed two vertical rails along which the actual grab could move. The top covers could be opened completely for full access. The addition of weight up to 400 pounds on top of the grab provided sufficient force for the half-round sides to dig into coarse material during the closing operation. When rock fragments got caught between the jaws of the grab, incomplete closure resulted and part or all of the sample was lost. In general the results were good, and this instrument retrieved samples where other devices failed.
Gravity corer; The gravity corer consisted of a 1500-pound weight to which one to three 3-m, 7.6-cm ID steel core barrels were attached. A clear polybutyrate liner was inserted in the barrels, and the sediment was retained by a brass-fingered core catcher.
The cores were cut into 1.5-m sections. Each section was x-rayed and then split lengthwise into working and archive halves. From the working half, samples were taken for grain size and physical properties. The archive half was described and photographed. Both sections were put into storage tubes that were capped, taped, labelled, and stored under refrigeration.
Vibracorer; A Kiel vibracore was used to collect up to 2 m continuous cores in areas with coarse-grained sediment. A gravity core-type barrel was attached to the head of the vibracore along with a clear polybutyrate liner. Penetration normally was less than one meter.
Physical Qceanographic Measurements
Profiling current meter; Vertical profiles of flow speed and direction were obtained with a Hydro-Products model 950-S Savonius rotor-type profiling current meter. This meter system has a field performance accuracy estimated as ±5 cm/sec for current velocity, ±10° for direction, and ±2 m for depth.
Instrumented tripod: Large instrumented bottom tripod systems, GEOPROBEs (Cacchione and Drake, 1979), were deployed at three locations within the study region in July of 1978. Details and results of these experiments are reported elsewhere (Cacchione and others, 1979, 1981). These experiments were designed to gather site-specific bottom boundary layer hydrodynamic and water property data. Two short-term experiments and one long-term experiment were undertaken.

The GEOPROBE system measures flow velocities and flow directions at four levels within one meter of the seafloor (100 cm, 70 cm, 50 cm and 20 cm) using spherical electromagnetic flow sensors. The system also records pressure, temperature, light transmissivity and light scattering at a height of 2 m from the seafloor. A supplemental rotor/vane current meter recorded flow velocities and directions at 1.8 m from the bed.
GEOLOGIC SETTING
Lower Cook Inlet is situated near the convergent margin of the North America and Pacific lithospheric plates. Modern tectonism is evident from the frequent strong earthquakes in the area; 13 events of greater than magnitude 6 have occurred within the lower Cook Inlet area in the last 65 years. The four active volcanoes along the northwest margin of the inlet are further evidence of tectonism (Fig. 1). All but Mt. Douglas have erupted in historic time. The most recent eruption was that of Mt. Augustine in 1976. Clusters of shallow and deep seismicity, with some magnitudes exceeding 6, have been recorded beneath Iliamna, Augustine and Douglas volcanoes (Pulpan and Kiele, 1979).
Basement rocks underlying lower Cook Inlet include Mesozoic and Cenozoic sedimentary rocks in a northeast-trending belt that extends from the Alaska Peninsula and Shelikof Strait to upper Cook Inlet (Fig. 4; see Fisher and Magoon, 1978, Magoon et al., 1979). The Aleutian Range batholith and Bruin Bay fault are major geologic features on the northwest side of the inlet, and the Border Ranges fault on the southwest.
Within the inlet a major fold, the Augustine-Seldovia arch, extends approximately east-west between Augustine Island and Seldovia. Basement rocks both north and south of the arch are folded into large synclines that generally trend northeast.
PHYSICAL OCEANOGRAPHY
Flow of water in lower Cook Inlet has been described in terms of three components: 1) mean currents, 2) low-frequency fluctuations, and 3) tides (Muench et al., 1978; Muench and Schumacher, 1980). Mean flow is driven principally by the baroclinic, westerly flowing Kenai Current (Schumacher and Reed, 1980), which enters lower Cook Inlet through Kennedy and Stevenson Entrances and follows the 100-m isobath in an arcuate, east-to-west path (Fig. 5). Speeds of the mean flow are about 10-15 cm/sec in the summer and about twice this in the winter. Flow derived from fresh-water input to upper Cook Inlet moves southward down the west side of the inlet and merges with the westerly flow near Cape Douglas, producing a strong southerly current there. Mean flow in the remainder of lower Cook Inlet is weak and variable.
Low-frequency fluctuations, with periods on the order of one week, dominate over other non-tidal currents in lower Cook Inlet (Muench and Schumacher, 1980). These currents are thought to be related to atmospheric forcing, in particular local winds and the strong low-pressure systems that move through the Gulf of Alaska in winter. The fluctuations tend to follow the same path as the mean flow.
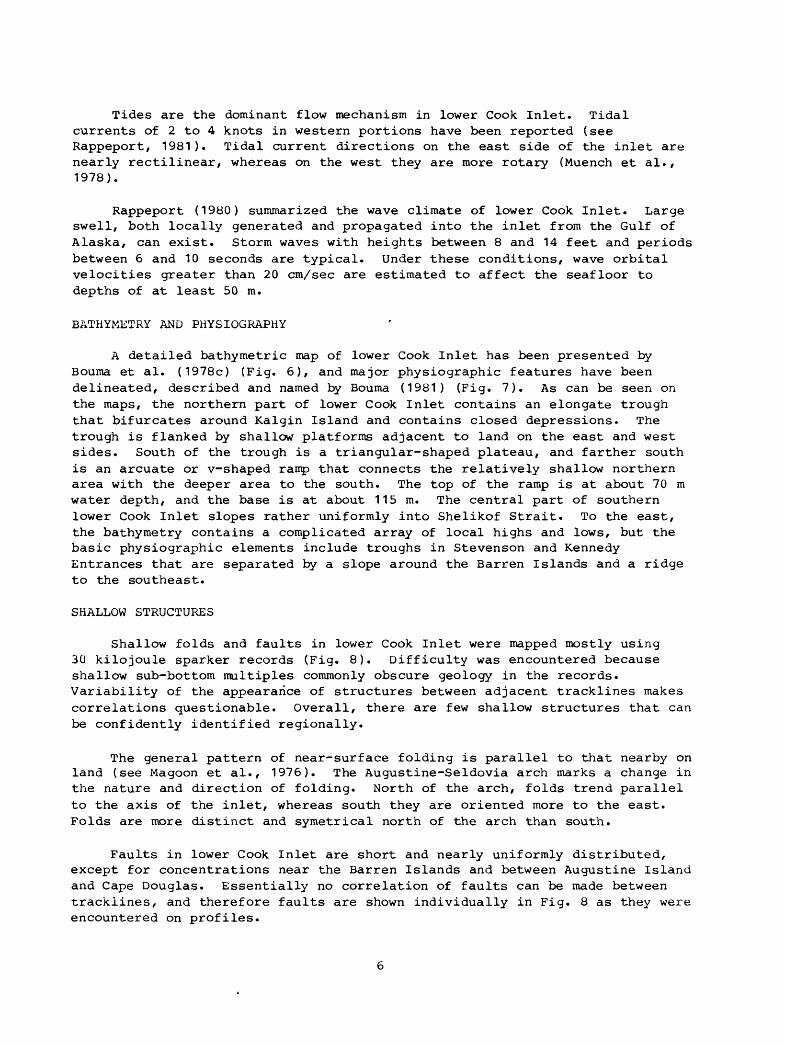
Tides are the dominant flow mechanism in lower Cook Inlet. Tidal currents of 2 to 4 knots in western portions have been reported (see Rappeport, 1981). Tidal current directions on the east side of the inlet are nearly rectilinear, whereas on the west they are more rotary (Muench et al., 1978).
Rappeport (1980) summarized the wave climate of lower Cook Inlet. Large swell, both locally generated and propagated into the inlet from the Gulf of Alaska, can exist. Storm waves with heights between 8 and 14 feet and periods between 6 and 10 seconds are typical. Under these conditions, wave orbital velocities greater than 20 cm/sec are estimated to affect the seafloor to depths of at least 50 m.
BATHYMETRY AND PHYSIOGRAPHY
A detailed bathymetric map of lower Cook Inlet has been presented by Bouma et al. (1978c) (Fig. 6), and major physiographic features have been delineated, described and named by Bouma (1981) (Fig. 7). As can be seen on the maps, the northern part of lower Cook Inlet contains an elongate trough that bifurcates around Kalgin Island and contains closed depressions. The trough is flanked by shallow platforms adjacent to land on the east and west sides. South of the trough is a triangular-shaped plateau, and farther south is an arcuate or v-shaped ramp that connects the relatively shallow northern area with the deeper area to the south. The top of the ramp is at about 70 m water depth, and the base is at about 115 m. The central part of southern lower Cook Inlet slopes rather uniformly into Shelikof Strait. To the east, the bathymetry contains a complicated array of local highs and lows, but the basic physiographic elements include troughs in Stevenson and Kennedy Entrances that are separated by a slope around the Barren Islands and a ridge to the southeast.
SHALLOW STRUCTURES
Shallow folds and faults in lower Cook Inlet were mapped mostly using 30 kilojoule sparker records (Fig. 8). Difficulty was encountered because shallow sub-bottom multiples commonly obscure geology in the records. Variability of the appearance of structures between adjacent tracklines makes correlations questionable. Overall, there are few shallow structures that can be confidently identified regionally.
The general pattern of near-surface folding is parallel to that nearby on land (see Magoon et al., 1976). The Augustine-Seldovia arch marks a change in the nature and direction of folding. North of the arch, folds trend parallel to the axis of the inlet, whereas south they are oriented more to the east. Folds are more distinct and symetrical north of the arch than south.
Faults in lower Cook Inlet are short and nearly uniformly distributed, except for concentrations near the Barren Islands and between Augustine Island and Cape Douglas. Essentially no correlation of faults can be made between tracklines, and therefore faults are shown individually in Fig. 8 as they were encountered on profiles.

Very few faults offset the seafloor where a cover of unconsolidated material exists/ probably because strong currents rapidly erase such features in the non-cohesive sediment. Surface faults mapped in Fig. 8 offset uncon solidated sediment, but they may not reach the seafloor. Subsurface faults offset folded bedrock but not the overlying unconsolidated sediment.
The activity state of faults in lower Cook Inlet is uncertain. Those that offset unconsolidated sediment have moved since Pleistocene time, but their most recent movement is unknown. Recent activity has evidently occurred on the Castle Mountain fault, a short distance northwest of the inlet, as shown by lineations and offset of Pleistocene glacial deposits (Evans et al., 1972). After the 1964 earthquake, Foster and Karlstrom (1967) mapped an extensive zone of ground fissures adjacent to the southeast margin of upper Cook Inlet and suggested that the zone might be underlain by an active fault. Pulpan and Kienle (1979) report some linear shallow seismic trends in Cook Inlet, but no correlations with known faults have been made.
STRATIGRAPHY
Basement rocks underlying lower Cook Inlet have been studied using CDP seismic-reflection data (Fisher and Magoon, 1978). Three major reflectors have been identified, and they have been interpreted as representing unconformities at the base of the Tertiary sequence, at the base of upper Cretaceous rocks, and near the base of upper Jurasic strata. These unconformities separate four cycles of sedimentation and tectonism, occurring in early Mesozoic, late Mesozoic, early Cretaceous, and late Cenozoic time.
Basement rocks are truncated by an erosional unconformity, likely produced by Pleistocene glaciers. Above the unconformity are up to 340 m of Pleistocene and Holocene unconsolidated sediment comprising several basinal features that reflect the geometry of the unconformity (Fig. 9; see Bouma et al., 1978a).
The unconsolidated sedimentary sequence has been divided into four seismic-stratigraphic units by Rappeport (1981). The lowermost unit, up to 75-m thick, is characterized by irregular and discontinuous reflectors in seismic profiles and is interpreted as being composed of unsorted glacial debris (e.g., ground moraine). Overlying this unit is a thin (<3 m) unit thought to be a layer of glacial outwash consisting of poorly sorted coarse gravel and sand. The lower boundary of this unit is a strong reflector, but internally no acoustic structure is seen. Next higher is a unit ranging in thickness to about 20 m and characterized by large sandwaves, both on the seafloor and buried. The sediment type is well-sorted sand with some shells. The uppermost unit, ranging to over 75-m thick, is characterized acoustically by well-defined, continuous horizontal reflectors. The lowest reflectors conform to the underlying surface as draped cover. Rappeport (1981) interprets the unit as glaciomarine, glaciofluvial, or glaciolacustrine sand and silty sand.

SURFICIAL SEDIMENT
Textures and compositions of seafloor sediment samples have been studied in order to define sediment types and to draw conclusions regarding sediment dynamics. This information has environmental applications to engineering foundation design and to prediction of pollutant transport pathways and storage sites.
Textural analysis of surficial sediment shows the area to be dominated by sand- and gravel-size material. Mean grain size generally decreases from north to south (Fig. 10) and shows certain associations with bathymetry and physiography. The most abundant size class is sand (0.0625 - 2 mm). Sediment covering the central areas, including Cook Platform, Cook Trough, Cook Ramp, North Chinitna Platform, and northeast Shelikof Trough, contain greater than 80% in the sand size fraction (Fig. 11).
The greatest amount of gravel size sediment (>2 mm) occurs to the north, in Cook Trough and on its slopes, on North Ninilchik Platform, and on the northern section of North Ninilchik Platform (Fig. 12). Mud sizes (<0.0625 mm) occur largely in the south and along the inlet's borders, including Shelikof Trough, North Barren Ridge, Kennedy Ramp, Chinitna Platform and a small basin west of Anchor Point (Fig. 13).
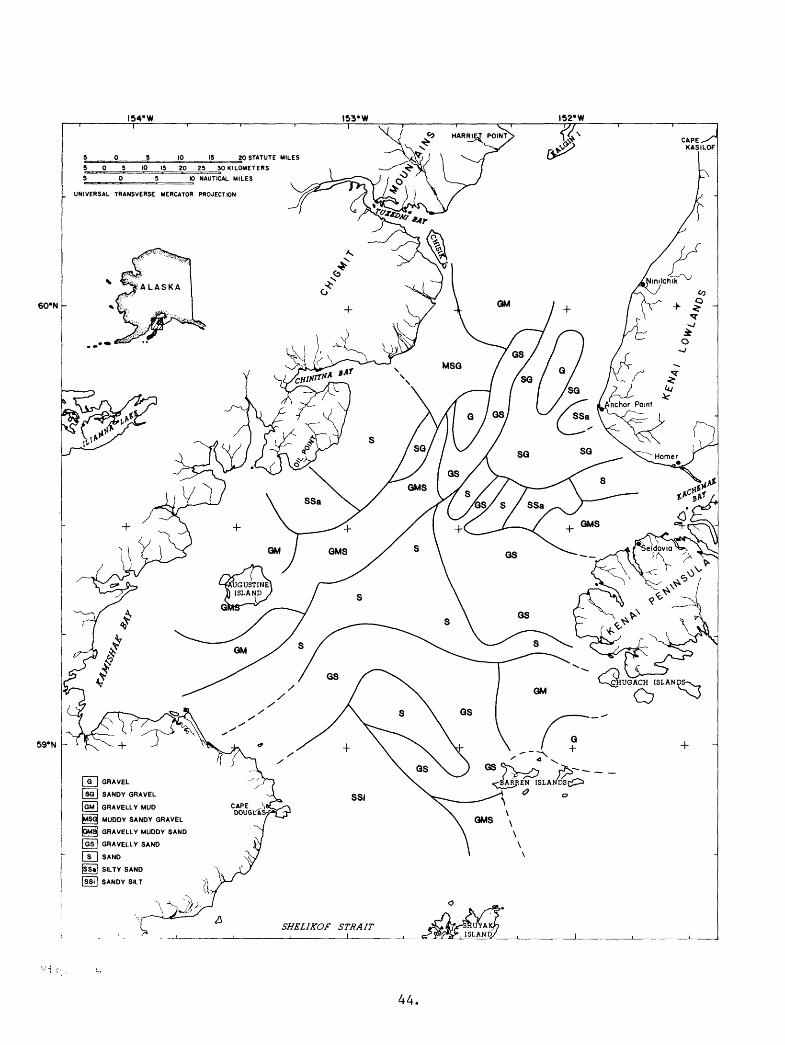
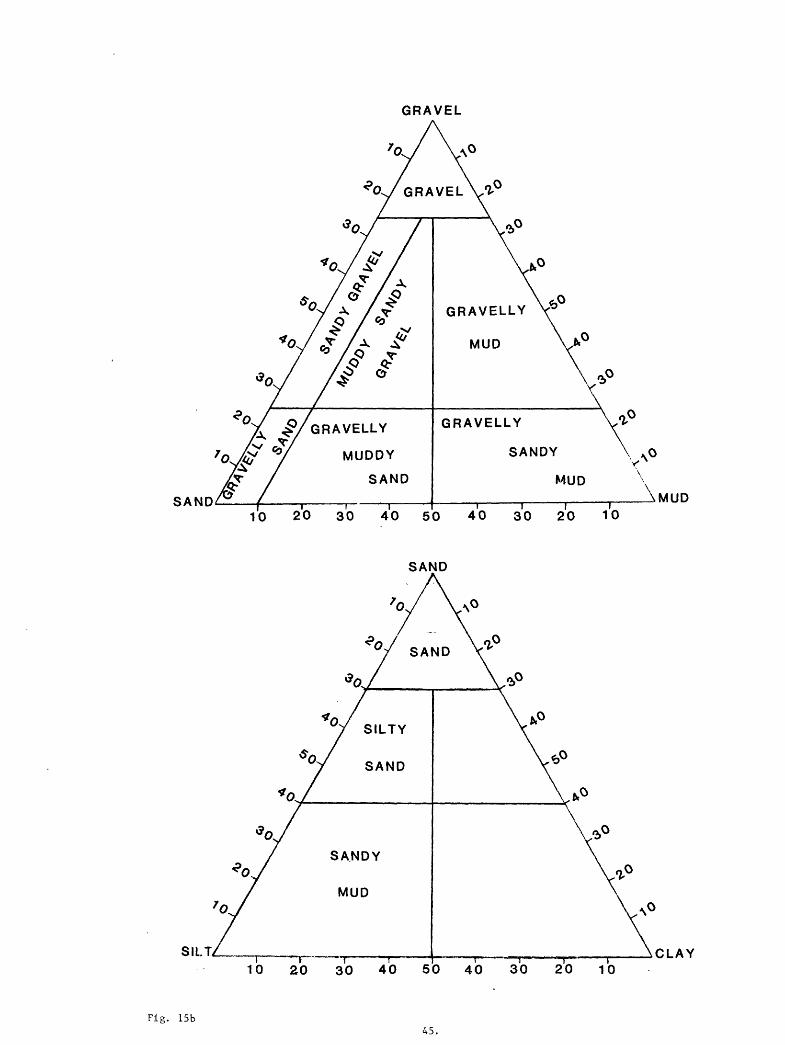
Ternary diagrams of grain size percentages were used to classify sediment types (Fig. 14). Divisions within the diagrams and sediment type names were made to fit natural groupings of our data and are modifications of Shepard's (1954) and Folk's (1954) classification schemes. Samples with more than 1% gravel-size were located on the gravel-sand-mud triangle and all others were located on the sand-silt-clay triangle. Sediment types were then plotted on a map to show their distribution (Fig. 15).
Gravel with mud (gravelly mud, muddy sandy gravel, and gravelly muddy sand) blankets the borders of the inlet, occurring on eastern South Chinitna Platform, western North Chinitna Platform, Chisik Valley, northwest Cook Trough, South Ninilchik Platform, Kennedy Ramp, and a portion of Barren Slope.
Sand with gravel (gravel, sandy gravel, and gravelly sand) occurs in the central area, covering part of Cook Trough and its slopes, much of Cook Plateau, Cook Ramp, North Barren Slope, North Ninilchik Platform, and Kennedy Trough.
Sand and silty sand tend to be more scattered in their distribution, appearing on Chinitna Platform, Cook Plateau, the southern end of Cook Trough, Ninilchik Platform and northern Shelikof Trough. Sandy silt, being the finest sediment, is deposited in Shelikof Trough, the deepest part of the inlet.
Some single-sample anomalies exist within the larger fields of uniform sediment type depicted in Figure 15; for example, the small area of silty sand just off Anchor Point. In this particular instance, the anomaly can be explained by bathymetry because this sediment occupies a small basin 20 meters deeper than the surrounding sandy gravel platform. Other single-sample

anomalies are not so easily explained and may be due to the existence of local bedforms (e.g., sampling of a sand ribbon in an area generally covered with gravel), errors in sampling or analysis, or shortcomings in distinguishing sediment types with ternary diagrams.
Surface microtextures on sand-size quartz grains were studied using a scanning electron microscope (Hampton et al., 1978). Typical grains show features indicative of glacial processes, in most cases modified by chemical or mechanical action. Grains from a few areas in northern lower Cook Inlet are characterized by nearly unaltered glacial microtextures. Samples from within the area of large sand waves are characterized by an abundance of mechanical impact features. Other places, where bedforms are small or absent, chemical alteration of grain surfaces is characteristic.
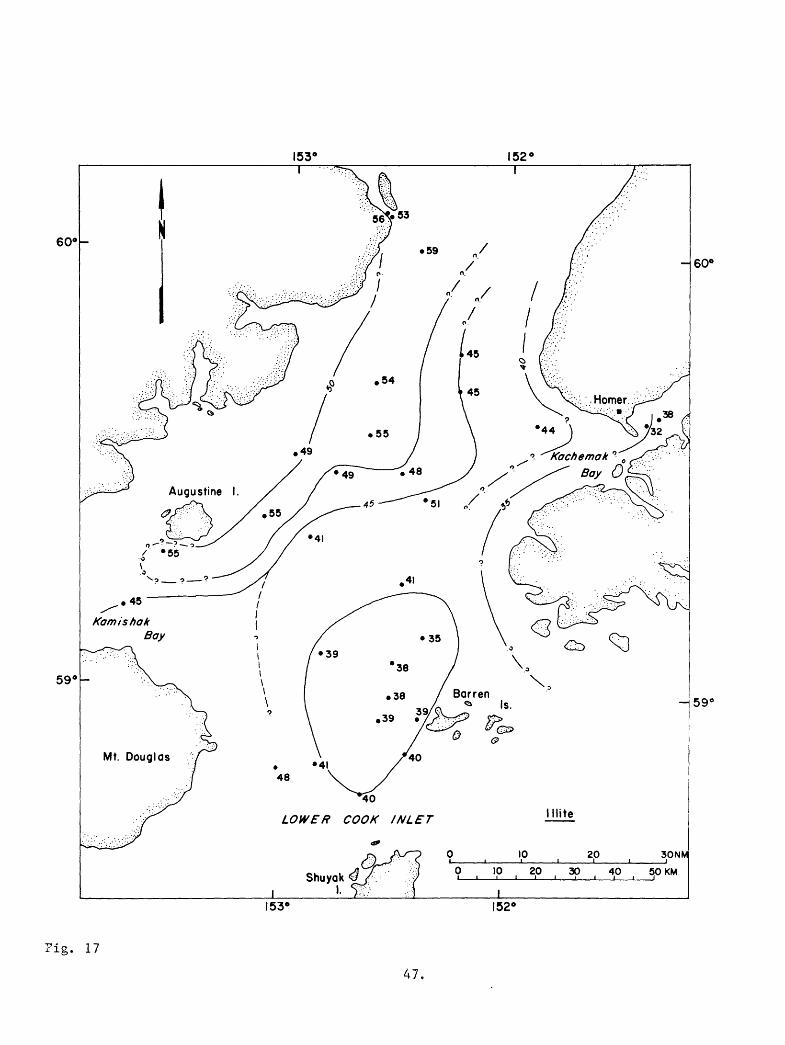
Compositionally, the distribution of clay minerals (Hein et al., 1979) and heavy minerals (F. Lee-Wong, USGS, unpublished data) have been mapped. Two end-member clay mineral suites can be identified in lower Cook Inlet. One is relatively rich in illite and occurs mostly in the west and north (Fig. 17). The source is thought to be from the Susitna River that empties into the head of Cook Inlet. The other suite is relatively rich in chlorite + kaolinite (the two minerals were not distinguished) and is found in the southern and eastern areas (Fig. 18). This suite is derived from the Copper River in the eastern Gulf of Alaska.
Heavy mineral assemblages in lower Cook Inlet are dominated by hornblende, hypersthene, and clinopyroxene. The most likely sources include the igneous arc terrane of the northeast Alaska Range, reworked sedimentary rocks from within the inlet, and local drainage systems.
BEDFORMS
The seafloor of lower Cook Inlet has been molded into a wide variety of bedforms - morphologic features created by fluid flow over an unconsolidated sediment bed. Numerous publications have reported on the classification, morphology, distribution, and dynamics of these features (e.g., Bouma et al., 1977a,b, 1978,a,b, 1979; 1980; Whitney et al., 1979; Rappeport, 1981; Orlando, in prep.). Because they reflect hydraulic conditions and modes of sediment transport that can affect engineering structures, and because they are so widespread, bedforms have important environmental implications for lower Cook Inlet.
Listed below are descriptions of the major bedform types that have been observed in lower Cook Inlet.
Sand waves (Fig. 19) are wavy accumulations of sand with straight or sinuous crests oriented perpendicular to current flow. Wave heights range to about 14 m in lower Cook Inlet, and wave lengths range to about 950 m. Sand waves are further classified as small (wave length less than 20 m), medium (wave length 20-100 m) and large (wave length greater than 100 m). Length to height ratios typically exceed 20 to 1, but ratios as low as 10 to 1 have been reported (Rappeport, 1981). Small and medium waves can be superimposed on large ones, and they are also found on other bedforms such as sand ribbons.

Ripples (Fig. 20) are small wavy forms in sand with heights less than about 10 cm and wave lengths less than about 20 cm. These small bedforms are detectable only with photographic or television systems.
Sand bands (Fig. 21) are fields of bedforms (typically sand waves) that are elongate in the direction of flow and are relatively sharply bounded by fields of other bedforms of different size. Boundaries of a sand band may be straight and parallel, but can also bifurcate.
Sand ribbons (Fig. 22) are narrow, typically thin (<1 m), current- parallel bodies of sand overlying hard bottom (see below). Sand within the ribbon is commonly formed into small, transverse to oblique-trending sand waves.
Comet marks (Fig. 23) are scour depressions extending down-current from obstructions to flow, such as large boulders.
Hard bottom (Fig. 24) is more-or-less flat seafloor covered with coarse sediment.
The type of bedform occurring at a particular place depends on several factors, including sediment size, water depth, and current velocity (Southard, 1971). Sediment availability also is important; sand waves and sand bands form where sand supply is large/ whereas sand ribbons and hard bottom occur where sand supply is restricted.
Figure 25 shows the distribution of bedforms in lower Cook Inlet as mapped by Orlando (in prep.). Field boundaries, wave crest orientations, and inferred migration directions are shown. The distribution of bedforms distinguishes those areas where sand is abundant from those where it is not. That is, sand waves and sand bands occur in the central, generally deeper areas where sand is abundant; for example, Cook Trough, Cook Plateau, and Cook Ramp. Sand ribbons and hard bottom occur nearer the margins where sand is not abundant; namely, on the platforms.
The largest sand waves, with heights up to 14 m, are found on upper Cook Ramp, in water depths from 80-110 m. Buried large sand waves have been observed in seismic reflection records on the ramp.
South of the Ramp in Shelikof Trough, where water depths are greatest, bedforms are generally absent and the seafloor is smooth, apparently reflecting a relatively low energy hydraulic regime. Numerous comet marks have been found there (Whitney et al., 1979), with orientations indicating current movement from east to west, following the arcuate pattern of mean circulation (Fig. 5).
SEDIMENTARY ENVIRONMENTS AND MODERN SEDIMENT TRANSPORT
The foregoing information about sediment, physiography, and oceanography can be used to draw inferences about sediment dynamics in lower Cook Inlet. Areas over which sedimentary processes are similar can be identified as
10

distinct sedimentary environments. Speculation can be made about the condi tions under which sediment is moved and the pathways it follows.
The present-day distribution of unconsolidated sediment reflects the original distribution of Pleistocene glacial deposits as modified by post- transgressional reworking. Sand and finer material are being removed from some glacial deposits, leaving behind a coarse lag. Most winnowed sand is redeposited elsewhere in the inlet, whereas most of the mud is carried into Shelikof Strait and the Gulf of Alaska. Almost no new coarse sediment is being added, but significant amounts of fines are supplied, especially by rivers at the head of Cook Inlet.
Energy levels and directions of fluid motion are highly variable. This results in a complicated distribution of sedimentary environments, but erosional, transportational, and depositional types can be distinguished. Their locations are definable, although imprecisely because of the sparsity of data.
Erosional environments are identified where the sediment type is coarse grained and deficient in fines (e.g., gravel and sandy gravel, Fig. 15), and the sea bed is classified as hard bottom with the common presence of sand ribbons (Fig. 25). Erosional environments occur where water depths are shallow and/or in restricted parts of the inlet where waves and tidal currents impart significant stress on the seafloor; strong enough to remove much of the mud and sand sizes and prevent deposition. Most of the bed is immobile. Quartz sand grains left behind are for the large part sheltered from intense mechanical or chemical action and retain their original glacial micromorphology (Fig. 16).
Transportational environments exist where current energies are strong enough to put sand-size sediment in motion as bed load, at least periodically, and to prevent accumulation of fines in the bed material. These areas of mobile substrate are identified by the presence of a continuous sandy cover, medium-to-large sand waves and sand bands (Fig. 25), and dominant mechanical- impact microtextures (Fig. 16). They occur mostly in central lower Cook Inlet, generally where sand and gravelly sand appear on Figure 15.
Depositional environments are typified by having significant quantities of mud in seafloor sediment (gravelly mud, muddy sandy gravel, gravelly muddy sand, silty sand, sandy silt, Fig. 15) and occur where currents are of low energy and the bed is consequently immobile. Chemical microtextures tend to be dominant on quartz sand grains. Two subenvironment types can be distinguished on the basis of sediment accumulation rates. Areas of low accumulation rate still show evidence of glacial debris on the seafloor (e.g., gravelly mud, muddy sandy gravel, gravelly muddy sand), whereas in areas of relatively high accumulation rate the glacial debris has been completely covered by a blanket of sediment with sand as the coarsest size grade (silty sand, sandy silt). Depositional environments occur near the boundaries of the inlet (low sedimentation rates), where the seafloor is evidently shielded from intense currents even though water depths are shallow, and in deeper areas south of the ramp (higher sedimentation rates).
1 1

Sediment transport in Cook Inlet is of course governed by water motion. Tides produce the strongest currents (Muench and Schumacher, 1980), but mean and low frequency circulation are significant, especially with respect to suspended load. Bathymetry and geometry of the inlet exert a significant influence on both the strength and direction of currents, and consequently on sediment movement.
As noted in early studies (Sharma and Burrell, 1970), the constriction of Cook Inlet near Kalgin Island and the forelands produces strong currents there. Winnowing takes place, and sediment is flushed southward. Sandy sediment accumulates where the inlet widens and deepens, to form the major bedform fields (Fig. 25). These fields terminate at Cook Ramp, which is the leading edge of a southerly prograding sand body (Hampton et al., 1978).
Migration of bedforms has been discussed by Bouma et al. (1978b, 1979), Whitney et al. (1979), and Rappeport (1981). Nearly all sand waves and ripples in lower Cook Inlet show shape asymmetry in their longitudinal profiles, suggesting that movement has taken place in the direction of the steepest face (e.g., Alien, 1968). Most larger waves indicate net southerly movement, in the direction of ebb currents (Fig. 25). Ripples have been observed to reverse orientation with the tides, but no similar behavior has been detected for the larger bedforms.
Rappeport (1981) analyzed current velocity measurements taken over a period of about three months in the summer of 1978 and reported that maximum current speeds were in the ebb direction. Also, current speeds were greatest at the crest of a large sand wave compared to the trough. Currents exceeded the theoretical threshold velocity necessary to initiate sediment transport about 35% of the time. This was supported by television observations made at the start of the study period, which showed that sediment movement took place only during 1 to 1.5 hour around peak ebb and flood currents (Bouma et al., 1979).
Sequential bottom photographs recorded net ripple migration of 10 cm in the ebb direction at a large sand wave crest and no detectable migration in the trough over the 3-month period of current measurements. Notably, this period, being in the summer, is relatively quiescent compared to winter when large storms occur and compared to spring when meltwater adds to flow out of the inlet. Moreover, the period of observation did not include peak spring tide, the time of greatest energy during a tidal cycle. So, the observed ripple movements may be near the annual minimum.
Rappeport (1981) calculated sediment transport rates and deduced that the largest sand waves (wave heights in meters, wave lengths in hundreds of meters) might migrate only 30-40 cm/yr, or one wave length in 500-600 years. This slow rate was corroborated in a study by Whitney et al. (1979) by comparing sand wave positions on side-scan sonograhps taken four years apart over coincident tracklines. No net movement greater than 10 m (the precision of the comparison) could be detected.
12

Two alternative conclusions can be drawn from these studies. Either the sand waves are nearly inactive under the present hydraulic regime and their morphology is relict from a lower position of sea level, or the sand waves move significant amounts today but only during periods of extreme current conditions/ such as during large storms or spring runoff.
The foregoing discussion applies principally to bed-load motion. Suspended load has been studied by Hein et al. (1979), Feely and Massoth (unpublished data), and Burbank (1977). Clay mineral suites identify two main sources for the suspended load: the Susitna River at the head of Cook Inlet and the Copper River in the eastern Gulf of Alaska. The Copper River suite moves into Cook Inlet with the Kenai Current (Schumacher and Reed, 1980), moving north toward Homer and west toward Shelikof Strait. The Susitna River suite moves south along the west side of the inlet, mixing with some of the Copper River suite and continuing around Cape Douglas into Shelikof Strait. Concentrations of suspended matter are greater on the west side of the inlet than on the east.
The two clay mineral suites can be identified both in the water column and in bottom sediment. Observations by Feely and Massoth (unpublished data) and by Bouma et al. (1979) show that significant resuspension of this fine grained sediment from the seafloor occurs during peak ebb and flood currents. Storage of suspended-load material on the seafloor is only temporary at the locations where observations were made (Cook Plateau, in Kachemak Bay, and near Kalgin Island).
ENVIRONMENTAL ASSESSMENT
The available geologic information points out several features and processes that can affect resource development in lower Cook Inlet. However, oil and gas development has been conducted safely for several years in adjacent upper Cook Inlet, which shares similar coastal and marine environ ments.
Seismic activity certainly poses the major environmental risk. Lower Cook Inlet is included in seismic risk zone 3, defined as areas susceptible to earthquakes exceeding magnitude 6 and where .major structural damage could occur (Evans et al., 1972). Damage can either be caused directly by ground shaking, surface faulting, or surface warping and indirectly by ground failure or tsunamis.
The recurrence interval of great earthquakes (M >7 8) in the Cook Inlet area has been estimated from a minimum of 33 years (Sykes, 1971) to a maximum of 800 years (Plafker and Rubin, 1967). These earthquakes are generated in the shallow thrust zone, less than 30 km deep, associated with plate convergence. Deeper earthquakes, with frequent events in the magnitude 5- 6 range, show clusters beneath Iliamna, Douglas, and Augustine volcanoes (Pulpan and Kienle, 1979). Intense shallow events associated with volcanic eruptions have also been recorded.
13

The last great earthquake to affect the inlet occurred in 1964, and considering the minimum estimated recurrence interval, another from the same source area may happen during the lifetime of an oil-producing province. The Shumagin seismic gap directly to the west is another source area predicted for a near-future great earthquake (Pulpan and Kienle, 1979). So, although the timing of destructive earthquakes cannot be predicted precisely, they must be considered a threat during resource development in lower Cook Inlet.
The 1964 Alaska earthquake caused tectonic warping of the earth's surface over a broad region. Maximum uplift of 15 meters was reported in the eastern Gulf of Alaska (Malloy and Merrill, 1972). General subsidence occurred in and around lower Cook Inlet, to a maximum of 1.3 m (Plafker, 1972). Along Homer Spit, sediment failure and consolidation augmented the subsidence to a total of nearly 2 m, submerging large areas of land (Waller, 1965).
Details of the effects of large earthquakes offshore in Cook Inlet are unknown, but no sediment slides or major shallow faults have been found in our surveys, and they are not considered to be a significant problem. Our knowledge of unconsolidated sediment types is limited to near-surface samples, and it is possible that engineering test drilling will reveal local subsurface sediment layers that could liquefy during a seismic event. Nevertheless, ground shaking, tectonic ground warping, and perhaps tsunamis appear to be the major offshore concerns from seismic activity.
The four active volcanoes located in and around lower Cook Inlet (Fig. 1) are andesitic and can have violent eruptions. Severe danger from lava flows, nuee ardentes, or lahars is probably restricted to land and coastline areas around the volcanoes, although in the unlikely event of a Krakatoan eruption of insular Mt. Augustine, major effects could be felt at sea. Abrasive and corrosive effects of ash falls from typical eruptions can extend regionally and be a nuisance, if not a major danger, to offshore operations. A destructive tsunami associated with the 1883 eruption of Augustine reportedly hit the east side of the inlet (Evans et al., 1972), and similar tsunamis could affect coastal areas in the future.
The various sediment types in lower Cook Inlet appear to possess good foundation properties. Geotechnical tests have not been run to determine shear strength and consolidation behavior, but the coarse-grained nature of the sediment (typically with small amounts of clay), the general low accumu lation rates, and the low seafloor slopes throughout most of the area imply favorable engineering conditions. No geologic evidence of gravitationally unstable slopes or soft, underconsolidated sediment has been found. As mentioned previously, subsurface layers of liquefiable silt or fine sand may exist that could cause strength loss or abnormal consolidation during an earthquake, but their presence can only be determined by drilling.
Environmental problems may arise in association with sediment dynamics. Currents are variable in the inlet and can exert strong forces on the seafloor during peak periods of tidal activity, especially when augmented by storm- generated waves and setup. The sand wave fields are of particular interest. Migration of the large sand waves could cause removal of support from
14

structures or application of unexpected loads. Migration rates are most likely negligible during normal conditions, as determined by two independent studies (Rappeport, 1981; Whitney et al., 1979), but short-lived extreme conditions might induce signficiant movement because sediment transport rate increases with the third power of mean current velocity (e.g., see Bagnold, 1963). The latter possibility could be tested by making observations of sand waves over long time periods that include high-energy events. Observations to date have not done this.
Irrespective of sand wave migration, erosion and consequent undermining of structural foundations or pipelines is possible in those aras. Peak tidal currents have been shown theoretically (Rappeport, 1981 ) and by direct observation (Bouma et al., 1979) to induce general motion of the sandy bed, even during less-than-rnaximum tidal range and calm weather conditions. Although the normal regime is transportational, with insignificant change in seafloor elevation, constriction of currents around obstacles can lead to local erosion (see Posey, 1971; Wilson and Abel, 1973). Geopfert (1969) reported three instances of pipeline failure in upper Cook Inlet when localized erosion led to vortex shedding and consequent vibration of the pipes to failure.
Localized erosion also can be expected in other areas of lower Cook Inlet. Areas of seafloor where water depth is less than about 50 m experience forces from storm waves that can erode sand, according to calculations made by Rappeport (1981). Even where the sedimentary environment has been classified as depositional, such as in Shelikof Trough, the presence of comet marks (Whitney et al., 1979) attests that erosion around obstacles takes place. In the erosional sedimentary environments common in northern lower Cook Inlet, currents are strong enough to winnow sand and probably some gravel size . grades, but erosion of sufficient magnitude to cause engineering problems is likely determined by local grain size. Large clasts might provide general bed immobility even under severe conditions.
Another aspect of high-energy sediment transport is abrasion of structural components. Visser (1969) reported considerable abrasion due to high silt concentrations in upper Cook Inlet waters, and similar effects from rapidly moving bed load might be encountered in the lower inlet.
Mineral grains in the suspended load can adsorb pollutants such as spilled oil. The fate of the adsorbed pollutants thereby is determined by the fate of the suspended load. Considering the sources of suspended material (Hein et al., 1978), pollutants originating either from within the inlet or outside (i.e., the eastern Gulf of Alaska) might have effects in lower Cook Inlet.
Feely et al. (1978) determined that suspended particles in lower Cook Inlet can accommodate up to 11% their weight in Cook Inlet crude oil and concluded that such pollutants could be distributed throughout the inlet before settling to the seafloor. Sediment that remains in suspension long enough would be swept into Shelikof Strait, where the sedimentary regime is mainly depositional (Hampton et al., 1981) and long-term storage would
15

result. Alternatively, some might experience long-term storage in the quiet bays along the borders of the inlet. Across most of the lower Cook Inlet seafloor, temporary incorporation into the sediment bed might take place. But, the periodic resuspension of fines that has been observed by Bouma et al, (1979) and by Feely and Massoth (unpublished data) indicates eventual removal to more permanent storage sites.
16

REFERENCES
Alien, J. R. L. , 1968, Current Ripples. Their Relation to Patterns of Water and Sediment Motion. Amsterdam, North Holland Publishing Company, 433 p.
Bagnold, R. A., 1963, Beach and nearshore processes. In; Hill, M. N. (ed.),The Sea, v. 3, The Earth Beneath the Sea. New York, IntersciencePublishers, p. 507-528.
Bouma, A. H., 1981, Submarine topography and physiography of lower Cook Inlet, Alaska. U.S. Geological Survey Open-File Report, 81-1335, 28 p.
Bouma, A. H., Hampton, M. A., Frost, T. P., Torresan, M. E., Orlando, R. C., and Whitney, J. W., 1978a, Bottom characteristics of lower Cook Inlet, Alaska. U.S. Geological Survey Open-File Report 78-236, 90 p.
Bouma, A. H., Hampton, M. A., and Orlando, R. C., 1977a, Sand waves and other bedforms in lower Cook Inlet. Marine Geotechnology, v. 2, p. 291-308.
Bouma, A. H., Hampton, M. A., Rappeport, M. L., Whitney, J. W., Teleki, P. G., Orlando, R. C., and Torresan, M. E., 1978b, Movement of sand waves in lower Cook Inlet, Alaska. Proceedings of the 10th Offshore Technology Conference, p. 2271-2285.
Bouma, A. H., Hampton, M. A., Wennekens, M. P., and Dygas, J. A, 1977b, Large dunes and other bedforms in lower Cook Inlet, Alaska. Proceedings of the 9th Offshore Technology Conference, p. 79-85.
Bouma, A. H., Hampton, M. A., Whitney, J. A., and Nonnan, W. G., 1978b,Physiography of lower Cook Inlet, Alaska. U.S. Geological Survey Open- File Report 78-728, 16 p.
Bouma, A. H., Rappeport, M. L., Cacchione, D. A., Drake, D. E., Garrison,L. E., Hampton, M. A., and Orlando, R. C., 1979, Bedform characteristics and sand waves, lower Cook Inlet, Alaska. Proceedings of the 11th Offshore Technology Conference, p. 1083-1094.
Bouma, A. H., Rappeport, M. L., Orlando, R. C., and Hampton, M. A., 1980, Identification of bedforms in lower Cook Inlet, Alaska. Sedimentary Geology, v. 26, p. 157-177.
Burbank, D. C., 1977, Circulation studies in Kackemak Bay and lower Cook Inlet. In; Trasky, L. L., Flagg, L. B., and Burbank, D. C. (eds.), Environmental Studies of Kachemack Bay and Lower Cook Inlet, Alaska. Anchorage, Alaska Department of Fish and Game, 207 p.
Cacchione, D. A., and Drake, D. E, 1979, A new instrument system toinvestigate sediment dynamics on continental shelves. Marine Geology, v. 30, p. 299-312.
1 7

Cacchione, D. A., Drake, D. E., and Rappeport, M. L., 1981, Bottom and near- bottom sediment dynamics in lower Cook Inlet, Alaska. U.S. Geological Survey Open-File Report, in press.
Cacchione, D. A., Drake, D. E., and Wiberg, P., 1979, Velocity and bottom- stress in the bototm boundary layer, outer Norton Sound, Alaska (abs.). International Meeting on Holocene Marine Sedimentation in the North Sea, I.A.S. Program, Trexel, The Netherlands.
Evans, C. D., Buck, E. H., Huffier, R. T., Fish, S. G., Forbes, R. B., and Parker, W. B., 1972, The Cook Inlet environment A background study of available knowledge. Anchorage, Univ. Alaska Resource Center, Alaska Sea Grant Program, 137 p.
Feely, R. A., Cline, J. D., and Massoth, G. J., 1978, Transport mechanisms and hydrocarbon adsorption properties of suspended matter in lower Cook Inlet. In: Environmental Assessment of the Alaskan Continental Shelf: Quarterly Report to Outer Continental Shelf Environmental Assessment Program, National Oceanic and Atmospheric Administration, Boulder, Colorado, v. 2, p. 3-32.
Fisher, M. A., and Magoon, L. B., 1978, Geologic framework of lower Cook Inlet, Alaska. American Association of Petroleum Geologists Bulletin, v. 62, p. 373-402.
Folk, R. L., 1954, The distinction between grain size and mineral composition in sedimentary rock nomenclature. Journal of Geology, v. 62, p. 344-359.
Foster, H. L., and Karlstrom, T. N. V., 1967, Ground breakage and associated effects in the Cook Inlet area, Alaska, resulting from the March 27, 1964, earthquake. U.S. Geological Survey Professional Paper 543-F, 28 p.
Geopfert, B. L., 1969, An engineering challenge - Cook Inlet, Alaska.Proceedings of the 1st Offshore Technology Conference, p. 1-512-1-522.
Hampton, M. A., 1981, Description of seafloor sediment and preliminary geo- environmental report, Shelikof Strait, Alaska. U.S. Geological Survey Open-File Report 81-1133, 87 p.
Hampton, M. A., Bouma, A. H., Torresan, M. E., and Colburn, I. P., 1978,Analysis of microtextures on quartz grains from lower Cook Inlet.Geology, v. 6, p. 105-110.
Hein, J. R., Bouma, A. H., Hampton, M. A., and Ross, C. R., 1979, Claymineralogy, fine-grained sediment dispersal and inferred current patterns, lower Cook Inlet and Kodiak Shelf, Alaska. Sedimentary Geology, v. 24, p. 291-306.
Manoon, L. B., Adkinson, W. L., Chmelik, F. B., Dolton, G. L., Fisher, M. A., Hampton, M. A., Sable, E. G., and Smith, R. A., 1976, Hydrocarbon potential, geologic hazards, and infrastructure for exploration and development of the lower Cook Inlet, Alaska. U.S. Geological Survey Open- File Report 76-449, 124 p.
18

Magoon, L. B., Bouma, A. H., Fisher, M. A., Hampton, M. A., Scott, E. W., and Wilson, C. L., 1979, Resource report for proposed OCS sale no. 60, lower Cook Inlet-Shelikof Strait, Alaska. U.S. Geological Survey Open-File Report 79-600, 38 p.
Malloy, R. J., and Merrill, G. F., 1972, Vertical crustal movements on the seafloor. In; The Great Alaska Earthquake of 1964, Oceanography and Coastal Engineering. Washington, D. C., National Research Council, National Academy of Sciences, p. 252-265.
Muench, R. D., Mofjeld, H. O., and Charnell, R. L., 1978, Oceanographicconditions in lower Cook Inlet Alaska: Spring and Summer 1973. Journal of Geophysical Research, v. 83, p. 5090-5098.
Muench, R. D., and Schumacher, J. D., 1980, Physical oceanographic andmeteorological conditions in the northwest Gulf of Alaska. NOAA TechnicalMemorandum ERL PMEL-22, 147 p.
Orlando, R. C., in preparation, Morphologic and sediment characteristics of bedforms in lower Cook Inlet, Alaska. Master of Science Thesis, San Jose State University, San Jose, California.
Plafker, G., 1972, Tectonics. In; The Great Alaska Earthquake of 1964,Geology. Washington, D.C., National Research Council, National Academy of Sciences, p. 47-122.
Plafker, G., and Rubin, M., 1967, Vertical tectonic displacements in south- central Alaska duriing and prior to the great 1964 earthquake. Journal of Geosciences, Osaka City University, p. 53-72.
Posey, C. J., 1971, Protection of offshore structures against underscour.Journal of the Hydraulics Division, American Society of Civil Engineers, No HY7, Proceedings Paper 8230, p. 1011-1016.
Pulpan, H., and Kienle, J., 1979, Western Gulf of Alaska seismic risk. Proceedings of the 11th Offshore Technology Conference, paper 3612, p. 2209-2218.
Rappeport, M. L., 1981, Studies of tidally-dominated shallow marine bedforms, lower Cook Trough, Cook Inlet, Alaska. Unpublished Ph.D. Thesis, Stanford university, Stanford, California, 323 p.
Schumacher, J. D., and Reed, R. K., 1980, Coastal flow in the northwest Gulf of Alaska: The Kenai Current. Journal of Geophysical Research, v. 85, p. 6680-6688.
Sharma, G. D., and Burrell, D. C., 1970, Sedimentary environment and sediments of Cook Inlet, Alaska. American Association of Petroleum Geologists Bulletin, v. 54, p. 647-654.
Shepard, F. P., 1954, Nomenclature based on sand-silt-clay ratios: Journal ofSedimentary Petroloqy, v. 24, p. 151-158.
19

Southard, J. B., 1971, Representation of bed configurations in depth-velocity- size diagrams. Journal of Sedimentary Petrology, v. 41, p. 903-915.
Sykes, L. R., 1971, Aftershock zones of great earthquakes, seismicity gaps, and earthquake prediction for Alaska and the Aleutians. Journal of Geophysical Research, v. 75, p. 8021-8041.
Visser, R. C., 1969, Platform design and construction in Cook Inlet, Alaska. Journal of Petroleum Technology (April), p. 411-420.
Waller, R. M., 1966, Effects of the earthquake of March 27, 1964, in the Homer area. U.S. Geological Survey Professional Paper 541-D, 28 p.
Whitney, J. W., Noonan, W. G, Bouma, A. H., and Hampton, M. A., 1979, Lower Cook Inlet, Alaska: Do those large sand waves migrate?. Proceedings of the 11th Offshore Technology Conference, p. 1071-1082.
Wilson, N. D., and Abel, W., 1973, Seafloor scour protection for a semi- submersible drilling rig on the Nova Scotian shelf. Proceedings of the 5th Offshore Technology Conference, p. 631-646.
20

Table 1. Location (dearees minutes)r srain size (weisht percent) sft d mean size (phi units) For lower Cook Inlet sediment samples.
Sta23456783
101112131415 IB17181922232425 2S27282930333435 3B 37 394142434445 4S4849150152300302303 305 30S 310
Lat i tude 53 37.55 SO 5.3S SO 5.45 SO 4.70 53 19.02 53 IS.24 53 10.S3 53 41.GO 59 41.25 59 34.50 53 34.60 53 25.75 53 30.00 53 31.08 53 23.20 53 20.70 53 12.15 58 56.25 58 51.20 58 55.70 58 58.43 53 3.20 53 8.10 53 26.30 53 21.35 53 14.38 53 1B.G5 53 2G.35 59 3G.55 53 37.35 53 41.50 53 4G.30 53 40.75 53 36.25 59 3G.20 53 3G.G3 59 35.25 59 34.80 53 44.40 60 0.50 53 56.00 59 4.55 59 37.21 53 34.3G 53 36.13 53 33.45 53 30.80 53 30.75 59 30.98
Lonsitude151152152152153153153152152152152152152152153152152152152152152152152152152152152152151152152151151151151151152152152152152152152152152152152152152
183434334132443G34353S504S54S
534423243431312220252821125214131357564522<-» r>i_ j^.3B32223
4323
*3
1835303030
.17
. 13
.54
.83
.45
.12
. 10
. 10
.30
.30
.10
.03
.01
.00
.SO
.50
.80
.36
.30
.30
. 11
.20
. 10
.70
.30
.15
.70
.43
.00
. 30
.00
. 00
. 15
. 00
.GO
.07
.30* 10.05.46.30.50.08.66.23.15.00. 00.00
Gray .0
40483825
305
5235704
20300
101830G1G
160G
110
31G73G35001
10G35
7G0070000i
.00
.74
.66
.28
.31
. 13
.15
.77
.82
.07
.35
.23
.77
.76
.83
.53
.00
.96
.30
.64
. 12
.47
.26
.GO
.37
.03
.42
.66
. 00
. 13
. 10
.63
.06
. 00
.00
.72
.30
.37
.24
.58
.90
. 00
. 00
.94
.24
.BO
.08
.01
.32
Sand2
413923G25113G8355G76353066743421735888308434338233328738G331625538322387318337227333893838333338
.46
.07
.63
.83
.23
.87
.35
.12
.55
.33
.73
.63
.22
.21
.74
.07
.83
.32
.84
.32
. 10
. 12
.01
.40
.05
. 72
.31
.82
.46
.46
.34
. 15
.63
.70
.32
.57
.71
.79
.03
.20
.27
.53
.71
.88
.82
.17
.26
.18
. 00
S51133
252331401835
11333
< <JL i
4534
1235430000013007i5
48i0i
400
160100000
ilt.80.55.28.03.OS.87.45.82.12.74.66.25.38.24.15.43.08.93.15.72.34.83.27. 00.84. 13.56.32.04.76.35.31.03.02.78.76. 11.93.34.51.67.52.25.36.61.60.54.68-R?
Clay45.4.2.G.G.
11.9.7.2.<-»j£- .
4.0.1 .3.4.0.
IS.4.
10.3.4.4.1 .0.0 .0.0.0.0.1 .0 .0.2.0.i.
19.0.0.0.
1G.0.3.0,0.0.0.0.0 ,'.
74G4438034134529552026836273273103137172455346001400112050G561252828303528253371IS35048233S3 ) ii >~
i 2 '; ?°T
Meansize7.721 .080.421.873.273.703.072.760.280.722.131 .711 .621 .512.021 .765.78i .S32.321 .SB2.111 .881 .731 .270.3S1.511 .311 . 121 .530.72
-0.750.280.781 .571 .875.331 . 131 .321.274.55
-1. 152.58i .511 .351 .55i .561 .53 ,54' i ̂
21.

Table 1. (continued)
MeanSta. Latitude Lonsitude Gray. Sand Silt Clay size312 59 30.12 -152 31.02 5.27 93.10 1.32 0.31 1.40314 59 27.54 -152 38.32 38.G8 G1.32 0.00 0.00 0.15315 53 25.71 -153 19.25 G.OG 38.14 41.12 14.G7 4.30316 59 21.93 -153 13.73 11.83 54.G5 20.81 12.71 3.10318 59 9.90 -152 38.54 1.40 92.G7 3.67 2.26 1.81319 59 13.59 -152 38.46 8.41 90.52 0.94 0.13 1\26320 59 17.64 -152 39.99 0.29 98.28 1.28 0.15 1.56321 59 22.81 -152 38.00 0.00 99.84 0.14 0.02 1.51322 59 31.09 -152 38.35 8.66 90.61 0.51 0.22 1.24323 59 30.88 -152 38.86 0.29 97.89 1.3G 0.46 1.5932G 59 32.80 -152 25.31 26.8G 71.64 1.19 0.31 0.64327 59 33.84 -152 25.01 19.77 79.55 0.56 0.12 0.84404 59 31.17 -153 7.59 0.39 46.03 30.12 23.46 4.84405 59 28.21 -153 11.82 9.31 G3.19 15.85 11.G5 2.88406 59 27.42 -152 38.04 0.00 84.40 11.16 2.44 2.18407 58 52.67 -152 55.38 0.00 22.21 50.42 27.36 6.09408 58 52.48 -152 56.02 0.52 23.52 52.08 23.88 5.8G409 58 55.62 -152 56.98 0.00 30.69 47.79 21.52 5.48410 58 55.33 -152 57.52 0.00 22.62 52.1G 24.22 5.89411 58 53.89 -152 58.39 0.25 26.51 48.79 24.45 5.77412 58 52.39 -152 57.85 0.60 21.83 53.70 23.87 5.92414 59 27.27 -152 33.23 2.81 96.69 0.43 0.07 1.43416 59 46.30 -152 29.05 84.44 13.48 1.71 0.37 -1.35418 59 41.70 -152 26.07 20.38 78.75 0.61 0.26 0.84419 59 39.86 -152 20.61 42.14 55.15 1.75 0.96 0.1S420 59 38.95 -152 45.07 31.19 68.48 0.28 0.05 0.43421 59 45.06 -152 45.22 0.16 98.74 0.85 0.25 1.55422 59 49.74 -152 37.93 54.59 34.82 7.03 3.56 0.21423 59 50.14 -152 29.51 55.98 33.09 6.23 4.70 0.22424 59 54.65 -152 14.61 11.37 88.09 0.44 0.10 1.13425 59 59.88 -152 9.18 34.85 17.41 37.52 10.22 2.84426 GO 0.62 -151 53.84 51.94 44.85 2.81 0.40 -0.16427 59 50.09 -151 55.21 48.62 49.SB 1.29 0.23 -0.1242S 59 49.97 -152 6.75 80.36 17.13 1.97 0.54 -1.18429 59 49.88 -152 14.G3 37.44 59.42 2.20 0.94 0.37430 59 49.11 -152 20.10 2.89 96.34 0.61 0.16 1.44cl 59 0.00 -152 0.00 85.52 12.92 1.39 0.17 -1.42c4 59 0.00 -152 30.00 19.28 55.12 18.75 G.82 2.25c5 59 0.00 -152 40.00 1.27 94.62 3.32 0.79 1.67
clO 59 10.00 -152 14.00 0.58 39.96 47.30 12.16 4.64ell 59 8.00 -152 20.00 1.10 43.56 42.98 12.3G 4.45c!2 59 10.00 -152 24.00 0.08 45.08 43.19 11.64 4.43c!3 59 10.00 -152 34.00 42.91 41.14 10.G3 5.32 0.93c!4 59 10.30 -152 45.00 14.09 84.76 0.77 0.38 1.07ci5 59 10.00 -152 54.00 0.00 99.45 0.48 0.07 1.53ciG 59 10.00 -153 4.00 18.46 80.20 0.99 0.35 0.93CIS 59 10.00 -153 23.70 0.00 99.37 0.55 0.08 1.53ci9 59 15.50 -152 10.70 0.00 98.83 1.03 0.14 1.56c20 59 16.00 -152 22.50 1.45 94.97 2.45 1.13 1.G6c23 59 16.30 -J52 49 :>O 7,61 92.2G 0.13 0.00 1.24c24 59 16.00 -152 2,00 .; 3,. J 5 B5.34 1.16 0.35 1.12c25 5915.90 -153 &.ju 0,00 96.90. 2.14 0.96 1.68
2.2.

Table 1. (continued)
Sta.c2Gc29c30c33c34c40c4ic42c43c44c45c4Sc5Sc57c58
Lat i tude595959595959595959595959595959
15.22.'i?'?
22.23.34.33.33.33.33.33.33.37.4G.4G.
800010700000000000000000000010
Lonsi tude-153-152-152-153-153-151-151-152-152-152-152-152-153-152-152
20.001 0 . 0022.207 . 307. GO
44.0054 . 004.002.0014.0024.0034.002.002.0013.00
Gray .1.753.230.000 . 000.591 .747.897.320 . 090.000.570.090.000.000.00
Sand36.8495.4159.4099.1997.4075.51G9.9570.034G.9259.2385.9283.5877.1145.8281 .40
Silt48.17
1 .1332.280.731.71
17.9317.8118.7243. 1G30.9310.497.9915.7037.4311.27
Clay130800443993<-»<£_
71G7
.24
.23
.32
.08
.30
.82
.35
.87
.S3
.84
.02
.34
.19
.69
.33
M e s nsize4.731.4S3.GG1 .541 .582.GG2.402.424.273.732.2i2. OS2.824.G12. S3
23.

FIGURE CAPTIONS
1. Location map, Cook Inlet/ Alaska.
2. Seismic-reflection profiling track lines. a) 1976, b) 1977, c) 1978, d) 1979, e) detail of 1979.
3. Sediment sample locations.
4. Regional geologic features. (From Magoon et al., 1979.)
5. Regional mean flow pattern. (From Muench and Schumacher, 1980. )
6. Bathymetry. (From Bouma et al., 1978.)
7. Physiographic features. (From Bouma, 1981.)
8. Shallow folds and faults. (From Bouma and Hampton, 1976.)
9. Thickness of unconsolidated sediment. Contours in milliseconds of two- way travel time. Acoustic velocity of unconsolidated sediment has not been determined, but probably is about 1800 m/sec. (From Bouma et al., 1978a.)
10. Mean grain size of sediment samples, in phi units.
11. Percent sand-size (2 - 0.0625 mm; -1-4 phi) grains in sediment samples.
12. Percent gravel-size (greater than 2 mm; greater than -1 phi) grains in sediment samples.
13. Percent mud-size (less than 0.0625 mm; less than 4 phi) grains in sediment samples.
14. Ternary plots of grain-size classes (in weight percents). Upper diagram includes samples with greater than 1% gravel; lower diagram includes samples with less than 1% gravel.
15. a) Distribution of sediment types. b) Definition of sediment types.
16. Distribution of microtextures and bedforms. Microtextural types arelisted in order of decreasing abundance. Capital letter denoted abundant occurrence of a texture. Underline denotes dominance of a particular microtexture throughout a sample. Lower-case letters in parentheses denote minor occurence of a microtexture. (From Hampton et al., 1978)
17. Weight percent illite in clay fraction of sediment samples. (From Hein et al., 1979)
18. Weight percent chlorite+kaolinite in clay fraction of sediment samples. (From Hein et al., 1979.)
24.

19. Side-scan sonographys of a) large sand waves (wave length greater than 100 m), with secondary small bed forms and b) medium (wave lengths between 20-100 m) and small (wave lengths less than 20 m) sand waves. (From Orlando, in prep.)
20. Sea-floor photographs showing ripples. (From Orlando, in prep.)
21. Side-scan sonographs of sand bands, Note bifurcations. (From Orlando, in prep.)
22. Side-scan sonographs of sand ribbons. (From Orlando, in prep.)
23. Side-scan sonographs of comet marks. Tails of comet marks point down- current. (From Orlando, in prep.)
24. Side-scan sonograph (a) and sea-floor photograph (b) of hard bottom. (From Orlando, in prep.)
25. Distribution of bed forms. (From Orlando, in prep.)
25.

REGIONAL LOCATION MAP150° 148°
59e
KENNEDYENTR/
BARREN ISV*
A STEVENSON JS> ENTRANCE
/Jk, f 3 SHUYAK I.O
Fig. 1154° 152°
60°
59°
150C
26.

IS3*
WIS
O'W
co
run
with
spa
rker
!>
un
iboo
m
and
3.5
KH
z ba
thym
etry
Lin
n
run
with
un
iboo
m
and
3.S
K
Hz
bath
ymet
ry
ISS
'WIS
2«W
Fig
. 2a

LOWER COOK INLET S7-77-WG
TRACK LINE MAP
59*40
59° 201
_ 59° 00
153° Otf I52°40' 152° 20' 152° 00' I5I°40'
Fig. 2b
23.

I54*W I53*W I I52*W
LOWER COOK INLETTRACKLINE MAP
S8-78-WG
60*N -
59*N -
Fig. 2c
29.

I54»W I53*W I52*W
60«N
59*N -
Fig. 2d
30.

45'
40
'
I
3 iS
cale
in
n
au
tica
l m
iles
35
' I
438
41
0
40
5
15
2°
SO
' iO o
n'
59°
30
29'
-28
'
-27'
-26
'
Fig
. 2e
59°2
5'

I54*W I53*W I52*W
60*N -
59*N -
Fig. 3
32.


Fig. 5 34.

153
60* -
59* -
LOWER COOK INLET, ALASKA BATHYMETRY
<Min>o,A H., H.i.ptwi. M.A., 0*4. I»T7, U.S. oloflleol »«r..y, Pacific
Arctic araKk *f U«rlM * « » M*>ilo P»rk. Coilf«f»U.
-60*
IS2-
35.

I54'W I53'W I52*W
60'N -
59'N -
C00« \l PLATEAU
Fig. 7
36.

I54»W IS3»W IS2»W
60*N -
59*N -
Fig. 837.

I54'W I53»W I52»W
60»N -
59'N -
Fig. 9
38.

I54*W I53*W I52*W
60«N -
59'N -
505 10 15 20 25 SO KILOMETERS
5 0 5 K> NAUTICAL MILES
Fig. 1039,

I54*W I53*W I52*W
60»N -
59*N -
0 5 10 _ 15 20 25 SO KILOMETERS
5 K> NAUTICAL MILES
Fig. 11
40.

I54*W I53*W
60*N -
41.

I54»W I53»W I52*W
60*N
59'N -
Fig. 13
42.

GRAVEL
*0
SAND
*0.
10 20 30 40 50 40 30 20 10MUD
SAND
I54*W I53*W I52*W
60*N -
59*N -
05 10 19 20 25 3O KILOMETERS
UNIVERSAL TRANSVERSE MERCATOR PROJECTION
| Q | GRAVEL
|SQ| SANDY GRAVEL
|GM| GRAVELLY MUD
MUDDY SANDY GRAVEL
GRAVELLY MUDDY SAND
|GS| GRAVELLY SAND
| S | SAND
|SSa| SILTY SAND
|SSi| SANDY SILT
SHELIKOF STRAIT
44.
GRAVEL
SAND
GRAVELLY
MUDDY
SAND
GRAVELLY
SANDY V^
MUD
T I I "1 I I I |
10 20 30 40 50 40 30 20 10
\
MUD
SAND
SILT10 20 30 40 50 40 30 20 10
CLAY
Fig. 15b45.

45' 50' 15 02* 45 50
MICROTEXTURES
/AMPLE NUMBER /DEPTH
36 (45m) G: glacial features
M: mechanical features C: chemical features
BEDFORMS
stf\) average wave height +L& greater than 5m
s*?m average wave height IP' 2-5 m
average wave height less than 2m
/ isolated sand ribbons
- 60°N48(45m) CG(m)
(56m) GM(c)
36(45 m) MG(c)
34(28m) -
AUGUSTINE ISLAND
16 (48m)CM(g)
17 (74m CGm
32 (69m ) : > C(m)(g)28(78^|:^
MG(c)
7 (32m) CM(g)
154 (75m) CM(g)
150 (147m)CG(m) 26(U9m)
C(g)(m 25(133 m)C(m)(g) -59°N
Fig. 1646.
152'
-60°
LOWER COOK INLET
10 20 30 40 50 KM
59°-
153
Fig. 17
47.

152'
60°-
59°-
60
LOWER COOK INLET
10 20 30 40
- 59°
. 18
48.

H«
OQ

H-
OQ N)
O
Ln
O

500
Fig. 2151.

TJ
H-
OQ Ui
iififs
L'*'''* °
*
ME
TE
RS
|
I I 1
O
M
01
-«4
o»
o
w

m -- --;. --:'- rr - * ' " ' ' '
wjrtfefccft^r * ' ?-jf^^nff^f.^r^y'^s? v.*,.-' . i*?
y?=S*.?s«^|: .^^^-5'^^
0-,
f^Stjjtt^^^-r Jl&&i^$ 'v^^^^^s^v^^^i^^fe
*-^^c ' ^"** * - - «^i^^»
^^S^sS

^f
2 E-*-V -i---<-"^\. - - .- » -:
-i- . .----- -*- -v»3Er.^>v <><>~^ -, ^,«r. ^^«*B.3/ VC/ »-" ' ' *1"^i"»^-"»f--^-f^'><'JH <3ttinife;-«rt- r-aaf\ jlft -i"i r Z'F J ^»~XI^t^it?»":i^f't."-i'-«r_-"r;:;jc^ - v» -^p.ic., ««. ~ai-ci;'ae«-'

I53°W I52°W
KENAI PENINSULA
CHUGACH ISLANDS
59°N
EXPLANATION
Small sand wave fields A > 20 meters
Medium sand wave fields A. 20-100 meters
Large sand wave fields A < 100meters
Sand waves
Sand waves with superimposed Bedform
Sand bands
\\\\ Sand ribbons
W^ Comet marks
*. :: Boulders
CH3) Flat field,little relief
» Bedform orientation reflecting net current flow
55.