by thomas a. rubin and james e. moore ii - reason … rppi policy study no. 230 august 1997 rubber...
TRANSCRIPT

0 RPPI
Policy Study No. 230 August 1997
Rubber Tire Transit: A Viable Alternative to Rail
By Thomas A. Rubin and James E. Moore II EXECUTIVE SUMMARY
ubber Tire Guideways are, to a significant extent, “the road not taken” for guideway transportation improvements in Los Angeles and throughout the United States.
Busways, high occupancy vehicle (HOV) lanes, high occupancy toll (HOT) lanes, bus malls, and other rubber tire guideway modes have shown that they can often provide greater transportation capacity improvement, usable by more people, at lower cost than comparable rail modes in many transportation corridors. In many cases, however, such non-rail guideways have not been fairly considered as alternatives to rail lines—if they have been considered at all. Rubber Tire Guideways are certainly not the right solution for every transportation situation and there are many cases where rail transit is an appropriate and productive component of an overall urban transportation network. However, in cases where decisions are being made for new transportation improvements that may include guideway solutions, Rubber Tire Guideways have proven productivity and cost-effectiveness characteristics that should lead to their serious consideration as traditional/nontraditional transit alternatives. Selection of transit system components should be conducted in a fair and competent manner, with the technology choice decision not being made until after the study is performed. In Los Angeles, the authors conclude:
• HOV lanes should be given a much higher priority for construction and implementation than rail guideways. Los Angeles County Metropolitan Transportation Authority (MTA) projections give HOV lanes far higher transportation productivity and cost-effectiveness;
• Wherever possible and where excess capacity exists, HOT lanes should be implemented on new HOV lanes, and considered as retrofit options for existing HOV lanes;
• Where justified, MTA should provide a high priority to expanding bus and alternative transit service on HOV lanes in its planning and financial budgeting; and
• MTA should consider more Rubber Tire Guideway projects, particularly projects serving the central business district.
R

RUBBER TIRE TRANSIT 1
P a r t 1
Introduction
he term, “Rubber Tire Guideway,” refers to a wide range of traffic technologies that provide dedicated or preference lanes for buses, high occupancy vehicles, and automobiles. The term includes exclusive busways, high occupancy vehicles lanes on freeways, HOT lanes, dedicated bus malls, bus/HOV preference lanes on surface roadways, and traffic signal priority/preference. Rubber Tire
Guideways have made major contributions to total transportation system performance in many major urbanized areas. When compared to all types of rail systems, Rubber Tire Guideways generally provide a very high level of mobility for a larger number of users at far less public sector cost. The most successful Transit Guideway in Los Angeles County is the El Monte Busway/HOV, consisting of a dedicated lane in each direction on or near the I-10 Freeway from slightly East of El Monte to near Union Station in the Northeastern corner of the Los Angeles Central Business District. Originally placed in service in the early 1970's, the transit ridership on the El Monte is over four times the ridership on the Long Beach-Los Angeles Blue Line (measured per mile of guideway) at a speed of travel well over twice as fast. Overall, the buses on the El Monte provide approximately three times the transit utilization (measured in passenger miles) per mile of guideway as the Blue Line. When the HOV use of the El Monte is added, the El Monte busway provides approximately ten times the transportation consumption (passenger miles) of the Blue Line per guideway mile. The acknowledged capital cost of the Blue Line was $877 million for 21.6 miles of bi-directional light rail guideway, or $41.6 million per bi-directional mile in (approximately) fiscal year 1988 dollars. The original cost of the El Monte Busway project contracts was $36,191,3001 Assuming a project spending midpoint of 1972, the capital cost of the El Monte, in fiscal year 1988 dollars was approximately $85.3 million for 11.5 miles of busway/HOV lanes, or $7.4 million per bi-directional mile.2 Consequently, the El Monte produces approximately ten times the transportation utilization per guideway mile as the Blue Line at less than one-fifth the capital cost per mile. While the term “guideway” transit has often been used to refer exclusively to rail modes, the use of “fixed guideway” also includes certain non-rail, “rubber tire” transit and paratransit modal applications:
1 Southern California Rapid Transit District Engineering Department, “Summary-San Bernardino Busway
Project,” October 26, 1981. 2 In 1972, the Department of Labor, Bureau of Labor Statistics Consumer Price Index (CPI-W) in the Los
Angeles/Long Beach/Anaheim urbanized area was 41.4. In 1988, the index was 119.0, giving a multiplier of 2.87. The MTA reports that the Construction Cost Index increases at 82 percent of the rate of increase for the CPI (MTA, “A Plan for Los Angeles: Transportation for the 21st Century,” March 1995, p. 114). This adjustment produces a multiplier of 2.36, and a comparable 1988 dollar cost of El Monte Busway contracts of $85.3 million.
T
2 RPPI
(1) A transportation system composed of vehicles that can operate only on their own guideways, which were constructed for that purpose. Examples are rapid rail, light rail, and monorail. (2) Federal usage of the term in funding legislation also includes bus priority lanes, exclusive right-of-way bus operations, trolley coaches, and ferryboats as fixed guideway transit.3
This paper describes the characteristics of Rubber Tire Guideways and compares their utility to rail modes, particularly in Los Angeles. We begin by defining various bus and rail guideway transit, including examples.4
A. Rail Guideway Modes:
“Automated guideway (automated guideway transit, AGT)—any guided transit mode with fully automated operation. The term usually refers only to guided modes with small and medium-sized vehicles that operate on guideways with exclusive right-of-way. The term includes the personal rapid transit concept and group rapid transit or peoplemover systems.” At one time in its design and construction, the Green Line was expected to be an automated guideway system. While over $50 million was spent for this purpose, the Green Line currently operates as a light rail system. At present, the British Columbia Transit Vancouver SkyTrain is the only automated guideway transit system in North America, other than peoplemovers. The planned, but never approved, Los Angeles downtown people mover would have been an example of the more common type of automated guideway, similar to the peoplemovers in Detroit, Miami, and Morgantown, West Virginia. “Commuter rail—a passenger railroad service that operates within metropolitan areas on track that usually is part of the general railroad system. The operations, primarily for commuters, are generally run as part of a regional system that is publicly owned or by a railroad company as part of its overall service. In some areas it is called regional rail.” In Los Angeles and neighboring counties, the Southern California Regional Rail Authority, doing business as Metrolink, is the commuter rail operator. Some commuter rail operations, including some of those of Metrolink, operate outside of metropolitan areas or between metropolitan areas. “Light rail (LRT)—as defined by the TRB (Transportation Research Board) Subcommittee on Light Rail Transit, a metropolitan electric railway system characterized by its ability to operate single cars or short trains along exclusive rights-of-way at ground level, on aerial structures, in subways, or occasionally, in streets, and to board and discharge passengers at track or car floor level.” The Los Angeles-Long Beach and Pasadena Blue Lines and the Green Line (as it currently operates) are all light rail systems. “Rail rapid (heavy rail transit, rapid rail transit)—a transit system that generally serves one urban area, using high-speed, electrically powered passenger rail cars operating in trains in exclusive rights-of-way, without grade crossings (Chicago is an exception) and with high platforms. The tracks may be in underground tunnels, on elevated structures, in open cuts, at surface level, or any combination thereof. Some local terms used for rail rapid transit are the elevated, the metro, the metropolitan railway, the rapid, the subway, the underground.” The Red Line is a rail rapid transit system. Rail rapid transit generally operates longer trains, especially during peak periods, than light rail. While the Long Beach-Los Angeles Blue Line has been limited to two-car trains by the short blocks on the Washington Blvd. street-running section at lack of signal preemption, the other Los Angeles light rail lines are designed for three-car peak trains. The Red
3 Transportation Research Board, “Urban Public Transportation Glossary,” 1989, p. 27 and Vukan R. Vuchic, “Urban Public Transportation Systems and Technology,” 1981, pp. 65, 647.
4 All definitions are from TRB 1989, except where otherwise indicated.

RUBBER TIRE TRANSIT 3
Line can operate six-car trains, while other rail rapid systems operate longer trains, such as BART's ten-car trains.
B. Rubber Tire Guideway Modes:
“Busway—a special roadway designed for exclusive use by buses. It may be constructed at, above, or below grade and may be located in separate rights-of-way or within highway corridors.” North America’s pure busways include those operated by the Ottawa-Carleton Regional Transit Commission (OC Transpo), Pittsburgh's Port Authority of Allegheny County (PATransit), and the exclusive busway on Route 495 leading to the New York bus terminal. The El Monte Busway/High Occupancy Vehicle lane was originally constructed and originally operated as a pure busway (no vehicles other than buses), and was subsequently opened to HOV-3 traffic. An “HOV-3” designation requires a minimum of three occupants per vehicle to use the HOV lane, while “HOV-2” only requires two. In California, vehicles with fewer than three seats can utilize HOV lanes if all seats are full. It is legal to operate a two-seater sports car with both seats occupied, or a motorcycle, in an HOV-3 lane.5 Busway/HOV Lane—refers to a freeway lane dedicated to use of high occupancy vehicles, including buses. This configuration is typical in Los Angeles, but by no means restricted to LA. The Shirley Highway bus and carpool lanes in suburban Washington DC is a high profile project. “Busway” is defined above. “High-occupancy vehicle (HOV Lane)—a highway or street lane reserved for buses, light rail vehicles, or both.” Virtually all of the HOV lanes currently in place, under construction, or planned for Los Angeles County are, will, or could be utilized for buses as well as car- and vanpools. This includes the El Monte, Harbor Freeway, and Anderson Freeway HOV lanes. In Los Angeles, while a few HOV lanes, such as the El Monte are HOV-3. Newly constructed and other planned lanes are generally HOV-2, with plans for future (but potentially difficult) upgrades to HOV-3. “High occupancy/toll (HOT) lanes—a type of HOV lane that allows vehicles that do not meet the minimum load standards to use the high occupancy lanes by paying of a fee.” The SR-91 HOT lane in Orange County is the first of its type in the U.S.6 The use of transponders with stored and deductible monetary value, or electronic monthly passes, eliminates the requirement for such travelers to stop at tollbooths. This technology can be used to charge different prices for access at different times, keyed to current and immediately upcoming demands on capacity. Prices can be raised to reduce demand during high peak periods, and reduced during periods when demand is low. Overly complex and frequent changes in prices could lead to consumer confusion and resistance. “Bus (lane) (bus priority lane, preferential bus lane, priority bus lane)—a highway or street lane reserved primarily for buses, either all day or during specified periods. It may be used by other traffic under certain circumstances, such as making a right or left turn, or by taxis, motorcycles, or carpools that meet specified requirements described in the traffic laws.” Counter flow lanes are special cases of bus lanes. A counterflow lane is “A highway or street lane on which vehicles operate in a direction opposite to what would be the normal flow of traffic in that lane.” The Spring Street counterflow lane is the best Los Angeles example of a non-freeway lane dedicated to bus service. In the CBD, where the Spring Street Counterflow lane operates,
5 It is not unknown for judges to rule that pregnant women driving alone may use an HOV-2 lane. Manikins, blow-
up dolls, dogs dressed in human clothing, and similar variations have generally proven far less successful in meeting the legal requirements for HOV use, although not due to any lack of attempts.
6 Authors' definition.

4 RPPI
Spring Street is a multi-lane one-way street South, except for the Eastern-most bus lane, which runs North. Emergency vehicles are the only non-transit vehicles that are authorized to use the counterflow lane. Bus transit mall—a further extension of dedicated bus lanes where all, or almost all, non-transit traffic is eliminated, often with special pedestrian enhancements such as brick pavement and wrought iron bus shelters, lights, and signposts. Denver and Portland have implemented and operate successful Central Business District (CBD) bus transit malls. Where the Portland light rail line crosses the bus transit mall, the pedestrian improvements have been expanded to create a rail transit mall. Signal preemption—“in highway operations, an automatic or manual device for altering the normal signal phasing or the sequence of a traffic signal to provide preferential treatment for specific types of vehicles, such as buses or trains.” The mid-corridor of the Los Angeles-Long Beach Blue Line coordinates train movements and traffic signals for crossing traffic. The Northern and Southern street running portions of the Blue Line are not currently permitted signal preemption, though a preemption scheme is scheduled for implementation in the North. A bus signal preemption experiment was operated on Lines 424/425 on Ventura Boulevard in the San Fernando Valley, but was halted several years ago by the Los Angeles Department of Transportation. The term “signal priority” indicates that the traffic signaling system is programmed to provide the privileged vehicle a green signal whenever and as soon as needed. “Signal preference” describes situations where the privileged vehicle will receive a green signal earlier than would otherwise be the case, but not necessarily immediately. Due to traffic flow problems that could result from aggressive use of absolute signal priorities (two-second greens, disruption of major traffic signal patterns, etc.), signal priority is usually reserved solely for use by emergency vehicles (fire, police, ambulance). It is often extremely difficult for transit operators to obtain municipal permission for signal prioritization/preference because of such concerns on the part of city traffic engineers. For example, the Los Angeles County Transportation Commission (LACTC), the MTA predecessor that planned, designed, and constructed the Long Beach-Los Angeles Blue Line, attempted to gain such treatment over the entire right of way in the early- and mid-1980's. The LACTC was only successful with respect to the high-speed mid-corridor section, and then with limitations. Trains stopped at stations in the mid-corridor section can be delayed prior to departing, but once trains are in motion, they will have signal priority to the next station. At that time, LACTC staff projected that an additional seven minutes could have been saved on a one-way trip of approximately 58-59 minutes if preference were to be granted on the non-high speed sections in the Los Angeles and Long Beach CBDs. Recently, the City of Los Angeles Department of Transportation (LA-DOT) granted signal preemption on Washington Blvd., saving approximately three-four minutes per one-way trip. This also allows the reduction of one less train. It will also allow MTA to operate three-car trains (North of the Long Beach street running track segment), although the Blue Line was built with two-car stations.

RUBBER TIRE TRANSIT 5
P a r t 2
Bus-Based Urban Transit
ne of the most intractable ideas that prevents Los Angeles from implementing a functional transit system is rail chauvinism. There is a prevailing mind set in the transit community that a real city simply must have a rail-based transit system, regardless of the history, structure, or actual transit needs of the community. But examples from around the world show that first class cities can thrive
with non-rail transit.
A. Express Bus System (Curitiba)7
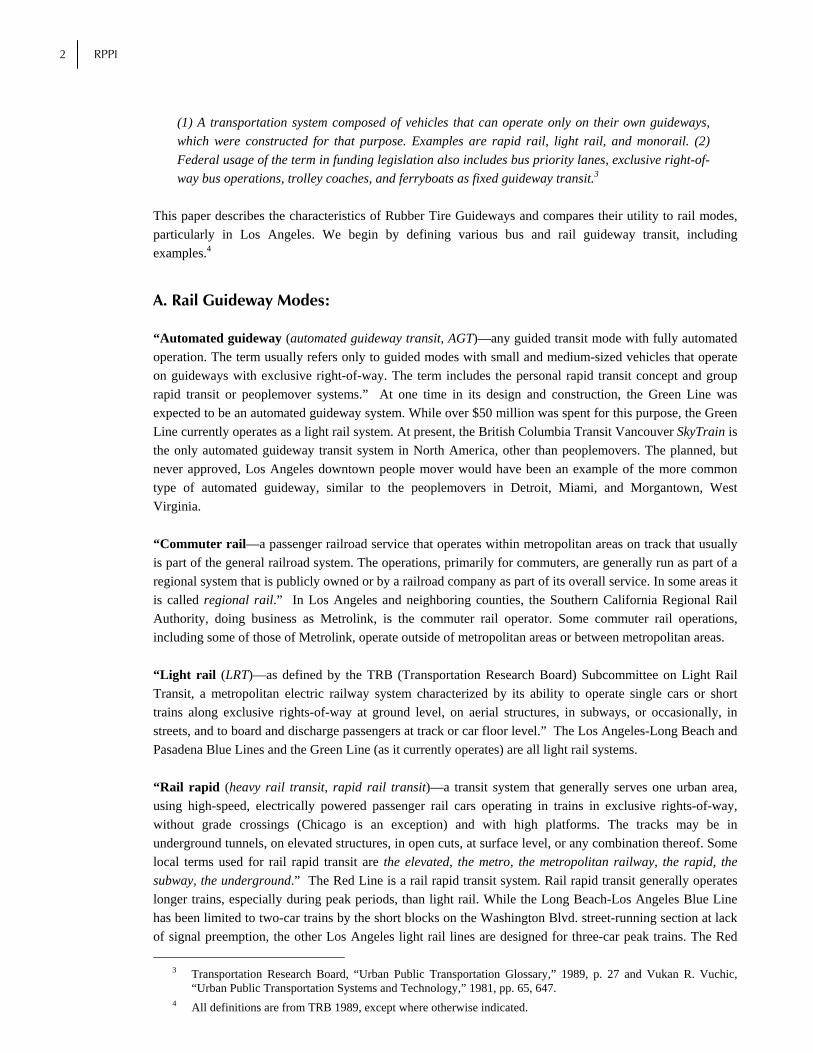
Curitiba, the capital of the State of Parana in Southern Brazil, has one of the best-planned and -implemented and most effectively integrated urban planning and transportation systems in the developing world. The Curitiba approach has had a major impact in the efficient and effective management of the growth of a very dynamic, rapidly developing major urbanized area. The bus system is the most important mode of passenger transportation, carrying 70 percent of weekday trips in 1989.8 Although Curitiba has more cars per capita than any Brazilian city except remote Brasilia, per capita fuel consumption is 25 percent lower than in comparable Brazilian cities, and Curitiba has one of the lowest levels of ambient air pollution in the nation.9 The problems facing Curitiba's city and transportation planners can be illustrated, in large part, by the single statistical time series for population shown in Figure 1. In response to these demands, Curitiba developed a 1966 master plan for the city that includes a bus transit network comprised of several different types of bus service. These include:
• “Express Service”—263 standard, articulated, and double-articulated buses carrying 600,000 passengers per day on approximately 50 miles of dedicated busways operating in five directions to and from the CBD.
• “Feeding Service”—336 buses carrying 350,000 passengers per day on approximately 185 route miles on lines designed to feed passengers to the terminals for the Express buses.
• “Interdistrict Service”—125 buses carrying 200,000 passengers per day on approximately 115 route
miles interconnecting the terminals and do not enter the CBD.
7 Arellano Farias, “Planning Theory Case Study: Public Transportation in Curitiba, Brazil,” October 15, 1996
(unpublished, available from the authors). 8 Route, ridership, and bus numbers from “Urban Transportation World Reference,” Ubranizacao de Curitiba,
S.A., (undated), and briefing by Fria Kerin, Presidente, URBS, May 1997. 9 Jonas Rabinovich and Josef Leitman, “Urban Planning in Curitiba,” Scientific American, March 1996, pp. 46–53.
O
6 RPPI
Figure 1: Population GrowthCuritiba, Brazil
1940 1960 1990 1996 20000,000
500,000
1,000,000
1,500,000
2,000,000
2,500,000
3,000,000
3,500,000
• “Direct Service”—161 buses carrying 200,000 passengers per day on approximately 155 route miles
that provide limited/express service. This is a faster transportation option for specific trips for which there is sufficient demand to justify the service.
• “Conventional Service”—335 buses carrying 250,000 passengers per day connecting the neighborhoods with the CBD.
• “Special Assistance Service”—28 specially equipped minibuses offering free service for physically and mentally challenged riders
• “Park Service”—buses that operate on Sundays and Holidays, using the weekday fleet.
• “Executive Service”—downtown circulator and tourist buses.
• “Circular Service”—15 buses carrying 5,000 passengers per day serving the downtown Central Ring area, connecting to Direct and Express buses and stations.
Each type of service is differentiated by different color schemes (red for Express, orange for Feeder, etc.), which allows riders to easily avoid boarding errors. The first four services, Express, Feeding, Interdistrict, and Direct, are the products of the integrated transit plan (ITP). These total approximately 235 routes on 500 route miles serving approximately 90 percent of the urbanized area population, generating approximately 1.8 million unlinked (1.2 million linked) trips per day. The remaining 10 percent of the area is still served by Conventional bus service, which is now largely the remnants of the preexisting bus system, and is being gradually reduced as the elements of the ITP network are implemented and fine tuned.

RUBBER TIRE TRANSIT 7
The Express portion of the bus system was, in part, designed to operate much like a subway on rubber tires. Know as “Ligherino” (“Lite”), it was specifically conceived to operate in a fast, comfortable, and efficient manner to serve the populace of the entire area at the same fare as the rest of the bus network. Stops were limited for this high-speed, long-distance travel component of the system, with an average distance between major terminal/transfer points of approximately two kilometers and guideway stops approximately every half kilometer. The 88 Ligherino bus stops are tubes, constructed of laminated glass and steel, with fare collection turnstile entrances and exits, where approximately 10–200 riders can await their buses protected from the weather. Tube size is keyed to demand. There are no stairs on the Ligherino buses. The station platform height is the same as that of the bus floor, which, together with fare payment when entering the station, increases boarding/alighting speed by a factor of approximately four. The Ligherino buses travel on dedicated rights of way at average speeds of about 21 miles per hour. While this speed is significantly less than the freeway express bus service typical for North America, it provides a significant speed advantage for many travelers in Curitiba, saving as much as 15 minutes on a typical 8–10 miles peak period trip. This vehicle operating speed is only slightly lower than that of the Red Line (projected to be 24 mph) and Blue Line (22 mph) and is faster than most light rail lines in the United States. The North/South Ligherino line carries approximately 15,000 passengers per hour at peak in the peak direction, a figure comparable to that of the Rio de Janeiro Metro—and well in excess of the maximum capacity of the Los Angeles Red Line outside of the CBD. Curitiba also uses double-articulated buses on its most heavily utilized line, the Boqueron-Central Ring Line. Approximately 80 feet long with two flex hinges and five doors, the maximum vehicle load is 270—significantly more than a light rail car. Nicknamed the “Surface Metro,” these buses allow daily ridership as high as 130,000 passengers per line—many times the 40,000/day ridership of the Blue Line, the most heavily utilized U.S. light rail line, and more than many heavy rail lines. The cost of the entire Ligherino system was $45 million—approximately 20 percent of the estimated cost of a single electric light rail line. A subway system was estimated to cost $60-70 million per kilometer, while the cost of express bus guideways was $200,000–$700,000 per kilometer.10
B. Pure Busway (OC Transpo)
Ottawa, Canada's capital city, has one of the world's most extensive systems of exclusive busways. After a detailed study of transit alternatives, the Regional Municipality of Ottawa-Carelton determined that transit would be a key component of the regional plan and that a busway system would be more responsive to the requirements of the area than a rail system. In 1974, it made the decision to construct and operate the busway system and assigned the responsibility to the Ottawa-Carleton Regional Transit Commission (OC Transpo). With the opening of the final 1.12 mile extension of the Southwest Transitway on November 3, 1996, the total Transitway system now extends 19.3 miles—with plans for an additional nine miles in the short-term and an additional nine in the longer term.11 The busways consist of exclusive two-lane roadways, widening at stations to allow express buses to pass locals. Stations are generally comparable to North American light
10 Rabinovich and Leitman estimate the cost at $200,000 per kilometer. The author’s estimate of $700,000 per
kilometer is based on interviews of URBS and City of Curitiba personnel. 11 “OC Transpo Opens Transitway With Free Bus Rides, Tours,” Passenger Transport, November 18, 1996, p. 1.

8 RPPI
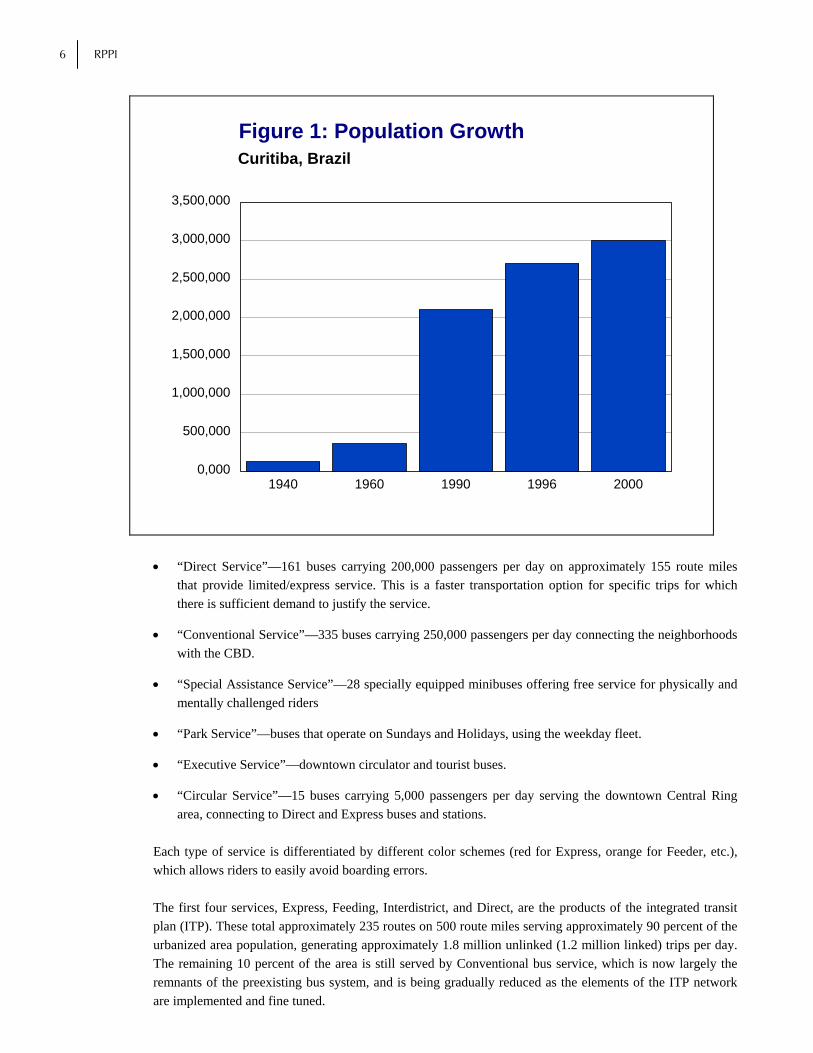
rail stations, such as those constructed for the Blue and Green Lines in Los Angeles. There are currently 28 stations, including five in the CBD.12 These busways are supported by other bus guideway and support facilities, including bus lanes on general purpose freeways (approximately ten miles), bus lanes in malls (two, each of approximately one-quarter mile) and surface streets (approximately six miles), for a total bus guideways system of approximately 36 miles. The metropolitan area has a population of approximately half a million. The total weekday busway use was approximately 200,000 prior to the opening of the most recent extension.13 Table 1 compares these statistics with various U.S. rail systems constructed after World War II. The OC Transpo Busway system performs very well. Its daily ridership far exceeds the ridership of all light rail systems (200,000 vs. 42,560 for San Diego, the highest ridership light rail system) and is comparable to the heavy rail systems (BART at 261,750 exceeds the OC Transpo busway ridership, but only by 30 percent, in a far larger metropolitan area with a far longer guideway system). In ridership per capita, it far exceeds the highest rated rail system. OC Transpo’s 0.4 boardings per capital, is over twice Atlanta's value of 0.181, and over seven times the rail average of 0.054. The most distinct feature of the Ottawa system is the right-of-way priorities that have been given to bus. Except for one HOV-3 lane, all other facilities are exclusive busways. The success of the Transitway and the other integrated Rubber Tire Guideways has had major implications for surface transportation in Ottawa.
(D)ue to the success of transit, there have been no major increases to road capacity in the central areas since 1971 and the number of cars leaving the central area in the PM peak hour has actually declined, although employment and total person-trips have continued to increase. Door-to-door travel time on the busway system is competitive with auto door-to-door travel time.14
Overall, Ottawa's transitway is a well-planned and implemented bus system that must be regarded as a key component of one of the most successful surface transportation networks in North America. Besides providing excellent and highly utilized service to the CBD, busways have also been built to newly developed residential areas that have been planned simultaneously with the transportation system. One of the notable results of this excellent transportation plan is the attractiveness of the resulting physical features. The excellent integration of the busways and stations into the areas they serve is generally regarded as one of the more successful features of the system. The contrast between the visual impacts of the OC Transpo transitway system and the impacts of a light rail system, with rail’s required track, ties, ballast, and overhead catenary, is dramatic.
C. Busway/HOV Lane (Houston)
In 1978, the voters of Harris County (greater Houston), Texas passed a 1-cent retail sales tax to fund major transit improvements for what was then not only one of the nation's largest metropolitan areas (currently fourth largest), but one of the most dynamic and fastest growing.15
12 Van Wilkins, “Busways: Rapid Transit of the Future,” Bus World, Fall 1985, pp. 12–19; David R. Martinelli, “A
Systematic Review of Busways,” Journal of Transportation Engineering, May/June 1996, pp. 192–199. 13 Marteinelli, “A Systematic Review…” and Van Wilkins, “Busways—Economical Rapid Transit,” Mass Transit,
July/August 1990, pp. 16–19. 14 Ian Stacy, “OC Transportation General Manager,” The Urban Transportation Monitor, September 15, 1995. 15 Van Wilkins, 1985.
RUBBER TIRE TRANSIT 9
Houston was one of the last of the major U.S. cities to begin an effective transition from a highly deteriorated for-profit bus operation to a government-funded and controlled transit operation. At that time, Houston's transit system was by far the smallest of any major U.S. metro areas, consisting of a little over 200 buses. As is typical of such transit tax issues, the original plan presented to the voters included many rail lines from the CBD to various suburban centers and residential areas, and
included rapid construction of busways that would later be converted to rail. The rail plan progressed and was ready to begin implementation when, in the early 1980's, Harris County voters rejected bonding against the existing sales tax to finance the first components of the proposed rail network. While the local rail proponents continued to advance their plans for some years, the local decision makers eventually determined that the best course for the area would be the continued development of rubber tire transit without rail. The busway network, which began construction in 1982, is projected to reach 105 miles in length by the turn of the century. Fortunately for those interested in relating cause and effect in the real world, the Texas Transportation Institute (TTI) maintains an extensive, on-going effort to monitor the utilization and productivity of the Harris County HOV/Busway system for the Texas Department of Transportation. Project 1353 is designed to determine if HOV lanes in Houston and Dallas are effectively moving more people, rather than merely diverting traffic flow from the general-purpose lanes. The latest results show that the HOV lanes in both cities are generally successful in saving trip time, reducing vehicle emissions and fuel consumption, and freeing up general-purpose freeway lanes to better accommodate demand. Houston's HOV lanes carry 78,000 people per day, serving 35,000 vehicles that would otherwise travel primarily on general purpose freeway lanes. Freeway travel averages 24 mph during rush hours, while HOV traffic averages 50 to 55 mph. Bus operating speeds on freeways have nearly doubled from 26 to 49 mph, which is important, because the Houston bus route network has more commuter express service from suburbs than do most transit systems in large U.S. metro areas. The resulting four percent reduction in areawide congestion is estimated to produce an annual reduction in congestion costs of $130 million.
16 U.S. Ridership and Service Area Population from FTA, “Transit Profiles—Agencies in Urbanized Areas
Exceeding 200,000 Population for the 1994 Nation Transit Database Report Year,” December 1995.
Table 1: Guideway Transit System Comparisons
City or System Daily Ridership16
Service Area Population
Daily Ridership/Area
Population OC Transpo Busways 200,000 500,000 .400
Atlanta Heavy Rail 224,137 1,241,667 .181
BART Heavy Rail 261,750 3,629,516 .072
Baltimore Rail Total 77,142 2,077,667 .037
Miami Rail Total 58,857 1,735,000 .034
Miami Heavy Rail 47,476 1,735,000 .027
Buffalo Light Rail 28,752 1,182,165 .024
Portland Light Rail 25,635 1,172,158 .022
Baltimore Heavy Rail 37,144 2,077,667 .018
San Diego Light Rail 42,560 2,348,417 .018
Baltimore Light Rail 20,400 2,077,667 .010
Baltimore Commuter Rail 19,598 2,077,667 .009
Miami People Mover 11,381 1,735,000 .007
Rail Totals/Average 718,833 13,386,590 .054

10 RPPI
To measure the success of HOV facilities, researchers examined numerous factors, including the occupancy per vehicle and the impact on overall per-lane efficiency, defined as the person volume per lane times the average speed. These data show that Houston and Dallas HOV lanes are producing throughputs of 72 to 280 percent more than comparable general-purpose freeway lanes. Well over half the HOV lane users polled report that they have chosen to carpool or use transit because of the existence of the HOV lanes. On typical non-traffic incident days, HOV lane users save from five to fifteen minutes per trip, depending on which freeway was studied. One of the most interesting aspects of the study is that the HOV users' perceived time savings is much greater than the actual time savings—a most significant finding with respect to predicting mode choice decisions.
D. SR91 HOT Lane (Orange County)
There are two basic approaches to high occupancy/toll lanes. One is to build dedicated lanes principally or solely for the use of travelers willing to pay the toll for faster travel. The other is to build an HOV lane for the use of buses, carpools, and vanpools and then sell the excess capacity. These two approaches are not strictly separate. Orange County, California provides an excellent example of the former. A private, for-profit entity, the California Private Transportation Co., paid for the construction of, and operates HOT lanes co-located with, State Route 91, the Riverside Freeway. Daily use is currently approximately 24,000, with each car paying up to $2.75. The SR 91 HOT lane project is successful enough that the owners are actively searching for additional HOT lane investment opportunities.17 The acceptance of the HOT lane concept by the drivers of Orange County can best be measured by their ready willingness to vote with their wallets. While construction of dedicated HOT lanes is certainly possible in Los Angeles County, there are also many excellent opportunities for implementing the second approach. Virtually all of the planned Los Angeles County HOV lanes are likely to have excess capacity in their early years, particularly if they are implemented as HOV-3 lanes. The MTA's position on HOT lanes can perhaps best be described as “developing.” The 1995 Long Range Plan (LRP) made scant mention of HOT lanes, stating that,
High-occupancy toll lanes and private sector-sponsored projects will be investigated in at least one or two corridors for possible future demonstration.18
The LRP also appears to assume that most HOV lanes will originally be opened as HOV-2, but voices concern that upgrading requirements to HOV-3 may be necessary fairly soon to avoid HOV lane congestion. In updating the LRP, the MTA appears to have significantly increased its projected freeway and HOV speeds, presumably in response to changes in the Southern California Association of Governments' population and employment estimates. This suggests less pressure on HOV capacity. However, MTA also appears to be giving more consideration to opening new HOV lanes as HOV-3 facilities; and to broader application of HOT lane principles. Some groups may complain about the undemocratic nature of HOT lanes, where those who can pay are able to take advantage of faster transportation options, but the poor cannot. But this is a canard: there are many
17 Kim Clark, “How to Make Traffic Jams a Thing of the Past,” Fortune, March 31, 1997, p. 34. 18 MTA, “A Plan for Los Angeles County: Transportation for the 21st Century,” March, 1995, p. 79.

RUBBER TIRE TRANSIT 11
good reasons for the poor to support HOT lanes. First, there is a shortfall of funding for additional transportation capacity of any sort, and HOT lanes provide one of the best opportunities to attract funds from the private sector. If this new source of funding is not tapped, there will be few improvements for anyone. Second, as those willing to pay leave general purpose lanes, those who stay behind can travel faster. Finally, to assume that people with lower incomes have valueless time is odious. Like everyone else who drives, low-income motorists have events in their lives that require punctuality, such as births, deaths, hospital visits, high-school graduations, and so on. To assume that they would rather miss such critical events than pay a few dollars is simply ridiculous. Long-time Los Angeles residents may remember the infamous Diamond Lane experiment of 1976. A general purpose lane on the Santa Monica Freeway, the busiest roadway in the United States, was converted to a HOV demonstration project. The resulting outcry from the non-HOV users was so severe that the political decision-makers reversed the demonstration project in record time. The State legislature subsequently made it illegal to restrict existing general purpose lanes to HOV use. A very similar event occurred in 1992, when I-66 in Virginia, which was specifically built to be an HOV-only facility during peak periods, was forced back into general purpose use. The HOV lanes were originally opened for general purpose use for what was supposed to be a limited time, but the attempt to convert them back to HOV status was made during a hotly contested Congressional election.19 These experiences suggest that any attempt to convert HOV-2 lanes to HOV-3 status introduces the risk of severe reactions from HOV-2 users who would be disenfranchised by the change. Indeed, at the present time, there is some pressure on MTA and Caltrans to convert the El Monte to HOV-2 because the other HOV lanes in the County are HOV-2. This conversion dilemma suggests that MTA should open new HOV lanes as HOV-3 facilities, not HOV-2.
E. Bus Transit Mall (Portland)
During the last decade, rail proponents have frequently pointed to the Tri-County Metropolitan Transportation District (Tri-Met) Banfield Light Rail Transit as a positive example of what a light rail line can add to a downtown area. One of the most cost-effective of the post-1980 generation of light rail projects in North America, this Portland, Oregon system carried almost 8.5 million passengers 46.4 million passenger miles in fiscal year 1994, operating up to 23 rail cars during the peak.20 Tri-Met is currently in the process of constructing a Westward extension of its Light Rail system. Although the proposal to extend rail Northward into Vancouver, Washington appears to have been at least delayed by the results of a recent ballot referendum, Tri-Met is proceeding with plans for lines North and South of the CBD. The agency’s most recent effort was a creative attempt to seek legislation creating new flexible funding sources for transportation services for the disabled, shift these new funds to transit agencies, and make existing funding for transit services for the disabled available to pay for light rail bonds. Tri-Met’s reward from the Oregon legislature was SB 485, which places new limits on the amount of lobbying taxpayer agencies are allowed to do.
19 Joseph R. Stowers, “HOV Lessons from the Dulles Toll Road,” TR News, January-February 1994, pp. 5-9. 20 “FTA, Transit Profiles—Agencies in Urbanized Areas Exceeding 200,000 Population For the 1994 National
Transit Database Report Year,” p. 207.
12 RPPI
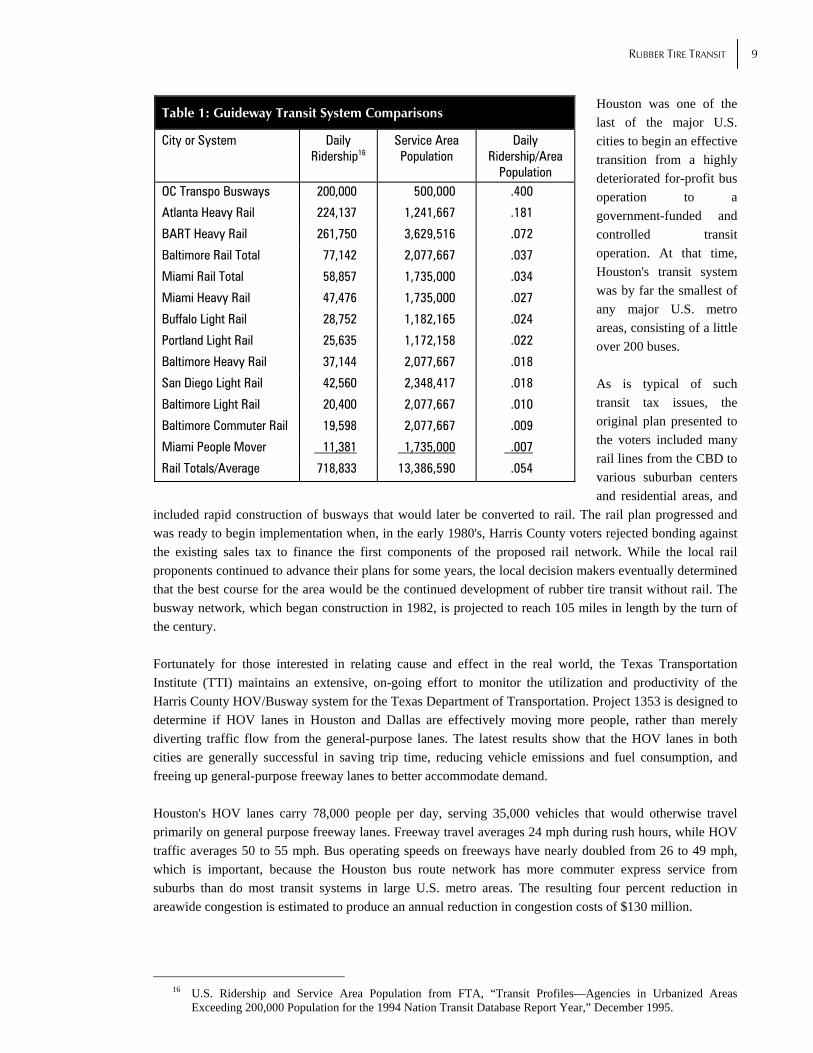
Portland's CBD bus transit mall has received far less attention, but has had a far larger impact on public transit use. In fiscal year 1994, the Tri-Met bus system carried 182.1 million passengers a total of 208.1 million passenger miles on a peak fleet of 499 buses. The heart of Portland's CBD has a long and narrow North-South orientation, running between the Willamette River to the East and the river bluffs to the West. In the 1970's, Tri-Met implemented a bus mall operating on Fifth and Sixth Streets, a pair of parallel, North-South, opposing one-way streets. One of the better-designed and executed transit malls in North America, the mall features large, semi-enclosed bus stop shelters offering effective protection against the area's frequent rains, and computerized information on the next arriving buses on each line. Considerable attention was paid to all the street hardware, including everything from trash cans to water fountains to paving bricks in the “Rail” mall. The facility adds considerably to the attractiveness of the area. Service through the mall and the greater downtown area is operated on a fareless square basis, providing free trips within the boundaries of the downtown. The rail system operates on a loop through the CBD on two streets perpendicular to the bus mall, providing excellent interchange between the light rail system and the mass of bus lines serving downtown Portland. When the Westside light line is completed, the loop and return service will be converted to through service from Westside to Eastside and vice versa. Tri-Met has been studying alternatives for the North-South light rail service through the CBD, including operating the proposed North-South rail line through what is now the bus mall. The Tri-Met 1990 Bus Passenger Census reports approximately 66,000 weekday bus boardings in the mall, compared to approximately 10,000 light rail boardings in the CBD.21 Use of the bus mall was, and is, far higher than rail use in the CBD. As Tri-Met continues to (try to) build rail lines, the ratio may change, particularly since Tri-Met evidently plans to follow the standard transit practice of converting a large share of the bus lines that formerly served the Portland CBD directly into feeder lines for the light rail system. One of the rationales for adding light rail service was concern that the bus mall use was approaching the facility’s capacity of 195 boardings per hour, potentially upgradable to 240 by changing from the existing two-block spacing between stops to three-block spacing.22 However, when the light rail loop was built, the net effect was to construct a new CBD transit mall perpendicular to the existing bus mall, adding considerable additional transit mall capacity. This new capacity could have been added without the rail component. A well-designed and implemented bus transit mall can upgrade the physical appearance and livability of a downtown, and can provide far more capacity than a comparable light rail line and mall at a considerably lower cost. The rail mall cost over $20 million. The original bus mall cost under $10 million. The Portland transit malls have proven excellent additions to the greater Portland transportation network.
F. Dedicated Lane On General Use Street (Spring Street Counterflow Lane)
For many years, the MTA and other Los Angeles County bus transit operators have utilized the Spring Street counterflow lane. Spring Street is a one-way, southbound street through the historic core of the Los Angeles CBD. The eastmost lane has been converted to a northbound lane for the exclusive use of buses and emergency vehicles over a distance of approximately 1.3 miles (ten blocks).
21 Young Park, (then) Tri-Met Rail Corridor Planner, “Portland Transit Mall Findings Report (Draft Final Report),”
APTA 1994 Rapid Rail Conference, p. 35. 22 Park, p. 2.
RUBBER TIRE TRANSIT 13
At peak, the number of buses using the counterflow lane approaches and sometimes exceeds 200 per hour—more than one vehicle every twenty seconds. The number of routes is large enough that there are generally two sets of bus stops per block, with the various lines assigned to one or the other. The Busway has operated close to its capacity for many years, often with three or four buses lined up at a stop. While counterflow lane buses do not face the problem of pulling away from a bus stop into an active traffic lane, the difficulty following buses at a bus stop face in moving around lead buses that have not completed their boarding/alighting operations can be even more troublesome. The counterflow lane approach, while useful in certain situations, does have problems. First, since there is only a single lane, any problems that block the lane require buses to jog around the obstacle into a lane that normally flows in the opposite direction. Also, jay-walkers may be at more risk because they may be less likely to check for buses traveling in the counterflow direction. Finally, emergency vehicle operations in the counterflow lane can interfere with efficient transit operations.
G. Signal Preemption/Prioritization (Ventura Blvd.)
Signal preemption for transit vehicles has been technically available for well over a decade, but has not been widely used for buses and other rubber tire vehicles. In the mid-1980's, the Southern California Rapid Transit District (the transit operations predecessor of MTA) was a participant in a signal preemption demonstration conducted by LA-DOT. Eighty-seven buses, operating on Lines 424/425, the busiest line in the San Fernando Valley, were equipped with strobe devices that “flashed” green traffic signals at intersections on Ventura Blvd. The devices extended green phases for 30 seconds, which allowed buses to reduce operating time and increase travel speed by avoiding red lights. Initial operating and mechanical difficulties were largely overcome by second generation modifications. The demonstration was generally viewed as successful by bus operations and transit. Unfortunately, the bus component of this demonstration, was halted by LA-DOT after a only a few years, and has not been repeated. A different type of signal preference is commonly used for rail transit. Individual vehicle-mounted transmitters can be used by light rail vehicles operating in mixed traffic, such as the Blue Line on Flower and Washington just South of the Los Angeles CBD. This type of preemption is not desirable for alignments such as the Blue Line mid-corridor, where trains operate at high speeds through intersections protected by traffic signals. In such corridors, the standard technical solution is to synchronize traffic signals with each train’s departure from the station, allowing the train to receive the green phase at each signalized intersection until the train reaches the next station. The requirements of such signalization logic is complicated by trains operating between the same pair of stations in opposite directions. Providing preference to transit vehicles through signalized intersections can significantly increase the speed of travel for transit passengers, decreasing transit operating costs and increasing the competitiveness of transit. However, such actions can interfere with non-transit vehicle movements. Even more important, transit preference can be perceived by automobile travelers as slowing their travel, and these automobile users may express their displeasure to their elected representatives. City/county traffic engineers, with years of experience in optimizing automobile traffic flows, are often less convinced by arguments that speeding travel for 35 people in a bus is a good thing than by their long experience with public reactions to changes in signal timing plans. The political difficulties inherent in transit vehicle signal preemption may be more important than the technical issues.

14 RPPI
P a r t 3
Costs and Cost-Effectiveness
ollowing the standard format for summarizing transit finances, we divide costs into two major components, capital costs and operating costs. The discussion of capital costs accounts for both local cost and external capital grants. The discussion of operating costs accounts for operating revenues (mainly fares), external subsidies, local subsidies, and cost-effectiveness. No distinction is drawn
between local and total costs because the non-local share of operating costs is very small.
A. Capital Costs
The costs shown in Table 2 represent a reasonable range of local and total capital cost estimates for typical, usually Los Angeles-specific projects. Such estimates are subject to considerable variation, depending upon the details of each project. There are broad ranges of alternatives in the design and operation of guideway transportation. These decisions, along with local geographic, physical, and other conditions, have a major impact on the trade-off between what is desirable and what is possible. Capital costs are shown as ranges on a per mile, bi-directional basis, expressed in 1996 dollars. A bi-directional guideway allows transportation in two directions. For pure busways and busway/HOV options, where the guideway and the vehicles together form a new transit system, capital costs include vehicles and support equipment. We assume a peak headway of one minute. Only costs for the physical guideway are shown for Rubber Tire Guideways where the purpose of the guideway is to allow existing buses and HOVs to operate faster or more cost-effectively, or to encourage greater use of transit and HOVs.23 Los Angeles County costs are used where possible, as noted. Guideway costs are generally higher closer to CBDs because of higher costs for land acquisition, and the greater difficulties associated with design and construction. “Local Tax” cost refers to the portion of the cost paid by local taxpayers, with emphasis on Los Angeles County experience. Costs of similar rail lines outside of Los Angeles are likely to be considerably lower in most cases.
23 In such situations, the faster speed of travel reduces the number of buses required to provide the same level of
service. Consider a conventional street-running bus route ten miles long (one way). If we assume a five-minute recovery time at each end of the run, and a 12 mph street operating speed, the total round trip time is: [(10 miles x 2 trips per round trip / 12 miles per hour) x 60 minutes per hour] + 5 minutes per recovery x 2 recoveries = 110 minutes per round trip. (eq. 1)
Thus the number of buses (not including spares) needed to maintain a five-minute peak headway is 110 minutes / 5 minutes headway = 22 buses. (eq. 2)
If the improvements associated with a Rubber Tire Guideway increases the operating speed to 15 mph, then the total round trip time drops to 90 minutes, and the peak bus requirement drops to 18. An increase to 20 mph drops the vehicle requirement to 14, and an increase to 24 mph reduces the vehicle requirement to 10. However, faster travel speed often leads to higher demand, and more buses might be required to handle increased ridership. We assume no change in capital cost, which implies that increases in speed and ridership offset each other.
F

RUBBER TIRE TRANSIT 15
The MTA has consistently failed to correctly account for many of the costs of rail. MTA is required by both generally accepted accounting principles (GAAP) and state legislation to capitalize interest costs during construction, but it has never done so.24 Properly recognizing capitalized interest would add from tens of millions to potentially over $100 million to the costs of specific rail lines. Arguably, the capital costs of such projects should also include the capitalized interest on grantor (Federal and State of California government) borrowings to fund the projects; or, alternatively, a cost of capital charge, such as the 7 percent cost of capital rate mandated by the Federal Transit Administration. We have not included such bus and rail costs here because such expenses are not normally included under either GAAP or industry costing conventions, and because the data required to perform the calculations are not available. MTA has also taken important rail components out of specific rail line budgets. The largest example of this was establishing the “LA Car” purchase as a separate line item budget. Originally $258 million, this expense was subsequently reduced to approximately $228 million by reducing the size of the order. These costs are not associated with the Green and Pasadena Lines, where the vehicles are to be used (at least to the extent that these cars will be used). In past years, MTA has not allocated tens of millions of dollars in annual general and administrative overhead costs with the rail lines to which these costs should be applied. Under GAAP transit industry accounting practices and PUC requirements, such costs should be shown as costs of these rail lines. If MTA had followed proper accounting practices, the costs of MTA rail lines would be increased by approximately 10 percent to 30 percent. We have increased MTA’s reported costs by conservative increments to better reflect the real costs of each line. Consistent with GAAP standards, we show interest on borrowings to build rail lines after the commencement of revenue operations as operating, rather than capital costs. We convert costs per unit of guideway into costs per unit of transit consumption, specifically passenger-miles. For rail modes, the formula for the calculation of passenger-miles per hour is:
trains per hour x cars per train x average passenger load per car x average speed in miles per hour = passenger-miles per hour.25 (eq. 3)
For Rubber Tire Guideway modes, expression (eq. 3) is simplified because there is always only one car per train. This standard calculation includes an implicit assumption that all guideways are at least as long as the distance that can be traveled on them in one hour. Our purpose is to calculate the cost per mile of guideway, so an adjustment is necessary to produce passenger-miles produced per mile of guideway. We account for the importance of speed in generating passenger-miles by multiplying the product on (eq. 3) by 1/60. This indexes the passenger-miles per mile of guideway subject to one minute operation. This recognizes the importance of higher speeds in producing greater throughput.
24 The relevant legislation literally has LACTC's name on it. PUC 130510-130519 was originally passed as the
“Los Angeles County Transportation Commission Revenue Bond Act.” 25 This methodology is adapted from Vukan R. Vuchic, “Urban Public Transportation Systems and Technology,”
1981, p. 70.

16 RPPI
Table 2: Total Capital Cost and Local Tax Burden (1996 $Millions) of Transit Options, per Guideway Mile, by Mode
Transit Mode Total Capital Local Tax RUBBER TIRE GUIDEWAY A. Pure Busway $5–35a $2–25 B. Busway/HOV Lane 5–30b,26 2–20 C. HOT Lane 5–31c 0–10 D. Bus Transit Mall 3–10d 1–8 E. Dedicated Lane on General Use Street 1–5e 1–3 F. Signal Preemption/Prioritization 1–2f 1 RAIL GUIDEWAY A. Heavy Rail $200–550g,27 $80–200 B. Light Rail 50–80h,28 30–60 C. Automated Guideway 45–85i 25–65 D. Downtown People Mover 20–50j 15–40 E. Commuter Rail 2–6k,29 1–4 a The small increase over “Busway/HOV Lane” costs reflects costs of stations and more complex guideway entrances and exits. Costs reported for vehicles and supporting assets are our estimates. b Costs reported for vehicles and supporting assets are our estimates. c The small increase over cost of HOV lanes reflects the costs of electronic toll collection gear and other elements. “Local Tax” is lower due to the self-financing provided by tolls. This does not comprehend bus use, and bus costs are not included. In many corridors, HOT lanes could return a profit to investors. d This estimate is based on the costs of Portland and Denver busways. The “Local Tax” component can be lower if benefit assessment district or other non-general tax financing is used. The costs of buses and operating and maintenance facilities are not included. e This is our estimate based on existing streets and modifications limited to minor changes, such as curbs cuts for off-line bus stops, signage, and lane separation barriers. The costs of buses and operating and maintenance facilities are not included. f This is our estimate based on a system and bus fleet large enough to achieve economies of scale. The costs of buses and operating and maintenance facilities are not included. g The low end of the range is defined by the five-mile San Fernando Valley Red Line, which is $1,082 million in 2004-2013 dollars. The high end is defined by the three-mile Red Line Segment 1, which is $1,418 million in 1986-93 dollars. h The high end of the range is defined by the 13.5 mile Pasadena Blue Line, originally estimated at $998 million, and later reduced to slightly over $800 million in 1994-2003 dollars, plus the cost of rail cars and other items not included by MTA. The low end of the range is our attempt to construct a more likely estimate by discounting the extraordinarily high cost of the Pasadena line. i This is our estimate, constructed based on BC Transit’s experience Vancouver SkyTrain, and the additional costs of automation incurred by the MTA for the Green Line. We adjusted this initial range by subtracting of $5 million per mile from the low end of the interval, and adding $5 million per mile to the high end. It is difficult to properly classify the Green Line. At one point, the Green Line was intended to be an automated guideway system. Tens of millions of dollars were spent on automation, but this idea was eventually abandoned. The vehicles are designed to light rail standards, as is the proposal power system and other components. But the method and speed of operation, combined with a 100 percent grade separated guideway, is more typical of heavy or rapid rail. Rapid rail generally operates with a minimum of four-car trains, and more commonly operates with six-to-ten car trains. The Green Line currently operates with one-car trains. j This is our estimate based on recent Los Angeles experience. These cost can vary significantly due to great differences in the cost of guideway construction, and who pays for additional costs. Guideway designs range from simple to tunnels to integrated with buildings. k We estimate the total capital cost of Metrolink at approximately $1.2 billion for approximately 300 miles of commuter rail right-of-way.
26 These values are based on data from “A Plan for Los Angeles County: Transportation for the 21st Century,”
MTA, March 1996; “A Plan for Los Angeles County: Transportation for the 21st Century—Technical Appendices,” MTA, adopted March 22, 1995; and “A Plan for Los Angeles County: Transportation for the 21st Century—Supporting Cash Flows,” MTA, adopted March 22, 1995.
27 “A Plan for Los Angeles County: Transportation for the 21st Century,” MTA, March 1996, pp. 127–131, increased for costs not included by MTA, such as direct rail segment costs not shown as such, capitalized interest, overhead and administration, etc.
28 These upper bound is based on data from “A Plan for Los Angeles County: Transportation for the 21st Century,” MTA, March 1996.
29 Based upon $823 million (Southern California Regional Rail Authority Annual Budget Fiscal Year 1992–93, p. 2) initial Metrolink capital budget plus authors’ estimates of additional costs for Sante Fe right-of-way purchase, rail stations, and upgrade of line to North Los Angeles County.

RUBBER TIRE TRANSIT 17
Our calculations include a number of implicit assumptions, but are based as fully as possible on actual National Transit Database (Section 15) data from the Federal Transit Administration, and on standard industry practices. Table 3 shows the total capital and local tax costs per passenger mile for different transit modes, assuming a forty-year life for fixed facilities and 254 working weekdays per year, and relying on the midpoints of the costs intervals shown in Table 2.
Table 3: Total Capital Cost and Local Tax Burden (1996 $Millions) of Transit Options, per Passenger-Mile, by Mode
Transit Mode Total Capital Local Tax
RUBBER TIRE GUIDEWAY A. Pure Busway $.007–.046 $.003–.033 B. Busway/HOV Lane .002–.015 .001–.010 C. HOT Lane .002–.015 0–.005 D. Bus Transit Mall .008–.027 .003–.027 RAIL GUIDEWAY A. Heavy Rail .16–.43 .06–.16 B. Light Rail .20–.31 .12–.24 C. Automated Guideway .06–.10 .03–.08 D. Downtown People Mover .16–.41 .12–.33 E. Commuter Rail .008–.024 .004–.015
B. Operating Costs and Cost-Effectiveness
Table 4 shows operating costs and taxpayer subsidies for transit operating modes. Since the overwhelming majority of operating subsidies come from local taxes, we do not present local subsidies, but only total taxpayer subsidies. Calculating total costs and subsidies requires a choice of assumptions and combinations of the capital and operating elements calculated above. Costs may vary substantially depending upon the specific guideways and operating modes being considered. We have attempted to be representative and consistent. We assume that:
• Short/Medium-Distance Busways are operated with the MTA or Los Angeles Privatized Bus (Foothill Transit) cost structure;
• Bus Transit Malls are operated with the MTA or Los Angeles Privatized Bus cost structure; and
• Long Distance Busways are operated with the Los Angeles Privatized Bus or New Jersey Long Haul Express Bus cost structure.
18 RPPI
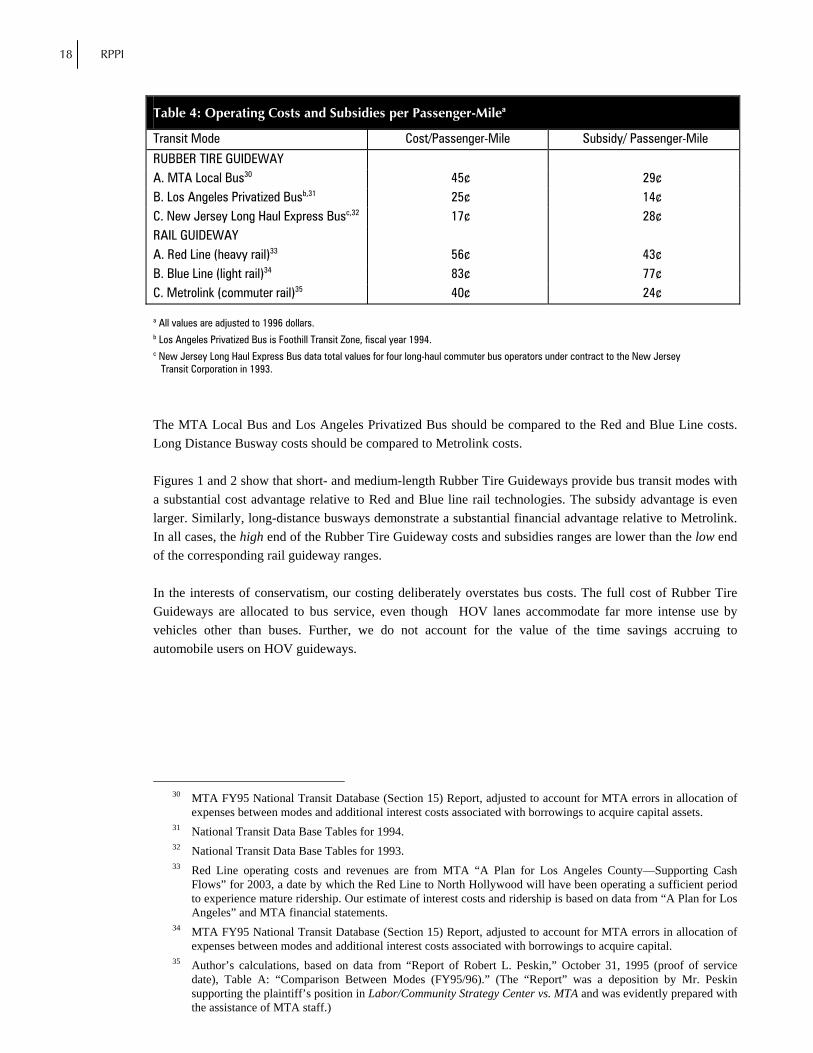
Table 4: Operating Costs and Subsidies per Passenger-Milea
Transit Mode Cost/Passenger-Mile Subsidy/ Passenger-Mile
RUBBER TIRE GUIDEWAY A. MTA Local Bus30 45¢ 29¢ B. Los Angeles Privatized Busb,31 25¢ 14¢ C. New Jersey Long Haul Express Busc,32 17¢ 28¢ RAIL GUIDEWAY A. Red Line (heavy rail)33 56¢ 43¢ B. Blue Line (light rail)34 83¢ 77¢ C. Metrolink (commuter rail)35 40¢ 24¢
a All values are adjusted to 1996 dollars. b Los Angeles Privatized Bus is Foothill Transit Zone, fiscal year 1994. c New Jersey Long Haul Express Bus data total values for four long-haul commuter bus operators under contract to the New Jersey Transit Corporation in 1993.
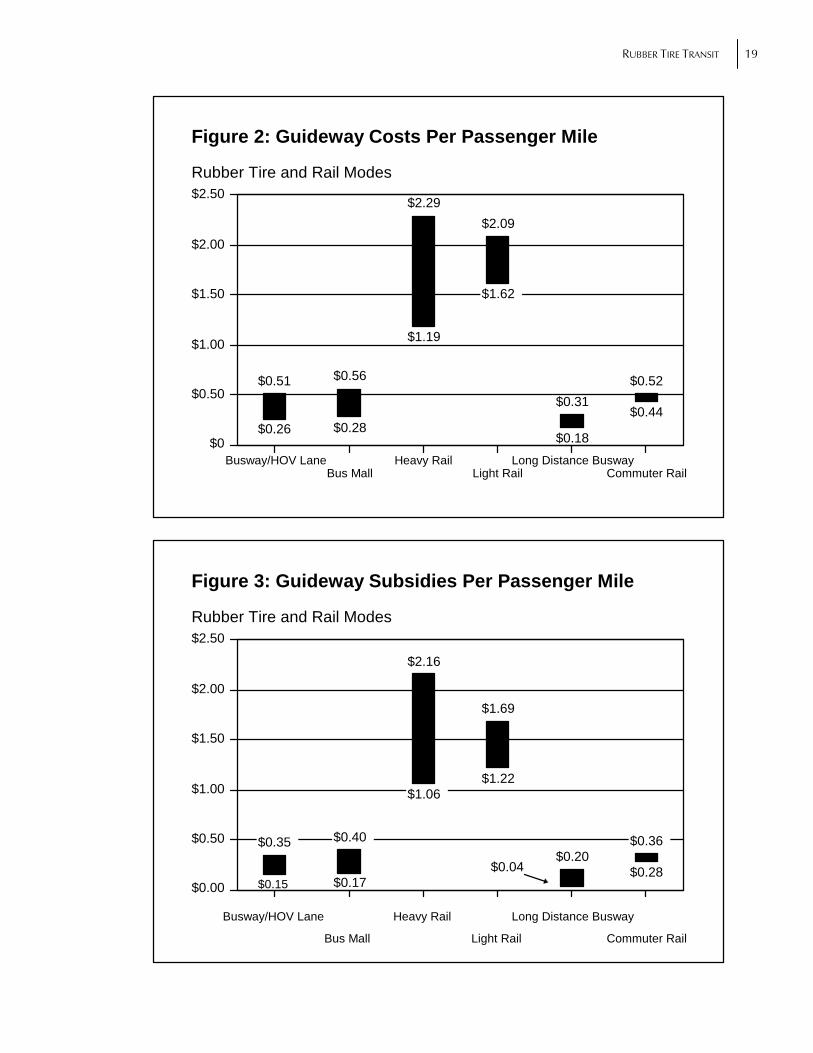
The MTA Local Bus and Los Angeles Privatized Bus should be compared to the Red and Blue Line costs. Long Distance Busway costs should be compared to Metrolink costs. Figures 1 and 2 show that short- and medium-length Rubber Tire Guideways provide bus transit modes with a substantial cost advantage relative to Red and Blue line rail technologies. The subsidy advantage is even larger. Similarly, long-distance busways demonstrate a substantial financial advantage relative to Metrolink. In all cases, the high end of the Rubber Tire Guideway costs and subsidies ranges are lower than the low end of the corresponding rail guideway ranges. In the interests of conservatism, our costing deliberately overstates bus costs. The full cost of Rubber Tire Guideways are allocated to bus service, even though HOV lanes accommodate far more intense use by vehicles other than buses. Further, we do not account for the value of the time savings accruing to automobile users on HOV guideways.
30 MTA FY95 National Transit Database (Section 15) Report, adjusted to account for MTA errors in allocation of
expenses between modes and additional interest costs associated with borrowings to acquire capital assets. 31 National Transit Data Base Tables for 1994. 32 National Transit Data Base Tables for 1993. 33 Red Line operating costs and revenues are from MTA “A Plan for Los Angeles County—Supporting Cash
Flows” for 2003, a date by which the Red Line to North Hollywood will have been operating a sufficient period to experience mature ridership. Our estimate of interest costs and ridership is based on data from “A Plan for Los Angeles” and MTA financial statements.
34 MTA FY95 National Transit Database (Section 15) Report, adjusted to account for MTA errors in allocation of expenses between modes and additional interest costs associated with borrowings to acquire capital.
35 Author’s calculations, based on data from “Report of Robert L. Peskin,” October 31, 1995 (proof of service date), Table A: “Comparison Between Modes (FY95/96).” (The “Report” was a deposition by Mr. Peskin supporting the plaintiff’s position in Labor/Community Strategy Center vs. MTA and was evidently prepared with the assistance of MTA staff.)
RUBBER TIRE TRANSIT 19
$0.51 $0.56
$2.29$2.09
$0.31$0.52
$0.26 $0.28
$1.19
$1.62
$0.18
$0.44
Busway/HOV LaneBus Mall
Heavy RailLight Rail
Long Distance BuswayCommuter Rail
$0
$0.50
$1.00
$1.50
$2.00
$2.50Rubber Tire and Rail Modes
Figure 2: Guideway Costs Per Passenger Mile
$0.35 $0.40
$2.16
$1.69
$0.20$0.36
$0.15 $0.17
$1.06$1.22
$0.04 $0.28
Bus Mall Light Rail
Busway/HOV Lane Heavy Rail Long Distance Busway
Commuter Rail
$0.00
$0.50
$1.00
$1.50
$2.00
$2.50Rubber Tire and Rail Modes
Figure 3: Guideway Subsidies Per Passenger Mile
20 RPPI
P a r t 4
Benefits
ide-by-side, common-corridor comparisons of Rubber Tire Guideway and rail transit show that, in most cases, Rubber Tire Guideways have important advantages with respect to the following transportation system characteristics:
• Travel Speed
• Capacity
• Number of Passenger Transfers and Passenger Access
• Speed of Construction
• Emergency Vehicle Access We do not claim that Rubber Tire Guideways will prove superior to rail in all situations. However, Rubber Tire Guideways have proven so consistently competitive, and so frequently superior, that failure to give serious consideration to Rubber Tire transit constitutes a major failure in the planning process.
A. Travel Speed
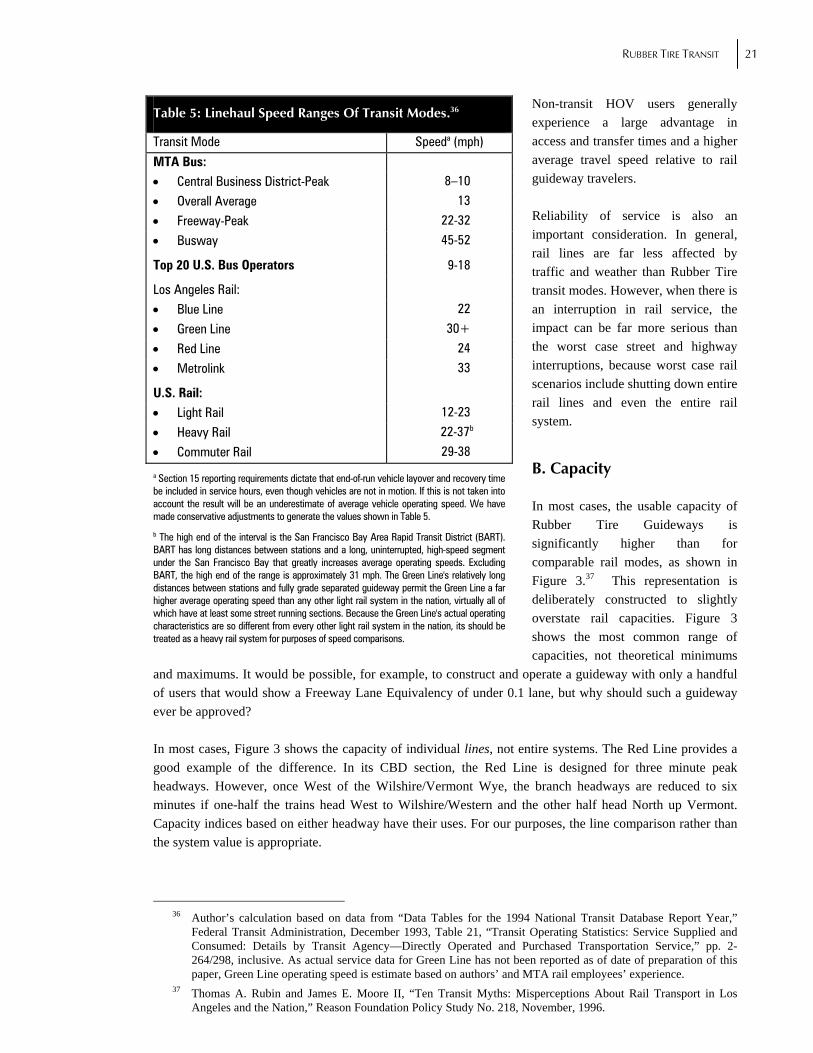
“Speed” has two alternative interpretations, (1) linehaul speed of transit and HOV vehicles in operation on the guideway, and (2) average origin-to-destination travel speed. All too often, corridor transit guideway decisions are made on the basis of the former, even though the latter is a much more reliable determinant of any mode’s attractiveness and use. Table 5 shows representative ranges of vehicle speeds for various modes on guideways. Pure busways and HOV/busways are very competitive with respect to vehicle operating speed. HOV travel, in Los Angeles and elsewhere, generally occurs at or above 55 mph on non-incident days. The more important level of service measure is the total, origin-to-destination trip time. Rubber Tire Guideways often offer one-vehicle, home-to-work trips, or require only one transfer. For comparable trips, use of a rail mode often requires two or more transfers. The wait time associated with transfers, which travelers weight much more heavily than in-vehicle travel time, and the lower access time usually needed to reach bus stops provides attractive time advantages to Rubber Tire Guideway bus passengers.
S
RUBBER TIRE TRANSIT 21
Non-transit HOV users generally experience a large advantage in access and transfer times and a higher average travel speed relative to rail guideway travelers. Reliability of service is also an important consideration. In general, rail lines are far less affected by traffic and weather than Rubber Tire transit modes. However, when there is an interruption in rail service, the impact can be far more serious than the worst case street and highway interruptions, because worst case rail scenarios include shutting down entire rail lines and even the entire rail system.
B. Capacity
In most cases, the usable capacity of Rubber Tire Guideways is significantly higher than for comparable rail modes, as shown in Figure 3.37 This representation is deliberately constructed to slightly overstate rail capacities. Figure 3 shows the most common range of capacities, not theoretical minimums
and maximums. It would be possible, for example, to construct and operate a guideway with only a handful of users that would show a Freeway Lane Equivalency of under 0.1 lane, but why should such a guideway ever be approved? In most cases, Figure 3 shows the capacity of individual lines, not entire systems. The Red Line provides a good example of the difference. In its CBD section, the Red Line is designed for three minute peak headways. However, once West of the Wilshire/Vermont Wye, the branch headways are reduced to six minutes if one-half the trains head West to Wilshire/Western and the other half head North up Vermont. Capacity indices based on either headway have their uses. For our purposes, the line comparison rather than the system value is appropriate.
36 Author’s calculation based on data from “Data Tables for the 1994 National Transit Database Report Year,”
Federal Transit Administration, December 1993, Table 21, “Transit Operating Statistics: Service Supplied and Consumed: Details by Transit Agency—Directly Operated and Purchased Transportation Service,” pp. 2-264/298, inclusive. As actual service data for Green Line has not been reported as of date of preparation of this paper, Green Line operating speed is estimate based on authors’ and MTA rail employees’ experience.
37 Thomas A. Rubin and James E. Moore II, “Ten Transit Myths: Misperceptions About Rail Transport in Los Angeles and the Nation,” Reason Foundation Policy Study No. 218, November, 1996.
Table 5: Linehaul Speed Ranges Of Transit Modes.36
Transit Mode Speeda (mph)
MTA Bus: • Central Business District-Peak 8–10
• Overall Average 13
• Freeway-Peak 22-32
• Busway 45-52
Top 20 U.S. Bus Operators 9-18
Los Angeles Rail: • Blue Line 22
• Green Line 30+
• Red Line 24
• Metrolink 33
U.S. Rail: • Light Rail 12-23
• Heavy Rail 22-37b
• Commuter Rail 29-38
a Section 15 reporting requirements dictate that end-of-run vehicle layover and recovery time be included in service hours, even though vehicles are not in motion. If this is not taken into account the result will be an underestimate of average vehicle operating speed. We have made conservative adjustments to generate the values shown in Table 5. b The high end of the interval is the San Francisco Bay Area Rapid Transit District (BART). BART has long distances between stations and a long, uninterrupted, high-speed segment under the San Francisco Bay that greatly increases average operating speeds. Excluding BART, the high end of the range is approximately 31 mph. The Green Line's relatively long distances between stations and fully grade separated guideway permit the Green Line a far higher average operating speed than any other light rail system in the nation, virtually all of which have at least some street running sections. Because the Green Line's actual operating characteristics are so different from every other light rail system in the nation, its should be treated as a heavy rail system for purposes of speed comparisons.

22 RPPI
23.6
4.8
14.0
1.0 1.6
0.3 0.32.1
0.3 0.2 Pure Busway
HOV LaneEl Montebusway Heavy Rail
Light RailCommuter Rail
Guideway Type
0.0
5.0
10.0
15.0
20.0
25.0
30.0Freeway Lane Equivalent
Red Line CBD Max. 8.3 Metrolink 0.6(Heavy Line)
Red Line SFValley Ave. 2.2
Red Line SFValley Max. 3.9 Blue Line Max.
5.7
Minimum-Maximum/LA Actual CapacitiesFigure 4: Surface Transportation Guideway Capacities
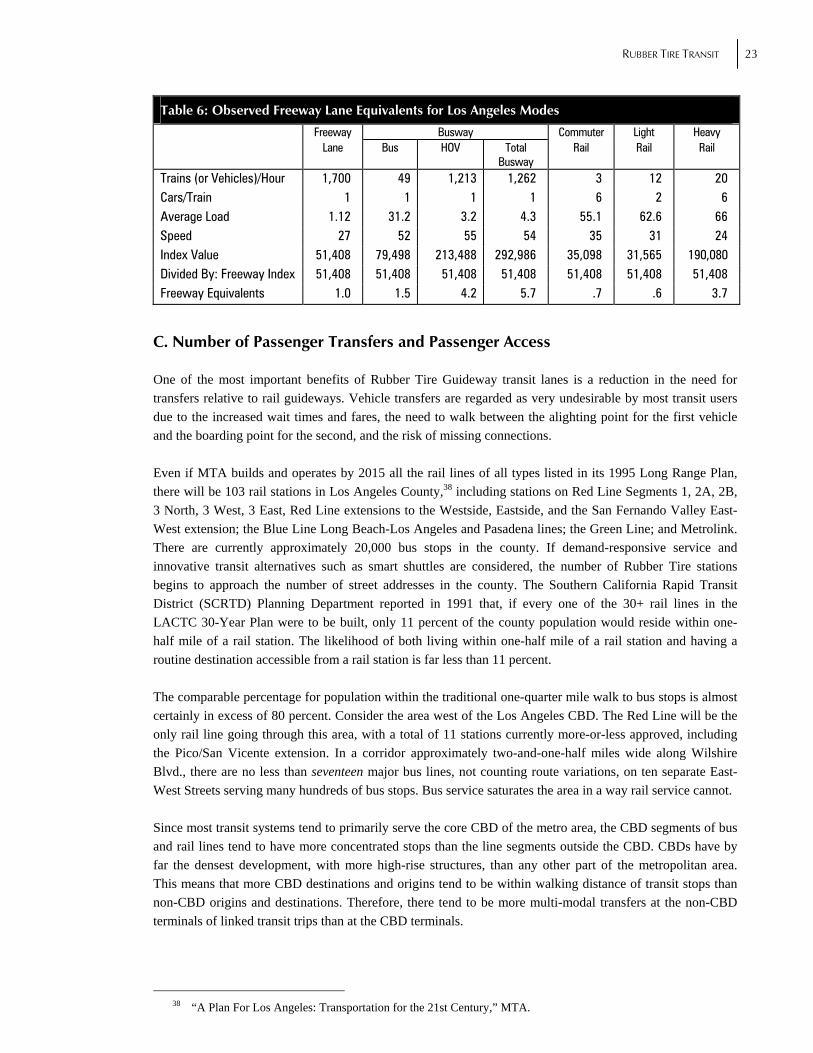
Despite several years of frequent, continuing, and very incorrect statements to the contrary from the MTA, the actual, utilized capacity of most rail guideways is less than that of a single freeway lane. Table 6 provides actual freeway lane equivalents for the various Los Angeles modes. These were generated with observed performance data. Figure 4 graphically compares the freeway lane equivalents for several modes of rubber tire transit to the distorted estimates provided in the MTA’s 30 year plan. The Blue Line, for example, has an actual utilized freeway lane equivalency of approximately 0.6-0.7; and the Blue Line, due in large part to its bargain fares for long trips, is by far the most heavily used light rail line in the nation. Commuter rail lines produce high theoretical capacities due to their ability to link longer trains with high operating speeds and long trip lengths. But the practicalities of corridors are such that it is rare, especially in the Los Angeles area, for an individual commuter rail line's utilized capacity to approach 0.5 freeway lane equivalents. Even lines operating in the neighborhood of 0.25 freeway lane equivalents might be deemed “productive.” The demand for travel on many commuter rail lines is so low it has produced service frequencies of only three or even fewer trains per hour during peak periods. The individual Red Line segments will have usable capacities on the order of two to three freeways lanes. In the CBD portion of the Red Line, branch lines double up, trains (briefly) share a common trunk line, and the peak headway drops from six to three minutes. This provides a practical capacity of somewhat less than eight freeway lanes—and this is a maximum value, not a “real world” actual one.
RUBBER TIRE TRANSIT 23
Table 6: Observed Freeway Lane Equivalents for Los Angeles Modes
Freeway Busway Commuter Light Heavy Lane Bus HOV Total
Busway Rail Rail Rail
Trains (or Vehicles)/Hour 1,700 49 1,213 1,262 3 12 20 Cars/Train 1 1 1 1 6 2 6 Average Load 1.12 31.2 3.2 4.3 55.1 62.6 66 Speed 27 52 55 54 35 31 24 Index Value 51,408 79,498 213,488 292,986 35,098 31,565 190,080 Divided By: Freeway Index 51,408 51,408 51,408 51,408 51,408 51,408 51,408 Freeway Equivalents 1.0 1.5 4.2 5.7 .7 .6 3.7
C. Number of Passenger Transfers and Passenger Access
One of the most important benefits of Rubber Tire Guideway transit lanes is a reduction in the need for transfers relative to rail guideways. Vehicle transfers are regarded as very undesirable by most transit users due to the increased wait times and fares, the need to walk between the alighting point for the first vehicle and the boarding point for the second, and the risk of missing connections. Even if MTA builds and operates by 2015 all the rail lines of all types listed in its 1995 Long Range Plan, there will be 103 rail stations in Los Angeles County,38 including stations on Red Line Segments 1, 2A, 2B, 3 North, 3 West, 3 East, Red Line extensions to the Westside, Eastside, and the San Fernando Valley East-West extension; the Blue Line Long Beach-Los Angeles and Pasadena lines; the Green Line; and Metrolink. There are currently approximately 20,000 bus stops in the county. If demand-responsive service and innovative transit alternatives such as smart shuttles are considered, the number of Rubber Tire stations begins to approach the number of street addresses in the county. The Southern California Rapid Transit District (SCRTD) Planning Department reported in 1991 that, if every one of the 30+ rail lines in the LACTC 30-Year Plan were to be built, only 11 percent of the county population would reside within one-half mile of a rail station. The likelihood of both living within one-half mile of a rail station and having a routine destination accessible from a rail station is far less than 11 percent. The comparable percentage for population within the traditional one-quarter mile walk to bus stops is almost certainly in excess of 80 percent. Consider the area west of the Los Angeles CBD. The Red Line will be the only rail line going through this area, with a total of 11 stations currently more-or-less approved, including the Pico/San Vicente extension. In a corridor approximately two-and-one-half miles wide along Wilshire Blvd., there are no less than seventeen major bus lines, not counting route variations, on ten separate East-West Streets serving many hundreds of bus stops. Bus service saturates the area in a way rail service cannot. Since most transit systems tend to primarily serve the core CBD of the metro area, the CBD segments of bus and rail lines tend to have more concentrated stops than the line segments outside the CBD. CBDs have by far the densest development, with more high-rise structures, than any other part of the metropolitan area. This means that more CBD destinations and origins tend to be within walking distance of transit stops than non-CBD origins and destinations. Therefore, there tend to be more multi-modal transfers at the non-CBD terminals of linked transit trips than at the CBD terminals.
38 “A Plan For Los Angeles: Transportation for the 21st Century,” MTA.

24 RPPI
LACTC 30-Year Plan vs. Reality
5
2
7
14
5.7
0.7 0.6
3.7
Busway Commuter Rail Light Rail Heavy Rail0
2
4
6
8
10
12
14
16 30-Year Plan Reality
Figure 5: Capacity Comparisons
However, even in CBDs, rail trips tend to require more transfers and longer walks than does bus service. In the Los Angeles CBD, for example, there are three rail stations (Seventh/Flower, Pershing Square, and Civic Center), with seven entrances in the CBD proper, and one more station (Union Station) near the edge of the CBD. There are hundreds of bus stops within the CBD, and hundreds more on the fringes. Most bus lines that serve the CBD make at least eight to ten stops in the CBD. Commuter Rail passengers have only one CBD stop, at Union Station, which is separated from the CBD proper by a freeway. Transit modes that provide less ease of access and require more transfers have a negative impact on transit use, particularly use by riders with other options. Consider a suburb to CBD trip for which a traveler has a choice between (1) catching a bus two blocks from his/her home which will access a busway to the CBD, and then be dropped off a block from his/her job in the CBD; or (2) catching a bus at the same spot, which then takes him/her to a commuter rail stop, where, after a 5–10 minute wait, a commuter rail train drops him/her in the CBD. After a three-minute walk and a two-minute wait, our traveler takes a subway to a location three blocks from the job site. Holding all else equal, it is easy to see why most travelers would prefer option (1). However, in making a decision to implement and operate Metrolink, the MTA has largely eliminated option (1). More realistically, our traveler is left with a choice of (3) driving to the commuter rail station and proceeding from there as in option (2), or (4) driving directly to the job in a single occupant vehicle.
D. Speed of Construction
It generally takes far longer to plan, design, construct, and place into service rail guideways than Rubber Tire Guideways. The time required to bring the Blue Line into service from the passage of Proposition A in November 1980 to the beginning of service on the first segment in July 1991 is a period of slightly under eleven years. This discounts the preliminary planning work performed prior to the passage of Proposition A. If we start the Red Line clock with the SCRTD Draft Environmental Impact Statement/Environmental Impact Report (EIS/EIR) in June, 1983, which also discounts several years of preliminary planning work, MTA's forecast revenue

RUBBER TIRE TRANSIT 25
operations date (ROD) of May, 2000 defines a period of almost 17 years between the formal presentation of the plan and passenger service for the final segment of the original Red Line.39 The alignment of the original Red Line EIS/EIR was later changed, but the North Hollywood terminus and the San Fernando Valley alignment and details are essentially unchanged. Segment One of the Red Line opened in January 1993, giving an interval of approximately nine-and-one-half years. The Pasadena Line received its formal approval for construction from the MTA Board in the Summer of 1993. Its current projected ROD of May 2004 defines an interval of just under 11 years.40 All of these intervals ignore the many years of preliminary planning work that preceded the formal presentation or adoption of the project plans, or the approval of the funding source. Comparable elapsed times for Rubber Tire Guideway projects provide virtually no examples of delays of this lengths, with some HOV projects being implemented in under five years. The prominent exception is the Anderson (Century) Freeway, which was held up for over a decade by a variety of legal actions. However, even in this case, the HOV lanes were still opened before the Green Line, which runs down the middle of this freeway for most of its length. Further, this exception is for a new freeway, probably the last to be built in Los Angeles, not for the addition of capacity to an existing freeway. There are several reasons why rail guideway projects tend to take so much longer than Rubber Tire Guideways.
• Due to the structure of federal law and the requirements of the political process, the planning requirements for rail projects have been far more extensive than for concrete/asphalt projects. (Although this is changing. For example, the days of attempts to avoid EIS/EIR requirements by adopting negative declarations for highway projects appear to be long over in most California jurisdictions.)
• It is far more difficult to complete the planning, design, and construction of new rail guideways through developed urbanized areas than it is to add lanes to most existing freeways. (It was possible to put Metrolink into operation far sooner than any Southern California urban rail line, and faster than many Rubber Tire projects because Metrolink, with only relatively minor exceptions, uses existing rail right-of-ways. Because there were no federal dollars spent on the original Metrolink routes, no federal environmental impact statement was required. And, as an operating freight railroad, Metrolink was statutorially exempted from the California Environmental Quality Act’s Environmental (CEQA) Impact Report requirements. (Total Metrolink system ridership is less than that of any one of several existing MTA bus lines.)
• Rail projects are generally far more expensive than Rubber Tire Guideway projects and, therefore, require far more time and effort to raise the required funds. Also, there are generally more sources of funding available for Rubber Tire Guideway projects—although there are generally also more competing projects, which can turn the competition for funding into a contest of political wills. As a result, it has often taken rail projects many years after their planning is substantially completed to acquire funding. Until the funding is approved and final, the planning process is still open, which means that there is pressure to keep improving the plan. At one time, the first segment Pasadena Line was scheduled to begin service in fiscal year 1996, with a full revenue operations date in fiscal year 1997.41 The seven-year delay from fiscal year 1997 to fiscal year 2004 is due almost entirely to problems associated with obtaining funds to complete the project. Of the 22 urban rail lines in the 30-Year Plan,
39 MTA Board Implementation Plan for Adopted Rail Projects, January 10, 1997, p. 20. 40 Ibid. 41 MTA 30-Year Plan, p. 39.

26 RPPI
ten were delayed a total of 37 years in the 1995 update of the Long Range Plan, two were scaled back, and twelve were totally eliminated from the construction schedule. There have been additional delays programmed since. Funding problems can impact the scheduling of Rubber Tire Guideway projects as often and as profoundly as they can impact rail projects. However, the high cost of rail projects means the impact of funding shortfalls on rail guideway schedules is usually far greater than it is for Rubber Tire Guideway schedules, as the Los Angeles experience demonstrates.
E. Emergency Vehicle Utilization
The availability of Rubber Tire Guideway lanes co-located with general purpose freeway lanes can have important advantages for emergency vehicles such as police cruisers, fire trucks, ambulances, tow/freeway assistance trucks, HazMat teams, etc. Vehicles responding to emergencies not on the freeways themselves can almost always reach the emergency faster by using the HOV/Busway lane in cases where freeway travel is required. In many cases, freeway emergencies can be reached far faster because the HOV/Busway lanes are available. There are also disadvantages. If there is an incident that involves the HOV/Busway lane, then the traffic from this lane must be diverted to the general purpose lanes. Also, transit operators with experience with busway lanes co-located with general purpose freeways often conclude that such emergency vehicle use tends to become indiscriminate, which can diminish the benefits to transit and HOV users.

RUBBER TIRE TRANSIT 27
P a r t 5
Conclusion
ubber Tire transit/HOV Guideways have great potential for improving the nation’s urban transportation networks. Such improvements, in conjunction with other, related changes in transportation policy, funding, and implementation are certain to provide far more transportation improvements, at far lower cost, and far earlier, than the two decades of rail-heavy transportation
decisions that have driven transit policy in Los Angeles and the nation’s other traffic-weary cities. Projects in Curitiba, Brazil; Orange County, California; Houston, Texas; and Portland, Oregon demonstrate that rubber-tire alternatives offer high levels of service more cost-effectively than rail transit options. We recommend the following:
• Transit agencies should consider more Rubber Tire Guideways projects, particularly for projects serving a central business district. The existing infrastructure along these corridors often makes adding busway/HOV/HOT lanes technically challenging and expensive, but such projects are still very competitive alternatives to rail in these corridors. This is particularly important for Los Angeles, where the continued reliance on rail plans is both controversial and detrimental to the bus system on which the transit-dependent population so heavily relies.
• High occupancy vehicle lanes should be given a higher priority for construction and implementation
than rail guideways. HOV lanes are far more productive and cost-effective than rail. Indeed, we question why the existing and proposed Southern California rail lines should be constructed or operated at all.
• Wherever possible and where excess capacity exists, new HOV lanes should be implemented as
HOT lanes. Capacity permitting, all existing HOV lanes should be considered for retrofit as HOT lanes.
R
28 RPPI
P a r t 6
Acknowledgments
e appreciate the valuable research assistance provided by Shin Lee and Deva Deka, Ph.D. candidates, School of Urban Planning and Development, University of Southern California; and by Alvaro Arellano Farias, MPl/MArch dual degree candidate, School of Urban Planning and Development and the School of Architecture, University of Southern California, who explained
the detailed operations of the Curitiba bus system, and contributed conclusions from his own work on the subject. We also appreciate the materials and discussion provided by Gabriel Roth, as well as Robert W. Poole, Jr. ([email protected]), and Kenneth Green ([email protected]) of the Reason Public Policy Institute. The authors remain responsible for conclusions presented here.
About The Authors
homas A. Rubin, CPA, CMA, CMC, CIA, CGFM, CFM is a mass transit consultant in Oakland, California. He served as Controller-Treasurer of the Southern California Rapid Transit District from 1989 until the SCRTD/LACTC merger that formed the Los Angeles County Metropolitan Transportation Authority in 1993. Prior to joining the SCRTD, he was a partner in and National
Transit Services Director for Deloitte Haskins & Sells (now Deloitte & Touche). He earned his BSBA from the University of Nebraska-Lincoln and his MBA from Indiana University-Bloomington. James E. Moore, II is Associate Professor of Civil and Environmental Engineering and of Urban Planning and Development at the University of Southern California. His research focuses on performance and evaluation of urban transportation systems. He is Associate Director of USC's Center for Advanced Transportation Technologies, and Director of the Transportation Engineering program. Moore was a member of Northwestern University's Civil Engineering faculty prior to joining USC. He earned his Ph.D. in Civil Engineering from Stanford University.
W
T
Table Of Contents
INTRODUCTION............................................................................................................................................1
A. RAIL GUIDEWAY MODES:...........................................................................................................................2 B. RUBBER TIRE GUIDEWAY MODES: .............................................................................................................3
BUS-BASED URBAN TRANSIT....................................................................................................................5
A. EXPRESS BUS SYSTEM (CURITIBA) .............................................................................................................5 B. PURE BUSWAY (OC TRANSPO) ...................................................................................................................7 C. BUSWAY/HOV LANE (HOUSTON)...............................................................................................................8 D. SR91 HOT LANE (ORANGE COUNTY)......................................................................................................10 E. BUS TRANSIT MALL (PORTLAND) .............................................................................................................11 F. DEDICATED LANE ON GENERAL USE STREET (SPRING STREET COUNTERFLOW LANE) ............................12 G. SIGNAL PREEMPTION/PRIORITIZATION (VENTURA BLVD.) .......................................................................13
COSTS AND COST-EFFECTIVENESS .....................................................................................................14
A. CAPITAL COSTS ........................................................................................................................................14 B. OPERATING COSTS AND COST-EFFECTIVENESS ........................................................................................17
BENEFITS ......................................................................................................................................................20
A. TRAVEL SPEED .........................................................................................................................................20 B. CAPACITY .................................................................................................................................................21 C. NUMBER OF PASSENGER TRANSFERS AND PASSENGER ACCESS ...............................................................23 D. SPEED OF CONSTRUCTION ........................................................................................................................24 E. EMERGENCY VEHICLE UTILIZATION .........................................................................................................26
CONCLUSION...............................................................................................................................................27
ACKNOWLEDGMENTS..............................................................................................................................28
ABOUT THE AUTHORS..............................................................................................................................28
TABLE OF CONTENTS.................................................................................................................................1