by the texas growth index - digital library/67531/metadc3952/m2/1/high_res_d · by the texas growth...
TRANSCRIPT
THE RELATIONSHIP BETWEEN THE TEACHERINSIGHT SCORE
AND STUDENT PERFORMANCE AS MEASURED
BY THE TEXAS GROWTH INDEX
Robert Jacob Koerner B.S., M.Ed.
Dissertation Prepared for the Degree of
DOCTOR OF EDUCATION
UNIVERSITY OF NORTH TEXAS
August 2007
APPROVED:
Bill E. Camp, Major Professor Jon I. Young, Minor Professor Judith A. Adkison, Committee Member and
Associate Dean for Administration and Enrollment Management
M. Jean Keller, Dean of the College of Education Sandra L. Terrell, Dean of the Robert B. Toulouse School of Graduate Studies
Koerner, Robert Jacob. The relationship between the TeacherInsight™ interview scores
and student performance as measured by the Texas Growth Index. Doctor of Education
(Educational Administration), August 2007, 95 pp., 27 tables, 2 illustrations, reference list, 71
titles.
In their efforts to make the selection and hiring process more efficient, school
administrators utilize teacher selection instruments such as the Web-based TeacherInsight™
assessment tool (The Gallup Organization, Princeton, NJ). Tools such as these instruments are
now used regularly by school systems across the nation to assess teachers regarding their
knowledge, talents, skills, attitudes, and values. According to Gallup, the TeacherInsight is a
predictor of teacher talent and is based on 12 themes.
This study utilized 132 elementary and secondary teachers and approximately 4,500
students currently enrolled in Grades 3 through 11 to determine if the TeacherInsight is a
predictor of student achievement. This study considered: (1) the relationship between the
TeacherInsight and student achievement as measured by the Texas Growth Index (TGI); (2) the
relationship between teacher characteristics (years of experience, level [primary or secondary],
gender, age, degree) and the TeacherInsight instrument; (3) the relationship between teacher
characteristics (years of experience, level [primary or secondary], gender, age, degree) and
student achievement as measured by the TGI; and (4) the relationship between student
classifications (limited English proficient, economically disadvantaged, at-risk) and student
achievement as measured by the TGI.
The analyses found a very weak positive relationship between the TeacherInsight and
student achievement using the TGI in the subjects of English/ reading and math. Additional
analysis based on levels (primary and secondary) between TeacherInsight scores and TGI values

TeacherInsight. Of the characteristics, years of teaching experience was the strongest predictor of
scores on the TeacherInsight. Although the overall analyses indicated significant relationships,
they were very weak for both English/reading and math. Teacher characteristics were also poor
predictors of student achievement. Again, the overall analysis indicated a significant but weak
relationship for both English/reading and math. When considering the relationship between
student classifications of LEP, economically disadvantaged, and at-risk, only at-risk had a weak
relationship to student achievement.
The findings provide little support to the validity of TeacherInsight in terms of its ability
to predict student achievement scores and its usefulness as a tool for the selection of teachers by
school systems. Until more extensive research is completed on the TeacherInsight and its impact
on student achievement, no definitive answers for school systems can be made. Suggestions and
recommendations for future studies are provided in the discussion section.

Copyright 2007
by
Robert Jacob Koerner
ii

ACKNOWLEDGEMENTS
As I look back to the start, there are so many people who influenced me on my journey. I
could never really thank them enough.
Let me first thank God. He allowed me to talk with Him about anything at any moment.
I would like to thank my family for their support and love. Jeanna, you mean so much to
me and I could not have completed this endeavor without your love. Mom and Dad, I wish you
were here to see what I have become and share the joy of this accomplishment. Bill, you have
kept me motivated and were always so unselfish of your time when I needed assistance. My
sisters Cathy, Mitzi, and Cindy, you all have continued to support me and provide words of
encouragement when I needed them most. All my nieces and nephews, I thank you for your
support. Andrea and Tom, Gene and Sue, I appreciate your generous donations of time to help
with my family.
I would like to thank my dissertation committee, Dr. Bill Camp, Dr. Dr. Judith Adkison,
and Dr. Jon Young. I appreciate your wisdom and guidance prior to and during the proposal and
defense portions of the doctoral program.
Thanks to all the friends and colleagues in the school district in which I work. Steve
Ellis, your never-ending support and encouragement was always welcome. You are a true
mentor. Richard Valenta and David Holland, I appreciate your suggestions and research
assistance throughout the project. And to all others whom I work with, thank you.
iii
TABLE OF CONTENTS
Page ACKNOWLEDGEMENTS............................................................................................................iii LIST OF TABLES...........................................................................................................................v LIST OF ILLUSTRATIONS..........................................................................................................vii Chapter I. INTRODUCTION………….....................………….……………….............................1 II. LITERATURE REVIEW…………....………………….…….……............................12 III. METHODOLOGY……………………………………….…….................................39 IV. FINDINGS………………………………………………….......................................52 V. DISCUSSION AND CONCLUSIONS....……………………….…...........................73 APPENDIX....................................................................................................................................87 REFERENCES..............................................................................................................................90
iv

LIST OF TABLES
Table 1: Descriptive Statistics for English/Reading Teachers…………………………...............54
Table 2: Descriptive Statistics for Math Teachers…………………………………….................55
Table 3: Descriptive Statistics for Students Taking TAKS for English/Reading……..................56
Table 4: Descriptive Statistics for Students Taking TAKS for Math…………………................56
Table 5: Correlation of TI Scores and TGI Scores in English/Reading and Math……................57
Table 6: Correlation of TI Scores and TGI Scores at Primary and Secondary Levels..............…58
Table 7: Correlation Between Teacher Characteristics and TeacherInsight…………..................59
Table 8: Multiple Regression Summary for English/Reading………………………...................59
Table 9: Coefficients and Beta Weights for English/Reading………………………...................60
Table 10: Multiple Regression Summary for Math…………………………………...................60
Table 11: Coefficients and Beta Weights for Math…………………………………...................61
Table 12 Correlation Between Teacher Characteristics and TGI……………………..................62
Table 13: Multiple Regression Summary for English/Reading Teachers and TGI …..................62
Table 14: Coefficients and Beta Weights for English/Reading Teachers and TGI…...................63
Table 15: Multiple Regression Summary for Math Teachers and TGI ……………...............….63
Table 16: Coefficients and Beta Weights for Math Teachers and TGI……………...............…..64
Table 17: Correlation Between Student Classifications and TGI……………………..................65
Table 18: Multiple Regression Summary for Student Classifications/TGI in English/Reading...65
Table 19: Coefficients and Beta Weights for Student Classifications/TGI in English/Reading...65
Table 20: Multiple Regression Summary for Student Classifications and TGI in Math...............66
Table 21: Coefficients and Beta Weights for Student Classifications and TGI in Math...............66
Table 22: Model Summary for English/Reading……………………………………...................67
v
Table 23: Multiple Regression Summary for English/Reading……………………….................67
Table 24: Coefficients and Beta Weights for English/Reading……………………..…...............67
Table 25: Model Summary for Math………………………………………………….................69
Table 26: Multiple Regression Summary for Math…………………………………...................70
Table 27: Coefficients and Beta Weights for Math…………………………………...................71
vi

vii
LIST OF ILLUSTRATIONS
Figure 1: Regression Standardized Predicted Value With rtgi as Dependent Variable.................88 Figure 2: Regression Standardized Predicted Value With mtgi as Dependent Variable...............89
CHAPTER 1
INTRODUCTION
What characteristics and qualifications do outstanding teachers possess? The answer to
that question has been sought for decades and has been the subject of countless investigations
and debates that have produced a great deal of information for school districts and personnel
departments. The No Child Left Behind Act of 2001 (NCLB) generated renewed vigor and
sparked researchers in their efforts to discover what characteristics and qualifications translate
into the most effective classroom teachers. Traditionally, school systems have relied on work
experience, education, certification and licensure credentials, recommendations, and interviews
to hire teachers. These have been used with varying degrees of priority to hire teachers, but
school districts and campus personnel have often been unsure which characteristics and
qualifications translate into higher student achievement and success. Many school systems have
added variations to the criteria for hiring teachers with instruments that purport to measure the
effectiveness of teachers. This study is designed to examine the TeacherInsight™ assessment
tool (The Gallup Organization, Princeton, NJ, http://education.gallup.com), a nontraditional
preemployment tool, and its relationship to student achievement.
There are a number of factors, personal and professional, that translate into great
teaching. One would like to think that a great teacher would continue to improve every year
until retirement, and by that time each and every one of his or her students would have mastered
every objective taught to them. Although our school systems tend to promote this idea, first-year
teachers are often assigned the same responsibilities as a twenty-year veteran teacher. Perhaps
there are other variables that affect a teacher’s attitude and motivation to teach throughout his or
her career, and experience is only a positive influence up to a specific level, such as five years
1

(Rosenholtz, 1986). One also might assume that those who graduate from prestigious institutions
at the top of the class, with a 4.0 grade point average and mastery of the subject matter, would be
excellent candidates for teaching. However, academic ability and knowledge of subject matter do
not always translate into higher student performance (Darling-Hammond, 2000). Although a
basic understanding of subject matter and pedagogy are important, it would seem that the ability
to communicate those ideas has the most impact on student achievement (Murnane, 1985).
Recommendations and references are a consistent part of any candidate’s application and
can have influence not only on hiring but on whether or not an interview is actually granted.
Because of time constraints for those submitting the recommendations, the content often follows
a similar format and contains mostly positive comments about the applicant. Establishing and
maintaining a positive reputation in the profession may have as much if not more impact than
formal written recommendations within a school system.
The traditional face-to-face interview is likely the single most important part of the
hiring process. Personnel departments and school administrators add unique twists with such
things as questionnaires and portfolio discussions, but the interview generally consists of one
individual or committee asking about the philosophies of the candidate. There is also a great deal
of variation in the amount of time and number of interviews a candidate is required to endure.
The question then becomes, does the interview and the hiring process provide enough insight to
determine how effective that teacher will be in the classroom? Moreover, when measuring
effectiveness in terms of student achievement, how well will that teacher’s students perform on a
standardized test provided by the state? The interview responses as well as all of the
qualifications and characteristics are put together to help answer these questions and select the
best candidate for the job.
2
Interestingly, when one surveys students, parents, and educators concerning the
characteristics a successful teacher should possess, the responses may not include any of those
previously mentioned. More important are personal characteristics such as attitudes, values, and
personality traits that may or may not be evident in the traditional hiring process, although
studies of personality traits have shown little promise (Schalock, 1979). Gordon believed that
highly effective teachers possess three very specific characteristics: subject-matter knowledge,
refined teaching skills, and talent. He indicated that the most important of these characteristics
was talent and further defined talent as “naturally recurring thoughts, feelings, and behaviors that
can be productively applied . . . it is part of the person, seemingly intangible, and, unlike
knowledge and skills, is not learned” (Gordon, 2003). In an effort to determine teacher talents,
Gallup convened a focus group of outstanding teachers. This group determined that the common
characteristics were their motivation to teach, the relationships they develop with students, and
the manner in which they structure learning (Gordon, 2003). These attributes could be difficult to
assess utilizing traditional hiring practices.
In their efforts to make the selection and hiring process more systematic, school systems
began utilizing teacher selection instruments to determine teacher characteristics. These tools are
now used regularly by school systems across the nation. Some examples of these assessment
tools include the STAR Teacher Interview, the National Board for Professional Teaching
Standards (NBPTS), The Praxis Series™ teacher performance assessment (Educational Testing
Service, Lawrenceville, NJ, http://www.ets.org), and the Teacher Perceiver Instrument (TPI).
Two specialized versions of the TPI are the Urban Teacher Perceiver Interview and a Web-based
electronic version called the TeacherInsight (TI).
3
In the spring of 1992, the school district in this study contracted with the Gallup
Organization to train personnel in the use of the Teacher Perceiver Interview (TPI). In 2002,
Gallup instituted a Web-based version called the TeacherInsight. Both of these were designed to
“provide the best prediction of the applicant’s potential for teaching success based on the
applicant’s talent” (The Gallup Organization, 2002). According to Gallup, job-related talents are
determined through specific questions that relate to “life themes” that are possessed by every
individual (The Gallup Organization, 2002). This study utilized data from this North Texas
school district that includes scores from the Web-based TeacherInsight interview.
Studies have provided mixed results concerning the effectiveness of instruments such as
the TeacherInsight and its predecessor, the Teacher Perceiver Interview, in predicting employee
success (Antilone, 2000; Bingham 2000; Brown 2004; Gallop 2004; Drozd, 2005; Howard
1998). Success has been measured using different dependent variables such as absenteeism,
retention, and principal ratings. Few studies have utilized postemployment dependent variables
such as student performance and achievement gain to evaluate an instrument such as the
TeacherInsight as a predictor of teacher success. Additional research associated with the
TeacherInsight is needed to accurately measure the success of the instrument over time in school
systems.
One might expect that if the school district in this study has used a form of the Gallup
instrument for 15 years and the instrument truly is a measure of teacher talent, there would be a
measurable difference in student achievement and possibly other issues such as retention and
absenteeism, when compared to districts with similar enrollment and demographics. Until
recently, the school district in this study has been at or above the state average in student
performance. The implementation of new state testing standards over the last several years has
4

also provided challenges for the school system.
In the 2002-2003 school year, Texas school systems instituted a new state-wide
assessment instrument called the Texas Assessment of Knowledge and Skills (TAKS). The test
was much more rigorous than the previous test, the Texas Assessment of Academic Skills
(TAAS), because it required more knowledge of the state-mandated curriculum, the Texas
Essential Knowledge and Skills (TEKS). All grade levels from grades 3-11 are required to take
mathematics and English/reading every year and must pass the final test in order to graduate. The
TAKS scores are a representation of knowledge and skills acquired during a standard school year
with a certified teacher. The Texas Education Agency (TEA) now utilizes consecutive years of
TAKS scores to calculate a useful measure called the Texas Growth Index (TGI). The TGI
measures student growth or gain from one testing year to the next and will be utilized in this
study.
The expectations and responsibilities of school districts and ultimately teachers have clearly
increased over the years, and it is apparent that the need for outstanding teachers is a common
factor for programs aimed at improving student performance. Teacher quality has been cited
numerous times as one of the most important factors contributing to student achievement
(Ferguson, 1998; Hanushek, Kain, Rivkin, 2005). The Department of Education estimates that
schools will need to hire more than two million new teachers over the next decade (U.S.
Department of Education, 1999). School systems across the nation are challenged with the task
of searching through virtually thousands of applications to find and hire competent teachers.
Numerous interviews are then conducted to determine the best fit for the school district and local
campus. Because of the time and work associated with obtaining applications, resumes,
recommendations, credentials, and conducting interviews, many school districts are forced to use
5

instruments such as the TeacherInsight Interview to help screen and hire potential employees.
Problem Statement
There is very little research specifically related to the TeacherInsight and its ability to
select the best teachers based on the success of students on a standardized test. This study
examines the relationship between the TeacherInsight score and student performance as
measured by the Texas Growth Index (TGI). More specifically, the study examines the
predictive validity of the TeacherInsight, as measured by student performance that is based on
the TGI for reading, English language arts, and mathematics at primary and secondary levels.
Research Questions
This study will address the following questions: 1. Is there a relationship between the TeacherInsight score and student achievement as
measured by the Texas Growth Index in English, reading, and math?
2. What are the relationships between teacher characteristics (age, gender, degree earned,
years of teaching experience, and level taught [primary or secondary]) and the TeacherInsight
instrument developed by Gallup?
3. What are the relationships between teacher characteristics (age, gender, degree earned,
years of teaching experience, and level taught [primary or secondary]) and student achievement
as measured by the Texas Growth Index in English, reading, and math?
4. What are the relationships between the student classifications (limited English
proficiency (LEP), economically disadvantaged (ED), and at-risk) and student achievement as
measured by the Texas Growth Index in English, reading, and math?
5. What are the relationships between specific groups of student and teacher characteristics
and student achievement as measured by the Texas Growth Index in English, reading, and math?
6
Significance of the Study
High quality teachers are essential for school systems. Recent studies of effective classroom
teachers indicate that teacher effectiveness has a substantial impact on differences in student
learning, and students that are assigned several poor teachers consecutively demonstrate lower
gains in student achievement (Sanders & Rivers, 1996). School systems are utilizing non-
traditional methods to help ensure they hire effective teachers. One example of this is the
TeacherInsight Interview instrument. Many school systems rely heavily on instruments such as
the TeacherInsight to help select people whom they believe will be successful teachers for their
schools.
Definitions
Teacher Perceiver Interview (TPI) -- A teacher selection instrument developed by The
Gallup Organization that measures potential teacher talent analyzed based on 12 life themes.
TeacherInsight (TI) -- An electronic version of the Teacher Perceiver Interview that
replaced Gallup’s TPI and provided immediate results for school systems.
Texas Assessment of Academic Skills (TAAS) -- The instrument in Texas public schools
that measured academic achievement for students in Grades 3-12 until 2002. The test is based on
the TEKS curriculum mandated by the state. The TAAS measured reading and mathematics in
Grades 3-12 and writing in Grades 4 and 8.
Texas Assessment of Knowledge and Skills (TAKS) -- The instrument that replaced
TAAS as a measure of academic achievement for the TEKS-based curriculum. The TAKS
measures reading in Grades 3-8, writing in Grades 4 and 7, English language arts in Grades 10
and 11, mathematics in Grades 3-11, science in Grades 5, 10, and 11, and social studies in
7

Grades 8, 10, and 11. The Grade 11 TAKS test must be passed in order for students to graduate
from high school (Texas Education Agency).
Texas Growth Index (TGI) -- An estimate of a student’s academic growth based on the
TAKS scores for two consecutive years. The parameters used to determine TGI were developed
using empirical data from the base comparison years of spring 2003 to spring 2004. A TGI score
of zero represents an average year of expected growth change for that group. A positive score
represented better than expected growth and a negative score represented less than expected
growth (Accountability Manual, 2005).
Delimitations
The TeacherInsight System provides immediate feedback regarding scores for potential
teachers. It is very convenient for the district as well as the candidate. However, achievement
data can be accumulated only for the applicants the district interviewed and subsequently hired.
The effectiveness of those teachers who have lower scores on the TeacherInsight cannot be
measured with achievement data because they were generally not offered a job in the district.
This limits the range of scores in the study.
Limitations
The questions in this study focus on one school district in North Central Texas that
employs 1,422 teachers. Therefore, the sample size was affected by considering only those
teachers who taught English, reading, or mathematics; were certified in the areas they taught, and
were employed for an entire school year. Although the TPI has been used by the district for 15
years, the TeacherInsight has been used in the district for only four years. Therefore, teachers
hired prior to the 2002-2003 school year and still teaching in the district could not be included.
8

Other content areas tested by TAKS, including science and social studies were based on
more than one year’s worth of curriculum and student achievement scores which could not be
traced to a single teacher. For example, the 11th-grade science TAKS test was a comprehensive
test that covered biology, chemistry, and physics as one-year courses taken at some time during
9th, 10th, or 11th grades.
The sample for this study could not utilize student or teacher data for Grades 3 or 12.
Because of the use of gain scores and the need for two consecutive years of data, third grades
had no prior year’s data for calculations. Grade 12 did not have a TAKS test as the exit level test
as did Grade 11. The student sample was also impacted by the utilization of gain scores. In order
to calculate gain scores, two consecutive years of TAKS data was needed. Many students were
omitted for not meeting this criteria. Students were also omitted if they did not take the TAKS
test at the same school where they were enrolled at the beginning of the school year.
One additional limitation is that the school district in this study generally hires only those
applicants who score at or above the cut-off that Gallup provides. This limits the variability in
scores which could influence results.
Summary
There is little doubt that the success of school systems depends on their ability to hire the
most effective teachers. Today, school systems still utilize the traditional hiring practices
associated with examining teacher qualifications and characteristics and conducting varying
types of interviews. As the number of applicants and the amount of time to process them
continues to grow, school systems look for efficient ways to screen and select good teachers.
Over the last two decades, many school systems have slowly integrated specific
instruments such as the TeacherInsight to help them screen applicants and select their teachers.
9
This study seeks to determine if the TeacherInsight is an effective tool for hiring teachers by
examining the performance of students on standardized tests. It is important for school systems
to know their investment is producing results.
Organization of Study
The review of literature for this study (Chapter II) includes topics that support the
questions proposed in the study. It was necessary to initially point out the significance of
teachers throughout years of legislation. The importance of teachers provided a segue into the
specific characteristics and qualifications that researchers have studied and school systems have
utilized to hire people they believe are the most effective teachers. A short discussion of the
actual interview process is also included. In addition to assessing the characteristics and
qualities, and to assist in the interview process, school systems have integrated the use of various
instruments to help them screen large numbers of applicants. The instrument considered in this
study, the TeacherInsight, and its predecessor, the Teacher Perceiver, are presented in detail.
Several other similar instruments are also discussed. The literature review also provides a brief
overview regarding value-added assessment. In this study, this is important because gain scores
for student achievement data are calculated over consecutive years and used for the dependent
variable.
The methodology chapter (III) describes the research design; a detailed description of the
questions presented in this study; statistical analysis used; and data collection, procedures, and
instrumentation. The collection of data for participants included teacher and student
characteristics collected from the school district personnel and research departments. School
district demographic information is provided along with data related to specific teacher and
student characteristics. Teacher variables include TeacherInsight scores, years of experience,
10
gender, age, degree, and level taught. Student variables included calculated gain scores (TGI)
and LEP, economically disadvantaged, and at-risk classifications for students. Using SPSS®
statistical and data management package (SPSS Inc., Chicago, http://www.spss.com), regression
was used to determine the significance and strength of relationships between and among these
variables. Details of the procedures for the utilization of TAKS scores and the calculation of gain
scores were also included in this chapter as well as a description of the TeacherInsight interview
instrument.
Chapter IV describes the results of the statistical analysis by question and provides a
considerable number of tables that include sample sizes, coefficients, standard deviations, and
levels of significance. The statistics and findings are described in detail. Chapter V summarizes
the study and makes conclusions about the variables considered and the relationships between
the TeacherInsight and student achievement. The chapter also includes suggestions for future
study relating to the TeacherInsight.
11

CHAPTER II
LITERATURE REVIEW
Education Reform and Teachers
The Coleman report examined a number of very important issues related to equal
opportunities for children in education. The four major questions addressed the extent of racial
segregation, the relationship between the types of schools students attend and what they learn,
how much students learn as measured by standardized tests, and the existence of equal
educational opportunities (Coleman et al., 1966). The report ultimately concluded that the family
background, not the schools and their teachers, had the most impact on student achievement. The
criteria that were used as indicators of quality included many that were directly related to
teachers and the classroom. These included the thoroughness of the curriculum and specific
characteristics of teachers such as salary, verbal ability, experience, and attitudes (Coleman et al.,
1966).
The results of the report sparked a spate of studies that collectively provided a foundation
for the effective schools movement. The movement did not dispute the importance of family in
the education process, but firmly established that schools control student mastery of subjects and
success in school in terms of achievement. The Correlates of Effective Schools have been
modified over the years to the following: instructional leadership; clear and focused mission;
safe and orderly environment; climate of high expectations; frequent monitoring of student
progress; positive home-school relations; opportunity to learn and time on task (Effective
Schools Products, 2001). It was suggested that these correlates were the components necessary
for any school to be successful by having an impact on student achievement (Effective Schools
Products, 2001). A second generation of correlates has expanded the meaning and expectations
12
for students learning. These correlates are based on challenges that require teachers to develop
new strategies that include cooperative teaming, reteaching and regrouping, interdisciplinary
curriculum writing, technology integration, and assessment through data analysis (Lezotte,
1991). Without question, teachers have a pivotal role in the implementation, maintenance, and
assessment of these strategies.
In 1983, a report entitled A Nation at Risk addressed a number of declines and
inadequacies in the U.S. educational system. The findings described problems associated with
curriculum, expectations for graduation, utilization of time, and the shortage of quality teachers.
The analysis of curriculum content indicated that more students were steering away from
rigorous courses and graduating with only minimum requirements. The expectations for the
knowledge and skills one should possess upon graduation and the utilization of time were
described as being deficient in regard to the amount of time spent on homework, fewer core
subject credits, and competency standards (National Commission on Excellence in Education,
1983). Finally, the study also found that teacher preparation programs were inadequate and
severe shortages existed in a number of subject areas (National Commission on Excellence in
Education, 1983). Again, teachers played an integral part in changes recommended to
educational programs essential for system-wide improvement.
President Clinton signed into law the Goals 2000: Educate America Act, which addressed
a number of educational issues such as those described above. The purpose of the Act was:
To improve learning and teaching by providing a national framework for education reform; to promote the research, consensus building, and systemic changes needed to ensure equitable educational opportunities and high levels of educational achievement for all students; to provide a framework for reauthorization of all Federal education programs; to promote the development and adoption of a voluntary national system of skill standards and certifications; and for other purposes (Teacher and Goals 2000, 2000).
13
The Act emphasized the need for teachers to implement appropriate standards and
assessments, participate in high quality professional development opportunities, utilize
technology, and be accountable for the success of students (Teachers and Goals 2000, 2000).
This area of legislation has been overshadowed and replaced with President Bush’s Republican
agenda in the No Child Left Behind Act (NCLB) of 2001.
The NCLB was designed to improve student achievement through a number of changes
in federal guidelines and support for public schools. NCLB was built on “four common-sense
pillars:” accountability for results, emphasis on doing what works based on scientific research,
expanded parental options, and expanded local control and flexibility (NCLB, 2001). The act
also required states to ensure that every student’s progress be measured in Grades 3-8 in reading
and math and again in Grades 10-12. In addition, prior to the 2005-2006 school year, all teachers
of core academic subjects would be “highly qualified.” Highly qualified teachers must have
bachelor’s degrees, full state licensure or certification by the state, and demonstrate competency
in each core academic subject in which they teach (NCLB, 2001).
Not only were school districts in Texas facing tough federal legislation guidelines with
NCLB, but the state legislature profoundly changed testing standards and accountability for
student achievement with the Texas Assessment of Knowledge and Skills (TAKS). According to
the Texas Education Agency (TEA), the TAKS more rigorously tests for understanding of the
Texas Essential Knowledge and Skills (TEKS), which is the mandated state curriculum (Texas
Education Agency Website, 2003). It became the measure of student success in Texas schools.
The Texas Legislature mandated the replacement of the Texas Assessment of Academic Skills
(TAAS) in 1999 with the administration of the TAKS in the 2002-2003 school year. The TAKS
was not only more rigorous, but tested more grade levels than any previously administered
14

standardized test. The TAKS measured reading in Grades 3-8; writing in Grades 4 and 7; English
language arts in Grades 10 and 11; mathematics in Grades 3-11; science in Grades 5, 10, and 11;
and social studies in Grades 8, 10, and 11. The Grade 11 TAKS test must be passed in order to
graduate from high school (Texas Education Agency, 2007).
The common factor throughout years of legislation, educational initiatives, and
achievement testing was the need for highly qualified teachers in the classrooms. Based on more
recent guidelines found in NCLB and its impact on teachers and student achievement, it became
imperative that school districts recruit and hire good teachers. One challenge was determining
which ones would be successful in the classroom in terms of student achievement. There were a
number of preemployment indicators that employers used to select people they believed were the
best teachers. The most often used indicators included general academic ability and intelligence,
subject matter knowledge, knowledge of teaching and learning, degree levels obtained,
preparation programs, certification and licensure, years of experience, and measures that assess
teacher personalities and attitudes toward teaching (Darling-Hammond, 2000). The latter related
to Gallup’s Teacher Perceiver Interview and the more recent electronic version, the
TeacherInsight.
Teacher Preemployment Indicators
Whitehurst made several assumptions about the reauthorization of the Elementary and
Secondary Education Act (ESEA) (2002). The first of these was that teachers do make a
difference and could vary extensively in terms of quality. He further stated that quality was
affected by: general knowledge and ability, certification and licensure, experience, subject matter
knowledge, intensive and focused in-service training, and alignment between teacher training
and standards-based reforms (Whitehurst, 2002). Darling-Hammond used data from a multitude
15
of sources to study the influences of teacher qualifications on student achievement (2000). The
qualifications examined were measures of academic ability and intelligence, knowledge of
subject matter and teaching, certification, and teaching behaviors in the classroom (Darling-
Hammond, 2000).
The qualifications listed above have been used frequently as school districts attempt to
select highly qualified teachers. Each of these preemployment indicators will be examined
further in an attempt to provide insight into some of the characteristics and qualifications that
school districts have traditionally used to identify and hire teachers. In addition, attention will
also be given to the structure and importance of the teacher interview in the hiring process.
Intelligence and Academic Ability
In a study by Darling-Hammond, data was collected in an effort to determine the
ways in which teacher quality influences student achievement. The data was obtained from a 50-
state survey of policies, state case study analyses, the 1993-1994 Schools and Staffing Surveys
(SASS), and the National Assessment of Educational progress (NAEP). One of the variables
considered was intelligence and general academic ability. Several studies were reviewed, and it
was determined that the majority of relationships between intelligence and teaching performance
were small and statistically insignificant (Darling-Hammond, 2000). It was noted that the small
relationship between intelligence and teacher performance could be due to the lack of variability
among teachers and its weak relationship to actual performance (Murnane, 1985).
Goldhaber described teacher academic ability with measures such as teacher certification
or college entrance exams and performance on tests of verbal ability. Based on his analysis, he
reported that measures of teacher academic ability represented one of the best predictors of
teacher quality (Goldhaber, 1996). Greenwald et al. (1996) examined nine research studies
16

related to teacher academic ability and student achievement and discovered that the majority of
the studies reported positive relationships. Further studies specifically conducted at the
elementary level also reported positive relationships between teacher academic ability and
student achievement (Ferguson, 1991; Strauss & Sawyer, 1986). Some research literature
suggested that a teacher’s verbal ability could be strongly related to student achievement because
of the ability of teachers to convey ideas in a more clear and effective manner (Murnane, 1985;
Ehrenberg and Brewer, 1995).
Subject Matter and Pedagogy
A second variable considered was that of subject matter knowledge. Darling-Hammond
reported that “studies of teachers’ scores on the subject matter tests of the National Teacher
Examinations (NTE) have found no consistent relationship between this measure of subject
matter knowledge and teacher performance as measured by student outcomes or supervisory
ratings” (1999). According to Monk and King-Rice (1994), the only instances in which
knowledge appeared to make a difference were those associated with high school math and
science. High school math and science teachers majoring in their field of instruction had more
successful students than teachers who taught outside their major fields. The relationships
appeared to be even more evident in advanced math and science courses (Monk, 1994).
However, a similar study at the elementary level comparing subject matter knowledge and
student success in science and math classes found no relationship (Rowan, 2002).
Darling-Hamond (2000) reported that the relationship between pedagogy was somewhat
stronger than subject matter knowledge on teacher effectiveness. Ferguson and Womak, in their
study of 200 graduates of a teacher education program, found that education coursework
accounted for more than four times the variance in teacher performance over subject matter
17
knowledge (1993). Darling-Hammond further stated that the degree of pedagogical skill
interacted with subject matter knowledge and influenced teacher performance in a positive or
negative manner (2000). It was apparent that a certain amount of subject matter knowledge and
pedagogy was necessary, but there was no guarantee that these would translate into effective
teachers.
Certification
The research relating to licensure and certification of teachers has produced mixed
results. Generally, traditional certification required that prospective teachers complete college
level coursework in both pedagogy and in the subject in which they want to teach. They were
then required to take standardized tests for certification. Today, those desiring a career in
teaching have alternative certification programs to choose from and some systems hire
candidates with no certification at all.
A study conducted by the Abell Foundation (Walsh, 2001), reviewed 150 teacher
certification studies and found no significant difference between the effectiveness of certified
and noncertified teachers. Additional studies (Goldhaber & Brewer, 1999; Goebel, Romacher, &
Sanchez, 1989; Miller, McKenna, & McKenna, 1996) also concluded that there was no
difference in student performance when comparing the effectiveness of certified and
alternatively certified teachers. One study used a value-added methodology to compare the
achievement of students with teachers who were certified and those that were not certified. They
found that when looking at the growth of students, fully certified teachers performed virtually the
same as those that were not certified (Goldhaber & Brewer, 2000). However, it has been
suggested that fully certified teachers had a significant influence on student performance if they
were certified in the subject area in which they taught (Goldhaber & Brewer, 2000). In a study of
18
teacher quality, Darling-Hammond (2000) found that measures of teacher preparation and
certification had the strongest correlation to student achievement in reading and mathematics,
even when controlling for student poverty and language status.
The ongoing studies concerning certification and its implications for student performance
continue to provide school district personnel a means by which candidates could be screened and
selected, but to date there is no clear choice. There is a great deal of variation in traditional and
alternative certification programs. Many school systems today appear to be more concerned with
the shortage of teachers in high-need areas and are becoming more and more interested in
alternative programs.
Experience
Teacher experience has shown minimal impact on student achievement. Although many
studies have found some levels of significance (Murnane & Phillips, 1981; Klitgaard & Hall,
1974; Greenwald, Hedges, & Laine, 1996), it has been reported that the relationship may not be
linear (Hawkins, Stancavage, & Dossey, 1998), and it may actually level off after about five
years (Rosenholtz, 1986).
In Hanushek’s review of more than 100 studies of teacher years of experience and student
outcomes, only 40 showed a statistically significant relationship. Interestingly, 7 of the 40 studies
found that additional years of experience had a negative impact on student achievement. An
article published by the Heartland Institute reviewed the 2000 National Assessment of
Educational Progress on fourth-grade math students and reported a student score disparity of
only five points when comparing teachers with zero years of experiences to teachers with more
than 25 years of experience (The Heartland Institute, 2001).
19
There appeared to be no clear cut explanation for why teacher experience was not a
consistently valid measure of student achievement. Perhaps it depended on a school districts
leadership and opportunities for professional development. Hanushek (1986) pointed out the
possibility that a positive relationship on experience may be associated with the tendency for
more experienced teachers to have higher-level classes and students. Rosenholtz (1984) reported
that veteran teachers in an environment focused on continual learning and collaboration
demonstrated improved performance. Darling-Hammond (2000) further stated that the problem
may be that older teachers who do not continue to grow and learn may become bored with their
jobs.
Teacher Behaviors
Although there was a great deal of research relating to student characteristics and student
achievement, there was much less related to teacher personalities and behaviors and student
outcomes. According to Darling-Hammond,
Research on teachers’ personality traits and behaviors has produced few consistent findings (Schalock, 1979; Druva & Anderson, 1983), with the exception of studies finding a recurring positive relationship between student learning and teachers’ “flexibility,” “creativity,” or “adaptability” (Berliner & Tikunoff, 1976; Schalock, 1979; Walberg & Waxman, 1983).
One study considered teacher behavior by looking at the positive and negative attitudes
toward students and the course material being taught. Each prepared session consisted of a 15-
minute lecture, an achievement test on the lecture material, and an attitude questionnaire. The
results suggested that the task attitudes exhibited by the teacher influenced student achievement,
while interpersonal attitudes did not. It was further noted that the attitude of the teacher toward
the material being taught had more influence on student achievement than the attitude toward
students as individuals (Mayberry, 1970).
20

Although not specifically related to student achievement, it appeared that the ability to
interact positively with students could be important. Research by Berliner and Tikunoff indicated
that effective teachers enjoy teaching in an environment where there exists a positive relationship
between the students and the teacher, and that effective teachers were generally polite and
pleasant in their daily interactions with students (1977). In a later study, Morrow surveyed school
teachers about experiences with their teachers who made a difference in their own lives. The
results revealed that the positive relationships that were established were more important than
subject matter or instructional techniques. It was also reported that teachers who were more
caring, encouraging, and gave individual attention to students had the greatest positive impact
(Morrow, 1991).
The Teacher Interview
Teacher credentials, experience, and references all contributed to the selection of high
quality teachers, but the face-to-face interview was likely to be the most frequently used method
of teacher selection and quite possibly carried the most weight (Whetzel, Baranowski, Petro,
Curtin, & Fisher, 2003). Employment interviews generally were either structured, with a fixed
set of questions that were scored against behaviorally based rating scales, or unstructured, where
there was no standard protocol for questions or scoring (Whetzel et al., 2003). According to
McDaniel et al., the oral structured interview is a selection procedure designed to predict future
job performance on the basis of oral responses to oral inquiries (McDaniel, Whetzel, Schmidt, &
Maurer, 1994).
To further define structured and unstructured interviews, Huffcutt (1992) described four
levels of interview structure: Level 1 had no guidelines for questions and no benchmarks with
which to evaluate questions. Level 2 specified question topics and moderate evaluation of
21
responses. Level 3 specifically provided questions and a definite rating scale was used to
evaluate responses. Level 4 required exact questions asked of every candidate and responses
were evaluated based on specified benchmark answers. Traditionally school officials used a
combination of Levels 2, 3, and 4 to interview potential teachers.
Goldstein emphasized that the interaction and an appropriate level of questioning
between individuals during interviews was necessary in order to ensure there was a good fit. He
further stated that the level of questioning should address the candidate’s ability to analyze a
problem, to organize different facets of a problem, to explain the conditions, and to mitigate or
solve the problem (Goldstein, 1986). According to Whetzel et al., interview questions were often
geared to determine problem-solving abilities through two different question types: behavioral
and situational. Behavioral questions required candidates to consider an instance in which they
had to deal with a specific situation, and situational questions generally involved a scenario for
which candidates were asked how they would handle the circumstances (Whetzel, Baranowski,
Petro, Curtin, & Fisher, 2003). Both behavioral and situational questions have been tested and
found to be valid (Taylor & Small, 2002).
Structured Interview Validity
The structured interview is a popular means by which school administrators screen and
select employees, and it has been implemented as a useful supplement in school district selection
processes. In 1994, a comprehensive meta-analysis was performed to investigate the validity of
the structured employment interview. The study indicated that when employment interviews
were used correctly, they could be a valid predictor of job performance and, moreover, that
validity was generalizable (McDaniel, Whetzel, Schmidt, & Maurer, 1994).
22
A later study conducted by Schmidt and Rader (1999) used meta-analysis of a predictive
validity database from Gallup-developed instruments used for teachers in education and sales
representatives, managers, and sports team members in the business setting to learn the boundary
conditions of the structured interview as described by McDaniel et al. (1994). The study utilized
107 validity estimates and found that the empirically structured interview process resulted in
values that were predictive of multiple performance criteria. The interview in this study differed
by being empirically constructed, administered by telephone, and scored at a later time based on
a taped transcript. As outlined by Schmidt and Rader, the questions and scoring were developed
empirically through the following steps:
1. Examination of the job description, visiting the organization, and observing on-the-job performance. 2. The nomination of a group of outstanding performers were nominated by their employers and were later interviewed by researchers to “define and clarify the major functions and responsibilities of the job and to identify behavioral tendencies or traits (called themes) that appear to characterize these top performers and to be related to high-level job performance.” Any one job generally had between 10 and 15 themes. 3. A set of potential interview questions were developed to measure each of the identified themes. 4. The employer was asked to nominate a group of current employees who were outstanding and a group that was less than satisfactory or average. 5. Each employee was interviewed individually and his or her responses to the initial set of questions were recorded. The questions (and themes) retained were those that showed the largest difference between high- and low-performing groups (Schmidt & Rader, 1999).
Schmidt and Rader also discussed how the empirically based process enabled the
development of the scoring protocol for the questions. The protocol was designed to be a guide
to determine whether specific answers were related to specific themes. If it was determined that
the response recorded was related to a specific theme, a point was given; and if it did not, no
23

point was given. In addition, the authors pointed out that some questions did not qualify as either
behavioral or situational. For instance, “How competitive are you?” and “How do you feel when
someone doubts what you say?” demonstrated that questions in the structured interview did not
always fit into the two most often used categories (1999).
In summary, the study was found to have criterion-related validity (r = .40) for
supervisory ratings of job performance similar to that of other structured employment interviews
(r = .44) as described in McDaniel et al. (1994). Subsequently, it was suggested that varying
approaches to the development and utilization of structured employment interviews led to similar
levels of validity. Schmidt and Rader hypothesized that these results were attributed to the fact
that “. . . different types of structured interviews all measure to varying degrees constructs with
known generalizable validity (i.e., conscientiousness and general mental ability)” (1999). It was
determined that the phone interview in this study was a valid predictor of absenteeism, sales
volume, job tenure, and production records (Schmidt & Rader, 1999).
Teacher Perceiver Interview
The Gallup Organization interviewed master teachers from across the nation about good
teaching practices and behaviors to give the interview process additional scientific validity.
Gallup then trained thousands of school personnel to administer the interview to teachers in their
school districts. Responses that were consistent with those of master teachers in relation to
attitudes, feelings, and behaviors earned teachers a high percentile score. The Teacher Perceiver
Interview (TPI) contains 60 open-ended questions that give teachers the opportunity to express
their beliefs and opinions about issues that impact their profession. Each question is read to
applicants by a trained interviewer, who scores each response. In order to qualify as an
interviewer, individuals are required to participate in an extensive training program and develop
24
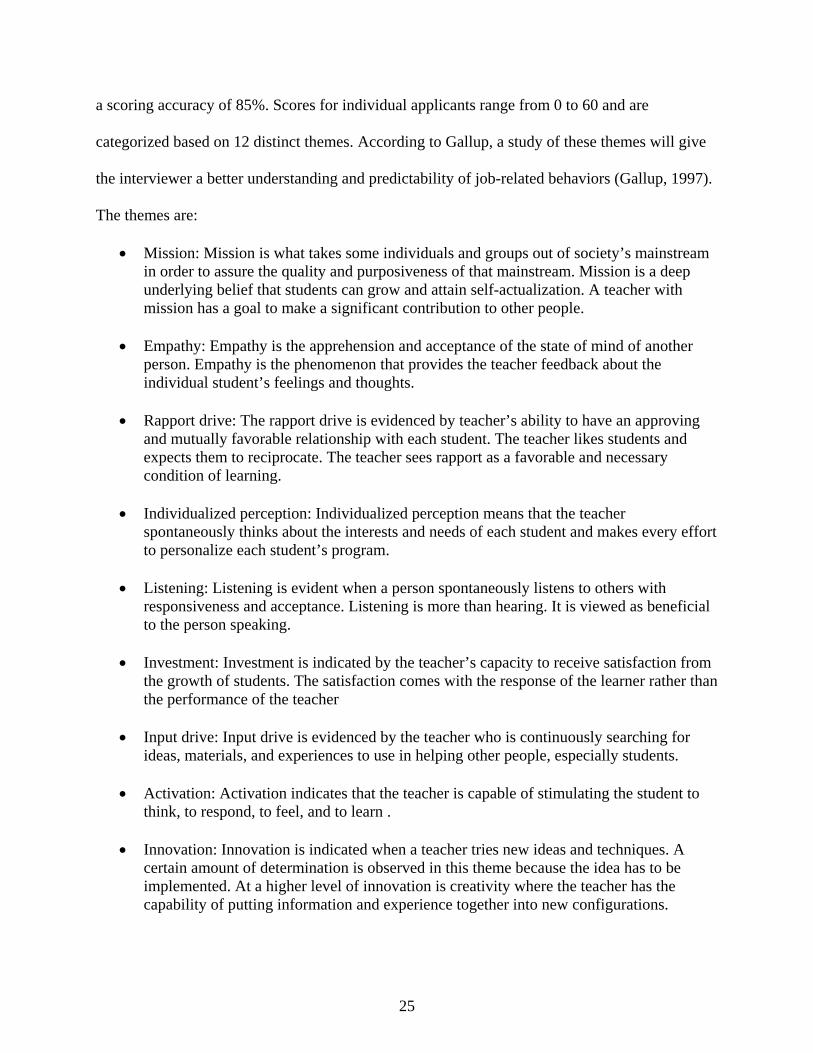
a scoring accuracy of 85%. Scores for individual applicants range from 0 to 60 and are
categorized based on 12 distinct themes. According to Gallup, a study of these themes will give
the interviewer a better understanding and predictability of job-related behaviors (Gallup, 1997).
The themes are:
• Mission: Mission is what takes some individuals and groups out of society’s mainstream in order to assure the quality and purposiveness of that mainstream. Mission is a deep underlying belief that students can grow and attain self-actualization. A teacher with mission has a goal to make a significant contribution to other people.
• Empathy: Empathy is the apprehension and acceptance of the state of mind of another
person. Empathy is the phenomenon that provides the teacher feedback about the individual student’s feelings and thoughts.
• Rapport drive: The rapport drive is evidenced by teacher’s ability to have an approving
and mutually favorable relationship with each student. The teacher likes students and expects them to reciprocate. The teacher sees rapport as a favorable and necessary condition of learning.
• Individualized perception: Individualized perception means that the teacher
spontaneously thinks about the interests and needs of each student and makes every effort to personalize each student’s program.
• Listening: Listening is evident when a person spontaneously listens to others with
responsiveness and acceptance. Listening is more than hearing. It is viewed as beneficial to the person speaking.
• Investment: Investment is indicated by the teacher’s capacity to receive satisfaction from
the growth of students. The satisfaction comes with the response of the learner rather than the performance of the teacher
• Input drive: Input drive is evidenced by the teacher who is continuously searching for
ideas, materials, and experiences to use in helping other people, especially students.
• Activation: Activation indicates that the teacher is capable of stimulating the student to think, to respond, to feel, and to learn .
• Innovation: Innovation is indicated when a teacher tries new ideas and techniques. A
certain amount of determination is observed in this theme because the idea has to be implemented. At a higher level of innovation is creativity where the teacher has the capability of putting information and experience together into new configurations.
25

• Gestalt: Gestalt indicates the teacher has a drive toward completeness. The teacher sees in patterns and is uneasy until work is finished. When Gestalt is high the teacher tends toward perfectionism. Even though form and structure are important, the individual student is considered first. The teacher works from individual to structure.
• Objectivity: Objectivity is indicated when a teacher responds to the total situation. The
teacher gets facts and understands first as compared to making an impulsive reaction.
• Focus: Focus is indicated when a person has models and goals. The person’s life is moving in a planned direction. The teacher knows what the goals are and selects activities in terms of these goals (Gallup, 1997).
The themes are divided into three categories described as intrapersonal, interpersonal,
and extrapersonal. According to Gallup (1997), intrapersonal themes relate to a teacher’s
personal philosophy and feelings about education, interpersonal themes relate to teaching
abilities, and extrapersonal themes relate to teaching structures in the classroom.
It can be difficult for school systems to filter through all of the research describing the
selection of teachers and what qualities and combinations of factors make effective teachers.
More recently, the focus for school systems has been on the qualities of teachers that result in
positive postemployment outcomes (Young & Deli, 2002). There were a number of studies that
have examined the validity and usefulness of the TPI as a preemployment indicator. Primarily
these studies have focused on the validity of the TPI as a preemployment indicator for teacher
success and the postemployment outcomes of job performance. The outcomes have been
measured by examining principal ratings of teachers; student achievement based on standardized
tests; and other variables such as absenteeism, student ratings, grade point average, and
demographics. Young and Deli (2002) stated that “the relationship between preemployment
decisions and postemployment job performance provides the final link within the teacher
selection process, and this relationship between preemployment indicators and postemployment
outcomes is germane for improving the teacher selection process” (p. 587).
26
Early reviews of the TPI provided mixed results. As expected, studies conducted by
Selection Research Incorporated, the organization that developed the TPI, and The Gallup
Organization have provided positive results in favor of the TPI. Other studies have provided
some support as well. However, there were many other studies that provided no support for the
TPI.
In 1977, a study investigated the TPI as a method of teacher selection by comparing the
use of the TPI with traditional methods of teacher selection, and found that: empirical bases for
claims of the various Perceiver systems were weak; there was evidence that the 60-question
format of the TPI was partially predictive of student ratings of new teachers, but not predictive of
outcomes of good teaching; there was no evidence that the TPI was superior to classical
interview techniques; and questions of conflict of interest and invasion of privacy have arisen in
the implementation of Perceiver systems (Miller, McKenna, & McKenna, 1977).
A later study found differing results. The study addressed concerns related to the use of
the TPI by 271 school administrators. The purpose was to determine the importance of the TPI in
relation to seven other commonly used selection criteria. The study found that of eight selection
criteria that included interview, references, telephone references, application form, resume,
transcript, and tests; the TPI was the most important and supported the use of time and money
associated with use of the TPI in the teacher selection process. More specifically, the study
reported that the importance of the criteria from least to most important were test, transcript,
application form, resume, telephone references, references, interview, and TPI (Overman, 1981).
Principal ratings appeared often in research measuring the effectiveness of teachers in the
classroom, including those associated with the TPI. A study conducted by Chalker examined the
relationship between scores from the TPI of 40 high school teachers and scores from
27

administrator and student ratings (Chalker, 1981). The study found significant correlations
between the TPI and administrator quartile rankings and student ratings (Chalker, 1981). An
additional study involving the Teacher Perceiver and supervisor ratings separated elementary and
secondary teachers in the analysis. Twenty-one elementary and 29 secondary teachers agreed to
participate by allowing their immediate supervisors to rate them and by completing a self-
satisfaction survey. The study found a significant relationship between the Teacher Perceiver
scores and ratings of administrators and elementary teacher satisfaction, but no relationship was
found for secondary teachers (Zaranek, 1983). Another study examined the predictive validity of
the Teacher Perceiver Interview utilizing teachers from elementary, junior high, and high school
levels and principal evaluations of teacher effectiveness. The study discovered no predictive
validity between the TPI and teacher effectiveness as determined by their building principal
(Mauser, 1986).
Carlos Antilone examined relationships between results of the TPI and principal ratings,
student ratings, and job satisfaction ratings (2000). Results of the study indicated that the TPI
effectively discriminated between high and low teacher scores on principal evaluations for
Mission, Input Drive, and Individualized Perception themes. The Empathy theme contributed
most to variation in student ratings, and the Individualized Perception theme accounted for the
variation in job satisfaction ratings. All other themes were not significant and did not contribute
to variation in principal, student, or job-satisfaction ratings (Antilone, 2000).
The relationship between teachers’ scores on each of the TPI themes and principals’
perception of how effective these teachers were based on those themes was investigated in a
Tennessee school district using the Urban Teacher Perceiver Interview. This test was also
developed by Gallup with the same types of questions as the TPI but designed especially for
28
urban school districts. Sixty-eight principals and 233 teachers participated in the study. Teachers
received a score for all 11 life themes, and principals were given questionnaires that rated
teachers on each theme as well as providing overall scores. The results indicated an overall
correlation for the two variables; however, the significance level was low. Eight of the 11 themes
produced significant correlations. The investigator supported the use of the instrument and its
ability to measure talent, but suggested that it not be used as the sole determinant for
employment and recommended additional studies with schools using the instrument (Kanipe,
1996).
Young and Deli investigated the abbreviated and full versions of the TPI as potential
predictors of teacher performance. The abbreviated version contained only 22 of the 60 questions
found on the full version. They discovered that when using principal ratings of teacher
performance and absenteeism as criterion measures, very little relationship existed when scores
for the Teacher Perceiver were used as predictor variables. The researchers did conclude that the
complete version was a better predictor than the shortened version, but questioned the internal
consistency of the test and its impact on the reliability and validity of the instrument (Young &
Deli, 2002).
Another study utilized personnel files to obtain demographic information for 142
elementary school teachers and the Teacher Perceiver Academy Questionnaire for
Administrators (TPAQA) to survey principals’ opinions of teachers. The study found significant
relationships between grade point average (GPA), years of teaching experience, and TPI scores.
In addition, principal opinions of teacher performance as measured by ratings on the TPAQA
indicated that the TPI themes of Rapport Drive, Listening, Investment, Activation, Innovation,
and Focus were predictors of teacher performance (Howard, 1998).
29
A study conducted by Karl Brown (2004) examined whether or not using the TPI resulted
in hiring more effective teachers and whether or not it impacted teacher retention rates (Brown,
2004). In addition, the study considered whether or not specific components of the TPI or themes
were related to effective teaching. The findings indicated that: (1) administrators perceive that
teachers hired using the instrument are better overall teachers; (2) teachers who performed higher
on the overall theme categories as well as on specific theme questions were more likely to be
rated as more effective teachers; and (3) teachers hired with the Teacher Perceiver
recommendation had higher retention rates than other teachers (Brown, 2004).
Only a few studies were found that considered some measure of student achievement as
a variable. One study in a Colorado school district examined the validity of the Teacher
Perceiver Instrument by using student achievement gain scores on a Comprehensive Test of
Basic Skills. Twenty-seven fourth- and fifth-grade teachers were given the TPI, and the scores of
their students for two consecutive years in math, reading, and language arts were collected. This
data along with teacher years of experience were analyzed using multiple regression. The study
found that teacher’s TPI scores could not be predicted by their years of experience or mean
student achievement scores in math, reading, and language arts. However, these four variables
were weak predictors for the theme of Individualized Perception on the TPI. A negative
relationship was found between TPI scores on Individualized Perception and the academic
achievement gain in math and language arts. No other significant relationships were found
(Thompson, 1982).
Bingham (2000) used quantitative methods to examine the relationship between teacher
preemployment success indicators and student achievement as measured by the TAAS.
Specifically, the study looked at: (1) the predictive validity of preemployment indicators as
30

measured by student achievement; (2) the concurrent validity of preemployment indicators; (3)
the relationship of indicators to ratings given by supervisors to teachers; and (4) variance in the
relationship of indicators for ethnicity, gender, and family income. The study included a sample
of 138 teachers and 2,780 students from a Texas school district. The findings suggested that
there was a very low correlation between teacher preemployment indicators and student
achievement on TAAS. TPI scores and supervisor ratings of teachers also did not demonstrate a
significant relationship. There were also no strong correlations found between the teacher
perceiver and groups categorized by ethnicity, gender and family income. Additional findings
indicated small levels of significance between TPI and student performance when looking at the
subpopulation groups of ethnicity, gender, economically disadvantaged status, and at-risk status.
Recommendations for further research included replication studies at the middle and high school
levels and the utilization of performance variables other than TAAS (Bingham, 2000).
TeacherInsight Interview
The TeacherInsight™ assessment tool (The Gallup Organization, Princeton, NJ,
http://education.gallup.com) is an electronic version of the Teacher Perceiver Instrument
developed by the Gallup Organization. The TeacherInsight (TI) is composed of two parts, one
being the interview portion and the other being the StrengthsFinder development tool. This study
focuses on only the interview portion of the TeacherInsight.
According to Gallup, in order to hire the best teachers quickly, school districts must: (1)
attract more teacher candidates; (2) create a larger pool of applicants; (3) create a user-friendly
application and interviewing system; (4) use a centralized approach to ensure the depth of
teaching talent throughout the district; and (5) require less staff time to interview candidates. The
Web-based TeacherInsight allows school districts to accomplish these tasks by screening a large
31

volume of applicants quickly, identifying the candidates with talents like the very best teachers,
and focusing valuable time on recruiting and selecting teachers the district really wants (Gallup,
2002).
The TeacherInsight interview requires approximately 40 minutes to complete. The entire
process is completed on-line and is composed of selected questions from the Teacher Perceiver
Interview that includes statements that use a 1-5 Likert scale with “strongly disagree” to
“strongly agree” response options; multiple choice items that reveal applicants’ attitudes, beliefs,
and behaviors; and open-ended questions that applicants answer in their own words. The report
presented by Gallup is based on responses provided by the applicant and is a “best prediction of
the applicant’s potential for teaching success based on the applicant’s talent” (Gallup, 2002).
Scores can be reported through the Gallup Website or electronically provided to school districts
(Gallup, 2002).
The Gallup Organization conducted research utilizing a pilot Web interview that was
given to 180 teachers across the United States. The data were obtained from focus groups were
composed of teachers, administrators, and students. The responses demonstrated the knowledge,
skills, attitudes, and behaviors that exemplify outstanding teachers. These interview results,
along with 30 years of Gallup research on the TPI indicating that “successful people respond
differently from less successful people” (Wallwey, 2002), were used to develop the pilot Web
interview. Information gathered from the pilot interview and highly correlated to outstanding
performance was used to develop a field interview (Wallwey, 2002).
An analysis performed by Gallup examined the relationship between scores on the field
interview and principal and student ratings of teacher performances. Fourth- through 12th-grade
students rated 111 teachers, while principals rated 159 participating teachers. The results
32
indicated that “those teachers scoring high on the interview were more likely to be outstanding
performers than those teachers who scored low on the interview” (Wallwey, 2002). The analysis
also found no evidence of differences in interview scores when comparing race, gender, and age.
A reliability score of .83 was computed for the field interview using Cronbach’s alpha (Wallwey,
2002).
During the 2003-2004 school year, Gallup again looked at the predictive validity of the
TeacherInsight across multiple school systems using principal and student ratings. Principal
ratings were collected using a Web survey. Student ratings were collected using two versions of
a paper-pencil survey. A kindergarten through third-grade version and a 4th-grade through 12th-
grade version were used. The nature of the rating instruments was not provided. There were 491
teachers participating in the study. Gallup’s study also considered characteristics such as age,
gender, and race. The study showed that the higher principals and students rated teachers, the
higher the teacher’s TI percent score. In addition, the higher the TI score, the higher the students
rated their satisfaction with the teacher. The study concluded by stating that teachers who score
at or above 63% on the TI are 1.6 times more likely to be rated among the top quartile of
teachers, and those who score below 63% are 3.4 times more likely to be rated among the bottom
quartile of teachers than the top quartile. There were no disparate findings related to age, gender,
and race (Gallup, 2004).
The latest report from Gallup related to the TeacherInsight examined the usefulness of
the instrument in identifying teachers based on student achievement gains. Inquiry into the
specific measurement and calculation of student gains by Gallup were not successful. Gains for
students were represented by less than one year of gain and greater than one year of gain. Across
the country, 139 teachers participated in the study. The results indicated that teachers whose
33
students had one grade level and higher of student achievement gains were more likely to be
associated with higher quartiles of TeacherInsight percent scores. The teachers whose students
had less than one grade level of gain were more likely to be associated with lower TeacherInsight
percent scores quartiles (Drozd, 2005).
Other Selection Instruments
The STAR Teacher Interview (Haberman, 1995), The Praxis Series™ (Educational
Testing Service, Lawrenceville, NJ, http://www.ets.org) teacher performance assessment, and the
National Board for Professional Teaching Standards Propositions (NBPTS, 1999) were
additional selection instruments utilized by school systems to attempt to identify teacher attitudes
and attributes. According to Ryan and Alcock (2002), the TPI, along with these instruments,
“grew from its own idiosyncratic history, mission, and purpose, and has affected, and will likely
continue to affect, the identification of effective and successful teachers” (Ryan & Alcock,
2002).
Haberman’s (1995) STAR Teacher Interview was designed to identify those highly
successful teachers who had the most impact on at-risk students. at-risk students are often the
most difficult to teach and most likely come from impoverished backgrounds. Haberman
researchers discovered the characteristics of these highly successful teachers based on interviews
of teachers chosen by principals, parents, and other teachers to be effective with at-risk students.
The attributes were persistence; the ability to protect learners and learning, the translation of
theory into practice, personal accountability for learning, professional versus personal
orientation, understanding of burn-out, and fallibility. Additional characteristics included high
expectations, organizational ability, physical and emotional stamina, teaching style, explanations
of success, ownership, and inclusion. Teachers who possessed these traits were more likely to be
34

successful in urban schools (Haberman, 2005). A recent study of the instrument found that the
higher the interview scores, the longer the teachers were retained in the district (Frey, 2003).
More specifically, math and science teachers were retained longer on average than other groups.
Retention rates for other groups in descending order were humanities, vocational, and pupil and
personnel support teachers. (Frey, 2003). Currently more than 200 cities across the nation utilize
this urban teacher selection instrument (Haberman, 2005).
The Praxis Series measures a wide range of teaching skills and content knowledge. It is
divided into three parts: Part I basic skills assessments in reading, writing, and math are
designed for use as a precursor to entry into a traditional teacher preparation program and for
state licensure. Part II subject area assessments are designed to determine content-area
knowledge. Part III classroom performance assessments are based on observations that assess
actual teaching practices of beginning teachers. The Praxis is composed of four domains that
include organizing content knowledge for student learning, creating an environment for student
learning, teaching for student learning, and teaching professionalism (Educational Testing
Service, 2004). According to ETS, the Praxis includes more than 140 assessments that measure
both content and pedagogical knowledge in more than 70 subject areas and is part of licensure
requirements in 36 states across the nation. State boards generally determine passing scores for
each Praxis test (Educational Testing Service, 2004).
Included in the mission of The National Board for Professional Teaching Standards
(NBPTS) is the advancement of “quality of teaching and learning by maintaining high and
rigorous standards for what teachers should know and be able to do and providing a national
voluntary system for certifying teachers who meet these standards” (NBPTS Website). Although
it is not a specific test, it is still used by school systems to select effective teachers. Using “five
35
core propositions,” NBPTS has developed the standards by which teachers are measured. The
certification consists of a number of performance-based assessments that include portfolios,
student samples, videotapes, detailed analysis of teaching, and written exercises that tests
content-area knowledge (NBPTS Website).
Value-added Assessment
In a handbook entitled, “School Directors’ Handbook 2001,” value-added assessment is
defined as “any method of analyzing student test data to ascertain students’ growth in learning by
comparing students’ current level learning to their past learning” (Evergreen Freedom
Foundation, 2001). Value-added assessment began getting a great deal of attention 10 years ago
when William Sanders developed the model, the Tennessee Value-Added Assessment System
(TVAAS), which is still being used today in Tennessee. The model calculates the expected
growth of students based on their performance history. Three assertions are offered to support
this methodology as a teacher evaluation instrument:
1. Teacher effectiveness is by far the most important factor in determining the outcomes
of the learning process, and TVAAS estimates of teacher effects provide accurate indicators of
teacher effectiveness (Sanders & Rivers, 1996).
2. TVAAS estimates of teacher effects measure the independent and unique contribution
a particular teacher makes to his or her students’ growth, regardless of a student’s background
(Sanders & Rivers, 1996).
3. TVAAS teacher effects are independent of students’ prior ability; therefore teacher
effectiveness does not depend on the student’s aptitude for learning. (Sanders & Rivers, 1996).
The National Association of State Boards of Education (NASBE) indicated that results of
value-added systems were important because they demonstrated consistency in teacher
36

effectiveness, added merit to literature that relates to the difference teachers make on learning,
demonstrated a quality teacher’s potential in closing achievement gaps, and provided data to
assess and improve school systems (NASBE Website, 2006).
There were individuals who argued there were too many uncertainties associated with
value-added assessment. Ballou, in an article published by the Hoover Institution, stated that the
three primary problems with gain scores were: (1) the current methods of testing do not measure
gains accurately; (2) some of the gains may be attributable to factors other than the quality of a
given school or teacher; and (3) the lack of a firm basis for comparing gains of students of
different levels of ability (2002). Kupremintz reinforced these problems and stated that much
more research was needed in order to adequately judge the strengths and weaknesses of value-
added assessment (Kupermintz, 2005). He asserted that the TVAAS model represented an overly
simplistic description of teaching and learning because it did not consider the importance of
student learning histories and contextual factors on the rate of academic progress. He described
learning histories in terms of student preparation with the support received inside and outside of
school, such as tutoring and summer school, as well as the community resources available to the
school (Kupermintz, 2005).
Despite arguments, school systems across the nation are utilizing various methods of
tracking student gains to measure teacher effectiveness. Value-added analysis looks specifically
at how much students are learning and provides support for the idea that quality teaching is the
key to student success. Moreover, the correlation between student growth and quality teaching
could be strong enough to make this assessment tool a means by which teachers will be
evaluated in years to come (Evergreen Freedom Foundation Website, 2001).
37
Summary
Decades of reform and legislation presented the teacher as the focal point for
implementing change and the person most responsible for student learning in schools. There was
little doubt that effective teachers could make a profound difference in the classroom. The
characteristics that defined effective teachers, such as intelligence and academic ability, subject
matter and pedagogy, certification, experience, and personality, were still considered in the
hiring and selection process of school systems. These characteristics, along with the interview,
determined employment with a school system.
There are many variations to the interview process and they can be very time consuming
for personnel departments and schools. Many schools are using additional selection instruments,
such as the TeacherInsight, to aid in screening and hiring teachers. There is not a great deal of
research to support or refute the usefulness of this instrument in selecting teachers, especially in
the area of student achievement. Student achievement can be measured by performance on a
standardized test for consecutive years in order to determine gain scores. Although this type of
value-added assessment is still being debated in terms of its effectiveness in accurately
measuring student gains, many school systems utilize this method to guide their instructional
programs. This study uses this method of measuring student achievement in order to add to the
literature relating to the TeacherInsight.
38
CHAPTER III
RESEARCH METHODOLOGY
The research methodology describes the procedures and analysis necessary to provide a
plausible response to the problem statement through close examination of the research questions.
This chapter addresses the design of the study with a detailed description of the appropriate
statistical procedures necessary to examine the research questions. In addition, this section
provides demographic and performance information concerning the school district’s teachers and
students, as well as the processes and procedures involved in the collection of data from various
offices within the school district.
Research Questions
The variables related to teachers in this study were TeacherInsight™ assessment tool
(The Gallup Organization, Princeton, NJ, http://education.gallup.com) scores, teacher years of
experience, grade level taught, teacher age, gender, and highest degree earned. Student variables
included two consecutive years of Texas Assessment of Knowledge and Skills (TAKS) scores to
calculate Texas Growth Index (TGI), limited English proficiency (LEP) classification, at-risk
classification, economically disadvantaged classification, and primary or secondary grade level.
It is important to note that although the TGI utilizes two years of data, only one full year of gain
is calculated for one teacher. Five questions were using these variables examined the relationship
between the TeacherInsight and student TAKS scores, the relationship between teacher
characteristics and TeacherInsight scores, and the relationship between student characteristics
and student TAKS performance.
1. Is there a relationship between the TeacherInsight score and student achievement as
measured by the Texas Growth Index in English, reading, and math?
39

2. What are the relationships between teacher characteristics (age, gender, degree earned,
years of teaching experience, and level taught [primary or secondary]) and the
TeacherInsight instrument developed by Gallup?
3. What are the relationships between teacher characteristics (age, gender, degree earned,
years of teaching experience, and level taught [primary or secondary]) and student
achievement as measured by the Texas Growth Index in English, reading, and math?
4. What are the relationships between the student classifications (limited English
proficiency, economically disadvantaged, and at-risk) and student achievement as
measured by the Texas Growth Index in English, reading, and math?
5. What are the relationships between specific groups of student and teacher characteristics
and student achievement as measured by the Texas Growth Index in English, reading,
and math?
Research Design
In this study, a quantitative methodology was chosen for the analysis of teacher and
student data. A number of statistical procedures were performed in order to answer the five
research questions that in summary asked: (1) is the TeacherInsight a valid predictor of student
achievement; (2) do teacher characteristics of gender, age, degree earned, and years of
experience impact scores on the TeacherInsight instrument or student achievement; and (3) are
certain student characteristics of LEP, at-risk, and economically disadvantaged status related to
student achievement. The TeacherInsight instrument and teacher characteristics served primarily
as independent or predictor variables. Student performance as measured by the TGI for reading,
English, and mathematics were the dependent or criterion variables.
40
Question 1 considered the relationship between the TeacherInsight scores and student
achievement. One variable was the TeacherInsight score and the other variable was student
achievement as measured by the TGI. The TGI was a representation of student gain utilizing two
consecutive years of student TAKS scores. Since there were two variables, a Pearson bivariate
analysis was used to determine if there was a relationship between TeacherInsight scores and
student performance on TAKS, as measured by the TGI. Two separate Pearson correlation
coefficients were calculated, one for reading/English and one for math. The first correlation used
the TeacherInsight as the independent variable and the TGI for reading/English as the dependent
variable. Reading was the dependent variable for the primary grades 4-5 and English was the
dependent variable for secondary grades 6-11. The second correlation used the TeacherInsight as
the independent variable and mathematics as the dependent variable for grades 4-11 .
Question 2 considerd the impact of teacher characteristics on TeacherInsight scores.
Teacher age, gender, degree held, level taught (primary or secondary), and years of experience,
at the time the TI was taken, were examined utilizing multiple regression to determine if these
variables were good predictors of scores on the TI. Multiple regression can establish that a set of
independent variables explains a proportion of the variance in a dependent variable at a
significant level and can establish the relative predictive importance of the independent variables
by comparing beta weights.
Multiple regression was chosen because there are multiple independent variables and one
dependent variable. Teacher characteristics were the independent variables and TeacherInsight
(TI) score was the dependent variable. Two separate regressions were performed: one for
reading/English and one for math. Specifically, one regression used English/reading teacher
characteristics as the independent variables and their TI scores as the dependent variable, and the
41
other used math teacher characteristics as the independent variable and their TI scores as the
dependent variable.
Question 3 considered the impact of teacher characteristics on student TGI scores. Again,
multiple regression was used in determining if the variables of teacher age, gender, degree held,
years of experience at the beginning of the 2005-2006 school year, and level taught (primary or
secondary), were good predictors of student performance as measured by the TGI. Multiple
regression can establish that a set of independent variables such as teacher characteristics
explains a proportion of the variance in the dependent variable, TGI at a significant level. Beta
weights were also presented in order to explain the relative predictive importance of the teacher
characteristics.
The years of experience variable in Question 3 was slightly different from the previous
two questions. Since the data for TAKS were taken at the end of the 2005-2006 school year, this
question utilized years of teacher experience based on the same school year. The previous
question considered years of experience at the time the TI Interview was taken.
Question 4 considered specific student classifications and their relationship to student
achievement. The student classifications were LEP, economically disadvantaged and at-risk and
represent the independent variables. Student achievement as measured by the TGI served as the
dependent variable. In keeping with previous analyses, two separate multiple regressions were
performed: one regression included reading/English student classifications and their TGI scores,
and one regression included math student classifications and their TGI scores. Multiple
regressions assisted in determining if student classifications of LEP, economically
disadvantaged, and at-risk could explain any portion of the variance in TGI scores. Beta weights
assisted in determining the predictive importance of the student classifications on TGI scores.
42

Question 5 considered how certain groups of teacher and student characteristics impacted
student TGI scores. Hierarchical regression was used in order see how the variance in the
dependent could be explained by one or a set of new independent variables, over and above that
explained by an earlier set. The analyses were again determined for both reading/English and
math. The first block of independent variables included the teacher characteristics of years of
experience, level taught, gender, age, and degree level. The dependent variable was student TGI
scores. The second block of data included TeacherInsight scores for reading/English and math as
the independent variables. The third block included the student classifications of LEP,
economically disadvantaged, and at-risk.
Participants
This study utilized data obtained from a school district in North Central Texas, the Texas
Education Agency, and The Gallup Organization. The specific school district chosen for this
study has 21 elementary schools, 7 middle schools, and 4 high schools that participated in the
study.
According to the Academic Excellence Indicator System (AEIS) report on the Texas
Education Agency (TEA) Website, the school district was rated academically acceptable for the
2003-2004, 2004-2005, and 2005-2006 school years. Ratings for the 2002-2003 school year were
not reported because the new accountability system was being initiated. Until the 2005-2006
school year, TAKS scores for reading/English language arts (ELA) and mathematics have
consistently been above the state average. Eighty-nine percent of the district-wide students met
the standard for reading/ELA and 74% met the standard for math in all grade levels for the 2005-
2006 school year. The state average was 87% for reading/English and 75% for math.
43

All the teachers chosen for this study were certified in the state of Texas and participated
in the Web-based TeacherInsight Interview. They worked with students on a daily basis for an
entire school year, but teachers that left the school district during the school year or were hired
during the school year were omitted from the study. The criteria for teachers included being
certified in the subject they teach; teaching reading, English language arts, or mathematics; and
being employed by the district the entire school year. After all the data were received from the
district, approximately 132 teachers met the criteria to be included in the study. The teachers
ranged from Grade 3 to Grade 11 and taught mathematics, reading, or English language arts.
Elementary level teachers were examined in reading and math at Grades 4 and 5. Secondary
teachers included middle school and high school level teachers and were examined in reading in
Grades 6 and 7, English language arts in Grades 8-11, and math at Grades 6 through 11. In order
to ensure confidentiality, the names of the teachers were not disclosed.
The AEIS report from the TEA Website indicated that the district employed 1,653.5
teachers during the 2004-2005 school year. The ethnicity of the teachers was as follows: African
American 1.3%; Hispanic 3.6%; White 94.4%; Native American 0.3%; and Asian/Pacific
Islander 0.4%. It was also reported that 73.9% of teachers held bachelor’s degrees, 25.5% held
master’s degrees, and 0.3% of all teachers held doctorate degrees. The average years of teacher
experience in the district was 12 years.
As with the names of teachers, the names of students were not disclosed. According to
the AEIS report, the student population for the 2005-2006 school year was reported as follows:
African American 6.9%, Hispanic 26.9%, White 60.0%, Native American 0.6%, and
Asian/Pacific Islander 5.5 %. Average class sizes for Grades 1-6 ranged from 19.4 to 23.9, and
average class sizes for Grades 7-12 were 23.5 in ELA and 19 in math. Forty-three percent of
44

students were reported as being economically disadvantaged, which was determined by the
number of students receiving free or reduced meals each day. Eleven percent of students are LEP
and more than 37% were classified as at-risk of dropping out of school.
Procedures and Data Collection
The data for this study were taken from a database of teacher information with
permission from the Personnel Department, and student testing data from the Research and
Assessment Department. Data collected for teachers included years of experience, age, gender,
highest degree earned, subject and grade level taught at time of TAKS administration, and
TeacherInsight scores. These variables were chosen because they were often considered in
studies related to teacher characteristics and student performance. Levels taught by teachers
(primary and secondary) were included because previous studies related to Gallup’s instrument
have spent very little time discussing them separately. As stated earlier, only those teachers
teaching reading, English, and mathematics were considered.
Student data collected included TAKS scores in reading, English language arts, and
mathematics, as well as gender, participation in free/reduced lunch program, at-risk
identification, and LEP program participation. Participation in the lunch program classified
students as economically disadvantaged. at-risk students met criteria for at-risk classification,
and non-English-speaking students who entered the district participated in the LEP program for
up to three years. Two consecutive years of TAKS scores for all students who participated in the
study were collected and used to calculate the TGI for every student. It is important to
understand that although two consecutive years of data was used, only one year of growth was
calculated based on the scores at end of 2005 and the end of the 2006 school year. Only one
teacher was responsible for a student’s calculated gain score for that school year.
45
According to Appendix E of the 2005 Accountability Manual on the TEA Website, the
TGI was used for calculations associated with the state accountability system. It was an estimate
of a student’s academic growth on the TAKS test over two consecutive years. The TGI is
currently used to calculate Gold Performance Acknowledgements (GPA) for Comparable
Improvement in reading/ELA and mathematics and to calculate the TAKS Progress Indicator
under the alternative education accountability (AEA) procedures. The GPA recognizes districts
for high performance on indicators other than those used to determine accountability ratings. The
indicators are advanced course completion, advanced placement results, attendance rates,
commended performance in core subjects, distinguished achievement program, and ACT® test
(ACT, Inc., Iowa City, IA, http://www.act.org) or SAT® Reasoning Test (College Board, New
York, NY, http://www.collegeboard.com) results. The TAKS Progress Indicator sums
performance results across Grades 3-12 and across subjects to determine alternative education
campus and charter ratings.
The parameters used to determine TGI were developed using the empirical data from the
base comparison years of Spring 2003 to Spring 2004 (TEA Website). For this study, the first
and last grade levels, 3 and 12, could not be used. A TGI score cannot be calculated for Grade 3
because TAKS was not administered at Grade 2, and there was no TAKS at Grade 12. Therefore,
the study examined only those teachers and students in Grades 4-11. The TGI scores were
calculated by the district research and accountability department using the formula provided by
the Texas Education Agency.
Primary and Secondary Data
The teacher data collected at the primary level, Grades 4 and 5, required more scrutiny
because it was not always clear which teacher was responsible for student TAKS scores.
46

Generally, teachers at the primary grades taught all subjects including English, reading, math,
science, and social studies. However, some teachers were “departmentalized,” which means they
taught only one subject. It was necessary to examine teacher schedules individually to ensure
accurate data was used. In this study, only those teachers who taught reading and/or math were
considered. If teachers taught only English, they were not considered because they generally
concentrate more on grammar and writing than reading, which was tested every year on TAKS.
The secondary level, Grades 6-11, was more straight-forward with a few complications at
the sixth and seventh grades. All sixth and seventh grades in the district departmentalize in
reading and math. The question then became, who was responsible for TAKS scores, the English
teacher or the reading teacher? In order to remain consistent, only reading teachers were a part
of the analysis at the 6th and 7th grade levels. The remaining grades at the secondary level were
clear with teachers teaching only English language arts or mathematics.
Teachers were coded for statistical analysis based on the variables that pertained to each
question. The highest degree earned included groups for bachelor’s and master’s degrees. There
were too few teachers with doctoral degrees to consider them separately. The two groups based
on the grade levels taught were elementary Grades 4-5 and secondary Grades 6-12. These
groups, along with teacher age, gender, and subject areas taught, were all sorted and grouped in
an Excel spreadsheet. Using subject areas taught, teacher TI scores were matched with their
students’ TAKS scores from the 2004-2005 and 2005-2006 school years.
Student TAKS scores and other variables were retrieved from a large database of district
testing data provided to the district by Texas Education Agency and from district databases. The
district databases and software provided a means of tracking student testing data based on
specific categories such as subject, teacher, and class. From this information, students were also
47
identified as LEP, at-risk, and economically disadvantaged. It was important to note that Special
Education students taking the State Developed Alternative Assessment (SDAA) or the Locally
Developed Alternative Assessment (LDAA) were not included in the study.
Once TAKS scores were collected, they were used to calculate the TGI for every student.
The formula for calculating the TGI was calculated differently based on student grade level and
subject area. The formula was calculated as follows:
1. Determine starting point based on grade and subject for student using TGI growth equation parameters. 2. Take student scale score in previous year. 3. Determine student increase using TGI growth parameters. 4. Multiply scale score times the increase. 5. Add starting point and product of scale score and increase to obtain expected student scale score for current year. 6. Subtract expected scale score form current year scale score to obtain the difference in expectation. 7. Divide difference in expectation by the adjustment factor in the growth equation parameters to obtain the TGI score. (Texas Education Agency, 2006) Student TAKS scores as well as TGI scores were maintained in an Excel spreadsheet
along with teacher characteristics and TeacherInsight scores. TGI scores were calculated by the
Research and Accountability Department and matched to student ID numbers. Finally, the data
collected was analyzed using SPSS® statistical and data management package (SPSS Inc.,
Chicago, http://www.spss.com).
Materials and Instrumentation
TeacherInsight scores were based on an index that indicated the percentage of possible
points. The 2002-2003 scores were converted from a percentile rank to this index as the scoring
48

process changed during that time. Scores prior to the 2003-2004 school year were reported as
percentile ranks. Since that time, all data from the TI were scored and presented as based on a
percentage of possible points from 1 to 99. The teacher scores reported on the TeacherInsight
were used to determine if they were good predictors of student scores on TAKS.
The TeacherInsight instrument was given to all qualified applicants that were considered
for a teaching position in the district. As indicated earlier, the on-line interview required about 40
minutes and was made up of selected questions and statements that used a 1-5 Likert scale,
multiple choice items, and open-ended questions to reveal attitudes, beliefs, and behaviors. The
responses correlated with specific themes that Gallup insisted equated to teacher talent (2002).
The data was transferred to an Excel spreadsheet for analysis.
Student Data Compilation
The student data compiled for this study consisted of many steps. The first was to import
student data from the database of information provided by the Research and Development
Department into an Excel spreadsheet. The data included the test date, grade level, campus
number at the beginning of the school year, campus number at time of TAKS test, Public
Education Information Management System (PEIMS) number (also called the student ID
number), economically disadvantaged (ED) classification, at-risk classification, LEP
classification, and TAKS data.
Students were first sorted based on the campus numbers at the beginning of the school
year and at the time the TAKS test was taken. A match function was used in Excel to ensure that
students were at the same campus for the entire school year. If the numbers did not match, the
students were deleted. The next step involved students classified as ED, LEP, and at-risk. In
order to be considered as ED, families must qualify for the federally funded meal program,
49
which included breakfast and lunch for free or at a reduced rate based on the family’s income.
LEP students qualified if a language survey indicated that a language other than English was
spoken in the home, and if the student did not pass an oral language proficiency test. Students
considered at-risk were those who met at least one of many criteria that may in some way
indicate increased probability of dropping out of school, such as grade level failure and TAKS
test failure. Students who qualified for either one of these programs were coded “1” and those
who did not qualify were coded “0.”
The next step sorted students based on TAKS score codes. The only students considered
for the study had to be coded “S” (scored) for two consecutive years. This was necessary because
two years of TAKS scores (2005 and 2006) were required for the calculation of TGI scores.
Students could be coded for up to 14 other designations that included absent, exempt, cheating,
etc. Only those scores coded with an “S” were considered; therefore, all other students with other
codes were deleted.
There were three subsets of student data based on district compilation of data. These
subsets included student data for Grades 3-11 for April of 2006 and April of 2005; reading for
Grades 3 and 5 for February of 2006 and 2005; and mathematics for Grade 5 for April of 2006
and 2005. These subsets of data were all manipulated in the manner described above, except that
the first one, for Grades 3-11, was further sorted by subject (math or reading/English). This step
was necessary to keep the data accurate and to avoid eliminating from the study students who
might have taken only one test.
The data subsets were combined into one spreadsheet. Utilizing the two consecutive
years of TAKS scores for every student, Appendix E of the 2006 Accountability Manual
published by TEA was used to calculate TGI scores. It was necessary to sort the data by grade
50
level because the TGI growth equation parameters differed based on grade level and subject area.
The calculations were made using the formula functions in Excel® spreadsheet software
(Microsoft Corporation, Redmond, WA, http://www.microsoft.com) (Accountability Manual,
2006).
The final step utilized student ID numbers and the VLOOKUP function in Excel to match
student data with their teacher rosters and teacher data in another spreadsheet. This function
allowed all the student data and teacher data to be conveniently placed into one large Excel
spreadsheet for analysis. In order to ensure accuracy, the merging of all teacher and student data
was completed by the district research department.
Summary
This study utilized a large database of teacher and student information to determine the
relationships between TeacherInsight scores and student achievement; teacher characteristics and
the TeacherInsight; teacher characteristics and student achievement; and certain student
classifications and student achievement. Bivariate, regression, multiple regressions, and
hierarchical regression were used to analyze the data. Data was sorted and matched according to
teacher and subject areas. TeacherInsight scores were matched with reading, English, or math
teachers, and TGI scores that measure student achievement gain were calculated and matched to
students. TeacherInsight scores were used as the independent and dependent variables; teacher
characteristics and student classifications served as independent variables; and student TGI
scores served as the dependent variable. All teacher characteristics and student classifications
were coded and entered into SPSS along with TI and TGI scores.
51
CHAPTER IV
FINDINGS
Introduction
This chapter examines the data collected and the results of the statistical analysis. The
data were collected by the Personnel Department and the Research and Accountability
Department located within the school district. The results from the statistical analyses for all five
questions proposed in the study are presented in detail with tables that provides descriptive
statistics for teachers and students, regression correlations, and beta weights. This chapter
presents the results from regression analyses that sought to determine the relationship between
the TeacherInsight™ assessment tool (The Gallup Organization, Princeton, NJ,
http://education.gallup.com) and the student Texas Growth Index (TGI) scores; between teacher
characteristics and TeacherInsight (TI) scores; between teacher characteristics and student TGI
scores; and between student classifications and TGI scores. Finally, hierarchical regression was
used to determine the impact of blocks of teacher and student data on student TGI scores.
Research Questions
1. Is there a relationship between the TeacherInsight score and student achievement as
measured by the Texas Growth Index in English, reading, and math?
2. What are the relationships between teacher characteristics (age, gender, degree earned,
years of teaching experience, and level taught [primary or secondary]) and the
TeacherInsight instrument developed by Gallup?
3. What are the relationships between teacher characteristics (age, gender, degree earned,
years of teaching experience, and level taught [primary or secondary]) and student
achievement as measured by the Texas Growth Index in English, reading, and math?
52
4. What are the relationships between the student classifications (limited English
proficiency (LEP), economically disadvantaged (ED), and at-risk) and student
achievement as measured by the Texas Growth Index in English, reading, and math?
5. What are the relationships between specific groups of student and teacher characteristics
and student achievement as measured by the Texas Growth Index in English, reading,
and math?
Descriptive Statistics
The following information described the general characteristics of the teachers and
students used in the study. The descriptive statistics were examined in two parts. The first part
provided the means, standard deviations, and sample sizes for the teacher characteristics selected
for the study. The second part provided the same information for the student characteristics
selected for the study. Separate tables for reading and math were also provided.
Teacher Statistics
Initial collection of data provided approximately 400 teachers who worked for the school
district during 2005-2006 school year and had participated in the TeacherInsight interview. After
filtering teacher data based on subject and grade level taught, there were 132 teachers who met
the criteria for the study. The criteria required that teachers teach only English, reading, or math,
and they must have taught for the entire school year. Teacher characteristics included subject and
grade level, TI scores, years experience, gender, age, and degree level.
Tables 1 and 2 list the independent variables considered for teachers along with means,
standard deviations, and number for English/reading and mathematics. The average
TeacherInsight scores (Reading TI = 73.20 and math TI = 69.70) listed were similar. However
53

English/reading teachers had a slightly higher average TI score. math teachers in the study had
more experience on average and were slightly older than those teaching English/reading.
The total number of teachers for each subject area was higher than the actual number of
teachers used in the study. This difference was due to the fact that many elementary teachers
taught both subject areas and were examined for both reading and mathematics relationships. Of
the teachers used in the study, there were slightly more who taught at the secondary level than at
the primary level, and more female teachers than male teachers for both English/reading and
math subject areas. Both subject areas had approximately the same numbers of teachers who held
degrees at the master’s degree level. Overall in the study, there were more teachers who taught
English/reading than math.
Table 1
Descriptive Statistics for English/Reading Teachers
M SD N Eng/Read TI 73.2004 7.88174 86 Yrs Exp 3.4619 5.19576 86 Age 34.654 8.30124 86 Gender Male Female Total 12 74 86 Degree Bachelor’s Master’s Total 72 14 86 Level Primary Secondary Total 46 40 86
54

Table 2
Descriptive Statistics for Math Teachers
M SD N Math TI 69.6984 9.39150 71 Yrs Exp 5.5129 7.93846 71 Age 37.5222 11.22781 71 Gender Male Female Total 18 53 71 Degree Bachelor’s Master’s Total 58 13 71 Level Primary Secondary Total 41 30 71
Student Statistics
Tables 3 and 4 below provide some general statistics related to the students who
participated in the study. Again, this data was grouped based on the subjects of English/reading
and math. The mean TGI scores for students in reading were slightly higher than TGI scores for
students in math. The numbers of students who were economically disadvantaged, limited
English proficient, and at-risk were very similar for both subject areas. When comparing data
from the district Academic Excellence Indicator System (AEIS) report (ED 44%, LEP 11%, and
At-Risk 38%) and the sample taken for the study, the percentages for the specialized student
groups were somewhat lower, but still representative of the sample.
As seen in Tables 3 and 4, the student samples for primary and secondary for
English/reading and math varied considerably. Based on certain criteria, some students qualified
for more than one category. Students in the study were involved only if they had teachers with
TeacherInsight scores. Many more teachers who had TeacherInsight scores were those who
taught at the secondary level for English/reading and at the primary level for math.
55

Table 3
Descriptive Statistics for Students Taking TAKS for English/Reading
M SD N Reading TGI .0528 1.09074 3601 Yes No Total % Econ Dis 1236 2365 3601 34 LEP 252 3349 3601 7.0 At-Risk 1316 2285 3601 37 Level Primary Secondary 875 2726 3601 Table 4
Descriptive Statistics for Students Taking TAKS for Math
M SD N Math TGI .0447 1.08929 3562 Yes No Total % Econ Dis 1262 2216 3478 36 LEP 284 3194 3478 8.1 At-Risk 1285 2193 3478 37 Level Primary Secondary 2845 633 3478 Analytical Statistics
This section presents the statistical correlations found from analysis of the compiled
teacher and student data. The statistical analyses were discussed based on the five research
questions presented in this study and conducted at a .01 level of significance. This level was
chosen because it provided only a 1% probability that the results occurred by chance.
Preliminary analysis based on scatter plots for English/reading TI scores and student TGI scores
and math TI scores and TGI scores were performed in order to see any observable relationships.
56
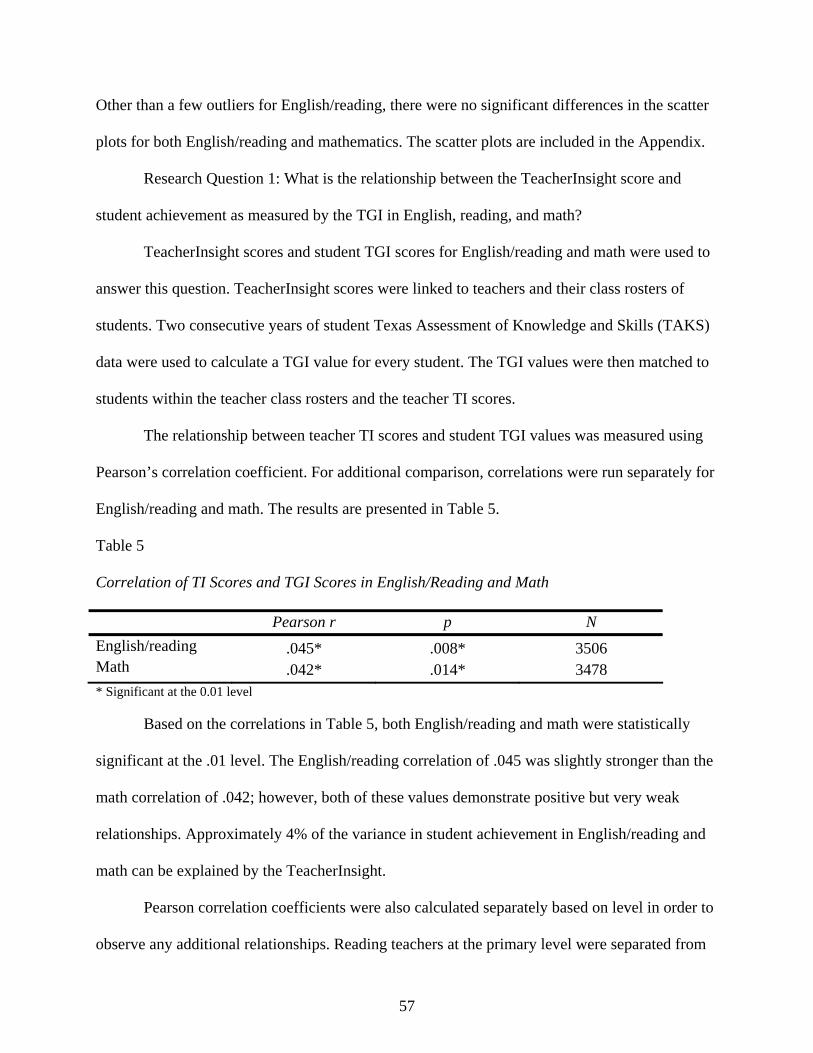
Other than a few outliers for English/reading, there were no significant differences in the scatter
plots for both English/reading and mathematics. The scatter plots are included in the Appendix.
Research Question 1: What is the relationship between the TeacherInsight score and
student achievement as measured by the TGI in English, reading, and math?
TeacherInsight scores and student TGI scores for English/reading and math were used to
answer this question. TeacherInsight scores were linked to teachers and their class rosters of
students. Two consecutive years of student Texas Assessment of Knowledge and Skills (TAKS)
data were used to calculate a TGI value for every student. The TGI values were then matched to
students within the teacher class rosters and the teacher TI scores.
The relationship between teacher TI scores and student TGI values was measured using
Pearson’s correlation coefficient. For additional comparison, correlations were run separately for
English/reading and math. The results are presented in Table 5.
Table 5
Correlation of TI Scores and TGI Scores in English/Reading and Math
Pearson r p N English/reading .045* .008* 3506 Math .042* .014* 3478 * Significant at the 0.01 level
Based on the correlations in Table 5, both English/reading and math were statistically
significant at the .01 level. The English/reading correlation of .045 was slightly stronger than the
math correlation of .042; however, both of these values demonstrate positive but very weak
relationships. Approximately 4% of the variance in student achievement in English/reading and
math can be explained by the TeacherInsight.
Pearson correlation coefficients were also calculated separately based on level in order to
observe any additional relationships. Reading teachers at the primary level were separated from
57

those at the secondary level, and math teachers were separated from those at the primary and
secondary level. Table 6 provides the coefficients for these analyses.
Table 6
Correlation of TI Scores and TGI Scores at Primary and Secondary Levels
Pearson r p N Primary English/reading .040 .265 775 Math .067 .132 513 Secondary English/reading .016 .418 2713 Math -.004 .837 2168 * Significant at the 0.01 level
Separating teacher and students by level did not produce significant results. As seen in
Table 6, none of the relationships between TI scores and TGI scores for primary and secondary
levels in both English/reading and math were significant at the 0.01 level.
Research Question 2: What is the relationship between teacher characteristics (age,
gender, degree earned, years of teaching experience, and level taught [primary or secondary])
and the TeacherInsight instrument developed by Gallup?
This question seeks to determine if a relationship exists between teacher years of
experience, level, gender, age, and degree, and the TeacherInsight. Multiple regression was used
in the analysis. It was important to determine if certain characteristics of teachers could influence
performance on the TeacherInsight. Table 6 provides the overall regression coefficients for
English/reading and math.
58

Table 7
Correlation Between Teacher Characteristics and TeacherInsight
R R2 Adjusted R2
English/reading 0.284* 0.081 7.56162 Math 0.369* 0.136 8.73997 * Significant at the 0.01 level
The correlations revealed a significant positive relationship between teacher
characteristics and the TeacherInsight in both English/reading (R2 = .08) and math (R2 = .14) at
the .01 level. The relationship appears to be slightly stronger for math teachers. Teacher
characteristics accounted for approximately 8.1% of the variance associated with TI scores for
English/reading teachers and approximately 13.6% of the variance associated with TI scores for
math. It appears that teacher characteristics do not have a great deal of impact on TI scores.
English/reading TI scores and math TI scores both had statistically significant
relationships with teacher characteristics of gender, age, and degree. This is depicted in the
regression summary tables (Table 7 and Table 9). Coefficients, beta weights, and structure
coefficients for individual teacher characteristics are illustrated for English/reading and math in
Tables 8 and 10. Two separate multiple regressions were run in order to compare
English/reading and math results.
Table 8
Multiple Regression Summary for English/Reading
Model SS df MS F Significance
1 Regression Residual Total
17525.040 199093.88 216618.92
5 3482 3487
3505.008 57.178
61.300
.000
59
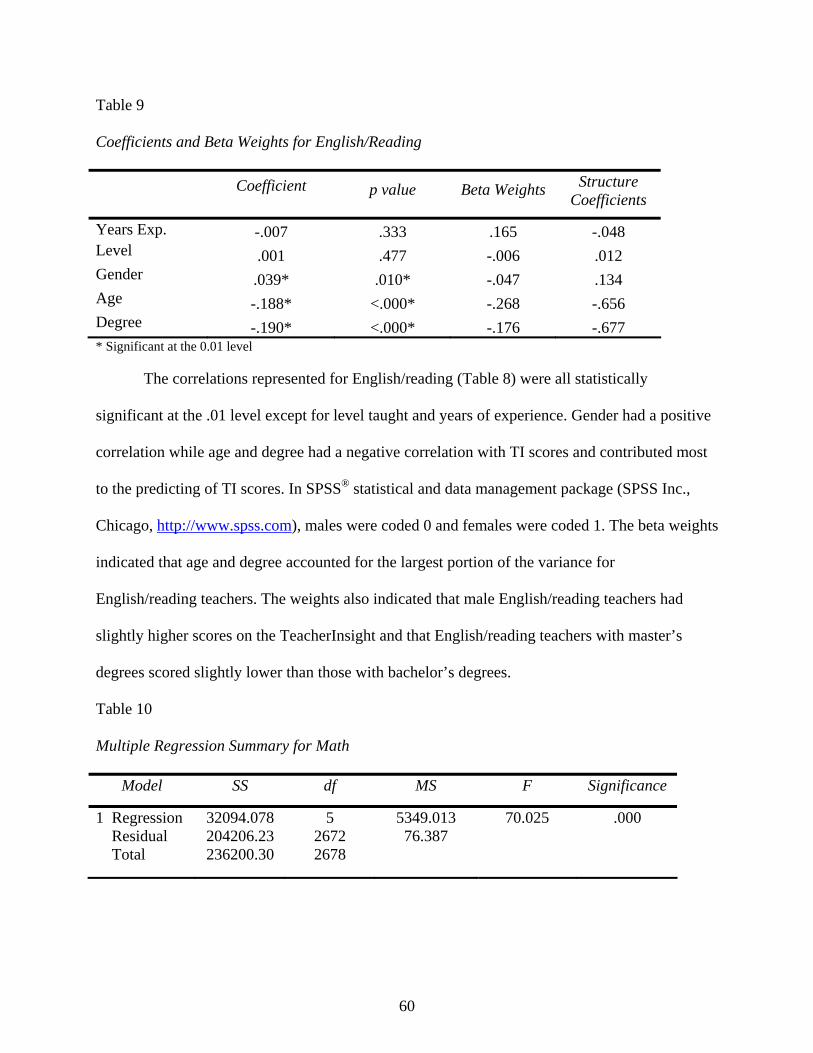
Table 9
Coefficients and Beta Weights for English/Reading
Coefficient p value Beta Weights Structure Coefficients
Years Exp. -.007 .333 .165 -.048 Level .001 .477 -.006 .012 Gender .039* .010* -.047 .134 Age -.188* <.000* -.268 -.656 Degree -.190* <.000* -.176 -.677 * Significant at the 0.01 level
The correlations represented for English/reading (Table 8) were all statistically
significant at the .01 level except for level taught and years of experience. Gender had a positive
correlation while age and degree had a negative correlation with TI scores and contributed most
to the predicting of TI scores. In SPSS® statistical and data management package (SPSS Inc.,
Chicago, http://www.spss.com), males were coded 0 and females were coded 1. The beta weights
indicated that age and degree accounted for the largest portion of the variance for
English/reading teachers. The weights also indicated that male English/reading teachers had
slightly higher scores on the TeacherInsight and that English/reading teachers with master’s
degrees scored slightly lower than those with bachelor’s degrees.
Table 10
Multiple Regression Summary for Math
Model SS df MS F Significance
1 Regression Residual Total
32094.078 204206.23 236200.30
5 2672 2678
5349.013 76.387
70.025
.000
60
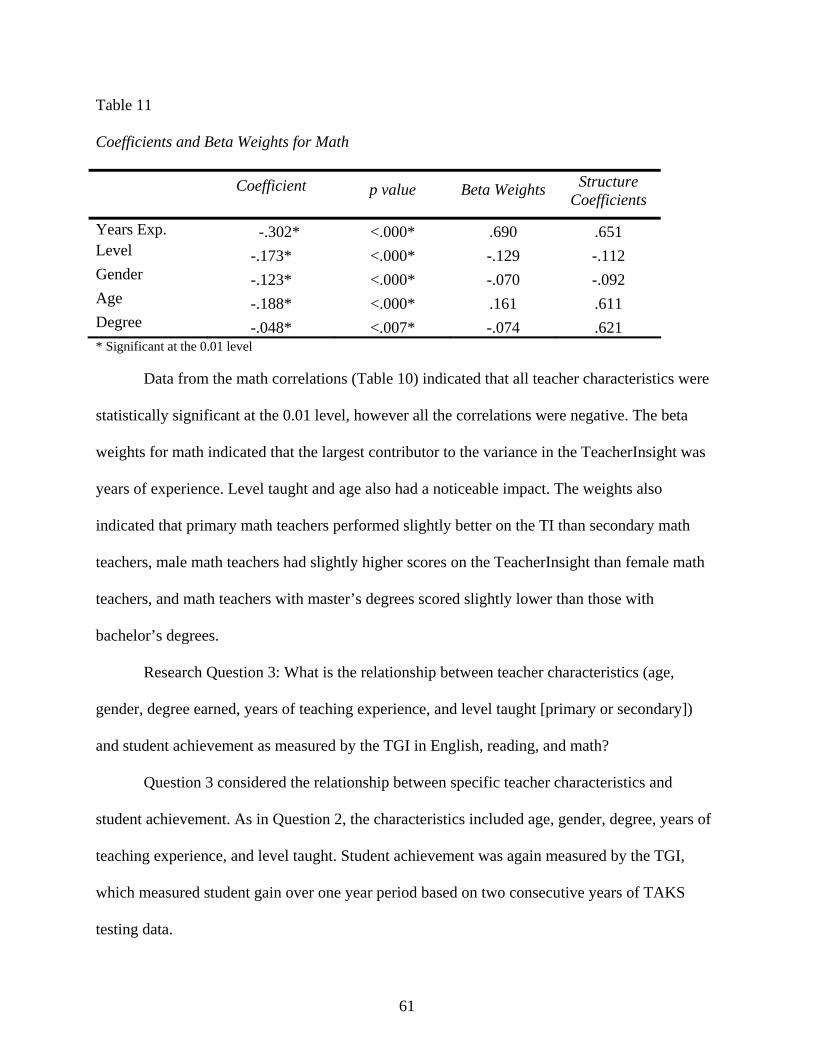
Table 11
Coefficients and Beta Weights for Math
Coefficient p value Beta Weights Structure Coefficients
Years Exp. -.302* <.000* .690 .651 Level -.173* <.000* -.129 -.112 Gender -.123* <.000* -.070 -.092 Age -.188* <.000* .161 .611 Degree -.048* <.007* -.074 .621 * Significant at the 0.01 level
Data from the math correlations (Table 10) indicated that all teacher characteristics were
statistically significant at the 0.01 level, however all the correlations were negative. The beta
weights for math indicated that the largest contributor to the variance in the TeacherInsight was
years of experience. Level taught and age also had a noticeable impact. The weights also
indicated that primary math teachers performed slightly better on the TI than secondary math
teachers, male math teachers had slightly higher scores on the TeacherInsight than female math
teachers, and math teachers with master’s degrees scored slightly lower than those with
bachelor’s degrees.
Research Question 3: What is the relationship between teacher characteristics (age,
gender, degree earned, years of teaching experience, and level taught [primary or secondary])
and student achievement as measured by the TGI in English, reading, and math?
Question 3 considered the relationship between specific teacher characteristics and
student achievement. As in Question 2, the characteristics included age, gender, degree, years of
teaching experience, and level taught. Student achievement was again measured by the TGI,
which measured student gain over one year period based on two consecutive years of TAKS
testing data.
61
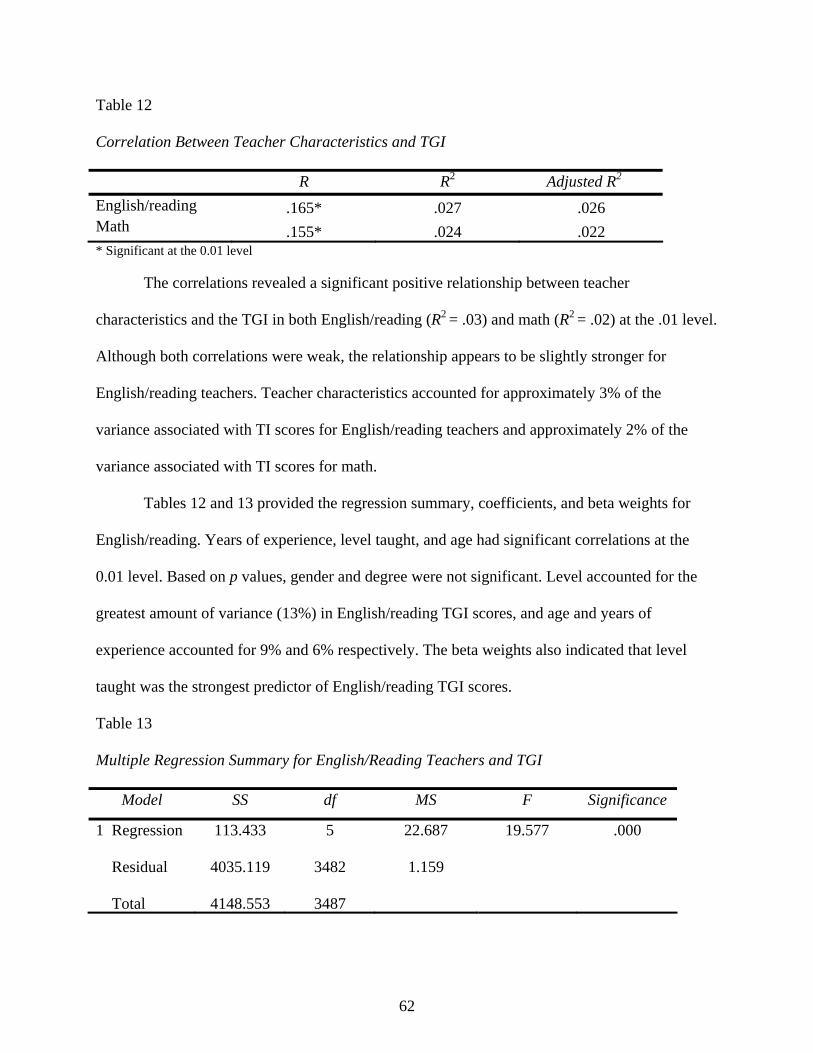
Table 12
Correlation Between Teacher Characteristics and TGI
R R2 Adjusted R2
English/reading .165* .027 .026 Math .155* .024 .022 * Significant at the 0.01 level
The correlations revealed a significant positive relationship between teacher
characteristics and the TGI in both English/reading (R2 = .03) and math (R2 = .02) at the .01 level.
Although both correlations were weak, the relationship appears to be slightly stronger for
English/reading teachers. Teacher characteristics accounted for approximately 3% of the
variance associated with TI scores for English/reading teachers and approximately 2% of the
variance associated with TI scores for math.
Tables 12 and 13 provided the regression summary, coefficients, and beta weights for
English/reading. Years of experience, level taught, and age had significant correlations at the
0.01 level. Based on p values, gender and degree were not significant. Level accounted for the
greatest amount of variance (13%) in English/reading TGI scores, and age and years of
experience accounted for 9% and 6% respectively. The beta weights also indicated that level
taught was the strongest predictor of English/reading TGI scores.
Table 13
Multiple Regression Summary for English/Reading Teachers and TGI
Model SS df MS F Significance
1 Regression Residual Total
113.433
4035.119
4148.553
5
3482
3487
22.687
1.159
19.577
.000
62
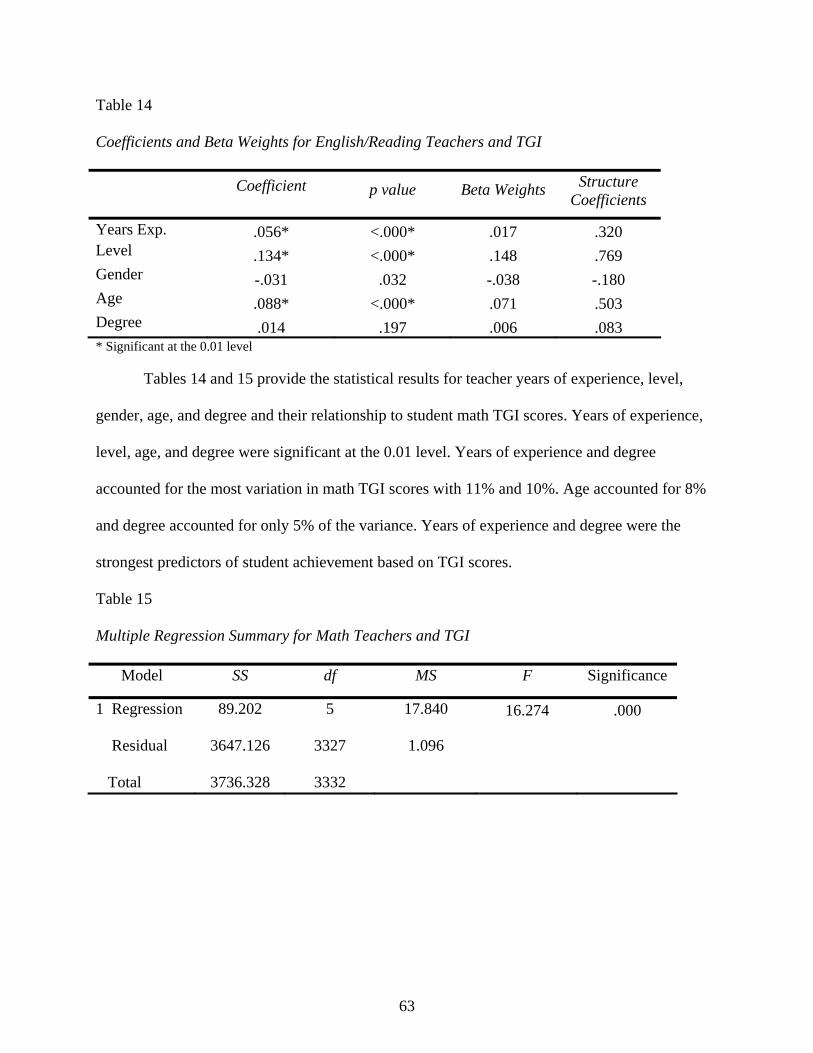
Table 14
Coefficients and Beta Weights for English/Reading Teachers and TGI
Coefficient p value Beta Weights Structure Coefficients
Years Exp. .056* <.000* .017 .320 Level .134* <.000* .148 .769 Gender -.031 .032 -.038 -.180 Age .088* <.000* .071 .503 Degree .014 .197 .006 .083 * Significant at the 0.01 level
Tables 14 and 15 provide the statistical results for teacher years of experience, level,
gender, age, and degree and their relationship to student math TGI scores. Years of experience,
level, age, and degree were significant at the 0.01 level. Years of experience and degree
accounted for the most variation in math TGI scores with 11% and 10%. Age accounted for 8%
and degree accounted for only 5% of the variance. Years of experience and degree were the
strongest predictors of student achievement based on TGI scores.
Table 15
Multiple Regression Summary for Math Teachers and TGI
Model SS df MS F Significance
1 Regression Residual Total
89.202
3647.126
3736.328
5
3327
3332
17.840
1.096
16.274
.000
63
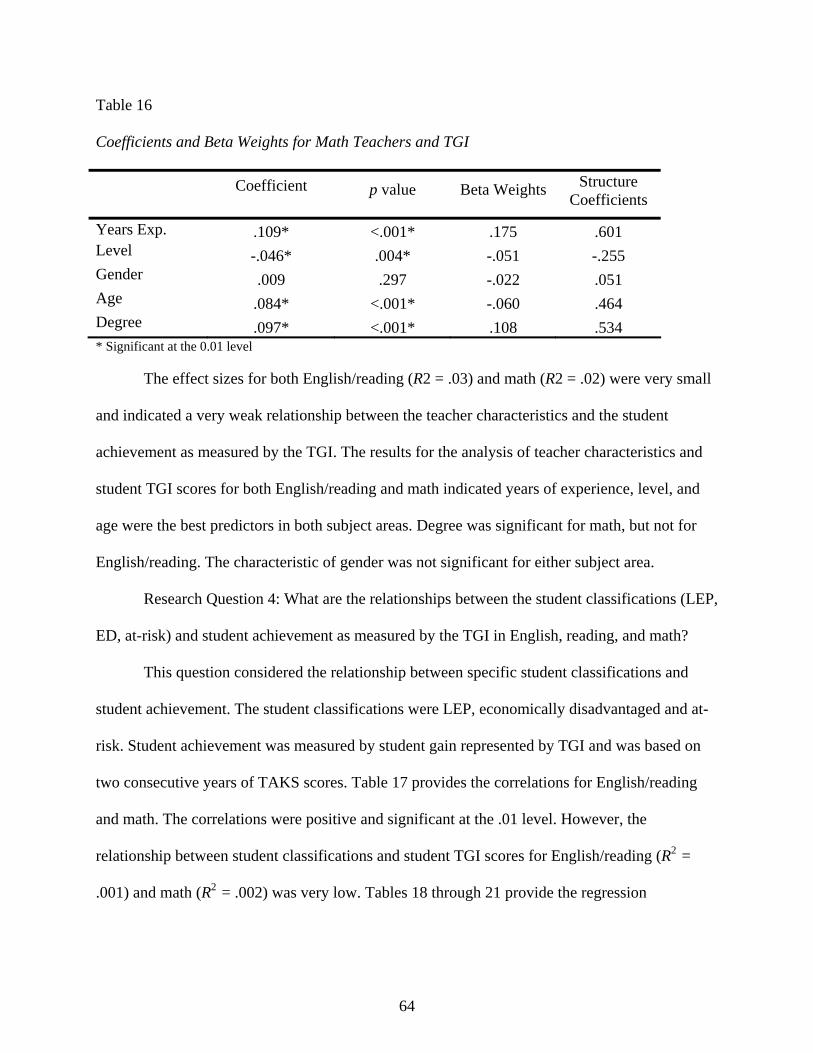
Table 16
Coefficients and Beta Weights for Math Teachers and TGI
Coefficient p value Beta Weights Structure Coefficients
Years Exp. .109* <.001* .175 .601 Level -.046* .004* -.051 -.255 Gender .009 .297 -.022 .051 Age .084* <.001* -.060 .464 Degree .097* <.001* .108 .534 * Significant at the 0.01 level
The effect sizes for both English/reading (R2 = .03) and math (R2 = .02) were very small
and indicated a very weak relationship between the teacher characteristics and the student
achievement as measured by the TGI. The results for the analysis of teacher characteristics and
student TGI scores for both English/reading and math indicated years of experience, level, and
age were the best predictors in both subject areas. Degree was significant for math, but not for
English/reading. The characteristic of gender was not significant for either subject area.
Research Question 4: What are the relationships between the student classifications (LEP,
ED, at-risk) and student achievement as measured by the TGI in English, reading, and math?
This question considered the relationship between specific student classifications and
student achievement. The student classifications were LEP, economically disadvantaged and at-
risk. Student achievement was measured by student gain represented by TGI and was based on
two consecutive years of TAKS scores. Table 17 provides the correlations for English/reading
and math. The correlations were positive and significant at the .01 level. However, the
relationship between student classifications and student TGI scores for English/reading (R2 =
.001) and math (R2 = .002) was very low. Tables 18 through 21 provide the regression
64
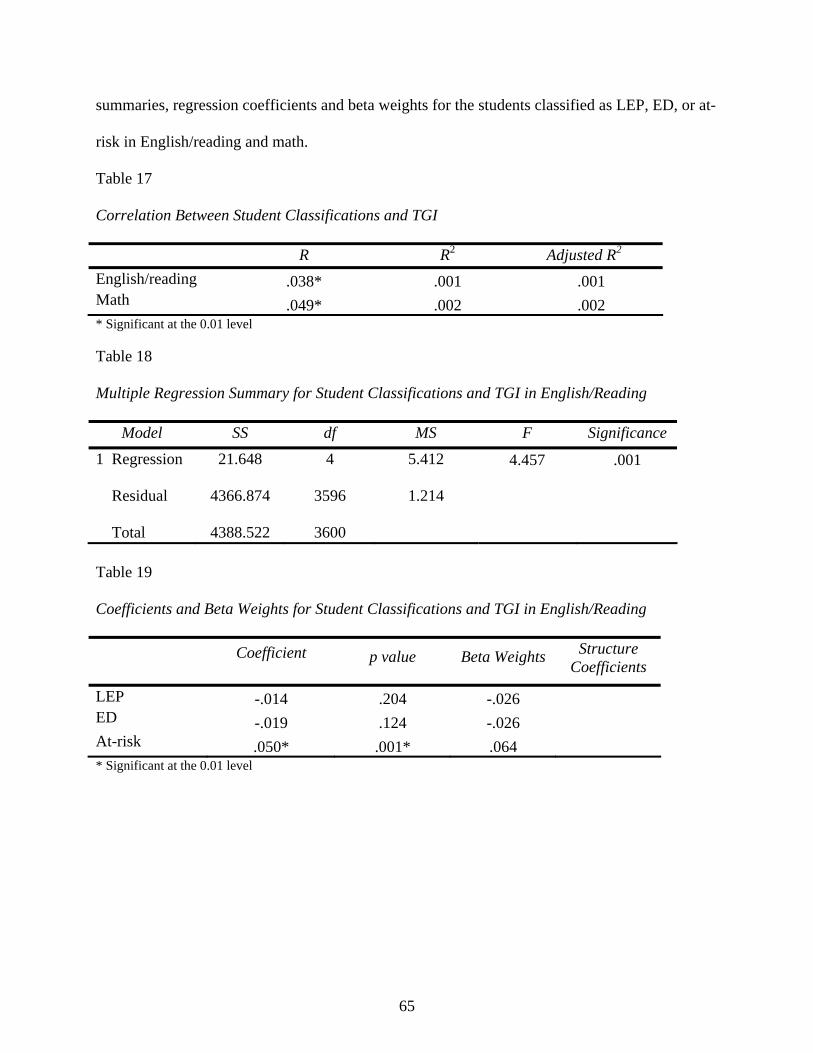
summaries, regression coefficients and beta weights for the students classified as LEP, ED, or at-
risk in English/reading and math.
Table 17
Correlation Between Student Classifications and TGI
R R2 Adjusted R2
English/reading .038* .001 .001 Math .049* .002 .002 * Significant at the 0.01 level
Table 18 Multiple Regression Summary for Student Classifications and TGI in English/Reading
Model SS df MS F Significance
1 Regression Residual Total
21.648
4366.874
4388.522
4
3596
3600
5.412
1.214
4.457
.001
Table 19 Coefficients and Beta Weights for Student Classifications and TGI in English/Reading
Coefficient p value Beta Weights Structure Coefficients
LEP -.014 .204 -.026 ED -.019 .124 -.026 At-risk .050* .001* .064 * Significant at the 0.01 level
65
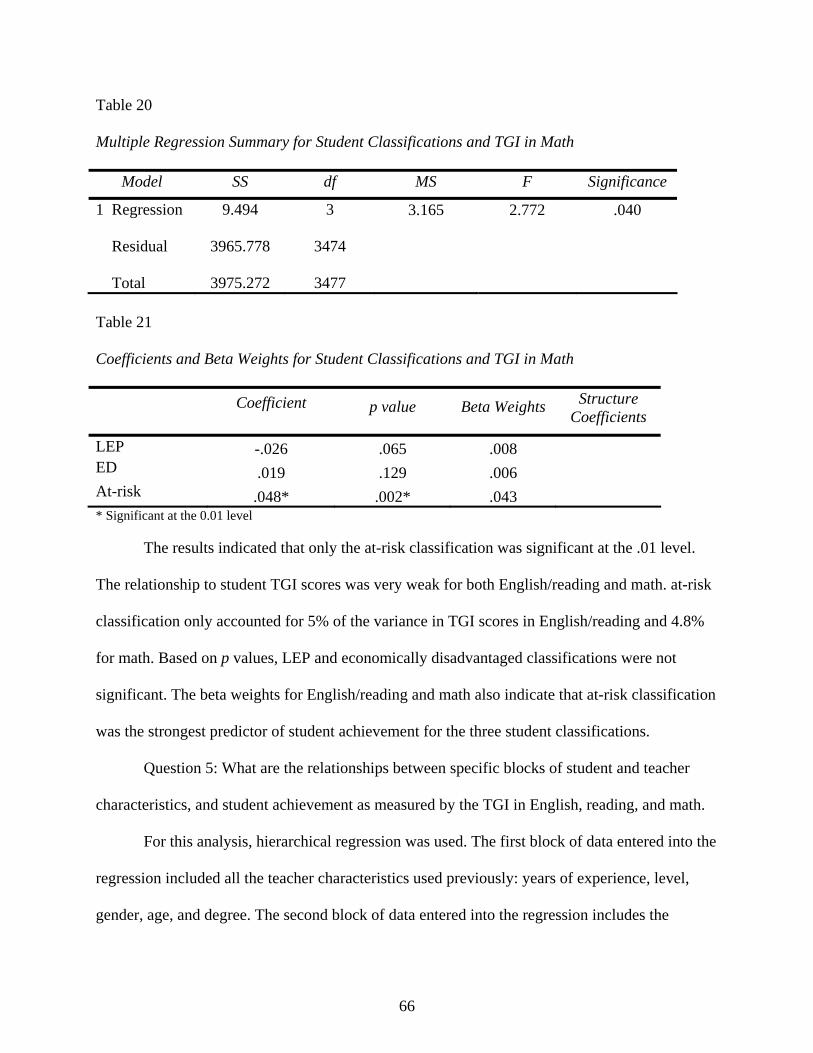
Table 20
Multiple Regression Summary for Student Classifications and TGI in Math
Model SS df MS F Significance
1 Regression Residual Total
9.494
3965.778
3975.272
3
3474
3477
3.165
2.772
.040
Table 21 Coefficients and Beta Weights for Student Classifications and TGI in Math
Coefficient p value Beta Weights Structure Coefficients
LEP -.026 .065 .008 ED .019 .129 .006 At-risk .048* .002* .043 * Significant at the 0.01 level
The results indicated that only the at-risk classification was significant at the .01 level.
The relationship to student TGI scores was very weak for both English/reading and math. at-risk
classification only accounted for 5% of the variance in TGI scores in English/reading and 4.8%
for math. Based on p values, LEP and economically disadvantaged classifications were not
significant. The beta weights for English/reading and math also indicate that at-risk classification
was the strongest predictor of student achievement for the three student classifications.
Question 5: What are the relationships between specific blocks of student and teacher
characteristics, and student achievement as measured by the TGI in English, reading, and math.
For this analysis, hierarchical regression was used. The first block of data entered into the
regression included all the teacher characteristics used previously: years of experience, level,
gender, age, and degree. The second block of data entered into the regression includes the
66

TeacherInsight scores, and the third included the student classifications of LEP, economically
disadvantaged, and at-risk student. The model summary and multiple regression summary are
provided in Tables 11 and 12.
Table 22
Model Summary for English/Reading
Model R R2 Adjusted R2 SE
1 .165* .027 .026 1.07650 2 .170* .029 .027 1.07587 3 .175* .031 .028 1.07536 *Significant at the .01 level a. Predictors: (Constant), yrsexp, degree, level, gender, age b. Predictors: (Constant), yrsexp, degree, level, gender, age, rti c. Predictors: (Constant), yrsexp, degree, level, gender, age, rti, econ, rsk, lep d. Dependent variable: reading tgi Table 23 Multiple Regression Summary for English/Reading
Model SS df MS F Significance1 Regression Residual Total
113.433
4035.119
4148.553
5
3482
3487
22.687
1.159
19.577
.000
2 Regression Residual Total
119.281
4029.272
4148.553
6
3481
3487
19.880
1.158
17.175
.000
3 Regression Residual Total
126.593
4021.960
4148.553
9
3478
3487
14.066
1.156
12.164
.000
a. Predictors: (Constant), yrs exp, degree, level, gender, age b. Predictors: (Constant), yrs exp, degree, level, gender, age, rti c. Predictors: (Constant), yrs exp, degree, level, gender, age, rti, econ, rsk, lep d. Dependent variable: reading tgi
67
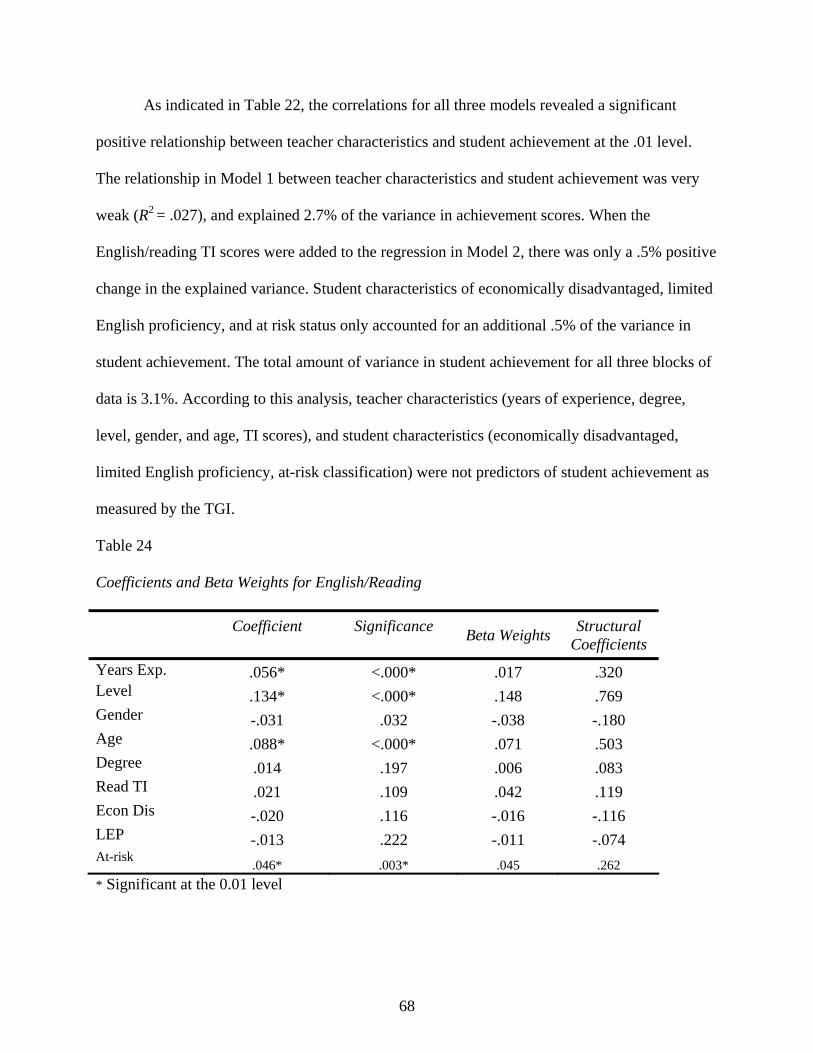
As indicated in Table 22, the correlations for all three models revealed a significant
positive relationship between teacher characteristics and student achievement at the .01 level.
The relationship in Model 1 between teacher characteristics and student achievement was very
weak (R2 = .027), and explained 2.7% of the variance in achievement scores. When the
English/reading TI scores were added to the regression in Model 2, there was only a .5% positive
change in the explained variance. Student characteristics of economically disadvantaged, limited
English proficiency, and at risk status only accounted for an additional .5% of the variance in
student achievement. The total amount of variance in student achievement for all three blocks of
data is 3.1%. According to this analysis, teacher characteristics (years of experience, degree,
level, gender, and age, TI scores), and student characteristics (economically disadvantaged,
limited English proficiency, at-risk classification) were not predictors of student achievement as
measured by the TGI.
Table 24
Coefficients and Beta Weights for English/Reading
Coefficient Significance Beta Weights Structural Coefficients
Years Exp. .056* <.000* .017 .320 Level .134* <.000* .148 .769 Gender -.031 .032 -.038 -.180 Age .088* <.000* .071 .503 Degree .014 .197 .006 .083 Read TI .021 .109 .042 .119 Econ Dis -.020 .116 -.016 -.116 LEP -.013 .222 -.011 -.074 At-risk .046* .003* .045 .262 * Significant at the 0.01 level
68

According to Table 24, only years of experience, level taught, age, and at-risk were
significant at the .01 level and contributed 5.6%, 13.4%, 8.8%, and 4.6% of the variance in TGI
scores. These characteristics all indicated a significantly positive relationship with student
achievement. According to the beta weights, level (primary or secondary) appeared to have the
strongest impact on student achievement among English/reading teachers. Years experience, age,
and at-risk also contributed, but to a smaller extent.
The hierarchical regression analysis for math, like the English/reading, was entered based
on three blocks. Model 1was the same teacher characteristics used in the previous analysis,
years of experience, degree, level, gender, and age. Model 2 added TeacherInsight to the
analysis, and Model 3 added the student variables of economically disadvantaged, LEP, and at-
risk. The correlations and results of the analysis for math are presented in the model summary for
math table (Table 25) and the regression summary table (Table 26).
Table 25
Model Summary for Math
Model R R2 Adjusted R2 SE
1 .155* .024 .022 1.04701 2 .165* .027 .025 1.04541 3 .181* .033 .030 1.04290 *Significant at the .01 level a. Predictors: (Constant), yrsexp, degree, level, gender, age b. Predictors: (Constant), yrsexp, degree, level, gender, age, mti c. Predictors: (Constant), yrsexp, degree, level, gender, age, mti, econ, rsk, lep d. Dependent variable: math tgi
69

Table 26 Multiple Regression Summary for Math
Model SS df MS F Significance1 Regression Residual Total
89.202
3647.126
3736.328
5
3327
3332
17.840
1.096
16.274
.000
2 Regression Residual Total
101.376
3634.952
3736.328
6
3326
3332
16.896
1.093
15.460
.000
3 Regression Residual Total
122.107
3614.221
3736.328
9
3323
3332
13.567
1.088
12.474
.000
a. Predictors: (Constant), yrs exp, degree, level, gender, age b. Predictors: (Constant), yrs exp, degree, level, gender, age, mti c. Predictors: (Constant), yrs exp, degree, level, gender, age, mti, econ, rsk, lep d. Dependent variable: math tgi
According to Tables 25 and 26, the overall correlations in all three models were positive
and statistically significant. There was a very weak relationship between teacher characteristics
and student achievement (R2 = .024). When math TI scores were added to the regression, there
was only a .3% change in the explained variance. When student characteristics were entered into
the analysis, a total increase of .6% was found to explain the variance in student achievement.
The total variance contributed by all three blocks of predictors was only 3.3%. The three models
indicated that teacher characteristics, TI scores, and student characteristics (economically
disadvantaged, LEP, at-risk) were very weak predictors of student achievement based on student
TGI scores.
Table 27 provides the regression coefficients, beta weights, and structural coefficients
between years of experience, level, gender, age, degree, TI score, economically disadvantaged,
70
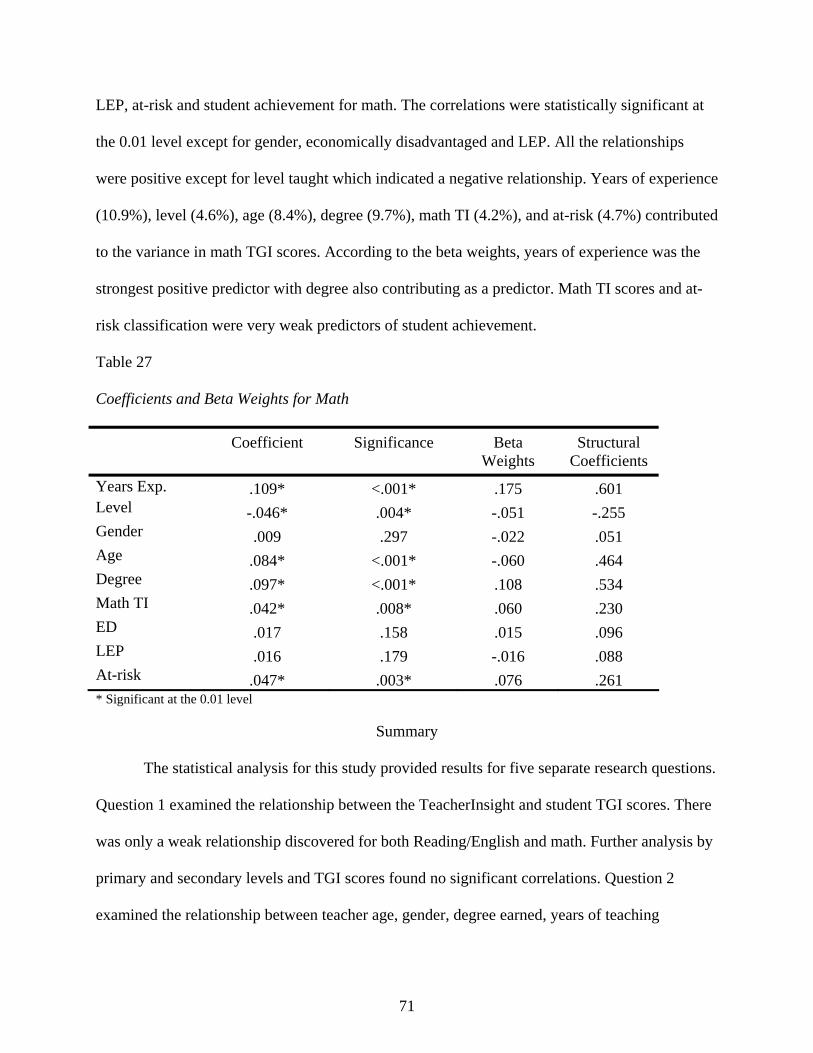
LEP, at-risk and student achievement for math. The correlations were statistically significant at
the 0.01 level except for gender, economically disadvantaged and LEP. All the relationships
were positive except for level taught which indicated a negative relationship. Years of experience
(10.9%), level (4.6%), age (8.4%), degree (9.7%), math TI (4.2%), and at-risk (4.7%) contributed
to the variance in math TGI scores. According to the beta weights, years of experience was the
strongest positive predictor with degree also contributing as a predictor. Math TI scores and at-
risk classification were very weak predictors of student achievement.
Table 27
Coefficients and Beta Weights for Math
Coefficient Significance Beta Weights
Structural Coefficients
Years Exp. .109* <.001* .175 .601 Level -.046* .004* -.051 -.255 Gender .009 .297 -.022 .051 Age .084* <.001* -.060 .464 Degree .097* <.001* .108 .534 Math TI .042* .008* .060 .230 ED .017 .158 .015 .096 LEP .016 .179 -.016 .088 At-risk .047* .003* .076 .261 * Significant at the 0.01 level
Summary
The statistical analysis for this study provided results for five separate research questions.
Question 1 examined the relationship between the TeacherInsight and student TGI scores. There
was only a weak relationship discovered for both Reading/English and math. Further analysis by
primary and secondary levels and TGI scores found no significant correlations. Question 2
examined the relationship between teacher age, gender, degree earned, years of teaching
71

experience, and level taught (primary or secondary) and the TeacherInsight instrument. The
regression analysis revealed that years of experience for teachers in math was the best predictor
of TI scores.
Although negative, age was also a reasonably good predictor of teacher TI scores for both
English/reading and math. Question 3 considered the relationship between the same teacher
characteristics and student achievement. The relationships were significant, but very weak for
both subject areas. Question 4 examined the student classifications of LEP, economically
disadvantaged, and at-risk. at-risk classification provided the only significant results for both
English/reading and math. The relationship between at-risk classification and TGI scores was
also very weak. Question 5 considered three blocks of data: teacher characteristics, teacher TI
scores, and student characteristics, and determined their relationship to student TGI scores.
These blocks combined explained only 3.1% of the variance in student achievement for
English/reading and only 3.3% of the variance in student achievement for math as measured by
TGI scores.
72

CHAPTER V
SUMMARY, DISCUSSION, CONCLUSIONS,
AND RECOMMENDATIONS
Introduction
Decades of legislation and programs at the state and federal levels related to education
and the success of students have effective teachers as a common factor. The difficulty for school
systems lies in the selection of the most effective teachers among many others trying to obtain a
position within the profession. School systems need to filter through countless applications but
also know what characteristics will translate into enhanced student performance. Studies looking
at the impact of various teacher characteristics on student performance find a great deal for
school systems to use as positive indicators. School systems in general use a common set of
preemployment teacher characteristics when hiring the people they believe are the best possible
teachers for their schools and, more importantly, people who that can produce the most
successful students.
The primary focus of this study was to determine if a preemployment indicator such as
the TeacherInsight Instrument is a good predictor of teacher performance by measuring student
performance on the Texas Assessment of Knowledge and Skills (TAKS). The study also
examined the possibility that certain teacher characteristics could impact the scores on the
TeacherInsight, and asked if those same characteristics had any relationship to student
achievement. Also considered was the impact of teacher characteristics and certain student
classifications on student achievement. Specifically, the study examined: (1) the relationship
between the TeacherInsight™ assessment tool (The Gallup Organization, Princeton, NJ,
http://education.gallup.com) and student growth using the Texas Growth Index (TGI); (2) the
73
relationship between certain teacher characteristics and the TeacherInsight (TI); (3) the
relationship between certain teacher characteristics and student performance; and (4) the
relationship between certain student classifications and student performance. The study also
examined the impact of certain blocks of teacher and student data on student achievement.
The TeacherInsight is the latest Web-based instrument developed by Gallup and purports
to be an accurate measure of teacher talent. The most talented teachers will be the most effective
in the classroom. The school district chosen for this study uses the TeacherInsight to screen
potential applicants, and those with scores at or above average are generally the ones who are
interviewed. This study measures the relationship between teacher scores on the TeacherInsight
and how well their students perform on a standardized test. The Texas Growth Index measures
student gain for every student and serves to measure student performance.
Almost 7,000 student TGI scores for English/reading and math were used in this study,
along with 132 teacher TI scores. These participants were from the 32 elementary, middle, and
high schools in this North Texas school district. Teacher data was obtained from the Personnel
Department, and student data was obtained from the Research and Accountability Department.
The data were filtered and sorted according to subject areas, grade levels, and certain teacher and
student criteria. Students included were in Grades 4-11 in English, reading, or math and had two
consecutive years of TAKS scores. Teachers were employed for the entire 2005-2006 school
year in Grades 4-11; taught English, reading, or Math; and had TeacherInsight scores. Teacher
and student information was merged utilizing teacher rosters as well as teacher and student ID
numbers.
74

Discussion of Findings
Literature relating to the TeacherInsight is scarce. At the time of this study, the only
studies available are those conducted by the Gallup Organization. All of those studies indicate
positive relationships between the TI and various indicators of teacher success. The predecessor
to the TI, the Teacher Perceiver Instrument, which is very similar, provided several useful
studies other than those conducted by Gallup. This study utilizes those as well as the studies
conducted by Gallup to further examine various relationships associated with the TI.
Research Question 1
What is the relationship between the TeacherInsight score and student achievement as
measured by the TGI in English, reading, and math?
The analysis of data found a statistically significant, positive but very small relationship
between the TeacherInsight score and student achievement using the Texas Growth Index. This
is also apparent in the scatter plots in the Appendix. They do not show strong relationships
between English/reading and student achievement or math and student achievement. The
correlations for both English/reading and math are very similar and weaker than anticipated.
Therefore, no distinctions can be made between English/reading and math teachers as it relates to
the achievement of their students.
The primary Gallup study relating to the TeacherInsight expresses results based on
quartiles and does not provide information related to the significance of each point on the
instrument (Drozd, 2005). The bottom of the highest quartile generally serves as the cut-off and
scores above this are considered the best candidates for the school district (Drozd, 2005). Since
the majority of the sample for this study fall into the upper quartile of TeacherInsight scores,
75

perhaps the results in this study demonstrate the difficulty in discriminating between the better
scores on the TeacherInsight.
The purpose of the TeacherInsight is primarily to screen for the best teachers from a very
large pool of applicants. The results from this study do not indicate that districts should not use
screening instruments such as the TeacherInsight. School districts should continue to use it in
combination with other hiring practices, but not solely as a predictor of student achievement. The
results reveal that there can be any number of things that can influence student performance.
Value-added assessment controls some of the variables that might impact student scores by
putting students on a more level playing field at the start. It is believed that the effectiveness of
teachers could be more accurately measured and compared with a value-added approach
(Sanders & Rivers, 1996).
Research Question 2
What is the relationship between teacher characteristics (age, gender, degree earned,
years of teaching experience, and level taught [primary or secondary]) and the TeacherInsight
instrument developed by Gallup?
This analysis finds a statistically significant positive relationship between teacher
characteristics of years of experience, level, age, gender and degree, and teacher scores on the
TeacherInsight in both English/reading and math. Although the relationship demonstrated by
both subjects is weak, math teacher characteristics overall show a stronger relationship and
account for more variance than did English/reading teacher characteristics. Teacher
characteristics for English/reading accounted for 8.1% of the variance and teacher characteristics
for math accounted for 13.6% of the variance. The effect size was .08 for English/reading and
.14 for math.
76
When considering teacher characteristics independently, English/reading teacher
characteristics of age (r = -.19) and degree (r = -.19) have the strongest correlations. However,
they both have an inverse relationship with TeacherInsight scores. Years of experience (r = -.30),
level (r = .-17), gender (r = -.12), age (r = -.19), and degree (r = -.05) for math teachers had a
negative relationship with TeacherInsight scores, with years of experience being the strongest.
These results suggest that younger math teachers tend to have higher scores on the TI than do
older math teachers.
There is no definitive answer in the literature as to the impact of years of experience on
the TI. It is not difficult to imagine that some level of experience would have an impact on the
manner in which a teacher answers certain questions on an interview instrument. Having 10
years in education and having taken the TeacherInsight myself, I find myself struggling between
the natural caring instinct for students and the legal ramifications of my actions. Therefore,
perhaps an experienced teacher who is more cognizant of the law and school policies answers a
question differently than a newly hired teacher. In this study, the older and experienced teachers
do not score higher on the TeacherInsight. In addition, the level of primary or secondary
assignments and the level of education have very little influence on TeacherInsight scores. The
overall results tend to confirm Gallup’s (2004) study that suggests TI scores are not significantly
impacted by teacher characteristics of age and gender. Although a small portion of variance can
be attributed to the teacher characteristics, the individual correlations are weak with the
exception of years of experience for math teachers.
It is anticipated that certain characteristics would have more impact on TI scores. For
instance, it is my perception, having been employed at both the primary and secondary levels
that primary teachers would have higher scores on the TeacherInsight. They tend to be more
77
nurturing, caring, and willing to build relationships and understand the needs of their students.
Effective primary programs are built around the caring relationships that teachers have with their
students (Wagner, 2002). Many of the themes on the TeacherInsight include descriptors such as
feelings, thoughts, relationships, needs, and listening (Gallup, 2003). The data, however, do not
show a significant relationship.
It was also hypothesized that because of the nature of some of the TeacherInsight themes just
described, female teachers would tend to score higher. Female teachers are generally more
sensitive and more lenient with behavioral concerns (Hopf & Hotzichristou, 1999), and also tend
to more supportive and expressive (Meece, 1987). The data actually show that, although the
relationships are weak, male math teachers scored higher on the TI than female math teachers (r
= -.12), and that female English/reading teachers score slightly higher on the TI than male
English/reading teachers (r = .04).
Research Question 3
What is the relationship between teacher characteristics (age, gender, degree earned,
years of teaching experience, and level taught [primary or secondary]) and student achievement
as measured by the TGI in English, reading, and math?
The results for this analysis also indicate a significantly positive, but very weak
relationship between certain teacher characteristics and student achievement as indicated by the
TGI for both English/reading (R2 = .03) and math (R2 = .02). There is little difference between
English/reading and math relationships. When considering individual characteristics, years of
experience and age are significant for both English/reading and math teachers, but the
relationships are very weak. All other teacher characteristics contributed minimally, negatively,
or not at all to student achievement. This confirms studies that have reported only minimal levels
78
of significance on student achievement for teacher years of experience (Murnane & Phillips,
1981; Klitgaard & Hall, 1974; Greenwald, Hedges, & Laine, 1996). There could be other factors,
such as professional development and the teacher learning environment, that influence student
achievement (Rosenholtz, 1984).
The teacher characteristics of degree and gender are not significant in this study. Studies
concerning various teacher characteristics, such as degree and gender, and their impact on
student achievement have not been in any way conclusive. The findings in this study support
research showing that teachers with advanced degrees fare no better than teachers with basic
degrees when it comes to student achievement, and in some cases, holding higher-level degrees
has a negative effect (Greenwald et al., 1996). Gaining additional knowledge by earning a
graduate level degree does not necessarily translate into better teachers based on student
performance. There are likely many factors that together impact student achievement. The results
of the study also do not support reports that indicate gender largely affects student achievement,
teacher’s perceptions of students, and student engagement with academic material (Dee, 2006).
Research Question 4
What are the relationships between the student classifications (LEP, economically
disadvantaged, at-risk) and student achievement as measured by the TGI in English, reading, and
math?
This question examines the relationship between students classified as LEP,
economically disadvantaged, and at-risk, and student achievement based on student TGI scores.
The results indicate that although the correlations are very small for both English/reading (r =
.05) and math (r = .05), only at-risk students provide a significant positive relationship. At-risk
classification accounts for only about 5% of the variance for both subjects.
79
The utilization of gain scores and a value-added approach to student achievement is an
attempt to control for some of the variables that influence the performance of students.
Determining gain allows students to start from where they are academically and measure a gain
over a determined time period (Sanders & Rivers, 1986). If a teacher is aware that his or her
students are not making the necessary amount of gain, it provides the teacher with useful
information concerning gaps in instruction and learning.
The results in this study support the idea that value-added assessment is not influenced by
student backgrounds and economic status when considering gain from one year to the next
(Sanders & Rivers, 1996). The student classifications of LEP and economically disadvantaged
did not provide significant results. At-risk classification had a very weak relationship with
student achievement. The expectation was that there would be little or no relationship between
student classifications and student achievement if gain scores were the measurement criteria.
Research Question 5
What are the relationships between specific blocks of student and teacher characteristics,
and student achievement as measured by the TGI in English, reading, and math?
This question examines how the certain groups or blocks of student and teacher data in
this study correlate with TGI scores. Three blocks of data are entered using hierarchical
regression. The first block includes teacher years of experience, level, gender, age and degree;
the second block includes TeacherInsight scores; and the third block includes LEP, economically
disadvantaged, and at-risk student classifications.
The results indicate that teacher characteristics, teacher TI scores, and student
characteristics are weak predictors of student achievement based on TGI scores. In
English/reading, 3.1% of the variance in student achievement is explained by the first (2.7%),
80
second (.2%), and third (.05%) blocks of predictor variables. In math, 3.3% of the variance in
student achievement is explained by the first (2.7%), second (.3%), and third (.6%) blocks of
predictor variables. Years of experience is the strongest predictor for English/reading and level is
the strongest predictor for math. Although the relationship is weak, age is the only predictor that
is significant in both subject areas.
Hierarchical regression analysis is used because it presents a good picture of how the
teacher data and student data as a whole impact student achievement. The results indicate that
overall, the teacher characteristics in this study have a minimal impact on student achievement
when using gain scores. This supports the study conducted by Goldhaber, who indicates that,
although empirical research demonstrates that teachers have substantial impacts on students,
there are no consistent traits associated with teacher effectiveness (2003). Darling-Hammond
points out that licensing or certification standards and access to professional development is
widely disparate across the nation (2000). This clearly indicates that there are other important
factors to consider when considering relationships between teacher characteristics and student
achievement.
After teacher characteristics, the results indicate that for both subject areas the
TeacherInsight adds very little to predicting variation in student TGI scores. No research has
been found that relates to the TeacherInsight, other than those studies provided by Gallup. This
study was not designed to provide support for Gallup’s study (Drozd, 2005) that indicates higher
student gains are correlated with higher quartiles of TeacherInsight scores. This study also does
not contradict Gallup’s study because there are significant differences. The results do support
earlier studies relating to the Teacher Perceiver that reported little or no relationship between the
instrument and student achievement (Thompson, 1982; Bingham, 2000). Therefore, if school
81
systems continue to use the TeacherInsight, they should use it in combination with other
selection criteria and not as the sole determinant of which applicants are granted an interview.
After considering TI scores, student classifications were added into the regression. When
considering these variables together, it is apparent that there is very little added to the variance in
student TGI scores for either subject area. at-risk classification is the only variable that is
significant for both English/reading (r = .046) and math (r = .047), but the relationship is very
weak. It is important to understand the student characteristics and their relationship to the
achievement in this particular school district. Gain scores are used to help control for these
variables and strictly examine gain from where the students start academically, not necessarily
on the level they should be based on grade and age. If a student starts school significantly
behind, more than one year of gain would have to be made consistently for that student to reach
the academic level for his or her grade.
Recommendations for Future Research
This study examines the relationship between TeacherInsight and student achievement as
measured using the Texas Growth Index. In addition, various teacher characteristics such as
years of experience, age, degree, level, and gender are considered in order to determine their
relationship to the TeacherInsight and student achievement. There are a number of studies that
could be conducted using these and other collections of data.
One recommendation for future studies is to utilize individual themes or the general
categories of themes associated with the TeacherInsight. Although there is not a strong
relationship between the TeacherInsight and student achievement in this study, there may be
stronger correlations with categories or individual themes. The categories are intrapersonal,
interpersonal, and extrapersonal, and the themes are presented in Chapter II. Currently, Gallup
82
does not have the data available to report the scores for the TeacherInsight by category or theme.
Only one score is reported for the entire set of interview questions.
This study also examined data at the primary and secondary levels in English/reading and
math. There is not sufficient data to distinguish between middle school and high school levels.
The sample size for middle school data is small compared to elementary and high school so it is
grouped with high school data. Elementary (primary) data and combined middle and high school
(secondary) data are considered in this study. Data need to be examined in regard to all levels
separately as well as to the subject areas of writing, science, and social studies. This study
considers only English, reading, and math.
This study utilized gain scores to measure student achievement. The state has just
recently provided calculations for TGI score, so it is new to the schools in Texas. Another
recommendation is to utilize more than two consecutive years of achievement data. Gain scores
for students over several years would provide more consistent data and add validity to future
studies.
I recommend that a school district using the TeacherInsight, or considering using it, test
all district teachers. This comprehensive coverage will provide a larger range of teacher scores.
In this study, there are a number of teachers within the school district who are not included in
this study because they do not have TeacherInsight scores. In general, the teachers who might
have performed poorly are never considered because the chances of an interview are low. The
school district typically grants interviews to those with the higher TeacherInsight scores.
Considering those teachers who score very low will help add validity to the study because it will
examine their impact on student achievement as well. If those teachers’ students perform poorly,
83
and they score low on the TeacherInsight, this inclusion will assist in making more substantial
conclusions about the effectiveness of the TI as a teacher selection instrument.
One additional recommendation is to conduct a similar study to this one using data from
all the school systems that utilize the TeacherInsight, but generalize it enough to make
comparisons with other school districts that do not use the instrument. For instance, collect
student performance data in the form of gain scores from all the districts in the state of Texas that
use the TeacherInsight, and from those that do not. If the instrument has been used for a number
of years and it truly measures talent and selects the most effective teachers, there should be
increases in performances, especially when compared to school systems that have similar
characteristics but that do not use the instrument. It would also be important to consider all
selection criteria used by individual districts when making comparisons.
Conclusions
The results of the study will not change the way personnel departments hire prospective
teachers for their school systems. The purpose of this study is to examine the relationship
between the TeacherInsight and student achievement, as well as the relationship that certain
characteristics may have with the TeacherInsight and with student achievement. The hope is that
school systems could be more confident in making hiring decisions because they would be more
aware of the TeacherInsight’s ability to select the best teachers for their schools.
The TeacherInsight is used to screen potential teacher applicants with a 40-question on-
line test that asks questions relating to applicant opinions and attitudes toward teaching. If
teachers to do not score in the top quartile, there is a good possibility they will not be
interviewed by the district. Based on the findings in this study, that may cause the district to lose
some potentially effective teachers.
84
Although there was a small relationship between the TeacherInsight and student
achievement, the predictive ability of the TeacherInsight is uncertain. Years of teaching
experience does have a small impact on TeacherInsight scores and student achievement in this
study, but the relationship is very weak. It is difficult to imagine that experience, and other
variables such as professional development related to working on relationships with students and
the pedagogy coursework associated with licensure, does not impact the manner in which
questions on the TeacherInsight are answered. Having taken the TeacherInsight recently, I found
myself struggling with many of the questions based on what I learned during my graduate
studies, what I have learned on the job in working with others, and what I truly feel about
education. I believe my responses to some of the questions would be different at different times
in my educational career. Whether that has an impact on my score I do not know because I never
saw my score.
Certain teacher and student characteristics may have more influence in specific
circumstances, but as with many other studies, this study does not provide any substantial
evidence that the characteristics of years of experience, age, gender, level, degree, economically
disadvantaged, LEP, and at-risk status have a substantial impact on student achievement. I
believe the use of gain scores in this study helped to control for variables related to student
background, because gain scores are based on where a student starts and ends academically, not
on an achievement level based on mastery at a certain grade level.
The TeacherInsight is used by many school systems across the nation. Until additional
studies are conducted by researchers inside and those outside the Gallup organization, it is
difficult to support or refute the findings claimed thus far relating to the TeacherInsight. This
study recommends that additional studies be conducted, and that they incorporate all teachers
85

and the performances of their students, all school systems that utilize the TeacherInsight, and the
utilization of gain scores to represent student achievement.
86

APPENDIX
SUPPLEMENTAL FIGURES
87

Figure 1. Regression Standardized Predicted Value With rtgi as Dependent Variable.
Scatterplot
Dependent Variable: rtgi
20-2-4-6 -8
5.00
2.50
0.00
-2.50
-5.00
rtgi
Regression Standardized Predicted Value
88

Figure 2. Regression Standardized Predicted Value With mtgi as Dependent Variable.
3210-1-2-3
Regression Standardized Predicted Value
5.00
2.50
0.00
-2.50
-5.00
mtg
i
Scatterplot
Dependent Variable: mtgi
89
REFERENCES
Antilone, C. (2000). A validation study of the Teacher Perceiver Interview. Unpublished doctoral dissertation, Texas Women’s University, Denton, Texas. Ballou, D. (2002). Sizing up test scores. Education Next, 2. Retrieved April 5, 2007, from
http://www.hoover.org/publications/ednext/3365706.html. Berliner, D., & Tikunoff, W. (1976). The California beginning teacher evaluation study:
Overview of the ethnographic study. Journal of Teacher Education, 27(1), 24-30. Bingham, P. (2000). The concurrent and predictive validity of elementary school teacher
preemployment success indicators. Unpublished doctoral dissertation, University of Texas, Austin.
Brown, K. (2004). The impact of the Gallup Teacher Perceiver Interview on hiring teachers as
perceived by selected administrators in the Alamo Heights Independent School District, San Antonio, Texas. Unpublished doctoral dissertation, Texas A&M University, College Station. Retrieved December 30, 2006, from ProQuest Dissertations.
Chalker, D. (1981). The Teacher Perceiver Interview and an instrument for predicting
successful teaching behavior. Unpublished doctoral dissertation, Wayne State University, Detroit. Retrieved December 30, 2006, from ProQuest Dissertations.
Coleman, J., Campbell, E., Hobson, C., McPartland, J., Mood, A., Weinfeld, F., & York, R.
(1966). Equality of educational opportunity. Washington, DC: U.S. Government Printing Office.
Darling-Hammond, L. (2000). Teacher quality and student achievement: A review of state policy
evidence. Education Policy Analysis Archives, 8(1). Dee, T. (2006). The why chromosome: How a teacher’s gender affects boys and girls. Education
Next, 4. Retrieved April 5, 2007, from http://www.hoover.org/publications/ednext/3826496.html
Drozd, D. (2005). TeacherInsight and student achievement. Princeton, NJ: The Gallup
Organization Education Division. Edmonds, R. (1979) Effective schools for the urban poor. Educational Leadership, 37(1), 15-27. Educational Testing Service (2004). The Praxis Series. Princeton, NJ: Author. Retrieved August
15, 2005, from http://www.ets.org. Effective Schools Products. (2001). Revolutionary and evolutionary: The effective schools
movement. Okemos, MI: Author. Retrieved July 15, 2005, from http://www.effectiveschools.com.
90

Evergreen Freedom Foundation (2001). School director’s handbook: Value-added assessment.
Olympia, WA: Author. Retrieved June 10, 2006, from http://www.effwa.org/pdfs/Value-Added.pdf.
Frey, P. (2003). Ability of the urban teacher selection interview to identify teachers who are
likely to be retained in the Buffalo Public Schools. Unpublished doctoral dissertation, Seton Hall University, South Orange, NJ. Retrieved December 30, 2006, from ProQuest Dissertations.
Fuller, E. (1999). Does teacher certification matter? A comparison of TAAS performance in
1997 between schools with low and high percentages of certified teachers. University of Texas, Austin, Charles A. Dana Center.
Furgeson, R. (1991, Summer). Paying for public education. New evidence on how and why
money matters. Harvard Journal on Legislation, 28(2), 465-498. Furgeson, P. & Womak, S. (1993). The impact of subject matter and education coursework on
teaching performance. Journal of Teacher Education, 44(1), 55-63. Gallup Organization. (1997). The Gallup Organization teacher perceiver. Princeton, NJ: Author.
Retrieved July 15,2005, from http://education.gallup.com. Gallup Organization. (2002). TeacherInsight system. Princeton, NJ: Author. Retrieved July 15,
2005, from http://education.gallup.com. Gallup Organization. (2004). TeacherInsight interview: Predictive validity study 2003-2004
School Year. Princeton, NJ: Author. Gardner, D. P., Larsen, Y. W., Baker, W. O., Campbell, A., Crosby, E. A., Foster, C. A., et
al. (1983). A nation at risk: The imperative for school reform. Washington, DC: U.S. Department of Education, National Commission on Excellence in Education.
Goebel, S., Ronacher, K., & Sanchez, K. (1989). An evaluation of HISD’s alternative
certification program of the academic year: 1988-1999. Houston: Houston Independent School District, Department of Research and Evaluation. (ERIC Document No. 322103).
Goldhaber, D. D., & Brewer, D. J. (2000, Summer). Does teacher certification matter? High
school certification status and student achievement. In Educational Evaluation and Policy Analysis, 22(2), 129-45. Washington, DC: U.S. Department of Education, Institute of Education Sciences. (ERIC Document No. EJ615883).
Goldstein, W. (1986). Recruiting superior teachers: The interview process. Phi Delta Kappan,
Bloomington, IN: Phi Delta Kappa Educational Foundation.
91
Gordon, G. (2003, December). Alternative certification and the TeacherInsight. Omaha, NE: Gallup Organization Education Division. Retrieved July 30, 2004, from http://gmj.education.gallup.com.
Greenwald, R., Hedges L, and Laine, R. (1996). The effect of school resources on student
achievement. Review of Educational Research, 66, 361-396. Haberman, M. (1995). Star teachers of children in poverty. West Lafayette, IN: Kappa Delta Pi. Haberman, M. (2005). Selecting and preparing urban teachers. Haberman Foundation. Retrieved
August 15, 2005, from http://www.altcert.org/research/research.asp?page=Research&article=preparing.
Hanuseck, E., (1986, September). The economics of schooling: Production and efficiency in
public schools. Journal of Economic Literature, 24(3), 1141-78. Hanuseck E., Kain, J., & Rivkin, S. (1999). Do higher salaries buy better teachers? (Working
Paper No. 7082). Cambridge: National Bureau of Economic Research. Hawkins, E., Stancavage, F. & Dossey, J. (1998). School policies and practices affecting
instruction in mathematics. Washington, DC: National Center of Education Statistics. Heartland Institute (2001, October). Teacher experience and student achievement. School Reform News. Retrieved June 12, 2006, from
http://www.heartland.org/ArticleProcessor.cfm?theId=artId10131 Hopf, D., & Hotzichristou (1999). Teacher gender-related influences in Greek schools. British Journal of Educational Psychology, 69, 1-18. Howard, M. A. (1998). The relationships among teacher selection predictors and teacher performance with principals’ opinions about teacher selection process. Unpublished
doctoral dissertation, Georgia State University, Atlanta. Retrieved December 30, 2005, from ProQuest Dissertations.
Huffcutt, A. (1992). An empirical investigation of the relationship between multidimensional
degree of structure and the validity of the employment interview. Unpublished doctoral dissertation. Texas A&M University, College Station.
Hussar, W. (1999). Predicting the need for newly hired teachers in the United States to 2008-
2009. Washington, DC: U.S. Department of Education, National Center for Education Statistics.
Kanipe, M. (1996). A study of the predictive validity of the Urban Teacher Perceiver Interview in
the Knox County School System. Digital dissertations, University of Tennessee, Knoxville.
92
Klitgaard, R., & Hall, G. (1974). Are there unusually effective schools? Journal of Human Resources, 10(3). 90-106. Kupermintz, H. (2005). Value-added assessment of teachers: The empirical evidence. In A.
Molnar (Ed.), School reform proposals: The research evidence. Tempe: Arizona State University, Educational Policy Studies Laboratory. Retrieved June 12, 2006, from http://www.asu.edu/educ/epsl/EPRU/documents/EPRU 2002-101/Chapter 11-Kupermintz-Final.pdf
Lezotte, L. W. (1991). Correlates of effective schools: The first and second generation. Okemos,
MI: Effective Schools Products, Ltd. Mauser, P. J. (1986). The predictive validity of the Teacher Perceiver Interview to teacher
effectiveness. Unpublished doctoral dissertation, Oklahoma State University, Norman. Retrieved December 30, 2005, from ProQuest Dissertations (AAT 8709724).
Mayberry, W. (1970). The effects of perceived teacher attitudes on student achievement.
Doctoral dissertation, University of Illinois, Urbana-Champaign. (Eric Document Reproduction Service No. ED050013).
McDaniel, M., Whetzel, D., Schmidt F., & Maurer, S. (1994). The validity of employment
interviews: A comprehensive review and meta-analysis. Journal of Applied Psychology, 75, 322-327.
Meece, J. (1987). The influences of school experiences on the development of gender schemata.
In L. S. Lisben & M. L. Signorella (Eds.), Children’s gender schemata (pp. 57-73). San Francisco: Jossey-Bass.
Miller J., McKenna B., & McKenna, M. (1996). A comparison of alternatively and traditionally
prepared teachers. Journal of Teacher Education 49(3), 165-176. Monk, D. (1994). Subject matter preparation of secondary mathematics and science teachers and
student achievement. Economics of Education Review 13(2), 125-145. Morrow, L. (1991). Trends and strategies in early literacy education. In Perspectives on early
childhood education: Growing with young children toward the 21st century (pp. 105-115). Washington, DC: National Education Association.
Murnane, R. (1985). Do effective teachers have common characteristics: Interpreting the
quantitative research evidence. Paper presented at the National Research Council Conference on Teacher Quality in Science and mathematics, Washington, DC.
Murnane, R., & Phillips, B. (1981). Learning by doing, vintage, and selection: Three pieces of
the puzzle relating teaching experience and teaching performance. Economics of Education Review 4, 691-693.
93
National Association of State Boards of Education (NASBE). (2005). NASBE study group on value-added assessment. Alexandria, VA: Author. Retrieved August 15, 2005, from http://www.nasbe.org/Research_Projects/Value_Added_Assessment.html.
National Board for Professional Teaching Standards. (2005). The five core propositions.
Retrieved August 15, 2005, from http://www.nbpts.org/about/index.cfm. No Child Left Behind Act, 20 U.S.C. § 6301 (2001). Overman, W. (1981). The importance of the Teacher Perceiver Interview as a teacher selection
criterion to administrators in relationship to their leadership style. University of Northern Colorado, Greeley. Retrieved February 4, 2007, from Proquest Dissertations (AAT8202717).
Rosenholtz, S. J. (1985). Effective schools: Interpreting the evidence. American Journal of
Education, 93(3), 352-388. Rowan, B., Correnti, R., & Miller, R. J. (2002). What large-scale, survey research tells us about
teacher effects on student achievement: insights from the prospectus study of elementary schools. Teachers College Record, 104(8), 1525-1567.
Ryan, P., & Alcock, M. (2002). Personal and interpersonal attributes in selecting teachers. Action in Teacher Education 24(1), 58-67. Sanders, W., & Rivers, J. (1996). Cumulative and residual effects of teachers on future student academic achievement. (Research Progress Report). Knoxville: University of
Tennessee, Value-Added Research and Assessment Center. Schalock, D. (1979). Research on teacher selection. In D. C. Berliner (Ed.) Review of Research
in Education, Vol. 7. Washington, DC: American Education Research Association. Schmidt, F., & Rader, M. (1999). Exploring the boundary conditions for interview validity:
Meta-analytic validity findings for a new interview type. Personnel Psychology 52(2), 445-464.
Strauss, R., & Sawyer, E. (1986). Some new evidence on teacher and student competencies.
Economics of Education Review 5(1), 41-48. Taylor, P., & Small, B. (2002). Asking applicants what they would do versus what they did do:
A meta-analytic comparison of situational and past behavior employment interview questions. Journal of Occupational and Organizational Psychology, 75, 277-294.
Teachers and Goals 2000: Leading the journey toward high standards for all students. (2000).
[Handbook]. Washington, DC: U.S. Department of Education. Retrieved August 15, 2005, from http://www.ed.gov/G2K/teachers/plan-prt.html.
94

95
Texas Education Agency. (2007). Assessment: Testing and assessment 2007. Retrieved July 12, 2006, from http://www.tea.state.tx.us/assessment.html.
Thompson, A. (1982). The teacher perceiver interview as related to student achievement.
Unpublished doctoral dissertation, University of Northern Colorado, Greeley. Wagner, T. (2002). Secondary school change. First published in Education Week, 22(13), 40.
Retrieved May 19, 2007, from http://www.schoolchange.org. Wallwey, D. (2001). TeacherInsight Interview: Interview development study technical report.
Princeton, NJ: Gallup Organization. Walsh, K. (2001). Teacher certification reconsidered: Stumbling for quality. Baltimore: Abell
Foundation. Whetzel, D., Baranowski, L., Petro, J., Curtin, P., & Fisher, J. (2003). A written structured
interview by any other name is still a selection instrument .Applied H.R.M. Research 8(1), 1-16.
Young, I., & Delli, D. (2002). The validity of the Teacher Perceiver Interview for predicting
performance of classroom teachers. Education Administration Quarterly 38(5), 586-612. Zaranek, R. (1983). A correlation analysis between the teacher perceiver interview and teacher
success in the Chippewa Valley School System (Michigan). Unpublished doctoral dissertation, Western Michigan University, Kalamazoo.