by the soil and the plant - department of water resources€¦ · evapotranspiration or consumptive...
TRANSCRIPT

1294Crop Water Use
California Water Plan Update 2005
Evapotranspiration and Relative Contribution by the Soil and the Plant By Theodore Hsiao and Liukang Xu, UC Davis

California Water Plan Update 2005
Volume 41304
Evapotranspiration and Relative Contribution by the Soil and the Plant
Evapotranspiration and Relative Contribution by the Soil and the Plant By Theodore C. Hsiao and Liukang Xu
Department of Land, Air and Water ResourcesUniversity of California, Davis
IntroductionA field receives water as rain or irrigation. Some of this water may be lost in liquid form as runoff. Some,after infiltrating the soil, may continue to move deeper as liquid beyond the root zone and into the ground water. Usually, the major loss of water is as vapor, by evaporating from the soil or being transpired by the plants growing on the soil. The liquid loss can be recovered either as ground water or stream flow byusers downstream. The water lost as vapor is dissipated in the atmosphere, a huge sink, and cannot berecovered except as precipitation. For all intents and purposes, evapotranspiration from a field, consisting of both water transpired by plants and evaporated from the soil, represents an irreversible loss from that geographical location, and is referred to as consumptive water use.
Evapotranspiration or consumptive water use is usually beneficial, in that plants are grown and producedin exchange for the water used. Plants grow and acquire their biomass (dry weight) by assimilating carbon dioxide from the air via photosynthesis. To acquire carbon dioxide from the air, plants open their stomata, the microscopic control valves on the leaf surface, to let carbon dioxide diffuse into the leaves for photosynthesis. At the same time, water vapor escapes inevitably via the same open valves into the atmosphere. Hence, carbon dioxide assimilation and transpiration (T) are closely associated, and highproduction is usually linked to high crop water use, as long as that use is the result of transpiration(Tanner and Sinclair, 1983; Hsiao, 1993).
The consumptive use of water through soil evaporation (E), however, is not in exchange for carbon dioxide assimilation. Therefore it is usually considered to be non-beneficial use. This point of view is perhaps slightly too simplistic, and will be discussed in a later section. In any event, in managing the limited water resource of the state of California, it is important to know more accurately how much water crop fields evapotranspire, and how much of the evapotranspiration is due to soil E. It is also important to devise and develop means to minimize the E part of ET. This chapter presents pertinent informationbearing on these points and is made up of two parts. The first part discusses ET in terms of the basic principles and important factors determining ET and the quantitative relationships. That is followed by a brief description of the methods used to separate out soil E from plant T, and a review of the literaturequantifying the extent of soil E relative to ET. The second part reports on the results of experimentsconducted to obtain additional information on the factors affecting ET and the proportion of E in ET, the extent ET is suppressed while water is applied by sprinklers, and the extent that crop T is likely to be increased by minimizing soil E.
Conceptual Background and Analysis of the Literature
Energy Supply for Evapotranspiration and Interactions Between E and T
For water to be evapotranspired, it must be converted from liquid form to vapor form. Water has an unusually high latent heat of vaporization—it takes approximately 2.45 kJ (580 calories) of energy toevaporate one gram of water. For a crop field, virtually all of this energy comes from the aerial
1
Evapotranspiration and Relative Contribution…

1314Crop Water Use
California Water Plan Update 2005
Evapotranspiration and Relative Contribution by the Soil and the Plant
environment. By far the most important source of energy for ET is solar radiation absorbed by the field. This is known as net radiation transfer and consists of the incoming radiation minus the outgoingradiation. A minor source is the direct heating of the crop and soil by air going over the field, whichoccurs only when the air is warmer than the crop and the soil. This energy supply is termed sensible heat transfer. For many situations, the absorbed radiation is so dominating that daily or weekly ET from a fullywet field can be estimated from the net radiation over the field for the same period. The energy supplied by net radiation is divided by the latent heat of vaporization to obtain the amount of water evapotranspired. Such estimates often fall within 5 or 10 percent of the true ET. Deviation is caused by the warming or cooling of the field by the overhead air mass. ET (when converted to energy units) would be greater than net radiation if the air has a net warming effect on the field, and would be less if the air is mostly cooler than the field and has a net cooling effect.
If the rate of energy supplied as net radiation is suddenly reduced for an evapotranspiring field by a passing cloud blocking the sun, ET would continue for a very short moment (seconds to minutes) at nearly the same rate, but with part of the energy supplied by the sun for evaporation now coming from the heat stored in the crop and soil. The loss of the stored heat to the evaporation process reduces thetemperature of the crop and the soil. The cooler temperature then leads to a lower water vapor concentration in the crop and at the soil surface, which in turn slows down ET quickly after the cloud blocks the sun. If the energy supply is suddenly increased as the cloud moves away and the sun reappears, or by a warm wind, ET would remain momentarily at near the original rate, until the extra energy heats up the crop and soil. The higher temperature then raises the water vapor concentration in the leaves and at the soil surface, leading to an increase in ET.
Water vapor concentration in leaves and at the soil surface change with temperature because saturationwater vapor concentration is strongly dependent on temperature, rising as temperature of the water increases (Clausius0-Clapeyron equation). The air space network inside leaves is essentially saturatedwith water vapor. For any given soil water status (soil moisture tension), the air layer a few moleculesthick adjacent to the soil is also nearly saturated with water vapor. Hence, changes in temperature of the leaves and the soil are associated with changes in water vapor concentration at the water losing surface.
Under favorable conditions with ample water supply when leaves are photosynthesizing at a high rate, stomata of most crop species are essentially fully open. In that case the foliage canopy acts essentially as a fully wet surface, transpiring at a rate similar to evaporation from a free body of water at the sametemperature, covering the same land area as the canopy, and under the same aerial environment. This rate may be loosely referred to as the potential rate of transpiration, evaporation, or evapotranspiration. Whenplants are deficient in water or nutrients, and when temperature is too cold, stomata are less open and photosynthesis rate lower, the canopy would act as a surface that is less than fully wet, and transpiration would be below the potential rate. For the soil, evaporation is at the potential rate when the surface is fully wet and vapor concentration essentially the same as that of a body of water at the same temperature.When the soil surface begins to dry out and surface vapor concentration falls significantly below that of free water at the same temperature, soil E would fall below the potential rate.
Crop fields may be considered to be composed of three types of surfaces-canopy surface, exposed soil surface, and shaded and sheltered soil surface. Shaded soil surface receives very little radiation and is at a temperature considerably lower than that of exposed soil. This, coupled with the fact that it is generallysubjected to less wind and under air of higher humidity because of transpiration of the canopy overhead,
2
California Water Plan Update 2005
Volume 41324
Evapotranspiration and Relative Contribution by the Soil and the Plant
limit its evaporation to a very low level. Consequently, one may assume that ET from a crop field is largely due to T from the canopy and E from the exposed soil surface. For situations of fully wet exposed soil surface and canopy with fully open stomata, the field acts as a fully wet surface as a whole, and evapotranspires at essentially the potential rate or slightly higher. For situations of partial canopycoverage of the soil combined with dry or not fully wet exposed soil, the field would evapotranspire at a rate lower than the potential and acts effectively as a surface that has dried to some degree.
Reference ET and Crop Coefficient
When the surface is fully wet, ET is at the potential rate determined by atmospheric conditions. The important weather variables are radiation, temperature, water vapor concentration (humidity) in the air, and wind velocity. An integrated measure of the capability of the atmosphere to supply the energy for ET and carry away the water vapor is reference evapotranspiration (ETo). ETo is defined as “the rate of ET from an extended surface of a short green crop (usually a grass kept short by frequent mowing),completely shading the ground and not short of water or nutrients”. For practical purposes, ETo is either the same or very similar to potential ET and may assumed to be the same. Instead of being measured on grasses, ETo is now commonly calculated from weather data using certain formula, or derived from pan evaporation data. Sufficient research has been done previously to verify that the calculated results are in close agreement with the results measured on grass as a reference crop (Doorenbos and Pruitt, 1975). For different locations in California, the Department of Water Resources collects the weather data from anetwork of weather stations and makes the ETo data available for downloading from its web site. Although defined with grass as a reference crop, ETo takes into account the effects of weather and is indicative of the evaporative demand of the atmosphere. The influence exerted by the crop and the soil on ET, however, is not included in ETo. Crop and soil exert their control on ET mostly by altering the wetness of their surfaces. To a minor degree the roughness of the field, mostly determined by geometry of the vegetation, also exerts an effect. A rougher surface causes air moving over it to be more turbulent,enhancing the rate of ET slightly. In the common practical method of estimating ET, the impact of the crop and the soil is accounted for by a coefficient known as crop coefficient (Kc). Kc is defined as the ratio of crop ET to ETo, such that:
ET = Kc ETo
Thus, Kc is essentially an integrated measure of the “effective wetness” and roughness of the surface of the field, while ETo is an integrated measure of the evaporative demand of the atmosphere. Another way to consider Kc is to think of it as ET of the crop normalized for the evaporative demand of the atmosphere. The simple equation holds for different time intervals chosen, ranging from hourly ET to weekly and monthly means.
Seasonal Pattern of ET of Annual Crops
The life cycle of annual crops may be divided into three phases, each characterized by its own ET rate and somewhat different response to environmental or management factors. During the first phase, the foliage canopy, very sparse at the beginning, grows with time until it fully or nearly fully covers the soil. The second phase, usually lasting for several weeks or more, consists of the time period when the canopy is full and green with no obvious yellowing. This is the period when the crop produces dry matter at the highest rate due to high rates of photosynthesis per unit of land area. The third phase starts as the crop begins to mature and the older leaves senesce and turn yellow first, followed by younger and youngerleaves, until the crop is fully mature or harvested.
3
Evapotranspiration and Relative Contribution…
1334Crop Water Use
California Water Plan Update 2005
Evapotranspiration and Relative Contribution by the Soil and the Plant
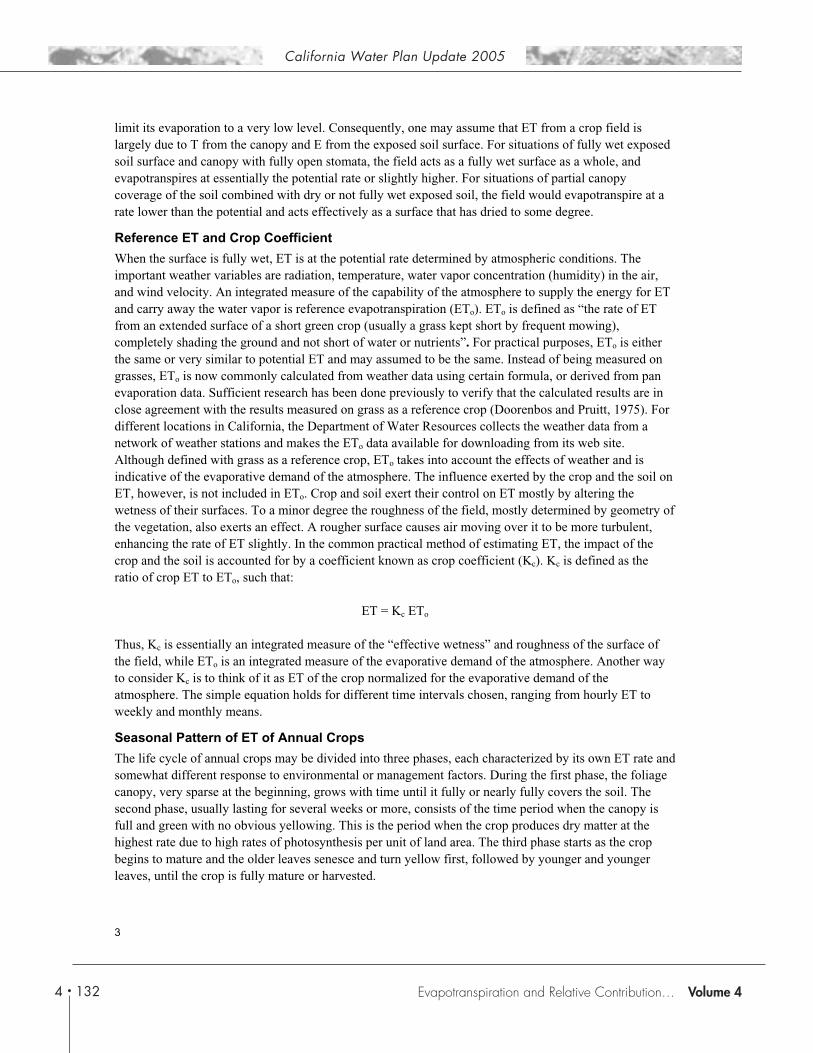
An example of the pattern of ET of an annual crop over the first two phases plus the beginning of the third phase is given in Figure 1. ETo calculated from weather data is depicted by the dashed line. Effects of day-to-day variations in weather on ET are discernible as indicated by the variations in ETo. More importantly, features attributable to the development of crop canopy cover and changes soil surface wetness stand out in Figure 1. For the first half of the graph, there is a gradual rise in base-line ET that can be visualized if one draws an imaginary smooth curve connecting the lowest ET rates for the first half of the graph. Added to this base line are several skewed ET peaks occurring after each irrigation. The peaks (referred to simply as irrigation spikes) are due to evaporation from the exposed soil surface after it is wetted by the irrigation water. As the soil surface begins to dry one or two days after an irrigation, soil E declines with time. The basal ET is due mostly to transpiration from the crop, plus some residualevaporation from the exposed soil at its driest point. In the first two or three weeks after planting, the plants have only very few leaves and the canopy covers only an insignificant portion of the ground.Therefore soil E accounts for virtually all of the ET. As the canopy of the crop develops, more and moreof the ground is covered by the canopy, which continues to transpire regardless of the wetness of the soil surface, as long as the crop is obtaining sufficient water from the deeper part of the soil to keep its stomata open. Hence, base line ET rises with time in Figure 1, until the canopy covers the ground nearlyfully.
With full ground cover, the canopy intercepts nearly all the radiation energy and accounts for most of the ET and soil E is not of much significance. ET is then insensitive to the wetting of the soil surface under the canopy, and hence is not affected perceptively by irrigation. In Fig. 1, the soil was mostly covered bythe crop canopy about 55 days after planting. There were therefore no marked irrigation spikes in ET after that time, in spite of the irrigations. Near the end of the time interval shown in Fig. 1, older leaves of the canopy begin to turn yellow. This senescence apparently accounted for the decline in ET relative to ETo at that time. The dip in ET on days 54, 66, 74, and 75 after planting were the result of cloudy and cool weather as indicated by the low values of ETo on those days.
4
California Water Plan Update 2005
Volume 41344
Evapotranspiration and Relative Contribution by the Soil and the Plant
0 20 40 60 800
2
4
6
8
10
Irrigations
Bean ET
EToET
(m
m d
ay-1
)
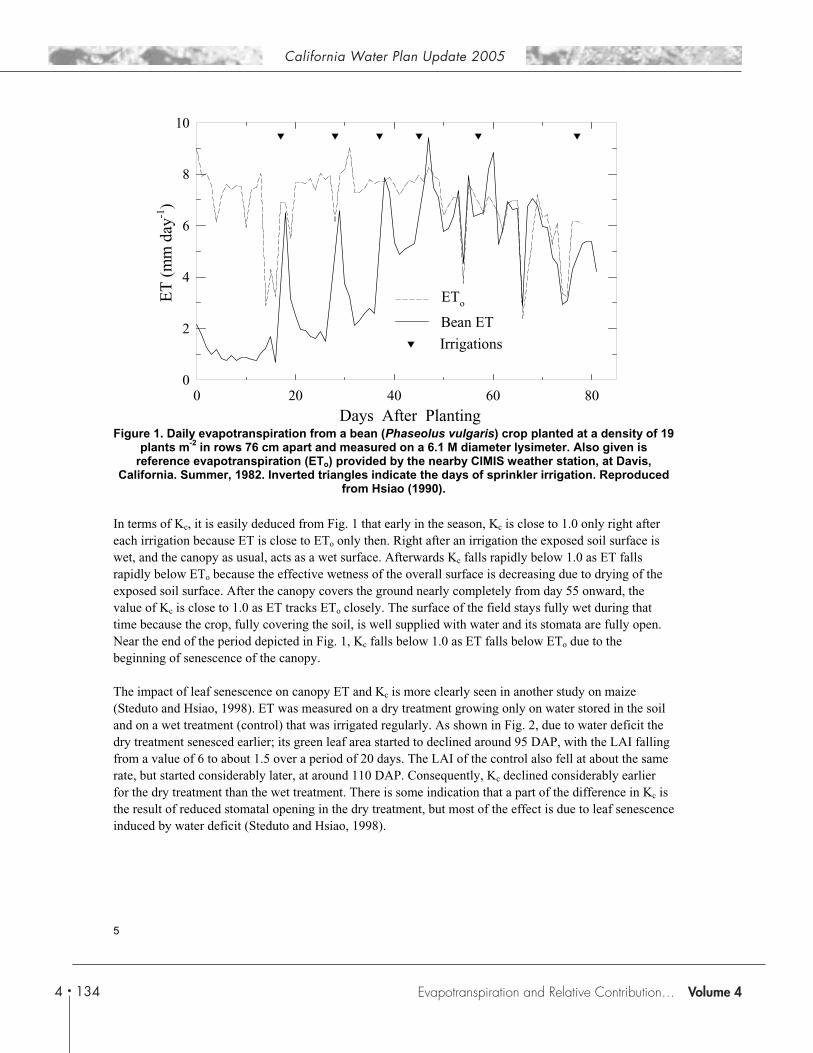
Days After PlantingFigure 1. Daily evapotranspiration from a bean (Phaseolus vulgaris) crop planted at a density of 19
plants m-2 in rows 76 cm apart and measured on a 6.1 M diameter lysimeter. Also given is reference evapotranspiration (ETo) provided by the nearby CIMIS weather station, at Davis,
California. Summer, 1982. Inverted triangles indicate the days of sprinkler irrigation. Reproducedfrom Hsiao (1990).
In terms of Kc, it is easily deduced from Fig. 1 that early in the season, Kc is close to 1.0 only right after each irrigation because ET is close to ETo only then. Right after an irrigation the exposed soil surface is wet, and the canopy as usual, acts as a wet surface. Afterwards Kc falls rapidly below 1.0 as ET falls rapidly below ETo because the effective wetness of the overall surface is decreasing due to drying of the exposed soil surface. After the canopy covers the ground nearly completely from day 55 onward, the value of Kc is close to 1.0 as ET tracks ETo closely. The surface of the field stays fully wet during that time because the crop, fully covering the soil, is well supplied with water and its stomata are fully open. Near the end of the period depicted in Fig. 1, Kc falls below 1.0 as ET falls below ETo due to thebeginning of senescence of the canopy.
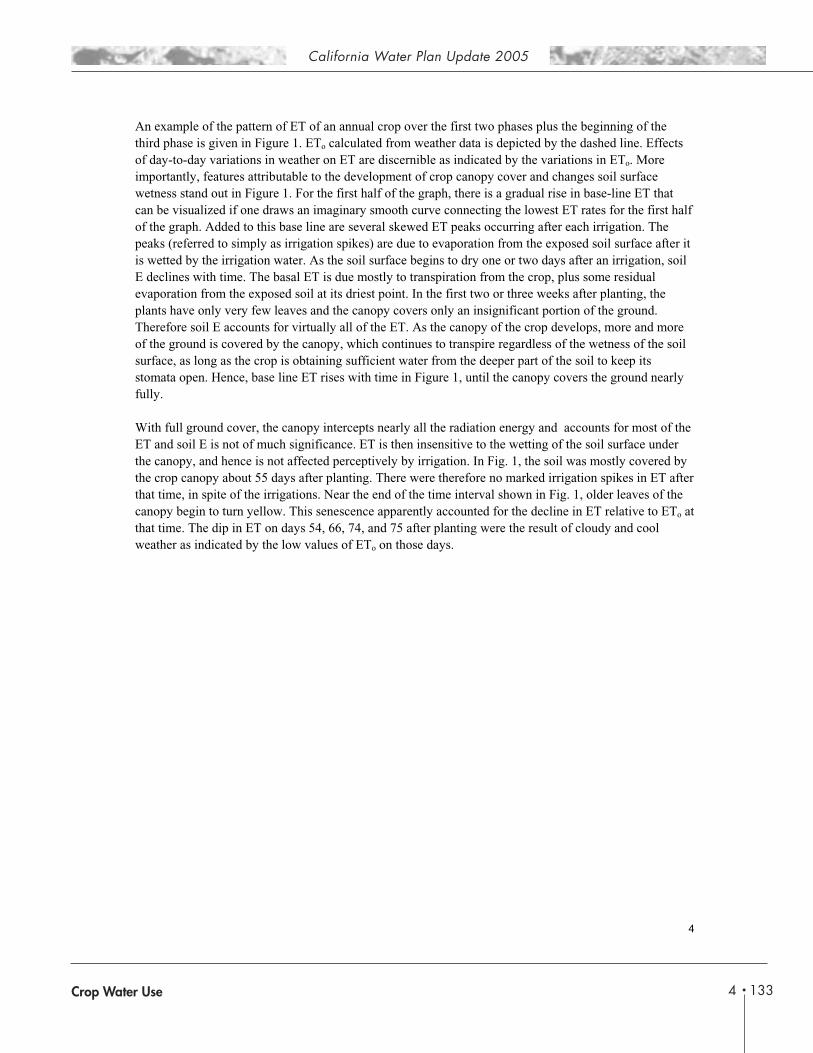
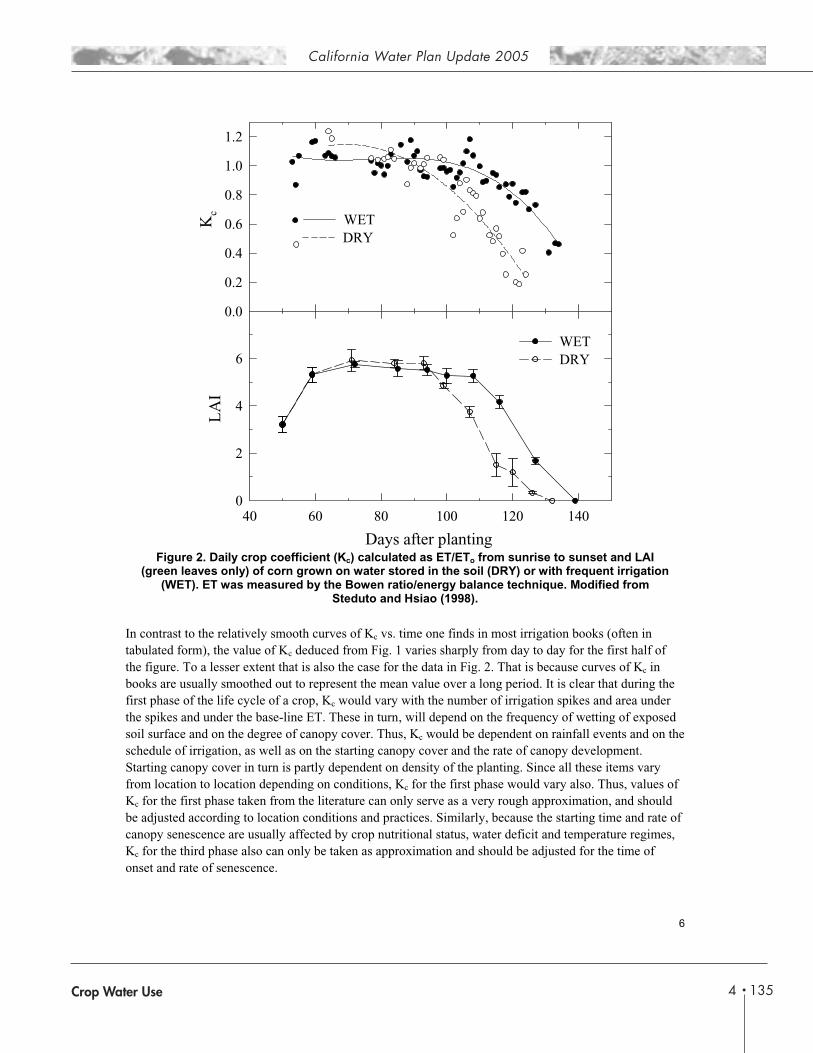
The impact of leaf senescence on canopy ET and Kc is more clearly seen in another study on maize(Steduto and Hsiao, 1998). ET was measured on a dry treatment growing only on water stored in the soil and on a wet treatment (control) that was irrigated regularly. As shown in Fig. 2, due to water deficit the dry treatment senesced earlier; its green leaf area started to declined around 95 DAP, with the LAI falling from a value of 6 to about 1.5 over a period of 20 days. The LAI of the control also fell at about the samerate, but started considerably later, at around 110 DAP. Consequently, Kc declined considerably earlier for the dry treatment than the wet treatment. There is some indication that a part of the difference in Kc is the result of reduced stomatal opening in the dry treatment, but most of the effect is due to leaf senescenceinduced by water deficit (Steduto and Hsiao, 1998).
5
Evapotranspiration and Relative Contribution…
1354Crop Water Use
California Water Plan Update 2005
Evapotranspiration and Relative Contribution by the Soil and the Plant
Kc
0.0
0.2
0.4
0.6
0.8
1.0
1.2
Days after planting
40 60 80 100 120 140
LA
I
0
2
4
6WETDRY
WETDRY
Figure 2. Daily crop coefficient (Kc) calculated as ET/ETo from sunrise to sunset and LAI(green leaves only) of corn grown on water stored in the soil (DRY) or with frequent irrigation
(WET). ET was measured by the Bowen ratio/energy balance technique. Modified from Steduto and Hsiao (1998).
In contrast to the relatively smooth curves of Kc vs. time one finds in most irrigation books (often in tabulated form), the value of Kc deduced from Fig. 1 varies sharply from day to day for the first half of the figure. To a lesser extent that is also the case for the data in Fig. 2. That is because curves of Kc in books are usually smoothed out to represent the mean value over a long period. It is clear that during the first phase of the life cycle of a crop, Kc would vary with the number of irrigation spikes and area under the spikes and under the base-line ET. These in turn, will depend on the frequency of wetting of exposed soil surface and on the degree of canopy cover. Thus, Kc would be dependent on rainfall events and on theschedule of irrigation, as well as on the starting canopy cover and the rate of canopy development.Starting canopy cover in turn is partly dependent on density of the planting. Since all these items varyfrom location to location depending on conditions, Kc for the first phase would vary also. Thus, values of Kc for the first phase taken from the literature can only serve as a very rough approximation, and should be adjusted according to location conditions and practices. Similarly, because the starting time and rate of canopy senescence are usually affected by crop nutritional status, water deficit and temperature regimes,Kc for the third phase also can only be taken as approximation and should be adjusted for the time of onset and rate of senescence.
6

California Water Plan Update 2005
Volume 41364
Evapotranspiration and Relative Contribution by the Soil and the Plant
The preceding discussion also makes clear that not only the total ET, but the proportion of soil E makingup ET depends too on the frequency of wetting of soil surface and the degree of canopy cover, and hence, should vary with local conditions and practices. At the same time, the discussion points to some possible options to reduce the E portion of ET, a topic to be taken up later. First, it is necessary to know how muchof ET is due to soil E and under what conditions.
Measuring or Estimating E and T Separately
A fair number of papers have been published reporting separate estimates of soil E and plant T. Before considering these data and judging their reliability, it is necessary to consider the difficulties involved in making these estimate and review the methods used.
It may appear to be simple to separate out the rate of plant transpiration (T) from soil evaporation (E). In fact it is difficult to do. One important reason is that the plants and the soil share the same energy source and the same or closely overlapping aerial environment; therefore T and E interact. For example, in the case of a partial canopy cover with a substantial portion of the soil surface exposed and wet, soil E would cool the surface soil and the adjacent air, and humidify the adjacent air. Hence, the plants would be cooler and transpiring in a more humid environment, and T would be less compared with the situation when the soil surface is dry. If exposed soil between plants is covered to eliminate E, plant T would increase to some extent because the energy that would have gone to support soil E is now partly available to enhance plant T.
Another cause of the difficulties encountered in separating out T from E is the fact that the water evaporated from the soil or transpired from the plants comes ultimately from the same reservoir in the soil, and the rate of water depletion from this reservoir determines how wet or dry the soil surface would be and its rate of E. If one isolates a portion of the soil in a container to measure E from that portion, therewould be no root removal of water from that portion, nor drainage or capillary rise of water from the soillayer below. This will lead in time to a soil surface different in wetness and vapor concentration than that of the non-isolated soil.
Since soil E and T interact, either of them can be measured simply by eliminating the other. Measuringthe rate of water loss after removing the plants would overestimate E, and measuring after sealing the soil surface to eliminate soil E would overestimate T. In both cases the measured rates would be higher than the rate taking place with the original spatial pattern of plants on the soil, because eliminating one liquid-to-vapor conversion process would make the air drier and more energy available for the other process. It is necessary to measure one in the presence of the other to obtain realistic values. There are only a few ways to do this directly, and more ways to do it indirectly.
For fields with crops growing soil E is normally measured with microlysimeters, made by filling small(e.g., 1-liter) containers with the soil and burying the containers between crop rows. The weight loss of the microlysimeters over time on an area basis provides a measure of soil E for the field. For the measurement to be reliable, the following conditions must hold: (a) The position of the microlysimetersrelative to the plants must be representative of the field. This is normally achieved by placing severallysimeters at equal distance between two plant rows, and replicating the lysimeter arrays at severallocations. (b) The surface of the soil in the microlysimeter must be similar to that outside in smoothness and consolidation. This can be achieved by fitting an virtually intact core of soil in the lysimeter, or by
7
Evapotranspiration and Relative Contribution…

1374Crop Water Use
California Water Plan Update 2005
Evapotranspiration and Relative Contribution by the Soil and the Plant
packing disturbed soil inside the lysimeter and letting the soil consolidate over one or morewetting/drying cycles. (c) The soil surface within the lysimeter must be nearly identical in water status asthat of the soil adjacent to the lysimeters. This is difficult to achieve if the lysimeter, once installed, is used over a long period, because the soil inside is hydraulically isolated from that outside and roots are not inside the lysimeter to remove the soil water as it occurs outside. This problem can be overcome byinstalling sets of lysimeters frequently and measuring the weight loss of each set only over a short interval of a day or two. Alternatively, a large number of lysimeters may be installed, watered in a way to obtain a narrow range of surface wetness similar to that of the soil outside, and then measuring the weight loss only of those with wetness of the soil surface matching that outside. Wetness of the surface can be matched by measuring surface temperature with an infrared thermometer and choosing only lysimeterswith surface temperature nearly identical to that of the soil outside under similar canopy shading.Unfortunately, to our knowledge this promising method, although alluded to in a publication (Walker,1984), has rarely been applied to making measurement of soil E. Another way to ensure the match is to measure vapor pressure of the soil surface inside the lysimeters with the instrument of Seymour and Hsiao (1984).
Soil E has also been estimated from measured changes in water content of shallow layers of surface soil over time. This procedure is fraught with problems because water content may be changed by root water removal and vertical water movement within the soil, in addition to surface evaporation. Ritchie and Burnett (1971) ameliorated a part of this problem by relating lysimeter measured bare soil E rate to surface (3 cm layer) soil water content and using the relationship to deduce soil E from measured surface soil water content. This does not, however, take care of the root water removal problem. Another way to estimate soil E is to apply the Bowen ratio/energy balance (BREB) approach to measure the upward latent heat flux in the air very close to the surface of the soil between widely spaced crop rows (Ashktorab et al., 1994). Though novel, the estimates are likely confounded since gradients of temperature and humidity inthe horizontal direction are probably marked and the normal fetch requirement for using the BREBtechnique is not met.
As for transpiration, T of single plants is now estimated by measuring the rate of upward flow of water in the plant stem. The assumption is that this rate is equal to the rate of T, a good assumption when measuring over a 24-hour period. When the measurement covers shorter periods (e.g., hourly), the results can be quite inaccurate because there is usually a substantial lag in the upward water flow behindtranspiration in the morning, and in the transpiration behind the upward flow in the afternoon. The technique relies on the fact that applied heat would be carried by flowing water. By applying heat to the basal part of the stem, water flow is inferred from heat flow based on temperature measurements. The simpler method is to determine the rate of heat pulse traveling up the stem by applying pulses of heat at the base and determining the time it takes for the change in temperature to reach a measured distance up the stem from the point of heat application. The measurement yields the velocity of water flow. To obtain the flow rate or quantity of water flow per unit of time, the measurements have to be calibrated against measured rate of transpiration. The method is inaccurate because due to differences in xylem geometryand blockage from plants to plants, the calibration obtained from one plant may not be applicable to another. A better way is based on balancing the heat input to the stem against the heat outflow, yieldingdirectly the rate of flow. The base of the stem is wrapped in an electrical strip heater and the heat input measured in watts. Thermal couples are placed to measure the temperature gradients up and down streamfrom the heater, and radially across the insulation wrapped outside of the heater. These data, together with thermal conductivity of plant stem and of the heater insulation, are used to calculate with heat transport
8

California Water Plan Update 2005
Volume 41384
Evapotranspiration and Relative Contribution by the Soil and the Plant
equations the heat lost by thermal conduction. The difference between the heat input and loss by thermalconduction indicates the amount of heat transported away from the heater by water flow in the stem.Water flow is then computed from the heat capacity of water and the temperature data.
For the stem flow to be indicative of T of the field, a relatively large number of representative plants mustbe measured simultaneously. This can be expensive if commercial stem flow gauges are used, especiallyif the measurement is over many days when stems of the plants are enlarging, necessitating changing overfrom gauges of one size to gauges of progressively larger sizes.
Soil E and canopy T can also be estimated indirectly. An early method is to sample plants for dry weight and measure ET periodically as the plants grow, and then plot the dry matter produced versus the cumulative ET. Usually the relationship is linear and the line intercepts the ET-axis at a value considerably higher than zero. This intercept value is taken as the total amount of soil E. The underlyingassumption is that the amount of dry matter produced at different growth stages of the plant is proportional to the cumulative amount of water transpired up to that time, a fairly reasonable assumption(Fischer and Turner, 1978). Plant T is then the difference between soil E and total ET.
The most obvious indirect way to estimate soil E and canopy T separately is by model simulation. The models are some times very simple but inaccurate. For example, by assuming that soil E declines linearlywith time after a soil wetting. More complicated models estimate advective transfer of energy and water vapor between the soil and the canopy environ (e.g., Shuttleworth and Wallace, 1985), but require either simplification of fundamentally complex situations or parameterization for different conditions.
Still another way to estimate canopy T indirectly is to calculate it from measured leaf conductance and leaf area. This involves much uncertainty because the scaling up process, from the leaf level to canopylevel, is still experimental and not yet well worked out.
Magnitude of Soil E Relative to ET as Reported in the Literature
In the published studies, soil E was reported to range from a few percent to as much as over 80 percent of the measured or estimated ET. Because of the difficulties encountered in measuring or estimating E and T separately, there is considerable uncertainty in some of the reported results. Nonetheless, some firm data from several studies, together with the relatively consistent conclusions drawn in many other studies of less definitive nature, permit a fairly quantitative assessment. These studies are examined in some detail here, starting with the cases where soil E constituted the major portion of ET and ending with situations where soil E is minimal.
As expected from the previous discussion on factors affecting soil E and plant T, high ratios of E to ET are observed mostly when canopy cover or LAI (leaf area index, leaf area per unit land area) of crop is low and the soil surface is wet or at least not very dry much of the time. Examples are the results obtained by several groups when soil E was measured with microlysimeters under sparse canopies just a day ortwo after soil surface was wetted. Lascano et al. (1987) found soil E for a cotton field under a LAI of 1.0 to be slightly higher than 5 mm per day on days when ETo should be in the range of 7 mm per day as judged by the level of solar radiation. Villalobos and Fereres (1990) measured soil E to be 60-80 percent of ETo for sunflower, maize and cotton with LAI of 0.6 to 1.2. For longer terms but with parts of soil surface drying intermittently, Sadras et al. (1991) found soil E, measured by microlysimeters installed freshly each week, to be 50 percent of ET for two cultivars of sunflowers over a period of 64 days starting
9
Evapotranspiration and Relative Contribution…
1394Crop Water Use
California Water Plan Update 2005
Evapotranspiration and Relative Contribution by the Soil and the Plant
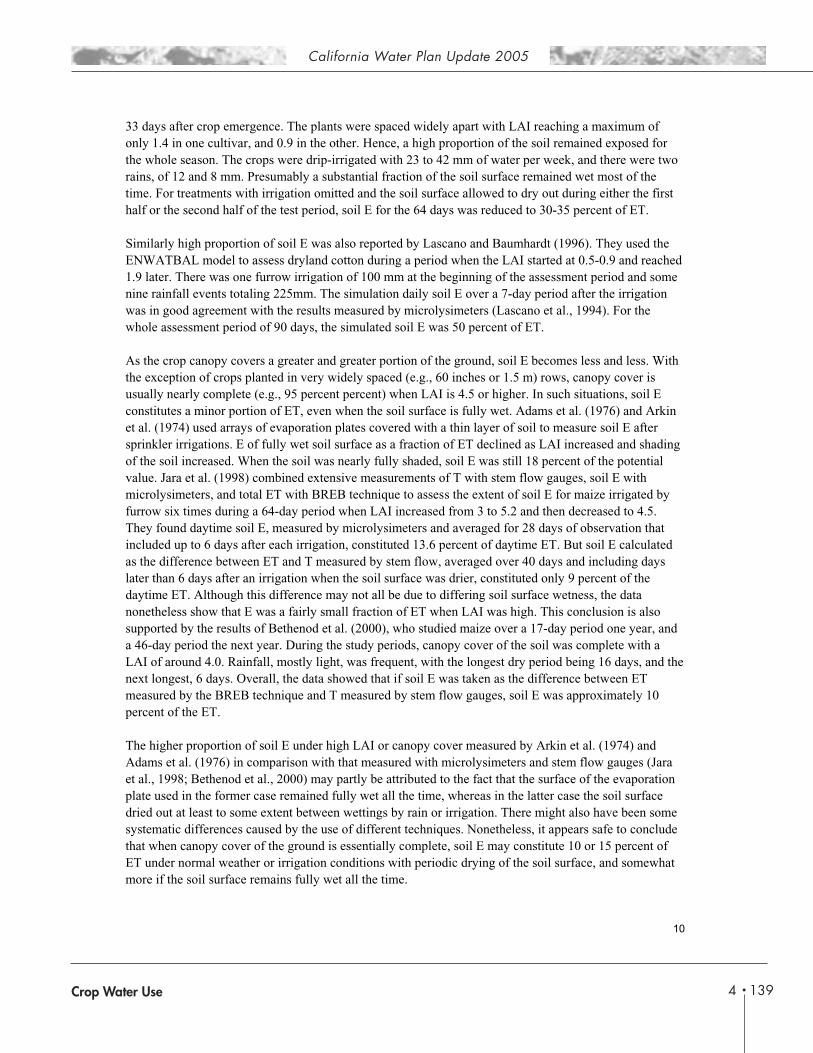
33 days after crop emergence. The plants were spaced widely apart with LAI reaching a maximum of only 1.4 in one cultivar, and 0.9 in the other. Hence, a high proportion of the soil remained exposed for the whole season. The crops were drip-irrigated with 23 to 42 mm of water per week, and there were two rains, of 12 and 8 mm. Presumably a substantial fraction of the soil surface remained wet most of the time. For treatments with irrigation omitted and the soil surface allowed to dry out during either the first half or the second half of the test period, soil E for the 64 days was reduced to 30-35 percent of ET.
Similarly high proportion of soil E was also reported by Lascano and Baumhardt (1996). They used the ENWATBAL model to assess dryland cotton during a period when the LAI started at 0.5-0.9 and reached 1.9 later. There was one furrow irrigation of 100 mm at the beginning of the assessment period and somenine rainfall events totaling 225mm. The simulation daily soil E over a 7-day period after the irrigationwas in good agreement with the results measured by microlysimeters (Lascano et al., 1994). For the whole assessment period of 90 days, the simulated soil E was 50 percent of ET.
As the crop canopy covers a greater and greater portion of the ground, soil E becomes less and less. With the exception of crops planted in very widely spaced (e.g., 60 inches or 1.5 m) rows, canopy cover is usually nearly complete (e.g., 95 percent percent) when LAI is 4.5 or higher. In such situations, soil E constitutes a minor portion of ET, even when the soil surface is fully wet. Adams et al. (1976) and Arkin et al. (1974) used arrays of evaporation plates covered with a thin layer of soil to measure soil E after sprinkler irrigations. E of fully wet soil surface as a fraction of ET declined as LAI increased and shading of the soil increased. When the soil was nearly fully shaded, soil E was still 18 percent of the potential value. Jara et al. (1998) combined extensive measurements of T with stem flow gauges, soil E with microlysimeters, and total ET with BREB technique to assess the extent of soil E for maize irrigated byfurrow six times during a 64-day period when LAI increased from 3 to 5.2 and then decreased to 4.5. They found daytime soil E, measured by microlysimeters and averaged for 28 days of observation that included up to 6 days after each irrigation, constituted 13.6 percent of daytime ET. But soil E calculatedas the difference between ET and T measured by stem flow, averaged over 40 days and including dayslater than 6 days after an irrigation when the soil surface was drier, constituted only 9 percent of the daytime ET. Although this difference may not all be due to differing soil surface wetness, the data nonetheless show that E was a fairly small fraction of ET when LAI was high. This conclusion is also supported by the results of Bethenod et al. (2000), who studied maize over a 17-day period one year, and a 46-day period the next year. During the study periods, canopy cover of the soil was complete with a LAI of around 4.0. Rainfall, mostly light, was frequent, with the longest dry period being 16 days, and thenext longest, 6 days. Overall, the data showed that if soil E was taken as the difference between ET measured by the BREB technique and T measured by stem flow gauges, soil E was approximately 10 percent of the ET.
The higher proportion of soil E under high LAI or canopy cover measured by Arkin et al. (1974) and Adams et al. (1976) in comparison with that measured with microlysimeters and stem flow gauges (Jara et al., 1998; Bethenod et al., 2000) may partly be attributed to the fact that the surface of the evaporation plate used in the former case remained fully wet all the time, whereas in the latter case the soil surfacedried out at least to some extent between wettings by rain or irrigation. There might also have been some systematic differences caused by the use of different techniques. Nonetheless, it appears safe to conclude that when canopy cover of the ground is essentially complete, soil E may constitute 10 or 15 percent of ET under normal weather or irrigation conditions with periodic drying of the soil surface, and somewhatmore if the soil surface remains fully wet all the time.
10

California Water Plan Update 2005
Volume 41404
Evapotranspiration and Relative Contribution by the Soil and the Plant
Over the full range of canopy cover or LAI, it is desirable to have a function (curve) relating soil E to theLAI or percent of canopy cover. In the literature a number of empirical curves have been constructed from experimental data. Four of them are presented here in Fig. 3. It is seen that generally the curves deviate from each other. The only consistency is that they all show soil E relative to ET or ETo to decline exponentially with increase in canopy cover or LAI. In considering these curves, it is important to note a number of uncertainties. For one, the soil surface condition may not be as well defined as desired. For example, in the case of Curve (d) obtained by Ritchie and Burnett (1971), soil surface is assumed to be fully wet but in fact could be partially dry because stage 2 evaporation was taken to start after 10 mm of water has evaporated since wetting of the soil whereas their Figure 3 showed stage 2 already started after only 5 mm of water has evaporated. The second uncertainty is that in the case of the relationship with LAI, it will depend on the geometry of plant distribution. The more uniformly the plants are distributed on the land, the more effectively they would shade the soil and reduce soil E. As already mentioned, wide spacing between rows with plants densely spaced along the row will require a higher LAI to shade the same proportion of soil as compared to more narrow distance between rows with plants less denselyspaced along the row. Another caveat is that the values are estimates in the case of Curve (d). It wasassumed that soil E was equivalent in energy terms to the net radiation measured below canopy when soil surface is wet (Ritchie and Burnett, 1971).
Experimental Studies As a part of the effort to assess the extent of E relative to ET, to quantify better crop ET and consumptivewater use, and to better define the conditions that affect ET, several field studies were carried out in 1999and 2000 supported by funds from DWR. These studies and the results are described by topics below.
ET of Crops at Two Plant Densities-Indirect Assessment of Soil E
Growing plants at a higher density results in a faster foliage canopy development and more coverage of the soil in the early part of the season. As already discussed, this would reduce the proportion of ET lost by soil evaporation and increase the proportion lost by plant transpiration. Detailed data on ET as affectedby plant density are rare. This part of the project is to develop more such data and to assess how much of the soil E may be saved by planting at higher densities.
MethodsThe two large (6.1 m diameter) lysimeters at the experimental field of the University of California, Davis were planted on June 4, 1999 with cotton, at a density of 25 plants per m2 for the weighing lysimeter(WL), and 8 plants per m2 for the floating lysimeter (FL). The two lysimeters have essentially the samesensitivity and resolution for measuring ET.
A large area surrounding the lysimeters was also planted with cotton of similar density at the same time,to provide adequate fetch or upwind guard area. The lysimeters were routinely irrigated by filling the furrows between beds with water at the time when the surrounding field was furrow-irrigated. However, early in the season the work on the extent ET is suppressed during sprinkler irrigation (see a later section)was also conducted on the lysimeters, entailing the application of water by sprinklers on a number of days. Canopy coverage of the soil was measured periodically by the light interception method with a 1-mlong light sensor. ET was monitored over the season by measuring changes in the lysimeter outputvoltage, calibrated as changes in weight and converted to changes in water content per unit land area. A data logger scanned the output every 1 second, and calculated and stored the mean for each 5 min
11
Evapotranspiration and Relative Contribution…
1414Crop Water Use
California Water Plan Update 2005
Evapotranspiration and Relative Contribution by the Soil and the Plant
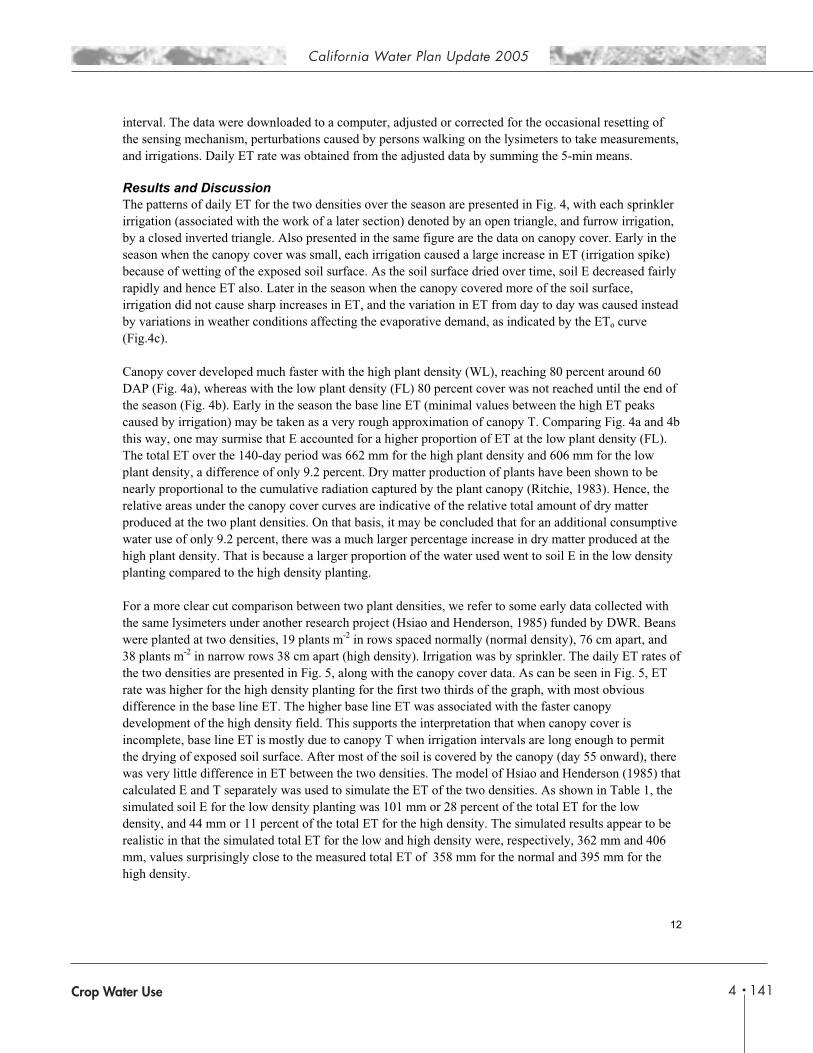
interval. The data were downloaded to a computer, adjusted or corrected for the occasional resetting of the sensing mechanism, perturbations caused by persons walking on the lysimeters to take measurements,and irrigations. Daily ET rate was obtained from the adjusted data by summing the 5-min means.
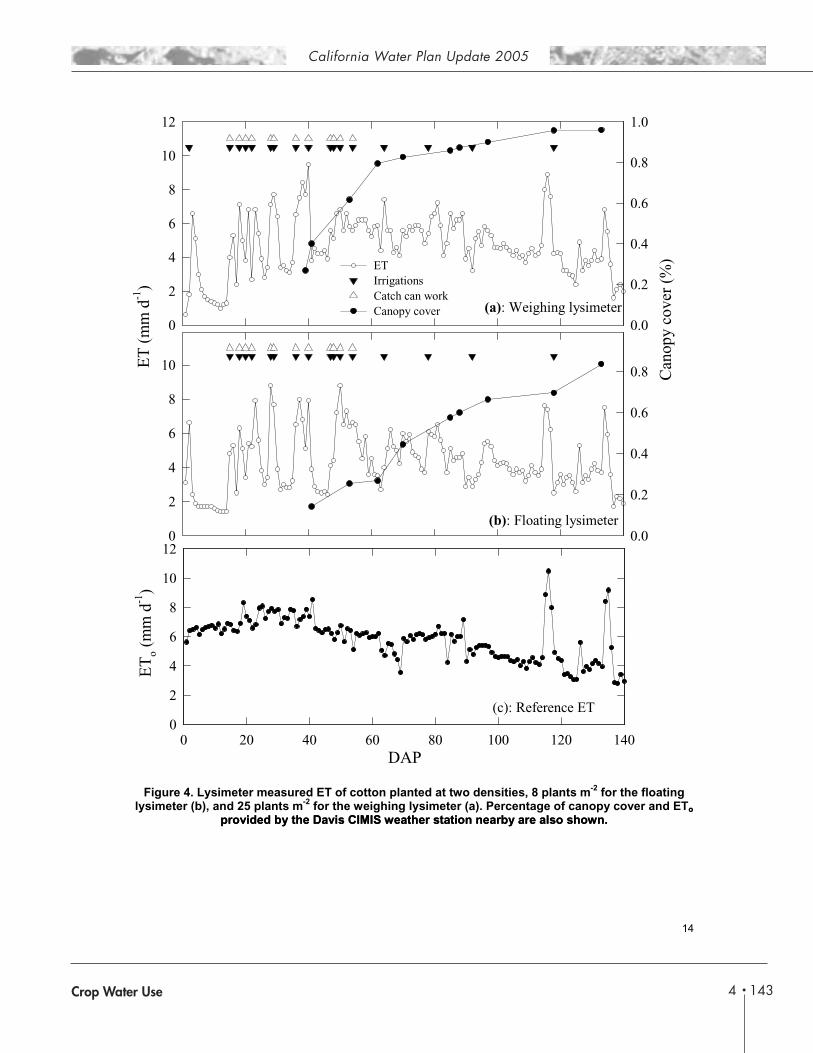
Results and Discussion The patterns of daily ET for the two densities over the season are presented in Fig. 4, with each sprinkler irrigation (associated with the work of a later section) denoted by an open triangle, and furrow irrigation, by a closed inverted triangle. Also presented in the same figure are the data on canopy cover. Early in the season when the canopy cover was small, each irrigation caused a large increase in ET (irrigation spike) because of wetting of the exposed soil surface. As the soil surface dried over time, soil E decreased fairlyrapidly and hence ET also. Later in the season when the canopy covered more of the soil surface, irrigation did not cause sharp increases in ET, and the variation in ET from day to day was caused instead by variations in weather conditions affecting the evaporative demand, as indicated by the ETo curve (Fig.4c).
Canopy cover developed much faster with the high plant density (WL), reaching 80 percent around 60 DAP (Fig. 4a), whereas with the low plant density (FL) 80 percent cover was not reached until the end of the season (Fig. 4b). Early in the season the base line ET (minimal values between the high ET peaks caused by irrigation) may be taken as a very rough approximation of canopy T. Comparing Fig. 4a and 4bthis way, one may surmise that E accounted for a higher proportion of ET at the low plant density (FL). The total ET over the 140-day period was 662 mm for the high plant density and 606 mm for the low plant density, a difference of only 9.2 percent. Dry matter production of plants have been shown to be nearly proportional to the cumulative radiation captured by the plant canopy (Ritchie, 1983). Hence, the relative areas under the canopy cover curves are indicative of the relative total amount of dry matterproduced at the two plant densities. On that basis, it may be concluded that for an additional consumptivewater use of only 9.2 percent, there was a much larger percentage increase in dry matter produced at the high plant density. That is because a larger proportion of the water used went to soil E in the low densityplanting compared to the high density planting.
For a more clear cut comparison between two plant densities, we refer to some early data collected with the same lysimeters under another research project (Hsiao and Henderson, 1985) funded by DWR. Beans were planted at two densities, 19 plants m-2 in rows spaced normally (normal density), 76 cm apart, and 38 plants m-2 in narrow rows 38 cm apart (high density). Irrigation was by sprinkler. The daily ET rates of the two densities are presented in Fig. 5, along with the canopy cover data. As can be seen in Fig. 5, ETrate was higher for the high density planting for the first two thirds of the graph, with most obvious difference in the base line ET. The higher base line ET was associated with the faster canopydevelopment of the high density field. This supports the interpretation that when canopy cover is incomplete, base line ET is mostly due to canopy T when irrigation intervals are long enough to permitthe drying of exposed soil surface. After most of the soil is covered by the canopy (day 55 onward), there was very little difference in ET between the two densities. The model of Hsiao and Henderson (1985) thatcalculated E and T separately was used to simulate the ET of the two densities. As shown in Table 1, the simulated soil E for the low density planting was 101 mm or 28 percent of the total ET for the low density, and 44 mm or 11 percent of the total ET for the high density. The simulated results appear to be realistic in that the simulated total ET for the low and high density were, respectively, 362 mm and 406mm, values surprisingly close to the measured total ET of 358 mm for the normal and 395 mm for the high density.
12

California Water Plan Update 2005
Volume 41424
Evapotranspiration and Relative Contribution by the Soil and the Plant
GC (%)0 20 40 60 80 100
E/E
T o
r E
/ET
o (%
)
0
20
40
60
80
100
E/ETo = e(-0.017 GC)
E/ET = 416.4 e(-0.055 GC)
LAI
0 1 2 3 4 5 6
E/E
To
(%)
0
20
40
60
80
100
E/ETo=e(-0.41 LAI)
E/ETo=1.21-0.7 LAI0.5
(a)
(b)
(c)(d)
Figure 3. Empirical relationship between ratio of soil E to ET or ETo and crop canopy cover or LAI. Equations described by the curves are given in the figure. Curve (a) represents the equation of
Adams et al. (1975) fitting their experimental data on sorghum, and the equation of Villalobos and Fereres fitting their data on corn, cotton and sunflower; Curve (b) represents an equation fitting
the data of Ashktorab et al. (1994) on tomato; Curve (c) represents the equation of Villalobos and Fereres (1991) fitting their data on corn, cotton and sunflower; and Curve (d) represents an
equation derived from the equation of Ritchie and Burnett (1971) for T/ETo vs. LAI fitting their dataon cotton and sorghum.
13
Evapotranspiration and Relative Contribution…
1434Crop Water Use
California Water Plan Update 2005
Evapotranspiration and Relative Contribution by the Soil and the Plant
ET
(m
m d
-1)
0
2
4
6
8
10
12
Can
opy
cove
r (%
)
0.0
0.2
0.4
0.6
0.8
1.0
ETIrrigationsCatch can workCanopy cover
0
2
4
6
8
10
0.0
0.2
0.4
0.6
0.8
(a): Weighing lysimeter
(b): Floating lysimeter
DAP0 20 40 60 80 100 120 140
ET
o (m
m d
-1)
0
2
4
6
8
10
12
(c): Reference ET
Figure 4. Lysimeter measured ET of cotton planted at two densities, 8 plants m-2 for the floating lysimeter (b), and 25 plants m-2 for the weighing lysimeter (a). Percentage of canopy cover and ETo
provided by the Davis CIMIS weather station nearby are also shown.o
provided by the Davis CIMIS weather station nearby are also shown.
14

California Water Plan Update 2005
Volume 41444
Evapotranspiration and Relative Contribution by the Soil and the Plant
A reasonable conclusion would be that the percentage of ET going to soil E can be reduced substantiallyby narrower row spacing and higher planting density. On the other hand, this would result in a higher total ET because of the increase in canopy T. Higher canopy T, however, is associated with higher productivity, as already discussed.
Comparison of ET Between Drip and Furrow Irrigated Fields
Drip irrigation is often said to save water because only a portion of the soil surface is wetted at eachirrigation. While this is likely true for young orchards with trees spaced far apart and most of the soil notshaded, the validity as a general case may be questioned. This study was conducted to obtain more data bearing on this question.
MethodsCotton was planted on June 13, 2000 in the two Davis lysimeters and surrounding field at the samedensity. One lysimeter (FL) and adjacent area was irrigated by a surface drip system, and the other and adjacent area, by furrow irrigation. Weight loss by the lysimeters were monitored to calculate ET rate; and canopy cover on each lysimeter was measured periodically. During the early phase of growth, plants on the FL were less green and grew slower than plants on the WL and surrounding area. Tests indicated that the soil of the FL was slightly more saline and basic than the soil of the WL. Extra water was applied at irrigation time the FL to leach the soil and reduce the salinity. The FL plants soon recovered and started to grow normally. To account for the difference in canopy cover, an adjustment in the ET data was made.The excessive canopy cover of the WL (in percentage), calculated by subtracting the canopy cover on the FL from that on the WL, was divided by 100 and multiplied by an assumed crop coefficient of 1.1, and the result was added to the measured ET of the FL.
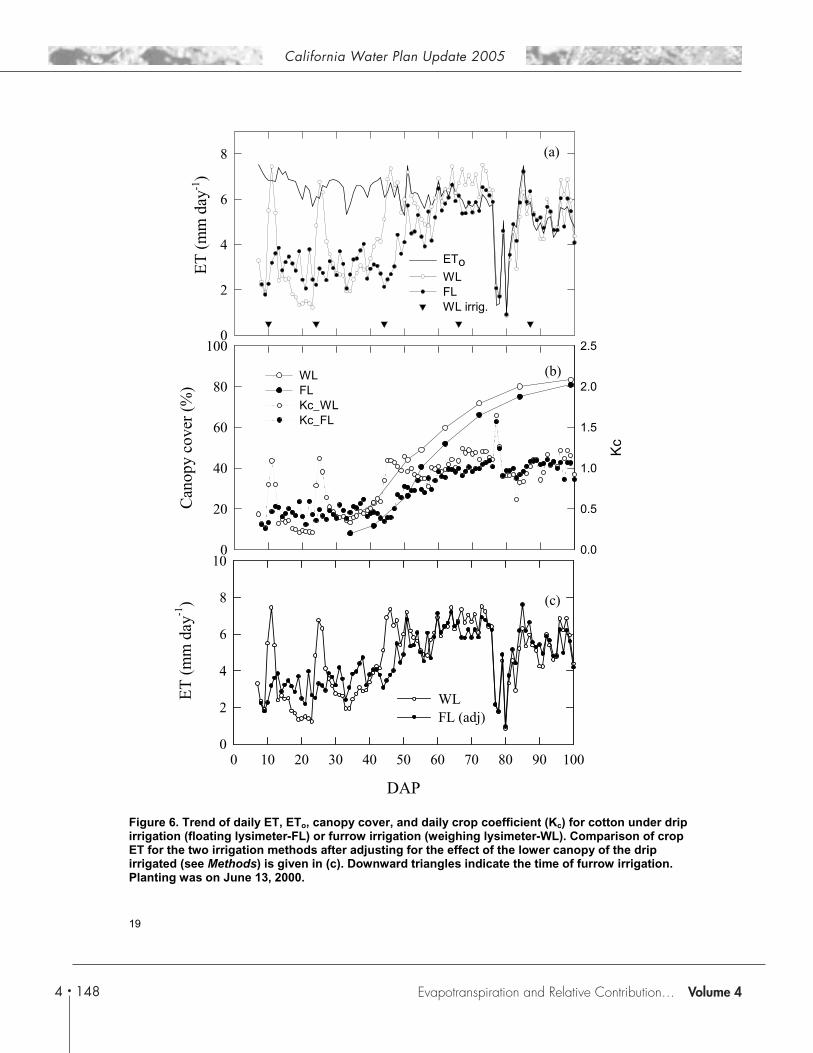
Results and Discussion The rate of daily ET under drip and furrow irrigation as measured by the lysimeters are given in Fig. 6,along with the data on canopy cover. Because of the salinity problem with the FL, there was a substantial difference in canopy cover between the two irrigation methods in the first part of the season and it was desirable to adjust the ET data for the difference in canopy sizes as described under methods. The adjusted ET data are presented in Fig. 6c. It is seen in Fig. 6a and 6c that the most obvious difference in ET between the drip and furrow irrigated lysimeter in the first 50 days is the lack of irrigation spikes in the former and the prominence of irrigation spikes in the latter. In addition, not as obvious but still clear is the higher ET of the drip irrigated lysimeter starting several days after one furrow irrigation and lasting until the next furrow irrigation. These differences are the result of fundamental differences in the two water application methods. With furrow irrigation, the spikes and the rapid decline are caused by the sudden wetting of the whole soil surface, followed by surface drying and stage 2 exponentially declining evaporation rate from exposed soil surface. With drip irrigation, only a portion of the exposed soil surface is wetted at each irrigation but this portion stays fully or fairly wet most of the time due to the short timeintervals between irrigations. Hence, during the time when the furrow irrigated soil surface had dried out enough to limit soil E markedly, the ET of furrow irrigated lysimeter is less than the ET of the drip irrigated one because the latter has a part of its soil surface still wet.
15
Evapotranspiration and Relative Contribution…

1454Crop Water Use
California Water Plan Update 2005Evapotranspiration and Relative Contribution by the Soil and the Plant
Figure 5. Evapotranspiration and canopy cover of bean planted at two densities, 19 plants m-2
(normal, with 76 cm row spacing) and 38 plant m-2.(high, with 38 cam row spacing). Invertedsolid triangles indicate sprinkler irrigations. Measured canopy cover is given as circles; lines
are fitted using the canopy growth model of Hsiao and Henderson (1985). Same experiment as that shown in Fig. 1.
-2
(normal, with 76 cm row spacing) and 38 plant m-2.(high, with 38 cam row spacing). Invertedsolid triangles indicate sprinkler irrigations. Measured canopy cover is given as circles; lines
are fitted using the canopy growth model of Hsiao and Henderson (1985). Same experiment as that shown in Fig. 1.
0
2
4
6
8
10
IrrigationsNormal densityHigh density
ET
(m
m d
ay-1
)
Days after planting
0 20 40 60 80
Can
opy
cove
r (%
)
0
20
40
60
80
Normal density
High density
16

California Water Plan Update 2005
Volume 41464
Evapotranspiration and Relative Contribution by the Soil and the Plant
Table 1. Cumulative soil E and canopy T and ET as predicted by the model of Hsiao andHenderson (1985) in comparison with cumulative ET as measured by lysimeters, for fields of beans planted at two different densities. Data are for a period of 79 days starting 1 day after
planting.
Plant Density19 plants m-2 38 plants m-2
(mm) (% of ET) (mm) (% of ET)
ModelSoil E 101 28 44 11Crop T 261 72 362 89ET 362 100 406 100
MeasurementET 358 ---- 395 ----
Over the period of 90 some days, the measured total ET was 436 mm for the furrow irrigated (WL), and 387 mm for the drip irrigated (FL). After adjusting for the difference in canopy cover (see Methods), the total ET for the drip irrigated was 426 mm. Assuming the adjustment is reasonable, the similarity in totalET between the furrow and drip irrigated cotton indicates that drip irrigation does not necessarily save water in some situations. This conclusion is consistent with those drawn in several other careful studies (e.g., Tarantino et al., 1982). In the current study, the frequent wetting of a part of the soil by dripirrigation kept the ET high during the periods when ET of furrow irrigated treatment was low due to soil surface drying over the long intervals between irrigations.
Extent crop ET is Suppressed During Sprinkler Irigation.
Sprinkler irrigation is sometimes said to be wasteful because after being emitted by the sprinklers, the water drops evaporate partly in the air before reaching the soil and the crop. In terms of the energybalance principle, however, in-air evaporation from the water drops should reduce the energy supply to the field and cool and humidify the air, leading to reduced rate of ET from the soil and the crop. This study was conducted to quantify the extent surface ET is suppressed during sprinkler irrigation.
MethodsThe two lysimeters were planted with cotton in 1999 and 2000. To determine the extent ET is suppressed, the normal rate of ET (control) without sprinkling must be known, and one lysimeter (FL) was used for this purpose. The other lysimeter (WL) was used to determine the ET rate under sprinkler application. To measure ET from the soil/crop surface during sprinkler application, the amount of water applied and reaching the surface must be accurately measured and deducted from the change in weight of the lysimeter. Sixty small platforms each with three supporting legs were distributed on the lysimeter. A catch can was placed on each platform and carefully leveled with a spirit level. A layer of oil about 1 cmthick was added to the can to prevent evaporation of water caught in the can. The can with its content was weighed before and after the sprinkler application, to 0.1 g accuracy, to determined the depth of water applied. Tests conducted with cans containing water dyed brightly red and placed on white paper sheets showed that there was no detectable splatter from the can during sprinkling. After adding water to cans containing oil, weight of the cans did not change significantly after sitting in the field for a number of hours, indicating no evaporative loss. For each test run, the FL was irrigated by sprinkler to ensure that its top soil layer is fully wet. The irrigation was stopped just before applying water to the WL (equipped with
17
Evapotranspiration and Relative Contribution…
1474Crop Water Use
California Water Plan Update 2005
Evapotranspiration and Relative Contribution by the Soil and the Plant
catch cans) by sprinklers. The reported rate of ET measured by the WL has been corrected for the surface area occupied by the non-evaporating catch cans.
Results and Discussion Figaure 7 shows an example of the change in weight of the two lysimeters with time during the test. The continuous gain in weight for FL between 11:20 and 14:00 was the result of water application bysprinklers. After the application was stopped, the continuous loss in weight of FL with time was due to ET. At about 14:05 the sprinklers were turned on to apply water to the WL, which gained weight continuously until the application stopped at 16:30. The water applied as measured by the catch cans minus the water gained by the lysimeter between 14:05 and 16:30 was taken as the cumulative ET fromthe WL during the sprinkler application.
18
California Water Plan Update 2005
Volume 41484
Evapotranspiration and Relative Contribution by the Soil and the Plant
ET
(m
m d
ay-1
)
0
2
4
6
8
EToWLFLWL irrig.
Can
opy
cove
r (%
)
0
20
40
60
80
100
Kc
0.0
0.5
1.0
1.5
2.0
2.5
WLFLKc_WLKc_FL
DAP
0 10 20 30 40 50 60 70 80 90 100
ET
(m
m d
ay-1
)
0
2
4
6
8
10
WLFL (adj)
(a)
(b)
(c)
Figure 6. Trend of daily ET, ETo, canopy cover, and daily crop coefficient (Kc) for cotton under drip irrigation (floating lysimeter-FL) or furrow irrigation (weighing lysimeter-WL). Comparison of cropET for the two irrigation methods after adjusting for the effect of the lower canopy of the drip irrigated (see Methods) is given in (c). Downward triangles indicate the time of furrow irrigation.Planting was on June 13, 2000.
19
Evapotranspiration and Relative Contribution…

1494Crop Water Use
California Water Plan Update 2005
Evapotranspiration and Relative Contribution by the Soil and the Plant
20
determination of surface ET while under sprinkler irrigation. Weight was measured from an arbitrary reference point and was not the total weight of the lysimeter. The rapid changes in
weight between 13:00 and 14:00 were due to weight of the researchers setting up the catch cans,and around 16:45, weight of the researcher taking away the cans for weighing.
Of the total eight tests conducted in 1999, three of them gave unacceptable values of ET under sprinkler irrigation, either much higher than the control ET and ETo, or negative values. The results of the remaining five tests and the four tests conducted in 2000 the mean values are presented in Table 2. As can be seen, the variation from test to test was large and less definitive than we had hoped for. It can be seen from the slopes of the lines in Fig. 7 and in Table 2 that ET during sprinkler application is very smallrelative to the application rate, and hence, relatively small errors in the amount of applied water measuredby catch cans can lead to a large error in the calculated ET under sprinkling.
The reduction in ET under sprinkling as a percentage of the control ET was calculated for each test and given in Table 2. For the 1999 tests, the mean percentage reduction was 48 percent, and for 2000, the mean was 46 percent. The overall mean reduction was 47 percent for the nine tests in two years. A
Figure 7. Example of weight change of the weighing and floating lysimeters during the
Pacific standard time (h)
10 11 12 13 14 15 16 17 18
Wt.
(kg)
0
200
400
600
WLFL
800

California Water Plan Update 2005
Volume 41504
Evapotranspiration and Relative Contribution by the Soil and the Plant
reasonable conclusion would be that during water application by impulse sprinklers, surface ET is substantially suppressed, although in-air evaporation of the spraying water drops probably makes up for the difference and more.
Table 2. ET rate of a cotton field under sprinkler irrigation relative to ET rate not under irrigation (control ET). Reduction of ET rate under sprinkling is given as a percentage of the control ET rate. Control lysimeter was irrigated by sprinklers first, then the sprinklers were turned off at the startof the ET measurement. ET rate was calculated as the difference between the water application
rate measured by catch cans and the water gain rate measured by lysimeter.
Date
Time (Pacific standard) ETo
(mmh-1)
Lysim.watergainrate(mmh-1)
Waterappl.rate(mm h-
1)
ControlET(mm h-
1)
ET under sprinkler(mm h-1)
ET reduction undersprinkler (%)
Year 1999
6/18 14:00-16:30 0.65 4.79 4.96 0.80 0.17 79
6/21 11:00-14:00 0.72 4.74 5.40 0.85 0.65 24
7/1 12:00-14:30 0.82 4.92 5.48 0.93 0.56 40
7/2 11:00-13:00 0.80 5.01 5.60 0.89 0.59 34
7/20 12:40-15:10 0.70 5.72 6.00 0.76 0.28 63Year 2000
10/3 11:00-14:00 0.510 6.46 6.86 0.55 0.41 26
10/6 10:50-13:50 0.58 6.06 6.42 0.66 0.37 44
10/13 10:30-13:30 0.38 7.05 7.10 0.37 0.051 86
10/19 12:00-15:00 0.38 6.54 6.84 0.42 0.31 262year
n47
mea
Extent Transpiration May Increase When Soil Evaporation is Minimized
One idea for saving water is to minimize or eliminate soil E while not restricting crop T. During tpart of the life cycle of crops, only a part of the soil is covered by the foliage canopy and soil E is high ifthe soil surface is wet. If soil E is reduced, less energy is consumed by soil evaporation and air above andnear the soil would be less humid and hotter. This in turn causes the canopy to be hotter and surroundiair to be less humid. T would increase as the result of a large humidity gradient (�W) from the leaf to the air. Very little work has been done to quantify this effect by experimental mea
he early
ng
surements. This study was elop some of the needed information. The objective is to measure the increase in canopy conducted to dev
temperature and the reduction in air humidity and use the data to calculate how much T would be raised by the reduction in soil E.
21
Evapotranspiration and Relative Contribution…
1514Crop Water Use
California Water Plan Update 2005
Evapotranspiration and Relative Contribution by the Soil and the Plant
MethodsIn a large field of cotton two adjacent plots, 15x15 m each, were demarcated. The plots were irrigatedonce or twice to establish the plant stand. On day 35 after planting in 1999, and day 44 after planting in
000, irrigation began to be applied to the WET treatment every 14 to 20 days, while DRY treatment ceived none. Temperature of 18 mature leaves on top of the canopy in each plot was measured
c
mVssumption has been shown to be
pe of 1 e can lotwere measured cision hrometer (He l., 1 ), osi he cen ach plot toavoid edge effects. Voltage outp om rm ychrometers were scanned every 1second and averaged every 5 mi a data logger, and the m values stored.
The driving force for transpiration, the difference in vapor pressure between inside of the leaf and the bulk air surro g the canopy �W), was calculated from the calculated vapor pressure inside the leaf and th ure sur e bu r. T ss th act of reduced soil E on canopy T, we assumed that the stomatal conductance are basically WET and DRY plot and the only effects on can T are those due to cha erature and humiditywhich alter �W te o spir is p rtion W for a given conductance, the increase in canopy T of t DRY t due e d il sur hould he increase in �W. That is, the percentage increas age increase in �W. Using thisapproach, the in as c ted dded to the esti T of the WET plot to obtainT of the DRY plot. Canopy T of the WET plot was estimated using our ET model (Hsiao and Henderson, 1985).
Vapor pressure at and temperature of the soil surfa rand catio the plots were measuredperiod it stru (Se r a iao, . Air ity at abo m height was also m d at the sa me the s
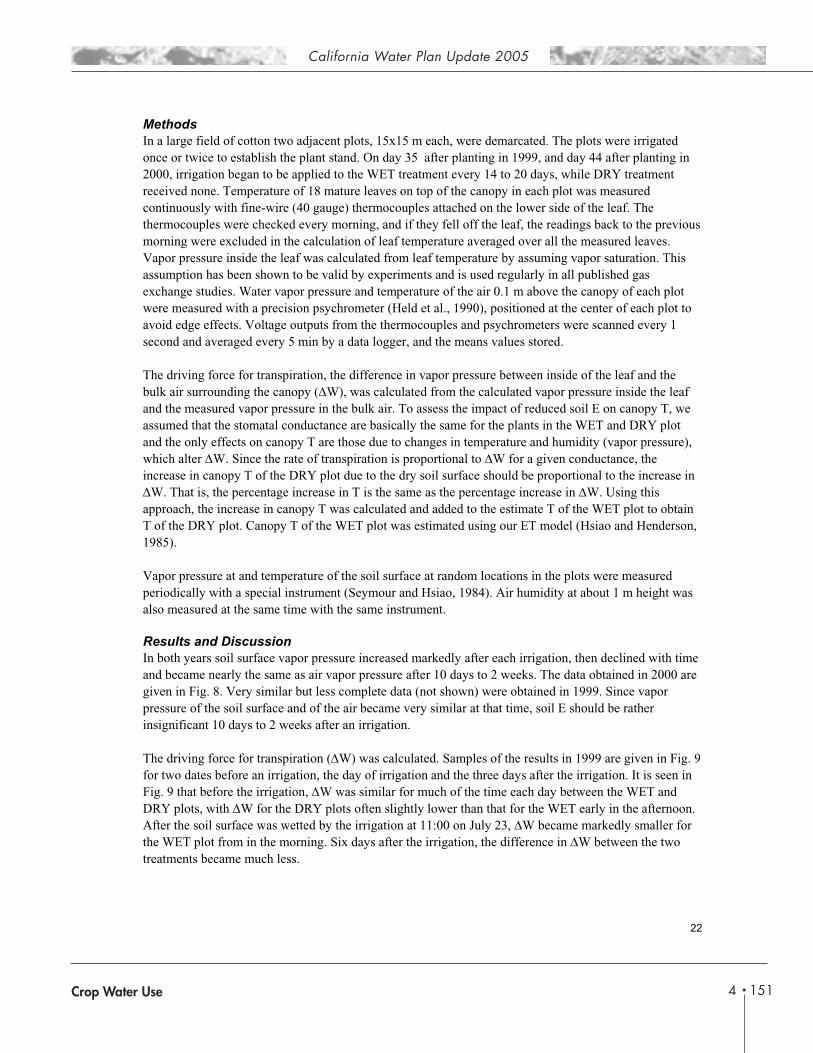
Results and Discussion In both soil surface vapor essure creased rkedly fter each rigation, then lined with timend bec early the same as air vapor pressure after 10 days to 2 weeks. The data obtained in 2000 are
8. Very similar but less complete data (not shown) were obtained in 1999. Since vapor ld be rather
ss.
2reontinuously with fine-wire (40 gauge) thermocouples attached on the lower side of the leaf. The
thermocouples were checked every morning, and if they fell off the leaf, the readings back to the previous orning were excluded in the calculation of leaf temperature averaged over all the measured leaves.apor pressure inside the leaf was calculated from leaf temperature by assuming vapor saturation. This
valid by experiments and is used regularly in all published gas aexchange studies. Water vapor pressure and tem rature the air 0.
990m above thtioned at t
opy of each pter of ewith a pre psyc ld et a
ocouples and psp
eansuts frn by
the the
undin (e meas d vapor pres e in th lk ai o asse e imp
the same for the plants in thenges in temopy p (vapor pressure),
. Since the ra f tran ation ropo al to �he plo
e in T to th ry so
e as the percentface s be proportional to t
is the samcrease in canopy T w alcula and a mate
ce at om lo ns inically w
sureh a special in
me timentith
ymoume instru
nd Hsment.
1984) humid ut 1ea w a
yearsame n
pr in ma a ir decagiven in Fig. pressure of the soil surface and of the air became very similar at that time, soil E shouinsignificant 10 days to 2 weeks after an irrigation.
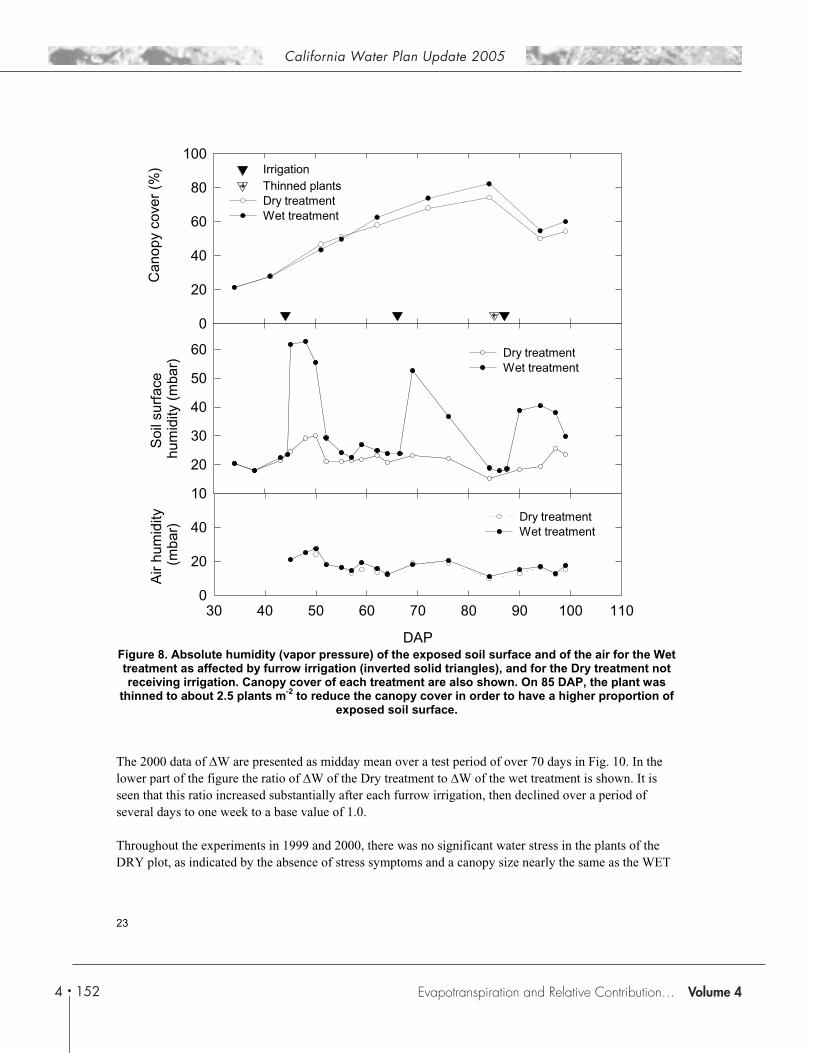
The driving force for transpiration (�W) was calculated. Samples of the results in 1999 are given in Fig. 9for two dates before an irrigation, the day of irrigation and the three days after the irrigation. It is seen in Fig. 9 that before the irrigation, �W was similar for much of the time each day between the WET and DRY plots, with �W for the DRY plots often slightly lower than that for the WET early in the afternoon. After the soil surface was wetted by the irrigation at 11:00 on July 23, �W became markedly smaller for the WET plot from in the morning. Six days after the irrigation, the difference in �W between the two treatments became much le
22
California Water Plan Update 2005
Volume 41524
Evapotranspiration and Relative Contribution by the Soil and the Plant
Can
opy
cove
r (%
)
0
20
40
60
80
100IrrigationThinned plantsDry treatmentWet treatment
Soi
l sur
face
hum
idity
(m
bar)
10
20
30
40
50
Dry treatment60Wet treatment
Figure 8. Absolute humidity (vapor pressure) of the exposed soil surface and of the air for the Wettreatment as affected by furrow irrigation (inverted solid triangles), and for the Dry treatment not receiving irrigation. Canopy cover of each treatment are also shown. On 85 DAP, the plant w
thinned to about 2.5 plants masn of
bsence of stress symptoms and a canopy size nearly the same as the WET
-2 to reduce the canopy cover in order to have a higher proportioexposed soil surface.
DAP
30 40 50 60 70 80 90 100 110
Air
h (
The 2000 data of �W are presented as midday mean over a test period of over 70 days in Fig. 10. In thelower part of the figure the ratio of �W of the Dry treatment to �W of the wet treatment is shown. It is seen that this ratio increased substantially after each furrow irrigation, then declined over a period of several days to one week to a base value of 1.0. �
Throughout the experiments in 1999 and 2000, there was no significant water stress in the plants of theRY plot, as indicated by the aD
u mm
idity )
bar
0
20
40Dry treatmentWet treatment
23
Evapotranspiration and Relative Contribution…

1534Crop Water Use
California Water Plan Update 2005
Evapotranspiration and Relative Contribution by the Soil and the Plant
plot. That is due to the high water holding capacity of the deep Yolo loam soil at the experiment site, and fast development of the root system of many crops including cotton on this soil.
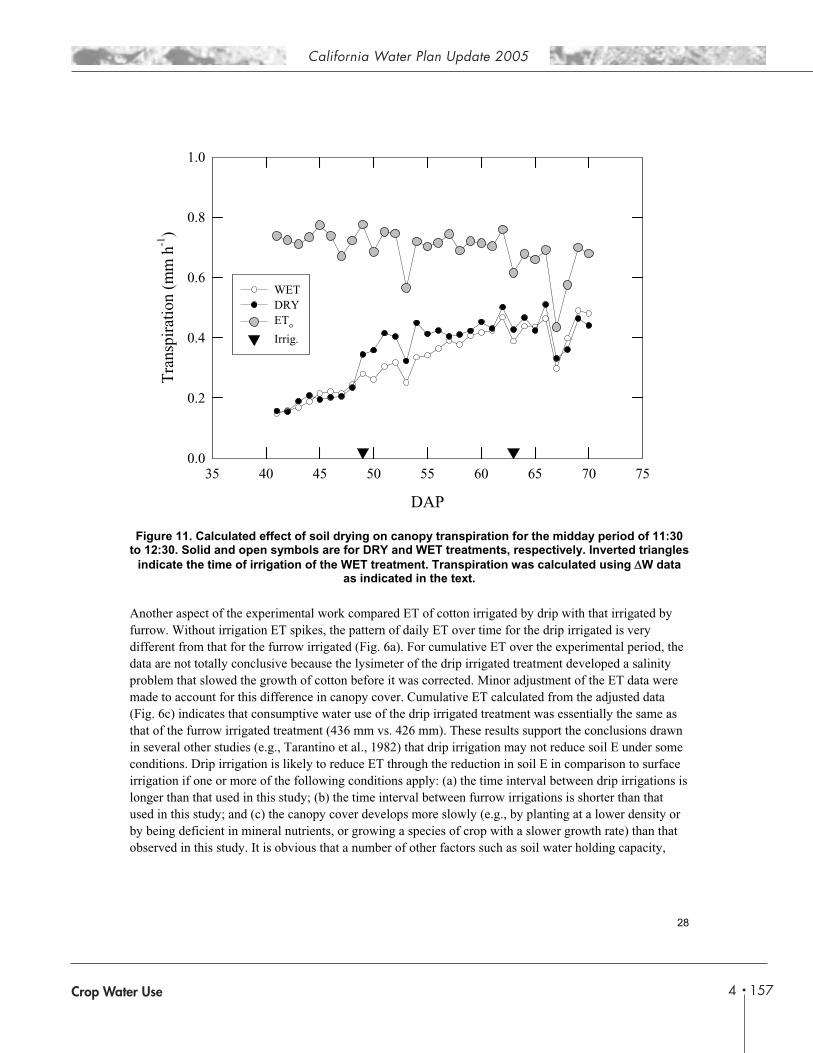
Using the estimated �W, the increase in canopy transpiration (T) caused by dry soil surface wascalculated for the midday period over two irrigation cycles in 1999, and the results are presented in Fig. 11. Both treatments were irrigated the same way on 35 DAP and canopy T was similar for the WET and the DRY plots and the canopy cover was also similar. As expected, irrigation of the WET plot on 49 DAP caused a large difference in canopy T between the WET and DRY plots. This difference lessened gradually over time and became insignificant after about a week. The canopy grew from approximately30 percent coverage of the soil at 49 DAP to 60 percent coverage of the soil on 63 DAP. The nextirrigation of the WET plot, applied on 63 DAP, had no significant effect on canopy T. Most likely that was due to the fact that by then the canopy covered more than 60 percent of the soil, and heating of the small portion of the dry soil surface was insufficient to have a measurable effect on canopy temperature. Therefore the estimated canopy T was essentially not affected. Overall, compared to the intermittentlywetted soil surface, dry soil surface was estimated to increase canopy transpiration by 17 percent over the 15 days of testing period (49 to 63 DAP).
24
California Water Plan Update 2005
Volume 41544
Evapotranspiration and Relative Contribution by the Soil and the Plant
Figure 9. Vapor pressure difference (�W) between the interior of leaves and the air for cottonin the WET and DRY treatments on six dates in 1999. Irrigation of the WET plot was on
7/23 starting about 11:00.
�W (
mba
r)
0
5
10
15
20
25
30
35
40
WETDRY
WETDRY
7/19 7/22
7/23
0
5
10
15
20
25
30
357/24
7/25
Pacific standard time (h)
6 8 10 12 14 16 180
5
10
15
20
25
30
35
6 8 10 12 14 16 18
7/29
25
Evapotranspiration and Relative Contribution…

1554Crop Water Use
California Water Plan Update 2005
Evapotranspiration and Relative Contribution by the Soil and the Plant
It should be pointed out that the above estimates of the potential increase in canopy T are likely to be on the high side. The estimate was based on midday data, when intrarow advective effect is expected to be the greatest. Basing the estimate on the cumulative daily data would have reduced the estimateenhancement in canopy T. Also, in estimating canopy T the DRY plants were assumed to have the samecanopy conductance as the WET plants. In reality, conductance was probably lower for the DRY than the WET plants because cotton stomata close more as �W increases (Xu, 2000), and therefore canopy T would not have been enhanced as much.
The results in both 1999 and 2000 indicate that eliminating or markedly reducing soil E would enhancecanopy T significantly only when canopy coverage of the ground is small, and the effect is only substantial in the first several days after an irrigation. Thus, unless the soil surface is wetted by irrigation very frequently when canopy cover is small, the increase in canopy T for the season by eliminating the wetting of soil surface is likely to be minor.
General Discussion and Conclusion This chapter is based both on a study of the literature and on substantial experimental work conducted at the University of California, Davis, over two years. The review of literature confirms what is generally, ifvaguely, taken for granted. That is: when crop canopy cover of the soil is partial, canopy T is less than the rate of ETo, and soil E is substantial when the soil surface is wet and exposed, and decreases as canopy cover increases. Although the number of reasonably definitive studies is limited, the results are fairlyconsistent and shows (Fig. 3) that when canopy cover of the soil is partial and soil surface wet, canopy T as a fraction of ET is not just proportional to the fractional canopy cover but greater; and soil E as a fraction of ET is not proportional to the fractional exposed soil surface but less. In other words, canopyappears to exert a disproportionately large impact on canopy T and on soil E. On the other hand, when canopy coverage of the soil is complete or very nearly so, there is still some soil E, in the order of 10 percent or less of ET.
Once the exposed soil surface begins to dry, soil E declines exponentially with time and the empiricaldata indicate that canopy T increases at least slightly as the result. This point is emphasized in the analysisby Ritchie (1983), of canopy T as a fraction of ET in relation to LAI. Nonetheless, the conclusion is not as firm as one would like because it is based on comparing T/ET data measured or estimated withdifferent methods from different studies.
The experimental work conducted at Davis demonstrates clearly the influence of plant density on the peed of canopy development and hence on the extent of soil E relative to canopy T. Higher plant density
andincrea Tcaused by increased canopy T is benefi produced by the crop per unit of ET. That is, the efficiency of consumptive water use for biomass production is improved.
smore canopy cover reduce soil E but increase canopy T. Consequently the total ET is usually
sed but the amount of soil E is reduced, as demonstrated in Fig. 3 and 5. The increase in total Ecial, in that more biomass is
26

California Water Plan Update 2005
Volume 41564
Evapotranspiration and Relative Contribution by the Soil and the Plant
AP was applied to oth treatments, but subsequently only to the Wet treatment. On 85 DAP, the stand was thinned to
2.5 plants m-2. �W was calculated from foliage temperature and bulk air vapor pressure.
60
80
100
Irrigation
Can
opy
cove
r (%
)
40Dry treatmentWet treatment
0
20
Figure 10. Difference in midday (11:30 to 12:30 PST) water vapor pressure (�W) between the foliage interior and the bulk air for the Dry and Wet cotton in 2000, and the ratio of �W for the Drytreatment to �W for the Wet treatment. Irrigation (inverted arrow heads) on 24 Db
DAP
20 30 40 50 60 70 80 90 100 110
�W
d/�W
w
0.50
1.25
�W (
mba
r)
0
10
20
30
40Dry �WWet �W
0.75
1.00
27
Evapotranspiration and Relative Contribution…
1574Crop Water Use
California Water Plan Update 2005
Evapotranspiration and Relative Contribution by the Soil and the Plant
:30to 12
ta
several other studies (e.g., Tarantino et al., 1982) that drip irrigation may not reduce soil E under some onditions. Drip irrigation is likely to reduce ET through the reduction in soil E in comparison to surface
irri is
obser
DAP
35 40 45 50 55 60 65 70 75
Tra
nspi
ratio
n (m
m h
-1)
0.0
0.2
0.4
0.6
0.8
1.0
WETDRYETo
Irrig.
Figure 11. Calculated effect of soil drying on canopy transpiration for the midday period of 11:30. Solid and open symbols are for DRY and WET treatments, respectively. Inverted triangles
indicate the time of irrigation of the WET treatment. Transpiration was calculated using �W daas indicated in the text.
Another aspect of the experimental work compared ET of cotton irrigated by drip with that irrigated byfurrow. Without irrigation ET spikes, the pattern of daily ET over time for the drip irrigated is verydifferent from that for the furrow irrigated (Fig. 6a). For cumulative ET over the experimental period, the data are not totally conclusive because the lysimeter of the drip irrigated treatment developed a salinityproblem that slowed the growth of cotton before it was corrected. Minor adjustment of the ET data were made to account for this difference in canopy cover. Cumulative ET calculated from the adjusted data (Fig. 6c) indicates that consumptive water use of the drip irrigated treatment was essentially the same as that of the furrow irrigated treatment (436 mm vs. 426 mm). These results support the conclusions drawn inc
gation if one or more of the following conditions apply: (a) the time interval between drip irrigationslonger than that used in this study; (b) the time interval between furrow irrigations is shorter than that used in this study; and (c) the canopy cover develops more slowly (e.g., by planting at a lower density or by being deficient in mineral nutrients, or growing a species of crop with a slower growth rate) than that
ved in this study. It is obvious that a number of other factors such as soil water holding capacity,
28
California Water Plan Update 2005
Volume 41584
Evapotranspiration and Relative Contribution by the Soil and the Plant
rooting depth, and sensitivity of the crop to low soil water status enter into consideration when deciding on irrigation intervals in addition to the potential reduction in soil E.
The extent that ET from the soil and from the crop is suppressed during sprinkler water application was also carefully assesses in many tests over the two year period in Davis. ET rate had to be calculated as the difference between the water application rate as measured by catch cans and the rate of water gain by the field as measured by precision lysimeters. Due to the fact that ET rate is small when compared to the rate of water application by impulse sprinklers, the results are quite variable. By conducting a total of nine successful tests, it is possible to conclude that ET is suppressed during the time of sprinkler irrigation, byprobably 40 to 50 percent in comparison to ET from a wet field without the sprinkling. The suppression is the result of the spraying water drops from the sprinklers humidifying and cooling the air. Thus, the in-airevaporation from the falling water drops is not all vain, in that some saving of ET results. The saving is not greater because rotation of the sprinkler heads places the spray over a particular area onlyperiodically. The general impression is that sprinkler irrigation involves extra water loss due to in-airevaporation of the drops. The extent of this evaporation has been calculated in a theoretical way, based on drop size distribution, traveling distance, and wet bulb depression as a function of air humidity. This effort should be expanded and combined with experimental measurements to better assess the in-air evaporation of sprinkler systems. The in-air evaporation rate can then be compared with the extent of ET suppression to ascertain just how much extra water is lost during sprinkler irrigations.
The final part of the experimental work was to estimate the potential increase of canopy transpiration if soil evaporation is greatly reduced or eliminated. This was done by measuring increases in foliage temperature when soil surface was dry compared to when it was wet, under conditions when canopycovered the soil only partly. Using the fact that leaf interior is essentially saturated with water vapor and the well know saturation vapor pressure vs. temperat e curve, the potential effect on transpiration was e
hr time. The common time interval between irrigations is in terms of a week to
urstimated from the increases in water vapor gradient from the foliage to the bulk air driving transpiration.
The results show that in the worst case scenario, canopy T over a dry soil surface may be 30 percent igher than over a fully wet soil surface, and the difference narrows and became insignificant as the soil
surfacesurface dries ovemany days, ample time for the drying of exposed soil surface. Hence, when averaged over a period of weeks or more the difference in canopy T over a dry soil compared to a soil wetted periodically byirrigation should be considerably less. In the case we evaluated, the average difference was 17 percent for a period when the canopy cover was low. Generally speaking then, there would be some increase in canopy T when canopy cover is incomplete if soil E is essentially eliminated by irrigating with buried drip systems. The elimination of soil E, however should still result in a significant saving in total ET or consumptive water use.
29
Evapotranspiration and Relative Contribution…
1594Crop Water Use
California Water Plan Update 2005
Evapotranspiration and Relative Contribution by the Soil and the Plant
References Cited Adams, J. E., Arkin, G. F., and Ritchie, J. T. 1976. Influence of row spacing and straw mulch on first stage drying.
.
,
Plant-atmosphere interactions, evapotranspiration, and irrigation scheduling. Acta Horticulturae.
148.
a
-
d
-
. 1971. Dryland evaporative flux in a subhumid climate: II. Plant Influences. AgronomyJournal. 63:56-62.
Sadras, V. O., Whitfield, D. M., and Connor, D. J. 1991. Regulation of evapotranspiration, and its partitioningbetween transpiration and soil evaporation by sunflower crops: a comparison between hybrids of differentstature. Field Crops Research. 28: 17-37.
Seymour, V. A. and Hsiao, T. C. 1984. A soil surface psychrometer for measuring humidity and studyingevaporation. Agricultural and Forest Meteorology. 32: 61-70.
Shuttleworth, W. J. and Wallace, J. S. 1985. Evaporation from sparse crops - an energy combination theory.Quarterly Journal of the Royal Meterological Society. 111: 839-855.
Soil Science Society of America Journal. 40: 436-442.
Arkin, G. F., Ritchie, J. T., and Adams, J. E. 1974. A method for measuring first-stage soil water evaporation in thefield. Soil Science Society of America Proceedings. 38: 951-954.
Ashktorab, H., Pruitt, W. O., Member, A. S. C. E., and Paw, U. 1994. Partitioning of evapotranspiration usinglysimeter and micro-Bowen-Ratio system. Journal of Irrigation and Drainage Engineering. 120: 450-464
Bethenod, O., Katerji, N., Goujet, R., Bertolini, J. M., and Rana, G. 2000. Determination and validation of corn croptranspiration by sap flow measurement under field conditions. Theoretical and Applied Climatology. 67:153-160.
Doorenbos, J. and Pruitt, W. O. 1975. Guidelines for predicting crop water requirements. Irrigation and DrainagePaper 24, FAO, United Nations, Rome.
Held, A. A., Steduto, P., Orgaz, F., Matista, A. A., and Hsiao, T. C. 1990. Bowen Ratio/energy balance techniquefor estimating crop net CO2; assimilation, and comparison with a canopy chamber. Theoretical and Applied Climatology. 203-213.
Hsiao, T. C. and Henderson, D. W. 1985. Improvement of crop coefficients for evapotranspiration. Final ReportCalifornia Irrigation Management Information System project, Vol. 1 Land, Air & Water Resources Papers10013-A, University of California, Davis, pp III-3 to III-35.
Hsiao, T. C. 1990.
California Water Plan Update 2005
Volume 41604
Evapotranspiration and Relative Contribution by the Soil and the Plant
Steduto, P. and Hsiao, T. C. 1998. Maize canopies under two soil water regimes. II. Seasonal trends ofevapotranspiration, carbon dioxide ance as related to leaf area index.Agricultural and Forest Meteorolo
t Water Use in Crop Production. Agonomy
Tarantino, ranspiration of processing tomatoes
Villalobo
Walker,
assimilation and canopy conductgy 89:185-200.
Tanner, C. B. and Sinclair, T. R. 1983. Efficient water use in crop production: Research or re-search? Taylor, H. M.,Jordan, W. R., and Sinclair, T. R. (eds.) Limitation to EfficienSociety of America, Madison, WI. pp 1-27
E., Singh, H., and Pruit, W. O. 1982. The microclimate and evapotunder drip and furrow irrigation. Rivista di agronomia. 16: 21-29.
s, F. J. and Fereres, E. 1990. Evaporation measurements beneath corn, cotton, and sunflower canopies.Agronomy Journal. 82: 1153-1159.
G. K. 7-12-1984. Evaporation from wet soil surfaces beneath plant canopies. Agricultural and ForestMeteorology. 33: 259-264.
Xu, L. 2000. Crop evapotranspiration, photosynthesis, and water use efficiency as affected by environmentalvariables. Ph.D. Dissertation. University of California, Davis
31
Evapotranspiration and Relative Contribution…