by sultan m. alsolaiman - eprints.qut.edu.au solaiman_thesis.pdf · construction boom, with over...
TRANSCRIPT

School of Civil Engineering and Built Environment Faculty of Science and Engineering
Queensland University of Technology
An Empirical Study of the Factors Impacting on the Involvement of Clients in Saudi Arabian Construction Projects
By Sultan M. Alsolaiman
B.Sc. in Mechanical Engineering (KSU, Saudi Arabia 1996), Master of Mechanical Engineering (ODU, VA, USA 2003), MBA Finance (QUT, AU 2009)
Submitted in fulfilment of the requirement for the degree of
DOCTOR OF PHILOSOPHY
Brisbane-Australia
2014


I
Abstract
The construction sector in Saudi Arabia is the largest and fastest growing market in
the Gulf region. This strong economic position has encouraged the Saudi
Government to take the opportunity to implement spending and launch many
construction projects. In the last five years, Saudi Arabia has been experiencing a
construction boom, with over 16,500 ongoing public projects and the value of all
current projects totalling US$ 956 billion. Despite this impressive spending profile, a
United Nations Development Programme Report indicated that Saudi Arabia was
not progressing well in implementing effective management and achieving good
organisational performance. This was clearly demonstrated by the number of
projects suffering delay, which increased from 700 projects in 2009 to 3000 projects
in 2013.
The problems experienced on construction projects in Saudi Arabia have mainly
been caused by the low level of client involvement during many of the most critical
project activities. The lack of client involvement in the construction of public
projects has been identified as the main cause of many operational problems such
as cost and time overruns, disputes, errors, uncertainties in plans and specifications,
and increased maintenance costs.
The present study aims to facilitate the improvement of client performance and
involvement in construction projects. The study reviews the current practices of
client involvement in public construction projects in Saudi Arabia, investigates the
nature of the client involvement and participation in construction projects, and
considers how this involvement can impact on, and affect, the outcomes of
projects. Furthermore, this study investigates the reasons for limited client
involvement and participation in public construction projects in Saudi Arabia in
relation to three groups of factors, namely: (1) individual factors, (2) project factors,
and (3) organisational culture factors. The investigation helps to identify methods
for enhancing client involvement in project processes and leads to the proposal of

II
ways to improve the current unsatisfactory situation, in order to have more positive
outcomes in Saudi construction projects.
The analysis in the present study links the research questions and research
outcomes. The research design initially used a quantitative method to address the
first three main research questions by conducting a survey in the form of a
questionnaire. The results from the survey were analysed using descriptive analysis.
Following this, inferential statistical analysis of testing was conducted on the data
results of the survey. Finally, the analysis used structural equation modelling (SEM)
to determine the significance of the impact of both the individual and
organisational culture factors on the involvement of clients in construction projects
within the project delivery expectations.
This study suggests that organisational culture plays a major role in influencing and
increasing the client involvement in construction projects by emphasising team
orientation. Organisational culture also has an influential positive effect on clients
as individuals. In order to have a positive outcome in construction project delivery,
clients need to focus more attention on, and improve the levels of, education and
knowledge. This increases their decision-making capability and improves the quality
of decision-driven outcomes, which are reflected in the project activities, especially
in the early stage of design. The delivery of construction projects is generally
measured by the quality, cost and time of project implementation; therefore, the
clients’ objective should be to get the balance right between all of these elements in
order to satisfy the desired project delivery expectations.
The findings were used to develop the “Client Involvement-Interactive” (CI-
Interactive) framework. This framework is designed to improve the current
unsatisfactory situation of client involvement and contribute to more positive
outcomes in Saudi construction projects.

III
Keywords
Saudi Arabia, Clients, Construction Project Phases, Organisational Culture Factors,
Individual Factors, Project Factors, Structural Equation Modelling, SEM

IV
Table of Contents
Abstract .......................................................................................................................... I Keywords ...................................................................................................................... III List of Figures ............................................................................................................. VIII List of Tables ................................................................................................................. IX
List of Abbreviations ...................................................................................................... X
Statement of Original Authorship ................................................................................ XI Acknowledgments ....................................................................................................... XII
CHAPTER 1 INTRODUCTION TO THE STUDY ................................................................................. 1
1.1 Research Background .............................................................................................. 1
1.2 Research Aim ........................................................................................................... 3
1.3 Research Methodology ........................................................................................... 3
CHAPTER 2 LITERATURE REVIEW ................................................................................................. 6
2.1 Introduction ............................................................................................................. 6
2.2 Construction Projects in Saudi Arabia ..................................................................... 6
2.2.1 Background of Stages in Saudi Arabian Construction Industry........................ 6
2.2.2 Economic Profile of Construction Industry in Saudi Arabia ............................. 8
2.2.3 Status of Construction Sector in Saudi Arabia ............................................... 11
2.3 Clients in Construction Projects ............................................................................ 15
2.3.1 Definition, Types and Duties of the Client ..................................................... 15
2.3.2 Nature of Effective Client Involvement .......................................................... 19
2.4 Factors Affecting Client Involvement .................................................................... 25
2.4.1 Individual and Project Factors ........................................................................ 26
2.4.2 Organisational Culture Factors ....................................................................... 28
2.5 Conceptual Framework ......................................................................................... 31
2.6 Summary ............................................................................................................... 33
CHAPTER 3 RESEARCH DESIGN AND METHODOLOGY ................................................................ 34
3.1 Introduction ........................................................................................................... 34
3.2 Research Problem ................................................................................................. 34
3.3 Research Design .................................................................................................... 37
3.4 Survey .................................................................................................................... 40
3.4.1 Questionnaire Development .......................................................................... 41
3.4.2 Scale................................................................................................................ 43
3.4.3 Questionnaire Closed Loop Back-Translation ................................................ 44
3.4.4 Pre-Testing the Questionnaire ....................................................................... 45
3.5 Sample Design and Size ......................................................................................... 46
3.6 Ethical Considerations ........................................................................................... 49
3.7 Data Analysis ......................................................................................................... 50
3.7.1 Preliminary Data Analysis ............................................................................... 50
3.7.2 Descriptive Analysis ........................................................................................ 54
3.7.3 Inferential Statistical Analysis ........................................................................ 56
3.8 Summary ............................................................................................................... 61

V
CHAPTER 4 CURRENT PRACTICES IN CLIENT INVOLVEMENT ....................................................... 63
4.1 Introduction .......................................................................................................... 63
4.2 Preliminary Data Results ....................................................................................... 64
4.2.1 Sample Data Profile ........................................................................................ 64
4.2.2 Editing the Data .............................................................................................. 64
4.2.3 Validity and Reliability of the Questionnaire ................................................. 66
4.3 Demographic Profiles ............................................................................................ 69
4.4 Current Client Involvement Analysis ..................................................................... 73
4.4.1 Respondents’ Involvement as Clients in Project Phases ................................ 74
4.4.2 Construction Project Phase Ranking of Importance ...................................... 86
4.5 Impact of Client Involvement on Project Delivery ................................................ 88
4.6 Factors Affecting Client Involvement .................................................................... 89
4.6.1 Individual Factors ........................................................................................... 89
4.6.2 Project Factors ............................................................................................... 94
4.6.3 Organisational Culture Factors ...................................................................... 94
4.7 Summary ............................................................................................................... 97
CHAPTER 5 FACTORS INFLUENCING CLIENT INVOLVEMENT: SEM ............................................... 99
5.1 Introduction .......................................................................................................... 99
5.2 Preliminary Structural Model ................................................................................ 99
5.2.1 Project Phases Measurement Model Fit ...................................................... 101
5.2.2 Individual Factors Measurement Model Fit ................................................. 104
5.2.3 Organisational Culture Factors Measurement Model Fit ............................ 106
5.3 Final Structural Model ......................................................................................... 107
5.3.1 Whole Structural Model with Individual Factors ......................................... 108
5.3.2 Whole Structural Model with Organisational Culture Factors .................... 110
5.3.3 Whole Structural Model with Individual Factors and Organisational Culture Factors ............................................................................................. 111
5.4 Impact of Individual and Organisational Culture Factors on Client Involvement112
5.5 Summary ............................................................................................................. 117
CHAPTER 6 DISCUSSION .......................................................................................................... 118
6.1 Introduction ........................................................................................................ 118
6.2 Current Client Involvement ................................................................................. 119
6.2.1 Client Involvement in Project Phases........................................................... 119
6.2.2 Impact of Client Involvement on Project Delivery ....................................... 126
6.2.3 Factors Affecting Client Involvement ........................................................... 127
6.3 Impact of Individual and Organisational Culture Factors on Client Involvement131
6.4 Final Model of Client Involvement in Construction Projects .............................. 134
6.5 Summary ............................................................................................................. 135
CHAPTER 7 CONCLUSION AND RECOMMENDATIONS .............................................................. 137
7.1 Introduction ........................................................................................................ 137
7.2 Conclusion ........................................................................................................... 138
7.2.1 Relatively Low Client Involvement in Saudi’s Construction Projects ........... 138

VI
7.2.2 Impact on Project Delivery ........................................................................... 139
7.2.3 Main Factors Affecting Client Involvement .................................................. 140
7.3 Contributions ....................................................................................................... 142
7.4 Limitations ........................................................................................................... 144
7.5 Recommendations for Future Research ............................................................. 144
BIBLIOGRAPHY...................................................................................................... 145
APPENDICES ......................................................................................................... 156
Appendix A Questionnaire [ENGLISH Version] .......................................................................... 157
Appendix B Questionnaire [ARABIC Version] ........................................................................... 164
Appendix C Preliminary Data Analysis ..................................................................................... 171
C-1: Coding Data ........................................................................................................ 171
C-1-1: Demographic [Part 1 in Questionnaire]...................................................... 171
C-1-2: Client Involvement [Part 2 in Questionnaire] ............................................. 172
C-1-3: Factors Affecting the Involvement [Part 3 in Questionnaire] .................... 173
C-1-4: Project Delivery Expectation [Part 3 in Questionnaire] ............................. 174
C-2: Targeted Government Agencies ........................................................................ 175
C-3: Refinement of the Dataset................................................................................. 176
C-4: Reliability Test of the Measures in the Questionnaire ...................................... 181
C-4-1: Reliability Test of Client Involvement in Project Phases ............................ 182
C-4-2: Reliability Test for Individual Factors ......................................................... 187
C-4-3: Reliability Test for Project Factors .............................................................. 188
C-4-4: Reliability Test for Organisational Culture Factors ..................................... 189
C-4-5: Reliability Test for Project Delivery Expectations ....................................... 190
Appendix D Data Result of the Questionnaire .......................................................................... 191
D-1: Demographic Statistic [Part 1 in Questionnaire] ............................................... 191
D-2: Current Practice of Client Involvement [Part2 in Questionnaire] .................... 194
D-2-1: Overall Client Involvement in Projects ....................................................... 194
D-2-2: Client Involvement Based on Project Ownership ...................................... 197
D-2-3: Client Involvement Based on Project Type ................................................ 199
D-2-4: Overall Current Practice Ranking of Client Involvement ........................... 201
D-3: Factors Affecting Client Involvement [Part3 in Questionnaire] ........................ 203
D-3-1: Individual Factors ....................................................................................... 203
D-3-2: Project Factors ............................................................................................ 203
D-3-3: Organisational Culture Factors ................................................................... 204
D-4 Project Delivery Expectation .............................................................................. 205
D-4-1: Impact of Project Delivery Based on Overall Sample ................................. 205
D-4-2: Impact of Project Delivery Based on Ownership ....................................... 205
D-4-3: Impact of Project Delivery Based on Project Type ..................................... 206

VII
Appendix E Mann-Whitney and Kruskal-Wallis ANOVA Results ............................................... 207
E-1: Mann-Whitney ANOVA Results ......................................................................... 207
E-2: Kruskal-Wallis ANOVA Results ........................................................................... 211
Appendix F Factor Analysis ..................................................................................................... 215
F-1: Construction Projects Phases ............................................................................. 215
F-2: Inividual Factors ................................................................................................. 219
F-3: Organisational Culture Factors .......................................................................... 222
Appendix G AMOS Output ....................................................................................................... 225
G-1: Project Phase Measurement Model Fit ............................................................. 225
G-2: Individual Factors Measurement Model Fit ...................................................... 226
G-3: Organisational culture Factors Measurement Model Fit .................................. 227
G-4: Whole Structural Model with Individual Factors .............................................. 228
G-5: Whole Structural Model with Organisational Culture Factors .......................... 230
G-6: Whole Structural Model with Individual Factors and Organisational Culture Factors ............................................................................................................... 232

VIII
List of Figures
CHAPTER 1
CHAPTER 2
Figure 2.1: Oil global price and target of Saudi price 9 Figure 2.2: Revenues, expenditures and surplus for Saudi budget in the last ten years 9 Figure 2.3: Traditional relation between the clients and others in Saudi construction projects 12 Figure 2.4: Major construction process activities (ASCE, 2012) 18 Figure 2.5: Scope of the study 19 Figure 2.6: Client involvement 21 Figure 2.7: Conceptual model of project management by Toor and Ogunlana (2008) 21 Figure 2.8: Client’s role in project delivery 23 Figure 2.9: Important elements of the client activities in a projects 25 Figure 2.10: Three main groups of factors that limit client involvement in construction projects 26 Figure 2.11: Conceptual framework of client involvement 32
CHAPTER 3
Figure 3.1: Research design process (developed for this research) 39 Figure 3.2: Closed loop back-translation (Modified Coffey technique, 2010) 45 Figure 3.3: Sampling designs and sampling procedures 47 Figure 3.4: Research coding system 51
CHAPTER 4
Figure 4.1: Frequency statistics for participants' project type 72 Figure 4.2: Frequency statistics for project procurement 73 Figure 4.3: Likert and involvement scale profile used for Part 2 in the questionnaire 74 Figure 4.4: Overall data on respondents’ involvement as clients in construction projects 76 Figure 4.5: Client involvement in public and semi-public construction projects 84 Figure 4.6: Client involvement in different project types 85 Figure 4.7: Comparison of client involvement among different perspectives 86 Figure 4.8: Impact of client involvement on project implementation 88 Figure 4.9: Profile of individual factors influencing client involvement 90 Figure 4.10: Profile of organisational culture factors influencing client involvement 94
CHAPTER 5 Figure 5.1: Involvement domain of the clients 100 Figure 5.2: Latent variables of preliminary structural model 101 Figure 5.3: Initial project phase measurement model 102 Figure 5.4: Final project phase measurement model fit 103 Figure 5.5: Initial individual factors measurement model 104 Figure 5.6: Final individual factors measurement model fit 105 Figure 5.7: Initial organisational culture factors measurement model 106 Figure 5.8: Final organisational culture factors measurement model fit 107 Figure 5.9: Initial whole structural model 108 Figure 5.10: Initial whole structural model with individual factors 109 Figure 5.11: Final whole structural model with individual factors 109 Figure 5.12: Initial whole structural model with organisational culture factors 110 Figure 5.13: Final whole structural model with organisational culture factors 111 Figure 5.14: Initial whole structural model 111 Figure 5.15: Final whole structural model with individual and organisational culture factors 112 Figure 5.16: Impact of individual factors on client involvement 113 Figure 5.17: Impact of organisational culture factors on client involvement 114 Figure 5.18: Relationship between variables of individual, organisational culture, and client
involvement 115
CHAPTER 6 Figure 6.1: “CI-Interactive” framework for improving client involvement in construction
projects 135

IX
List of Tables
CHAPTER 1 CHAPTER 2 Table 2.1: Projects approved by the Saudi Government since 2007 10 Table 2.2: Client type summary (Brandon & Lu, 2008) 16 Table 2.3: Important directions in improving client performance (Jawahar-Nesan & Price, 1997) 17 Table 2.4: Organisational culture factors in construction (Cheung et al., 2011) 31
CHAPTER 3 Table 3.1: Content of questionnaire 42 Table 3.2: Normality data tests listed by Park (2008) 52 Table 3.3: Reliability level considerations 53 Table 3.4: Criteria used for factor analysis in the present study 57 Table 3.5: Assessment of measurement model 59 Table 3.6: Multi-fit indices for assessing the structural model fit 60 Table 3.7: Multiple fit indices used in the present study 61
CHAPTER 4 Table 4.1: Number of returned questionnaires 64 Table 4.2: Summary of reliability test of construction project phases 67 Table 4.3: Summary of reliability test of individual factors 67 Table 4.4: Summary of reliability test of project factors 68 Table 4.5: Summary of reliability test of organisational culture factors 68 Table 4.6: Summary of reliability test of project delivery expectations 69 Table 4.7: Frequency statistics for respondents' ownership type 69 Table 4.8: Frequency statistics for respondents' age 70 Table 4.9: Frequency statistics for respondents' education level 70 Table 4.10: Frequency statistics for workshops attended by respondents 71 Table 4.11: Frequency statistics for respondents' experience 71 Table 4.12: Respondent’s average (mean) involvement as clients in construction phases 75 Table 4.13: Mean ranking of client involvement in planning phase 78 Table 4.14: Mean rank of client involvement in design phase 79 Table 4.15: Mean rank of client involvement in construction phase 80 Table 4.16: Mean rank of client involvement in handover phase 82 Table 4.17: Mean rank of client involvement in O&M phase 82 Table 4.18: Construction project phase in order of importance 87 Table 4.19: Friedman test for construction project phase 87 Table 4.20: Ranking of existing individual factors from the highest to lowest 91 Table 4.21: Factor analysis of individual factors 93 Table 4.22: Rank from the highest to lowest of existing organisational culture factors 95 Table 4.23: Factor analysis for organisational culture factors 96
CHAPTER 5 Table 5.1: Code description of project phase measurement model fit 104 Table 5.2: Code description of individual factors model fit 105 Table 5.3: Code description of organisational culture factors model fit 107 Table 5.4: Structural model’s goodness of fit 113 Table 5.5: Impact of individual and organisational culture factors on client involvement 115 Table 5.6: Total impact on client involvement 116 Table 5.7: Indicators that measure the latent variable (OC and IF) 116
CHAPTER 6 Table 6.1: Average client involvement in Saudi construction project phases 121 Table 6.2: Most important phases and tasks in the construction project process 125

X
List of Abbreviations
AMOS Analysis of Moment Structures for Windows v21 software
CMIN/DF Chi Square or X2 value and associated DF
CMIN Chi Square or X2
CI Client involvement
DF Degree of freedom
FA Factor analysis
GFI Goodness-of-fit index
IF Individual factors
KMO Kaiser-Meyer-Olkin
MI Modification indices
NFI Normed fit index
OC Organisational culture
PCA Principal component analysis
RMSEA Root mean square error of approximation
RNI Relative Noncentrality index
SEM Structural equation modelling
SL Standardised loading
SPSS Statistical Package for Social Sciences for Windows v21 (IBM Corp., Released 2012)
SR Standardised residual
TLI Tucker-Lewis index

XI
Statement of Original Authorship
The work contained in this thesis has not been previously submitted to meet
requirements for an award at this or any other higher education institution. To the
best of my knowledge and belief, the thesis contains no material previously
published or written by another person except where due reference is made.
Signature:
Date: 1 June 2014
QUT Verified Signature

XII
Acknowledgments
First, thanks to Allah, ‘God’, who endowed me with endless grace and gave me the
health and motivation to achieve my goals.
I extend special thanks to my principal supervisor, Associate Professor Dr Bambang
Trigunarsyah and associate supervisor, Dr Vaughan Coffey. I owe my sincere
gratitude to Dr Bambang, who supervised me from the beginning of my study, for
his insightful, professional, continuous support and his understanding, guidance and
encouragement during all the stages of my PhD journey.
I would like to thank my family who collaboratively forgave my preoccupation and
permitted me the luxury of time to focus on the ultimate goal of completing my
PhD. My special thanks and appreciation go to my parents for their infinite love,
prayers, support and encouragement. My deepest gratitude goes to my wife, who
always infuses me with the strength to persevere and the courage to exceed my
own expectations. Without the endless encouragement and patience of my life
partner, Lujain, this thesis would not have been possible. To my beloved children,
Rawan, Rakan, Yara and Ahmed, thank you for your extraordinary understanding
and willingness to be a part of this journey.
I am grateful to many individuals who assisted me in the preparation and
completion of this study, for their support, guidance and encouragement. I am also
grateful to all of the study participants for their time and willingness to share their
views.

1
CHAPTER 1 INTRODUCTION TO THE STUDY
1.1 Research Background
The construction sector in Saudi Arabia is the largest and fastest growing market in
the Gulf region (Middle East Economic Digest [MEED], 2010; Samargandi, Fidrmuc &
Ghosh, 2013). Saudi Arabia has a strong economic standing globally and is a
member of the Group of Twenty (G20) which is the premier forum for international
cooperation on the most important issues on the global economic and financial
agenda (Middle East Economic Digest [MEED], 2010). This strong economic standing
has encouraged the Saudi Government to take the opportunity to spend money on
many projects. In the last five years, Saudi Arabia has experienced a construction
boom with over 16,500 ongoing public projects and a total value equal to US$956
billion (Middle East Economic Digest [MEED], 2010; Ministry of Finance, 2012).
However, a United Nations Development Programme Report indicated that Saudi
Arabia was failing to make real progress in achieving good management and
organisational performance (United Nations Development Programme, 2009). This
was clearly demonstrated in the number of projects experiencing delay, which
increased from 700 projects in 2009 (Althynian, 2010) to 3000 projects in 2013
(Anti-Corruption Commission, 2013).
Since the 1970s, construction project management practices in Saudi Arabia have
varied (Bubshait & Al-Musaid, 1992) due to the different nationalities of the
construction industry professionals. Furthermore, the quality of public projects has
varied among government agencies due to the different approaches used (Al-
jarosha, 2010; Althynian, 2010). Some examples of problems experienced in
construction projects in Saudi Arabia include cost and time overruns, disputes,
errors, uncertainties in plans and specifications, and increased maintenance costs.
The lack of client involvement in public construction projects has been proposed as
the main cause of myriad problems (Althynian, 2010).

2
Al-Khalil and Al-Ghafly (1999) found that slow decision-making throughout the
construction project process, especially in the early stage of a project, resulted in a
conflict between all parties in later stages. Therefore, client involvement during the
formative and early design stages of the projects is a critical factor that must be
taken into account if a project is to be delivered on time, to budget and to the
desired quality (Love, Gunasekaran & Li, 1998). Clients need to perform their roles
and responsibilities effectively and efficiently at the right time and through the use
of correct methods in order to have the optimum involvement required during all
the construction project phases, namely, the planning, design, construction,
handover, and operation and maintenance phase.
Taking the right decision is typically not a simple matter as most problems in
construction projects are highly complex in nature. This complexity is due to a
number of factors, either in the construction process or in management, that affect
project success and cause project failure. This may also cause delay, low quality in
the work done, or cost overrun. Identifying these factors can therefore be helpful
for analysing the potential reasons for project success or failure (Low & Chuan,
2006). Understanding clients' attitudes and actions is also critically important for
construction professionals in collectively taking the construction sector forward
(Boyd & Chinyio, 2006). Equally important, organisational culture plays a major role
in guiding and shaping behaviour (Rashid et al., 2004). Therefore, the present study
investigates the client involvement in public projects in Saudi Arabia in relation to
three categories of factors, namely, the individual, project, and organisational
culture factors. Researchers including Chan et al. (2004), Brockenbrough (2009),
Sargeant et al. (2010), White and Fortune (2002) and Cheung (2011) have identified
many factors that are related to these three categories. Brandon and Lu (2008)
pointed out that it is important to identify the dominating factors that lead to low
client involvement in construction projects. This raises a question about which of
these areas has the highest impact on limiting efficient client involvement in
construction projects and how client involvement can be improved.
However, very little investigation has been reported that focuses on effective client
involvement in public construction projects. In the Saudi context, only one study

3
was carried out by Bubshaite and Al-musaid (1992), twenty years ago. They
emphasised the quality of owner involvement in three project phases (planning,
design and construction), and focused on defining the important tasks during the
construction project phases. Taking a different approach, this research investigates
the impact of clients’ individual, project and organisational culture characteristics
on their involvement in various phases of construction project delivery.
1.2 Research Aim
The aim of this research is to investigate the influence of individual, project and
organisational culture factors on client involvement during the construction project
process and the impact of these factors on the performance of construction project
delivery.
This investigation helps to establish the methods for enhancing client involvement
in the project process and leads to the proposal of some ways to improve the
current situation, in order to have more positive outcomes for Saudi construction
projects. It is important to note the limitations of this study:
1. The scope of the study was limited to clients who represented Saudi
Government.
2. The scope of the study was limited to government agencies.
3. The study covered only public sector construction project not private
construction projects.
1.3 Research Methodology
In order to achieve the aim, this research began by deriving basic observations and
theoretical insights from the literature, as discussed in Chapter 2. The literature
review focused on Saudi construction projects and the involvement of clients in
delivering the projects. The discussion of the literature focuses on the factors that
researchers have found to influence client involvement, in the categories of
individual, project and organisational culture factors. A conceptual framework is
developed to summarise the findings from the literature review.

4
Chapter 3 discusses the method selected for this research. Based on the research
framework developed in Chapter 2, the following four (4) research questions were
established:
1. What is the current practice of client involvement in Saudi construction
projects?
2. What is the impact of client involvement on project performance?
3. What are the main factors affecting client involvement?
4. How do those factors influence the client involvement and lead to improved
project performance?
In attempting to answer the research questions, this research was directed by the
following objectives:
1. To understand the current practice of client involvement in Saudi
construction projects.
2. To identify the impact of current client involvement practices on
construction project delivery in Saudi Arabia.
3. To identify and examine the factors that influence client involvement in
public projects in Saudi Arabia in three categories: (1) individual factors, (2)
project factors, and (3) organisational culture factors.
4. To develop a conceptual model of the relationship between client
involvement and the three groups of factors; to identify the relationship
between client involvement and the three groups of factors; and to
develop an instrument for measuring and diagnosing the client
involvement in relation to the three groups of factors.
Appropriate methods for answering these questions were then selected. First, the
quantitative method was used to cover the first three main research questions by
distributing a survey in the form of a questionnaire. The questionnaire was
distributed to 315 participants and 223 surveys were returned (70.79% response
rate). An inferential statistical analysis of testing was then conducted using SPSS
version 21, as presented in Chapter 4. The mean, median, mode, range and

5
standard deviation were used to identify the central tendency of the research
variables. Cronbach’s alpha was applied to check the reliability of the measures.
Frequency distributions of the variables were obtained and generated as tables,
graphs and pie charts. Where appropriate, tests were carried out on the significance
of the findings. The Kruskal-Wallis and Mann-Whitney tests were used to test the
significance of the differences between the mean ranks of the various groups.
Based on the data obtained from Part 2 and Part 3 of the questionnaire, the fourth
main research question was answered using the structural equation modelling
(SEM) approach with the analysis of moment structures (AMOS) application. This
was done in order to develop the model fit and measure the impact of the
individual factors and organisational culture factors on the client involvement in
construction projects, as presented in more detail in Chapter 5.
The findings presented in the previous chapters are interpreted and discussed in
Chapter 6 with a focus on ways to improve client involvement in construction
projects in Saudi Arabia. Chapter 7 presents the conclusions and makes a number of
recommendations.

6
CHAPTER 2 LITERATURE REVIEW
2.1 Introduction
This chapter presents a review of the research literature. This chapter is divided into
three parts related to the research aim and questions. In the first part, a brief
overview of the construction industry in Saudi Arabia is presented. The second part
focuses on the concept of the client, and the clients’ roles and responsibilities. In
particular, this part considers the literature revealing the current practices of client
involvement in public construction projects in Saudi Arabia.
The third part discusses the factors that affect and limit client involvement and
performance during construction projects. These factors are described in relation to
the categories of individual, project and organisational culture factors. This part of
the review helps to establish the ideal of enhanced client involvement in project
processes and to propose some ways to improve the situation in order have positive
outcomes in construction projects.
2.2 Construction Projects in Saudi Arabia
2.2.1 Background of Stages in Saudi Arabian Construction Industry
Throughout the years, the Saudi Arabian construction industry has gone through a
number of different stages. The first major stage began in the 1970s with the
government’s introduction of two 5 year plans. At that time, construction became
an industry of importance in Saudi Arabia alongside more traditional industries,
such as petroleum production. Through grants and interest-free loans, citizens were
encouraged to build and invest in numerous projects with different types, sizes and
functions. Additionally, there was an urgent need to develop the country’s
infrastructure. These initial years of growth were accompanied by a great deal of
economic prosperity, leading to the establishment of many well-known and

7
recognisable firms that had a significant impact on the industry (Ministry of
Economy and Planning, 2010).
In the third plan (1980-85), the emphasis changed. Spending on infrastructure
declined, but rose markedly in the areas of education, health and social services.
The share for diversifying and expanding productive sectors of the economy
(primarily industry) did not rise as planned, but the construction of two industrial
cities (Jubail and Yanbu) built around the use of the country's oil and gas to produce
steel, petrochemicals, fertiliser and refined oil products was largely completed
(Ministry of Economy and Planning, 2010).
In the fourth plan (1985-90), the country's basic infrastructure was viewed as largely
complete, but education and training remained areas of concern. Private enterprise
was encouraged, and foreign investment in the form of joint ventures with Saudi
public and private companies was welcomed. The private sector became more
important, rising to 70% of non-oil GDP by 1987 (Ministry of Economy and Planning,
2010).
The fifth plan (1990-95) emphasised the consolidation of the country's defences
after the first Gulf War; improved and more efficient government social services;
regional development; and, most importantly, the creation of greater private-sector
employment opportunities for Saudis by reducing the number of foreign workers
(Ministry of Economy and Planning, 2010).
The sixth plan (1996-2000) focused on lowering the cost of government services
without cutting them and sought to expand educational training programs. The plan
called for reducing the kingdom's dependence on the petroleum sector by
diversifying economic activity, particularly in the private sector, with special
emphasis on industry and agriculture (Ministry of Economy and Planning, 2010).
The seventh plan (2000-2004) focused more on economic diversification and a
greater role for the private sector in the Saudi economy. For the period from 2000
to 2004, the Saudi Government aimed at an average GDP growth rate of 3.16% each
year, with projected growths of 5.04% for the private sector and 4.01% for the non-

8
oil sector. The government also set a target of creating 817,300 new jobs for Saudi
nationals (Ministry of Economy and Planning, 2010).
The eighth plan (2005-2010) again focused on economic diversification in addition
to education and the inclusion of women in society. The plan called for establishing
new universities and new colleges with technical specialisations. Privatisation and
an emphasis on a knowledge-based economy and tourism were also identified as
ways to help achieve the goal of economic diversification (Ministry of Economy and
Planning, 2010).
The ninth plan (2010-2014) aspired to eliminate poverty and increase development
in infrastructure, medical services, educational capacity and residential housing. The
plan also aimed to increase real GDP by 15% over 5 years and called for substantial
government investment in human resource development, in order to decrease
Saudi unemployment from 9.6% to 5.5% (Ministry of Economy and Planning, 2010).
2.2.2 Economic Profile of Construction Industry in Saudi Arabia
The construction sector in Saudi Arabia is the largest and fastest growing market in
the Gulf region (Middle East Economic Digest [MEED], 2010; Samargandi et al.,
2013). Ongoing construction projects in the Gulf are valued at US$1.9 trillion (SR7.1
trillion), and one-quarter of the developments are located in Saudi Arabia (Middle
East Economic Digest [MEED], 2010). A number of positive economic, demographic
and geographic factors, as well as continued government support, have combined
to help Saudi Arabia weather the current economic downturn better than most of
its Gulf neighbours. According to industry experts, in the first two quarters of 2009,
34 contracts, each with a value of over US$500 million (SR1.9 billion), were
awarded. These contracts represent a combined worth of US$50.1 billion (SR187.9
billion).
In the last 10 years, the oil price has significantly increased and the oil price recently
rose to above US$110, as shown in Figure 2.1. Saudi Arabia has the world's second
largest oil reserves and is the world's second largest oil exporter with a production
of over 9 million barrels of oil per day. This has had an enormous impact on Saudi

9
Arabian income. The Saudi budget has had a surplus in the last seven years, as
shown in Figure 2.2. Therefore, Saudi Arabia has a strong economic standing
globally. It is a member of the G20 forum for international cooperation on the most
important issues on the global economic and financial agenda. This strong economic
position has encouraged the Saudi Government to take the opportunity to spend
money on many public projects.
Figure 2.1: Oil global price and target of Saudi price
Figure 2.2: Revenue, expenditures, and surplus for Saudi budget in the last ten years
The Saudi Government is intent on fueling the growth of the construction sector.
The government planned to spend an estimated US$400 billion (SR1.5 trillion) on
large infrastructure projects from 2010 to 2015 (Ministry of Finance, 2010). In the
-50.00
0.00
50.00
100.00
150.00
200.00
250.00
300.00
350.00
2001 2002 2003 2004 2005 2006 2007 2008 2009 2010 2011 2012
Billio
ns o
f U
S (
$)
Year
Actual Budget
Revenues Expenditures Surplus/Deficit

10
period between October 2008 and April 2009, industry experts estimate that the
Saudi Government invested nearly US$137 billion on construction projects. Since
2007, 16,968 projects with an approved cost of US$237.11 billion have been signed
off by the government as set out in Table 2.1. However, according to the Gulf
Project Index introduced by the Middle East Economic Digest, the total value of
ongoing projects in Saudi Arabia in August 2013 was US$956 billion. This increase in
number was due to the inclusion of some petroleum projects that are not under the
control of Saudi Ministry of Finance.
Table 2.1: Projects approved by the Saudi Government since 2007
Government-Approved Projects (*)
Year No of Project Cost (Billions US$)
2007 3200 22.13
2008 2500 32.00
2009 2350 38.77
2010 2460 38.77
2011 2600 39.55
2012 2000 36.53
2013 (2ndQ) 1858 29.35
Total 16968 237.11 (*
) Ministry of Finance Reports (2007 to 2013)
H.E. Amr Al Dabbagh, Governor of the Saudi Arabian General Investment Authority
stated that construction in Saudi Arabia will play a large part in the kingdom’s
massive industrial expansion through the National Industrial Cluster Development
Program (U.S.-Saudi Arabian Business Council, 2012). One of the most interesting
steps in development plans in Saudi Arabia is the initiative to create six economic
cities near the major regions of Tabuk, Madinah, Rabigh, Hail, Jizan and Eastern
Province. These cities are expected to create 1.3 million jobs, and accommodate a
population of 4.8 million, contributing to a value of US$150 billion in gross domestic
product.
In July 2013, the ArRiyadh Development Authority announced the winners of three
turnkey contracts for the construction of a 176 km six-line driverless metro network
in Riyadh. The overall budget for the metro is US$22.5 billion, making it one of the
world's largest public infrastructure projects. The Saudi Government also plans to

11
implement the same project in some other major cities such as Dammam and
Jeddah.
2.2.3 Status of Construction Sector in Saudi Arabia
Construction project management practices in Saudi Arabia are varied (Bubshait &
Al-Musaid, 1992) due to the different nationalities of the industry professionals
working in Saudi Arabia since the 1970s. Furthermore, the quality of public projects
varies among government agencies due to the different approaches used (Al-
jarosha, 2010; Althynian, 2010). Therefore, there are no general guidelines to
describe the role of public agencies in construction project management. The
varying degrees of client involvement in public construction could also be a reason
for the various levels of quality achieved in different construction agencies (Assaf &
Al-Hejji, 2006; Bubshait, 1994; Middle East Economic Digest [MEED], 2010).
In the relationship between the parties in Saudi projects, the consultant has
traditionally been considered as the major player in the construction project and
this approach has served to isolate the contractors from the client (Kometa,
Olomolaiye & Harris, 1996). In fact, there must be an unquestionable relationship
between the client and the consultant who will operate in the client’s best interest.
The isolation between the contractor and the client reduces the client’s influence
on the project and makes the client dependent on the consultant (Al-Sedairy, 1994;
Assaf & Al-Hejji, 2006). Furthermore, there is a perception among the clients in
government projects in Saudi Arabia that the consultants are correct even if the
offered resolution is different from the client's preference (Alnuaimi, Taha, Al
Mohsin & Al-Harthi, 2009). Figure 2.3 illustrates the direct relationship between the
client and consultant, and the indirect relationship between the client and
contractor in the construction sector in Saudi Arabia (Al-Kharashi & Skitmore, 2009;
Bubshait, 1994).

12
Figure 2.3: Traditional relation between the clients and others in Saudi construction projects
The lack of real progress in achieving good management and organisational
performance in Saudi Arabia has been cited (United Nations Development
Programme, 2003, 2009). According to Althynian (2010), the UN Development
Programme Report revealed some of the difficulties and problems faced by 850
construction projects out of 1035 projects underway between 1992 and 2009.
Among these projects, 41% of them were experiencing cost overruns and 82% (700
projects) had exceeded the scheduled delivery timeframe. The Anti-Corruption
Commission (2013)updated these figures and painted a worse picture: in 2013, over
3000 projects had not been completed on time. Alhammadi, the chairman of the
Committee of Contractors and board member of the Riyadh Chamber of Commerce,
blamed the government agencies for the delays in the implementation of the
projects and pointed out that the reasons for incomplete projects were the large
number of projects being put forward, errors in the project design, and weak
supervision of all the parties in the projects (Alsalim, 2013). One main reason can be
attributed to the lack of planning and design, and this lack of planning is caused by
the weakness of the client involvement in the project processes (Althynian, 2010).
Construction projects in Saudi Arabia experience major delays (Al-Kharashi &
Skitmore, 2009). Some studies have been carried out on the causes of these delays
in Saudi construction projects. Surveys conducted by Assaf (1995) in some Saudi
projects found that the most important causes of delay were related to client
involvement in project processes such as involvement in planning and design, and
slow responses when making decisions and granting approvals for materials.
Client
Consultant
Contractor
Subcontractors
Suppliers

13
Moreover, Al-Barak (1993) found that the causes of failure in some construction
projects in Saudi Arabia were related to the clients’ lack of experience and weak
involvement in project activities. Similarly, Al-hajji and Assaf (2006) found that
delays in construction projects originated mostly in client-related factors. Al-Khalil
and Al-Ghafly (1999) found that slow decision outcomes by the client were a major
cause of project delay in Saudi Arabia. Consequently, it appears that the problems
experienced in construction projects in Saudi Arabia are mainly caused by the low
level of client involvement during project activities. Moreover, the weak decisions in
the early stage of a project will result in a conflict between all parties in the later
stages. Therefore, client involvement during the formative and early design stages
of a project is a critical factor that must be taken into account if a project is to be
delivered on time, to budget and to the desired quality (Love et al., 1998).
The success of a project starts with correct planning and design involvement in the
early stage of a project and the client plays a major role in this stage (Shen, Chung &
Hui, 2004). Al-Sedairy (1994) investigated management conflict in public sector
construction in Saudi Arabia and found that the conflict in public sector
construction occurred most frequently in the key relationships between the
contractor and the client, and the contractor and the consultant. The conflict was
found to occur most strongly in the later stages of a project during construction.
Moreover, low levels of experience and the high rapid economic and construction
boom had provided little time for the client to establish its norms (Assaf & Al-Hejji,
2006). Therefore, problems arising from incomplete or inaccurate engineering
details were frequently serious and costly, and were often not discovered until the
project had been completed or was in use. Such problems include cost and time
overruns, disputes between clients and other parties (especially contractors), omis-
sions, errors, ambiguities in plans and specifications, reduced life span, and
increased maintenance costs (Al-Kharashi & Skitmore, 2009).
An example of the lack of real progress in the Saudi construction sector is the
tragedy that occurred in Jeddah in November 2009 when a catastrophic flash flood
killed 143 people, damaged 10,785 homes and more than 10,850 vehicles. The high-
level investigative committee subsequently set up by Saudi King Abdullah found

14
that the most important causes of the disaster included the corruption among top
municipal officials, poor infrastructure planning, incompetence and lack of expertise
among officials and public servants, and the negligence of some major decision-
makers (Arab News, 2010; Fatany, 2009). It is therefore essential that the
government of Saudi Arabia recognises the need to increase professionalism in the
construction sector, starting by enhancing the client involvement so that clients can
effectively and efficiently participate in the project processes.
As stated previously, however, very little research has focused on effective client
involvement in public construction projects in Saudi Arabia. One study was
conducted by Bubshaite and Al-musaid (1992), more than twenty years ago. That
study emphasised the quality of owner involvement in three phases – namely, the
planning, design and construction phases – in public construction projects in Saudi
Arabia. The study indicated that the construction phase included the most
involvement by the owner. In regard to the important phases, the study found that
the most important phase was construction, followed by planning, and then design.
The study concluded that defining the important tasks during the construction
project phases helped to get the optimum level of owner involvement and
maximise the value of quality with minimum quality cost. In contrast, the aim of the
present study is to investigate the ideal of enhancing the client involvement in the
project processes and to propose some models to improve the participation in
order to create positive outcomes in construction projects. This is done by
identifying the practice of client involvement through the five project phases which
are the “planning phase”, “design phase”, “construction phase”, “handover phase”
and “operation and maintenance phase” and finding the most critical factors that
influence the client involvement in the categories of individual factors, project
factors and organisational culture factors.

15
2.3 Clients in Construction Projects
A successfully constructed project begins with the client (Ryd, 2004; Xu & Miao,
2010). Clients are central to the construction process and are considered to be the
driving force in the project. This part of the literature review focuses on the
understanding of the client concept and their roles and responsibilities in
construction project processes.
2.3.1 Definition, Types and Duties of the Client
The development of a well-defined theoretical or empirical classification is a basic
step in conducting any form of systematic inquiry under investigation (McCarthy,
1995). An appropriate classification for construction clients is necessary to provide
clarity in terms of understanding who they are, their needs, and their involvement
in the project processes.
CLIENT DEFINITION
Different approaches have been adopted to define the client identity in the
construction project. Therefore, the currently poor understanding of who the
construction client is begins from the lack of clarity regarding the definition of the
term “client” (Boyd & Chinyio, 2006). The International Council for Research and
Innovation in Building and Construction (2005) in Helsinki proposed the following
definition of the client:
“A client is a person or organisation who, at a particular point in time, has
the power to initiate and commission design and construction activity with
the intention of improving the performance of an organisation's social or
business objectives”
CLIENT TYPES
There are clearly various construction clients in the construction sector. However,
understanding the client is not straightforward. For instance, Green (1996) argued
that construction professionals need to build up good relationships with clients in
order to be able to understand their needs, preferences and requirements.

16
Therefore, identifying construction client types is a first step in achieving such
understanding. It can also assist by clarifying roles and responsibilities for specific
types of client, considering the context in which they operate. Clarifying the types
and interests of clients is important to allow construction professionals to take
appropriate actions on each project and to understand their clients’ objectives.
Brandon and Lu (2008) identified six criteria to classify clients (Table 2.2): paying
clients and users; level of experience of the client with construction; nature of the
client organisation; type of client business; size of the client organisation; and rate
of change in the client’s organisational environment.
Table 2.2: Client type summary (Brandon & Lu, 2008)
Client 'Type' Terms used to refer to the type
Paying client and users Apparent customer and users
Paying clients and end users
Identifiable customer and virtual customer
Level of experience with construction (and level of experience with specific building type)
Sophisticated, partially informed and naïve
On-going portfolios and one-off projects
Unitary and pluralistic
Nature of the client organisation (sector)
Public (national and local)
Private (industry and service)
Mixed (mix of public and private enterprise; not-for profit and private regulated)
Client business type
Property developers (primary) and those who build to perform some business activity (secondary)
Product type Building form types, building use types, ownership types
Rate of change in environment Static versus dynamic environments
Size of the client organisation Small, medium or large companies
In fact, the public sector projects in developed countries represent the most highly
spending sector compared with the others (Boyd & Chinyio, 2006). In the case of
Saudi Arabia, public sector projects account for 80% of the construction boom
(Ministry of Finance, 2012). Therefore, among the criteria set out in Table 2.2, the
present study focuses on the nature of the client’s organisation (sector) for the
purpose of classifying the client. Some of the government agencies investigated in
this study are a mix of public and private enterprises. Furthermore, the study
focuses on the government agencies that include engineering management teams
with a number of project engineers in different fields who represent the
government (client) in the public construction projects.

17
CLIENT RESPONSIBILITY IN CONSTRUCTION PROJECTS
Clients who are closely involved in managing a project are usually the most satisfied
with the project quality (Bubshait & Al-Musaid, 1992). However, the client has
duties and responsibilities when involved in the construction process. Clients should
identify and adopt effective practices that contribute to high performance in their
involvement in the construction process (Al-jarosha, 2010; Al-Kharashi & Skitmore,
2009; Althynian, 2010; Forgues, 2006; Jawahar-Nesan & Price, 1997; Low & Chuan,
2006; Toor & Ogunlana, 2008; Xu & Miao, 2010). As construction projects become
larger and more complex, the client activity becomes more important for the
success of the project. Jawahar-Nesan and Price (1997) formulated twelve
important directions for improving the outcomes and productivity of client
representation in construction projects (Table 2.3). Their research, conducted in the
UK, focused on practices to perform each consecutive task to improve the
outcomes in construction.
Table 2.3: Important directions in improving client performance (Jawahar-Nesan & Price, 1997)
No. Performance Improvement
1 Preparing and organising 2 Developing project definition 3 Procurement 4 Organising a joint management team 5 Design management 6 Safety management 7 Measuring and reviewing performance 8 Communications 9 Motivation
10 Coordination 11 Documentation 12 Project evaluation
Involvement is determined by the degree to which the project team fulfills its
responsibilities to each phase of the total construction process (Bubshait, 1994;
Chan, Scott & Chan, 2004; Forgues, 2006; Parker & Skitmore, 2005; Shelbourn,
Bouchlaghem, Anumba & Carrillo, 2007; Toor & Ogunlana, 2008). The total
construction process, from the beginning of the project idea through its start-up,
was illustrated in the Quality in the Constructed Project Manual published by ASCE
(2012). The manual provides guidelines and recommendations which lead to quality
in construction project processes. Each phase of the construction process is of equal

18
importance. Each affects the success of the succeeding stages. Figure 2.4
summarises these activities in the three phases of the construction process
identified.
Figure 2.4: Major construction process activities (ASCE, 2012)
There are another two phases that are no less important than the previous phases,
namely, the handover phase and the operation and maintenance phase. The
handover of a project to the client at the end of the construction phase is a very
important stage of the project and is critical to the success of the facility’s operation
(Hassan, Kandeil & Nady, 2010). A well organised, efficient and effective transfer of
information from the contractor to the client is essential. The handover of the
project from the contractor to the client can have an effect on health and safety,
standards of operation, maintenance and operational cost efficiencies to the client.
The handover and fine-tuning of operations can impact heavily on the core business
of the client if not managed in a structured manner. All the elements of each
project phase are shown in detail in the Appendix (Appendix C, Section C-1-2, Table
C-1-2).
Major Construction Process Activities
Assign Planning Team
Study/Define needs
Study Feasibility Alternative
Develop Program
Develop Project Execution
Select and Acquire Site
Acquire Design Services
Support Design Function
Control Design Function
Accept/Communicate Design
Planning Phase Construction Phase Design Phase
Acquire Construction Services
Support Construction Function
Control Construction Phase
Accept Completed Facility

19
Clients need to perform their duties and responsibilities at the right time and in
correct ways in order to have the optimum involvement required during the
construction project phases, namely, the planning phase, design phase,
construction phase, handover phase, and operations and maintenance phase. The
scope of this study, as shown in Figure 2.5, is the client involvement in public
construction projects at each phase of the project process (planning, design,
construction, handover, and operation and maintenance).
Figure 2.5: Scope of the study
2.3.2 Nature of Effective Client Involvement
Clients play a major part in successful projects (Chua, Kog & Loh, 1999; Ryd, 2004;
Xu & Miao, 2010). Clients are therefore also central to the construction project
process and are considered to be the driving force in the construction projects.
The successful execution of a construction project is heavily influenced by the right
outcomes during the phases of the construction project. Much of the research on
organisational performance in developing countries, in general, and in Arab
countries in particular, identifies problems related to ineffectiveness in the project
outcomes (Al-Kharashi & Skitmore, 2009; Al-Sedairy, 1994; Ali, 1993), low
productivity (Alkahtani, 2000), and the lack of real progress in achieving good
management and organisational performance (United Nations Development
Program, 2003, 2009). Furthermore, managing project activities and making
Planning Phase
Design Phase
Construction
Phase
Handover Phase
O &M Phase
Client Involvement
Public Construction Project

20
decisions are very complex and uncertain endeavours, involving the coordination of
many tasks and individuals with different priorities and objectives. Moreover, the
effective involvement of all parties in the project needs flexible guidance because
the project process usually is about long-term operations that reflect on the life
cycle of project.
The degree of client involvement is based on taking the right decision during the
construction project processes. Put simply, involvement in a construction project is
like having a “black box” that needs to be opened by the client, as illustrated in
Figure 2.6. Then, the client divides the box (project) to phases (project phases) and
the phases are broken down to items (tasks). With the procedure chosen, the client
delivers the project according to what was expected. Therefore, good involvement
produces good outcomes so the decisions are taken mainly based on adequate
information, rich knowledge, and appropriate skills to use knowledge and
information. In a complex environment, undetermined and insufficient external
information as input during the project could trigger incomplete and poorly
constructed results (Sauter, 2005). Generally, the entire client involvement
procedure is based on the weight of the client’s experience (Nutt, 2006). Therefore,
for many construction projects, making good and timely decisions is not an easy
task to accomplish. Making the right decision is typically not a simple matter, as
most decision problems in construction projects are highly complex in nature. This
complexity is due to a number of factors, either in the construction process or in
management, that affect project success and cause project failure. Therefore,
knowing these factors can be helpful for analysing the potential reasons for project
success or failure (Low & Chuan, 2006).

21
Figure 2.6: Client Involvement
To establish the performance strategy which contributes to the success of a project
and facilitates efficient client involvement, Toor and Ogunlana (2008) presented a
conceptual illustration of project management as shown in Figure 2.7. It illustrates
that projects can be categorised into three general phases (input, process, and
outcome) and two major domains (the process domain and performance domain).
The process domain deals with all the construction project phases in the field,
starting from setting up the project, and moving through the input phases until
delivering and finishing the project. All the phases in the process domain are
supported by the performance domain which involves setting up the desired goal of
the project and the performance strategy.
Figure 2.7: Conceptual model of project management by Toor and Ogunlana (2008)
Involvement Procedure
Client
Project Delivery
Project Project Phases Items, Breakdown
Project Objective Product
Project Management
System
Performance Enhancement
Strategy
Performance Measurement
Performance Goals
Process Domain
Performance Domain
Input Output Process

22
The conceptual model in Figure 2.7 shows that the process domain and
performance domain are different in nature but interconnected in many ways as
parts of the whole project. Although each and every feature of the model is very
important, the performance enhancement is a critical aspect and has an impact on
performance outcomes. For that reason, focusing on client involvement in projects
and evaluating the client performance during the project stages will help to increase
the quality expected in the project delivery.
In project delivery, the construction sector has suffered through a decade of poor
design and construction performance (Flores & Chase, 2005; Post, 1998). The client
has a high impact on the construction project, which in many cases may determine
the project’s success or failure. Therefore, the client's objective is to obtain a high
quality facility through good planning, good design and good construction.
The client has three common expectations for the project delivery: (I) high quality,
(2) low cost; and (3) finished on time (Forgues, 2006). In order to plan and manage a
successful project, the three parameters of time, cost and quality should be
considered and defined by the client. Neglecting one parameter will have a
corresponding detrimental effect on the other two (Bowen, Cattel, Hall, Edwards &
Pearl, 2012). High quality means high specifications with high quality of project
management. The high quality sometimes leads to high cost with extra time and
with the risk of over-investment in the project. Therefore, the client’s objective is to
get the balance right between all these elements in order to meet their project
delivery expectations, as illustrated in Figure 2.8. The importance of the client role
was highlighted in the ASCE Quality in the Constructed Project Manual (2012). The
manual describes the high level of impact that the client has on the construction
project, which in many cases may determine the project’s success or failure.
Therefore, the client involvement in the early stages constitutes an initial phase of
the construction process and provides the link between the client and the project
(Institution of Civil Engineering, 1996).

23
Figure 2.8: Client’s role in project delivery
Whelton, Ballard and Tommelein (2002) highlighted the importance of the planning
and design stage which they considered as critical because as much as 80% of a
project can be specified in this early phase. For clients to act effectively and
efficiently in the early stage of a project, they must have rich knowledge and
adequate information about the problems as well as proficient skills to use this
knowledge and information.
It is important that designers spend time to understand the client’s business needs
and requirements from day one of the project when most of the critical decisions
made can affect the economy, efficiency, timing, functional content, appearance
and, most important of all, the real value of the project (Barrett, Hudson & Stanley,
1999; Boyd & Chinyio, 2006; Smith & Wyatt, 1998). This emphasises the importance
of the initial involvement of the client during the early stage of a project, and the
need for client control over the entire construction process in order to optimise the
project quality, cost and time. Kamara and Anumba (2001) argued that the
limitations in the existing framework in the early stages of projects can shift the
Client Role
High Specification
Over-Investment
Long Time Performance
Better Operation
Low Specification
Under-Investment
Failure in Short Time
Poor Operation
High Standard Quality Low Standard Quality
Client objective is getting the balance right between all elements
Quality
Cost
Time

24
focus away from the requirements of the client, and can result in problems during
the construction of the project.
The need to process the client’s requirements also arises from the need for
integrated strategies within the construction process, and the need for
collaborative working relationships among the project participants (Shelbourn et al.,
2007). Integration and collaboration are necessary to improve the efficiency of the
construction industry. Projects with effective communication strategies are often
more successful than those with poor communication (Kalla, 2005; Tourish &
Hargie, 2004). Good communication between all parties in the project produces
good collaboration; otherwise, the project is plagued with the problems associated
with fragmentation in the construction process.
Several researchers have recognised the problems caused by fragmentation in the
construction industry (Brandon & Betts, 1995; Evbuomwan & Anumba, 1996).
Fragmentation in the construction industry refers to a situation whereby
professionals who are involved in 'downstream' activities (e.g., contractors) are not
involved in 'upstream' decisions (design) that are passed between different
disciplines during the project. However, the use of integrated strategies, such as
design and build or concurrent engineering, requires that client needs are
processed and presented in a manner that will facilitate concurrent/collaborative
working relationships. Therefore, the clients’ key roles are to form the project team
as early as possible, to assign responsibilities and to establish high levels of
performance (ASCE, 2012). As a result, the client who leads the project team must
assign responsibility, authority, liability, contractual relationships and compensation
arrangements. This includes deciding on the desired level of quality by
communicating the requirements which result from the client's objectives.
To conclude this part, it can be summarised that clients should not be seen as
relatively passive actors in the project process. Client activities have become
increasingly more important for the project processes and project delivery (Briscoe,
Dainty, Millett & Neale, 2004; Xu & Miao, 2010). Joining the conceptual model of
project management by Toor and Ogunlana shown in Figure 2.7 with the client role
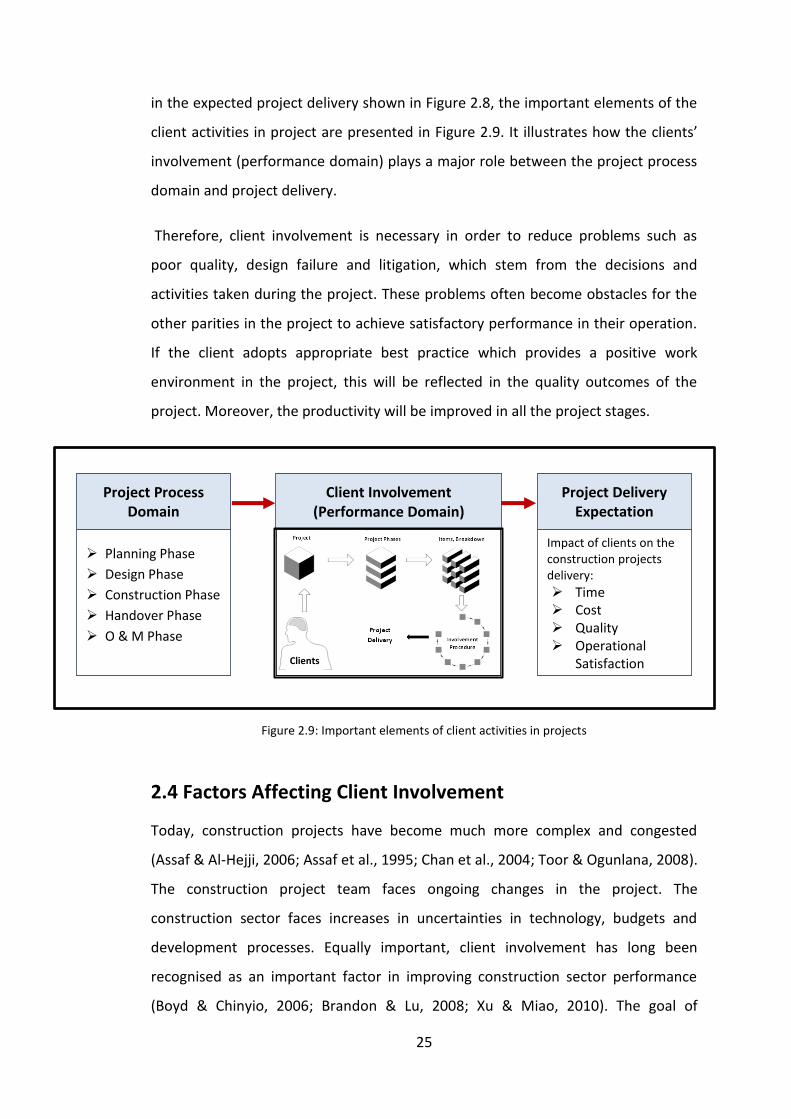
25
Project Delivery Expectation
Project Process Domain
Client Involvement (Performance Domain)
Impact of clients on the construction projects delivery:
Time Cost Quality Operational
Satisfaction
Planning Phase
Design Phase
Construction Phase
Handover Phase
O & M Phase
Clients
in the expected project delivery shown in Figure 2.8, the important elements of the
client activities in project are presented in Figure 2.9. It illustrates how the clients’
involvement (performance domain) plays a major role between the project process
domain and project delivery.
Therefore, client involvement is necessary in order to reduce problems such as
poor quality, design failure and litigation, which stem from the decisions and
activities taken during the project. These problems often become obstacles for the
other parities in the project to achieve satisfactory performance in their operation.
If the client adopts appropriate best practice which provides a positive work
environment in the project, this will be reflected in the quality outcomes of the
project. Moreover, the productivity will be improved in all the project stages.
Figure 2.9: Important elements of client activities in projects
2.4 Factors Affecting Client Involvement
Today, construction projects have become much more complex and congested
(Assaf & Al-Hejji, 2006; Assaf et al., 1995; Chan et al., 2004; Toor & Ogunlana, 2008).
The construction project team faces ongoing changes in the project. The
construction sector faces increases in uncertainties in technology, budgets and
development processes. Equally important, client involvement has long been
recognised as an important factor in improving construction sector performance
(Boyd & Chinyio, 2006; Brandon & Lu, 2008; Xu & Miao, 2010). The goal of

26
enhancing client involvement in construction projects is to improve the situation of
low involvement and find the optimum blend of scheduling, performance,
constructability, maintainability, environmental awareness, safety and cost
consciousness. Understanding the clients' attitudes and actions is also critically
important for construction professionals in collectively taking the construction
sector forward (Boyd & Chinyio, 2006). Equally important, organisational culture
plays a major role that can guide and shape behaviour (Rashid, Sambasivan &
Rahman, 2004). Therefore, it is important to identify the dominating factors that
lead to low client involvement in construction projects so that efforts can be
concentrated on those factors in order to reduce them (Brandon & Lu, 2008; Chan
et al., 2004; Chua et al., 1999; Low & Chuan, 2006; Toor & Ogunlana, 2008). The
present study investigates the reasons for limited client involvement in public
projects in Saudi Arabia in relation to the individual factors, project factors and
organisational culture factors, as shown in Figure 2.10.
Figure 2.10: Three main groups of factors that limit client involvement in construction projects
2.4.1 Individual and Project Factors
The client is defined as a key player and the client’s participation is a significant
factor in improving construction sector performance (Boyd & Chinyio, 2006;
Brandon & Lu, 2008; Xu & Miao, 2010). Thus, Walker (1995) considered the
influence of the client to be a significant factor in successful construction
performance. Understanding clients' attitudes and actions is critically important for
construction professionals in collectively taking the construction sector forward
Organisation
Cultural Factors
Project Factors
Client Involvement in
Construction Projects
Individual Factors

27
(Boyd & Chinyio, 2006). Chan et al. (2004) identified 44 factors affecting the
construction project. The attributes that are related to the client’s individual factors
include: the client’s experience and ability; the nature of the client; the size of the
client’s organisation; the client’s emphasis on cost, time and quality; and the client’s
contribution to the project. The project-related factors include the complexity of
the project, nature of the project, and size of the project. In projects which are
complex and large in size and where there is congestion between project elements,
coordination between the client and the project team is needed. The study by Chan
et al. also focuses on the project team and how to improve the effectiveness of
projects by identifying the project success and the critical success factors.
The Highway Engineering Handbook (2009) emphasised factors that can lead to a
poor quality outcome in some highway projects. Some of them are related to the
client’s attitude, including lack of information, wrong beliefs, habitual thinking,
reluctance to ask for advice, time pressures, negative attitudes, rapidly changing
technology, and poor human relations. Other factors are related to the project,
including time pressures, and poor coordination between the project team
members. Time constraints due to unrealistic project contract periods increase the
design and construction activity overlaps which results in slipped schedules, overrun
cost, low quality, and delays in the project.
The client attitude is a predisposition to respond in a positive or negative way
within the project. The client’s lack of knowledge arises from the failure to get
sufficient facts before starting the project or misunderstanding the full
requirements of the original project plan. Moreover, clients are often very reluctant
to seek advice from others in their field so sometimes their decisions are based on
“educated guesses”. In terms of age as a demographic characteristic, there is a
positive relationship between seniority and performance because older persons
have greater experience, resulting in higher skills and knowledge (Al-Yahya, 2009).
Low client experience results in a poor project output which means there is no clear
direction from the client to the project team. The clients also need to have a high
level of experience. Experience impacts on the skill level and project management
knowledge being applied in the project. Clients with more experience have a

28
greater range of knowledge of project methods, tools and techniques to manage
projects (Nutt, 2006).
Technological change is another factor that affects the client outcomes. Technology
changes rapidly in the development of processes, products and materials.
Therefore, no one person can be expected to have completely current knowledge in
any field. The lack of knowledge on technology or project management among
clients might be improved by doing training courses, attending a conference or
gaining a professional certificate related to construction projects (Sargeant,
Hatcher, Trigunarsyah, Coffey & Kraatz, 2010).
Both good communication and the ability to operate under pressure in a complex
environment were found to be important area in which clients needed to improve
their skills (White & Fortune, 2002). In view of the importance of communication in
projects, it is vital for clients to understand how communication processes work.
Clients should understand how to maximise the potential benefits of
communication and how to minimise the potential problems (Tenopir & King,
2004). Several factors may disrupt the communication process as barriers to
effective communication in the project. Client individual communication barriers
may disrupt effective communication. One common problem is language difference;
other problems include a lack of credibility about the subject, conflicting or
inconsistent cues, a reluctance to communicate, poor listening skills, or
predispositions about the subject. Paying less attention to communication will
increase the conflicts among all the parties in a project. A summary of the individual
factors and project factors used in the present study is presented in the Appendix
(Appendix C, Section C-1-3, Table C-1-3).
2.4.2 Organisational Culture Factors
Over the last decade, culture has become a mainstream topic of interest, discussion
and research within the construction industry. Organisational culture gives identity
to an organisation. It is necessary to understand the concept of organisational
culture before going deeply into the importance of organisational culture, its

29
influence on project activities in general, and its impact on client involvement in
particular.
Organisational culture has some important purposes. Firstly, it enhances the
stability of an organisation (Ashkanasy & Jackson, 2002; Cheung, Wong & Wu, 2011;
Schein, 2004). Secondly, organisational culture plays a major role that can guide and
shape behaviour (Rashid, Sambasivan & Rahman, 2004) so it can have an influential
positive effect on individuals within the organisation (Cheung et al., 2011). The
organisational culture is the set of values that helps the employees understand
what the organisation stands for, how it does things and what it considers
important. These values are set to motivate the employees in a way that is
beneficial for both the employees and employers. Organisational culture also has an
effect on project management. Parker and Skitmore (2005) found that
dissatisfaction with organisational culture is the primary reason causing project
management turnover. A number of studies seeking to find the connection between
organisational culture and performance have been reported (Bettinger, 1989;
Denison, 1990, 2000; Wilderom, Glunk & Maslowski, 2000).
Bettinger (1989) found that the development and application of organisational
culture can allow an organisation to raise performance, but failure to make use of
organisational culture can cause loss to the organisation. Bettinger identified eleven
key components of organisational culture that help to increase the employees’
performance: (1) establishing organisational goals and objectives; (2) the sense of
pride of the employees in the mission set by the company; (3) the employees’
attitudes towards any change in the goals; (4) the degree of openness in
communication, supervision and information sharing among team members; (5) the
degree of openness in communication and supervision; (6) the employees’
commitment to the organisation; (7) the avoidance of a dysfunctional performance
outcome by reducing the conflicts and enhancing the trust; (8) the level of the
employees’ participation in the decision-making process; (9) the establishment of
performance standards and values that contribute to success; (10) a good
environment to support and reinforce values; and (11) the presence of a rewarding
scheme to recognise good performance.

30
According to Ashkanasy and Jackson (2002), seven characteristics give a picture of
where an organisation stands culturally: (1) innovation and risk-taking, (2) attention
to detail, (3) outcome orientation, (4) people orientation, (5) team orientation, (6)
aggressiveness, and (7) stability. Innovation and risk-taking refer to the degree to
which the employees are encouraged to be innovative and risk-taking. Attention to
detail refers to the degree to which employees are expected to exhibit precision,
analysis and attention to detail. Outcome orientation refers to the degree to which
management focuses on results or outcomes, rather than on the processes used to
achieve these outcomes. People orientation refers to the degree to which
management decisions take into consideration their impact on people. Team
orientation refers to the degree to which work activities are organised around
teams rather than individuals. Aggressiveness relates to the degree to which people
are aggressive and competitive, rather than easy-going. Stability refers to the
degree to which organisational activities emphasise maintaining the status quo in
contrast to change and growth.
Denison (2000) developed the Denison Organisational Culture Model to evaluate
the culture of organisations. The model is based on four traits that have been
shown to have a strong influence on organisational performance: (1) involvement,
(2) consistency, (3) adaptability, and (4) mission. Each trait is further measured by
three indices and total of 12 indices. Coffey (2002) applied the Denison
Organisational Culture Model to measure the culture of contractors in Hong Kong.
The findings indicated that not all the attributes proposed by Denison (1990) had
positive and significant effects on the contractors' performance.
Cheung et al. (2011) discussed the use of organisational culture in relation to
construction project management by linking them with performance (involvement).
They used the important findings from previous organisational culture models to
identify the organisational culture in construction. The previous studies seeking to
relate organisational culture and performance were reviewed (including: Bettinger,
1989; Cameron & Quinn, 1999; Coffey, 2002; Denison, 1990; Fulmer, 1988; Hansen
& Wernerfelt, 1989; Hofstede, 1983; LIU, 1999; Woodcock & Francis, 1989). Cheung
et al. identified seven groups of organisational culture factors, as summarised in

31
Table 2.4. They determined that the existence of a strong culture in an organisation
results in the creation of a better feeling for the staff and ultimately results in better
performance, increased staff commitment and closer alignment with organisational
goals. A summary of all the organisational culture factors used in the present study
is presented in the Appendix (Appendix C, Section C-1-3, Table C-1-3).
Table 2.4: Organisational culture factors in construction (Cheung et al., 2011)
Organisational Culture Factors
Goal settings and accomplishment
Clear goals
Actions are matched with organisation's goals
Clear approach to succeed
Team orientation Emphasise team contributions
Amicable exchange opinions and ideas
Members' commitment to the team
Coordination and integration Encourage information sharing
Resolve internal problems effectively
Encourage inter-departmental collaboration
Performance emphasis Explicit set of performance standards
Guidance for performance improvement
Emphasise good performance
Innovation orientation Welcome alternative solutions
Encourage creative and innovative ideas
Allocate resources for implementing innovative ideas
Members' participation Value employees' ideas
Employees' participation in decision-making process
Employees' input on major decisions
Reward orientation Recognise and reward members' performance
Trust atmosphere
Accept criticism and negative feedback
Emphasise team accountability
Equitable reward
2.5 Conceptual Framework
This section presents the conceptual framework or preliminary model of the
present study. The final model is presented in Chapter 6 after the preliminary data
analysis. The conceptual framework is based on the findings of the previous
discussion in this chapter. It creates the foundation and highlights the relationship
between all the elements within the scope of the present study.
Figure 2.9 illustrates the important elements of the client activities in construction
projects, showing how the client involvement (performance domain) plays a major

32
role between the project process domain and project delivery. Client involvement in
the construction process should identify and adopt an effective practice that
contributes to high quality outcomes in respect of their relevant involvement in the
construction process. Therefore, enhancing the client involvement is necessary to
improve quality outcomes and establish the optimum blend of scheduling,
performance, constructability, maintainability, environmental awareness, safety
and cost. The present study investigates the factors involved in the limited client
involvement in public projects in Saudi Arabia in relation to the individual factors,
project factors and organisational culture factors. The study also evaluates the
effects of certain demographics on these relationships. These include the
respondents’ project ownership and project type. The conceptual framework is
presented in Figure 2.11.
Figure 2.11: Conceptual framework of client involvement
Project Delivery Expectation
Project Process Domain
Client Involvement (Performance Domain)
Impact of client on the construction projects delivery:
Time Cost Quality Operational
Satisfaction
Planning Phase
Design Phase
Construction
Phase
Handover Phase
O & M Phase
Project Factors Individual Factors Organisational Culture Factors
Demographic
Project ownership Project type
- Public - Semi-Public
- Building - Infrastructure - Industrial - Other
Client

33
2.6 Summary
This chapter reviewed and presented the research literature. It provided a
background overview of the construction sector, economic profile, and status of
client practices in the construction sector in Saudi Arabia. It is found that Saudi
Arabia has a very strong economy. In the last five years, Saudi Arabia has
experienced a construction boom with over 16,500 public projects. On the other
hand, Saudi Arabia has failed to make real progress in achieving good management
and organisational performance; this was demonstrated in the number of delayed
projects that increased from 700 projects in 2009 to 3000 projects in 2013.
To improve the level of client involvement and ensure more positive outcomes in
construction projects, the present study develops a conceptual framework
(preliminary model) associated with the study’s goals based on the literature
review. The model illustrates the significant relationship between all the elements.
The model links three groups of factors that limit and impact the client involvement
during the construction project activities. These are categorised as: (1) individual
factors, (2) project factors, and (3) organisational culture factors. The model also
evaluates the effects of certain demographics on these relationships. These include
the organisation type and the type of typical contract used. The next chapter
presents a detailed discussion on the research methodology applied in this study
based on the findings from the literature review.

34
CHAPTER 3 RESEARCH DESIGN AND METHODOLOGY
3.1 Introduction
The previous chapter reviewed the relevant literature related to client involvement.
Client involvement has long been recognised as an important factor in improving
project delivery in the construction sector. The client is the link between the project
process domain and project delivery, as presented in the preliminary conceptual
framework in Chapter 2 (Figure 2.11). The present study investigates the ideal of
enhance client involvement in the construction project processes and aims to
develop a model (or models) in order to improve the situation and ensure more
positive outcomes in construction project delivery.
This chapter discusses the research methodology applied in the present study. The
research methodology refers to the set of processes that are used to collect and
analyse data (Leedy & Ormrod, 2001). Mingers (2001) defined the research
methodology as a “structured set of guidelines or activities to assist in generating
valid and reliable research results”. This chapter explains and justifies the
methodology adopted in this research as well as the link between the research
questions and outcomes.
3.2 Research Problem
As discussed in the literature review (Chapter 2, Section 2.2.3), the construction
sector in Saudi Arabia has faced many challenges during the recent construction
boom. Due to the current practices, the challenges are the lack of real progress in
achieving good management and organisational performance, variability in quality
among the projects of government origination, increases in project delays, cost and
time overruns, lack of planning and design, and weak supervision by the responsible
government agency of the construction project processes. In addition, much of the
research on organisational performance in developing countries in general, and in
the Arab countries in particular, has identified problems related to ineffective

35
project outcomes (Al-Kharashi & Skitmore, 2009; Al-Sedairy, 1994; Ali, 1993) and
low productivity (Alkahtani, 2000). Therefore, clients can no longer be seen as
relatively passive actors in the project processes in Saudi public construction
projects. The goal of enhancing the client involvement in construction projects is to
improve the situation of low involvement and establish the optimum blend of
scheduling, performance, constructability, maintainability, environmental
awareness, safety and cost consciousness.
The client is one of the main players in successful project delivery (Chua et al., 1999;
Ryd, 2004; Xu & Miao, 2010). Moreover, as discussed in the literature review
regarding the nature of effective client involvement (Chapter 2, Section 2.3.2),
client activities in projects have become more important for the project processes
and project delivery (Briscoe et al., 2004; Xu & Miao, 2010). The degree of client
involvement is based on making the right decision at the right time during the
construction project processes.
Making the right decision is typically not a simple matter as most decisions in
construction projects are highly complex in nature. This complexity is due to a
number of factors, either in the construction process or in management, that affect
project success and cause project failure. Therefore, knowing these factors can be
helpful for analysing the potential reasons for project success or failure (Low &
Chuan, 2006). Understanding clients' attitudes and actions is also critically
important for construction professionals in collectively taking the construction
sector forward (Boyd & Chinyio, 2006). Equally important, organisational culture
plays a major role that can guide and shape individuals’ behaviours (Rashid et al.,
2004). Therefore, the present study investigates the reasons for the limited client
involvement in public projects in Saudi Arabia by focusing on the relevant factors in
the categories of: (1) individual factors, (2) project factors, and (3) organisational
culture factors. As discussed in Chapter 2 (Section 2.4), the literature including
works by Chan et al. (2004), the Highway Engineering Handbook (2009), Sargeant et
al. (2010), White and Fortune (2002) and Cheung (2011), has identified many
factors that are related to these three groups. Brandon and Lu (2008) pointed out
that it is important to identify the dominant factors that lead to low client

36
involvement in construction projects so that efforts can be concentrated on those
factors in order to reduce them and improve the client involvement.
This study aims to improve the client involvement in project processes, in order to
ensure more positive outcomes in construction project delivery. Based on this aim,
the following four (4) research questions are established:
1. What is the current practice of client involvement in Saudi construction
projects?
2. What is the impact of client involvement on project performance?
3. What are the main factors that affect client involvement?
4. How do those factors influence the client involvement and lead to improved
project performance?
In attempting to answer the research questions, this research is directed by the
following objectives:
1. To understand the current practice of client involvement in Saudi construction
projects.
2. To identify the impact of the current client involvement practices on the delivery
of construction projects in Saudi Arabia.
3. To identify and examine the factors which influence the client involvement in
public projects in Saudi Arabia in the categories of: (1) individual factors, (2)
project factors, and (3) organisational culture factors.
4. To develop a conceptual model of the relationship between client involvement
and the three categories of factors; to identify the relationship between client
involvement and the three categories of factors; and to develop an instrument
for measuring and diagnosing the client involvement and the three categories of
factors.

37
3.3 Research Design
In its simplest form, the research design is a “structured set of guidelines or
activities to assist in generating valid and reliable research results” (Mingers, 2001).
The research design sets out the plan and procedures for the research, including
some decisions, assumptions and detailed methods of data collection and analysis.
Research is also a process of relationships amongst the variables considered to
expand existing knowledge for some specified purpose. Furthermore, research can
also be seen as a process to explore, describe, understand, explain, predict, change
and evaluate the findings (Zikmund, Babin, Carr & Griffin, 2010). Creswell (2009)
identified the research design as a plan or proposal to research which is based on
three elements: the philosophy paradigms, strategies or approaches of the research
inquiry, and the specific methods used in the research.
Regarding the philosophy paradigms, four different paradigms were presented by
Creswell (2009) and Denzin and Lincoln (2011): (1) positivism, (2) constructivism, (3)
participatory, and (4) pragmatism. One of the philosophical paradigms used in the
traditional form of research is the positivist paradigm (also called positivist
research) (Denzin & Lincoln, 2011). The positivist research uses a systematic,
scientific approach to research (Hughes, 2001). Burrell and Morgan (2005) defined
positivist research as research "which seeks to explain and predict what happens in
the social world by searching for regularities and causal relationships between its
constituent elements". Positivist researchers also hold a deterministic philosophy in
which causes are believed to determine effects or outcomes (Creswell, 2009). One
of the major goals of using positivism in the present research is to obtain valid and
reliable knowledge as a set of universal principles that can explain, predict and
control human behaviour across the target sample. Thus, the positivist researcher
takes a controlled and structural approach to conducting research by initially
identifying a research topic, constructing appropriate research questions, adopting
a suitable research approach, collecting data, and analysing and interpreting the
relationships between the variables.

38
Any research study aims to identify factors that influence an outcome in order to
find the causes; the positivist research is sufficient (Creswell, 2009). Since the aim of
the present research is to investigate the factors that limit the client involvement
during the construction project processes, which has an effect on the outputs in
construction project delivery, and based on the research questions presented in the
previous section, this study adopts the positivist research approach.
The second element in a research methodology is the strategies or approaches of
the research inquiry. The strategy of the research inquiry is the type of method
used that provides a specific direction for the procedures in a research design
(Creswell, 2009). During the late 19th and throughout the 20th century, strategies
of inquiry associated with quantitative research were closely linked to positivist
research (Robson, 2011). More recently, quantitative strategies have involved
complex studies with many variables explored through surveys (Bryman & Cramer,
2009). As the present study investigates the factors that limit the client involvement
in Saudi Arabian construction projects, the quantitative approach is used.
The last element is the research methods that involve the forms of data collection,
analysis and interpretation to create the output of the research. The research
design process to achieve the aim of the present study is presented in Figure 3.1. A
research design represents the “master plan that specifies the methods and
procedures for collecting and analysing the needed information” (Zikmund et al.,
2010). The research design was divided into three stages based on the purpose of
the present study.

39
Literature Review
Research Questions Aim
State of Knowledge
Gap
Topic (Need to Study)
Conceptual Framework
Research Approach Selection (Quantitative method)
Questionnaire Development
Ethical Issues
Data Collection
Validity Reliability
Data Analysis
Data Analysis Methods: Inferential Statistical Analysis + SEM: - SPSS - AMOS
Output Answer RQ
Data Interpretation
Final FRAMEWORK
Research Process Gap Investigation RQ Knowledge Investigation Research Discussion and Conclusion
Stage One Stage Two
Stage Three
Figure 3.1: Research design process, (developed for this research)
Stage one involves providing an accurate description of the problem but does not
involve providing an explanation for the cause of the problem (Zikmund et al.,
2010). In the present study, an intensive literature review (Chapter 2) was
conducted to identify the research gaps/problems and describe the characteristics,
which allows a better understanding of the topic. It confirmed the need to
investigate the client involvement in construction projects in Saudi Arabia. The
research aim and research questions were then identified. The gap investigation
explored the studies done in relation to the research aim in order to find the
missing elements in the existing research literature. Then, the published sources
were used to formulate the research problem which is the most important step. The
literature review helped to establish the roots of the topic and helped to integrate
the findings with the existing body of knowledge. The literature review focused on
the Saudi construction background and the client involvement practices. At this
stage, the characteristics and conceptual model were described, as presented in
Chapter 2 (Section 2.5 and Figure 2.11).

40
Stage two involves discovering the evidence and gaining background information
about the research problem. It is provides a better understanding of the problems
from many dimensions (Zikmund et al., 2010). In the present study, a quantitative
method is used in this stage. Quantitative methods stress the measurement and
analysis of causal or correlational relationships between variables (Denzin & Lincoln,
2000). In the present study, the questionnaire covers the first three main research
questions. The questionnaire explores the evidence and provides a better
understanding of the impact of client involvement on project delivery in relation to
three groups of factors (individual, project, and organisational culture) based on the
current client involvement practices in construction projects in Saudi Arabia.
Stage three identifies the cause and effect relationship between the variables. This
stage involves the forms of data collection, analysis and interpretation as discussed
in the following sections. It also generally requires the development of a conceptual
framework to be able to understand and predict the relationships (Zikmund et al.,
2010). The present study aims to measure the impact or effect of the relationships
between the individual, project and organisational culture factors related to client
involvement in construction projects in Saudi Arabia. The conceptual framework is
also used to observe whether the chosen factors could change or cause either
positive or negative effects on client involvement in project delivery. In this stage,
SEM and the AMOS application are used to build up the model’s fit and examine the
cause and effects in the relationships among the variables in the research model.
3.4 Survey
The survey method is one of the most common tools used to collect primary data
from a representative sample of individuals (Creswell, 2008). The questionnaire
refers to a set of carefully designed questions that are given to a group of people in
exactly the same form in order to collect the required data about a topic (Jupp,
2006). The questionnaire can be used as an appropriate and accurate way to verify
the tendencies of the participants (Fraenkel & Wallen, 2000).

41
3.4.1 Questionnaire Development
For the purpose of the present study, a questionnaire was constructed from the
literature by establishing questionnaire items to fit the objectives of this research. It
is important for an effective questionnaire to recognise the objective of the
question and the nature of the answer through the questionnaire’s construction (De
Vaus, 2002b). The development of the questionnaire in this study followed Leedy’s
(1997) four practical guidelines, which are: using clear language, meeting research
aims, planning development including distribution and collection, and creating a
solid cover letter. Thus, in order to have clear language as well as clear
understanding for the questionnaire, the survey was written in two languages
(English and Arabic) which is appropriate for the participants. A translation method
was developed (as discussed later in Section 3.4.3). Close-ended questions with
ordinal and nominal scales were employed to make the questionnaire as easy to
complete as possible. Instructions were also provided at the beginning of each
section for completing the questionnaire.
The questionnaire consisted of three main parts and had a total of 100 items. Part 1
(8 items) was designed to obtain some demographic information about the
participants. Part 2 (41 items) was designed to identify the degree of client
involvement in construction projects. Part 3 (51 items) was designed to identify the
factors that influence client involvement in construction projects. Table 3.1 presents
the content of the questionnaire in more detail.

42
Table 3.1: Content of the questionnaire
Part Code Description No. of items
Objective
Part 1 Part_1 Demographic 8 General information about the participants
Total items in Part 1 8
Part 2 Part_2 Current client involvement practices Review current practices of client involvement in project processes in public construction projects in Saudi Arabia
Part_2_A Planning Phase 11
Part_2_B Design Phase 11
Part_2_C Construction Phase 11
Part_2_D Handover Phase 3
Part_2_E O & M Phase 4
Part_2_F The most important phase 1 Implement the most important phases in project process in order
Total items in Part 2 41
Part3 Part_3 Factors effecting the client involvement
Identify the factors that influence the clients’ involvement in public projects in Saudi Arabia Part_3_A Individual Factors 19
Part_3_B Project Factors 5
Part_3_C Organisational Culture Factors
23
Part_3_D Project Delivery Expectations 4 Identify the impact of the current client involvement practices on the delivery of construction projects in Saudi Arabia
Total items in Part 3 51 Total items of questionnaire = 100
The questions in the questionnaire needed to be linked to the research problem
and research questions related to the field of study. Each part of the questionnaire
had many items or measurements based on the comprehensive literature review
presented in Chapter 2. The aim of Part 1 of the questionnaire was to obtain
general information about the participants through questions on: organisation type,
age, education level, developing knowledge, experience, typical projects done, and
types of project contracts used.
The aim of Part 2 was to review current client involvement practices in project tasks
in public construction projects in Saudi Arabia. The project tasks were identified
based on the existing literature in Chapter 2 (Sections 2.3.1 and 2.3.2). Involvement
was determined by the degree to which the project team fulfilled their
responsibilities in each phase of the total construction process (Bubshait, 1994;
Chan et al., 2004; Forgues, 2006; Parker & Skitmore, 2005; Shelbourn et al., 2007;

43
Toor & Ogunlana, 2008). Therefore, Part 2 was divided into five sections: “A-
Planning Phase”, “B- Design Phase”, “C- Construction Phase”, “D- Handover Phase”,
and “E- Operations and Maintenance Phase”. Each phase has some elements
related to the client duty and responsibility. These tasks was adopted from the
Quality in the Constructed Project Manual published by ASCE (2012) and from
Bubshaite et al. (1992). All the phases and their tasks in detail are presented in the
Appendix (Appendix C, Table C-1-2).
The aim of Part 3 was to identify the factors that influence the client involvement in
public projects in Saudi Arabia in relation to three groups of factors: (1) individual
factors, (2) project factors, and (3) organisational culture factors. As stated above,
understanding clients' attitudes and actions is critically important for construction
professionals in collectively taking the construction sector forward (Boyd & Chinyio,
2006). In addition, organisational culture plays a major role that can guide and
shape the behaviour of the client. Therefore, the questionnaire included 47 factors
that were identified in the literature (Sections 2.4.1 and 2.4.2) and grouped in the
three categories. The individual group was composed of 19 factors, the project
group was composed of 5 factors, and the organisational culture group was
composed of 23 factors. The 47 factors in the three groups are presented in the
Appendix (Appendix C, Table C-1-3).
3.4.2 Scale
A Likert scale is a psychometric scale commonly involved in research that employs
questionnaires. It is the most widely used approach to scaling responses in a survey.
Five ordered response levels are often used (Dawes, 2008), although many
researchers use seven or nine levels. In the present study, the questionnaire used a
closed-ended Likert scale with 5 response levels. In Part 2 of the questionnaire, a 5-
point Likert scale ranging from “Not involved=1” to “Strongly involved =5” was used.
In Part 3 of the questionnaire, a 5-point Likert scale ranging from “Strongly
disagree=1” to “Strongly agree=5” was used. The advantages of using a Likert scale
are that it is simple to construct, likely to produce a highly reliable scale, and is easy
for participants to read and complete.

44
3.4.3 Questionnaire Closed Loop Back-Translation
The purpose of translating a questionnaire to a different language is to "ask the
same questions" (Harkness, Van de Vijver & Mohler, 2003) regardless of the
language used. A researcher should also aim to ensure the equivalence, clarity and
understanding across all translated questionnaire versions. Since the present study
focused on Saudi public construction projects, the questionnaire was written in two
languages: English and Arabic. This study adapted the Coffey methodology (2010)
which uses a back-translation technique.
The basic steps of the back-translation technique start with translating the original
questionnaire into another language (Questionnaire in Arabic, version#1) by the
first translator. Then, the questionnaire in Arabic (version#1) is translated back into
the English language (Questionnaire in English, version#1) by the new second
translator. The new third translator translates the questionnaire in English
(version#1) to the questionnaire in Arabic (version#2). Then, the questionnaire in
Arabic (version#2) is translated back into the English language (Questionnaire in
English, version#2) by the new fourth translator.
In general, back-translation can be expected to miss much and has faced criticism
(Forsyth, 2006). Practically, it is likely but not necessary that there is a major
difference between the original questionnaire and the translated version (Harkness
et al., 2003). Therefore, the present study added one more step to the back-
translation technique as shown in Figure 3.2. An expert translator was used to
develop the final questionnaire in English after comparing the original version with
the last version of the questionnaire in English (Questionnaire in English, final
version). The questionnaire in English (final version) was then translated into the
Arabic language and all three Arabic questionnaire versions were compared in order
to develop the final one (Questionnaire in Arabic, final version). This new step
closed the series of steps in the back-translation technique; therefore, the
technique was called the “closed loop back-translation” (CLBT) (Figure 3.2).

45
Figure 3.2: Closed loop back-translation (Modified Coffey technique, 2010)
3.4.4 Pre-Testing the Questionnaire
Zikmund (2010) defined pre-testing (or pilot testing) as the administration of a
questionnaire to a small group of respondents, which allows researchers to detect
ambiguity or bias in the questions. It is essential that the questionnaire components
are tested in realistic situations to ensure that the data collection will work. In the
present study, the questionnaire was formulated to be clear and short because a
long questionnaire may prevent participants from responding. Length is considered
to be a factor for an increased non-response rate (De Vaus, 2002b).
The pre-testing sample should be a group of respondents selected from the same
target sample population (Creswell, 2008; Zikmund et al., 2010). Therefore, the pre-
testing respondents should not be too divergent from the actual respondents.
In order to evaluate the clarity of the questionnaire, as well as the feasibility of the
survey as a whole, a pilot survey was conducted in order to identify any further
need of revision. A sample of 9 respondents was selected to complete the survey in
order to test the content validity of the questionnaire items. The questionnaires
were distributed in both languages (Arabic and English) based on the preference of
Questionnaire in English (Original)
Questionnaire in Arabic
(Version #1)
Questionnaire in English
(Version #1)
Questionnaire in Arabic
(Version #2)
Questionnaire in English
(Version #2)
Questionnaire in Arabic
(Final Version)
Compare
Compare Compare
2nd New Translator
1st New Translator
3rd New Translator
4th New Translator
Final Expert Translator
Questionnaire in English
(Final Version)
Compare

46
the participant. The participants were given material informing them of the purpose
and conduct of the research, the likely time it would take to complete the
questionnaire, assurance that the information provided would be confidential, and
a statement that the participation was voluntary and that their consent was
assumed by their completion and submission of the survey instrument.
From the feedback provided by respondents, the average time taken to complete a
questionnaire was approximately 13 minutes. It was therefore considered
unnecessary to reduce the overall number of questions in the questionnaire to
make it shorter.
A few changes were made on the questionnaire based on the pilot study. These 9
respondents, after participating in the pre-test, did not participate in the final
survey sampling. The final questionnaires in both languages (English and Arabic) are
presented in Appendices A and B.
3.5 Sample Design and Size
Sampling design and procedure are an important issue for the research design. De
Vaus (2002a) suggested that good sampling and questionnaire design should lead to
an 80% response rate. In selecting a valid and efficient sample for the present study,
the sampling procedure as outlined in seven stages developed by Zikmund (2010)
was followed and modified, as shown in Figure 3.3.
Stage one (Figure 3.3) starts with the identification of the population that the
researcher wishes to investigate (Sekaran, 2003). The target population is the
specific complete group relevant to the research project. Since the present study
targets the public construction projects in Saudi Arabia, the target population for
this research was defined as the government agencies involved in public
construction projects in Saudi Arabia. The questionnaires were distributed in the
head quarter (HQ) of organisations government and ministries that involved in the
most public construction projects in Saudi Arabia. All the HQs of organisations
government are located in capital city of Saudi Arabia “Riyadh”.

47
After the target population has been identified, the next step, in stage two (Figure
3.3), is creating the sample frame. According to Sekaran (2003), a sample frame is
the list of elements in the population from which a sample of study may be drawn;
it is also known as the working population. In this research, the sample frame was
the clients (project engineers in different fields) who represented the government
in public construction projects.
Figure 3.3: Sampling designs and sampling procedures
In stage three (Figure 3.3), it is very important to determine the sampling method
after creating the sample frame. There are two methods of approach. These are the
probability and non-probability approaches. Probability is a sampling technique in
which every member of the population has a known, nonzero probability of
selection. Non-probability is the sampling technique in which the units of the
sample are selected on the basis of personal judgment or convenience; the
probability of any particular member of the population being chosen is unknown.
Stage 7: Conduct Fieldwork
Stage 3: Determine Sampling Method (Probability or Nonprobability)
Stage 4: Plan for Selecting Sampling Units
Stage 5: Determine Sample Size
Stage 6: Select Sampling Units
Stage 1: Define the Target Population
Stage 2: Select a Sampling Frame
Distribute the survey questionnaire to the population identified (Data collection)
Non-probability Sampling selected Using convenience sampling technique
Plan for: Sample size, accuracy, time, resources, and analysis
Sample Size = 315 [In the present study, supposed each organisation received
15 surveys so the total sample: 1521=315]
Surveyed 315 of clients For 21 government agencies in Saudi Arabia
Public Projects In government agencies in Saudi Arabia
Clients who represented Saudi government in public projects

48
The samples are also gathered in a process that does not give all the individuals in
the population equal chances of being selected.
Due to the limitations of time and cost, the present study was conducted based on
a sample representation of the target population. The study used a convenience
sampling technique as it included participants who were available and willing to
participate in the study. Convenience sampling is a non-probability sampling
technique where subjects are selected because of their convenient accessibility and
proximity to the researcher. Researchers generally use convenience samples to
obtain a large number of completed questionnaires quickly and economically
(Zikmund et al., 2010). In the present study, clients are the participants of the target
sample drawn from the government agencies in Saudi Arabia.
After defining public projects as the target population, clients as the population
frame and the non-probability sampling method with convenience sampling as the
technique to be used, stage four (Figure 3.3) involves planning the sample. The
sampling plan is outlined to determine the procedures in selecting sample size, and
the methods in collecting data from the samples are studied in terms of timing and
accuracy. The present study used a survey method in the form of a questionnaire to
collect data within a twelve week collection period. The data were checked and
adjusted to prepare for coding and transfer to data storage. The purpose of
checking and adjusting data is to ensure the completeness, accuracy and reliability
of the data before analysis, as discussed in detail below in Section 3.7.1.
In stage five (Figure 3.3), the sample size is determined. The sample size is the
selected number of people to be chosen to represent the population. The sample
should be large enough to answer the research questions (Zikmund et al., 2010). For
the purpose of this study, each government agency supervising a public
construction project usually has between 8 to 12 clients (project engineers)
involved in the construction project processes, so providing 15 copies of the
questionnaire per agency was suitable. Expansion of the sample size was also
considered by using personal recommendations and references if any. With a total
of 21 government agencies targeted, the total copies of the survey that needed to

49
be distributed was: 15 questionnaires for each agency 21 government agencies =
315 questionnaires to be distributed. The sample size of 315 participants was
manageable in terms of the size, cost and time. A total of 223 participants
responded to the questionnaire.
The present study used the SEM technique which is sensitive to the sample size. The
SEM technique requires that the data should be normally distributed and free from
missing values and outliers. A reasonable sample size as recommended by Hoogland
and Boomsma (2001; 1998) is N = 200. Therefore, the 223 responses to the
questionnaire was an adequate size to go forward in the use of the SEM approach.
In stage six (Figure 3.3), the researcher should select the sampling unit to study
before proceeding to conduct the data collection (Zikmund et al., 2010). The
sampling unit is a single element or group of elements subject to selection in the
sample (Zikmund et al., 2010). Since the present study targeted the clients who
represented government agencies in public construction projects, the survey of the
315 clients represented the sample units for the present study.
In stage seven (Figure 3.3), the researcher is ready to proceed with data collection
and to distribute the survey to the population identified in the form of a
questionnaire.
3.6 Ethical Considerations
Ethical considerations are important in academic research, as in any other field of
human activity (Creswell, 2008). Ethical considerations in terms of integrity,
confidentiality and anonymity were addressed in the current study. For example,
the purpose of the survey was explained to the participants, along with assurances
regarding the confidentiality of the responses.
Ethical considerations were addressed in this research by following the Queensland
University of Technology guidelines. An application including the questionnaire used
in this research was made to the University Human Research Ethics Committee for

50
approval according to the University’s code of research ethics. The application was
approved on November 30, 2012 (Approval Number 1200000592).
3.7 Data Analysis
Raw data cannot be used to answer research questions until the data are converted
into a format that can be analysed (Zikmund et al., 2010). This section discusses the
link between the finding and the research questions. It also identifies whether the
desired outcomes were achieved to establish an understanding or answer the
research questions. This section is divided into three parts: preliminary data
analysis, descriptive analysis, and inferential statistical analysis.
Preliminary data analysis includes coding the data, screening the outliers, and
checking the normality distribution, validity and reliability. The description analysis
was used to describe and summarise information about the characteristics of the
sample. The methods for inferential statistical analysis include Kruskal-Wallis and
Mann-Whitney tests, factor analysis (FA) and SEM. These techniques can also be
used to establish the relationships among variables. All these procedures are
discussed in the next section.
3.7.1 Preliminary Data Analysis
Preliminary data analysis is a process of checking and adjusting the raw data into a
format that can be used for advanced analysis. This process includes coding the
data, screening the outliers, and checking the normality distribution, validity and
reliability. In the present study, the Statistical Package for Social Sciences (SPSS)
version 21 was used to analyse the data.
Coding Data
Coding is the process of identifying the data from the questionnaires using
numerical scores or other character symbols (Sekaran, 2003; Zikmund et al., 2010).
As can be seen from the questionnaire (Appendix A), there was a mixture of
nominal, ordinal and scale data. The questionnaire had three parts, as explained in
the previous section. The questionnaire used closed-ended Likert scales with 5

51
response levels in Part 2 and Part 3. The purpose of Part 2 was to identify the
degree of client involvement in public construction project; on this scale, “not
involved” was coded as 1 and “strongly involved” was coded as 5. The aim of Part 3
was to investigate the reasons for limited client involvement and participation in
public construction projects in relation to individual factors, project factors and
organisational culture factors; on this scale, “strongly disagree” was coded as 1 and
“strongly agree” was coded as 5. Since the total of variables in the questionnaire is
100 items, it is adequate to code each variable. Therefore, the research coding
system of the present study is presented in Figure 3.4. Each item has a character
symbol code as shown in Appendix C (Section C-1).
Figure 3.4: Research coding system
Screening the Outliers
An outlier is an observation that lies an abnormal distance from other values in a
data sample. Outliers can also lead to important changes in results when
researchers use statistical methods that rely on maximum likelihood estimators
such as regression, SEM and multilevel modelling (Byrne, 2001; Cohen, Cohen, West
& Aiken, 2003; Kutner, Nachtsheim, Neter & Li, 2004). Aguinis et al. (2013) reviewed
46 methodological sources and identified a list of 14 outlier definitions, 39
techniques, and 20 ways to handle these techniques. This gives an idea of how
important it is to identify the outliers and the impact of untreated outliers on the
statistical tests. The box plot is a useful graphical tool and one from many
techniques to identify outliers (Sheskin, 2010). Treating the outlier will improve the
replicability of essential results (Aguinis et al., 2013; Aytug, Rothstein, Zhou & Kern,
2012). One way to treat the outliers is to delete the outliers from the data (Shi &
Part?_?_?
Part number
Section number Item number
Examples Part2_A_7 Part3_C_11 Part2_E_3 Part1_D_5

52
Chen, 2008). One disadvantage associated with removing outliers from the data is
the reduction of the sample size, which reduces the accuracy of any statistical test
conducted. Another way is keep the outliers; however, this will lead to the risk of
obtaining more values that do not accurately represent the sample population
(Yuan & Zhong, 2008). Sheskin (2010) and Reifman et al. (2010) recommended a
technique to treat the outliers based on replacing the extreme value (low or high)
to the closest value in each tail of the distribution. The advantage of this technique
is the data have the same original sample size and the treated outlier values correct
the skewed data. The present study used this approach to treat the outlier data.
Checking the Normality Distribution
Normality tests are statistical procedures designed to test whether the underlying
distribution of the data is normally distributed. A critically important assumption in
the conduct of SEM analyses in general, and in the use of AMOS in particular
(Arbuckle, 2007), is that the data are normal. There are two ways of testing
normality: graphical methods and numerical methods. Graphical methods are
intuitive and easy to interpret, while numerical methods provide objective ways of
examining normality. Table 3.2 presents a summary of the two methods as listed by
Park (Park, 2008). D'Agostino (1990), Stevens (2012) and Tabachinick and Fidell
(2007 ) suggested that the skewness and kurtosis statistic are excellent descriptive
shape characteristics of the data distribution and inferential measures for
evaluating normality. West et al. (1995) proposed a reference of substantial
departure from normality as an absolute skewness value greater than 2 and kurtosis
value greater than 7.
Table 3.2: Normality data tests listed by Park (2008)
Graphical Methods Numerical Methods
Descriptive Stem-and-leaf plot box plot dot plot, histogram
Skewness Kurtosis
Theory-driven P-P plot Q-Q plot
Shapiro-Wilk, Shapiro- Francia test Kolmogorov-Smirnov test (Lillefors test) Anderson-Darling/Cramer-von Mises tests Jarque-Bera test, Skewness-Kurtosis test

53
Validity and Reliability
Validity and reliability are two essential characteristics of a good measurement tool
(Groth-Marnat, 2003). Before going further in research, it is important to know that
the selected variables and their measures are valid and reliable (Hair, Anderson,
Tatham & Black, 2010).
Content validity was examined in this study by developing the questionnaire from
the literature review and sending it to a group of sample respondents and asking
them to check for clarity and content. Based on the feedback, revisions were made
of the questionnaire.
Reliability is a major concern when a psychological test is used to measure some
attribute. Therefore, without reliable measures, the data cannot be tested and the
output result is not as accurate as needed to help in developing and improving the
research objectives (DeVellis, 2012). At the most basic level, there are three
methods that can be used to evaluate the reliability of a scale: inter-item
correlations, Cronbach's alpha, and corrected item-total correlations (Iacobucci &
Duhachek, 2003). Cronbach's alpha is the most commonly used metric used to
evaluate the reliability (Gliem & Gliem, 2003). The Cronbach alpha reliability
coefficient normally ranges between 0 and 1. Nunnaly and Bernstein (1994) and
Kline (2013) stated that the Cronbach alpha value of 0.7 is regarded as a minimum
figure for an adequate test. On other hand, George and Mallery (2003) suggested
that a Cronbach alpha value greater than 0.5 indicates poor reliability but is
acceptable. Table 3.3 presents a summary of the reliability level considerations in
relation to the Cronbach alpha values, including the parameters followed in this
study.
Table 3.3: Reliability level considerations
Cronbach Alpha Values
Reliability level considered
George and Mallery (2003, p.203)
Multon and Coleman (2010)
Present study
> 0.9 Excellent High High
> 0.8 Good Very good Very good
> 0.7 Acceptable Good Good
> 0.6 Questionable Unacceptable Unacceptable
> 0.5 Poor Unacceptable Unacceptable
< 0.5 Unacceptable Unacceptable Unacceptable

54
The Cronbach alpha formula incorporates the number of items on the test so the
greater the number of items, the greater the value of the Cronbach alpha. Based on
the Cronbach alpha formula = rk / [1 + (k -1)r] where k is the number of items
considered and r is the mean of the inter-item correlations, the size of the alpha is
determined by both the number of items in the scale and the mean inter-item
correlations. In the case of low Cronbach alpha values, either the value of the inter-
item correlations is too low or in negative. To achieve an adequate scale of
Cronbach alpha values, Kline (1999) recommended deleting any questionnaire item
with a corrected item-total correlation of greater than 0.3.
3.7.2 Descriptive Analysis
After editing and cleaning up the data, one of the common analytical tools used to
analyse the collected data in research is descriptive statistics analysis. Descriptive
statistics analysis is used to describe or summarise information about the
characteristics of the sample (Punch, 2003; Zikmund et al., 2010). In order to
summarise such information, tabulation is used to show how one variable relates to
another by arranging the information in a table or other summary format (Zikmund
et al., 2010). Descriptive statistics include the calculation of the mean, median,
standard deviation, bar charts, radar charts and pie charts.
The central tendency is a central value for a probability distribution. The most
common measures of central tendency are the mean, the median and the mode.
Researchers usually use the central tendency to measure and describe the
quantitative data in relation to some element or group (Crawley, 2005). As a
definition, the mean is the average of responses between the participants in the
sample (Crawley, 2005). The median is the numerical value separating the higher
half of a data sample from the lower half (Crawley, 2005). Another measurement is
a standard deviation. The standard deviation is commonly used to measure
confidence in statistical conclusions. The standard deviation shows how much
variation or dispersion from the average (mean) exists. A low standard deviation
indicates that the data points tend to be very close to the mean; a high standard

55
deviation indicates that the data points are spread out over a large range of values
(Sullivan, 2009).
The purpose of Part 1 in the questionnaire was to collect some demographic
information about the participants. The demographic characteristics include the
government agency type (public and semi-public), client age, education, and years
of experience. The data in this part are described by pie charts and bar graphs. It
also shows the variable name, counts and the percentage for each value associated
with each variable. The bar graph shows comparisons among categories, which
illustrates the elements and makes them easier to describe (Madsen, 2011).
Part 2 of the questionnaire was designed to identify the degree of client
involvement in construction projects. It contained five sections and covered 40
tasks in total. This part describes the client involvement in each task within the five
sections by using the radar chart. Radar charts display the data in the form of an
area and show an overview of several indicators. The radar chart is also a useful way
to display multivariate observations with an arbitrary number of variables.
According to Basu (2004), one application of a radar chart is to display the
performance metrics of an ongoing program. Therefore, the radar chart could have
great utility in the presentation of client involvement in construction projects
especially in situations where there are large numbers of variables (tasks).
Moreover, this technique has particular relevance for researchers who wish to
illustrate the degree of group similarities or differences on multiple variables in a
single graphical display (Saary, 2008).
The description of the data from Part 3 of the questionnaire used the same
technique as in Part 2 but adding more tables which present the factors from the
most to the least important based on the mean responses from the participants.
Part 3 investigated the reasons or factors for limited client involvement in public
construction projects in Saudi Arabia in relation to three groups of factors: (1)
individual factors, (2) project factors, and (3) organisational culture factors.

56
3.7.3 Inferential Statistical Analysis
After the descriptive analysis stage, inferential statistics methods are generally
applied. Inferential statistics are used to make inferences or judgments about a
population on the basis of a sample (Zikmund et al., 2010). Inferential statistics also
help to establish relationships among variables, from which the conclusions are
drawn and it is decided whether the collected data relate to the research questions
(Punch, 2003). The techniques used to analyse the data and to draw the conclusions
in this research are described in the next sections.
Kruskal-Wallis and Mann-Whitney Tests
To compare groups of cases for differences in their means along particular
variables, Kruskal-Wallis and Mann-Whitney tests were carried out. These tests are
a technique for testing the significance of the findings. The Kruskal-Wallis and
Mann-Whitney tests were used to test the significance of the differences between
the mean ranks of the various groups. The Kruskal-Wallis test is used for comparing
more than two samples that are independent, or not related. The Mann-Whitney
test is a non-parametric test similar to the Kruskal-Wallis test, but is applied where
there are only two groups to compare (Field, 2000). The Kruskal-Wallis and Mann-
Whitney tests do not assume normality, and can be used for ordinal variables (Park,
2008).
In the present study, the Kruskal-Wallis test was used to investigate the significance
of the differences in client involvement during the project phases (planning, design,
construction, handover, and O&M phases) among the four different project types
(building, infrastructure, industrial, and other). The Mann-Whitney test was used to
investigate the differences in client involvement during the project phases
(planning, design, construction, handover, and O& M phases) among the two
groups of organisation type (public and semi-public).

57
Factor Analysis
FA is a multivariate statistical approach commonly used in research conducted in
the social sciences field (Fabrigar & Wegener, 2011). The FA technique has become
one of the most commonly used quantitative methods. FA is also a tool used to
extract information from large databases and identify the interrelated data (Hair et
al., 2010). Moreover, FA highlights the interesting relationships that were not
discovered during the analysis of raw data. The two primary uses of FA are data
reduction and summarisation (Blaikie, 2003; Hair et al., 2010). It summarises the
characteristics of the variables with a clearer picture of which variables may act
together and how many variables might be expected to have impacts on the
analysis. For data reduction, FA assists in calculating the scores for large numbers of
variables and reduces them by substituting them from the original variables. In
other words, it creates new combinations of variables as replacements for the
original variables.
In the present study, in order to test the factor structure of the 19 elements
(indicators) of client individual factors (latent variables) and 23 elements
(indicators) of organisational culture factors (latent variables), FA was undertaken.
SPSS version 21 was used for this statistical technique. Table 3.4 shows the criteria
used in the factor analysis investigation.
Table 3.4: Criteria used for factor analysis in the present study
Criteria Description Justification Software used SPSS for Windows version 21 (IBM Corp., Released 2012)
Method of extracting factors
Principal component analysis (PCA) For factor reduction and summary (Hair et al., 2010)
Eigenvalues set Eigenvalues set to unity: Value=1 PCA examines the total variance of a test (Bryman & Cramer, 2009)
Kaiser-Meyer-Olkin It is a measure of sampling adequacy (MSA)
Must be greater than 0.5 (Hair et al., 2010)
Bartlett's test of sphericity
It is to indicate homogeneity of variance (Leung & Keating, 2010)
Must not exceed 0.05 (Hair et al., 2010)
Factor loading Factor loadings are correlation coefficients between observed variables and latent common factors (Yang, 2010).
Must be greater +0.50 (Hair et al., 2010)

58
Structural Equation Modelling
SEM has become an important and widely used analytical approach in social and
behavioral sciences over the past three decades (Bollen, 2005). SEM has become
one of the main options for researchers as a method of data analysis selection
because it has a number of strengths (Hair et al., 2010). One of the advantages of
SEM is that it defines the fit of a model to explain the entire set of relationships. It
allows the researcher to directly test the model of interest. It also has the ability to
specify latent variable models that provide separate estimates of relations among
the latent constructs and their indicators (the measurement model) and of the
relations among the constructs (the structural model). Moreover, SEM analyses the
relationships between latent variables without random error. This is because the
error has been estimated and removed, leaving only a common variance. Therefore,
SEM has the ability to distinguish between direct and indirect relationships among
the variables.
Several computer programs can be used for performing SEM (Hair et al., 2010).
Some of these programs are: LISREL (Linear Structural Relationships), EQS
(Equations), AMOS, CALIS, LISCOMP, RAMONA, SEPATH, and others. In the present
study, AMOS was conducted to perform the SEM. It can be integrated with SPSS and
it uses the graphical interface for all functions without using the syntax command or
codes. Based on the SEM/AMOS analysis, Chapter 5 presents an examination of the
conceptual framework of client involvement (see Chapter 2, Figure 2.11). The SEM
approach is used to link the individual factors and organisational culture factors to
the client involvement in the construction project phases. The flexibility of the SEM
approach allowed the present study to directly test the conceptual model. More
details of how the SEM is used to build the conceptual model and conclude the
development of the final model are discussed in Chapter 5.
Some basic knowledge and assessment helps to process and apply SEM. A structural
equation model is divided into two parts: a measurement model and a structural
model (Hair et al., 2010). The measurement model deals with the relationships
between the measured variables (indicators) and latent variables. The structural

59
model deals with the relationships between the latent variables only. Hair et al.
(2010) outlined some steps in using several diagnostic measures to assess the
model fit and some multiple fit indices that should be used to assess a structural
model.
Assessment of the measurement model includes standardised loading (SL),
standardised residual, and modification indices. Table 3.5 summarises the
assessment of measurement model suggested by Hair et al. (2010), including the
actions taken in the present study and the limitations.
Table 3.5: Assessment of measurement model (Hair et al., 2010, p. 713)
Measures Range Action taken in the present study
Standardised Loading (SL) SL < |0.5|
Considered too low loading and nominee for item deletion
|0.5| < SL < |1.0| Accepted range
SL > |1.0| Out of study range
Standardised Residual (SR) SR < |2.5| No problem
|2.5| < SR < |4.0| Need some attention for item
SR > |4.0| Item delete
Modification Indices (MI) MI > 10.0
As an indicator for model need an improvement
As shown in the table, the implication of dropping indicator items does not change
the latent construct’s meaning. According to Hair et al. (2010), items with low factor
loading can be dropped from the model without serious consequences as long as a
construct retains a sufficient number of indicators. Each construct should be
measured by at least three indicators (Hair et al., 2010, p. 702).
For the assessment of the structural model and after assessment of the
measurement model, the SEM evaluation of model fit is not as straightforward as it
is in statistical approaches. Because there is no single statistical significance test
that identifies a correct model fit (Barrett, 2007), it is necessary to evaluate model
fit on the basis of multiple fit indices. Hair et al. (2010), Hooper et al. (2008) and
Schermelleh et al. (2003) introduced a variety of fit indices with the acceptable
range which can be used as a guideline for structural equation modelling to help

60
avoid making such errors. The most commonly reported multi-fit indices are: CFI,
GFI, NFI and NNFI (McDonald & Ho, 2002); Chi-square test, RMSEA, CFI and SRMR
(Kline, 2011). The question is which indices should be reported that indicate the
best fit of the structural model. Therefore, reporting a variety of indices is necessary
(Crowley & Fan, 1997) because these different indices reflect a different aspect of
structural model fit. Based on these authors’ guidelines and the above review, Table
3.6 summarises the multi-fit indices with the level ranges and fits.
Table 3.6: Multi-fit indices for assessing the structural model fit (Hair et al., 2010; Hooper et al., 2008; Schermelleh et al., 2003)
Fit Indices Level Range Level Fit
CMIN/DF CMIN/DF < 2 (Hair et al., 2010; Schermelleh et al., 2003) Excellent fit
3 < CMIN/DF < 5 (Hair et al., 2010) Acceptable fit
CMIN/DF > 5 (Hair et al., 2010) Poor fit
GFI 0.90 < GFI < 0.95 (Hair et al., 2010; Schermelleh et al., 2003) Acceptable fit
0.95 < GFI < 1.00 (Hair et al., 2010; Hooper et al., 2008; Schermelleh et al., 2003) Perfect fit
RMSEA RMSEA < 0.03 (Hair et al., 2010; Hooper et al., 2008; Schermelleh et al., 2003) Excellent fit
0.03 < RMSEA < 0.07 (Hooper et al., 2008) Acceptable fit
0.03 < RMSEA < 0.08 (Hair et al., 2010; Schermelleh et al., 2003) Acceptable fit
NFI 0.90 < NFI < 0.95 (Schermelleh et al., 2003) Acceptable fit
0.95 < NFI < 1.00 (Hooper et al., 2008; Schermelleh et al., 2003) Perfect fit
TLI 0.90 < TLI < 0.95 (Hair et al., 2010) Acceptable fit
0.95 < TLI < 1.00 (Hair et al., 2010) Perfect fit
CFI 0.90 < TLI < 0.95 (Hair et al., 2010) Acceptable fit
0.95 < TLI < 1.00 (Hair et al., 2010; Hooper et al., 2008; Schermelleh et al., 2003) Perfect fit
RNI CFI > 0.90 (Hair et al., 2010) Acceptable fit
Where: CMIN/DF = (CMIN=Chi Square or X2 & DF=Degree of freedom); GFI = Goodness-of-Fit Index; RMSEA = Root Mean Square Error of Approximation; NFI = Normed Fit Index; TLI = Tucker-Lewis Index; RNI = Relative Noncentrality Index.
Table 3.6 lists the most widely used indices fit in SEM. In practice, fit indices cannot
all be used at the same time. Hair et al. (2010, p. 678) suggested that for any
complex model, multiple fit indices should be used to assess a model’s goodness-of-
fit. Hair et al. identified five groups of indices, namely: (1) the X2 value and
associated DF: CMIN/DF; (2) absolute fit indices: GFI, RMSEA, SRMR; (3) incremental
fit indices: CFI, TLI; (4) goodness-of-fit indices: GFI, CFI, TLI; and (5) badness-of-fit
indices: RMSEA, SRMR. Moreover, Hair et al. (p. 675) advised that the overall model

61
fit can be assessed using at least one index from each group. They also suggested
using the X2 value for the structure model and two other indices to establish the
validity of the structure model fit. Table 3.7 presents the indices with the acceptable
ranges that were used in the present study.
Table 3.7: Multiple fit indices used in the present study
Indices Groups (Hair et al., 2010)
Fit Indices Criteria Used for the Present Study
Index chosen Target level fit
1 X2 value and associated DF CMIN/DF CMIN/DF CMIN/DF < 2 (Excellent)
2 Absolute fit indices GFI, RMSEA, SRMR GFI GFI > 0.90 (Good)
3 Incremental fit indices CFI, TLI TLI TLI > 0.95 (Perfect)
4 Goodness-of-fit indices GFI, CFI, TLI CFI CFI > 0.95 (Perfect)
5 Badness-of-fit indices RMSEA, SRMR RMSEA RMSEA < 0.08 (Good)
3.8 Summary
This chapter presented the research methodology adopted for this study. The
research design and appropriate data collection methods were described, together
with the sample selection procedure. The applied data analysis and statistical
analysis techniques were also discussed, along with the limitations and
assumptions.
The purpose of the methodology is to link the research questions and outcomes.
The present study used the quantitative method to cover the first three main
research questions by distributing a survey in the form of a questionnaire. The
survey sample was identified as 315 participants, and the survey took place in Saudi
Arabia. The analysis was undertaken using SPSS for Windows (version 21). From the
data obtained in the questionnaires (Parts 2 and 3), the fourth main research
question was addressed using the SEM approach with AMOS software to build up
the model fit. The research design also includes the use of SEM to measure the
impact of the individual factors and organisational culture factors on the client
involvement in construction projects within project delivery expectations, as
presented in detail in Chapter 5.

62
The following chapter (Chapter 4) discusses the current client involvement practices
in the construction sector in Saudi Arabia. It presents the results of the statistical
analyses undertaken on the data to assess the characteristics of the sample covered
by the survey. The collected data are analysed and interpreted according to the
protocols that have been established in this chapter.

63
CHAPTER 4 CURRENT PRACTICES IN CLIENT INVOLVEMENT
4.1 Introduction
The previous chapter provided a detailed discussion of the research methodology
applied in this study. The study aims to improve the level of client involvement in
construction projects. This chapter presents the data collected from the survey in
tables and graphs, and provides a detailed analysis of the data collected using the
statistical tools identified in Chapter 3. Section 4.2 provides a profile of the sample
and the collected data. The remaining sections provide descriptive statistics of the
research findings including an examination of the relationships among the variables.
Section 4.3 focuses on the demographic profile of the respondents. Next, Section
4.4 analyses the data in relation to current client involvement practices in the
construction industry in Saudi Arabia. Section 4.5 presents an analysis of the impact
of client involvement on project delivery, while Section 4.6 analyses the factors that
influence client involvement.
The descriptive statistics presented in this chapter encompass frequency
distributions, measures of central tendency such as means, medians and modes,
and measures of dispersion such as the standard deviation. Where appropriate,
tests are also carried out on the significance of the findings. For example, the
Kruskal-Wallis and Mann-Whitney tests are used to test for the significance of the
differences between the mean ranks of the various groups. The Kruskal-Wallis test
is used for comparing more than two samples that are independent, or not related,
while the Mann-Whitney test is a non-parametric ANOVA which is similar to the
Kruskal-Wallis test but applied where there are only two groups to compare (Field,
2000). The variables are also analysed using factor analysis. Factor analysis is a
multivariate statistical technique for examining the underlying structure or the
structure of interrelationships among a large number of variables (Hair et al., 2010).
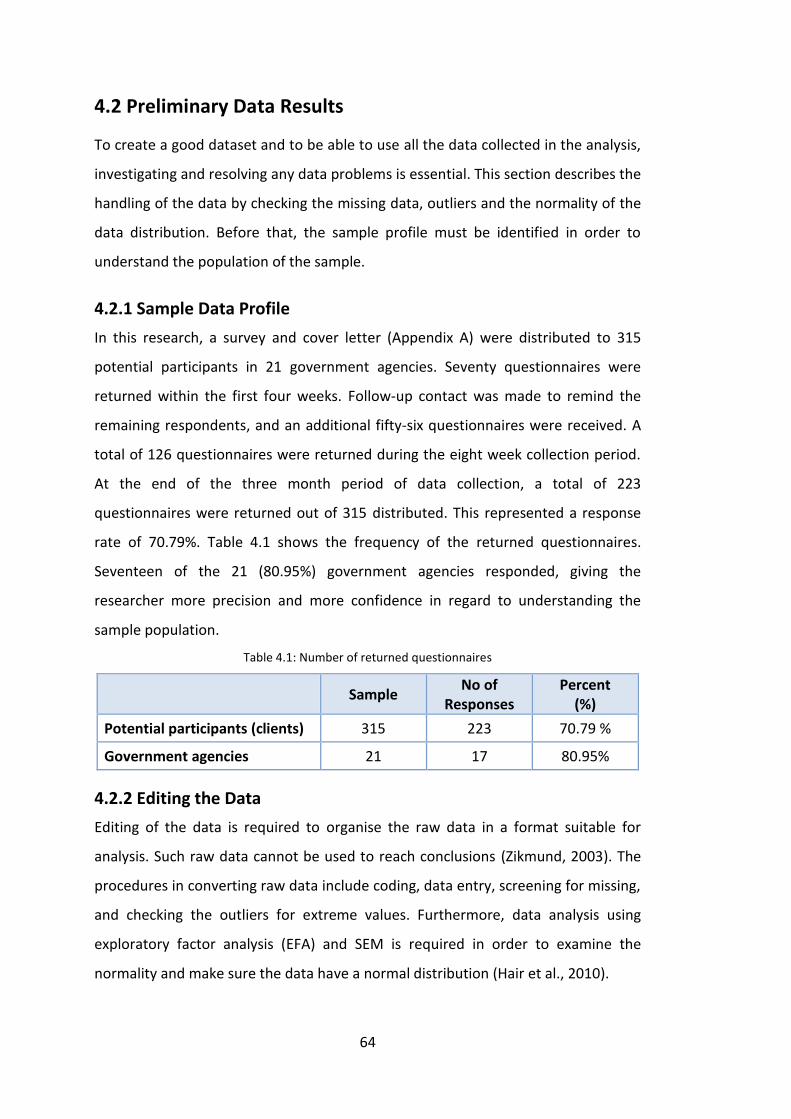
64
4.2 Preliminary Data Results
To create a good dataset and to be able to use all the data collected in the analysis,
investigating and resolving any data problems is essential. This section describes the
handling of the data by checking the missing data, outliers and the normality of the
data distribution. Before that, the sample profile must be identified in order to
understand the population of the sample.
4.2.1 Sample Data Profile
In this research, a survey and cover letter (Appendix A) were distributed to 315
potential participants in 21 government agencies. Seventy questionnaires were
returned within the first four weeks. Follow-up contact was made to remind the
remaining respondents, and an additional fifty-six questionnaires were received. A
total of 126 questionnaires were returned during the eight week collection period.
At the end of the three month period of data collection, a total of 223
questionnaires were returned out of 315 distributed. This represented a response
rate of 70.79%. Table 4.1 shows the frequency of the returned questionnaires.
Seventeen of the 21 (80.95%) government agencies responded, giving the
researcher more precision and more confidence in regard to understanding the
sample population.
Table 4.1: Number of returned questionnaires
Sample No of
Responses Percent
(%)
Potential participants (clients) 315 223 70.79 %
Government agencies 21 17 80.95%
4.2.2 Editing the Data
Editing of the data is required to organise the raw data in a format suitable for
analysis. Such raw data cannot be used to reach conclusions (Zikmund, 2003). The
procedures in converting raw data include coding, data entry, screening for missing,
and checking the outliers for extreme values. Furthermore, data analysis using
exploratory factor analysis (EFA) and SEM is required in order to examine the
normality and make sure the data have a normal distribution (Hair et al., 2010).

65
Coding Data
Coding is the process of identifying the data from the questionnaires using
numerical scores or other character symbols (Sekaran, 2003; Zikmund et al., 2010).
As explained previously (Chapter 3, Section 3.7.1), each item in the questionnaire
has a character symbol code as shown in Appendix C (Section C-1).
Data Entry
After the coding process is done, data entry is the next step. In this research, the
keyboard operator (the researcher) manually entered the data into the computer.
The SPSS for Windows version 21 software package was used for data entry before
further analysis.
Screening Data for Missing Values
After all the data were stored in the computer, the SPSS missing values analysis
option was used to analyse the patterns of the missing data. Analysis of missing
data is required to improve the validity of research. The result of the missing value
analysis indicated that no missing data were found in the questionnaire responses
in the dataset. The results of the missing data analysis are presented in Appendix C
(Table C-3-1 and Table C-3-2).
Treating the Outliers
The box-plot test in SPSS was used to investigate and determine the outliers in the
data. In Part 2 of the questionnaire (Appendix C, Table C-3-1), the item
[Part2_A_10] had eight high (3.4% out of N=223) extreme values which was the
largest number of outliers among all the items in Part 2. In Part 3 of the
questionnaire (Appendix C, Table C-3-2), the item [Part3_A_14] had eleven low
(4.93% out of N=223) extreme values which is the most number of outliers among
all the items in that part of the questionnaire. As explained in Chapter 3 (Section
3.7.1) in regard to how outlier values are treated, the extreme value was replaced
with the nearest value; that is, item [Part2_A_10] had seven responses for which a
value of 4 was replaced with a value of 3.

66
Skewness and Kurtosis Test for Normality Distribution
Examining the data normality is one of critically important assumptions in the
conduct of SEM analyses in general, and in the use of AMOS in particular (Arbuckle,
2007). To test the desired range results of skewness (<2) and kurtosis (<7) of the
data (West et al., 1995) in the present study, SPSS (v21) was used to describe the
data as presented in Appendix C (Table C-3-3 and Table C-3-4). The results showed
that the value of skewness and kurtosis were in the acceptable range. This
supported the conclusion that the data were normally distributed. The final treated
data on client involvement (Part 2 in the questionnaire) and the factors affecting
client involvement (Part 3 in the questionnaire) are presented in Appendix C (Table
C-3-3 and Table C-3-4).
4.2.3 Validity and Reliability of the Questionnaire
As explained previously, the questionnaire had three parts. Part 1 was focused on
the demographic profile of the respondents. No latent variables were required in
this part for the validity and reliability test. Part 2 aimed to identify the degree of
client involvement in government construction projects. It had five groups of items,
relating to the different phases of a construction project. Part 3 investigated the
reasons for limited client involvement and participation in government construction
projects in relation to individual factors, project factors and organisational culture
factors. The latent variable was the project delivery expectation.
Content validity was examined in this study by developing the questionnaire based
on the literature review and by sending the questionnaire to a group of sample
respondents and asking them to check it for clarity and content. Based on the
feedback, revisions were made and the final questionnaire as presented in
Appendix A (Section A-1) was assumed to be valid.
As explained in Chapter 3 (Section 3.7.1), the Cronbach’s alpha test was used to
evaluate the consistency and reliability in this study within the ranges assigned in
Table 3.3. The Cronbach’s alpha test for the parts and groups are shown in detail in
Appendix C (Section C-4).

67
Reliability Test of Construction Project Phases
There are five groups of items related to the construction project phases: “planning
phase”, “design phase”, “construction phase”, “handover phase”, and “operations
and maintenance phase”. The test of reliability was done for each group as well as
all the 40 items as one group. A summary of the results of the reliability test is
shown in Table 4.2, and all the details of the test are presented in Appendix C
(Section C-4-1). Overall, the Cronbach’s alpha was 0.943 which indicates a “high”
level of reliability. The “construction project phases” data were considered reliable
and the data accepted for further analysis.
Table 4.2: Summary of reliability test of construction project phases [Part 2 in questionnaire]
Construction Project Phase Reference Table
(Appendix C) Cronbach’s
Alpha Reliability
No. of Items
Planning Phase C-4-1 C-4-2
.918 High 11
Design Phase C-4-3 C-4-4
.922 High 11
Construction Phase C-4-5 C-4-6
.905 High 11
Handover Phase C-4-7 C-4-8
.927 High 3
O & M Phase C-4-9
C-4-10 .821 Very Good 4
All Construction Phases C-4-11 C-4-12
.943 High 40
Reliability Test of Individual Factors
There are 19 items related to individual factors. The reliability test was done for all
19 items as one group. A summary of the results is presented in Table 4.3, and the
details are presented in Appendix C (Section C-4-2). The Cronbach’s Alpha was
0.788 which indicates a “good” level of reliability, close to 0.8 (very good level).
Some items (i.e., Part3_A_7, Part3_A_14, Part3_A_15, Part3_A_16, Part3_A_17 and
Part3_A_19) scored less than 0.3 of the inter-item corrected matrix but all of them
had positive values. Overall, the data on “individual factors” were found to be
reliable and the data accepted for further analysis.
Table 4.3: Summary of reliability test of individual factors [Part 3 in questionnaire]]
Individual Factors Reference Table
(Appendix C) Cronbach’s
Alpha Reliability
No. of Items
Over all C-4-13 C-4-14
.788 Good 19

68
Reliability Test of Project Factors
The project factors include 5 items. The reliability test was done, and a summary of
the results is presented in Table 4.4. Details of the test are presented in Appendix C
(Section C-4-3). Overall, the Cronbach’s Alpha value was 0.408 which indicates a
“poor” level of reliability. All items scored less than 0.7 for the Cronbach’s Alpha
and less than 0.3 in the inter-item corrected matrix which results in all the items
being out of range (Cronbach’s Alpha>0.7, inter-item corrected matrix>0.3). Overall,
the data on “project factors” were considered to have poor reliability and the data
were not accepted for further analysis.
Table 4.4: Summary of reliability test of project factors [Part 3 in questionnaire]
Project Factors Reference Table
(Appendix C) Cronbach’s
Alpha Reliability
No. of Items
Over all C-4-15 C-4-16
.408 Poor 5
Reliability Test of Organisational Culture Factors
The organisational culture factors include 23 items. The reliability test was done for
the 23 items as one group. A summary of the results is shown in Table 4.5, and the
results are presented in detail in Appendix C (Section C-4-4). The Cronbach’s Alpha
was 0.977, which indicates a “high” level of reliability. Overall, the data on
“organisational culture factors” were found to be reliable and the data accepted for
further analysis.
Table 4.5: Summary of reliability test of organisational culture factors [Part 3 in questionnaire]
Organisational Culture Factors
Reference Table (Appendix C)
Cronbach’s Alpha
Reliability No. of Items
Over all C-4-17 C-4-18
.977 High 23
Reliability Test of Project Delivery Expectation
Clients have four common goals: high quality, low cost, on-time completion, and
satisfactory operation (Forgues, 2006). Reliability tests were done for these four
items. A summary of the results is shown in Table 4.6 and the details are presented
in Appendix C (Section C-4-5). The Cronbach’s Alpha was 0.853 which indicates a
“very good” level of reliability. Overall, the data on “project delivery expectations”
were found to be reliable and the data accepted for further analysis.

69
Table 4.6: Summary of reliability test of project delivery expectations [Part 3 in questionnaire]
Project Delivery Expectations
Reference Table (Appendix C)
Cronbach’s Alpha
Reliability No. of Items
Over all C-4-19 C-4-20
.853 Very Good 4
4.3 Demographic Profiles
The purpose of analysing the demographic profiles of the respondents is to
understand and describe the characteristics of the respondents, such as the
organisational type (public or semi-public), age, education, and years of experience.
This type of analysis also shows the variable name, counts and the percentage for
each value associated with each variable (Hair et al., 2010).
Respondents’ Ownership Type
Table 4.7 presents a summary of the respondents by reference to the ownership
type. Among the respondents, 42.6% worked in public agencies and 57.4% worked
in semi-public agencies. This gives an indication that the sample almost equally
represented the two types of agencies targeted in this study.
Table 4.7: Frequency statistics for respondents' ownership type
Ownership Type [Part1_D_1]
Frequency Precent (%)
Public 95 42.6
Semi-Public 128 57.4
Total 223 100.0
Respondents’ Age
Descriptive analysis of the respondents' age showed that the ages ranged from 21
to over 60 years. Among the 223 respondents, 129 were aged between 31 and 40
years and this age group was the majority in number (57.8%). Table 4.8 shows the
age group frequencies and percentages.

70
Table 4.8: Frequency statistics for respondents' age
Age: [Part1_D_2]
Age Frequency Precent (%)
21-30 52 22.9
31-40 129 57.8
41-50 23 10.3
51-60 17 7.6
Above 60 3 1.3
Total 223 100.0
Respondents’ Education Level
Descriptive analysis of the respondents' education level revealed a range of
different education levels. As shown in Table 4.9, 98.7% of the respondents held
university or post-graduate degrees. Of these, 64.6% held a Bachelor’s degree and
32.3% held a Master's degree. Overall, this indicates a high level of education
among the respondents.
Table 4.9: Frequency statistics for respondents' education level
Respondents’ education level [Part1_D_3]
Frequency Precent (%)
Doctor 4 1.8
Master’s degree 72 32.3
Higher Diploma 2 .9
Bachelor’s 144 64.6
Other 1 .4
Total 223 100.0
Workshops Attended by Respondents
Attending training courses, workshops or seminars helps to increase and improve
knowledge and skills in managing projects. Table 4.10 shows that 81.1% of the
respondents attended less than five workshops in the last five years. Of these,
31.8% did not attend any workshop in the last five years. This indicates some
weakness in the employee training programs provided by the government agencies.

71
Table 4.10: Frequency statistics for workshops attended by respondents
Workshops attended [Part1_D_5]
No. of courses Frequency Precent (%)
0 71 31.8
1-5 110 49.3
6-10 35 15.7
11-15 5 2.2
16 - 20 2 0.9
Total 223 100.0
Respondents’ Experience
More experienced clients have a greater range of knowledge of the methods, tools
and techniques involved in managing projects. This results positively in the client’s
involvement in a project. Table 4.11 shows the respondents’ profiles in relation to
experience. The first three segments represent the categories of 5, 10 and 15 years
of experience, which included 28.3%, 30.5% and 24.2% of the respondents,
respectively. This represented 83% of the whole sample.
Table 4.11: Frequency statistics for respondents' experience
Respondents’ experience [Part1_D_6]
Years Frequency Precent (%)
Less than 5 63 28.3
6-10 68 30.5
11-15 54 24.2
16-20 12 5.4
Above 20 26 11.7
Total 223 100.0
Respondents’ Project Types
Figure 4.1 summarises the types of projects [Variable no: Part1_D_7] that were
captured in the questionnaire (refer to Appendix A). As can be seen from the figure,
the project types were categorised based on the type of facility constructed as
follows: building (residential, non-residential); infrastructure (highways); industrial
(power plants, refineries, etc.); and other. The project types were also classified on
the basis of the type of client (public, semi-public). The number of cases in each
category is shown in the figure, together with the percentage equivalent. In the

72
semi-public sector, building projects constituted the biggest proportion, involving
99 (77.3%) out of the 128 respondents from that sector. In the public sector, the
majority of projects were in the industrial category, involving 35 (38.6%) out of the
95 respondents in that sector. Overall, the building category involved the largest
number of respondents (120 [53.8%] out of 223 respondents) across both sectors.
More details are set out in Appendix D (Section D-1, Table D-1-2).
Figure 4.1: Frequency statistics for respondents' project type
Procurement
In terms of the project contracts used by the 223 respondents in the sample, the
traditional lump sum contract dominated as the most popular procurement
approach with 145 (65%) respondents using this type of contract. Following this, at
26%, 24.2% and 20.2%, were the unit price, construction management and design-
build approach, respectively (Appendix D, Section D-1, Tables D-1-3 and D-1-4). As
illustrated in Figure 4.2, the results indicated clearly that the traditional lump sum
procurement approach was more popular than other contracts among the clients in
both the public and semi-public sector. The Friedman test (Appendix D, Section D-1,
Table D-1-5) also shows clearly that the traditional lump sum contract is highly
significant and the most popular contract used in construction among the other
types of contracts. The advantages of the traditional lump sum contract are that it is
low risk to the client and leads to fewer changes during the construction because
the full scope of the work is known at the time of tender (Kong & Gray, 2012).
21 (22.1%)
10 (10.5%)
35 (36.8%) 29(30.5%)
99 (77.3%)
20 (15.6%)
6 (4.7%) 3 (2.3%)
120 (53.8%)
30 (13.5%)
41 (18.4%)
32(14.3%)
0
20
40
60
80
100
120
140
Building Infrastructure Industrial Other
Re
spo
nse
s
Public (N=95) Semi-Public (N=128) Overall (N=223)

73
Knowing the full scope of project activities helps and encourage the client to be
more productive during the construction process and yield the greatest level of
client satisfaction with respect to time, cost and quality management on
construction projects (Bowen et al., 2012). On the other hand, clients are more
likely to be dissatisfied with project quality under design-build and construction
management procurement systems (Bowen et al., 2012).
Figure 4.2: Frequency statistics for project procurement
4.4 Current Client Involvement Analysis
This section presents an analysis of the data gathered through the questionnaire.
The first aim is to understand the current practices of client involvement in public
construction projects in Saudi Arabia. Part 2 of the questionnaire investigated the
respondents’ degree of involvement as clients in the five phases of a construction
project cycle, namely, the planning phase, design phase, construction phase,
handover phase and operations and maintenance phase. Each phase includes
elements which represent the project tasks. This analysis aims to identify the
existing status of client involvement in dealing with the daily activities in
construction projects. The respondents’ involvement as clients is explored through
three different perspectives: (1) involvement based on overall data; (2) involvement
based on the project ownership (public and semi-public); and (3) involvement based
on the type of project (building, infrastructure, industrial, and other).
26 (27.4%) 12(12.6%)
43(45.3%) 30(31.6%)
119 (93%)
33(25.8%)
15(11.7%) 24(18.8%)
145 (65%)
45(20.2%) 58(26%) 54(24.2%)
0
20
40
60
80
100
120
140
160
Lump Sum Design-Build Unit Price ConstructionManagement
Re
spo
nse
s
Public (N=95) Semi-Public (N=128) Overall (N=233)

74
The second aim of the analysis presented in this section is to identify the most
important phase in the construction project, in order to better understand where
attention should be focused to improve client involvement and to ensure a project
is successful.
4.4.1 Respondents’ Involvement as Clients in Project Phases
Descriptive statistics for the respondents’ involvement as clients in the five phases
of a construction project were produced (Appendix D, Section D-2, Table D-2-1). The
measure of central tendency was the mean, although the median would
theoretically be a more accurate measure because the data were ordinal. However,
the mean was used due to the nature of the data. The mean is also easier to
determine and interpret, and can be employed in various other calculations. In
addition, the data scales used in Part 2 of the questionnaire were “strongly
involved” to “not involved” on a five-point Likert scale used as shown in Figure 4.3.
To locate the level of involvement, the “involvement scale” was developed in five
intervals: “very low”, “low”, “neutral”, “high” and “very high” (Figure 4.3). The
involvement scale was calculated by dividing the four intervals in the Likert scale by
the five involvement intervals. The result was 0.8 for each interval. Therefore, the
“involvement scale profile” was built based on the five-point Likert scale (Figure
4.3).
Figure 4.3: Likert and involvement scale profile used for Part 2 in the questionnaire
As explained above, for a deep understanding of the current status of client
involvement, the respondents’ involvement as clients in construction projects is
explored through their involvement based on overall data, their involvement based
on the project ownership, and their involvement based on the project type.
1 2 3 4 5
Low Very High Very Low High Neutral
Likert Scale
Involvement Scale 1.8
1
2.6 3.4 4.2
5

75
The average involvement of the respondents as clients in each phase of a
construction project is presented in Table 4.12. It shows the client involvement
according to the project type, project ownership, and overall. The average
involvement in all construction project phases is presented in the last row of the
table. In all phases, the average client involvement was in the low involvement
range for the categories of project type, project ownership and overall (according to
the involvement scale profile in Figure 4.3), except for the “infrastructure” project
type in which the average client involvement was in the neutral range. A more in-
depth investigation into the respondents’ involvement as clients in construction
projects follows.
Table 4.12: Respondent’s average (mean) involvement as clients in construction phases
Construction Project Phase
Average Involvement as Clients
Project Type Project
Ownership
Overall
(N=223) Building (N=120)
Infrastructure (N=30)
Industrial (N=41)
Other (N=32)
Public (N=95)
Semi-Public (N=128)
Planning 1.67 2.98 2.49 2.19 2.25 1.89 2.07
Design 2.59 3.79 2.23 2.25 2.29 2.85 2.64
Construction 2.91 3.45 2.84 2.32 2.80 2.93 2.89
Handover 3.31 3.87 2.56 2.91 2.88 3.38 3.19
O & M 2.05 1.92 1.93 2.42 2.19 1.95 2.06
Average involvement in all phases
2.50 3.20 2.41 2.42 2.48 2.60 2.57
Client involvement Overall Data
As established in this study (Chapter 3, Section 3.4), a construction project has five
phases with 40 tasks that measure most of the activities involved in the
construction project cycle. Through the questionnaire, the respondents provided
information on all the tasks which identify the status of their involvement as clients
in the daily activities in each phase of a construction project.
The respondents’ client involvement profile in construction projects in relation to
the various tasks is shown in Figure 4.4. The level of involvement is shown in a red
line. Where the red line is closer to the centre of chart, the respondents have a
lower involvement as clients in the construction project. Where the red line is closer

76
to the perimeter of the chart, the respondents have a higher involvement as clients
in the construction project. These findings are also summarised in Appendix C
(Table D-2-2 in Section D-2).
Figure 4.4: Overall data on respondents’ involvement as clients in construction projects
The lowest rated tasks were A6, A10, A11 and C3 which were rated as “very low”
involvement. Nineteen tasks were rated as “low” involvement: A1, A2, A3, A4, A5,
A8 and A9 from the planning phase; B1, B3, B4, B7 and B10 from the design phase;
C1, C2 and C4 from the construction phase; and E1, E2, E3 and E4 from the
operations and maintenance phase. The middle of the involvement scale profile is
“neutral” involvement. Fifteen tasks were rated as neutral involvement: A7 from
the planning phase; B2, B5, B6, B8, B9 and B11 from the design phase; C5, C6, C9,
C10 and C11 from the construction phase; and D1, D2 and D3 from the handover
phase. C7 and C8 were the only two tasks rated as “high” involvement.

77
As shown in the chart (Figure 4.4), the respondents’ involvement as clients in the
planning phase and the operations and maintenance phase was much lower than in
the design, construction and handover phases. This might be due to a number of
reasons. For example: some tasks need a higher level of decision-making (especially
in the planning phase); some tasks require the other party to do the job, such as to
carry out preliminary studies; and, in the operations and maintenance phase, the
engineers take over the tasks from the client after the project has been handed
over from the contractors. In practice, a client can be expected to have a higher
level of involvement in the design phase and lower involvement in the planning and
O&M phases compared to the other phases.
Overall, it was found that the respondents had neutral and low levels of
involvement as clients in 38 out of 40 tasks in all the construction project phases.
This means that the respondents spent 50% or less of their efforts to 95% of the
day-to-day project activities. This low level of involvement can be expected to have
a negative impact on the project outcomes. The findings on the respondents’
involvement as clients in each phase of the construction process are discussed in
more detail as follows.
Planning Phase
Table 4.12 above presented the results on the respondents’ level of involvement as
clients in the planning phase. The average level of client involvement was 2.07,
which is considered to be low involvement based on the involvement scale profile
(Figure 4.3). The planning phase in a construction project is normally executed by
the client. In the present study, the planning phase was represented through 11
tasks. Table 4.13 presents the mean rank of the respondents’ level of involvement
as clients in the 11 tasks in the planning phase from low to high involvement.

78
Table 4.13: Mean ranking of client involvement in planning phase
Code Planning Phase Activities (Tasks) Rank N Mean
Part2_A_6 Approval of the project cost 1 223 1.54
Part2_A_11 Feasibility study of the proposed project 2 223 1.61
Part2_A_10 Description of the responsibilities and powers of each member participating in the project
3 223 1.72
Part2_A_4 Studying how to secure funds to finance the project 4 223 1.86
Part2_A_8 Studying the impact of the project on health and safety 5 223 1.94
Part2_A_9 Establishment of a criterion for the selection of project location 6 223 2.04
Part2_A_5 Estimation of the project cost and the time required for its completion 7 223 2.11
Part2_A_1 Assignment of task force (consultant, engineer etc.) to conduct preliminary studies for the proposed project
8 223 2.21
Part2_A_2 Studying the requirements of the beneficiary of the project 9 223 2.50
Part2_A_3 Defining, in writing, the technical specifications and conditions that determine the quality of the required work
10 223 2.58
Part2_A_7 Studying and determining the technical specifications of the materials to be used for the project
11 223 2.68
The respondents’ level of involvement as clients in the planning phase tasks was
varied but low across all the tasks; involvement in three tasks was ranked as very
low (scale 1 to 1.8); involvement in seven tasks was ranked as low (scale 1.8 to 2.6);
and involvement in one task was ranked as neutral (scale 2.6 to 3.4). The
respondents’ involvement in approving the project cost, doing the feasibility study
of the proposed project, and describing the responsibilities and powers of each
project member was very low. These three tasks illustrate the importance of the
planning tasks. The project feasibility study, for example, is an analysis of the ability
to complete a project successfully, taking into account the legal, economic,
technological, scheduling and other factors. Failing to complete the feasibility study
as accurately as possible can have consequences that are sufficiently serious to stop
the project. The task which was ranked with the highest level of involvement was
studying and determining the technical specifications of the materials to be used for
the project; even in this case, the respondents’ described their level of involvement
as clients in this task as neutral.
These results imply that the respondents were not aware of the importance of
participating as clients in the planning phase. This is also indicated by the result
showing that the respondents had the lowest involvement as clients in the planning
phase compared to the other phases (Table 4.12), regardless of whether the
involvement was looked at by reference to the project type (building, infrastructure,
industrial, and other), project ownership (public and semi-public), or the overall
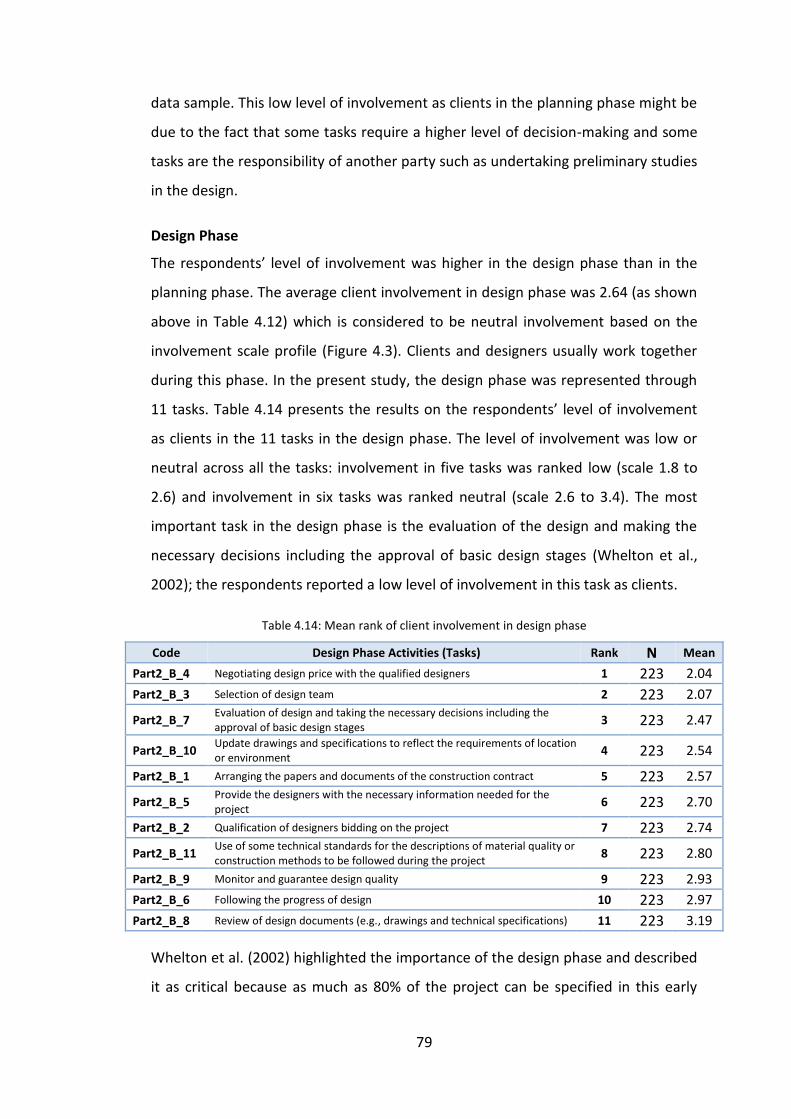
79
data sample. This low level of involvement as clients in the planning phase might be
due to the fact that some tasks require a higher level of decision-making and some
tasks are the responsibility of another party such as undertaking preliminary studies
in the design.
Design Phase
The respondents’ level of involvement was higher in the design phase than in the
planning phase. The average client involvement in design phase was 2.64 (as shown
above in Table 4.12) which is considered to be neutral involvement based on the
involvement scale profile (Figure 4.3). Clients and designers usually work together
during this phase. In the present study, the design phase was represented through
11 tasks. Table 4.14 presents the results on the respondents’ level of involvement
as clients in the 11 tasks in the design phase. The level of involvement was low or
neutral across all the tasks: involvement in five tasks was ranked low (scale 1.8 to
2.6) and involvement in six tasks was ranked neutral (scale 2.6 to 3.4). The most
important task in the design phase is the evaluation of the design and making the
necessary decisions including the approval of basic design stages (Whelton et al.,
2002); the respondents reported a low level of involvement in this task as clients.
Table 4.14: Mean rank of client involvement in design phase
Code Design Phase Activities (Tasks) Rank N Mean
Part2_B_4 Negotiating design price with the qualified designers 1 223 2.04
Part2_B_3 Selection of design team 2 223 2.07
Part2_B_7 Evaluation of design and taking the necessary decisions including the approval of basic design stages
3 223 2.47
Part2_B_10 Update drawings and specifications to reflect the requirements of location or environment
4 223 2.54
Part2_B_1 Arranging the papers and documents of the construction contract 5 223 2.57
Part2_B_5 Provide the designers with the necessary information needed for the project
6 223 2.70
Part2_B_2 Qualification of designers bidding on the project 7 223 2.74
Part2_B_11 Use of some technical standards for the descriptions of material quality or construction methods to be followed during the project
8 223 2.80
Part2_B_9 Monitor and guarantee design quality 9 223 2.93
Part2_B_6 Following the progress of design 10 223 2.97
Part2_B_8 Review of design documents (e.g., drawings and technical specifications) 11 223 3.19
Whelton et al. (2002) highlighted the importance of the design phase and described
it as critical because as much as 80% of the project can be specified in this early

80
phase. The results of the survey showed that the task in which the respondents had
the highest level of involvement as clients in the design phase was the review of
design documents. The level of involvement in this task was ranked as neutral. This
indicates that the respondents were not aware of the importance of participating as
clients in the design phase, even though it is a stage that involves decisions which
will later impact on the project during the construction phase.
Construction Phase
As shown above in Table 4.12, the respondents’ level of involvement as clients in
the construction phase was ranked as the second highest level of involvement
across all the project phases (following the handover phase). The average client
involvement in the construction phase was 2.89 (Table 4.12) which is considered
neutral based on the involvement scale profile (Figure 4.3). Using all the
information that was prepared during the design phase, the clients, designers and
contractors normally work together in the construction phase. In the present study,
the construction phase was represented through 11 tasks. Table 4.15 presents the
results on the respondents’ level of involvement in the 11 tasks in the construction
phase. The level of involvement across the tasks was varied: involvement in one
task was ranked as low (scale 1 to 1.8); involvement in three tasks was ranked as a
low (scale 1.8 to 2.6); involvement in five tasks was ranked as neutral (scale 2.6 to
3.4); and involvement of two tasks was ranked as high (scale 3.4 to 4.2).
Table 4.15: Mean rank of client involvement in construction phase
Code Construction Phase Activities (Tasks) Rank N Mean
Part2_C_3 Negotiating contract price with the contractors qualified to do the job 1 223 1.67
Part2_C_1 Qualification of contractors competing to implement the project 2 223 2.49
Part2_C_4 Interpretation and clarification of ambiguities in the contract documents and drawings 3 223 2.50
Part2_C_2 Explaining the objective of the project and providing the necessary information for bidding
4 223 2.60
Part2_C_5 Review, from time to time, the documents that submitted by the contractor (e.g., work schedules, manpower qualifications, equipment)
5 223 2.85
Part2_C_9 Establishment of a system and written code to ensure implementation quality, to be referred to by personnel in charge of implementation quality assurance and control
6 223 2.96
Part2_C_10 Emphasis on implementation quality by conducting necessary tests for the various implementation stages
7 223 2.99
Part2_C_6 Taking necessary decisions against contractor claims during project implementation 8 223 3.26
Part2_C_11 Regularly visit project site during implementation stage 9 223 3.31
Part2_C_8 Stress implementation quality and monitoring safety principles during project implementation
10 223 3.53
Part2_C_7 Monitoring and control of implementation methods and cost, as well as work schedule and contractor productivity
11 223 3.60

81
The results indicate that the respondents did not pay much attention to a number
of tasks that need to be carried out before construction of the project during the
bidding period, namely: negotiating the contract price with the contractors qualified
to do the job; checking the qualification of contractors competing to implement the
project; interpreting and clarifying ambiguities in the contract documents and
drawings; and explaining the objective of the project and providing the necessary
information for bidding. A low level of involvement in these tasks can lead to
conflict between the project parties. Al-Sedairy (1994) investigated management
conflict in public sector construction in Saudi Arabia and found that the conflict
occurs most frequently in the key relationships between the contractor and the
client, and between the contractor and the consultant. The conflict was found to
occur most strongly in the later stages of a project during construction.
The results in the present study indicate that the respondents were aware of the
need to be involved in the following tasks in the construction phase: taking
necessary decisions against contractor claims during project implementation;
regularly visiting the project site during the implementation stage; stressing
implementation quality and monitoring safety principles during project
implementation; and monitoring and control of implementation methods and cost,
as well as work schedule and contractor productivity. These tasks are very
important and significant in the outcomes of the construction phase. Clients can
resolve any claims, monitor the work schedule and contractor productivity, and
enforce the quality and safety control of the project by conducting regular visits to
the site during construction. Making the necessary decisions while the clients are on
site helps the project to be completed efficiently.
Handover Phase
The respondents’ involvement as clients was the highest in the handover phase
among all the phases. The average client involvement in the construction phase was
3.19 (Table 4.12), which is considered to be neutral involvement but close to high
involvement based on the involvement scale profile (Figure 4.3). The handover
phase can be organised by the clients and consultants in conjunction with the

82
contractor and subcontractors in order to accept the work done in project. In the
present study, the handover phase was represented through three tasks. Table 4.16
presents the results on the respondents’ involvement as clients in the three tasks in
the handover phase.
Table 4.16: Mean rank of client involvement in handover phase
Code Handover Phase Activities (Tasks) Rank Mean
Part2_D_1 Establishment of criteria for acceptance of completed project 1 3.09
Part2_D_3 Monitoring the process of testing and commissioning of all systems, plant and equipment in the project
2 3.11
Part2_D_2 Review of contract documents (engineering drawings, technical specifications, manuals for project maintenance and operation, warranty documents) after completion of the project
3 3.36
The handover of the project to the clients at the end of construction is a very
important stage of the project procurement process and facility operation success.
Reflecting the importance of the handover phase, it can be seen that the level of
client involvement in the handover tasks was nearly high. A well-organised, efficient
and effective transfer of information from the project contractors to the owner of
the project is essential. The commissioning and fine-tuning of operations during
handover can impact significantly on the use of the project if not managed in a
structured manner.
Operations and Maintenance Phase
The respondents’ level of involvement in the operations and maintenance phase
was the lowest amongst all the phases. The average client involvement in the O&M
phase was 2.06 (Table 4.12), which is considered low involvement based on the
involvement scale profile (Figure 4.3). In the present study, the O&M phase was
represented through four tasks. Table 4.17 presents the results on the respondents’
level of involvement as clients in the O&M phase.
Table 4.17: Mean rank of client involvement in O&M phase
Code Operation and Maintenance Phase Activities (Tasks) Rank Mean
Part2_E_1 Prepare the maintenance plan describing the maintenance schedules and lists the tasks
1 1.93
Part2_E_4 Building up the inventory including the important spare parts to maintain and operate the project with minimum “down time”
2 1.98
Part2_E_2 Prepare the operation information such as; How to operate the systems, Important safety instructions, and Troubleshooting data; to assist in solving problems and prevent unexpected expensive
3 2.09
Part2_E_3 Record the warranties and certificates reference information 4 2.24

83
The level of client involvement in all the O&M tasks was low (scale 1.8 to 2.6). The
successful operation and maintenance of a completed project is closely associated
with the level of client involvement. A project team benefits by giving careful
consideration to the O&M objectives during the project's planning, design and
construction. One strategy that should be considered during the construction
process is that the project owner may assign a special O&M representative to
advise the project team on how to complete the product in a manner that best
achieves the project's O&M needs.
Client Involvement Based on Project Ownership
The survey gathered data that enables the level of client involvement to be
analysed by reference to the type of project ownership (public or semi-public) (as
shown above in Table 4.12). The results show that the respondents were more
involved as clients in some phases of semi-public projects than in public projects.
These results are shown in detail in Appendix D (Table D-2-3 in Section D-2-2).
Figure 4.5 illustrates the client involvement profile for the public and semi-public
project ownership. The chart clearly shows the diversity between the levels of client
involvement in public and semi-public projects. The clients in semi–public projects
are more involved in some phases such as the design phase compared to the clients
in the public projects.
To investigate the differences in the levels of client involvement, Mann-Whitney
tests were applied to test for the significance of the differences between the mean
ranks of the two various groups (public and semi-public). Five tables were
developed (Appendix E, Section E-1) to investigate the significance of the
differences in client involvement in each project phase between the two groups of
project ownership. A comparison of these data with Figure 4.5 provides evidence on
the differences and similarities in some project tasks. For example, the p value of
item A3 (Part2_A_3) is greater than 0.5 (not significant) (Appendix E, Table E-1-1)
which means the mean rank of the item is almost equal in both groups of project
ownership. Comparing this with Figure 4.5, the lines of involvement in both the
public and semi-public projects were almost identical for item A3.

84
Figure 4.5: Client involvement in public and semi-public construction projects
In general, the respondents’ involvement as clients in both project ownership types
had some similarities and differences across the five construction project phases
(Appendix E, Section E1 and Figure 4.5). The most significant difference between
the mean ranks was evident in the design phase, with a high level of client
involvement in semi-public projects and a low level of client involvement in public
projects in this phase. This might be due to the tendency to fully utilise consultancy
services in the design phase of a public project.
Client Involvement Based on Project Type
The survey gathered data that enables the level of client involvement to be
analysed by reference to the type of project (as presented above in Table 4.12). The
results showed that clients in infrastructure projects were more involved in some
tasks than the clients in other project types (Appendix D, Section D-2-3, Table D-2-

85
4). Figure 4.6 presents the client involvement profile for all the project types, and
depicts the diversity of the involvement levels between the project types.
To investigate the differences in the levels of client involvement among the four
different project types, Kruskal-Wallis tests were used to test for the significance of
the differences between the mean ranks of the groups (building, infrastructure,
industrial, and other). Five tables were developed (Appendix E, Section E-2) to
investigate the significance of the differences in client involvement between the
project types in each construction project phase. Data from the tables (Appendix E,
Section E2) were compared with the data in Figure 4.6 to find evidence on the
differences in the project tasks. The differences in the levels of involvement in the
forty tasks in the five construction project phases were significant across the project
types (p<0.05) except for three items (Part2_B_2, Part2_B_4 and Part2_C_10).
Figure 4.6: Client involvement in different project types
1
2
3
4
5
A1A2
A3A4
A5
A6
A7
A8
A9
A10
A11
B1
B2
B3
B4
B5
B6
B7B8
B9B10
B11C1
C2
C3
C4
C5
C6
C7
C8
C9
C10
C11
D1
D2
D3
E1
E2E3
E4
Infrastructure IndustrialOther BuildingOverall
1 2 3 4 5 Not Involvment
Strongly Involvment

86
Overall, the results (Appendix E, Section E2 and Figure 4.6) show significant
differences in the levels of client involvement in different project types during the
construction project phases. In most cases, the level of involvement in the tasks was
low or very low for all project types, except for the infrastructure project type. As
shown above in Figure 4.6, the respondents’ levels of involvement as clients in the
eight tasks in infrastructure projects were rated very high. Figure 4.7 presents a
comparison of the respondents’ involvement as clients in construction project
phase through three different perspectives: (1) involvement based on overall data;
(2) involvement based on the project ownership (public and semi-public); and (3)
involvement based on the type of project (building, infrastructure, industrial, and
other).
Figure 4.7: Comparison of client involvement among different perspectives
4.4.2 Construction Project Phase Ranking of Importance
The second aim of this section is to analyse the questionnaire responses in order to
identify the most important phase in a construction project based on the views of
the respondents. This would help to identify the phase that needs more attention to
ensure a construction project is successful. At the end of Part 2 of the
1
2
3
4
5
Planning Design Construction Handover O & M
Mean
Project Construction Phase
Overall
Public
Semi-Public
Building
Infrastructure
Industrial
Other
Involvement Scale
Low
Very High
Very Low
High
Neutral
1.8
1
2.6
3.4
4.2
5

87
questionnaire, the respondents were asked to rank the five phases from the most
important to the least important. A summary of the results is presented in Table
4.18. The design phase was ranked as the most important phase in semi-public
projects while the planning phase was ranked as the most important phase in public
projects. The operations and maintenance phase was ranked as fifth as the least
important phase in both semi-public and public projects.
Table 4.18: Construction project phase in order of importance
Construction Project Phase
Public (N=95)
Semi-Public (N=128)
Overall (N=223)
Mean Rank Mean Rank Mean Rank
Planning 1.58 1 2.33 2 2.01 2
Design 2.27 2 1.61 1 1.89 1
Construction 2.65 3 2.92 3 2.81 3
Handover 3.71 4 4.01 4 3.88 4
Operations and Maintenance 4.79 5 4.13 5 4.41 5
The Friedman test was also conducted to detect the differences across the related
variables and rank them. The results of the Friedman test are presented in Table
4.19. The mean rank values show clearly that the design phase was the most
important phase and was ranked as the priority phase for clients during a
construction project. The other phases were ranked as follows: (2) planning phase;
(3) construction phase; (4) handover phase; and (5) operations and maintenance
phase. Moreover, the p value was significant (p<0.05) which means that there were
differences between all five phases.
Table 4.19: Friedman test for construction project phase
Ranks Test Statisticsa
Mean Rank N 223
Planning 2.01 Chi-Square 447.247
Design 1.89 df 4
Construction 2.81 Asymp. Sig. .000
Handover 3.88 a. Friedman Test
Operations and Maintenance 4.41

88
4.5 Impact of Client Involvement on Project Delivery
Clients have three common goals: (I) high quality, (2) low cost; and (3) rapid
completion (Forgues, 2006). These three goals, however, are rarely achieved
completely since they are in part mutually exclusive. The second main research
question for the present study is focused on the impact of client involvement on the
project delivery outcomes in public sector projects in Saudi Arabia. The respondents
were asked, “To what extent were the projects implemented” in relation to the
following goals and expectations: (1) time, (2) cost, (3) quality, and (4) operational
satisfaction. Moreover, for an in-depth understanding of the impacts of client
involvement, this impact was investigated in three ways: (1) based on the overall
data; (2) based on organisational type (public or semi-public); and (3) based on
project type (building, infrastructure, industrial, and other). Figure 4.8 presents a
summary of the results, and all the output data are presented in Appendix D
(Section D-4).
Figure 4.8: Impact of client involvement on project implementation
As shown in the neutral and negative impacts depicted in Figure 4.8, the
respondents reported that projects were implemented with time delays, higher
1
2
3
4
5
Negative Impact
Positive Impact
1
2
3
4
5
Mean
Involvement Impact on Project Implemented
Time
Cost
Quality
Operation

89
costs than contracted, the typical quality was not high, and operations were slightly
satisfactory. This indicates that a low level of involvement during the construction
project phases (as shown above in Figure 4.7) has a negative impact on the end of
the project regarding the desired goals of high quality, low cost, on-time
completion, and no major disruptions in operations.
4.6 Factors Affecting Client Involvement
The level of client involvement in construction projects is influenced by a multitude
of interrelated factors. In the present study, these factors are classified as individual
factors, project factors and organisational culture factors (Chapter 2, Figure 2.10).
The third main research question in this study is focused on the identification of
these factors. Therefore, this section presents an analysis of Part 3 of the
questionnaire which investigated the individual, project and organisational culture
factors. The data scales used in Part 3 were “strongly disagree” to “strongly agree”
and a five-point Likert scale was used. The data analysis included: (1) descriptive
analysis for the existing elements, (2) ranking the factors based on the mean values
from the highest to lowest in order to explore the most influential factors according
to the respondents, and (3) exploratory factor analysis.
4.6.1 Individual Factors
The individual factors include 19 items as shown in Appendix C (Table C-1-3).
Descriptive statistics for the individual factors that influenced the respondents’
involvement as clients in construction projects were produced (Appendix D, Table
D-3-1). Figure 4.9 illustrates the mean values of the questionnaire responses
regarding the factors that affected the respondents’ involvement as clients in
construction projects.

90
Figure 4.9: Profile of individual factors influencing client involvement
Table 4.20 presents the mean values of the individual factors and the rankings from
the most influential factors to the lowest. On the Likert scale, 12 factors were scaled
from 4 to 5, six factors were scaled from 3 to 4, and one factor was scaled under 3.
Based on the sample’s responses, the 12 factors that had a strong effect on the
client involvement in projects were: 1) getting a professional certificate related to
projects; 2) getting training courses; 3) low client salary; 4) technical, planning,
organising and coordinating skills are very important for clients to be able to be
more effective in a project; 5) unfamiliarity with construction projects; 6) good
knowledge influences the teamwork, collaboration and effective communication; 7)
language differences disrupt effective communication; 8) job satisfaction and
overlapping in some project tasks that are not of related duties; 9) inability to
identify regulations and responsibilities within the project; 10) unfamiliarity with
project design; 11) more clients experience more quality in project involvement;
and 12) emphasis on quick construction.
1
2
3
4
5
Strongly Disagree
Strongly Agree
1
2
3
4
5A1
A2
A3
A4
A5
A6
A7
A8
A9A10A11
A12
A13
A14
A15
A16
A17
A18
A19

91
Table 4.20: Ranking of existing individual factors from the highest to lowest
Rank Code Individual Factors Mea
n Std.
Deviation
1 Part3_A_4 Getting a professional certificate related to projects 4.57 .624
2 Part3_A_2 Training courses 4.55 .792
3 Part3_A_6 Low client salary 4.55 .757
4 Part3_A_19 Technical, planning, organising, and coordinating skills are very important for clients to be able to be more effective in a project
4.55 .634
5 Part3_A_14 Unfamiliarity with a construction project 4.48 .740
6 Part3_A_18 Good knowledge is influencing the teamwork, collaboration and effective communication
4.46 .702
7 Part3_A_5 Language differences disrupt effective communication 4.40 .740
8 Part3_A_7 Job satisfaction and overlapping in some project tasks that are not of related duties
4.37 .771
9 Part3_A_12 Inability to identify regulations and responsibilities within the project
4.24 .749
10 Part3_A_13 Unfamiliarity with project design 4.20 .786
11 Part3_A_1 More clients experience more quality in project involvement 4.11 .842
12 Part3_A_17 Emphasis on quick construction 4.03 .956
13 Part3_A_3 Attend international conferences 3.99 1.076
14 Part3_A_10 Inability to make appropriate decisions 3.92 .953
15 Part3_A_9 Poor human relations 3.90 .829
16 Part3_A_11 Inability to identify the basic requirements of the project in the first phase of the design
3.84 1.138
17 Part3_A_15 Emphasis on low construction cost 3.62 1.480
18 Part3_A_8 Increases in working hours 3.24 1.155
19 Part3_A_16 Emphasis on high quality of project 2.80 1.266
Based on the questionnaire responses, the first five items had the most influence on
client involvement. These five items, namely, professional certificate, good training,
reasonable salary, developing skills, and unfamiliarity in construction projects, apply
to most new engineers in the construction field. In general, it can be inferred that
the 12 items ranked in the questionnaires are related to the knowledge
development of the project members who can address these items by getting more
training, developing skills, becoming familiar with project process and developing
communication skills. As discussed previously, knowledge development in Saudi
Arabia is weak and the country has been cited for the lack of real progress in
achieving good management and organisational performance (United Nations
Development Programme, 2003, 2009). This was clear in the demographic analysis
where the questionnaire (Part1_D_5) showed that 81.1% of the participants
attended zero to five training workshops in the last five years. This indicates some
weakness in the employee training programs offered by the government agencies.

92
Government agencies should be a model employer in developing their employees.
Any specific program introduced by the government organisation such as an
employee training program is an important indicator of the value placed on
employees. It can be used to transmit awareness to the employees about the
important goals and objectives of the organisation, the expected behaviour, the
various roles and extent of their responsibilities, and the communication networks.
This might help to improve employee outcomes and project management and
performance and would result in more effective client involvement in construction
projects.
Explanatory Factor Analysis
EFA was also applied to the data in order to understand and highlight any
interesting relationships between the factors. Factor analysis is also a tool to extract
information from large databases and identify the interrelated data (Hair et al.,
2010). In other words, it creates new combinations of variables as replacements for
the original variables. The factor analysis was done for all 19 items that represented
the individual factors as one group. SPSS for Windows (v21) was used. The result of
the EFA test is presented in detail in Appendix F (Section F-2). The Bartlett test of
overall significance showed it to be significant (sig. = 0.000) and the Kaiser-Meyer-
Olkin measure of sampling adequacy was 0.687, which is greater than the required
critical level of 0.5. Thus, it was appropriate to proceed with factor analysis. Since
the objective of applying factor analysis was to reduce the original variance to a
minimal number of factors, PCA was used to extract the factors. From the rotated
component matrix (Appendix F, Section F-2), five groups were generated and
named. Table 4.21 presents the results generated from the factor analysis test.

93
Table 4.21: Factor analysis of individual factors
Code Individual Factors Loading
Group 1: Low knowledge and experience lead to poor decision making in the early stage of design
Part3_A_10 Inability to make appropriate decisions .857
Part3_A_3 Attend international conferences .836
Part3_A_9 Poor human relation .742
Part3_A_11 Inability to identify the basic requirements of the project in the first phase of the design
.738
Part3_A_1 More clients experience more quality in project involvement .719
Group 2: Inability to communicate clearly and weak in training with low knowledge lead to failure to identify the project regulations and responsibilities Part3_A_2 Training courses .829
Part3_A_18 Good knowledge is influencing the teamwork, collaboration and effective communication
.768
Part3_A_5 Language difference disrupt effective communication .711
Part3_A_12 Inability to identify regulations and responsibilities within the project .639
Group 3: No satisfaction in the job or with the salary leads to low client expectation
Part3_A_17 Emphasis on quick construction .754
Part3_A_7 Job satisfaction and overlapping in some project tasks that are not of related duties
.711
Part3_A_6 Low client salary .661
Part3_A_4 Getting a professional certificate related to projects .583
Group 4: Insufficient personal skills and long work hours lead to low client expectation
Part3_A_15 Emphasis on low construction cost .690
Part3_A_8 Increases in working hours .679
Part3_A_16 Emphasis on high quality of project .629
Part3_A_19 Technical, planning, organising and coordinating skills are very important for clients to be able to be more effective in project
-.541
Group 5: Low expertise in design and construction
Part3_A_13 Unfamiliarity with project design .609
Part3_A_14 Unfamiliarity with a construction project .529
The five groups identified in the analysis match some of the problems and obstacles
in the Saudi construction sector highlighted by other sources. Many recent media
reports have focused on the major delays in Saudi construction projects, with delays
said to be caused by (Alsalim, 2013)the clients, contractors and other factors (Al-
Kharashi & Skitmore, 2009; Althynian, 2010). As discussed in the literature review
(Chapter 2, Section 2.2.3), Al-jarosha (2010), Al-Kharashi and Skitmore (2009), Al-
Yahya (2009), Alsalim (2013), Althynian (2010), the Anti-Corruption Commission
(2013) and Assaf and Al-Hejji (2006) have emphasised the problems faced in the
Saudi construction projects; many of those problems resonate with the individual
factors highlighted in this analysis.

94
4.6.2 Project Factors
The project factors were not subjected to further analysis due to the results of the
reliability test. The results were found to be poorly reliable and the data were not
accepted (Table 4.4).
4.6.3 Organisational Culture Factors
Organisational culture factors include 23 items (Appendix C, Table C-1-3).
Descriptive statistics for the organisational culture factors that influenced the
respondents’ involvement as clients in construction projects were produced
(Appendix D, Table D-3-3). Figure 4.10 presents the means of the questionnaire
responses to the organisational culture that affected their involvement as clients in
construction projects.
Figure 4.10: Profile of organisational culture factors influencing client involvement
Table 4.22 presents the mean values of the organisational culture items and
rankings from the most influential item to the lowest. Only one item, namely, “clear
approach to succeed”, had a mean value higher than 3 (the cut-off point). The mean
values for the other 22 elements were lower than 3 and scaled between 2 to 3 on
the Likert scale. The highest value was 3.11 and the lowest value was 2.22,
indicating that there were no large differences between the 23 items. This indicates
that the respondents’ opinions were not strongly expressed or they did not have
1
2
3
4
5
Strongly Disagree
Strongly Agree
1
2
3
4
5C1
C2C3
C4
C5
C6
C7
C8
C9
C10
C11C12C13
C14
C15
C16
C17
C18
C19
C20
C21
C22C23

95
specific knowledge related to the organisational culture factors. This may point to a
weakness in organisational cultural whereby government agencies are not
sufficiently acting to improve the employee environment in general and the client
involvement in particular during the construction project process.
Table 4.22: Rank from the highest to lowest of existing organisational culture factors
Rank Code Organisational Culture Factors Mean Std.
Deviation
1 Part3_C_3 Clear approach to succeed 3.11 1.188
2 Part3_C_1 Clear goals 2.98 1.250
3 Part3_C_2 Actions are matched with organisation’s goals 2.89 1.093
4 Part3_C_10 Explicit set of performance standards 2.89 1.498
5 Part3_C_12 Emphasise good performance 2.83 1.570
6 Part3_C_8 Resolve internal problems effectively 2.79 1.447
7 Part3_C_7 Encourage information sharing 2.78 1.360
8 Part3_C_20 Atmosphere of trust 2.75 1.500
9 Part3_C_21 Accept criticism and negative feedback 2.74 1.264
10 Part3_C_9 Encourage interdepartmental collaboration 2.71 1.480
11 Part3_C_13 Welcome alternative solutions 2.67 1.463
12 Part3_C_4 Emphasise team contributions 2.65 1.543
13 Part3_C_23 Equitable reward 2.61 1.561
14 Part3_C_11 Guidance for performance improvement 2.60 1.593
15 Part3_C_5 Amicable exchange of opinions and ideas 2.56 1.615
16 Part3_C_22 Emphasise team accountability 2.56 1.354
17 Part3_C_6 Members’ commitment to the team 2.48 1.559
18 Part3_C_17 Employees’ participation in decision-making process 2.47 1.338
19 Part3_C_18 Employees’ input into major decisions 2.46 1.413
20 Part3_C_14 Encourage creative and innovative ideas 2.42 1.474
21 Part3_C_19 Recognise and reward members’ performance 2.39 1.426
22 Part3_C_16 Value employees’ ideas 2.29 .962
23 Part3_C_15 Allocate resources for implementing innovative ideas 2.22 1.328
Explanatory Factor Analysis
EFA was also applied to these data. The factor analysis was done for the 23 items as
one group. SPSS for Windows (v21) was used. The result of the EFA test is presented
in detail in Appendix F (Section F-3). The Bartlett’s test of overall significance
showed it to be significant (sig. = 0.000) and the Kaiser-Meyer-Olkin measure of
sampling adequacy was 0.920, which is greater than the required critical level of
0.5. Thus, it was appropriate to proceed with factor analysis. Since the objective of
applying factor analysis was to reduce the original variance to a minimal number of

96
factors, PCA was used to extract the factors. From the rotated component matrix
(Appendix F, Section F-3), three groups were generated. Table 4.23 presents the
results generated from the factor analysis test.
Table 4.23: Factor analysis for organisational culture factors
Code Organisational Culture Factors Loading
Group 1: Performance, innovation and team orientation
Part3_C_9 Encourage inter-departmental collaboration .861
Part3_C_7 Encourage information sharing .858
Part3_C_14 Encourage creative and innovative ideas .850
Part3_C_8 Resolve internal problems effectively .838
Part3_C_12 Emphasise good performance .828
Part3_C_10 Explicit set of performance standards .814
Part3_C_13 Welcome alternative solutions .791
Part3_C_6 Members’ commitment to the team .775
Part3_C_15 Allocate resources for implementing innovative ideas .760
Part3_C_11 Guidance for performance improvement .756
Part3_C_5 Amicable exchange of opinions and ideas .718
Part3_C_4 Emphasise team contributions .677
Group 2: Members’ participation in decision-making process and reward system
Part3_C_1 Clear approach to succeed .809
Part3_C_19 Recognise and reward members’ performance .731
Part3_C_20 Atmosphere of trust .721
Part3_C_17 Employees’ participation in decision-making process .702
Part3_C_23 Equitable reward .700
Part3_C_16 Value employees’ ideas .685
Part3_C_21 Accept criticism and negative feedback .680
Part3_C_18 Employees’ input into major decisions .652
Part3_C_22 Emphasise team accountability .642
Group 3: Goal setting and accomplishment
Part3_C_2 Clear goals .880
Part3_C_3 Actions are matched with organisation’s goals .740
The first group, labelled “Performance, innovation and team orientation” consisted
of 12 factors. Three of these factors relate to employee performance and
emphasise the establishment of a performance standard. Government agencies
should encourage employees to do a good job by improving their skills so they can
achieve higher levels of performance. Another three factors in the group are related
to innovation. Government agencies should value the ideas of employees at every
level and encourage them to search for better ways of getting the job done.
Innovation also helps improve performance. The remaining six factors in the group

97
are related to team orientation. Team orientation emphasises cooperation and
assistance between the people within the organisation. Government agencies
should emphasise team contributions rather than individual contributions through
an open exchange of opinions and ideas. Sharing of information, solving problems
and cooperating across departments should be encouraged.
The second group created by the PCA was labelled “Members’ participation in
decision-making process and reward system” and consisted of nine factors.
Participation in the decision-making process in an organisation is essential. Making
the right decision is typically not a simple matter, as most decision problems in
construction projects are highly complex in nature. Therefore, government agencies
should adopt a reward scheme to recognise good performance.
The third group was labelled “Goal setting and accomplishment” and consisted of
two factors. An organisation’s members have to understand and achieve the
organisational goal. Government agencies with a clear goal and mission are stable
(Denison, 2000). This stability will guide the employees to implement and improve
the organisational strategies as clients in the construction process. It is noted that
the three highest ranked organisational culture factors in the construction sector,
according to the respondents, were: a clear approach to succeed, clear goals, and
actions that are matched with the organisation’s goals (Table 4.22 above).
4.7 Summary
The purpose of the analysis presented in this chapter was to investigate the
respondents’ involvement as clients during construction projects activities and to
find the factors that influence the involvement. This chapter presented the findings
of the statistical analyses of the data collected from the survey in the present study.
Of 315 questionnaires sent to Saudi government agencies, 223 were returned with
complete answers. The profiles of the responding government agencies were
outlined and descriptive statistics of the respondents' demographic profiles were
introduced. Descriptive statistical analyses of the respondents' current practices as
clients in construction projects were then presented. Descriptive statistical analyses
of the relevant individual, project and organisational culture factors were provided.

98
An inferential statistical analysis of testing was also conducted. The mean, median,
mode, range and standard deviation were used to identify the central tendency of
the research variables. The Cronbach’s alpha test was applied to check the reliability
of the measures. The frequency distributions of the variables were obtained and
generated as tables, graphs and pie charts. Factor analysis was used for the
individual and organisational culture factors to represent the variable groups.
Based on the analysis of the results, this research found that the sample was
generally targeted different types of government agencies, different types of
construction project in Saudi Arabia. With these different segments, it has been
identified that the clients have low involvement during the construction project
tasks.
The next chapter describes the use of SEM to study the impact of the individual
factors and organisational culture factors on the respondents’ involvement as
clients in construction project. SEM is used to develop and propose a model to
improve the situation in order to have more positive outcome in construction
project delivery.

99
CHAPTER 5 FACTORS INFLUENCING CLIENT INVOLVEMENT: SEM
5.1 Introduction
The previous chapter (Chapter 4) analysed the data collected from the survey about
the respondents’ involvement as clients in public projects in the construction sector
in Saudi Arabia. This included the respondents’ demographic profile based on
characteristics such as the type of government organisation they represented
(public or semi-public) and their age, education and years of experience. The data
analysis also measured the level of the respondents’ involvement as clients in the
five phases of a construction project cycle, which addressed Research Question 1.
The impact of client involvement on the outcomes of a public construction project
was then investigated, addressing Research Question 2. Lastly, the analysis focused
on the relevant individual, project and organisational culture factors that influence
client involvement, which addressed Research Question 3. From the results
obtained in Chapter 4, additional inferential statistical analysis is desirable to
further investigate the influence of individual and organisational culture factors on
client involvement.
This chapter 5 describes the steps to investigate the influence of individual factors
and organisational culture factors on client involvement. This addresses Research
Question 4: “How do those factors influence the clients’ involvement and lead to
improved project performance?” Using SEM, this part of the study links the first
three research questions by finding the relations between all the elements and
answering Research Question 4.
5.2 Preliminary Structural Model
The preliminary structural model aims to identify the influence of the individual
factors and organisational culture factors on the respondents’ involvement as

100
clients in the construction project phases. SEM is used to build the structural model
and understand the impact of the individual factors and organisational culture
factors on involvement in construction projects with reference to the project
delivery expectations. The structural equation model is divided into two parts: a
measurement model, and a structural model. The measurement model deals with
the relationships between measured variables (indicators) and latent variables. The
structural model deals with the relationships between latent variables only. Figure
5.1 shows the involvement domain of the clients in construction projects. As shown,
the three latent variables are: (1) project phase, (2) client involvement, and (3)
project delivery expectation.
Figure 5.1: Involvement domain of the clients
To study the impact of individual and organisational culture factors on client
involvement, the individual and organisational culture factors are linked to the
project phases and client involvement as shown in Figure 5.2. The model studies the
direct effect of the individual factors and organisational culture factors on the
clients’ involvement. The model also studies the indirect effect of the individual
factors and organisational culture factors on the project phases. In addition, the
model identifies whether the individual factors or organisational culture factors
have a more significant impact on the clients’ involvement.

101
Figure 5.2: Latent variables of preliminary structural model
Each latent variable in Figure 5.2 is measured by some indicators. The project phase
variable is measured by a total of 40 tasks (indicators). The individual factors,
organisational culture factors, and project delivery expectations are measured by
19, 23 and 4 items, respectively. To simplify and improve the whole structural
model fit, SEM is conducted for each latent variable one by one to define the
measurement model fit using AMOS as explained in the following subsections.
5.2.1 Project Phases Measurement Model Fit
The construction project variable consists of five phases, namely, the planning
phase, design phase, construction phase, handover phase and operations and
maintenance phase. For each phase, there are indicators that represent the project
tasks. Figure 5.3 presents the initial project phase model. The data used are from
the observed measurements of Part 2 of the questionnaire.
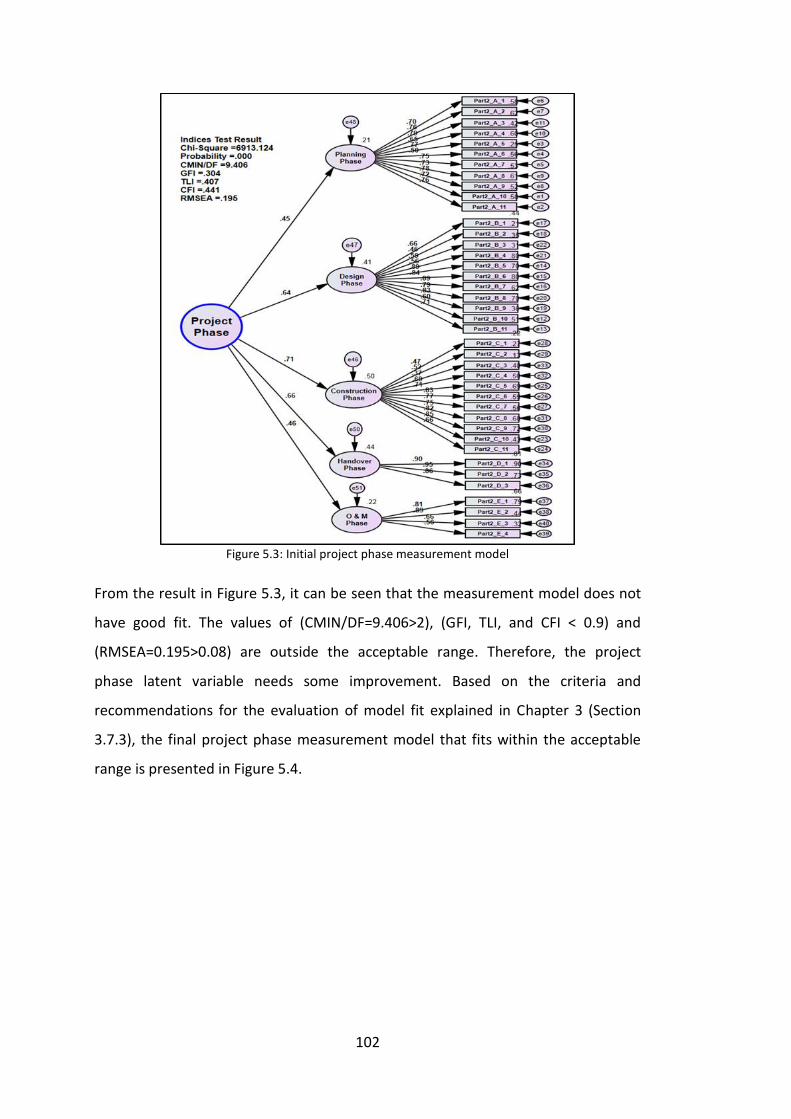
102
Figure 5.3: Initial project phase measurement model
From the result in Figure 5.3, it can be seen that the measurement model does not
have good fit. The values of (CMIN/DF=9.406>2), (GFI, TLI, and CFI < 0.9) and
(RMSEA=0.195>0.08) are outside the acceptable range. Therefore, the project
phase latent variable needs some improvement. Based on the criteria and
recommendations for the evaluation of model fit explained in Chapter 3 (Section
3.7.3), the final project phase measurement model that fits within the acceptable
range is presented in Figure 5.4.

103
Figure 5.4: Final project phase measurement model fit
As shown in Figure 5.4, the values of the project phase measurement model are:
model probability=0.003, CMIN/DF=1.848<2.00, GFI=0.921>0.9, TLI=0.966>0.9,
CFI=0.977>0.9 and RMSEA=0.08. All the values achieve the desired model fit value.
Three phases remain in the project phase model fit, namely, the design phase,
construction phase and handover phase, with significant loading estimates over 0.5.
Most of the indicators that measure the three phases (construct) have significant
loadings of over 0.5. In addition, the modification indices (Appendix G, Table G-1)
show all the error covariance values to be less than 10. The residual standard error
values (Appendix G, Table G-1) are within the desired range (less than 2). Therefore,
this measurement model is accepted for inclusion in the whole structural model.
Table 5.1 presents the description of each code in the project phase measurement
model fit.

104
Table 5.1: Code description of project phase measurement model fit
Code Project Phase
B-Design Phase Part2_B_6 Following the progress of design
Part2_B_8 Review of design documents
Part2_B_9 Monitor and guarantee design quality
C-Construction Phase Part2_C_6 Taking necessary decisions against contractor claims during project implementation
Part2_C_7 Monitoring and control of implementation methods and cost, as well as work schedule and contractor productivity
Part2_C_8 Stress implementation quality and monitoring safety principles during project implementation
Part2_C_9 Establishment of a system and written code to ensure implementation quality, to be referred to by personnel in charge of implementation quality assurance and control
D-Handover Phase Part2_D_1 Establishment of criteria for acceptance of completed project
Part2_D_2 Review of contract documents (engineering drawings, technical specifications, manuals for project maintenance and operation, warranty documents) after completion of the project
Part2_D_3 Monitoring the process of testing and commissioning of all systems, plant and equipment in the project
5.2.2 Individual Factors Measurement Model Fit
The individual factors variable contains 19 indicators. Figure 5.5 presents the initial
individual factors measurement model. The data used are from the observed
measurements of Part 3 in the questionnaire.
Figure 5.5: Initial individual factors measurement model
From the result in Figure 5.5, it can be seen that the measurement model does not
have good fit. The values of (CMIN/DF=10.935>2), (GFI, TLI and CFI < 0.9) and
(RMSEA=0.212>0.08) are outside the acceptable range. Therefore, the individual

105
factors latent variable needs some improvement. The final individual factors
measurement model that fits within the acceptable range is presented in Figure 5.6.
Figure 5.6: Final individual factors measurement model fit
As shown in Figure 5.6, the values of the individual factors measurement model are
CMIN/DF=2.109, GFI=0.978>0.9, TLI=0.975>0.9, CFI=0.987>0.9 and RMSEA=0.08. All
the values achieve the desired model fit value. Most of the indicators that measure
the individual factors (construct) have significant loadings of over 0.5. In addition,
the modification indices (Appendix G, Table G-2) show all the error covariance
values to be less than 10. The residual standard error values (Appendix G, Table G-2)
are within the desired range (less than 2). Therefore, this measurement model is
accepted for inclusion in the whole structural model. Table 5.2 presents the
description of each code in the individual factors model fit.
Table 5.2: Code description of individual factors model fit
Code Individual Factors
Part3_A_3 Attending international conferences
Part3_A_9 Poor human relations
Part3_A_10 Inability to make appropriate decisions
Part3_A_11 Inability to identify the basic requirements of the project in the first phase of the design
Part3_A_13 Unfamiliarity with project design

106
5.2.3 Organisational Culture Factors Measurement Model Fit
The organisational culture factors consist of 23 indicators. Figure 5.7 presents the
initial organisational culture factors measurement model. The data used are from
the observed measurements of Part 3 in the questionnaire.
Figure 5.7: Initial organisational culture factors measurement model
From the result in Figure 5.7, it can be seen that the measurement model does not
have good fit. The values of (CMIN/DF=11.212>2), (GFI, TLI, and CFI < 0.9) and
(RMSEA=0.214>0.08) are outside the acceptable range. Therefore, the
organisational culture factors latent variable needs some improvement. The final
organisational culture factors measurement model that fits within the accepted
range is presented in Figure 5.8.

107
Figure 5.8: Final organisational culture factors measurement model fit
As shown in Figure 5.8, the values of the organisational culture factors
measurement model are CMIN/DF=2.341, GFI=0.983>0.9, TLI=0.985>0.9,
CFI=0.994>0.9 and RMSEA=0.078. All the values achieve the desired measurement
model fit value. Most of the indicators that measure the organisational culture
factors (construct) have significant loadings of over 0.5. In addition, the
modification indices (Appendix G, Table G-3) show all the error covariance values to
be less than 10. The residual standard error values (Appendix G, Table G-3) are
within the desired range (less than 2). Therefore this measurement model is
accepted for inclusion in the whole structural model. Table 5.3 presents the
description of each code in the individual factors model fit.
Table 5.3: Code description of organisational culture factors model fit
Code Organisational Culture Factors
Part3_C_4 Emphasise team contributions
Part3_C_5 Amicable exchange of opinions and ideas
Part3_C_16 Value employees’ ideas
Part3_C_21 Accept criticism and negative feedback
Part3_C_22 Emphasise team accountability
5.3 Final Structural Model
As explained above, the preliminary structural model is based on the first four main
questions (Figure 5.2). To complete the final structural model, Figure 5.2 is
expanded and linked to all the measurement models developed in Section 5.2.
Figure 5.9 presents the initial version of the whole structural model which links the

108
project phase measurement model, the individual factors measurement model, and
the organisational culture measurement model. This section presents the structural
model in three ways. The first way is by studying only the impact of individual
factors on client involvement. The resulting model is called the “whole structural
model with individual factors”. The second way is by studying only the impact of the
organisational culture factors on client involvement. The resulting model is called
“whole structural model with organisational culture factors”. The third way is by
studying the influence and impact of both individual factors and organisational
culture factors on the client involvement. The effects between the individual factors
and organisational culture factors are also considered. The resulting model is called
the “whole structural model with individual factors and organisational culture
factors”.
Figure 5.9: Initial whole structural model
5.3.1 Whole Structural Model with Individual Factors
From the result in Figure 5.10, it can be seen that the whole structural model with
individual factors does not have good fit. The values of (CMIN/DF=4.496>2), (GFI,
TLI and CFI < 0.9) and (RMSEA=0.125>0.08) are outside the acceptable range.
Therefore, the model requires modification and improvement to increase the
goodness of fit. The final model that fits with the acceptable range is presented in
Figure 5.11.

109
Figure 5.10: Initial whole structural model with individual factors
As shown in Figure 5.11, the overall model fit measures are CMIN/DF=1.939,
GFI=0.900>0.9, TLI=0.956>0.9, CFI=0.967>0.9 and RMSEA=0.078. All the values
achieve the desired model fit value. Most of the indicators have significant loadings
of over 0.5. In addition, the modification indices (Appendix G, Table G-4) show all
the error covariance values to be less than 10. The residual standard error values
(Appendix G, Table G-4) are within the desired range (less than 2). Therefore, this
model is accepted and the model achieves goodness of fit.
Figure 5.11: Final whole structural model with individual factors

110
5.3.2 Whole Structural Model with Organisational Culture Factors
From the result presented in Figure 5.12, it can be seen that the whole structural
model with organisational culture factors does not have good fit. The values of
(CMIN/DF=4.157>2), (GFI, TLI, and CFI < 0.9) and (RMSEA=0.119>0.08) are outside
the acceptable range. Therefore, the model requires modification and improvement
in order to increase the goodness of fit. The final model that fits within the
acceptable range is presented in Figure 5.13.
Figure 5.12: Initial whole structural model with organisational culture factors
As shown in Figure 5.13, the overall model fit measures are CMIN/DF=2.188,
GFI=0.922>0.9, TLI=0.963>0.9, CFI=0.972>0.9 and RMSEA=0.073. All the values
achieve the desired model fit value. Most of the indicators have significant loadings
of over 0.5. The modification indices (Appendix G, Table G-5) show all the error
covariance values to be less than 10. The residual standardised error values
(Appendix G, Table G-5) are within the desired range (less than 2). Therefore, this
model is accepted and the model achieves goodness of fit.

111
Figure 5.13: Final whole structural model with organisational culture factors
5.3.3 Whole Structural Model with Individual Factors and Organisational Culture Factors
From the result presented in Figure 5.14, it can be seen that the whole structural
model with individual and organisational culture factors does not have good fit. The
values of (CMIN/DF=4.693>2), (GFI, TLI, and CFI < 0.9) and (RMSEA=0.129>0.08) are
outside the acceptable range. Therefore, the model requires modification and
improvement to increase the goodness of fit. The final model that fits within the
acceptable range is presented in Figure 5.15.
Figure 5.14: Initial whole structural model

112
The overall model fit measures (Figure 5.15) are CMIN/DF=1.943<2, GFI=0.870<0.9,
TLI=0.941>0.9, CFI=0.952>0.9 and RMSEA=0.080. All the values achieve the desired
model fit value except for the GFI value which is lower than 0.9. Thus, the model
has four measurements within the acceptable range for goodness of fit. Most of the
indicators have significant loadings of over 0.5. The modification indices (Appendix
G, Table G-6) show all the error covariance values to be less than 10. The residual
standard error values (Appendix G, Table G-6) are within the desired range (less
than 2). Therefore, this model is accepted and the model achieves goodness of fit.
Figure 5.15: Final whole structural model with individual and organisational culture factors
5.4 Impact of Individual and Organisational Culture Factors on Client Involvement
As defined in the previous section, the structural models are: (1) the whole
structural model with individual factors, (2) the whole structural model with
organisational culture factors, and (3) the whole structural model with individual
factors and organisational culture factors. All the structural models achieve
goodness of fit, as summarised in Table 5.4. This section focuses on the impact of
the individual and organisational culture factors on client involvement according to
each structural model.
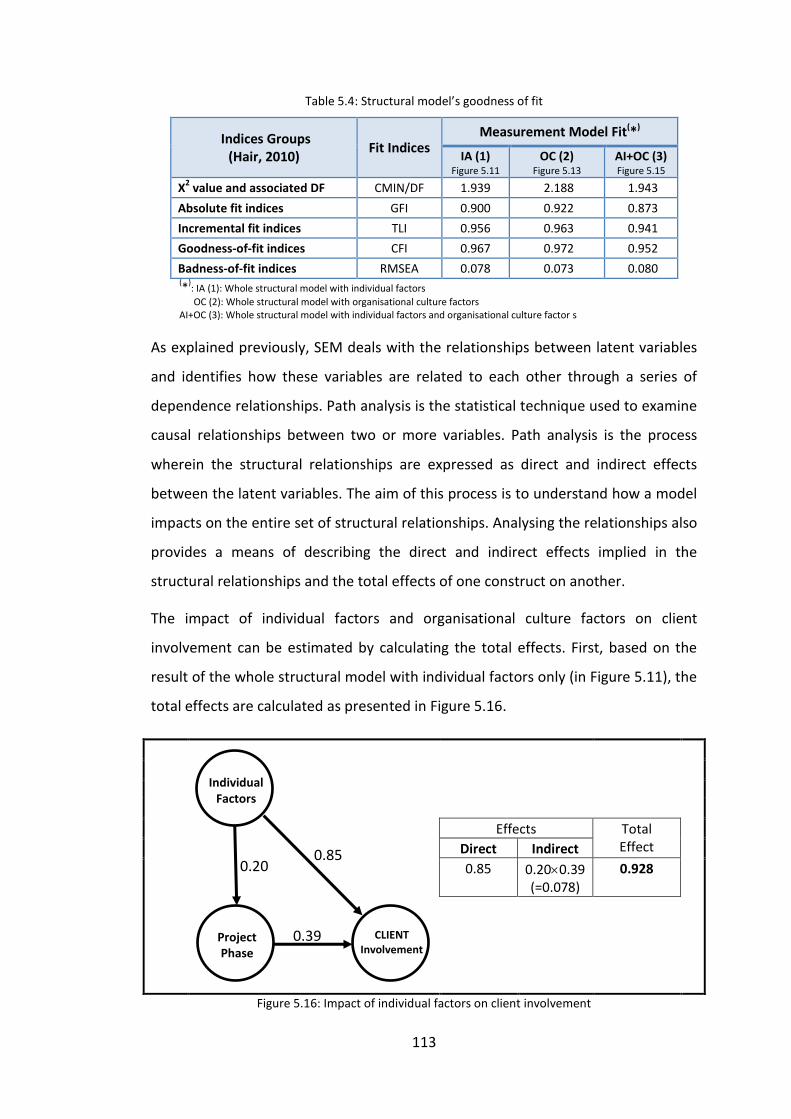
113
Table 5.4: Structural model’s goodness of fit
Indices Groups (Hair, 2010)
Fit Indices Measurement Model Fit(*)
IA (1) Figure 5.11
OC (2) Figure 5.13
AI+OC (3) Figure 5.15
X2 value and associated DF CMIN/DF 1.939 2.188 1.943
Absolute fit indices GFI 0.900 0.922 0.873
Incremental fit indices TLI 0.956 0.963 0.941
Goodness-of-fit indices CFI 0.967 0.972 0.952
Badness-of-fit indices RMSEA 0.078 0.073 0.080 (*
): IA (1): Whole structural model with individual factors
OC (2): Whole structural model with organisational culture factors AI+OC (3): Whole structural model with individual factors and organisational culture factor s
As explained previously, SEM deals with the relationships between latent variables
and identifies how these variables are related to each other through a series of
dependence relationships. Path analysis is the statistical technique used to examine
causal relationships between two or more variables. Path analysis is the process
wherein the structural relationships are expressed as direct and indirect effects
between the latent variables. The aim of this process is to understand how a model
impacts on the entire set of structural relationships. Analysing the relationships also
provides a means of describing the direct and indirect effects implied in the
structural relationships and the total effects of one construct on another.
The impact of individual factors and organisational culture factors on client
involvement can be estimated by calculating the total effects. First, based on the
result of the whole structural model with individual factors only (in Figure 5.11), the
total effects are calculated as presented in Figure 5.16.
Effects Total Effect
Direct Indirect
0.85 0.200.39 (=0.078)
0.928
Figure 5.16: Impact of individual factors on client involvement
Individual Factors
Project Phase
CLIENT Involvement
0.85 0.20
0.39

114
It can be seen from the calculation in Figure 5.16 that individual factors have a high
positive impact on client involvement. The direct impact of individual factors on
client involvement is highly significant with a value of 0.85. On the other hand,
individual factors have a low impact on project phases with a value of 0.2. The total
impact on client involvement by individual factors is highly significant with a value
of 0.92. The latent variable (individual factors) are measured by three indicators,
namely, Part3_A_3, Part3_A_10 and Part3_A_11, which have a significant
standardised loading of 0.67, 0.93 and 0.75, respectively.
Second, the impact of organisational culture factors on client involvement is
estimated by calculating the total effects. Based on the result of the whole
structural model with the organisational culture factors only (in Figure 5.13), the
total effects are calculated as presented in Figure 5.17.
Effects Total Effect
Direct Indirect
0.82 0.190.44 (=0.0836)
0.9036
Figure 5.17: Impact of organisational culture factors on client involvement
It can be seen from the calculation in Figure 5.17 that organisational culture factors
have a high positive impact on client involvement. The direct impact of
organisational culture factors on client involvement is highly significant with a value
of 0.82. On the other hand, organisational culture factors have a low impact on
project phases with a value of 0.19. The total impact on client involvement by
organisational culture factors is highly significant with a value of 0.9036. The
organisational culture factors latent variable is measured by three indicators,
Organisation Cultural Factors
Project Phase
CLIENT Involvement
0.82 0.19
0.44

115
Individual Factors
Project Phase
CLIENT Involvement
0.59
0.11
0.36
Organisation Cultural Factors
0.61
0.12 0.36
Organisation Cultural Factors
Project Phase
CLIENT Involvement
0.59 0.11
0.36
Individual Factors
0.61
0.12 0.36
namely, Part3_C_4, Part3_A_16 and Part3_A_22 which have a significant
standardised loading of 0.86, 0.65 and 0.95, respectively.
From the result above, it can be seen that both of the structural models presented
in Figure 5.11 and Figure 5.13 have a high impact on client involvement. Table 5.5
presents a comparison of these impacts. The next step in the analysis is to calculate
the impact of both individual and organisational culture factors on client
involvement as presented in the whole structural model with individual and
organisational culture factors (as shown above in Figure 5.15).
Table 5.5: Impact of individual and organisational culture factors on client involvement
Figure Relationships Effects Total
Effect Direct Indirect
5.11 Individual Client involvement 0.85 0.0780 0.9280
5.13 OC Client involvement 0.82 0.0836 0.9036
The impact of both individual and organisational culture factors on client
involvement can be estimated by calculating the total effects. From Figure 5.15, the
relationships between the variables are presented in Figure 15.18.
Figure 5.18: Relationship between variables of individual, organisational culture, and client
involvement

116
From Figure 5.18, it can be seen that there is more than one way to calculate the
impact on client involvement. Table 5.6 presents all the possible paths showing the
direct and indirect effects as well as calculating the total effects using the third
model presented in Figure 5.15.
Table 5.6: Total impact on client involvement
Relationships Path Effects
Total Effect Calculation Direct Indirect
OC CI 1 OC CI OC PP CI 0.36+0.120.36=0.4032 2 OC IF CI 0.36+0.610.59=0.7199
IF CI 3 IF CI IF PP CI 0.59+0.110.36=0.6296
[OC: Organisational culture, IF: Individual factors, PP: Project phases, CI: Client involvement]
It can be seen from the calculation in Table 5.6 that organisational culture factors
(path no. 2) have the highest positive impact on client involvement with a value of
0.7199. Organisational culture factors also have a direct positive high impact on
individual factors with a value of 0.61. Individual factors have a direct positive high
impact on client involvement with a value of 0.59 and a total effect of 0.6296 (path
no. 3). This indicates that organisational culture plays an important role in both
individual factors and client involvement. Moreover, the individual factors and
organisational culture factors latent variables are measured by three indicators
each, as presented in Table 5.7.
Table 5.7: Indicators that measure the latent variable (OC and IF)
Code Individual Factors Significance of Standardised
Loading
Part3_A_3 Attending international conferences 0.71 Part3_A_10 Inability to make appropriate decisions 0.89 Part3_A_11 Inability to identify the basic requirements of the
project in the first phase of the design 0.79
Code Organisational culture Aspects Significance of Standardised
Loading
Part3_C_4 Emphasise team contributions 0.83 Part3_C_16 Value employees’ ideas 0.60 Part3_C_22 Emphasise team accountability 0.98

117
5.5 Summary
This chapter introduced SEM using the AMOS application to investigate the impact
of individual factors and organisational culture factors on the clients’ involvement in
construction projects with reference to the project delivery expectations. Three
structural models were introduced based on latent variables that affect the client
involvement, namely, the whole structural model with individual factors, the whole
structural model with organisational culture factors, and the whole structural model
with individual factors and organisational culture factors. All the models indicated
that the individual and organisational culture factors have a significant direct and
indirect impact on client involvement. Each of the latent variables was measured by
three indicators with high standardised loading. Based on the findings presented in
Chapter 4 and Chapter 5 that address the four research questions, Chapter 6
presents further interpretation and discussion on ways to improve the level of client
involvement.
118
CHAPTER 6 DISCUSSION
6.1 Introduction
This chapter interprets and discusses the findings presented in the previous
chapters. The links between the chapters of the thesis are identified, before
drawing conclusions and reflecting on the implications of the research findings. The
present study was designed to investigate client involvement in construction
projects in Saudi Arabia and to propose and develop a model (models) to enhance
client involvement in order to have more positive outcomes in construction project
delivery. To achieve this aim, four questions were developed: (1) What is the
current practice of client involvement in Saudi construction projects?; (2) What is
the impact of client involvement on project performance?; (3) What are the main
factors affecting the clients’ involvement?; and (4) How do those factors influence
the clients’ involvement and lead to improved project performance?
The literature review in Chapter 2 provided an overview of the topic and addressed
some of the research questions. It also helped to integrate the findings with the
existing body of knowledge. In Chapter 3, the research methodology outlined the
steps taken to investigate the research problem. A research design process was
developed to frame all the activities in the present study, as presented in Chapter 3
(Figure 3.1).
Chapter 4 presented the findings of the statistical analyses of the data collected
from the survey. Of 315 questionnaires sent, 223 were returned with complete
answers. Descriptive statistics on the participants' demographics were first
introduced. The survey also measured the respondents’ degree of involvement as
clients within the five phases of the construction project process, namely, the
planning phase, design phase, construction phase, handover phase, and operations
and maintenance phase. This part of the analysis was focused on the first main
research question. It also investigated the impacts of client involvement on the
project delivery outcomes, covering the second main research question. For the

119
third main question, the analysis covered the individual, project and organisational
culture aspects factors that affect client involvement. Chapter 5 investigated the
influence and impact of individual aspects and organisational culture aspects on
client involvement. Using SEM, this part linked the first, second and third main
research questions in order to find the relationships between all the elements and
answer the fourth research question. The findings related to the research questions
are interpreted and discussed in this chapter to improve the clients’ involvement in
construction project in Saudi Arabia.
6.2 Current Client Involvement
The successful delivery of a construction project depends on having the correct and
accurate outcomes during each phase of the project. Clients play a major role
during the construction process. The present study investigated the current practice
of client involvement through the five construction phases with the aim to find the
factors that influence or limit the client involvement. This section discusses the
findings on the current practice of client involvement in each phase, the impact of
client involvement on project delivery, and the influence of the factors that obstruct
clients from being involved in the construction process.
6.2.1 Client Involvement in Project Phases
The client involvement in each phase of the construction process was identified in
Chapter 4 (Section 4.4). The results indicated that there was a variation in the
involvement of the respondents among the tasks in the construction project
process. This difference was expected because an opinion survey was used in the
research. One of the reasons for the differences may be the diversity in the
segments represented by the respondents in terms of the project ownership (public
and semi-public) and project type (building, infrastructure, industrial, and other).
This diversity is clear in the demographic data analysis presented in Chapter 4
(Section 4.3 and Table 4.12). Furthermore, Kruskal-Wallis and Mann-Whitney tests
were applied to compare the client involvement between the segments. As shown
in Chapter 4, there were significant differences in the client involvement in the

120
project phases between the two ownership types and the four project types. In the
ownership type segment, the current study found that the most significant
differences between the mean ranks between the two groups (public and semi-
public) were in the design phase. There was a higher level of involvement in semi-
public projects and weak involvement in public projects in the design phase. A
possible explanation for this might be the tendency to adopt consultancy services in
the design phase in public projects (Alnuaimi et al., 2009). Whelton, Ballard and
Tommelein (2002) also highlighted the importance of the design phase which is
considered critical because as much as 80% of a project can be specified in this early
phase. This also explains the various levels of quality achieved in different
construction project in government agencies due to the varying degrees of client
involvement in public construction (Assaf & Al-Hejji, 2006; Bubshait, 1994; Middle
East Economic Digest [MEED], 2010).
In the project type segment, the present study found that there were differences in
client involvement among the four different project types. The most significant
differences between the mean ranks among the four various project types (building,
infrastructure, industrial, and other) were in infrastructure projects. Infrastructure
projects in Saudi Arabia have been pro-actively developed by government since
1970. In the initial stage, there was an urgent need to develop the country’s
infrastructure. In more recent years, the government planned to spend an
estimated US$400 billion (SR1.5 trillion) on large infrastructure projects from 2010
to 2015 (Ministry of Finance, 2010). In July 2013, the ArRiyadh Development
Authority also announced the winners of three turnkey contracts for the
construction of a 176 km six-line driverless metro network in Riyadh with an overall
budget of US$22.5 billion, making it one of the world's largest public infrastructure
projects. In the last five years, clients have therefore been involved in successive
projects. This level of activity may explain why the client involvement in
infrastructure projects was higher than in the other project types.
The differences found in client involvement depending on the project ownership
segment or project type segment (Chapter 4, Table 4.12) are probably due to the
variations in the construction project management practices and different

121
approaches used in government agencies in Saudi Arabia since the 1970s (Al-
jarosha, 2010; Althynian, 2010; Bubshait & Al-Musaid, 1992). There are no general
guidelines to describe the role of public agencies in construction project
management. The varying degrees of client involvement in public construction
could also be a reason for the various levels of quality achieved in different
construction of government agencies (Assaf & Al-Hejji, 2006; Bubshait, 1994;
Middle East Economic Digest [MEED], 2010).
As identified in the current study, the construction project process has five phases
with 40 tasks that measure most activities during the construction project cycle.
Surprisingly, the survey revealed that clients had inadequate involvement in 38 out
of 40 tasks in the construction project phases as presented in Appendix D (Table D-
2-2). This means that the clients gave 50% or less of their efforts to 95% of the day-
to-day project activities. This low level of involvement is very likely to have a
negative impact on the project outcomes. Table 6.1 summarises the findings on the
average client involvement in Saudi construction project phases.
Table 6.1: Average client involvement in Saudi construction project phases
Construction Project Phases
Average Client involvement
Planning 2.07
Design 2.64
Construction 2.89
Handover 3.19
Operations and Maintenance
2.06
Overall Involvement (Scale out of 5) 2.57
In the planning phase, the average client involvement was 2.07 on the involvement
scale, which is considered low involvement. The levels of client involvement in
“Approval of the project cost”, “Doing feasibility study of the proposed project”,
and “Describing the responsibilities and powers of each member participating in the
project” were very low. These three tasks are highlighted as an example to illustrate
the importance of the planning tasks. The planning phase includes activities that

122
require a high level of authority to make decision, such as “Approval of the project
cost”. In any large project in Saudi Arabia, government agencies require formal
approval from the Ministry of Finance before awarding the contract (Government
Tenders and Procurement Law, 2006). The restrictions imposed by the Ministry of
Finance for approval of a project reduce the ability of clients to innovate in
construction due to limitations in the project budget. Therefore, it has been argued
that the budgetary and financial management system in Saudi Arabia needs to
reform and change (Albassam, 2011).
Another important activity in the planning phase is “Undertaking the project
feasibility study” which is an analysis of the ability to complete a project
successfully, taking into account legal, economic, technological, scheduling and
other factors. The consequences of not doing the feasibility study correctly may be
sufficient to stop the project. The risk of this consequence was evident in the low
client involvement in this task. Low client involvement in the planning phase may
account for the dramatic increase in the number of project delays in Saudi Arabia in
the last three years (Anti-Corruption Commission, 2013).
While the planning phase is important for making the right decisions to start the
project, the design phase is no less important for the project. Eighty percent of a
project can be specified at this phase (Whelton et al., 2002). In the present stud, the
average client involvement in the design phase was 2.64 on the involvement scale
which is considered neutral involvement. Clients need to have advanced knowledge
to be able to review the design documents. As shown in Chapter 2, there is
widespread recognition that more involvement by the client in the early design
stage has a positive impact on delivering the construction project successfully (Al-
Khalil & Al-Ghafly, 1999; Barrett et al., 1999; Institution of Civil Engineering, 1996;
Kamara & and Anumba, 2001; Love et al., 1998; Ryd, 2004; Shen et al., 2004;
Whelton et al., 2002).
It is important to recognise the close relationship between the design and
construction phases. The design phase is a process of creating the description of a
new project, usually represented by detailed plans and specifications, while the

123
construction phase is a process of identifying the activities and resources required
to make the design a physical reality. Clarification in design documents leads to less
conflict between the client and contractor (Al-Sedairy, 1994). This study found that
clients did not pay enough attention to the tasks that need to be implemented well
before constructing the project during the tender selection process. These tasks are
“Negotiating the contract price with the contractors qualified to do the job”,
“Checking the qualification of contractors competing to implement the project”,
“Interpreting and clarifying ambiguities in the contract documents and drawings”,
and “Explaining the objective of the project and providing the necessary
information for bidding” as presented in Chapter 4 (Table 4.15). Lack of attention to
these tasks might result in conflict in the construction project. These conflicts occur
most frequently in the key relationships of the contractor and the client, and the
contractor and the consultant. Research has found that the conflict was likely to
occur most strongly in the later stages of a project under construction (Althynian,
2010). Therefore, it is important to emphasise that the client needs to be pay more
attention to the design and construction phases.
The handover of the project to the client at the end of the construction is a very
important stage of the project procurement process and facility operation success.
Reflecting the importance of the handover phase, the level of client involvement in
handover tasks was found to be near a high level of involvement. A well-organised,
efficient and effective transfer of information from project contractors to the owner
of the project is essential. The commissioning and fine-tuning of operations during
handover can impact heavily on the use of the project if not managed in a
structured manner.
At the end of a project, project satisfaction is measured during the operations and
maintenance. However, in this study, the level of client involvement was found to
be the lowest amongst all the project phases. Successful operations and
maintenance of a completed project is closely associated with the level of client
involvement. Therefore, the project team benefits by giving careful consideration to
the operational and maintenance objectives during the project's planning, design
and construction stages. One suggestion for clients to consider during the

124
construction process is to assign a special O&M representative to advise the project
team on how to complete the product in a manner that best achieves the project's
O&M needs.
An important step in the current investigation was to study all the relations
between all tasks in the five phases and find the most significant items that are
important to the project process in general and clients in particular. For this
purpose, SEM was used. SEM deals with the relationships between measured
variables (tasks) and latent variables (project phases) as presented in Chapter 5
(Figure 5.3). The data used were from the observed measurements in Part 2 of the
questionnaire. Using the technique explained in Chapter 3 (Section 3.7.3) to find the
most important items that had a high impact on the project process, the final
project phase measurement model was presented in Chapter 5 (Figure 5.4). Table
6.2 summarises the findings and presents the items that were found to have the
most impact on the project phases. The design phase, construction phase and
handover phase were found to be the most significant and had a high level of
impact on the project process. The construction phase had the highest impact on
the project process, with a measurement of 0.85. The design phase and handover
phase were found to have less impact, with an equal measurement of 0.61. The
planning phase and operations and maintenance phase were also important in the
project activity cycle but were not significant in relation to client involvement in
construction projects. In the Saudi context, the most important task in the planning
phase is related to the major decision for approval of the project based on the
visibility study, and the authority for these decisions is restricted to the Ministry of
Finance. Another importance phase is the operations and maintenance phase that
keeps the project running in the way it was designed for. Most projects in Saudi
Arabia are run by specialist in operations and maintenance from the private sector.

125
Table 6.2: Most important phases and tasks in the construction project process
Latent Variables Measured Variables Project Phases Load Tasks Code Load
Design Phase
0.61
Following the progress of design Part2_B_6 0.82
Review of design documents Part2_B_8 0.86
Monitor and guarantee design quality Part2_B_9 0.94
Construction Phase
0.85
Taking necessary decisions about contractor claims during project implementation
Part2_C_6 0.77
Monitoring and control of implementation methods and cost, as well as work schedule and contractor productivity
Part2_C_7 0.91
Emphasise implementation quality and monitoring safety principles during project implementation
Part2_C_8 0.92
Establishment of a system and written code to ensure implementation quality, to be referred to by personnel in charge of implementation quality assurance and control
Part2_C_9 0.76
Handover Phase
0.61
Establishment of criteria for acceptance of completed project
Part2_D_1 0.89
Review of contract documents (engineering drawings, technical specifications, manuals for project maintenance and operation, warranty documents) after completion of the project
Part2_D_2 0.96
Monitoring the process of testing and commissioning of all systems, plant and equipment in the project
Part2_D_3 0.84
It can be seen from the SEM results on the relationships between the construction
phases that most of the tasks requiring the involvement of client were the phases of
design, construction and handover phases, and this finding is consistent with the
literature. All the tasks in the table above were considered significant and had a
high impact on the outcomes in the phase that they belonged to. In the design
phase, “Monitor and guarantee design quality” was found to have the highest
impact with a measurement of 0.94. This is evidence that quality in design is
requires the involvement of the client. Whelton et al. (2002) highlighted the
importance of the design stage and considered it to be critical because as much as
80% of a project can be specified in this early phase. Many studies emphasise the
importance of the quality of the design (Al-jarosha, 2010; ASCE, 2012; Forgues,
2006; Kamara & and Anumba, 2001; Low & Chuan, 2006; Magnussen & Samset,
2005; Toor & Ogunlana, 2008).
In the construction phase, “Monitoring and control of implementation methods and
cost, as well as work schedule and contractor productivity” and “Emphasise
implementation quality and monitoring safety principles during project

126
implementation” were the tasks with the highest impact (measurements of 0.91
and 0.92, respectively). The heart of a project is the construction phase. If the
construction phase activities are managed well by implementing the adequate
construction methods, monitoring the schedule of contractor productivity, project
cost control, quality of the project, and placing more emphasis on monitoring the
project safety, it leads to client satisfaction at the end of the project. It is very
important that the client leads the project team during the construction phase in
order to minimise any conflict. As stated above, conflict occurs most strongly at the
later stages of a project during construction. Taking the necessary decisions while
the clients are on site helps the project to be completed efficiently.
In the handover phase, the “Review of contract documents (engineering drawings,
technical specifications, manuals for project maintenance and operation, warranty
documents) after completion of the project” task was found to have the highest
impact, with a measurement of 0.96.
6.2.2 Impact of Client Involvement on Project Delivery
Clients make the decisions and perform the work to deliver the constructed project.
The main goal of the client is to deliver the project with the desired quality, on time
and within the approved cost. As the results presented in Chapter 4 (Section 4.5)
indicate, the low level of client involvement has a negative impact on delivering the
project on time across all segments (Chapter 4, Figure 4.8). This suggests the reason
why the construction sector in Saudi Arabia recently faced major delays in most
projects. For example, the number of project delays increased from 700 projects in
2009 (Althynian, 2010) to 3000 projects in 2013 (Anti-Corruption Commission,
2013). In addition, the expected project quality is not high. The quality of public
projects was noticed to be varied among government agencies due to the different
approaches that were used (Al-jarosha, 2010; Althynian, 2010). Forty-one percent
of projects experienced cost overruns (Althynian, 2010).
The Chairman of the Committee of Contractors and board member of the Riyadh
Chamber of Commerce recently blamed the government agencies for the status of
the implementation of projects and claimed the reasons were the large number of

127
proposed and ongoing projects, the presence of errors in the design of the project,
and the weak supervision by the government agencies of all parties in the projects
(Alsalim, 2013). Therefore, the main reason can be attributed to the lack of planning
and design, and this lack of planning is caused by the weakness of the clients’
involvement in the project process (Althynian, 2010).
6.2.3 Factors Affecting Client Involvement
This study aimed to investigate the reasons for limited client involvement in public
projects in Saudi Arabia. There is widespread recognition that the client is a key
player and their involvement is a significant factor in improving construction sector
performance (Boyd & Chinyio, 2006; Brandon & Lu, 2008; Xu & Miao, 2010).
Furthermore, understanding clients' attitudes and actions is critically important for
construction professionals in collectively taking the construction sector forward
(Boyd & Chinyio, 2006). Walker (1995), for example, considered the influence of the
client to be a significant factor in successful construction performance. Client
involvement is influenced by a multitude of interrelated factors. In the present
study, these factors were classified as “individual factors” and “organisational
culture factors” based on the analysis presented in Chapter 4 (Section 4.6).
Nineteen items were identified for the group of individual factors and 23 items
were identified for organisational cultural factors.
In terms of the individual factors, five items were found to have the most influence
on client involvement. These five items, namely, professional certificate, good
training, reasonable salary, developing skills, and unfamiliarity with construction
projects, apply to most new engineers in the construction field. Usually the new
(fresh) client has no experience to face a complicated project. Today, construction
projects have become much more complex and congested (Assaf & Al-Hejji, 2006;
Assaf et al., 1995; Chan et al., 2004; Toor & Ogunlana, 2008). The construction
project team faces ongoing changes in the project. There is also a positive
relationship between seniority and performance because older persons have
greater experience, resulting in higher skills and knowledge (Al-Yahya, 2009). Low
client experience results in a poor project output which means there is no clear

128
direction from the client to the project team. The clients also need to have a high
level of experience. Experience impacts on the skill level and project management
knowledge being applied in the project. Clients with more experience have a
greater range of knowledge of project methods, tools and techniques to manage
projects (Nutt, 2006).
In general, it can be inferred that the first 12 items presented in Chapter 4 (Table
4.20) as being important to client involvement are related to the knowledge
development of the project members who can address these issues by getting more
training, developing skills, becoming familiar with the project process and
developing communication skills. As discussed previously, knowledge development
in Saudi Arabia is weak and the country has been cited for the lack of real progress
in achieving good management and organisational performance (United Nations
Development Programme, 2003, 2009). This was clear in the demographic analysis
in the present study where the results from the questionnaire (Part1_D_5) showed
that 81.1% of the participants attended zero to five training workshops in the last
five years. This indicates some weakness in the employee training programs offered
by the government agencies. Government agencies should be model employers in
developing their employees. Any specific program introduced by the government
organisation such as an employee training program is an important indicator of the
value placed on employees. It can be used to transmit awareness to the employees
about the important goals and objectives of the organisation, the expected
behaviour, the various roles and extent of their responsibilities, and the
communication networks. This might help to improve employee outcomes and
project management and performance and would result in more effective client
involvement in construction projects.
Based on the EFA conducted in this study (Chapter 4, Section 4.6.1), the 19 items in
the individual factors group were grouped by five new combinations as follows:
Group 1: Low knowledge and experience lead to poor decision making in the early
stage of design.
Group 2: Inability to communicate clearly and weak in training with low knowledge
lead to failure to identify the project regulations and responsibilities.

129
Group 3: No satisfaction in the job or with the salary leads to low client expectation.
Group 4: Insufficient personal skills and long work hours lead to low client
expectation.
Group 5: Low expertise in design and construction
The five groups identified in the analysis match some of the problems and obstacles
in the Saudi construction sector as highlighted by other sources. Many recent media
reports have focused on the major delays in Saudi construction projects, with delays
said to be caused by the clients, contractors and other factors (Al-Kharashi &
Skitmore, 2009; Alsalim, 2013; Althynian, 2010). As discussed in the literature
review (Chapter 2, Section 2.2.3), Al-jarosha (2010), Al-Kharashi and Skitmore
(2009), Al-Yahya (2009), Alsalim (2013), Althynian (2010), the Anti-Corruption
Commission (2013) and Assaf and Al-Hejji (2006) have emphasised the problems
faced in Saudi construction projects; many of those problems resonate with the
individual factors highlighted in the present analysis.
In terms of organisational culture factors, organisational culture gives identity to an
organisation. Organisational culture also plays a major role in guiding and shaping
behaviour (Rashid et al., 2004) so it can be said to have an influential positive effect
on individuals (Cheung et al., 2011). Therefore, organisational culture influences
construction project activities in general, and has an impact on client involvement in
particular.
Based on the survey responses, there were no large differences between the 23
items in the organisational cultural factors group. The mean values were between
3.11 and 2.22. This indicates that the respondents’ opinions were not strongly
expressed or they did not have specific knowledge related to the organisational
culture factors. This may point to a weakness in organisational culture whereby
government agencies are not sufficiently acting to improve the employee
environment in general and the client involvement in particular during the
construction project process.

130
Based on the EFA that was also conducted for this group of factors (Chapter 4,
Section 4.6.3), the 23 factors were grouped by three new combinations:
Group 1: Performance, innovation and team orientation
Group 2: Members’ participation in decision-making process and reward system
Group 3: Goal setting and accomplishment
The first group, labelled “Performance, innovation and team orientation” consisted
of 12 factors. Three of these factors relate to employee performance and
emphasise the establishment of a performance standard. Government agencies
should encourage employees to do a good job by improving their skills so they can
achieve higher levels of performance. Three of the factors in the group are related
to innovation. Government agencies should value the ideas of employees at every
level and encourage them to search for better ways of getting the job done.
Innovation also helps improve performance. The remaining six factors in the group
are related to team orientation. Team orientation emphasises cooperation and
assistance between the people within the organisation. Government agencies
should emphasise team contributions rather than individual contributions through
an open exchange of opinions and ideas. Sharing of information, solving problems
and cooperating across departments should be encouraged.
The second group was labelled “Members’ participation in decision-making process
and reward system” and consisted of nine factors. Participation in the decision-
making process in an organisation is essential. Making the right decision is typically
not a simple matter, as most decision problems in construction projects are highly
complex in nature. Therefore, government agencies should adopt a reward scheme
to recognise good performance.
The third group was labelled “Goal setting and accomplishment” and consisted of
two factors. An organisation’s members have to understand and achieve the
organisational goal. Government agencies with a clear goal and mission are stable
(Denison, 2000). This stability will guide the employees to implement and improve
the organisational strategies as clients in the construction process. It is noted that
the three highest ranked organisational culture factors in the construction sector,

131
according to the respondents, were: a clear approach to succeed, clear goals, and
actions that are matched with the organisation’s goals (see Chapter 4, Table 4.22).
6.3 Impact of Individual and Organisational Culture Factors on Client Involvement
The main aim of the present study is to improve the client involvement in
construction projects by investigating the impact of individual factors and
organisational culture factors on client involvement and the construction project
process. SEM was used to develop and propose a model to improve the client
involvement and enhance the outcomes in construction project delivery. The
assessment and technique applied in using SEM was explained in Chapter 3 (Section
3.7.3).
Chapter 5 (Figure 5.9) presented the initial whole structural model which was linked
to the final project phase measurement model (Figure 5.4), the final individual
factors measurement model (Figure 5.6), and the final organisational culture factors
measurement model (Figure 5.8). In Chapter 5 (Section 5.3), three models were
proposed and the final model was created. The three structural models are: (1) the
final whole structural model with individual factors (Figure 5.11), (2) the final whole
structural model with organisational culture factors (Figure 5.13), and (3) the final
whole structural model with individual and organisational culture factors (Figure
5.15). All structural models achieved the goodness of fit (Table 5.4). Chapter 5
(Section 5.4) also measured the impacts (direct and indirect) on the client
involvement in all three models. It was found that the impact of the individual
factors on the client involvement in model (1) was almost the same as the impact of
the organisational culture factors on client involvement in model (2) (Figure 5.16
and Figure 5.17). In model (3), it was found that organisational culture factors had
the highest positive impact on client involvement. At the same time, organisational
culture factors had a positive high impact on individual factors. This indicates that
organisational culture plays an important role in regard to both individual factors
and client involvement (as presented in Table 5.5 and Figure 5.18). Therefore,
model (3), the final whole structural model with individual and organisational

132
culture factors, had more effect and influence on improving the client involvement
in construction projects and achieve the desired expectations of the project
delivery. The model contains elements related to the project phases, individual
factors, organisational culture factors and project delivery expectations, as
presented in Chapter 5 (Figure 5.15).
Three individual factors were found to have a direct impact on client involvement.
The first factor was “Attending international conferences”; this means that clients
need to pay more attention to the improvement of education and knowledge
(Sargeant et al., 2010). The second factor was “Make appropriate decisions”; this
means more attention needs to be paid to improving the quality of decisions
throughout the project activities (Boyd & Chinyio, 2006; Brandon & Lu, 2008; Xu &
Miao, 2010). The third factor was “Identify the basic requirements of the project in
the design phase”; this means more attention is needed to improve the
participation in the early stage of design.
The organisational culture, on the other hand, was found to have a high impact and
influence on both the client involvement and individual factors during the
implementation of the construction project. To increase the effectiveness of the
decisions made by the client, government agencies should emphasise team
contributions rather than individual contributions and should encourage the
exchange of opinions and ideas. A team orientation highlights cooperation and
assistance between the members of the project team during implementation of the
construction project. Therefore, the clients’ key roles are to form the project team
as early as possible, to assign responsibilities and to establish high levels of
performance (ASCE, 2012). As a result, the client who leads the project team must
assign responsibility, authority, liability, contractual relationships and compensation
arrangements. This includes deciding on the desired level of quality outcome
through communicating the requirements which result from the project objectives.
Good communication between team members is essential if a team is to collaborate
successfully and make the best use of its shared knowledge.

133
The client project team helps to improve the involvement in projects. Involvement
is determined by the degree to which the project team fulfils its responsibilities in
each phase of the total construction process (Bubshait, 1994; Chan et al., 2004;
Forgues, 2006; Parker &Skitmore, 2005; Shelbourn et al., 2007; Toor & Ogunlana,
2008). According to Skitmore et al. (2005), the advantages of forming the project
team are: effective communication among members, effective ways of resolving
project process problems, techniques for conflict resolution in a constructive way,
more trusting, supportive atmosphere within the group, clarification of the team’s
purpose and role of each team member, transforming a broad sense of purpose
into specific performance objectives, developing the right mix of skills to accomplish
high-performance results, enhancing creativity in task performance, motivated
members, reduced communication problems, high quality decision-making,
increased job satisfaction, better decisions and motivation, encouraged
participation, improved working relationships, and more contribution of
information.
The benefits outlined above support the client involvement in the project process.
The construction phase and handover phase have a significant impact on the client
involvement during the project process. For the construction phase, four tasks were
identified in this study as the most important: (1) taking necessary decisions against
the contractor’s claims during project implementation, (2) monitoring and control
of implementation methods and cost, as well as the work schedule and contractor
productivity, (3) stress implementation quality and monitoring of safety principles
during project implementation, and (4) establishment of a system and written code
to ensure implementation quality, to be referred to by personnel in charge of
implementing quality assurance and control. These tasks are significant in the
construction phase. Clients can assist in improving the project outcome, resolve any
claims, monitor the work schedule and contractor productivity, and enforce quality
and safety control in the project by establishing the system to ensure
implementation quality. The handover of a project to the client at the end of the
construction phase is also a very important stage of the project process and facility
operation success (Hassan et al., 2010). A well-organised, efficient and effective

134
transfer of information from the contractor to the client is essential. The handover
of the project from the contractor to the client can have an effect on the health,
safety, standards of operation, maintenance and operational cost efficiencies to the
client. The fine-tuning of operations during the handover can impact heavily on the
core business of the client if not managed in a structured manner.
6.4 Final Model of Client Involvement in Construction Projects
The interpretation and discussion presented in this chapter linked all the major
findings. Proposing and building the final framework helps to improve the client
involvement in construction projects. Figure 6.1 links the significant findings of this
study and presents the final framework. The framework shows that the
organisational culture plays a major role in influencing and increasing the client
involvement in construction projects by emphasising team orientation.
Organisational culture also has an influential positive effect on individuals (Cheung
et al., 2011). In order to have positive outcomes in construction project delivery,
clients need more attention and their education and knowledge level needs to be
improved. This increases the confidence in making appropriate decisions and
improves the quality of decision-making which is reflected in the project activities
especially in the early stage of design. Construction project delivery, in general, is
measured by the quality, cost and time taken to implement the project. The clients’
objective is to get the balance right between all these elements in order to reach
the desired project delivery expectations.
Figure 6.1 introduces the framework proposed to improve the client involvement in
public construction projects in Saudi Arabia, called the “Client Involvement
Interactive” (CI-Interactive) framework. The framework is “interactive” because it is
mainly based on teamwork. “Interactive” refers to the communication or
collaboration among the project team members through discussion and sharing
information.

135
Figure 6.1: “CI-Interactive” framework for improving client involvement in construction projects
6.5 Summary
This chapter interpreted and discussed the findings from the previous chapters and
identified the links between the chapters of the thesis. The present study was
designed to investigate the ideal of enhanced client involvement in the construction
project process and to develop a model to improve client involvement in order to
have more positive outcomes in construction project delivery. From the discussions
in this chapter it is concluded that organisational culture plays an important role in
regard to both individual factors and client involvement. Most of the findings of this
research support the existing literature. This chapter also presented the final
Strengthen and improve the individual aspects: Increasing education and knowledge
Quality of decision outcome
Participation in the early stage of design
Strengthen and improve the organisational culture aspects: Emphasise team contributions
Value employees’ ideas
Emphasise team accountability
Client Involvement in Project Process Strengthen through the construction and handover phases
S Taking necessary decisions against contractor claims during project implementation.
Monitoring and control of implementation methods and cost, as well as work schedule and contractor productivity.
Emphasis implementation quality and monitoring safety principles during project implementation.
Establishment of a system and written code to ensure implementation quality, to be referred to by personnel in charge of implementation quality assurance and control.
Establishment of criteria for acceptance of completed project.
Review of contract documents (engineering drawings, technical specifications, manuals for project maintenance and operation, warranty documents) after completion of the project.
Monitoring the process of testing and commissioning of all systems, plant and equipment in the project.
Construction Phase
Handover Phase
Improved Project Delivery Outcome “Time – Cost – Quality”

136
framework, called the CI-Interactive framework, to improve the level of client
involvement in construction projects.
The next chapter presents the conclusions of this research based on the analysis
and findings. The limitations of the research are identified, and recommendations
for future study are put forward.

137
CHAPTER 7 CONCLUSION AND RECOMMENDATIONS
7.1 Introduction
This research was motivated by the need to investigate the level of client
involvement in construction projects in Saudi Arabia, as outlined in Chapter 1. The
study was designed to develop a model to improve client involvement in the project
process, in order to enhance outcomes in construction project delivery.
To achieve this aim, four research questions were articulated: (1) What is the
current practice of client involvement in Saudi construction projects?; (2) What is
the impact of client involvement on project performance?; (3) What are the main
factors that affect client involvement?; and (4) How do those factors influence client
involvement, and which factors lead to improved project performance? The
literature review outlined the existing knowledge on the topic and addressed some
of the research questions. It also helped to integrate the findings of the present
study with the existing body of knowledge, as presented in Chapter 2. However, few
investigations have focused on effective client involvement in public construction
projects. In the Saudi context, only one prior study was conducted over twenty
years ago (by Bubshaite and Al-musaid (1992)).
In Chapter 3, the research methodology set out the steps taken to answer the
research questions. A research design process was developed to frame all the
activities in the present study (Figure 3.1). Chapter 4 presented the findings of the
statistical analyses of the data collected from the questionnaire. Descriptive
statistics of the participants' demographic profiles were first introduced. The
respondents’ level of involvement as clients within the five phases of a construction
project was measured. The impacts of client involvement on the project delivery
outcomes were investigated, in relation to the relevant individual, project and
organisational culture factors.

138
Chapter 5 demonstrated the steps to investigate the influence and impact of
individual factors and organisational culture factors on client involvement. Using
SEM, the first, second and third research questions were linked in order to find the
relationships between all the elements and answer the fourth research question.
The findings related to the research questions were interpreted and discussed in
the context of seeking ways to improve the client involvement in construction
projects in Saudi Arabia, as presented in Chapter 6. Finally, this chapter highlights
the conclusions and implications of the research findings. It also outlines the
limitations of the study and makes recommendations for future research.
7.2 Conclusion
The construction sector in Saudi Arabia is the largest, strongest and fastest growing
market in the Gulf region; however, the construction sector in Saudi Arabia has
faced many challenges during the recent construction boom. These challenges
include the lack of real progress in achieving good management and organisational
performance, variability in quality among the projects commissioned by
government agencies, increasing project delays and cost and time overruns, lack of
planning and design, and weak supervision by the government agencies of the
construction project process. Construction projects in Saudi Arabia experience
major delays, with the number of delayed projects increasing from 700 projects in
2009 to 3000 projects in 2013 (Anti-Corruption Commission, 2013).
7.2.1 Relatively Low Client Involvement in Saudi’s Construction Projects
One of the significant findings to emerge from this study is that the current client
involvement in construction projects in Saudi Arabia is at the level of neutral or low
involvement in 38 out of 40 tasks in the construction project process. This means
that the clients are giving 50% or less of their efforts to 95% of the day-to-day
project activities.

139
Among the five project phases of the construction process, the design phase was
ranked as the priority phase for client involvement during the construction project.
This is then followed by the client involvement in the planning phase. However, the
study found that the respondents had low involvement as clients in both the
planning and the design phases. This was suggested as the reason of weak decision-
making in the early stage of the project, which could result on conflict in the later
stages of the projects. Client involvement in semi-public projects, in the design
phase, was a higher compared to client involvement in public projects. This might
be due to the tendency of government agencies to adopt consultancy services in
the design phase of public projects.
The remaining phases were ranked in importance as follows: (3) construction phase;
(4) handover phase; (5) operations and maintenance phase.
7.2.2 Impact on Project Delivery
The relatively low client involvement has a negative impact on the projects’
ultimate outcomes. This condition has negatively affected the time completion of
construction projects in Saudi Arabia. It was also indicated as the main cause of
quality problems in Saudi construction projects.
The level of client involvement in the design phase, construction phase and
handover phase were found to be the most significant and had a high level of
impact on the project outcomes. In the design phase, client involvement was found
to be important in: following the design progress; reviewing design documents; and
monitoring and guaranteeing design quality. In the construction phase, the tasks
that required significant client involvement were found to include: taking necessary
decisions about contractor claims during project implementation; monitoring and
control of implementation methods and cost, as well as work schedule and
contractor productivity; emphasising implementation quality and monitoring safety
principles during project implementation; and establishment of a system and
written code to ensure implementation quality, to be referred to by personnel in
charge of implementation quality assurance and control. In the handover phase,
significant client involvement was found to be required for: establishment of criteria

140
for acceptance of completed project; review of contract documents (engineering
drawings, technical specifications, manuals for project maintenance and operation,
warranty documents) after completion of the project; and monitoring the process
of testing and commissioning of all systems, plant and equipment in the project
7.2.3 Main Factors Affecting Client Involvement
Three groups of factors, namely, individual factors, project factors and
organisational culture factors that affect and limit the client involvement and
performance during the construction project were investigated. The project factors
group was not subjected to further analysis due to the results of the reliability test.
The results were found to be poorly reliable and the data were not accepted
(Chapter 4, Section 4.2.3).
Among the individual factors, the four most impacting factors were: professional
certificate, good training, reasonable salary and skill development. These factors
were identified as the features most needed by the clients as individuals in the
construction sector. The individual factors were further summarised into five main
groups as follows:
Low knowledge and experience leads to insufficient decision-making in the early
stage of design.
Inability to communicate clearly and weak training with low knowledge lead to
failure to identify the project regulations and responsibilities.
Low satisfaction with job and salary leads to low client expectations.
Insufficient personal skills with long work hours lead to low client expectations.
Low expertise in design and construction.
The organisational culture factors were also grouped into three new combinations
as follows:
Performance, innovation, and team orientation.
Members’ participation in decision-making process and reward system.
Goal setting and accomplishment.

141
It is important to identify the dominant factors that lead to low client involvement
in construction projects so that efforts can be concentrated on those factors in
order to reduce them and improve the current practices. The client’s contribution is
critically important for the construction process and for taking the construction
sector forward. Equally important, organisational culture plays a major role in
guiding and shaping behaviour. However, very few investigations have been carried
out with a focus on effective client involvement in public construction projects in
Saudi Arabia. The results of the survey in the present study indicated that the
individual factors and organisational culture factors did not support the client
involvement. This lead to the conclusion that the client is not adequately involved in
construction projects in Saudi Arabia. Therefore, SEM was used to develop a model
to show how client involvement can be enhanced and how outcomes in
construction project delivery can be improved.
To improve the level of client involvement during the construction project process,
this study proposed the CI-Interactive framework which links the significant findings
of this study. The framework shows that organisational culture can play a major role
in influencing and increasing the client involvement in construction projects by
emphasising team orientation. Organisational culture can also have an influential
positive effect on individual. In order to have a positive outcome in construction
project delivery, the involvement of the client needs more attention and the clients’
level of education and knowledge needs to be improved. This will increase the
client’s confidence in making appropriate decisions and improve the quality of the
project activities especially in the early stage of design. In summary, ways to
improve government agencies performance in Saudi Arabia should be considered
when developing comprehensive frameworks for enhanced client involvement in
construction projects.

142
7.3 Contributions
Very little research has been conducted with a focus on effective client involvement
in public construction projects in Saudi Arabia. Only one study was reported by
Bubshaite and Al-musaid (1992), more than twenty years ago. Therefore, this study
makes several contributions to the fill the gap in knowledge.
First, this study modified the back-translation technique (Coffey, 2010) and
introduced a new technique called the closed loop back translation. The back-
translation method can be expected to miss much and has faced criticism (Forsyth,
2006). In the present study, one more step was added to the back-translation
technique (Chapter 3, Figure 3.2). In this extra step, an expert translator is used to
develop the final questionnaire in English after comparing the original version with
the last version of the questionnaire in English. The questionnaire in English is then
translated into Arabic and all three Arabic questionnaire versions are compared to
develop the final one. This new step closes the series steps of the back-translation
technique.
Second, building on the existing knowledge on the research methodology, this study
provided greater insight into the research design process. The design was based on
three elements: the philosophical paradigms, the strategies or approaches of the
research inquiry, and the specific methods used in the research (Chapter 3, Figure
3.1). The research plan takes a controlled and structural approach to conducting
research by initially identifying the research topic, constructing appropriate
research questions, adopting a suitable research approach, collecting data, and
analysing and interpreting the relationships between the variables.
Third, the study examined the complex relationships between 100 variables (8
variables in Part 1 of the questionnaire related to the respondents’ demographic
profiles, 40 variables in Part 2 of the questionnaire related to project tasks within
five project phases, and 51 variables in Part 3 of the questionnaire related to the
factors and project delivery expectations) and investigated how the relationships
influenced the client involvement in construction projects in Saudi Arabia. The
optimum level of client involvement was identified by reference to a previous study
that focused on the quality of the client involvement and defined the important

143
tasks during the construction project phases (Bubshait & Al-Musaid, 1992). In
contrast to that previous study, the aim of the present study was to investigate the
ideal of enhanced client involvement in project tasks and propose models that can
improve the situation and create more positive outcomes in construction projects.
This was done by identifying the current practices in client involvement throughout
the five project phases (the planning phase, design phase, construction phase,
handover phase, and operations and maintenance phase) and finding the individual,
project or organisational culture factors that most strongly influence the client
involvement.
Fourth, three statistical models were developed to represent the relationships
between the relevant factors and client involvement. The “final whole structural
model with individual factors” was developed to study the impact of individual
factors on client involvement. The “final whole structural model with organisational
culture factors” was developed to study the impact of organisational culture factors
on client involvement. The “final whole structural model with individual and
organisational culture factors” was developed to study the influence and impact of
individual factors and organisational culture factors on client involvement. This
model also considers the effect between the individual factors and organisational
culture factors. These three models provide in-depth understanding of the influence
of individual factors and organisational culture factors on client involvement.
Finally, this study developed a final framework for improving client involvement in
public projects in Saudi Arabia. The CI-Interactive framework (Chapter 6, Figure 6.1)
links the significant findings of this study. The framework shows that organisational
culture can play a major role in influencing and increasing the client involvement in
construction projects by emphasising team orientation. Organisational culture also
has an influential positive effect on individuals (Cheung et al., 2011). In order to
have a positive outcome in construction project delivery, the involvement of client
needs more attention and the clients’ level of education and knowledge needs to be
improved. The CI-Interactive framework can also provide specific guidelines for
government agencies that have weak performance in supervising construction
projects and have a low level of involvement as the clients in these projects.

144
7.4 Limitations
The focus of this study was on client involvement in construction projects in Saudi
Arabia. As such, it is important to acknowledge the following limitations:
1. The study was limited to clients who worked for the Saudi Government.
2. The study was limited to the role of government agencies as clients in
construction projects.
3. The study covered only public sector construction projects (not private
sector projects).
7.5 Recommendations for Future Research
Based on the findings of the research and the limitations that have been noted, a
number of directions for future research endeavours can be recommended:
Further research is required to identify other significant factors related to
the phenomenon of client involvement.
Future research could consider the role of the consultant and contractor and
study the obstacles they face in relation to client involvement.
The models presented in this research incorporate individual factors and
organisational culture factors that influence client involvement; these
models can be further developed to take into account the relevant project
factors.
Similar studies could be conducted with sample populations in other regions
in Saudi Arabia or around the world in order to strengthen the external
validity of the findings.
This study used a quantitative approach and inferential statistical analysis to
investigate current practices and the factors influencing the client
involvement in construction projects. Future research could also employ a
qualitative approach to provide other useful insights into this phenomenon.

145
BIBLIOGRAPHY Aguinis, H., Gottfredson, R. K., & Joo, H. (2013). Best-Practice Recommendations
for Defining, Identifying, and Handling Outliers. Organizational Research
Methods, 16(2), 270-301.
Al-Barak, A. (1993). Causes of contractors_ failures in Saudi Arabia. Unpublished
Master Thesis, KFUPM, Dhahran, Saudi Arabia.
Al-jarosha, Y. (2010). Expert warns of waste of 93 billion riyals in government
projects in the coming years. Alriyadh Newspaper, Issue 15409
Al-Khalil, M. I., & Al-Ghafly, M. A. (1999). Delay in public utility projects in Saudi
Arabia. International Journal of Project Management, 17(2), 101-106.
Al-Kharashi, A., & Skitmore, M. (2009). Causes of delays in Saudi Arabian public
sector construction projects. Construction Management and Economics,
27(1), 3 - 23.
Al-Sedairy, S. T. (1994). Management of conflict : Public-sector construction in
Saudi Arabia. International Journal of Project Management, 12(3), 143-151.
Al-Yahya, K. O. (2009). Power-Influence in Decision Making, Competence
Utilization, and Organizational Culture in Public Organizations: The Arab
World in Comparative Perspective. Journal of Public Administration
Research and Theory, 9(2), 385-407.
Albassam, B. (2011). Budgetary System in Saudi Arabia: Reform Needed. In C. E.
Menifield (Ed.), Comparative Public Budgeting: A Global Perspective.
London: Jones & Bartlett Publishers.
Ali, A. (1993). Decision-Making Style, Individualism, and Attitudes toward Risk of
Arab Executives. International Studies of Management & Organization,
23(3), 53.
Alkahtani, A. (2000). Involvement of employees and their personal characteristics in
Saudi construction companies. International Journal of Commerce and
Management, 10(4), 67-78.
Alnuaimi, A. S., Taha, R. A., Al Mohsin, M., & Al-Harthi, A. S. (2009). Causes,
effects, benefits, and remedies of change orders on public construction
projects in Oman. Journal of Construction Engineering and Management,
136(5), 615-622.
Alsalim, S. (2013). Government Entities bear part of the delay in the implementation
of projects. Alriyadh Newspaper

146
Althynian, F. (2010). An economic study reveals the reasons for the delay in the
implementation of 82% of infrastructure projects in the Kingdom. Alriyadh
Newspaper, Issue 15295
Anti-Corruption Commission (2013). 820 billion SR put 3000 limping projects under
the Focus. Alriyadh Newspaper
Arab News (2010, Mar, 6). King presented flood report. Arab News
Arbuckle, J. L. (2007). Amos 16 user's quide. Chicago: SPSS.
ASCE (2012). Quality in the constructed project : a guide for owners, designers, and
constructors (3nd ed.). Reston, Virginia: American Society of Civil
Engineers.
Ashkanasy, N. M., & Jackson, C. (2002). Organizational culture and climate.
Handbook of industrial, work and organizational psychology, 2, 398-415.
Assaf, S. A., & Al-Hejji, S. (2006). Causes of delay in large construction projects.
International Journal of Project Management, 24(4), 349-357.
Assaf, S. A., Al-Khalil, M., & Al-Hazmi, M. (1995). Causes of Delay in Large
Building Construction Projects. Journal of Management in Engineering,
11(2), 45-50.
Aytug, Z. G., Rothstein, H. R., Zhou, W., & Kern, M. C. (2012). Revealed or
Concealed? Transparency of Procedures, Decisions, and Judgment Calls in
Meta-Analyses. Organizational Research Methods, 15(1), 103-133.
Barrett, P. (2007). Structural Equation Modelling: Adjudging Model Fit. Personality
and Individual Differences, 42 (5), 815-824.
Barrett, P. S., Hudson, J., & Stanley, C. (1999). Good practice in briefing: the limits
of rationality. Automation in Construction, 8(6), 633-642.
Basu, R. (2004). Implementing Quality: A Practical Guide to Tools and Techniques:
Enabling the Power of Operational Excellence. London: Thomson Learning.
Bettinger, C. (1989). Use corporate culture to trigger high performance. Journal of
Business Strategy, 10(2), 38-42.
Blaikie, N. W. H. (2003). Analyzing quantitative data: From description to
explanation. Thousand Oaks, CA: Sage Publications.
Bollen, K. A. (2005). Structural Equation Models. In Encyclopedia of Biostatistics:
John Wiley & Sons, Ltd.
Boomsma, A., & Hoogland, J. J. (2001). The robustness of LISREL modeling
revisited. Structural equation models: Present and future. A Festschrift in
honor of Karl Jöreskog, 139-168.

147
Bowen, P. A., Cattel, K. S., Hall, K. A., Edwards, P. J., & Pearl, R. G. (2012).
Perceptions of time, cost and quality management on building projects.
Australasian Journal of Construction Economics and Building, 2(2), 48-56.
Boyd, D., & Chinyio, E. (2006). Understanding the Construction Client. Oxford,
UK: Blackwell Science.
Brandon, P., & Betts, M. (1995). The field of integrated construction information:
and editorial overview.Integrated Construction Infromation. E & FN Spon,
London.
Brandon, P., & Lu, S. (2008). Client Driving Innovation: Willy-Blackwell Publishing
Ltd
Briscoe, G. H., Dainty, A. R. J., Millett, S. J., & Neale, R. H. (2004). Client-led
strategies for construction supply chain improvement. Construction
Management and Economics, 193-201.
Brockenbrough, R. L. (2009). Highway engineering handbook : building and
rehabilitating the infrastructure (3rd ed.). New York: McGraw-Hill.
Bryman, A., & Cramer, D. (2009). Quantitative data analysis with SPSS 14, 15 and
16: A guide for social scientists. New York: Routledge.
Bubshait, A. A. (1994). Owner involvement in project quality. International Journal
of Project Management, 12(2), 115-117.
Bubshait, A. A., & Al-Musaid, A. A. (1992). Owner involvement in construction
projects in Saudi Arabia. ASCE Journal of Management in Engineering, 8(2),
176-185.
Burrell, G., & Morgan, G. (2005). Sociological Paradigms and Organizational
Analysis: Elements of the Sociology of Corporate Life. England, Hants:
Ashgate Publishing Limited.
Byrne, B. M. (2001). Structural equation modeling with AMOS, EQS, and LISREL:
Comparative approaches to testing for the factorial validity of a measuring
instrument. International Journal of Testing, 1, 55-86.
Cameron, K. S., & Quinn, R. E. (1999). Diagnosing and changing organizational
culture: Based on the competing values framework. Reading, Mass: Addison-
Wesley
Chan, A. P. C., Scott, D., & Chan, A. P. L. (2004). Factors Affecting the Success of a
Construction Project. Journal of Construction Engineering and Management,
130(1), 153-155.

148
Cheung, S. O., Wong, P. S. P., & Wu, A. W. Y. (2011). Towards an organizational
culture framework in construction. International Journal of Project
Management, 29(1), 33-44.
Chua, D. K. H., Kog, Y. C., & Loh, P. K. (1999). Critical success factors for
different project objectives. Journal of Construction Engineering and
Management, 125(3), 142-150.
Coffey, V. (2002). Assessing organizational culture? Value management to the
rescue. Value Manager, 8(3), 6-13.
Coffey, V. (2010). Understanding Organisational Culture in the Construction
Industry. Yew Yourk: Taylor & Francis.
Cohen, J., Cohen, P., West, S. G., & Aiken, L. S. (2003). Applied multiple
regression/correlation analysis for the behavioral sciences (3rd ed.).
Mahwah, NJ: Lawrence Erlbaum.
Crawley, M. J. (2005). "Central Tendency" in Statistics An Introduction using R. (p.
23). Hoboken, NJ, USA: John Wiley & Sons, Inc.
Creswell, J. W. (2008). Educational research : planning, conducting, and evaluating
quantitative and qualitative research (3rd ed.). Upper Saddle River, N.J. :
Pearson/Merrill Prentice Hall.
Creswell, J. W. (2009). Research design: Qualitative, quantitative, and mixed
methods approaches. Thousand Oaks: Sage Publications.
Crowley, S. L., & Fan, X. (1997). Structural equation modeling: Basic concepts and
applications in personality assessment research. Journal of personality
assessment, 68(3), 508-531.
D'Agostino, R. B., Belanger, A., & D'Agostino, R. B., Jr. (1990). A Suggestion for
Using Powerful and Informative Tests of Normality. The American
Statistician, 44(4), 316-321.
Dawes, J. (2008). Do Data Characteristics Change According to the number of scale
points used? An experiment using 5-point, 7-point and 10-point scales.
International Journal of Market Research, 50 (1), 61-77.
De Vaus, D. (2002a). Surveys In Social Research (5th ed.). London: Routledge by
Taylor and Francis Group.
De Vaus, D. A. (2002b). Surveys in social research / D. A. de Vaus Allen & Unwin.
St. Leonards, N.S.W.
Denison, D. R. (1990). Corporate culture and organizational effectiveness. London:
John Wiley & Sons.

149
Denison, D. R. (2000). Organizational culture: Can it be a key lever for driving
organizational change. The handbook of organizational culture. London:
John Wiley & Sons.
Denzin, N. K., & Lincoln, Y. S. (2000). Introduction: The discipline and practice of
qualitative research. Thousand Oaks, CA: Sage.
Denzin, N. K., & Lincoln, Y. S. (2011). The sage handbook of qualitative research.
Thousand Oaks: Sage.
DeVellis, R. F. (2012). Scale development: Theory and applications (3rd ed.).
Thousand Oaks, Calif: Sage Publications.
Evbuomwan, N., & Anumba, J. (1996). Towards an Integrated Engineering Design
Environment. Information Represntation and Delivery in Civil and Structural
Engineering. CIVIL-COMP PRESS (pp. 127-134). Edinburgh.
Fabrigar, L. R., & Wegener, D. T. (2011). Exploratory Factor Analysis. Oxford:
Oxford University Press.
Fatany, S. (2009, 6 December). Jeddah Tragedy led to awakening on social issues.
Khaleej Times.
Field, a. p. (2000). Discovering statistics using SPSS for Windows: advanced
techniques for the beginner. Thousand Oaks, London: Sage Publications.
Flores, V., & Chase, G. (2005). Project controls from the front end. Cost
Engineering, 47(4), 22-24.
Forgues, D. (2006). Increasing Client Capabilities Through Requirement
Engineering. Paper presented at the nternational Conference on Computing
and Decision Making in Civil and Building Engineering. Montréal, Canada.
Forsyth, B. H. (2006). Methods for translating survey questionnaires. Paper
presented at the Paper presented at the 61st Annual Conference of the
American Association for Public Opinion Research. Montréal.
Fraenkel, J., & Wallen, N. (2000). How to design & evaluate research in education.
New York: McGraw-Hill.
Fulmer, R. M. (1988). The New Management. London: Collier Macmillan.
George, D., & Mallery, P. (2003). SPSS for Windows step by step: A simple guide
and reference (4th ed.). Boston: Allyn & Bacon.
Gliem, J. A., & Gliem, R. R. (2003). Calculating, interpreting, and reporting
Cronbach’s alpha reliability coefficient for Likert-type scales: Midwest
Research-to-Practice Conference in Adult, Continuing, and Community
Education.

150
Government Tenders and Procurement Law (2006). Royal Decree No. M/58.
Green, S. (1996). A metaphorical analysis of client organisations and the briefing
process. Construction Management and Economics, 14, 155-164
Groth-Marnat, G. (2003). Handbook of psychological assessment (4th ed.). Hoboken,
New Jersey: John Wiley & Sons, Inc.
Hair, j. f., Anderson, r. e., Tatham, r. l., & Black, w. c. (2010). Multivariate data
analysis. A Global Perspective (7th ed.). Upper Saddle River, N.J. : Pearson
Education.
Hansen, G. S., & Wernerfelt, B. (1989). Determinants of firm performance: the
relative importance of economic and organizational factors. Strategy of
Management Journal, 10, 399-411.
Harkness, J. A., Van de Vijver, F. J. R., & Mohler, P. (2003). Cross-Cultural Survey
Methods. Hoboken, N.J: Wiley.
Hassan, M., Kandeil, A., & Nady, A. (2010). Hand-Over Process Improvement in
Large Construction Projects. IIMS Journal of Management Science, 1(2),
153-164.
Hofstede, G. (1983). The cultural relativity of organizational practices and theories.
Journal of International Business Study, 75-89.
Hoogland, J. J., & Boomsma, A. (1998). Robustness studies in covariance structure
modeling: An overview and a meta-analysis. Sociological Methods &
Research, 26, 329-367.
Hooper, D., Coughlan, J., & Mullen, M. R. (2008). Structural Equation Modelling:
Guidelines for Determining Model Fit. The Electronic Journal of Business
Research Methods, 6(1), 53 - 60.
Hughes, P. (2001). Paradigms, methods and knowledge. In Doing early childhood
research : international perspectives on theory and practice (pp. 31-55).
Crows Nest, NSW: Allen & Unwin.
Iacobucci, D., & Duhachek, A. (2003). Advancing alpha: Measuring reliability with
confidence. Journal of Consumer Psychology, 13(4), 478-487.
Institution of Civil Engineering (1996). Civil Engineering Procedure (4th ed.).
London: Thomas Telford Publishing.
Jawahar-Nesan, L., & Price, A. D. F. (1997). Formulation of best practices for
owner's representatives. Journal of Management in Engineering, 13(1), 44-
51.

151
Jupp, V. (2006). The Sage Dictionary of Social Research Methods. London: Sage
Publications.
Kalla, H. K. (2005). Integrated internal communications: a multidisciplinary
perspective. Corporate Communications, 10(4), 302-314.
Kamara, J. M., & and Anumba, C. J. (2001). A critical appraisal of the briefing
process in construction. Journal of Construction Research, 2 (1), 13-24.
Kline, P. (1999). The Handbook of Psychological Testing. New York: Routledge.
Kline, P. (2013). Personality : The Psychometric View. Hoboken: Taylor and Francis
Kline, R. B. (2011). Principles and practice of structural equation modeling. New
York: Guilford Press.
Kometa, S. T., Olomolaiye, P. O., & Harris, F. C. (1996). A review of client-
generated risks to project consultants. International Journal of Project
Management, 14(5), 273-279.
Kong, A., & Gray, J. (2012). Traditional Procurement is too slow. Australasian
Journal of Construction Economics and Building, 6(1), 51-62.
Kutner, M. H., Nachtsheim, C. J., Neter, J., & Li, W. (2004). Applied linear
statistical models (5th ed.). Boston: McGraw-Hill/Irwin.
Leedy, P. (1997). Practical Research: Planning and Design. New Jersey: Prentice-
Hall.
Leedy, P., & Ormrod, J. (2001). Practical research: planning and design. Upper
Saddle River, NJ: Prentice-Hall.
Leung, M., & Keating, J. (2010). Bartlett's Test. in Encyclopedia of Research
Design. (pp. 62-65). Thousand Oaks, CA: Sage Publications.
LIU, A. M. M. (1999). Culture in the Hong Kong real-estate profession: a trait
approach. Habitat International, 23(3), 413-425.
Love, P. E. D., Gunasekaran, A., & Li, H. (1998). Concurrent engineering: a strategy
for procuring construction projects. International Journal of Project
Management, 16(6), 375-383.
Low, S. P., & Chuan, Q. (2006). Environmental factors and work performance of
project managers in the construction industry. International Journal of
Project Management, 24(1), 24-37.
Madsen, B. (2011). Statistics for Non-Statisticians. New York: Springer Berlin
Heidelberg.

152
Magnussen, O. M., & Samset, K. (2005). Successful megaprojects: Ensuring quality
at entry. Paper presented at the The Euram 2005 Conference. Munich,
Germany.
McCarthy, I. (1995). Manufacturing classification: lessons from organizational
systematic and biological taxonomy. Integrated Manufacturing Systems, 6(6),
37-48.
McDonald, R. P., & Ho, M. H. R. (2002). Principles and practice in reporting
structural equation analyses. Psychological Methods, 7(1), 64.
Middle East Economic Digest [MEED] (2010). Special Report Saudi Arabia. Middle
East Economic Digest, 54(13), 33-33.
Mingers, J. (2001). Combining IS research methods: Towards a pluralist
methodology. Information Systems Research, 12(3), 240-259.
Ministry of Economy and Planning (2010). Ninth Plan (2010-2014) Report. Saudi
Arabia.
Ministry of Finance (2010). 2010 Financial Report. Saudi Arabia.
Ministry of Finance (2012). 2012 Financial Report. Saudi Arabia.
Nunnally, J. C., & Bernstein, I. H. (1994). Psychometric theory (3rd ed.). New York:
McGraw Hill.
Nutt, P. (2006). Comparing public and private sector decision-making practices.
Journal of Public Administration Research and Theory, 16, 289-318.
Park, H. M. (2008). Univariate Analysis and Normality Test Using SAS, Stata, and
SPSS. Working Paper. The University Information Technology Services
(UITS) Center for Statistical and Mathematical Computing, Indiana
University
Parker, S., & Skitmore, M. (2005). Projet management turnover: causes and effects
on project performance. International Journal of Project Management, 23,
205-214.
Post, N. M. (1998). Building teams get high marks. Engineering News Record, 240
(19), 32-39.
Punch, K. F. (2003). Survey Research: The Basics. London, UK: Sage Publications.
Rashid, M. Z. A., Sambasivan, M., & Rahman, A. A. (2004). The influence of
organizational culture on attitudes toward organizational change. Leadership
& organization development Journal, 25(2), 161-179.
Reifman, A., & Keyton, K. (2010). Winsorize. Encyclopedia of research design. (pp.
1637-1639). Thousand Oaks, CA: SAGE Publications, Inc.

153
Robson, C. (2011). Real world research: a resource for users of social research
methods in applied settings. Chichester: Wiley.
Ryd, N. (2004). The design brief as carrier of client information during the
construction process. Design Studies, 25(3), 231-249.
Saary, M. J. (2008). Radar plots: a useful way for presenting multivariate health care
data. Journal of Clinical Epidemiology, 61(4), 311-317.
Samargandi, N., Fidrmuc, J., & Ghosh, S. (2013). Financial development and
economic growth in an oil-rich economy: The case of Saudi Arabia.
Economics and Finance Working Paper, Brunel University, 13-12.
Sargeant, R., Hatcher, C., Trigunarsyah, B., Coffey, V., & Kraatz, J. A. (2010).
Creating value in project management using PRINCE2. Queenland
Univerisity of Technology, Brisbane
Sauter, V. L. (2005). Competitive intelligence systems: qualitative DSS for strategic
decision making. SIGMIS Database, 36(2), 43-57.
Schein, E. H. (2004). Organizational culture and leadership (Vol. 1): Jossey-Bass
Inc Pub.
Schermelleh, K., Moosbrugger, H., & Müller, H. (2003). Evaluating the fit of
structural equation models: Tests of significance and descriptive goodness-of-
fit measures. Methods of psychological research online, 8(2), 23-74.
Sekaran, U. (2003). Research Methods for Business: A Skill Building Approach (4th
ed.). New York, NY: John Wiley & Sons.
Shelbourn, M., Bouchlaghem, N., Anumba, C., & Carrillo, P. (2007). Planning and
implementation of effective collaboration in construction projects.
Construction Innovation: Information, Process, Management,, 7(4), 357 -
377.
Shen, Q., Li, H. , Chung, J., & Hui, P. Y. (2004). A framework for identification and
representation of client requirements in the briefing process. Construction
management and economics, 22(2), 213-221.
Sheskin, D. (2010). Outlier. Encyclopedia of research design. (pp. 980-982).
Thousand Oaks, CA: SAGE Publications, Inc.
Shi, L., & Chen, G. (2008). Detection of outliers in multilevel models. Journal of
Statistical Planning and Inference, 138, 3189-3199.
Skitmore, M., Chow, L. J., & Then, D. (2005). Characteristics of teamwork in
Singapore construction projects. Journal of Construction Research, 6(1), 15-
46.

154
Smith, J., & Wyatt, R. (1998). Criteria for strategic decision-making at the pre-
briefing stage. Proceedings of the 14th Annual Conference of the Association
of Researchers in Construction
Stevens, J. P. (2012). Applied Multivariate Statistics for the Social Sciences, Fifth
Edition. Hoboken: Taylor and Francis
Sullivan, L. E. (2009). "Standard Deviation" The SAGE Glossary of the Social and
Behavioral Sciences. SAGE Publications, Inc. Thousand Oaks, CA: SAGE
Publications, Inc.
Tabachnick, B. G., & Fidell., L. S. (2007 ). Using multivariate statistics. Boston:
Pearson/Allyn & Bacon.
Tenopir, C., & King, D. W. (2004). Communication patterns of engineers: Wiley-
IEEE Press.
Toor, S. R., & Ogunlana, S. O. (2008). Critical COMs of success in large-scale
construction projects: evidence from Thailand construction industry.
International Journal of Project Management Decision, 26, 420-430.
Tourish, D., & Hargie, O. (2004). The crisis of management and the role of
organizational communication. Key Issues in Organizational Communication,
Routledge, London, pp. 1-16.
U.S.-Saudi Arabian Business Council (2012). The Construction Sector in the
Kingdom of Saudi Arabia.
United Nations Development Programme (2003). Arab Human Development Report.
New York.
United Nations Development Programme (2009). Arab Human Development Report.
New York.
Walker, D. H. T. (1995). An investigation into construction time performance.
Construction Management and Economics, 13(3), 263-274.
West, S. G., Finch, J. F., & Curran, P. J. (1995). Structural equation models with
nonnormal variables: problems and remedies. In Hoyle R. S. (Eds.).
Structural equation modeling: Concepts, issues, and applications (pp. 56-75),
Newsbury Park, CA: Sage.
Whelton, M., Ballard, G., & Tommelein, I. D. (2002). A knowledge management
framework for project definition. Journal of Information Technology in
Construction, 7, 197-212.
White, D., & Fortune, J. (2002). Current practice in project management -- an
empirical study. International Journal of Project Management, 20(1), 1-11.

155
Wilderom, C. P. M., Glunk, U., & Maslowski, R. (2000). Organizational culture as a
predictor of organizational performance. In N. M. Ashkanasy, C. P. M.
Wilderom & M. F. Peterson (Eds.), Handbook of Organizational Culture and
Climate (pp. 193-210).
Woodcock, M., & Francis, D. (1989). Clarifying organizational values. Gower,
Brookfield, VT.
Xu, L., & Miao, Y. (2010). Based on the owner of the construction project
management research. Paper presented at the International Conference on
Future Information Technology and Management Engineering: IEEE.
Yang, H. (2010). Factor loadings. in Encyclopedia of research design. (pp. 481-
484). Thousand Oaks, CA: SAGE Publications, Inc.
Yuan, K.-H., & Zhong, X. (2008). Outliers, leverage observations, and influential
cases in factor analysis: Using robust procedures to minimize their effect.
Sociological Methodology, 38, 329-368.
Zikmund, W., Babin, B., Carr, J., & Griffin, M. (2010). Business Research Methods
(8th ed.). South-Westrn: Cengage Learning.
Zikmund, W. G. (2003). Business Research Methods (7th ed.). Cincinnati, OH:
Thomson/South-Western.

156
APPENDICES

157
Appendix A Questionnaire [ENGLISH Version]

158
An Empirical Study of the Factors Impacting on Involvement Levels of Clients in Saudi Arabian
Construction Projects
A Survey conducted by Eng. Sultan Alsolaiman
This questionnaire is part of a doctoral study conducted to review current practices of client involvement at public construction projects in Saudi Arabia. This research will also investigate what the client involvement and participation in construction projects are, and how these can affect the outcome of the project. Also, this study will investigate the reasons for limited client involvement and participation in public project in Saudi Arabia from three different perspectives which are: (1) individual factors, (2) project factors, and (3) organisational cultural factors. This investigation will help to establish the ideal of enhancing the client involvement in project process and propose some ways to overcome the situation in order to make optimum decision that can have a positive outcome in construction project.
Please take some time to participate in this study. Your input will be kept confidential and it will only be used for the purpose of conducting this study. The questionnaire consists of three parts and it will take about 10-20 minutes to complete. The time you put in completing this survey is highly appreciated. If you have questions, suggestions or comments, please do not hesitate to contact me.
Eng. Sultan Alsolaiman PhD Student School of Science & Engineering Queensland University of Technology
Phone: +966504
+614128 Email: [email protected]
QUEENSLAND UNIVERSITY OF TECHNOLOGY
SCHOOL OF URBAN DEVELOPMENT

159
Part One: DEMOGRAPHIC INFORMATION
The purpose of this part is to collect some demographic information about the participant For the following items, please choose the item that best describes your demographics
What is your government organisation you work for?
Public (i.e. Government Agency) Semi-Public (i.e. Saudi Aramco, SCECO, etc...)
Age:
21-30
31-40
41-50
51-60
Above 61
What is your level of education (Degree):
Doctor
Master’s degree
Higher Diploma
Bachelor’s
Other, Specify: ………………………..
Was your education in English?
No
Yes
Have you ever attended any training course, workshop, or seminar on your field:
No
Yes, If yes, Please specify how many in the last five years: …………..
What is your management experience in the construction project:
Less 5
6-10
11-15
16-20
Above 20
What typical project you do:
Building ( residential, non-residential)
Infrastructure (Highways)
Industrial (Power plant, refineries, etc.)
Other,
What type of contract/delivery project do you used:
Traditional Lump Sum
Design-Build
Unit Price
Construction Management
End Part One

160
Part Two: CLIENTS PERFORMANCE AND INVOLVEMENT
The purpose of this part is to identify the degree of Client involvement in government projects. Not Strongly
INSTRUCTION: Involved Neutral Involved
Please Indicate ( ) in the box that best describe your level of 1 2 3 4 5 involvement in each of the project phases. ▼ ▼ ▼ ▼ ▼ A- Planning Phase: Assignment of task force (consultant. engineering. etc.) to conduct preliminary studies for the proposed project.
Studying the requirements of the beneficiary of the project.
Defining, in writing, the technical specifications and conditions that determine the quality of the required work.
Studying how to secure funds to finance the project.
Estimation of the project cost and the time required for its completion.
Approval of the project cost.
Studying and determining the technical specifications of the materials to be used for the project
Studying the impact of the project on the safety and health.
Establishment of a criterion for the selection of project location.
Description of the responsibilities and powers of each member participating in the project (e.g. contractor and Consultant )
Feasibility study of the proposed project.
B- Design Phase:
Arranging the papers and documents of the construction contract (quantities of materials, schedule, specifications, and drawings).
Qualification of designers bidding on the project.
Selection of design team.
Negotiating of design price with the qualified designers.
Provide the designers with the necessary information needed for project.
Following the progress of design.
Evaluation of design and taking the necessary decisions including the approval of basic design stages.
Review of design documents (e.g. drawings and technical specifications)
Monitor and guarantee design quality.
Update drawings and specifications to reflect the requirements of location or environment.
Use of some technical standards (e.g. ASTM. SASO. ASHTO) for the descriptions of materials quality or construction methods to be followed during projects.

161
Continue in Part Two: CLIENTS PERFORMANCE AND INVOLVEMENT
The purpose of this part is to identify the degree of Client involvement in government projects. Not Strongly
INSTRUCTION: Involved Neutral Involved
Please Indicate ( ) in the box that best describe your level of 1 2 3 4 5 involvement in each of the project phases. ▼ ▼ ▼ ▼ ▼ C: Construction Phase Qualification of contractors competing to implement the project. Explaining the objective of the project and providing the necessary information for bidding
Negotiating contract price with the contractors qualified to do the job. Interpretation and clarification of ambiguities in the contract documents and drawings.
Review, from time to time, the documents that submitted by the contractor (e.g. work schedules. manpower qualifications. equipment. etc.)
Taking necessary decisions against contractor claims during project implementation.
Monitoring and control of implementation methods and cost, as well as work schedule and contractor productivity.
Stress implementation quality and monitoring safety principles during project implementation.
Establishment of a system and written code to ensure implementation quality, to be referred to by personnel in charge of implementation quality assurance and control.
Emphasis on implementation quality by conducting necessary tests for the various implementation stages.
Regularly visit project site during implementation stage.
D: Handover Phase Establishment of criteria for acceptance of completed project. Review of contract documents (engineering drawings, technical specifications, manuals for project maintenance and operation, warranty documents) after completion of the project.
Monitoring the process of testing and commissioning of all systems, plant and equipment in the project.
E: Operation and Maintenance Phase Prepare the maintenance plan describing the maintenance schedules and lists the tasks
Prepare the operation information such as; How to operate the systems, Important safety instructions, and Troubleshooting data; to assist in solving problems and prevent unexpected expensive
Record the warranties and certificates reference information. Building up the inventory including the important spare parts to maintain and operate the project with minimum “down time”
Write the following implementation phases in the order of importance: (use the numbers from 1 to 5: 1 is the most important and 5 less important) Planning - Design - Construction - Handover - Operation and Maintenance ( ) - ( ) - ( ) - ( ) - ( )
End Part Two

162
Part Three: FACTORS AFFECTING CLIENTS PERFORMANCE AND INVOLVEMENT
The purpose of this part is to identify the Factors affecting the client involvement in government project Strongly Strongly Disagree Agree
INSTRUCTION: Please Indicate ( ) in the box the degree to which 1 2 3 4 5
you agree with the following statement: ▼ ▼ ▼ ▼ ▼ A- Client Individual Factors:
• More clients experience more quality in project involvement • Education will improve the clients’ involvement by participation in:
-Training courses -Attend international conferences -Getting a professional certificate in related to projects
• Language difference disrupt effective communication • Clients involvement and participation in the projects is affected by:
- Low clients Salary. - Job satisfaction and overlapping in some project tasks that are not of related duties. - Increases in working hours. - Poor human relation - Inability to make appropriate decisions. - Inability to identify the basic requirements of the project in the first phase of the design. - Inability to identify regulations and responsibilities within the project.
- Unfamiliarity in project design. - Unfamiliarity in project construction. - Emphasis on low construction cost - Emphasis on high quality of project - Emphasis on quick construction
• Good knowledge is influencing the teamwork, collaboration and effective communication. • Technical, planning, organizing, and coordinating skills are very
important for clients to be able to be more effective in project
Project Factors: • Large and complex project affects the coordination between the clients and multiple contractors and sup contractors • Time constraint with unrealistic project contract duration increases the design and construction overlaps which
result to: - Slip schedules - Overrun cost - Diminish quality - Delay in the project
Project Delivery Factors: •In typical of projects, to what extent were the projects implemented:
- Implemented in compliance with the work schedule and finish on time [Time] - Implemented within the contract price [Cost] - Implemented with the specifications and expected quality [Quality] - Satisfactorily operated after project completion [Operation Satisfy]

163
Continue in Part Three: FACTORS AFFECTING CLIENTS PERFORMANCE AND INVOLVEMENT
The purpose of this part is to identify the Factors affecting the client involvement in government project Strongly Strongly Disagree Agree
INSTRUCTION: Please Indicate ( ) in the box the degree to which 1 2 3 4 5
you agree with the following statement: ▼ ▼ ▼ ▼ ▼ Organisational culture Factors:
• The goals and objectives of this organisation are reasonable, clearly defined and regularly reviewed • Everything that employees do is directed at accomplishing the organisation's goal • Employees know well what they need to do to succeed in the long run • This organisation emphasizes team contributions rather than individual contributions • Employees who work in the group are encouraged to work as a team and exchange opinions and ideas
• This organisation emphasizes building cohesive, committed teams of people
• Sharing of information between departments is encouraged • Problems between departments can be resolved effectively • Cooperation and assistance across departments is strongly encouraged
• This organisation sets performance standards for its employees • Employees are coached to improve their skills so they can achieve higher levels of performance
• This organisation emphasizes doing a good job
• Employees are always encouraged to search for better ways of getting the job done
• Employees are encouraged to be creative and innovative • This organisation helps employees to obtain the resources necessary to implement their innovative ideas
• This organisation values the ideas of employees at every level • This organisation allows employees to participate in the decision-making process • Employees are encouraged to have some input on decisions that affect their work
• Performance of employees are adequately recognized and rewarded • There is an atmosphere of trust in this organisation • Employees accept criticism or negative feedback without becoming defensive • Employees are encouraged to share responsibility for things that go wrong in their work group • Employees are rewarded not for whom they know but for what they perform
End Part Three - Thank you

164
Appendix B Questionnaire [ARABIC Version]

165
دراسة تحليليه للعوامل المؤثره على كفاءة مشاركة المهندسين في المشاريع الحكوميه
استبانه مقدمه بواسطة المهندس سلطان بن محمد السليمان
بحث رسالة الدكتوراه حول " دراسة العوامل المؤثره على كفاءة مشاركة من هي جزء االستبانه هذه
المهندسين في لمشاركة الحالية الممارسات " والتي من أهدافها تقييمالمهندسين في المشاريع الحكوميهعلى تنفيذ المشاريع. النتيجة هذه تؤثر أن يمكن السعودية وكيف العربية المملكة المشاريع الحكوميه في
جوانب خالل ثالث المشاريع من المهندسين في اثرت على مشاركة التي األسباب وكذلك دراسةالتنظيمية واخيرا الجوانب المتعلقه بالمشروع الجوانب للمهندسين، الفردية جوانبال: وهي مختلفة
في خطط إعداد لتعزيز مساعد عامل الدراسة هذه نتائج تكون بأن يأمل والباحث .للجهه الحكوميهترفع من إيجابية نتائج لها يكون أن يمكن التي الطرق بعض وتفعيل دور المهندسين واقتراح دعم مجال
.جودة تنفيذ المشاريع الحكوميه
خاصة، حيث يؤكد معلومات أي أو االسم كتابة تتطلب وال اختيارية هي الدراسة هذه في المشاركة البحث ألغراض إال تستخدم ولن تامة بسرية تعامل سوف والمعلومات البيانات جميع أن الباحث .أجزاء ثالثة من دقائق وتتكون 01تستغرق حوالي تعبئة االستبانه .العلمي
أو أسئلة، لديك كان لدى الباحث. إذا كبير تقدير محل الوقت المستخدم الستكمال تعبئة االستبانه هو .بي االتصال في تترددوا فال تعليقات، أو اقتراحات
المهندس/سلطان بن محمد السليمان
كلية الهندسه جامعة كوينزالند للتكنولوجيا
هاتف:
QUEENSLAND UNIVERSITY OF TECHNOLOGY
SCHOOL OF SCIENCE & ENGINEERING

166
الجزء االول
المشاركين عن العامه البيانات والمعلومات بعض جمع هو الجزء هذا من الغرض
( في المكان الذي يتفق مع إجابتك فضال ضع عالمة )
لحكومي الذي تعمل لديه؟ما هو نمط القطاع ا )....الوزارات، الجامعات (قطاع حكومي ).... ،قطاع شبه حكومي ) المؤسسات، ارامكو
العمر
21-30
31-40
41-50
51-60
عليه؟ حاصل تعليمي مؤهل اخر ماهو دكتوراه
ماجستير
عالي دبلوم
جامعي
،حدد اخر ......................
للغه االنجليزيه؟ هل اخر مؤهل تعليمي كان با ال
نعم
هل التحقت بدورات ، ورش عمل ، او مؤتمرات سواء داخل او خارج المملكه في مجال تخصصك؟ ال
) ( نعم، كم عددها في اخر خمس سنوات.
كم عدد سنوات الخبره في االشراف والمتابعه على المشاريع الحكوميه؟ خمس سنوات واقل
6 - 01
00 - 01
06 - 01
سنه 01ى من اعل
ماهية غالبية المشاريع التي قمت بتنفيذها )مباني ) سكني ، غير سكني
)....بنى تحيته ) طرق ، الجسور، الخدمات العامه
).....صناعي ) محطات توليد الكهرباء، محطات تحلية المياه
اخرى
ماهي انواع العقود المستخده لديكم ( عقد المبلغ المقطوعTraditional Lump Sum)
( عقد التصميم والبناءDesign-Build)
وحدة عقد ( األسعارUnit Price)
إدارة عقد ( المشروعConstruction Management)
نهاية الجزء االول

167
الجزء الثاني
الغرض من هذا الجزء هو تحديد درجة مشاركتكم في مراحل المشروع
%011 غير مشارك مشارك
5 4 3 2 1 ( في المكان الذي يتفق مع إجابتك فضال ضع عالمة ) ▼ ▼ ▼ ▼ ▼ المشروع مراحل اثناء الفعليه مشاركتك مدى ويصف
مرحلة التخطيط:
راسات االوليه للمشروع المقترح.تعين فريق لعمل الد
دراسة احتياجات المستفيد من المشروع. تحديد المواصفات الفنيه والشروط التي تحدد نوعية االعمال المطلوب تنفيذها كتابيا.
دراسة كيفية تامين المبالغ الماليه لتموين المشروع. روع والمده المطلوبه إلنهائه.تقدير قيمة المش
اعتماد قيمة المشروع. دراسة وتحديد الخصائص الفنية للمواد المستخدمه للمشروع.
دراسة اثر المشروع على سالمة وصحة المجتمع والبيئه )كالتلوث والضوضاء(. سب الموقع لطبيعة المشروع.وضع معيار الختيار موقع المشروع وان يتان
تحديد ووصف المسئوليات والصالحيات المخوله لكل عضو مشارك بالمشروع )االستشاري، المقاول،
المالك(.
دراسة جدوى المشروع المقترح.
مرحلة التصميم:
االنشاء )جدول الكميات، المواصفات،الرسومات(.استخدام المعايير الهندسيه لتجهيز مستندات ووثائق عقد تاهيل وتحليل عروض المصممين المتقدمين للمشروع ماليا وفنيا.
اختيار فريق التصميم سواء بالمنافسه او بالتاهيل والمفاوضه. مفاوضة المصممين المؤهلين على اجور التصميم.
مصممين بالمعلومات الضروريه لعملية تصميم المشروع. تزويد ال متابعة تقدم سير العمل اثناء عملية التصميم.
تقييم التصميم واخذ القرارات الرئيسيه للمراحل االوليه لتصميم المشروع. مراجعة وثائق التصميم كالرسومات والمواصفات الفنيه.
.مراقبة وضمان جودة التصميم تعديل الرسومات والمواصفات بما يتناسب مع متطلبات الموقع على الطبيعه.
استخدام معايير فنية لوصف نوعية المواد او الطريقه االنشائية المطلوب اتباعها اثناء تنفيذ المشاريع.

168
استمرار للجزء الثاني
المشروع مراحل في مشاركتكم درجة تحديد هو الجزء هذا نم الغرض
%011 غير مشارك مشارك
5 4 3 2 1 ( في المكان الذي يتفق مع إجابتك فضال ضع عالمة ) ▼ ▼ ▼ ▼ ▼ المشروع مراحل اثناء الفعليه ركتكمشا مدى ويصف
مرحلة التنفيذ: تاهيل المقاولين المتنافسين لتنفيذ المشروع.
ايضاح الهدف من المشروع للمقاولين المتنافسين وتوفير المعلومات الالزمه لهم لتقديم عطائاتهم. لعقد مع المقاولين المؤهلين لتنفيذ المشروع.التفاوض على قيمة ا
تفسير وايضاح االلتباس بوثائق العقد. مراجعة ما يقدمه المقاول كالجدول الزمني للمشروع، كفائة العماله، والمعدات.
اتخاذ القرارات الالزمه بخصوص ادعاءات المقاول اثناء تنفيذ المشروع. مراقبة وضبط طرق التنفيذ والتكلفه والجدول الزمني وانتاجية المقاول. التاكيد على جودة التنفيذ ومراقبة اسس السالمه اثناء تنفيذ المشروع.
تحديد اسس ومعاييرتضمن جودة التنفيذ وتستخدم من قبل المسئولين عن ضبط ومراقبة جودة التنفيذ. عمل التجارب الالزمه للتاكد من جودة التنفيذ لمختلف مراحل التنفيذ.
عمل زيارات دوريه للموقع خالل مرحلة التنفيذ.
مرحلة استالم المشروع:
تحديد المعايير الفنيه الستالم المشاريع المنفذه.
المطابقه للواقع ، الكتيبات الخاصه بصيانة وتشغيل المشروع، مراجعة وثائق العقد كالمخططات النهائية
وثائق الضمان سواء للمعدات او المشروع بعد االنتهاء من تنفيذ المشروع.
مراقبة عملية االختبارات في مرحلة التشغيل االبتدائي لجميع النظم واآلالت والمعدات في المشروع.
لصيانه:مرحلة التشغيل وا إعداد خطة الصيانة التي تتضمن جداول الصيانة وقوائم المهام.
بيانات قراءة التشغيل، عند والسالمه االمن تعليمات ، االنظمة تشغيل كيفية: مثل التشغيل، خطة اعداد
.لالتشغي اثناء متوقعة غير تكلفة ومنع المشاكل حل في للمساعدة االخطاء استكشاف و التشغيل
تصنيف الضمانات والشهادات الخاصة باالذظمه.
االنظمه المتوقفه أن تساعد على تشغيل شأنها من التي تخزين المواد االستهالكيه وقطع الغيار المهمه
للصيانه باقل وقت ممكن.
الى المرحلة االقل اهميه: رتب مراحل المشروع بالنسبه لديك من المرحله ذات االهميه القصوى
االقل اهميه( 5يعتبر اهميه قصوى ورقم 0بحيث ان الرقم 5الى 0)استخدم االرقام من
مرحلة التخطيط ) (
مرحلة التصميم ) (
مرحلة التنفيذ ) (
مرحلة استالم المشروع ) (
والصيانه ) ( مرحلة التشغيل
نهاية الجزءالثاني

169
الجزء الثالث
الغرض من هذا الجزء هو تحديد العوامل التي تؤثر على اداء ومشاركة المهندسين المشرفين على المشاريع الحكوميه
اوافق ارض اع
بشده بشده
5 4 3 2 1 العبارات منكل يحدد مدى موافقتك مع الذي ( في المكان فضال ضع عالمة )
▼ ▼ ▼ ▼ ▼ التاليه:
الجوانب الفرديه: لخبره لديهزيادة كفاءة اندماج المهندس بزيادة سنوات ا
زيادة المعرفه تساعد على كفاءة اندماج المهندس في المشاريع وذلك عن طريق: حضور الدورات المتخصصه حضور المؤتمرات العالميه
الحصول على الشهادات العالميه ورخص العمل في مجال التخصص لى مهام المهندس في المشروعضعف اللغه تؤثر سلبا ع
تتاثر جودة انتاجية المهندس خالل االشراف على المشاريع بـ: المردود المالي للمهندس والذي ال يتناسب مع حجم االعمال خالل المشروع
عمله عدم قبول المهندس على االعمال المنوطة به وتداخل بعض االعمال التي ليست من مهام زيادة ساعات العمل
العالقه الغير جيده بين اطراف المشروع عدم القدره على اتخاذ القرارات المناسب
عدم القدره على تحديد المتطلبات االساسيه للمشروع في المرحلة االولي من التصميم نظمه والمسؤليات داخل المشروععدم القدره على تحديد اال
عدم االلمام بتصميم المشروع عدم االلمام بطرق وكيفيه إنشاء المشروع
التركيز على تكلفة البناء المنخفضه التركيز على الجوده العاليه للمشروع التركيز على التنفيذ السريع للمشروع
مستوى المعرفه يساعد على العمل الجماعي والمشاركه الفعالهالمهارات المكتسبه لدى المهندس مثل حسن التخطيط والتنظيم والتنسيق تعتبر مهمه جدا في زيادة قدرة
المهندس على ادارة المشاريع بفاعلية اكثر.
الجوانب المتعلقه بالمشروع:ع الكبيره والمعقده تؤثر على جودة التنسيق بين المهندسين المشرفين واالطراف االخرى للمشروع المشاري
مثل االستشاري والمقاول.
مدة العقد الغير واقعيه وعدم وجود الوقت الكافي اثناء تنفيذ المشروع تزيد من تداخل مراحل تنفيذ المشروع
وتؤدي الى:
دول االعمال الخاصه بالمشروععدم انتظام ج زيادة التكلفه
ضعف الجوده تأخر في تنفيذ المشروع
بشكل عام الى اي مدي تم تنفيذ المشاريع لدي الجهة التي تتبعها: ضمن مدة عقد المشروع واالنتهاء بالوقت المحدد
لمعتمده للمشروعضمن التكلفه ا ضمن المواصفات المحدده والجوده المتوقعه
تم تشغيل المشروع بنجاح بعد االنتهاء من تنفيذ المشروع

170
استمرار للجزء الثالث
الحكوميه ريعالمشا على المشرفين المهندسين ومشاركة اداء على تؤثر التي العوامل تحديد هو الجزء هذا من الغرض
اوافق اعارض
بشده بشده
5 4 3 2 1 العبارات منكل يحدد مدى موافقتك مع الذي ( في المكان فضال ضع عالمة )
▼ ▼ ▼ ▼ ▼ التاليه:
ر التنظيميه للجهه الحكوميه:الجوانب المتعلقه باالمو الجهة الحكومية التي تعمل لديها تركز على:
ان االهداف واالستراتيجيات محدده وواضحه لك.
ان عملك الذي تقوم به يتطابق مع هذه االهداف واالستراتيجيات.ستراتيجيات لتحقيق النجاح على المدى ان تعرف جيدا ما يتعين عليك القيام به ضمن هذه االهداف واال
الطويل.
العمل الجماعي اكثر من العمل الفردي.
تشجيع الموظفين الذين يعملون كفريق جماعي لتبادل االراء واالفكار.
التزام الموظفين بعمل الفريق الجماعي.
ات.تشجيع تبادل المعلومات بين االدار
حل المشاكل بين االدارات واالقسام بشكل فعال.
تشجيع التعاون بين االدارات.
وضع معايير االداء لموظفيها.
تدريب الموظفين لتحسين مهاراتهم لتحقيق مستويات عاليه في االداء.
االداء الجيد لموظفيها.
تشجيع الموظفين دائما للبحث عن أفضل السبل النجاز االعمال.
تشجيع الموظفين على اإلبداع واالبتكار.
مساعد الموظفين على الحصول على الموارد الالزمة لتنفيذ أفكارهم المبتكرة.
اعطاء قيمه القتراحات الموظفين.
بالمشاركه في القرارات الرئيسيه والتي تؤثر على بيئة العمل.تشجيع الموظفين
السماح للموظفين بالمشاركه في عملية صنع القرار.
تقييم الموظفين بدقه ومكافاتهم على ادائهم
يوجد نوع من الثقه المتبادله في بيئة العمل
لردود السلبيهتقبل الموظفين للنقد وا
تحمل الموظفين المسؤولية الجماعية عند االخطاء وليست على الفرد ضمن فريق العمل.
مكافأة الموظفين على ادائهم وليس على أنهم قريبيين من اصحاب القرار.
شكرا لك –نهاية االستبيان

171
Appendix C Preliminary Data Analysis This appendix presents the preliminary data analysis that collected from the
questionnaire. Preliminary data analysis is a process of checking and adjusting the raw
data into a format that can be used for advanced analysis. It includes coding the data,
screening the outliers, and checking the normality distribution, validity and reliability.
C-1: Coding Data
This section presents the coding data. Coding is the process of identifying the data
from the questionnaires using numerical and character symbols. This section has four
parts: demographic, client involvement, factors and project delivery expectation. Each
item in the questionnaire has a character symbol code therefor 103 variables had been
coded as follow:
C-1-1: Demographic [Part 1 in Questionnaire]
Table C-1-1: Data coding for demographic Part One in Questionnaire Survey
Code Demographic Questions
Part1_D_1 What is your government organisation you work for? Part1_D_2 Age
Part1_D_3 What is your level of education (Degree)?
Part1_D_4 Was your education in English? Part1_D_5 Have you ever attended any training course, workshop, or seminar on your field? Part1_D_6 What is your management experience in the construction project?
Part1_D_7 What typical project you do?
Part1_D_8 How many contract/delivery projects do you used? Part1_D_9 Using Traditional Lump Sum Part1_D_10 Using Design-Build Part1_D_11 Using Unit Price Part1_D_12 Using Construction Management

172
C-1-2: Client Involvement [Part 2 in Questionnaire]
Table C-1-2: Data coding for client involvement in the construction phases Part Two in Questionnaire Survey
Code Client involvement in Construction Phases
A-Planning Phase Part2_A_1 Assignment of task force (consultant. engineering. etc.) to conduct preliminary studies for the proposed project
Part2_A_2 Studying the requirements of the beneficiary of the project
Part2_A_3 Defining, in writing, the technical specifications and conditions that determine the quality of the required work
Part2_A_4 Studying how to secure funds to finance the project
Part2_A_5 Estimation of the project cost and the time required for its completion
Part2_A_6 Approval of the project cost
Part2_A_7 Studying and determining the technical specifications of the materials to be used for the project
Part2_A_8 Studying the impact of the project on the safety and health
Part2_A_9 Establishment of a criterion for the selection of project location
Part2_A_10 Description of the responsibilities and powers of each member participating in the project
Part2_A_11 Feasibility study of the proposed project.
B-Design Phase Part2_B_1 Arranging the papers and documents of the construction contract
Part2_B_2 Qualification of designers bidding on the project.
Part2_B_3 Selection of design team.
Part2_B_4 Negotiating of design price with the qualified designers.
Part2_B_5 Provide the designers with the necessary information needed for project.
Part2_B_6 Following the progress of design.
Part2_B_7 Evaluation of design and taking the necessary decisions including the approval of basic design stages.
Part2_B_8 Review of design documents (e.g. drawings and technical specifications)
Part2_B_9 Monitor and guarantee design quality.
Part2_B_10 Update drawings and specifications to reflect the requirements of location or environment.
Part2_B_11 Use of some technical standards for the descriptions of materials quality or construction methods to be followed during projects.
C-Construction Phase Part2_C_1 Qualification of contractors competing to implement the project.
Part2_C_2 Explaining the objective of the project and providing the necessary information for bidding
Part2_C_3 Negotiating contract price with the contractors qualified to do the job.
Part2_C_4 Interpretation and clarification of ambiguities in the contract documents and drawings.
Part2_C_5 Review, from time to time, the documents that submitted by the contractor (e.g. work schedules. manpower qualifications. equipment. etc.)
Part2_C_6 Taking necessary decisions against contractor claims during project implementation.
Part2_C_7 Monitoring and control of implementation methods and cost, as well as work schedule and contractor productivity.
Part2_C_8 Stress implementation quality and monitoring safety principles during project implementation.
Part2_C_9 Establishment of a system and written code to ensure implementation quality, to be referred to by personnel in charge of implementation quality assurance and control.
Part2_C_10 Emphasis on implementation quality by conducting necessary tests for the various implementation stages.
Part2_C_11 Regularly visit project site during implementation stage.
D-Handover Phase Part2_D_1 Establishment of criteria for acceptance of completed project.
Part2_D_2 Review of contract documents (engineering drawings, technical specifications, manuals for project maintenance and operation, warranty documents) after completion of the project.
Part2_D_3 Monitoring the process of testing and commissioning of all systems, plant and equipment in the project.
E-Operation and Maintenance Phase Part2_E_1 Prepare the maintenance plan describing the maintenance schedules and lists the tasks
Part2_E_2 Prepare the operation information such as; How to operate the systems, Important safety instructions, and Troubleshooting data; to assist in solving problems and prevent unexpected expensive
Part2_E_3 Record the warranties and certificates reference information.
Part2_E_4 Building up the inventory including the important spare parts to maintain and operate the project with minimum “down time”

173
C-1-3: Factors Affecting the Involvement [Part 3 in Questionnaire]
Table C-1-3: Data coding for the factors affecting client involvement Part Three in Questionnaire Survey
Code Factors Affecting Client Involvement in Construction Client Individual Factors
Part3_A_1 More clients experience more quality in project involvement
Part3_A_2
Education will improve the clients’ involvement by participation in: -Training courses
Part3_A_3 -Attend international conferences Part3_A_4 -Getting a professional certificate in related to projects
Part3_A_5 Language difference disrupt effective communication
Part3_A_6
clients’ involvement and participation in the projects is affected by: -Low Client Salary
Part3_A_7 -job satisfaction and overlapping in some project tasks that are not of related duties Part3_A_8 -Increases in working hours Part3_A_9 -Poor human relation Part3_A_10 -Inability to make appropriate decisions Part3_A_11 -Inability to identify the basic requirements of the project in the first phase of the design. Part3_A_12 -Inability to identify regulations and responsibilities within the project Part3_A_13 -Unfamiliarity in project design. Part3_A_14 -Unfamiliarity in project construction Part3_A_15 -Emphasis on low construction cost Part3_A_16 -Emphasis on high quality of project Part3_A_17 -Emphasis on quick construction
Part3_A_18 Good knowledge is influencing the teamwork, collaboration and effective communication
Part3_A_19 Technical, planning, organizing, and coordinating skills are very important for clients to be able to be more effective in project
Project Factors Part3_B_1 Large and complex project affects the coordination between the clients and multiple contractors and sup-
contractors
Part3_B_2
Time constraint with unrealistic project contract duration increases the design and construction overlaps which result to: Slip schedules
Part3_B_3 Overrun cost Part3_B_4 Diminish quality Part3_B_5 Delay in the project
Organisational culture Factors Part3_C_1 Clear goals
Part3_C_2 Actions are matched with organisation’s goals
Part3_C_3 Clear approach to succeed
Part3_C_4 Emphasize team contributions
Part3_C_5 Amicable opinions and ideas exchange
Part3_C_6 Members’ commitment to team
Part3_C_7 Encourage information sharing
Part3_C_8 Resolve internal problems effectively
Part3_C_9 Encourage interdepartmental collaboration
Part3_C_10 Explicit set of performance standards
Part3_C_11 Guidance for performance improvement
Part3_C_12 Emphasize good performance
Part3_C_13 Welcome alternative solutions
Part3_C_14 Encourage creative and innovative ideas
Part3_C_15 Allocate resources for implementing innovative ideas
Part3_C_16 Value employees’ ideas
Part3_C_17 Employees’ participation in decision-making process
Part3_C_18 Employees’ input on major decisions
Part3_C_19 Recognize and reward members’ performance
Part3_C_20 Trust atmosphere
Part3_C_21 Accept criticism and negative feedback
Part3_C_22 Emphasize team accountability
Part3_C_23 Equitable reward

174
C-1-4: Project Delivery Expectation [Part 3 in Questionnaire]
Table C-1-4: Data coding for the elements of project delivery expectation
Part Three in Questionnaire Survey Code Project Delivery Expectation
In typical of projects, to what extent were the projects implemented: Part3_D_1 Implemented in compliance with the work schedule and finish on time [Time] Part3_D_2 Implemented within the contract price [Cost] Part3_D_3 Implemented with the specifications and expected quality [Quality] Part3_D_4 Satisfactorily operated after project completion [Operation Satisfy]

175
C-2: Targeted Government Agencies
The questionnaire was distributed in head quarter (HQ) of government agencies that
involved in the most public construction project in Saudi Arabia, such as ministries and
government organisations. The following Table C-2 presents the frequency of the
returned questionnaires
Table C-2: Number of returned survey questionnaire
Sample No of
Responses Percent
(%)
Potential participants (clients) 315 223 70.79 %
Government agencies 21 17 80.95%

176
C-3: Refinement of the Dataset
This section presents the result of handling and treating the data from the missing
value, outliers and checking the normality of the data. This process is very important
when researchers use statistical methods that rely on maximum likelihood estimators
such as factor analysis, SEM and multilevel modelling.
In the present study, screening of missing data, outlier and checking the normality of
the data were applied on Part 2 and Part 3 of the questionnaire survey. The result of
the missing value analysis indicated that no missing data were found in the
questionnaire responses in the dataset as shown in Table C-3-1.
Screening the Outliers
An outlier is an observation that lies an abnormal distance from other values in a data
sample. Outliers can also lead to important changes in results when researchers use
statistical methods that rely on maximum likelihood estimators such as SEM and
multilevel modelling. Keeping the outliers lead to the risk of obtaining more values
that do not accurately represent the sample population (Yuan & Zhong, 2008)
therefore treading the outlier will improve the replicability of essential results. In the
present study, the result indicated that there were some variables that had high
extreme values and other variables had low extreme values as shown in Table C-3-1.
The present study used a technique to treat the outliers based on replacing the
extreme value (low or high) to the closest value in each tail of the distribution. The
advantage of this technique is the data have the same original sample size and the
treated outlier values correct the skewed data.
Checking the Normality Distribution
Normality tests are statistical procedures designed to test whether the underlying
distribution of the data is normally distributed. Examining the data normality is one of
critically important assumptions in the conduct of SEM analyses in general, and in the
use of AMOS in particular (Arbuckle, 2007). To test the desired range results of
skewness (<2) and kurtosis (<7) of the data (West et al., 1995) in the present study,
SPSS (v21) was used to describe the data as presented Table C-3-3 and Table C-3-4. The
results showed that the value of skewness and kurtosis were in the acceptable range.
This supported the conclusion that the data were normally distributed.

177
Table C-3-1: Screening of missing data and outlier for part 2 in the survey questionnaire.
Code N Mean Std.
Deviation Std. Error of Mean
Median Missing No. of Extremesa
Low High
A-Planning Phase
Part2_A_1 223 2.21 1.319 0.088 2.00 0 0 0 Part2_A_2 223 2.50 1.448 0.097 2.00 0 0 0 Part2_A_3 223 2.75 1.331 0.089 3.00 0 0 7 Part2_A_4 223 1.86 1.232 0.082 1.00 0 0 0 Part2_A_5 223 2.11 1.381 0.092 1.00 0 0 0 Part2_A_6 223 1.65 1.100 0.074 1.00 0 0 9 Part2_A_7 223 2.68 1.320 0.088 2.00 0 0 0 Part2_A_8 223 1.94 1.353 0.091 1.00 0 0 0 Part2_A_9 223 2.04 1.423 0.095 1.00 0 0 0 Part2_A_10 223 2.00 1.357 0.091 1.00 0 0 8 Part2_A_11 223 1.85 1.323 0.089 1.00 0 0 5
B- Design Phase
Part2_B_1 223 2.57 1.415 0.095 3.00 0 0 0 Part2_B_2 223 2.74 1.723 0.115 2.00 0 0 0 Part2_B_3 223 2.07 1.409 0.094 1.00 0 0 0 Part2_B_4 223 2.04 1.602 0.107 1.00 0 0 0 Part2_B_5 223 2.70 1.506 0.101 2.00 0 0 0 Part2_B_6 223 2.97 1.552 0.104 3.00 0 0 0 Part2_B_7 223 2.47 1.596 0.107 2.00 0 0 0 Part2_B_8 223 3.19 1.403 0.094 3.00 0 0 0 Part2_B_9 223 2.93 1.517 0.102 3.00 0 0 0 Part2_B_10 223 2.67 1.296 0.087 3.00 0 0 6 Part2_B_11 223 2.80 1.463 0.098 3.00 0 0 0
C- Construction Phase
Part2_C_1 223 2.49 1.775 0.119 1.00 0 0 0 Part2_C_2 223 2.60 1.689 0.113 2.00 0 0 0 Part2_C_3 223 1.91 1.535 0.103 1.00 0 0 4 Part2_C_4 223 2.50 1.448 0.097 2.00 0 0 0 Part2_C_5 223 2.85 1.298 0.087 3.00 0 0 0 Part2_C_6 223 3.26 1.438 0.096 3.00 0 0 0 Part2_C_7 223 3.60 1.429 0.096 4.00 0 0 0 Part2_C_8 223 3.53 1.442 0.097 4.00 0 0 0 Part2_C_9 223 2.96 1.437 0.096 3.00 0 0 0 Part2_C_10 223 2.99 1.511 0.101 3.00 0 0 0 Part2_C_11 223 3.31 1.273 0.085 3.00 0 0 0
D- Handover Phase
Part2_D_1 223 3.09 1.498 0.100 3.00 0 0 0 Part2_D_2 223 3.36 1.485 0.099 4.00 0 0 0 Part2_D_3 223 3.11 1.540 0.103 3.00 0 0 0
E- Operation and Maintenance
Part2_E_1 223 1.93 1.115 0.075 2.00 0 0 0 Part2_E_2 223 2.09 1.263 0.085 2.00 0 0 0 Part2_E_3 223 2.24 1.140 0.076 2.00 0 0 0 Part2_E_4 223 1.98 1.193 0.080 2.00 0 0 0
a. Number of cases outside the range (Q1 - 1.5*IQR, Q3 + 1.5*IQR)

178
Table C-3-2: Screening of missing data and outlier for part 3 in the survey questionnaire.
Code N Mean Std.
Deviation Std. Error of Mean
Median Missing
No. of Extremesa
Low High
Client Individual Factors
Part3_A_1 223 4.11 .842 .056 4.00 0 0 0 Part3_A_2 223 4.52 .885 .059 5.00 0 4 0 Part3_A_3 223 3.99 1.076 .072 4.00 0 0 0 Part3_A_4 223 4.57 .653 .044 5.00 0 2 0 Part3_A_5 223 4.38 .817 .055 5.00 0 4 0 Part3_A_6 223 4.53 .793 .053 5.00 0 3 0 Part3_A_7 223 4.33 .893 .060 5.00 0 6 0 Part3_A_8 223 3.24 1.155 .077 3.00 0 0 0 Part3_A_9 223 3.90 .829 .056 4.00 0 0 0 Part3_A_10 223 3.92 .953 .064 4.00 0 0 0 Part3_A_11 223 3.84 1.138 .076 4.00 0 0 0 Part3_A_12 223 4.22 .799 .053 4.00 0 5 0 Part3_A_13 223 4.13 .918 .061 4.00 0 6 0 Part3_A_14 223 4.43 .861 .058 5.00 0 11 0 Part3_A_15 223 3.62 1.480 .099 4.00 0 0 0 Part3_A_16 223 2.80 1.266 .085 3.00 0 0 0 Part3_A_17 223 4.03 .956 .064 4.00 0 0 0 Part3_A_18 223 4.45 .726 .049 5.00 0 2 0 Part3_A_19 223 4.55 .634 .042 5.00 0 0 0
Project Factors
Part3_B_1 223 3.28 1.296 .087 4.00 0 10 0
Part3_B_2 223 4.34 .736 .049 4.00 0 1 0
Part3_B_3 223 3.64 1.344 .090 4.00 0 0 0
Part3_B_4 223 3.71 1.094 .073 4.00 0 0 0
Part3_B_5 223 4.38 .921 .061 5.00 0 8 0
Organisational culture Factors
Part3_C_1 223 2.98 1.250 .084 3.00 0 0 0 Part3_C_2 223 3.22 1.196 .0080 3.00 0 7 0 Part3_C_3 223 3.29 1.158 .078 3.00 0 6 0 Part3_C_4 223 2.65 1.543 .103 3.00 0 0 0 Part3_C_5 223 2.56 1.615 .108 2.00 0 0 0 Part3_C_6 223 2.48 1.559 .104 2.00 0 0 0 Part3_C_7 223 2.78 1.360 .091 2.00 0 0 0 Part3_C_8 223 2.79 1.447 .097 3.00 0 0 0 Part3_C_9 223 2.71 1.480 .099 2.00 0 0 0 Part3_C_10 223 2.89 1.498 .100 3.00 0 0 0 Part3_C_11 223 2.60 1.593 .107 2.00 0 0 0 Part3_C_12 223 2.83 1.570 .105 3.00 0 0 0 Part3_C_13 223 2.67 1.463 .098 2.00 0 0 0 Part3_C_14 223 2.42 1.474 .099 2.00 0 0 0 Part3_C_15 223 2.22 1.328 .089 2.00 0 0 0 Part3_C_16 223 2.57 1.250 .084 2.00 0 0 9 Part3_C_17 223 2.47 1.338 .090 2.00 0 0 0 Part3_C_18 223 2.46 1.413 .095 2.00 0 0 0 Part3_C_19 223 2.39 1.426 .095 2.00 0 0 0 Part3_C_20 223 2.75 1.500 .100 2.00 0 0 0 Part3_C_21 223 2.74 1.264 .085 3.00 0 0 0 Part3_C_22 223 2.56 1.354 .091 2.00 0 0 0 Part3_C_23 223 2.61 1.561 .105 2.00 0 0 0 Project Delivery Expectation
Part3_D_1 223 2.24 .993 .066 2.00 0 4 7
Part3_D_2 223 2.90 .905 .061 3.00 0 0 9
Part3_D_3 223 3.09 1.083 .072 3.00 0 0 0
Part3_D_4 223 3.14 1.203 .081 3.00 0 0 0
a. Number of cases outside the range (Q1 - 1.5*IQR, Q3 + 1.5*IQR)

179
The following Table C-3-3 and Table C-3-4 presented the final treated data on client
involvement (Part 2 in the questionnaire) and the factors affecting client involvement
(Part 3 in the questionnaire).
Table C-3-3: Final data for client involvement after treated from outlier and univariate non-normality distribution (part 2 in the survey questionnaire)
Code N Mean Std.
Deviation
Skewness Kurtosis
Statistic Std. Error Statistic Std. Error
A-Planning Phase
Part2_A_1 223 2.21 1.319 .659 .163 -.735 .324 Part2_A_2 223 2.50 1.448 .341 .163 -1.417 .324 Part2_A_3 223 2.58 1.062 -.094 .163 -1.213 .324 Part2_A_4 223 1.86 1.232 1.275 .163 .543 .324 Part2_A_5 223 2.11 1.381 .892 .163 -.514 .324 Part2_A_6 223 1.54 .842 1.044 .163 -.771 .324 Part2_A_7 223 2.68 1.320 .566 .163 -.871 .324 Part2_A_8 223 1.94 1.353 1.219 .163 .096 .324 Part2_A_9 223 2.04 1.423 1.084 .163 -.308 .324 Part2_A_10 223 1.72 .830 .559 .163 -1.322 .324 Part2_A_11 223 1.61 .831 .849 .163 -1.016 .324
B- Design Phase
Part2_B_1 223 2.57 1.415 .421 .163 -1.036 .324 Part2_B_2 223 2.74 1.723 .238 .163 -1.698 .324 Part2_B_3 223 2.07 1.409 .992 .163 -.420 .324 Part2_B_4 223 2.04 1.602 1.062 .163 -.674 .324 Part2_B_5 223 2.70 1.506 .387 .163 -1.294 .324 Part2_B_6 223 2.97 1.552 -.006 .163 -1.526 .324 Part2_B_7 223 2.47 1.596 .587 .163 -1.276 .324 Part2_B_8 223 3.19 1.403 -.219 .163 -1.197 .324 Part2_B_9 223 2.93 1.517 .122 .163 -1.472 .324 Part2_B_10 223 2.54 1.081 -.121 .163 -1.256 .324 Part2_B_11 223 2.80 1.463 .103 .163 -1.372 .324
C- Construction Phase
Part2_C_1 223 2.49 1.775 .518 .163 -1.572 .324 Part2_C_2 223 2.60 1.689 .415 .163 -1.562 .324 Part2_C_3 223 1.67 .836 .678 .163 -1.232 .324 Part2_C_4 223 2.50 1.448 .503 .163 -1.094 .324 Part2_C_5 223 2.85 1.298 .340 .163 -.957 .324 Part2_C_6 223 3.26 1.438 -.300 .163 -1.236 .324 Part2_C_7 223 3.60 1.429 -.710 .163 -.838 .324 Part2_C_8 223 3.53 1.442 -.591 .163 -1.020 .324 Part2_C_9 223 2.96 1.437 .080 .163 -1.199 .324 Part2_C_10 223 2.99 1.511 .078 .163 -1.449 .324 Part2_C_11 223 3.31 1.273 -.175 .163 -.956 .324
D- Handover Phase
Part2_D_1 223 3.09 1.498 -.025 .163 -1.341 .324 Part2_D_2 223 3.36 1.485 -.393 .163 -1.210 .324 Part2_D_3 223 3.11 1.540 .035 .163 -1.482 .324
E- Operation and Maintenance
Part2_E_1 223 1.93 1.115 1.157 .163 .637 .324 Part2_E_2 223 2.09 1.263 1.034 .163 .003 .324 Part2_E_3 223 2.24 1.140 .646 .163 -.171 .324 Part2_E_4 223 1.98 1.193 1.095 .163 .324 .324

180
Table C-3-4: Final data for factors affecting the client involvement after treated from outlier and univariate non-normality distribution (part 3 in the survey questionnaire)
Code N Mean Std.
Deviation
Skewness Kurtosis
Statistic Std. Error Statistic Std. Error
Client Individual Factors
Part3_A_1 223 4.11 .842 -.435 .163 -.891 .324 Part3_A_2 223 4.55 .792 -1.309 .163 -.112 .324 Part3_A_3 223 3.99 1.076 -.783 .163 -.412 .324 Part3_A_4 223 4.57 .624 -1.180 .163 .303 .324 Part3_A_5 223 4.40 .740 -.806 .163 -.740 .324 Part3_A_6 223 4.55 .757 -1.292 .163 -.006 .324 Part3_A_7 223 4.37 .771 -.753 .163 -.923 .324 Part3_A_8 223 3.24 1.155 .249 .163 -1.059 .324 Part3_A_9 223 3.90 .829 .052 .163 -1.240 .324 Part3_A_10 223 3.92 .953 -.508 .163 -.695 .324 Part3_A_11 223 3.84 1.138 -.520 .163 -1.086 .324 Part3_A_12 223 4.24 .749 -.419 .163 -1.112 .324 Part3_A_13 223 4.20 .786 -.364 .163 -1.295 .324 Part3_A_14 223 4.48 .740 -1.024 .163 -.427 .324 Part3_A_15 223 3.62 1.480 -.651 .163 -.993 .324 Part3_A_16 223 2.80 1.266 .010 .163 -1.022 .324 Part3_A_17 223 4.03 .956 -.469 .163 -.860 .324 Part3_A_18 223 4.46 .702 -.912 .163 -.448 .324 Part3_A_19 223 4.55 .634 -1.106 .163 .124 .324
Project Factors
Part3_B_1 223 3.66 .906 -.410 .163 -.573 .324
Part3_B_2 223 4.35 .724 -.632 .163 -.863 .324
Part3_B_3 223 3.64 1.344 -.882 .163 -.351 .324
Part3_B_4 223 3.71 1.094 -.577 .163 -.531 .324
Part3_B_5 223 4.44 .744 -.916 .163 -.609 .324
Organisational culture Factors
Part3_C_1 223 2.98 1.250 .001 .163 -.816 .324 Part3_C_2 223 2.89 1.093 -.285 .163 -.716 .324 Part3_C_3 223 3.11 1.188 -.177 .163 -.676 .324 Part3_C_4 223 2.65 1.543 .327 .163 -1.342 .324 Part3_C_5 223 2.56 1.615 .468 .163 -1.398 .324 Part3_C_6 223 2.48 1.559 .550 .163 -1.221 .324 Part3_C_7 223 2.78 1.360 .500 .163 -1.006 .324 Part3_C_8 223 2.79 1.447 .320 .163 -1.217 .324 Part3_C_9 223 2.71 1.480 .378 .163 -1.240 .324 Part3_C_10 223 2.89 1.498 -.099 .163 -1.498 .324 Part3_C_11 223 2.60 1.593 .337 .163 -1.503 .324 Part3_C_12 223 2.83 1.570 .039 .163 -1.534 .324 Part3_C_13 223 2.67 1.463 .339 .163 -1.296 .324 Part3_C_14 223 2.42 1.474 .530 .163 -1.122 .324 Part3_C_15 223 2.22 1.328 .937 .163 -.244 .324 Part3_C_16 223 2.29 .962 .345 .163 -.802 .324 Part3_C_17 223 2.47 1.338 .490 .163 -.985 .324 Part3_C_18 223 2.46 1.413 .532 .163 -1.032 .324 Part3_C_19 223 2.39 1.426 .765 .163 -.773 .324 Part3_C_20 223 2.75 1.500 .380 .163 -1.300 .324 Part3_C_21 223 2.74 1.264 .276 .163 -.829 .324 Part3_C_22 223 2.56 1.354 .408 .163 -1.130 .324 Part3_C_23 223 2.61 1.561 .483 .163 -1.326 .324 Project Delivery Expectation
Part3_D_1 223 1.87 .678 .171 .163 -.822 .324
Part3_D_2 223 2.84 .793 .178 .163 -1.160 .324
Part3_D_3 223 3.09 1.083 -.051 .163 -.405 .324
Part3_D_4 223 3.14 1.203 .003 .163 -.927 .324

181
C-4: Reliability Test of the Measures in the Questionnaire
This section presents the result of reliability test. Reliability is a major concern when a
psychological test is used to measure some attribute. Therefore, without reliable
measures, the data cannot be tested and the output result is not as accurate as
needed to help in developing and improving the research objectives (DeVellis, 2012).
At the most basic level, there are three methods that can be used to evaluate the
reliability of a scale: inter-item correlations, Cronbach's alpha, and corrected item-total
correlations (Iacobucci & Duhachek, 2003). Cronbach's alpha is the most commonly
used metric used to evaluate the reliability (Gliem & Gliem, 2003). The Cronbach alpha
reliability coefficient normally ranges between 0 and 1. Nunnaly and Bernstein (1994)
and Kline (2013) stated that the Cronbach alpha value of 0.7 is regarded as a minimum
figure for an adequate test. Table 3.3 presents a summary of the reliability level
considerations in relation to the Cronbach alpha values, including the parameters
followed in this study. To achieve an adequate scale of Cronbach alpha values, Kline
(1999) recommended deleting any questionnaire item with a corrected item-total
correlation of greater than 0.3.

182
C-4-1: Reliability Test of Client Involvement in Project Phases
Planning Phase:
Table C-4-1: Reliability statistics of planning phase
Cronbach's
Alpha
Cronbach's Alpha Based on
Standardized Items N of Items
.918 .922 11
Table C-4-2: Item-Total statistics of planning phase
Scale Mean if Item Deleted
Scale Variance if Item Deleted
Corrected Item-Total Correlation
Cronbach's Alpha if Item
Deleted
Part2_A_1 20.57 79.165 .698 .910
Part2_A_2 20.28 75.852 .767 .906
Part2_A_3 20.20 81.855 .744 .908
Part2_A_4 20.92 81.444 .645 .912
Part2_A_5 20.67 76.455 .784 .905
Part2_A_6 21.24 88.482 .511 .918
Part2_A_7 20.10 79.390 .687 .911
Part2_A_8 20.84 79.704 .652 .913
Part2_A_9 20.74 77.304 .718 .909
Part2_A_10 21.06 86.361 .664 .913
Part2_A_11 21.17 85.667 .711 .912
Test action taken:
Table Test Scale Reliability Action
Table C-4-1 Cronbach's Alpha .918 High Accepted
Table C-4-2 Cronbach's Alpha for each item
All items over 0.9 High Accepted
Table C-4-2 Corrected Item-Total Correlation
All items Greater than 0.3
Accepted

183
Design Phase:
Table C-4-3: Reliability statistics of design phase
Cronbach's Alpha Cronbach's Alpha Based on
Standardized Items N of Items
.922 .924 11
Table C-4-4: Item-Total statistics of design phase
Scale Mean if
Item Deleted
Scale Variance if
Item Deleted
Corrected Item-
Total Correlation
Cronbach's
Alpha if Item
Deleted
Part2_B_1 26.44 125.563 .729 .914
Part2_B_2 26.28 126.355 .552 .923
Part2_B_3 26.95 127.601 .663 .917
Part2_B_4 26.98 125.982 .616 .919
Part2_B_5 26.32 119.886 .865 .907
Part2_B_6 26.05 124.047 .701 .915
Part2_B_7 26.55 120.510 .788 .910
Part2_B_8 25.83 126.325 .710 .914
Part2_B_9 26.09 123.938 .724 .914
Part2_B_10 26.48 133.881 .625 .919
Part2_B_11 26.22 126.395 .673 .916
Test action taken:
Table Test Scale Reliability Action
Table C-4-3 Cronbach's Alpha .922 High Accepted
Table C-4-4 Cronbach's Alpha for each item
All items over 0.9 High Accepted
Table C-4-4 Corrected Item-Total Correlation
All items Greater than 0.3
Accepted

184
Construction Phase:
Table C-4-5: Reliability statistics of construction phase
Cronbach's Alpha Cronbach's Alpha Based on
Standardized Items N of Items
.905 .908 11
Table C-4-6: Item-Total statistics of construction phase
Scale Mean if
Item Deleted
Scale Variance if
Item Deleted
Corrected Item-
Total Correlation
Cronbach's
Alpha if Item
Deleted
Part2_C_1 29.27 105.243 .539 .905
Part2_C_2 29.17 104.292 .605 .900
Part2_C_3 30.09 118.632 .477 .906
Part2_C_4 29.26 103.725 .752 .891
Part2_C_5 28.91 106.776 .729 .893
Part2_C_6 28.50 104.801 .718 .893
Part2_C_7 28.16 107.505 .623 .898
Part2_C_8 28.23 107.792 .606 .899
Part2_C_9 28.80 105.033 .710 .893
Part2_C_10 28.78 101.445 .798 .888
Part2_C_11 28.45 109.501 .634 .898
Test action taken:
Table Test Scale Reliability Action
Table C-4-5 Cronbach's Alpha .905 High Accepted
Table C-4-6 Cronbach's Alpha for each item
All items over 0.8 v. good to High
Accepted
Table C-4-6 Corrected Item-Total Correlation
All items Greater than 0.3
Accepted

185
Handover Phase:
Table C-4-7: Reliability statistics of handover phase
Cronbach's Alpha Cronbach's Alpha Based on
Standardized Items N of Items
.927 .927 3
Table C-4-8: Item-Total statistics of handover phase
Scale Mean if Item Deleted
Scale Variance if Item Deleted
Corrected Item-Total Correlation
Cronbach's Alpha if Item
Deleted
Part2_D_1 6.47 8.286 .849 .896
Part2_D_2 6.20 8.117 .890 .863
Part2_D_3 6.45 8.266 .815 .924
Test action taken:
Operation and Maintenance Phase:
Table C-4-9: Reliability statistics of operation and maintenance phase
Cronbach's Alpha Cronbach's Alpha Based on
Standardized Items N of Items
.821 .821 4
Test action taken:
Table Test Scale Reliability Action
Table C-4-7 Cronbach's Alpha .927 High Accepted
Table C-4-8 Cronbach's Alpha for each item
All items over 0.8 v. good to High
Accepted
Table C-4-8 Corrected Item-Total Correlation
All items Greater than 0.3
Accepted
Table C-4-10: Item-Total statistics of operation and maintenance phase
Scale Mean if Item Deleted
Scale Variance if Item Deleted
Corrected Item-Total Correlation
Cronbach's Alpha if Item
Deleted
Part2_E_1 6.31 8.692 .690 .755
Part2_E_2 6.15 7.751 .729 .733
Part2_E_3 6.00 9.004 .609 .790
Part2_E_4 6.26 9.058 .556 .815
Table Test Scale Reliability Action
Table C-4-9 Cronbach's Alpha .821 Very Good Accepted
Table C-4-10 Cronbach's Alpha for each item
All items over 0.7 Good to V. good
Accepted
Table C-4-10 Corrected Item-Total Correlation
All items Greater than 0.3
Accepted

186
Reliability Test for Whole Five Phases measurement of clients’ involvement [Part 2 in the Questionnaire]:
Table C-4-11: Reliability statistics of operation and maintenance phase
Cronbach's Alpha Cronbach's Alpha Based on
Standardized Items N of Items
.943 .944 40
Table C-4-12: Item-Total statistics of operation and maintenance phase
Scale Mean if Item Deleted
Scale Variance if Item Deleted
Corrected Item-Total Correlation
Cronbach's Alpha if Item Deleted
Part2_A_1 99.16 890.430 .554 .941
Part2_A_2 98.87 896.126 .434 .942
Part2_A_3 98.78 900.638 .534 .942
Part2_A_4 99.50 906.422 .376 .943
Part2_A_5 99.26 887.579 .563 .941
Part2_A_6 99.83 920.199 .292 .943
Part2_A_7 98.69 892.198 .531 .942
Part2_A_8 99.42 891.029 .532 .942
Part2_A_9 99.32 884.047 .588 .941
Part2_A_10 99.64 908.772 .527 .942
Part2_A_11 99.76 908.806 .526 .942
Part2_B_1 98.79 872.410 .735 .940
Part2_B_2 98.62 869.416 .625 .941
Part2_B_3 99.29 884.099 .594 .941
Part2_B_4 99.33 883.140 .526 .942
Part2_B_5 98.67 873.862 .671 .940
Part2_B_6 98.39 888.330 .487 .942
Part2_B_7 98.89 874.114 .627 .941
Part2_B_8 98.17 886.746 .564 .941
Part2_B_9 98.43 885.040 .537 .942
Part2_B_10 98.83 893.740 .633 .941
Part2_B_11 98.56 881.770 .598 .941
Part2_C_1 98.87 868.537 .613 .941
Part2_C_2 98.77 871.450 .617 .941
Part2_C_3 99.69 901.530 .670 .941
Part2_C_4 98.86 876.472 .668 .940
Part2_C_5 98.51 880.377 .698 .940
Part2_C_6 98.10 895.399 .446 .942
Part2_C_7 97.76 893.732 .469 .942
Part2_C_8 97.83 892.671 .477 .942
Part2_C_9 98.40 893.683 .466 .942
Part2_C_10 98.38 880.939 .587 .941
Part2_C_11 98.05 897.042 .488 .942
Part2_D_1 98.27 888.488 .505 .942
Part2_D_2 98.00 891.158 .479 .942
Part2_D_3 98.25 882.513 .557 .941
Part2_E_1 99.43 906.823 .414 .942
Part2_E_2 99.27 910.173 .316 .943
Part2_E_3 99.13 916.966 .255 .943
Part2_E_4 99.38 910.327 .335 .943
Test action taken:
Table Test Scale Reliability Action
Table C-4-11 Cronbach's Alpha .943 high Accepted
Table C-4-12 Cronbach's Alpha for each item
All items over 0.9 High Accepted
Table C-4-12 Corrected Item-Total Correlation
All items Greater than 0.3
Accepted

187
C-4-2: Reliability Test for Individual Factors
Table C-4-13: Reliability statistics of individual fators
Cronbach's Alpha Cronbach's Alpha Based on
Standardized Items N of Items
.788 .814 19
Table C-4-14: Item-Total statistics of individual factors
Scale Mean if Item Deleted
Scale Variance if Item Deleted
Corrected Item-Total Correlation
Cronbach's Alpha if Item Deleted
Part3_A_1 73.70 55.570 .590 .765
Part3_A_2 73.26 56.547 .547 .768
Part3_A_3 73.83 54.082 .534 .765
Part3_A_4 73.24 58.263 .528 .772
Part3_A_5 73.41 58.936 .370 .778
Part3_A_6 73.26 58.763 .375 .778
Part3_A_7 73.44 61.851 .102 .792
Part3_A_8 74.57 54.561 .456 .771
Part3_A_9 73.91 54.853 .663 .760
Part3_A_10 73.89 53.767 .645 .759
Part3_A_11 73.97 54.040 .499 .768
Part3_A_12 73.57 58.525 .402 .777
Part3_A_13 73.61 57.166 .496 .771
Part3_A_14 73.34 60.215 .254 .784
Part3_A_15 74.19 60.379 .048 .814
Part3_A_16 75.01 60.437 .084 .804
Part3_A_17 73.78 59.388 .230 .787
Part3_A_18 73.35 59.779 .315 .781
Part3_A_19 73.26 61.680 .161 .788
Test action taken:
(*): Cronbach’s Alpha is 0.788 which indicate as a good scale and closed to 0.8 (very
good scale) so Items: Part3_A_7, Part3_A_14, Part3_A_15, Part3_A_16, Part3_A_17
and Part3_A_19 that had a positive value and less than 0.3 of inter-item corrected
matrix no need for deletion.
Table Test Scale Reliability Action
Table C-4-13 Cronbach's Alpha .788 Good Accepted
Table C-4-14 Cronbach's Alpha for each item
All items over 0.7 good to v. good
Accepted
Table C-4-14 Corrected Item-Total Correlation
6 item less than 0.3(*)
Accepted

188
C-4-3: Reliability Test for Project Factors
Table C-4-15: Reliability statistics of project factors
Cronbach's Alpha Cronbach's Alpha Based on
Standardized Items N of Items
.408 .468 5
Table C-4-16: Item-Total statistics of project factors
Scale Mean if Item Deleted
Scale Variance if Item Deleted
Corrected Item-Total Correlation
Cronbach's Alpha if Item Deleted
Part3_B_1 16.14 5.472 .233 .339
Part3_B_2 15.45 5.708 .302 .311
Part3_B_3 16.16 4.493 .172 .415
Part3_B_4 16.09 5.376 .139 .414
Part3_B_5 15.36 5.691 .291 .314
Test action taken:
(*): Cronbach’s Alpha is 0.408 which indicate as a poor scale and not reliable so Items:
Part3_B_1, Part3_B_3, Part3_B_4, and Part3_B_5 that had a positive value and less
than 0.3 of inter-item corrected matrix need for deletion. One item remaining which
cannot get the reliability scale because a scale must contain multiple items. As a result,
the group “Project aspect” is not reliable and had been removed.
Table Test Scale Reliability Action
Table C-4-15 Cronbach's Alpha .408 Poor Not Accepted
Table C-4-16 Cronbach's Alpha for each item
All items less than 0.7
Poor Not Accepted
Table C-4-16 Corrected Item-Total Correlation
5 item out of 6 less than 0.3(*)
Not Accepted

189
C-4-4: Reliability Test for Organisational Culture Factors
Table C-4-17: Reliability statistics of organisational culture factors
Cronbach's Alpha Cronbach's Alpha Based on
Standardized Items N of Items
.977 .975 23
Table C-4-18: Item-Total statistics of organisational culture factors
Scale Mean if Item Deleted
Scale Variance if Item Deleted
Corrected Item-Total Correlation
Cronbach's Alpha if Item Deleted
Part3_C_1 57.84 656.655 .631 .977
Part3_C_2 57.93 691.923 .096 .980
Part3_C_3 57.71 679.170 .292 .979
Part3_C_4 58.17 629.511 .862 .975
Part3_C_5 58.26 622.268 .915 .975
Part3_C_6 58.35 624.398 .922 .975
Part3_C_7 58.04 637.043 .870 .975
Part3_C_8 58.03 630.787 .904 .975
Part3_C_9 58.11 629.604 .900 .975
Part3_C_10 57.93 644.784 .678 .977
Part3_C_11 58.22 628.145 .851 .975
Part3_C_12 57.99 628.459 .860 .975
Part3_C_13 58.15 634.941 .835 .975
Part3_C_14 58.40 630.611 .890 .975
Part3_C_15 58.61 637.348 .888 .975
Part3_C_16 58.53 665.637 .646 .977
Part3_C_17 58.35 637.102 .884 .975
Part3_C_18 58.36 633.025 .895 .975
Part3_C_19 58.43 635.435 .851 .975
Part3_C_20 58.07 627.937 .911 .975
Part3_C_21 58.08 646.206 .791 .976
Part3_C_22 58.26 636.700 .880 .975
Part3_C_23 58.22 629.548 .851 .975
Test ation taken:
(*): Cronbach’s Alpha is 0.943 which indicate as a High scale so no need to remove any
items.
Table Test Scale Reliability Action
Table C-4-17 Cronbach's Alpha .943 High Accepted
Table C-4-18 Cronbach's Alpha for each item
All items over 0.9 High Accepted
Table C-4-18 Corrected Item-Total Correlation
Only 2 items less than 0.3(*)
Accepted

190
C-4-5: Reliability Test for Project Delivery Expectations
Table C-4-19: Reliability statistics of project delivery expectation
Cronbach's Alpha Cronbach's Alpha Based on
Standardized Items N of Items
.853 .865 4
Table C-4-20: Item-Total statistics of project delivery expectation
Scale Mean if Item Deleted
Scale Variance if Item Deleted
Corrected Item-Total Correlation
Cronbach's Alpha if Item Deleted
Part3_D_1 7.57 4.984 .849 .754
Part3_D_2 7.46 4.574 .829 .752
Part3_D_3 7.39 4.943 .812 .765
Part3_D_4 6.67 5.880 .378 .951
Test action taken:
Table Test Scale Reliability Action
Table C-4-19 Cronbach's Alpha .853 V. Good Accepted
Table C-4-20 Cronbach's Alpha for each item
All items over 0.7 good to High
Accepted
Table C-4-20 Corrected Item-Total Correlation
All item greater than 0.3
Accepted

191
Appendix D Data Result of the Questionnaire
D-1: Demographic Statistic [Part 1 in Questionnaire]
Table D-1-1: Participants personal information
Frequency Precent
(%) Valid
Percent Cumulative
Percent
Participants Type of Government organisation: [Part_D_1] Public 95 42.6 42.6 42.6 Semi-Public 128 57.4 57.4 100.0 Total 223 100.0 100.0
Participants Age: [Part_D_2]
21-30 52 22.9 22.9 22.9
31-40 129 57.8 57.8 80.7
41-50 23 10.3 10.3 91.0
51-60 17 7.6 7.6 98.7
Above 60 3 1.3 1.3 100.0
Total 223 100.0 100.0
Participants Education Level: [Part_D_3]
Doctor 4 1.8 1.8 1.8
Master’s degree 72 32.3 32.3 34.1
Higher Diploma 2 .9 .9 35.0
Bachelor’s 144 64.6 64.6 99.6
Other 1 .4 .4 100.0
Total 223 100.0 100.0
Workshops attended in the last five years: [Part_D_5]
0 71 31.8 31.8 31.8
1-5 110 49.3 49.3 81.1
6-10 35 15.7 15.7 96.8
11-15 5 2.3 2.3 99.1
16 - 20 2 0.9 0.9 100.0
Total 223 100.0 100.0
Participants Experience: [Part_D_6]
Less than 5 63 28.3 28.3 28.3
6-10 68 30.5 30.5 58.7
11-15 54 24.2 24.2 83.0
16-20 12 5.4 5.4 88.3
Above 20 26 11.7 11.7 100.0
Total 223 100.0 100.0

192
Table D-1-2: No of typical projects those clients do
Project Type [Part1_D_7]
Public Semi-Public Overall
N Precent
(%) N
Precent (%)
N Precent
(%)
Building ( residential, non-residential) 21 22.1 99 77.3 120 53.8
Infrastructure (Highways) 10 10.5 20 15.6 30 13.5
Industrial (Power plant, refineries, etc.) 35 36.8 6 4.7 41 18.4
Other 29 30.5 3 2.3 32 14.3
Total 95 100.0 128 100.0 223 100.0
Table D-1-3: Contracts used in public and semi-public project delivery
No of different contracts used in project delivery
[Part1_D_8]
Public Semi-Public Overall
N Precent
(%) N
Precent (%)
N Precent
(%)
0 17 17.9 0 0 17 7.6
1 53 55.8 88 68.8 141 63.2
2 18 18.9 24 18.8 42 18.8
3 6 6.3 9 7.0 15 6.7
4 1 1.1 7 5.5 8 3.8
Total 95 100.0 128 100.0 223 100.0
Table D-1-4: The four types of contract delivery in public and semi-public projects
Contract Delivery Type
Public Semi-Public Overall
N Precent
(%) N
Precent (%)
N Precent
(%)
Using Traditional Lump Sum
No 69 72.6 9 7.0 78 35.0
Yes 26 27.4 119 93.0 145 65.0
Total 95 100.0 128 100.0 223 100.0
Using Design-Build
No 83 87.4 95 74.2 178 79.9
Yes 12 12.6 33 25.8 45 20.2
Total 95 100.0 128 100.0 223 100.0
Using Unit Price
No 52 54.7 113 88.3 165 74.4
Yes 43 45.3 15 11.7 58 26.0
Total 95 100.0 128 100.0 223 100.0
Using Construction Management
No 65 68.4 104 81.3 169 75.8
Yes 30 31.6 24 18.8 54 24.2
Total 95 100.0 128 100.0 223 100.0

193
Table D-1-5: Friedman test for the four different contracts (procurement)
Ranks Test Statisticsa
Mean Rank N 223
Using Traditional Lump Sum 3.12 Chi-Square 123.189
Using Design-Build 2.23 df 3
Using Unit Price 2.34 Asymp. Sig. .000
Using Construction Management 2.31 a. Friedman Test

194
D-2: Current Practice of Client Involvement [Part2 in Questionnaire]
D-2-1: Overall Client Involvement in Projects
Table D-2-1: Descriptive statistics of current practice for client involvement in construction projects phases
Code N Mean
Std. Deviation
Std. Error of Mean Median
A-Planning Phase
A1 Part2_A_1 223 2.21 1.319 0.088 2.00 A2 Part2_A_2 223 2.50 1.448 0.097 2.00 A3 Part2_A_3 223 2.58 1.331 0.089 3.00 A4 Part2_A_4 223 1.86 1.232 0.082 1.00 A5 Part2_A_5 223 2.11 1.381 0.092 1.00 A6 Part2_A_6 223 1.54 1.100 0.074 1.00 A7 Part2_A_7 223 2.68 1.320 0.088 2.00 A8 Part2_A_8 223 1.94 1.353 0.091 1.00 A9 Part2_A_9 223 2.04 1.423 0.095 1.00
A10 Part2_A_10 223 1.72 1.357 0.091 1.00 A11 Part2_A_11 223 1.61 1.323 0.089 1.00
B- Design Phase
B1 Part2_B_1 223 2.57 1.415 0.095 3.00 B2 Part2_B_2 223 2.74 1.723 0.115 2.00 B3 Part2_B_3 223 2.07 1.409 0.094 1.00 B4 Part2_B_4 223 2.04 1.602 0.107 1.00 B5 Part2_B_5 223 2.70 1.506 0.101 2.00 B6 Part2_B_6 223 2.97 1.552 0.104 3.00 B7 Part2_B_7 223 2.47 1.596 0.107 2.00 B8 Part2_B_8 223 3.19 1.403 0.094 3.00 B9 Part2_B_9 223 2.93 1.517 0.102 3.00
B10 Part2_B_10 223 2.54 1.296 0.087 3.00 B11 Part2_B_11 223 2.80 1.463 0.098 3.00
C- Construction Phase
C1 Part2_C_1 223 2.49 1.775 0.119 1.00 C2 Part2_C_2 223 2.60 1.689 0.113 2.00 C3 Part2_C_3 223 1.67 1.535 0.103 1.00 C4 Part2_C_4 223 2.50 1.448 0.097 2.00 C5 Part2_C_5 223 2.85 1.298 0.087 3.00 C6 Part2_C_6 223 3.26 1.438 0.096 3.00 C7 Part2_C_7 223 3.60 1.429 0.096 4.00 C8 Part2_C_8 223 3.53 1.442 0.097 4.00 C9 Part2_C_9 223 2.96 1.437 0.096 3.00
C10 Part2_C_10 223 2.99 1.511 0.101 3.00 C11 Part2_C_11 223 3.31 1.273 0.085 3.00
D- Handover Phase
D1 Part2_D_1 223 3.09 1.498 0.100 3.00 D2 Part2_D_2 223 3.36 1.485 0.099 4.00 D3 Part2_D_3 223 3.11 1.540 0.103 3.00
E- Operation and Maintenance
E1 Part2_E_1 223 1.93 1.115 0.075 2.00 E2 Part2_E_2 223 2.09 1.263 0.085 2.00 E3 Part2_E_3 223 2.24 1.140 0.076 2.00 E4 Part2_E_4 223 1.98 1.193 0.080 2.00

195
Table D-2-2: Overall Client involvement level in project phases Std. Level of Clients’ involvement
Code Mean Deviation Very High High Neutral low Very Low
A-Planning Phase
A1 Part2_A_1 2.21 1.319 A2 Part2_A_2 2.50 1.448 A3 Part2_A_3 2.58 1.331 A4 Part2_A_4 1.86 1.232 A5 Part2_A_5 2.11 1.381 A6 Part2_A_6 1.54 1.100 A7 Part2_A_7 2.68 1.320 A8 Part2_A_8 1.94 1.353 A9 Part2_A_9 2.04 1.423
A10 Part2_A_10 1.72 1.357 A11 Part2_A_11 1.61 1.323
B- Design Phase
B1 Part2_B_1 2.57 1.415 B2 Part2_B_2 2.74 1.723 B3 Part2_B_3 2.07 1.409 B4 Part2_B_4 2.04 1.602 B5 Part2_B_5 2.70 1.506 B6 Part2_B_6 2.97 1.552 B7 Part2_B_7 2.47 1.596 B8 Part2_B_8 3.19 1.403 B9 Part2_B_9 2.93 1.517
B10 Part2_B_10 2.54 1.296 B11 Part2_B_11 2.80 1.463
C- Construction Phase
C1 Part2_C_1 2.49 1.775 C2 Part2_C_2 2.60 1.689 C3 Part2_C_3 1.67 1.535 C4 Part2_C_4 2.50 1.448 C5 Part2_C_5 2.85 1.298 C6 Part2_C_6 3.26 1.438 C7 Part2_C_7 3.60 1.429 C8 Part2_C_8 3.53 1.442 C9 Part2_C_9 2.96 1.437
C10 Part2_C_10 2.99 1.511 C11 Part2_C_11 3.31 1.273
D- Handover Phase
D1 Part2_D_1 3.09 1.498 D2 Part2_D_2 3.36 1.485 D3 Part2_D_3 3.11 1.540
E- Operation and Maintenance Phase
E1 Part2_E_1 1.93 1.115 E2 Part2_E_2 2.09 1.263 E3 Part2_E_3 2.24 1.140 E4 Part2_E_4 1.98 1.193

196
Figure D-2-1: The overall Client involvement in construction project.

197
D-2-2: Client Involvement Based on Project Ownership
Table D-2-3: Client involvement in Semi-Public and Public construction phases
Code
Public Semi-Public
N Mean
N Mean
A-Planning Phase
A1 Part2_A_1 95 2.40 128 2.06 A2 Part2_A_2 95 2.88 128 2.21 A3 Part2_A_3 95 2.84 128 2.69 A4 Part2_A_4 95 2.33 128 1.52 A5 Part2_A_5 95 2.48 128 1.83 A6 Part2_A_6 95 1.95 128 1.43 A7 Part2_A_7 95 2.62 128 2.72 A8 Part2_A_8 95 1.89 128 1.98 A9 Part2_A_9 95 2.18 128 1.95
A10 Part2_A_10 95 2.20 128 1.86 A11 Part2_A_11 95 1.82 128 1.87
B- Design Phase
B1 Part2_B_1 95 2.46 128 2.66 B2 Part2_B_2 95 2.38 128 3.01 B3 Part2_B_3 95 1.92 128 2.19 B4 Part2_B_4 95 1.56 128 2.39 B5 Part2_B_5 95 2.40 128 2.91 B6 Part2_B_6 95 2.41 128 3.38 B7 Part2_B_7 95 2.07 128 2.77 B8 Part2_B_8 95 2.69 128 3.56 B9 Part2_B_9 95 2.55 128 3.21
B10 Part2_B_10 95 2.38 128 2.89 B11 Part2_B_11 95 2.32 128 3.16
C- Construction Phase
C1 Part2_C_1 95 1.87 128 2.95 C2 Part2_C_2 95 2.41 128 2.73 C3 Part2_C_3 95 1.64 128 2.12 C4 Part2_C_4 95 2.54 128 2.48 C5 Part2_C_5 95 3.06 128 2.70 C6 Part2_C_6 95 3.19 128 3.31 C7 Part2_C_7 95 3.41 128 3.74 C8 Part2_C_8 95 3.35 128 3.66 C9 Part2_C_9 95 2.92 128 2.99
C10 Part2_C_10 95 3.02 128 2.96 C11 Part2_C_11 95 3.51 128 3.16
D- Handover Phase
D1 Part2_D_1 95 2.68 128 3.39 D2 Part2_D_2 95 2.97 128 3.65 D3 Part2_D_3 95 3.00 128 3.20
E- Operation and Maintenance
E1 Part2_E_1 95 2.34 128 1.63 E2 Part2_E_2 95 2.37 128 1.88 E3 Part2_E_3 95 1.99 128 2.42 E4 Part2_E_4 95 2.08 128 1.91

198
Figure D-2-2: The current practice of Client involvement in Semi-Public and Public
construction phases.
Figure D-2-3: The comparison between Semi-Public and Public of client involvement in construction phases.

199
D-2-3: Client Involvement Based on Project Type
Table D-2-4: Client involvement in different project type
Code
Building Projects
Infrastructure Projects
Industrial Projects
Other Projects
N Mean N Mean N Mean N Mean
A-Planning Phase
A1 Part2_A_1 120 1.82 30 3.07 41 2.88 31 2.00
A2 Part2_A_2 120 1.98 30 3.40 41 3.54 31 2.25
A3 Part2_A_3 120 2.32 30 3.47 41 2.51 31 2.81
A4 Part2_A_4 120 1.38 30 2.00 41 2.83 31 2.28
A5 Part2_A_5 120 1.59 30 2.83 41 3.24 31 1.91
A6 Part2_A_6 120 1.32 30 1.47 41 2.27 31 1.50
A7 Part2_A_7 120 2.35 30 4.10 41 2.73 31 2.50
A8 Part2_A_8 120 1.45 30 3.77 41 1.80 31 2.25
A9 Part2_A_9 120 1.42 30 4.07 41 2.10 31 2.44
A10 Part2_A_10 120 1.36 30 2.37 41 1.80 31 2.38
A11 Part2_A_11 120 1.35 30 2.30 41 1.71 31 1.78
B- Design Phase
B1 Part2_B_1 120 2.38 30 3.93 41 2.17 31 2.56
B2 Part2_B_2 120 2.96 30 3.07 41 2.32 31 2.16
B3 Part2_B_3 120 2.02 30 2.67 41 1.73 31 2.16
B4 Part2_B_4 120 2.17 30 2.57 41 1.44 31 1.81
B5 Part2_B_5 120 2.50 30 4.57 41 2.20 31 2.31
B6 Part2_B_6 120 2.97 30 4.37 41 2.17 31 2.69
B7 Part2_B_7 120 2.33 30 4.20 41 1.95 31 2.03
B8 Part2_B_8 120 3.35 30 4.30 41 2.73 31 2.16
B9 Part2_B_9 120 2.82 30 4.23 41 2.63 31 2.50
B10 Part2_B_10 120 2.34 30 3.53 41 2.85 31 1.94
B11 Part2_B_11 120 2.72 30 4.30 41 2.29 31 2.38
C- Construction Phase C1 Part2_C_1 120 2.74 30 3.30 41 1.66 31 1.87
C2 Part2_C_2 120 2.76 30 3.27 41 1.78 31 2.41
C3 Part2_C_3 120 1.61 30 2.23 41 1.44 31 1.69
C4 Part2_C_4 120 2.41 30 3.13 41 2.73 31 1.97
C5 Part2_C_5 120 2.54 30 3.90 41 3.27 31 2.50
C6 Part2_C_6 120 3.53 30 3.13 41 3.07 31 2.59
C7 Part2_C_7 120 3.59 30 4.63 41 3.78 31 2.44
C8 Part2_C_8 120 3.58 30 4.70 41 3.32 31 2.53
C9 Part2_C_9 120 3.08 30 2.93 41 3.22 31 2.22
C10 Part2_C_10 120 2.90 30 3.53 41 3.12 31 2.63
C11 Part2_C_11 120 3.30 30 3.23 41 3.85 31 2.72
D- Handover Phase D1 Part2_D_1 120 3.13 30 3.90 41 2.49 31 2.97 D2 Part2_D_2 120 3.55 30 4.00 41 2.59 31 3.03 D3 Part2_D_3 120 3.24 30 3.70 41 2.61 31 2.72
E- Operation and Maintenance E1 Part2_E_1 120 1.68 30 1.93 41 2.10 31 2.69 E2 Part2_E_2 120 2.02 30 2.00 41 2.02 31 2.53 E3 Part2_E_3 120 2.58 30 1.83 41 1.71 31 2.03 E4 Part2_E_4 120 1.92 30 1.90 41 1.90 31 2.41

200
Figure D-2-4: Client Involvement in different project type.
Table D-2-5: Construction phases in order of importance
Construction Phases Public (N=95)
Semi-Public (N=128)
Overall (N=223)
Mean Rank Mean Rank Mean Rank
Planning 1.58 1 2.33 2 2.01 2
Design 2.27 2 1.61 1 1.89 1
Construction 2.65 3 2.92 3 2.81 3
Handover 3.71 4 4.01 4 3.88 4
Operation and Maintenance
4.79 5 4.13 5 4.41 5
1
2
3
4
5
A1A2
A3A4
A5
A6
A7
A8
A9
A10
A11
B1
B2
B3
B4
B5
B6
B7B8
B9B10
B11C1
C2
C3
C4
C5
C6
C7
C8
C9
C10
C11
D1
D2
D3
E1
E2E3
E4
Infrastructure IndustrialOther BuildingOverall
1 2 3 4 5 Not Involvment
Strongly Involvment

201
D-2-4: Overall Current Practice Ranking of Client Involvement
This section is presented the current practice ranking of clients from the low to high
involvement in each phase of project construction activities in overall data.
Table D-2-6: The current practice ranking of client from the low to high involvement in Planning Phase Code Planning Phase Activities (Tasks) Rank N Mean
Part2_A_6 Approval of the project cost 1 223 1.54
Part2_A_11 Feasibility study of the proposed project 2 223 1.61
Part2_A_10 Description of the responsibilities and powers of each member participating in the project
3 223 1.72
Part2_A_4 Studying how to secure funds to finance the project 4 223 1.86
Part2_A_8 Studying the impact of the project on the safety and health 5 223 1.94
Part2_A_9 Establishment of a criterion for the selection of project location 6 223 2.04
Part2_A_5 Estimation of the project cost and the time required for its completion 7 223 2.11
Part2_A_1 Assignment of task force (consultant. engineering. etc.) to conduct preliminary studies for the proposed project
8 223 2.21
Part2_A_2 Studying the requirements of the beneficiary of the project 9 223 2.50
Part2_A_3 Defining, in writing, the technical specifications and conditions that determine the quality of the required work
10 223 2.58
Part2_A_7 Studying and determining the technical specifications of the materials to be used for the project
11 223 2.68
Table D-2-7: The current practice ranking of client from the low to high involvement in Design Phase Code Design Phase Activities (Tasks) Rank N Mean
Part2_B_4 Negotiating of design price with the qualified designers 1 223 2.04
Part2_B_3 Selection of design team 2 223 2.07
Part2_B_7 Evaluation of design and taking the necessary decisions including the approval of basic design stages
3 223 2.47
Part2_B_10 Update drawings and specifications to reflect the requirements of location or environment
4 223 2.54
Part2_B_1 Arranging the papers and documents of the construction contract 5 223 2.57
Part2_B_5 Provide the designers with the necessary information needed for project 6 223 2.70
Part2_B_2 Qualification of designers bidding on the project 7 223 2.74
Part2_B_11 Use of some technical standards for the descriptions of materials quality or construction methods to be followed during projects
8 223 2.80
Part2_B_9 Monitor and guarantee design quality 9 223 2.93
Part2_B_6 Following the progress of design 10 223 2.97
Part2_B_8 Review of design documents (e.g. drawings and technical specifications) 11 223 3.19

202
Table D-2-8: The current practice ranking of client from the low to high involvement in Construction Phase Code Construction Phase Activities (Tasks) Rank N Mean
Part2_C_3 Negotiating contract price with the contractors qualified to do the job 1 223 1.67
Part2_C_1 Qualification of contractors competing to implement the project 2 223 2.49
Part2_C_4 Interpretation and clarification of ambiguities in the contract documents and drawings
3 223 2.50
Part2_C_2 Explaining the objective of the project and providing the necessary information for bidding
4 223 2.60
Part2_C_5 Review, from time to time, the documents that submitted by the contractor (e.g. work schedules. manpower qualifications. equipment. etc.)
5 223 2.85
Part2_C_9 Establishment of a system and written code to ensure implementation quality, to be referred to by personnel in charge of implementation quality assurance and control.
6 223 2.96
Part2_C_10 Emphasis on implementation quality by conducting necessary tests for the various implementation stages
7 223 2.99
Part2_C_6 Taking necessary decisions against contractor claims during project implementation
8 223 3.26
Part2_C_11 Regularly visit project site during implementation stage 9 223 3.31
Part2_C_8 Stress implementation quality and monitoring safety principles during project implementation
10 223 3.53
Part2_C_7 Monitoring and control of implementation methods and cost, as well as work schedule and contractor productivity
11 223 3.60
Table D-2-9: The current practice ranking of client from the low to high involvement in Hand-Over Phase Code Handover Phase Activities (Tasks) Rank N Mean
Part2_D_1 Establishment of criteria for acceptance of completed project 1 223 3.09
Part2_D_3 Monitoring the process of testing and commissioning of all systems, plant and equipment in the project
2 223 3.11
Part2_D_2 Review of contract documents (engineering drawings, technical specifications, manuals for project maintenance and operation, warranty documents) after completion of the project
3 223 3.36
Table D-2-10: The current practice ranking of client from the low to high involvement in Operation and Maintenance Phase Code Operation and Maintenance Phase Activities (Tasks) Rank N Mean
Part2_E_1 Prepare the maintenance plan describing the maintenance schedules and lists the tasks
1 223 1.93
Part2_E_4 Building up the inventory including the important spare parts to maintain and operate the project with minimum “down time”
2 223 1.98
Part2_E_2 Prepare the operation information such as; How to operate the systems, Important safety instructions, and Troubleshooting data; to assist in solving problems and prevent unexpected expensive
3 223 2.09
Part2_E_3 Record the warranties and certificates reference information 4 223 2.24

203
D-3: Factors Affecting Client Involvement [Part3 in Questionnaire]
D-3-1: Individual Factors
Table D-3-1: Descriptive statistics of individual factors
Code N Mean Median Mode Std.
Deviation
Part3_A_1 223 4.11 5.00 5 .842 Part3_A_2 223 4.55 5.00 5 .792 Part3_A_3 223 3.99 5.00 5 1.076 Part3_A_4 223 4.57 5.00 5 .624 Part3_A_5 223 4.40 5.00 5 .740 Part3_A_6 223 4.55 5.00 5 .757 Part3_A_7 223 4.37 5.00 5 .771 Part3_A_8 223 3.24 3.00 3 1.155 Part3_A_9 223 3.90 3.00 3 .829
Part3_A_10 223 3.92 4.00 4 .953 Part3_A_11 223 3.84 5.00 5 1.138 Part3_A_12 223 4.24 5.00 5 .749 Part3_A_13 223 4.20 5.00 5 .786 Part3_A_14 223 4.48 5.00 5 .740 Part3_A_15 223 3.62 5.00 5 1.480 Part3_A_16 223 2.80 3.00 3 1.266 Part3_A_17 223 4.03 5.00 5 .956 Part3_A_18 223 4.46 5.00 5 .702 Part3_A_19 223 4.55 5.00 5 .634
D-3-2: Project Factors
Table D-3-2: Descriptive statistics and rank of project factors
Code N Mean Median Mode Std.
Deviation
Part3_B_1 223 3.66 4.00 4 .906
Part3_B_2 223 4.35 4.00 5 .724
Part3_B_3 223 3.64 4.00 4 1.344
Part3_B_4 223 3.71 4.00 4 1.094
Part3_B_5 223 4.44 5.00 5 .744

204
D-3-3: Organisational Culture Factors
Table D-3-3: Descriptive statistics of organisational culture factors
Code N Mean Median Mode Std.
Deviation
Part3_C_1 223 2.98 3.00 3 1.250
Part3_C_2 223 2.89 3.00 3 1.093
Part3_C_3 223 3.11 3.00 3 1.188
Part3_C_4 223 2.65 3.00 1 1.543
Part3_C_5 223 2.56 2.00 1 1.615
Part3_C_6 223 2.48 2.00 1 1.559
Part3_C_7 223 2.78 2.00 2 1.360
Part3_C_8 223 2.79 3.00 2 1.447
Part3_C_9 223 2.71 2.00 1 1.480
Part3_C_10 223 2.89 3.00 1 1.498
Part3_C_11 223 2.60 2.00 1 1.593
Part3_C_12 223 2.83 3.00 1 1.570
Part3_C_13 223 2.67 2.00 1 1.463
Part3_C_14 223 2.42 2.00 1 1.474
Part3_C_15 223 2.22 2.00 1 1.328
Part3_C_16 223 2.29 2.00 2 .962
Part3_C_17 223 2.47 2.00 1 1.338
Part3_C_18 223 2.46 2.00 1 1.413
Part3_C_19 223 2.39 2.00 1 1.426
Part3_C_20 223 2.75 2.00 2 1.500
Part3_C_21 223 2.74 3.00 3 1.264
Part3_C_22 223 2.56 2.00 1a 1.354
Part3_C_23 223 2.61 2.00 1 1.561

205
D-4 Project Delivery Expectation
D-4-1: Impact of Project Delivery Based on Overall Sample
Table D-4-1: Impact on project delivery based on overall sample (N=233)
Project Delivery Expectation
Code Goal N Mean Std.
Deviation
Part3_D_1 Time 223 1.87 .678
Part3_D_2 Cost 223 2.84 .793
Part3_D_3 Quality 223 3.09 1.083
Part3_D_4 Operation 223 3.14 1.203
D-4-2: Impact of Project Delivery Based on Ownership
Table D-4-2: Impact on project delivery based on ownership
Project Delivery Expectation
Organisation
Type Code Goal N Mean
Std.
Deviation
Public
Part3_D_1 Time 95 2.24 .795
Part3_D_2 Cost 95 2.42 .974
Part3_D_3 Quality 95 2.41 .881
Part3_D_4 Operation 95 3.22 .840
Semi-Public
Part3_D_1 Time 128 2.04 .788
Part3_D_2 Cost 128 2.10 .840
Part3_D_3 Quality 128 2.23 .786
Part3_D_4 Operation 128 2.89 1.052

206
D-4-3: Impact of Project Delivery Based on Project Type
Table D-4-2: Impact on project delivery based on project type
Project Delivery Expectation
Project Type Code Goal N Mean Std.
Deviation
Building
Part3_D_1 Time 120 2.01 .750
Part3_D_2 Cost 120 2.12 .862
Part3_D_3 Quality 120 2.23 .750
Part3_D_4 Operation 120 2.80 .984
Infrastructure
Part3_D_1 Time 30 2.37 .890
Part3_D_2 Cost 30 2.47 .973
Part3_D_3 Quality 30 2.50 .974
Part3_D_4 Operation 30 3.60 .968
Industrial
Part3_D_1 Time 41 2.34 .656
Part3_D_2 Cost 41 2.51 .870
Part3_D_3 Quality 41 2.56 .776
Part3_D_4 Operation 41 2.88 .927
Other
Part3_D_1 Time 32 2.06 .948
Part3_D_2 Cost 32 2.13 1.008
Part3_D_3 Quality 32 2.09 .963
Part3_D_4 Operation 32 3.56 .564

207
Appendix E Mann-Whitney and Kruskal-Wallis ANOVA Results
E-1: Mann-Whitney ANOVA Results
Table E-1-1: Mann-Whitney ANOVA result for client involvement [Planning Phase] and ownership [Part1_D_1]
Code Mann-
Whitney U
Wilcoxon W
Z Asympto
tic Sig. (2-tailed)
Organisation Type
(Part1_D_1) N
Mean Rank
Sum of Ranks
Part2_A_1 5167.500 13423.500 -2.054 .040 Public 95 121.61 11552.50
Semi-Public 128 104.87 13423.50
Part2_A_2 4516.000 12772.000 -3.422 .001 Public 95 128.46 12204.00
Semi-Public 128 99.78 12772.00
Part2_A_3 5685.500 13941.000 -.858 .391 Public 95 116.16 11035.00
Semi-Public 128 108.91 13941.00
Part2_A_4 3589.000 11845.500 -5.900 .000 Public 95 138.22 13130.50
Semi-Public 128 92.54 11845.50
Part2_A_5 4432.500 12688.500 -3.782 .000 Public 95 129.34 12287.50
Semi-Public 128 99.13 12688.50
Part2_A_6 4606.500 12862.500 -3.812 .000 Public 95 127.51 12113.50
Semi-Public 128 100.49 12862.50
Part2_A_7 6324.000 14580.000 .533 .594 Public 95 109.43 10396.00
Semi-Public 128 113.91 14580.00
Part2_A_8 5.652500 13908.500 -1.006 .315 Public 95 116.50 11067.50
Semi-Public 128 108.66 13908.50
Part2_A_9 5046.000 13302.000 -2.390 .017 Public 95 122.88 11674.00
Semi-Public 128 103.92 13302.00
Part2_A_10 4870.500 13126.500 -2.784 .005 Public 95 124.73 11849.50
Semi-Public 128 102.55 13126.50
Part2_A_11 6155.000 14411.000 .182 .856 Public 95 111.21 10565.00
Semi-Public 128 112.59 14411.00

208
Table E-1-2: Mann-Whitney ANOVA result for client involvement [Design Phase] and ownership [Part1_D_1]
Code Mann-
Whitney U
Wilcoxon W
Z Asympto
tic Sig. (2-tailed)
Organisation Type
(Part1_D_1) N
Mean Rank
Sum of Ranks
Part2_B_1 6669.500 14925.500 1.280 .201 Public 95 105.79 10050.50
Semi-Public 128 116.61 14925.50
Part2_B_2 7216.500 15472.500 2.514 .012 Public 95 100.04 9503.50
Semi-Public 128 120.88 15472.50
Part2_B_3 6354.500 14610.500 .634 .526 Public 95 109.11 10365.50
Semi-Public 128 114.14 14610.50
Part2_B_4 7425.500 15681.500 3.399 .001 Public 95 97.84 9294.50
Semi-Public 128 122.51 15681.50
Part2_B_5 7323.500 15579.500 2.682 .007 Public 95 98.91 9396.50
Semi-Public 128 121.71 15579.50
Part2_B_6 8170.500 16426.500 4.497 .000 Public 95 89.99 8549.50
Semi-Public 128 128.33 16426.50
Part2_B_7 7670.000 15926.000 3.507 .000 Public 95 95.26 9050.00
Semi-Public 128 124.42 15926.00
Part2_B_8 8171.500 16427.500 4.489 .000 Public 95 89.98 8548.50
Semi-Public 128 128.34 16427.50
Part2_B_9 7457.500 15713.500 2.960 .003 Public 95 97.50 9262.50
Semi-Public 128 122.76 15713.50
Part2_B_10 6880.000 15136.000 1.740 .082 Public 95 103.58 9840.00
Semi-Public 128 118.25 15136.00
Part2_B_11 8078.500 16334.500 4.300 .000 Public 95 90.96 8641.50
Semi-Public 128 127.61 16334.50

209
Table E-1-3: Mann-Whitney ANOVA result for client involvement [Construction Phase] and ownership [Part1_D_1]
Code Mann-
Whitney U
Wilcoxon W
Z Asympto
tic Sig. (2-tailed)
Organisation Type
(Part1_D_1) N
Mean Rank
Sum of Ranks
Part2_C_1 8030.000 16286.000 4.517 .000 Public 95 91.47 8690.00
Semi-Public 128 127.23 16286.00
Part2_C_2 6610.500 14866.500 1.177 .239 Public 95 106.42 10109.50
Semi-Public 128 116.14 14866.50
Part2_C_3 6718.000 14974.000 1.499 .134 Public 95 105.28 10002.00
Semi-Public 128 116.98 14974.00
Part2_C_4 5996.000 14252.000 -.182 .855 Public 95 112.88 10724.00
Semi-Public 128 111.34 14252.00
Part2_C_5 5082.000 13338.000 -2.156 .031 Public 95 122.51 11638.00
Semi-Public 128 104.20 13338.00
Part2_C_6 6567.000 14823.000 1.046 .295 Public 95 106.87 10153.00
Semi-Public 128 115.80 14823.00
Part2_C_7 7139.500 15395.500 2.309 .021 Public 95 100.85 9580.50
Semi-Public 128 120.28 15395.50
Part2_C_8 7072.500 15328.500 2.154 .031 Public 95 101.55 9647.50
Semi-Public 128 119.75 15328.50
Part2_C_9 6224.000 14480.000 .312 .755 Public 95 110.48 10496.00
Semi-Public 128 113.13 14480.00
Part2_C_10 5989.000 14245.000 -.195 .845 Public 95 112.96 10731.00
Semi-Public 128 111.29 14245.00
Part2_C_11 4965.000 13221.500 -2.408 .016 Public 95 123.73 11754.50
Semi-Public 128 103.29 13221.50
Table E-1-4: Mann-Whitney ANOVA result for client involvement [Handover Phase] and ownership [Part1_D_1]
Code Mann-
Whitney U
Wilcoxon W
Z Asympto
tic Sig. (2-tailed)
Organisation Type
(Part1_D_1) N
Mean Rank
Sum of Ranks
Part2_D_1 7661.000 15917.000 3.427 .001 Public 95 95.36 9059.00
Semi-Public 128 124.35 15917.00
Part2_D_2 7367.500 15623.500 2.785 .005 Public 95 98.45 9352.50
Semi-Public 128 122.06 15623.50
Part2_D_3 6610.500 14866.500 1.150 .250 Public 95 106.42 10109.50
Semi-Public 128 116.14 14866.50

210
Table E-1-5: Mann-Whitney ANOVA result for client involvement [Operation and
Maintenance Phase] and ownership [Part1_D_1]
Code Mann-
Whitney U
Wilcoxon W
Z Asympto
tic Sig. (2-tailed)
Organisation Type
(Part1_D_1) N
Mean Rank
Sum of Ranks
Part2_E_1 4394.000 12650.000 -3.788 .000 Public 95 129.75 12326.00
Semi-Public 128 98.83 12650.00
Part2_E_2 4987.500 13243.500 -2.427 .015 Public 95 123.50 11732.50
Semi-Public 128 103.46 13243.50
Part2_E_3 7535.000 15791.000 3.196 .001 Public 95 96.68 9185.00
Semi-Public 128 123.37 15791.00
Part2_E_4 5746.500 14002.500 -.751 .453 Public 95 115.51 10973.50
Semi-Public 128 109.39 14002.50

211
E-2: Kruskal-Wallis ANOVA Results
Table E-2-1: Kruskal-Wallis ANOVA result for client involvement [Planning Phase] and project type [Part1_D_7]
Code Chi-
Square df
Asymp. Sig.
What typical project you do N Mean Rank
Part2_A_1 31.608 3 .000
Building 120 95.85
Infrastructure 30 144.22
Industrial 41 145.73
Other 32 99.16
Part2_A_2 48.463 3 .000
Building 120 90.02
Infrastructure 30 148.43
Industrial 41 157.44
Other 32 102.05
Part2_A_3 31.325 3 .000
Building 120 96.53
Infrastructure 30 165.27
Industrial 41 106.88
Other 32 126.64
Part2_A_4 59.784 3 .000
Building 120 87.87
Infrastructure 30 108.57
Industrial 41 157.70
Other 32 147.16
Part2_A_5 56.583 3 .000
Building 120 90.84
Infrastructure 30 136.13
Industrial 41 166.22
Other 32 99.25
Part2_A_6 34.853 3 .000
Building 120 100.01
Infrastructure 30 105.62
Industrial 41 155.17
Other 32 107.63
Part2_A_7 31.108 3 .000
Building 120 98.55
Infrastructure 30 168.13
Industrial 41 116.78
Other 32 103.69
Part2_A_8 73.543 3 .000
Building 120 87.83
Infrastructure 30 177.48
Industrial 41 106.04
Other 32 148.88
Part2_A_9 83.251 3 .000
Building 120 83.70
Infrastructure 30 182.30
Industrial 41 115.46
Other 32 147.77
Part2_A_10 59.887 3 .000
Building 120 86.97
Infrastructure 30 153.32
Industrial 41 115.93
Other 32 162.09
Part2_A_11 30.224 3 .000
Building 120 96.11
Infrastructure 30 155.55
Industrial 41 115.66
Other 32 126.08
Total 223
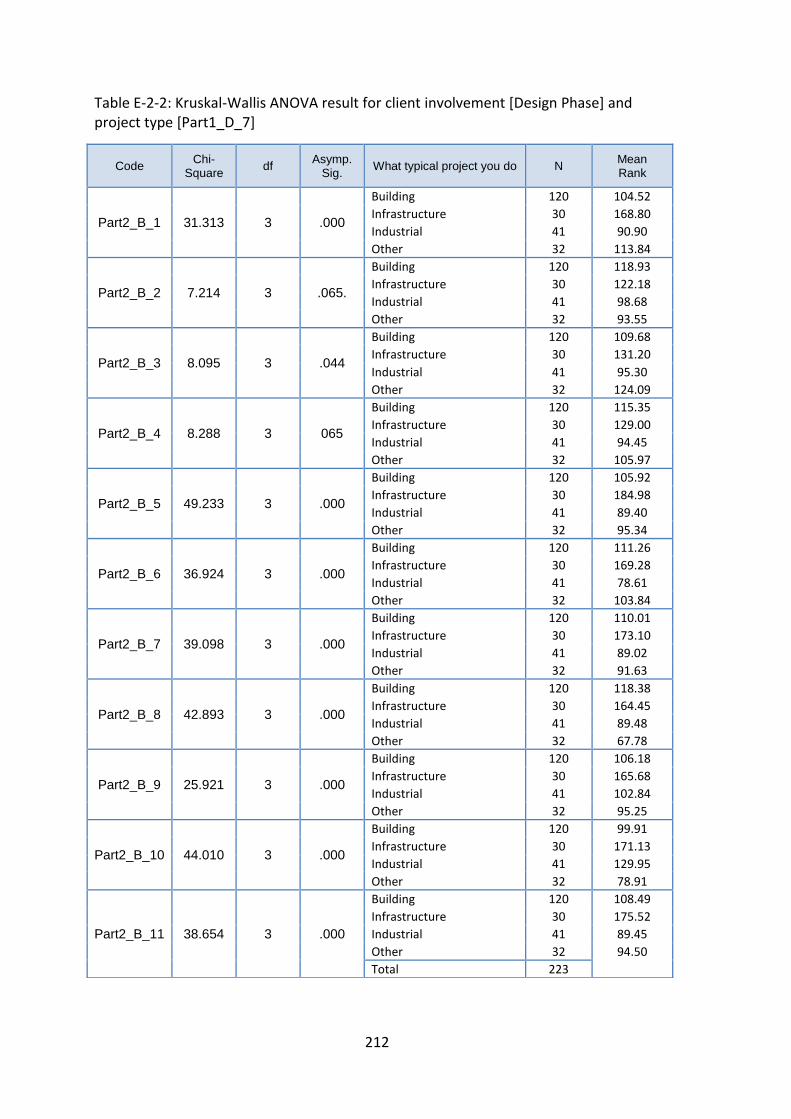
212
Table E-2-2: Kruskal-Wallis ANOVA result for client involvement [Design Phase] and project type [Part1_D_7]
Code Chi-
Square df
Asymp. Sig.
What typical project you do N Mean Rank
Part2_B_1 31.313 3 .000
Building 120 104.52
Infrastructure 30 168.80
Industrial 41 90.90
Other 32 113.84
Part2_B_2 7.214 3 .065.
Building 120 118.93
Infrastructure 30 122.18
Industrial 41 98.68
Other 32 93.55
Part2_B_3 8.095 3 .044
Building 120 109.68
Infrastructure 30 131.20
Industrial 41 95.30
Other 32 124.09
Part2_B_4 8.288 3 065
Building 120 115.35
Infrastructure 30 129.00
Industrial 41 94.45
Other 32 105.97
Part2_B_5 49.233 3 .000
Building 120 105.92
Infrastructure 30 184.98
Industrial 41 89.40
Other 32 95.34
Part2_B_6 36.924 3 .000
Building 120 111.26
Infrastructure 30 169.28
Industrial 41 78.61
Other 32 103.84
Part2_B_7 39.098 3 .000
Building 120 110.01
Infrastructure 30 173.10
Industrial 41 89.02
Other 32 91.63
Part2_B_8 42.893 3 .000
Building 120 118.38
Infrastructure 30 164.45
Industrial 41 89.48
Other 32 67.78
Part2_B_9 25.921 3 .000
Building 120 106.18
Infrastructure 30 165.68
Industrial 41 102.84
Other 32 95.25
Part2_B_10 44.010 3 .000
Building 120 99.91
Infrastructure 30 171.13
Industrial 41 129.95
Other 32 78.91
Part2_B_11 38.654 3 .000
Building 120 108.49
Infrastructure 30 175.52
Industrial 41 89.45
Other 32 94.50
Total 223

213
Table E-2-3: Kruskal-Wallis ANOVA results for client involvement [Construction Phase] and project type [Part1_D_7]
Code Chi-
Square df
Asymp. Sig.
What typical project you do N Mean Rank
Part2_C_1 20.570 3 .000
Building 120 120.35
Infrastructure 30 137.33
Industrial 41 86.60
Other 32 89.48
Part2_C_2 11.741 3 .008
Building 120 117.35
Infrastructure 30 131.98
Industrial 41 86.20
Other 32 106.28
Part2_C_3 18.402 3 .000
Building 120 107.00
Infrastructure 30 152.52
Industrial 41 97.26
Other 32 111.67
Part2_C_4 11.111 3 011
Building 120 108.38
Infrastructure 30 132.17
Industrial 41 127.29
Other 32 87.08
Part2_C_5 32.202 3 .000
Building 120 97.24
Infrastructure 30 157.55
Industrial 41 137.13
Other 32 92.44
Part2_C_6 11.506 3 .009
Building 120 123.61
Infrastructure 30 110.68
Industrial 41 100.28
Other 32 84.70
Part2_C_7 35.860 3 .000
Building 120 111.69
Infrastructure 30 161.92
Industrial 41 111.21
Other 32 67.39
Part2_C_8 37.870 3 .000
Building 120 114.01
Infrastructure 30 166.55
Industrial 41 96.28
Other 32 73.45
Part2_C_9 11.269 3 .010
Building 120 116.83
Infrastructure 30 109.38
Industrial 41 125.17
Other 32 79.47
Part2_C_10 6.102 3 .107
Building 120 108.67
Infrastructure 30 132.80
Industrial 41 118.88
Other 32 96.19
Part2_C_11 13.982 3 .003
Building 120 109.64
Infrastructure 30 109.55
Industrial 41 140.54
Other 32 86.58
Total 223

214
Table E-2-4: Kruskal-Wallis ANOVA results for client involvement [Handover Phase] and project type [Part1_D_7]
Table E-2-5: Kruskal-Wallis ANOVA results for client involvement [Operation and Maintenance Phase] and project type [Part1_D_7]
Code Chi-
Square df
Asymp. Sig.
What typical project you do N Mean Rank
Part2_D_1 15.576 3 .001
Building 120 113.30
Infrastructure 30 145.72
Industrial 41 86.87
Other 32 107.73
Part2_D_2 17.956 3 .000
Building 120 117.87
Infrastructure 30 142.35
Industrial 41 84.30
Other 32 97.03
Part2__3 12.779 3 .005
Building 120 117.52
Infrastructure 30 136.38
Industrial 41 88.61
Other 32 98.41
Total 233
Code Chi-
Square df
Asymp. Sig.
What typical project you do N Mean Rank
Part2_E_1 22.726 3 .000
Building 120 103.28
Infrastructure 30 98.12
Industrial 41 111.80
Other 32 157.98
Part2_E_2 10.520 3 .015
Building 120 111.36
Infrastructure 30 96.67
Industrial 41 102.04
Other 32 141.55
Part2_E_3 35.204 3 .000
Building 120 133.57
Infrastructure 30 83.17
Industrial 41 76.89
Other 32 103.14
Part2_E_4 10.288 3 .016
Building 120 111.55
Infrastructure 30 98.73
Industrial 41 100.56
Other 32 140.80
Total 233
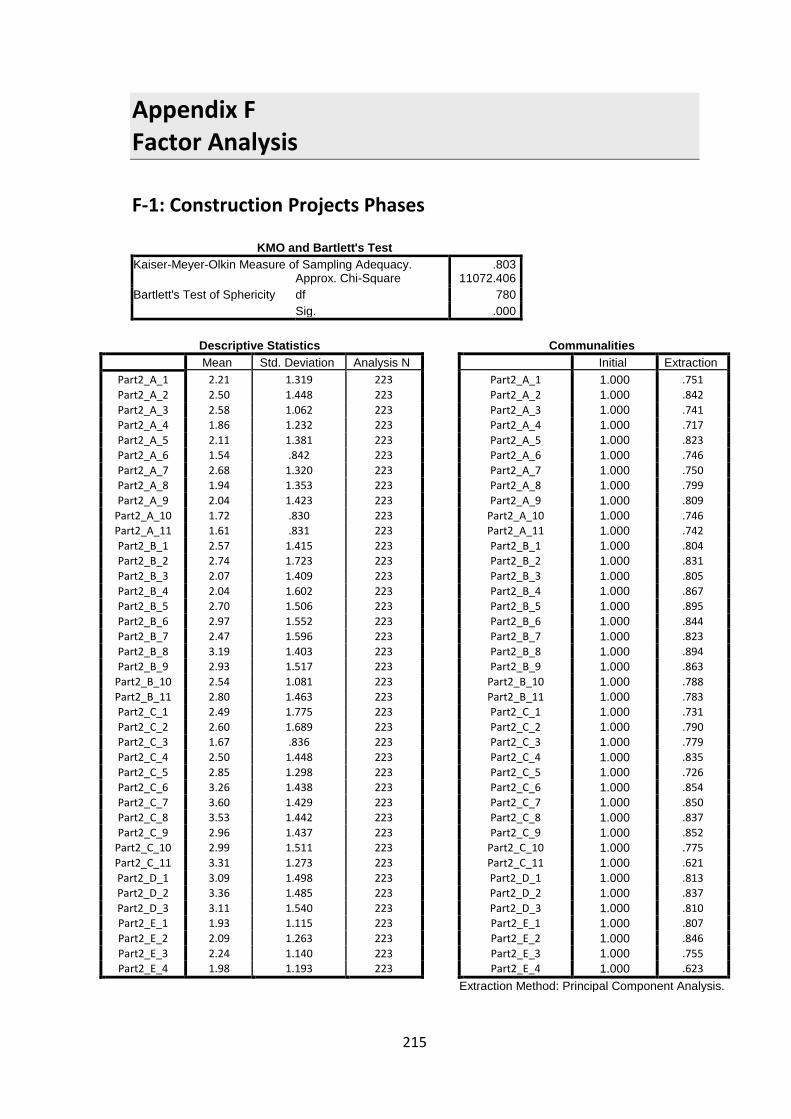
215
Appendix F Factor Analysis
F-1: Construction Projects Phases
KMO and Bartlett's Test
Kaiser-Meyer-Olkin Measure of Sampling Adequacy. .803
Bartlett's Test of Sphericity
Approx. Chi-Square 11072.406
df 780
Sig. .000
Descriptive Statistics Communalities
Mean Std. Deviation Analysis N Initial Extraction
Part2_A_1 2.21 1.319 223 Part2_A_1 1.000 .751
Part2_A_2 2.50 1.448 223 Part2_A_2 1.000 .842
Part2_A_3 2.58 1.062 223 Part2_A_3 1.000 .741
Part2_A_4 1.86 1.232 223 Part2_A_4 1.000 .717
Part2_A_5 2.11 1.381 223 Part2_A_5 1.000 .823
Part2_A_6 1.54 .842 223 Part2_A_6 1.000 .746
Part2_A_7 2.68 1.320 223 Part2_A_7 1.000 .750
Part2_A_8 1.94 1.353 223 Part2_A_8 1.000 .799
Part2_A_9 2.04 1.423 223 Part2_A_9 1.000 .809
Part2_A_10 1.72 .830 223 Part2_A_10 1.000 .746
Part2_A_11 1.61 .831 223 Part2_A_11 1.000 .742
Part2_B_1 2.57 1.415 223 Part2_B_1 1.000 .804
Part2_B_2 2.74 1.723 223 Part2_B_2 1.000 .831
Part2_B_3 2.07 1.409 223 Part2_B_3 1.000 .805
Part2_B_4 2.04 1.602 223 Part2_B_4 1.000 .867
Part2_B_5 2.70 1.506 223 Part2_B_5 1.000 .895
Part2_B_6 2.97 1.552 223 Part2_B_6 1.000 .844
Part2_B_7 2.47 1.596 223 Part2_B_7 1.000 .823
Part2_B_8 3.19 1.403 223 Part2_B_8 1.000 .894
Part2_B_9 2.93 1.517 223 Part2_B_9 1.000 .863
Part2_B_10 2.54 1.081 223 Part2_B_10 1.000 .788
Part2_B_11 2.80 1.463 223 Part2_B_11 1.000 .783
Part2_C_1 2.49 1.775 223 Part2_C_1 1.000 .731
Part2_C_2 2.60 1.689 223 Part2_C_2 1.000 .790
Part2_C_3 1.67 .836 223 Part2_C_3 1.000 .779
Part2_C_4 2.50 1.448 223 Part2_C_4 1.000 .835
Part2_C_5 2.85 1.298 223 Part2_C_5 1.000 .726
Part2_C_6 3.26 1.438 223 Part2_C_6 1.000 .854
Part2_C_7 3.60 1.429 223 Part2_C_7 1.000 .850
Part2_C_8 3.53 1.442 223 Part2_C_8 1.000 .837
Part2_C_9 2.96 1.437 223 Part2_C_9 1.000 .852
Part2_C_10 2.99 1.511 223 Part2_C_10 1.000 .775
Part2_C_11 3.31 1.273 223 Part2_C_11 1.000 .621
Part2_D_1 3.09 1.498 223 Part2_D_1 1.000 .813
Part2_D_2 3.36 1.485 223 Part2_D_2 1.000 .837
Part2_D_3 3.11 1.540 223 Part2_D_3 1.000 .810
Part2_E_1 1.93 1.115 223 Part2_E_1 1.000 .807
Part2_E_2 2.09 1.263 223 Part2_E_2 1.000 .846
Part2_E_3 2.24 1.140 223 Part2_E_3 1.000 .755
Part2_E_4 1.98 1.193 223 Part2_E_4 1.000 .623
Extraction Method: Principal Component Analysis.

216
Total Variance Explained
Component
Initial Eigenvalues Extraction Sums of Squared Loadings Rotation Sums of Squared Loadings
Total % of Variance
Cumulative %
Total % of Variance
Cumulative %
Total % of Variance
Cumulative %
1 13.051 32.627 32.627 13.051 32.627 32.627 5.753 14.381 14.381 2 5.821 14.553 47.180 5.821 14.553 47.180 5.303 13.256 27.638 3 4.053 10.133 57.313 4.053 10.133 57.313 5.156 12.890 40.527 4 2.904 7.259 64.571 2.904 7.259 64.571 4.909 12.272 52.800 5 2.584 6.459 71.031 2.584 6.459 71.031 4.295 10.737 63.537 6 2.224 5.559 76.590 2.224 5.559 76.590 3.376 8.439 71.976 7 1.168 2.919 79.509 1.168 2.919 79.509 3.013 7.533 79.509 8 .868 2.169 81.678 9 .819 2.047 83.725
10 .688 1.720 85.445 11 .598 1.494 86.939 12 .540 1.351 88.290 13 .442 1.106 89.395 14 .430 1.075 90.470 15 .390 .976 91.446 16 .370 .924 92.370 17 .325 .812 93.181 18 .298 .746 93.927 19 .283 .707 94.634 20 .250 .626 95.260 21 .236 .591 95.851 22 .194 .485 96.336 23 .181 .452 96.788 24 .144 .360 97.148 25 .136 .341 97.489 26 .135 .338 97.827 27 .121 .302 98.130 28 .094 .236 98.365 29 .091 .229 98.594 30 .088 .220 98.814 31 .084 .211 99.025 32 .076 .190 99.215 33 .066 .164 99.379 34 .056 .140 99.519 35 .047 .118 99.637 36 .041 .103 99.740 37 .032 .080 99.820 38 .025 .064 99.883 39 .024 .059 99.943 40 .023 .057 100.000
Extraction Method: Principal Component Analysis.

217
Component Matrixa
Component
1 2 3 4 5 6 7
Part2_B_1 .790 -.160 -.173 -.006 -.227 -.204 .174
Part2_B_5 .726 -.079 -.488 -.224 -.180 .171 -.109
Part2_C_3 .724 -.310 .061 -.104 -.301 .154 -.170
Part2_C_5 .721 .062 .340 -.115 .192 -.152 -.114
Part2_C_4 .689 .039 .470 -.129 -.184 -.076 -.286
Part2_B_2 .675 -.169 .175 -.178 -.480 -.143 .182
Part2_B_10 .670 .132 -.145 -.280 .178 -.309 .310
Part2_A_9 .664 -.286 -.327 .219 .254 -.107 -.235
Part2_B_3 .660 -.330 -.049 -.219 -.378 .259 -.010
Part2_C_1 .652 -.007 .190 -.075 -.466 -.211 -.049
Part2_C_2 .652 -.074 .384 -.056 -.423 -.111 -.135
Part2_B_7 .648 .242 -.467 -.226 -.023 .266 -.059
Part2_A_5 .634 -.506 .245 -.094 .265 .152 .052
Part2_B_11 .620 .334 -.468 .031 .043 -.112 .231
Part2_A_1 .613 -.391 .374 -.091 .199 -.096 .159
Part2_A_3 .612 -.419 -.142 .249 .117 -.270 .149
Part2_A_8 .606 -.255 -.383 .279 .240 -.108 -.271
Part2_A_11 .604 -.438 -.243 .210 .099 .022 -.267
Part2_A_7 .604 -.256 -.244 .209 .303 -.344 .077
Part2_B_4 .599 -.350 -.039 -.323 -.483 .210 .040
Part2_A_10 .596 -.330 -.207 .417 .177 .021 -.182
Part2_C_10 .575 .462 .382 -.169 .120 -.182 -.095
Part2_B_8 .568 .431 -.446 -.267 .109 .084 .310
Part2_B_9 .558 .289 -.550 -.170 .093 .329 .142
Part2_D_3 .546 .423 .184 .407 -.192 -.306 .048
Part2_C_8 .449 .681 .022 -.109 .362 -.010 -.169
Part2_C_6 .400 .651 .415 -.210 .113 .195 -.048
Part2_C_7 .445 .639 .104 -.183 .434 -.051 -.090
Part2_A_2 .527 -.610 .272 -.109 .300 -.019 .127
Part2_D_2 .462 .580 -.089 .404 -.105 -.296 .136
Part2_C_9 .435 .550 .381 -.224 .203 .277 -.215
Part2_D_1 .493 .535 -.045 .381 -.165 -.327 -.056
Part2_A_4 .444 -.518 .298 .088 .272 .265 .102
Part2_E_3 .206 .490 .191 .378 -.210 .400 .297
Part2_A_6 .342 -.418 .390 -.049 .373 .194 .351
Part2_B_6 .510 .270 -.598 -.160 -.041 .343 -.098
Part2_C_11 .493 .162 .519 -.218 .181 -.006 .032
Part2_E_1 .427 -.044 .190 .656 -.013 .394 -.034
Part2_E_4 .315 .287 .276 .535 -.235 .091 .124
Part2_E_2 .306 .122 .155 .571 .052 .618 .060
Extraction Method: Principal Component Analysis. a. 2 components extracted.

218
Rotated Component Matrixa
Component
1 2 3 4 5 6 7
Part2_B_4 .821 -.105 .334 .068 .219 -.130 .012
Part2_B_2 .805 .043 .145 .013 .261 .302 -.013
Part2_C_2 .786 .286 -.094 .121 .126 .198 .113
Part2_C_1 .753 .198 .050 .115 .043 .327 .020
Part2_B_3 .750 -.047 .347 .183 .238 -.135 .106
Part2_C_3 .741 .095 .192 .338 .214 -.082 .130
Part2_C_4 .661 .561 -.103 .184 .151 .094 .084
Part2_B_1 .564 -.012 .369 .342 .251 .411 -.027
Part2_C_9 .110 .857 .184 -.101 .039 -.090 .228
Part2_C_6 .112 .824 .184 -.259 .031 .081 .232
Part2_C_7 -.160 .821 .323 .048 .033 .204 -.019
Part2_C_8 -.140 .793 .357 .102 -.096 .196 .053
Part2_C_10 .239 .779 .073 .009 .108 .308 .001
Part2_C_11 .249 .621 -.022 -.062 .397 .096 .043
Part2_C_5 .344 .601 .044 .282 .356 .196 -.014
Part2_B_9 .058 .153 .892 .158 .011 .034 .117
Part2_B_8 .040 .260 .859 -.001 .069 .282 -.044
Part2_B_6 .157 .137 .826 .244 -.203 -.083 .110
Part2_B_7 .262 .241 .793 .243 -.066 -.014 .062
Part2_B_5 .501 .036 .694 .396 .003 -.040 -.029
Part2_B_11 .073 .146 .685 .239 .000 .479 .022
Part2_B_10 .189 .293 .487 .138 .356 .448 -.287
Part2_A_8 .097 .021 .253 .837 .104 .111 .032
Part2_A_9 .147 .057 .261 .817 .192 .107 .008
Part2_A_10 .144 -.038 .134 .767 .217 .097 .247
Part2_A_11 .290 -.060 .167 .759 .203 -.045 .085
Part2_A_7 .049 .002 .201 .645 .357 .387 -.117
Part2_A_3 .230 -.147 .115 .580 .435 .357 -.016
Part2_A_6 .056 .080 -.036 .053 .841 -.089 .128
Part2_A_2 .279 .055 -.055 .352 .788 -.076 -.087
Part2_A_5 .335 .152 .067 .374 .720 -.146 .061
Part2_A_1 .356 .210 -.058 .250 .708 .107 -.032
Part2_A_4 .189 .035 -.053 .306 .701 -.187 .239
Part2_D_2 .037 .288 .219 .135 -.214 .754 .271
Part2_D_3 .254 .350 -.008 .158 -.097 .699 .315
Part2_D_1 .152 .346 .128 .227 -.296 .678 .235
Part2_E_2 -.032 .102 .114 .141 .142 -.043 .883
Part2_E_1 .121 .057 -.039 .345 .165 .080 .797
Part2_E_3 .038 .168 .187 -.292 -.045 .266 .730
Part2_E_4 .170 .145 -.087 .001 -.030 .415 .627
Extraction Method: Principal Component Analysis. a. 2 components extracted.
Component Transformation Matrix
Component 1 2
1 .865 .502
2 -.502 .865

219
F-2: Inividual Factors
KMO and Bartlett's Test
Kaiser-Meyer-Olkin Measure of Sampling Adequacy. .687
Bartlett's Test of Sphericity
Approx. Chi-Square 2516.964
df 171
Sig. .000
Descriptive Statistics Communalities
Mean Std. Deviation Analysis N Initial Extraction
Part3_A_1 4.11 .842 223 Part3_A_1 1.000 .647
Part3_A_2 4.55 .792 223 Part3_A_2 1.000 .834
Part3_A_3 3.99 1.076 223 Part3_A_3 1.000 .732
Part3_A_4 4.57 .624 223 Part3_A_4 1.000 .714
Part3_A_5 4.40 .740 223 Part3_A_5 1.000 .722
Part3_A_6 4.55 .757 223 Part3_A_6 1.000 .665
Part3_A_7 4.37 .771 223 Part3_A_7 1.000 .629
Part3_A_8 3.24 1.155 223 Part3_A_8 1.000 .717
Part3_A_9 3.90 .829 223 Part3_A_9 1.000 .708
Part3_A_10 3.92 .953 223 Part3_A_10 1.000 .802
Part3_A_11 3.84 1.138 223 Part3_A_11 1.000 .736
Part3_A_12 4.24 .749 223 Part3_A_12 1.000 .845
Part3_A_13 4.20 .786 223 Part3_A_13 1.000 .824
Part3_A_14 4.48 .740 223 Part3_A_14 1.000 .458
Part3_A_15 3.62 1.480 223 Part3_A_15 1.000 .648
Part3_A_16 2.80 1.266 223 Part3_A_16 1.000 .494
Part3_A_17 4.03 .956 223 Part3_A_17 1.000 .594
Part3_A_18 4.46 .702 223 Part3_A_18 1.000 .812
Part3_A_19 4.55 .634 223 Part3_A_19 1.000 .647
Extraction Method: Principal Component Analysis.

220
Total Variance Explained
Compo
nent
Initial Eigenvalues Extraction Sums of Squared Loadings Rotation Sums of Squared Loadings
Total % of
Variance
Cumulative
%
Total % of
Variance
Cumulative
%
Total % of
Variance
Cumulative
%
1 5.310 27.946 27.946 5.310 27.946 27.946 4.344 22.865 22.865
2 2.525 13.292 41.238 2.525 13.292 41.238 2.764 14.547 37.413
3 2.512 13.222 54.460 2.512 13.222 54.460 2.451 12.898 50.311
4 1.454 7.652 62.112 1.454 7.652 62.112 2.027 10.669 60.980
5 1.295 6.818 68.930 1.295 6.818 68.930 1.511 7.951 68.930
6 .995 5.237 74.168
7 .893 4.700 78.868
8 .754 3.968 82.836
9 .721 3.796 86.631
10 .516 2.717 89.349
11 .400 2.104 91.453
12 .365 1.921 93.374
13 .315 1.658 95.032
14 .228 1.201 96.233
15 .194 1.022 97.254
16 .176 .925 98.180
17 .147 .774 98.954
18 .108 .570 99.524
19 .090 .476 100.000
Extraction Method: Principal Component Analysis.

221
Component Matrixa Rotated Component Matrix
Component Component
1 2 3 4 5 1 2 3 4 5
Part3_A_9 .824 -.162 -.043 .012 -.013 Part3_A_10 .857 .161 -.080 .008 .187
Part3_A_10 .811 -.361 .091 -.056 .048 Part3_A_3 .836 .105 -.046 .069 -.124
Part3_A_11 .746 -.298 -.163 -.176 .184 Part3_A_9 .742 .364 .010 -.041 .151
Part3_A_2 .709 .272 -.294 .318 -.265 Part3_A_11 .738 .188 -.098 -.283 .259
Part3_A_3 .704 -.375 .144 -.120 -.246 Part3_A_1 .719 .159 .194 .252 -.062
Part3_A_1 .688 -.109 .323 -.025 -.239 Part3_A_2 .354 .829 .140 .012 -.035
Part3_A_4 .600 .242 .169 -.480 -.191 Part3_A_18 .227 .768 -.146 -.361 .138
Part3_A_7 .049 .720 .201 -.146 .216 Part3_A_5 .127 .711 .427 -.105 -.082
Part3_A_6 .368 .689 .115 .063 -.193 Part3_A_12 .128 .639 -.196 .083 .612
Part3_A_5 .514 .558 -.264 .110 -.255 Part3_A_17 .075 -.101 .754 .098 .026
Part3_A_17 .164 .538 .424 -.311 -.034 Part3_A_7 -.218 .067 .711 -.012 .267
Part3_A_8 .400 -.194 .657 .285 -.086 Part3_A_6 .034 .457 .661 .132 -.019
Part3_A_18 .568 .099 -.655 .226 .021 Part3_A_4 .573 .064 .583 -.171 -.112
Part3_A_15 -.086 .211 .549 .509 .190 Part3_A_15 -.200 .002 .141 .690 .334
Part3_A_13 .481 -.107 .542 -.131 .519 Part3_A_8 .490 -.042 .058 .679 .107
Part3_A_16 -.002 -.303 .519 .307 -.197 Part3_A_16 .184 -.169 -.161 .629 -.103
Part3_A_12 .503 .082 -.258 .582 .424 Part3_A_19 .328 .018 -.137 -.541 .309
Part3_A_14 .260 .397 .100 -.065 .467 Part3_A_13 .534 -.275 .227 .200 .609
Part3_A_19 .336 -.204 -.362 -.304 .369 Part3_A_14 .027 .087 .404 -.081 .529
Extraction Method: Principal Component Analysis. a. 5 components extracted.
Extraction Method: Principal Component Analysis. Rotation Method: Varimax with Kaiser Normalization. Rotation converged in 20 iterations.
Factor Transformation Matrix
Factor 1 2 3 4 5
1 .828 .478 .196 -.030 .217
2 -.437 .382 .809 -.030 .088
3 .211 -.514 .374 .737 .092
4 -.259 .561 -.403 .644 .204
5 -.114 -.216 -.069 -.200 .946
Extraction Method: Principal Component Analysis.
Rotation Method: Varimax with Kaiser Normalization.

222
F-3: Organisational Culture Factors
KMO and Bartlett's Test
Kaiser-Meyer-Olkin Measure of Sampling Adequacy. .920
Bartlett's Test of Sphericity
Approx. Chi-Square 8010.843
df 253
Sig. .000
Descriptive Statistics Communalities
Mean Std. Deviation Analysis N Initial Extraction
Part3_C_1 2.98 1.250 223 Part3_C_1 1.000 .713
Part3_C_2 2.89 1.093 223 Part3_C_2 1.000 .784
Part3_C_3 3.11 1.188 223 Part3_C_3 1.000 .702
Part3_C_4 2.65 1.543 223 Part3_C_4 1.000 .773
Part3_C_5 2.56 1.615 223 Part3_C_5 1.000 .871
Part3_C_6 2.48 1.559 223 Part3_C_6 1.000 .877
Part3_C_7 2.78 1.360 223 Part3_C_7 1.000 .859
Part3_C_8 2.79 1.447 223 Part3_C_8 1.000 .886
Part3_C_9 2.71 1.480 223 Part3_C_9 1.000 .894
Part3_C_10 2.89 1.498 223 Part3_C_10 1.000 .784
Part3_C_11 2.60 1.593 223 Part3_C_11 1.000 .789
Part3_C_12 2.83 1.570 223 Part3_C_12 1.000 .827
Part3_C_13 2.67 1.463 223 Part3_C_13 1.000 .805
Part3_C_14 2.42 1.474 223 Part3_C_14 1.000 .884
Part3_C_15 2.22 1.328 223 Part3_C_15 1.000 .835
Part3_C_16 2.29 .962 223 Part3_C_16 1.000 .568
Part3_C_17 2.47 1.338 223 Part3_C_17 1.000 .854
Part3_C_18 2.46 1.413 223 Part3_C_18 1.000 .835
Part3_C_19 2.39 1.426 223 Part3_C_19 1.000 .830
Part3_C_20 2.75 1.500 223 Part3_C_20 1.000 .887
Part3_C_21 2.74 1.264 223 Part3_C_21 1.000 .718
Part3_C_22 2.56 1.354 223 Part3_C_22 1.000 .813
Part3_C_23 2.61 1.561 223 Part3_C_23 1.000 .799
Extraction Method: Principal Component Analysis.

223
Total Variance Explained
Compo
nent
Initial Eigenvalues Extraction Sums of Squared Loadings Rotation Sums of Squared Loadings
Total % of
Variance
Cumulative
%
Total % of
Variance
Cumulative
%
Total % of
Variance
Cumulative
%
1 15.760 68.521 68.521 15.760 68.521 68.521 10.030 43.608 43.608
2 1.611 7.006 75.527 1.611 7.006 75.527 6.929 30.126 73.734
3 1.216 5.287 80.814 1.216 5.287 80.814 1.629 7.081 80.814
4 .670 2.913 83.727
5 .566 2.459 86.186
6 .509 2.213 88.399
7 .444 1.931 90.330
8 .389 1.692 92.022
9 .350 1.524 93.546
10 .285 1.240 94.786
11 .229 .996 95.782
12 .222 .967 96.749
13 .168 .730 97.478
14 .130 .566 98.045
15 .095 .413 98.458
16 .077 .334 98.792
17 .069 .299 99.090
18 .057 .247 99.338
19 .046 .202 99.539
20 .040 .172 99.711
21 .034 .147 99.858
22 .020 .088 99.946
23 .012 .054 100.000
Extraction Method: Principal Component Analysis.
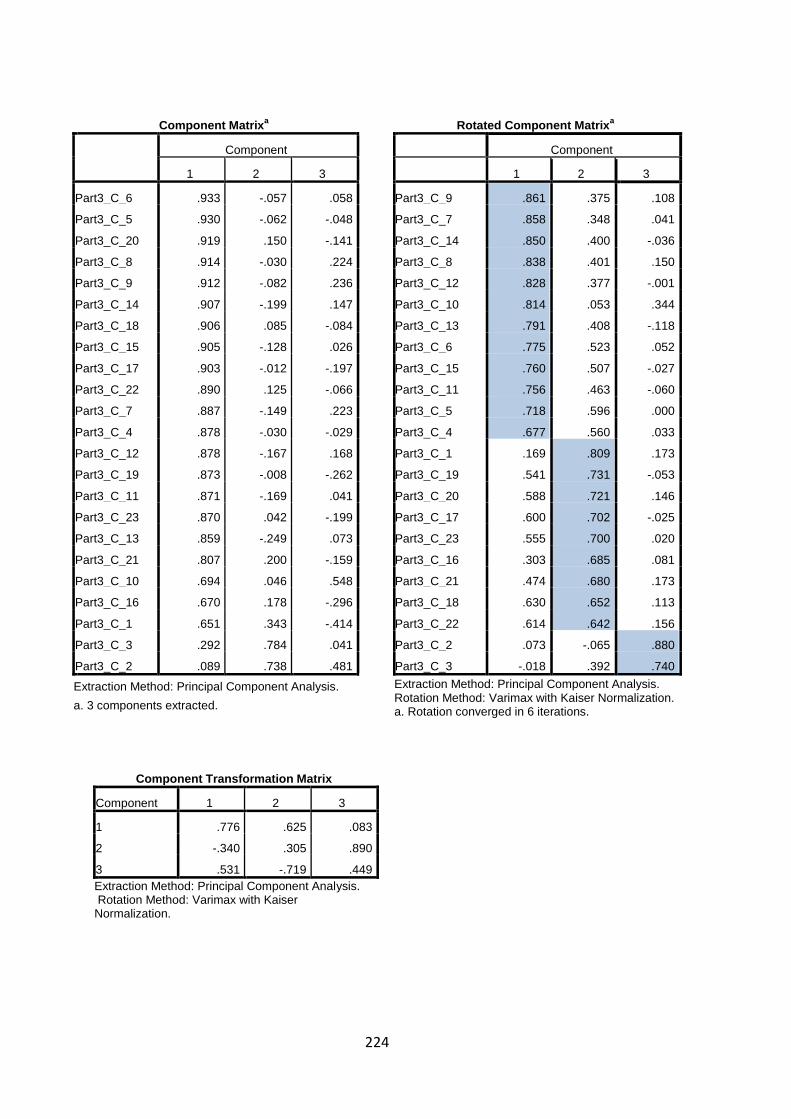
224
Component Matrixa Rotated Component Matrix
a
Component Component
1 2 3 1 2 3
Part3_C_6 .933 -.057 .058 Part3_C_9 .861 .375 .108
Part3_C_5 .930 -.062 -.048 Part3_C_7 .858 .348 .041
Part3_C_20 .919 .150 -.141 Part3_C_14 .850 .400 -.036
Part3_C_8 .914 -.030 .224 Part3_C_8 .838 .401 .150
Part3_C_9 .912 -.082 .236 Part3_C_12 .828 .377 -.001
Part3_C_14 .907 -.199 .147 Part3_C_10 .814 .053 .344
Part3_C_18 .906 .085 -.084 Part3_C_13 .791 .408 -.118
Part3_C_15 .905 -.128 .026 Part3_C_6 .775 .523 .052
Part3_C_17 .903 -.012 -.197 Part3_C_15 .760 .507 -.027
Part3_C_22 .890 .125 -.066 Part3_C_11 .756 .463 -.060
Part3_C_7 .887 -.149 .223 Part3_C_5 .718 .596 .000
Part3_C_4 .878 -.030 -.029 Part3_C_4 .677 .560 .033
Part3_C_12 .878 -.167 .168 Part3_C_1 .169 .809 .173
Part3_C_19 .873 -.008 -.262 Part3_C_19 .541 .731 -.053
Part3_C_11 .871 -.169 .041 Part3_C_20 .588 .721 .146
Part3_C_23 .870 .042 -.199 Part3_C_17 .600 .702 -.025
Part3_C_13 .859 -.249 .073 Part3_C_23 .555 .700 .020
Part3_C_21 .807 .200 -.159 Part3_C_16 .303 .685 .081
Part3_C_10 .694 .046 .548 Part3_C_21 .474 .680 .173
Part3_C_16 .670 .178 -.296 Part3_C_18 .630 .652 .113
Part3_C_1 .651 .343 -.414 Part3_C_22 .614 .642 .156
Part3_C_3 .292 .784 .041 Part3_C_2 .073 -.065 .880
Part3_C_2 .089 .738 .481 Part3_C_3 -.018 .392 .740
Extraction Method: Principal Component Analysis. Extraction Method: Principal Component Analysis. Rotation Method: Varimax with Kaiser Normalization. a. Rotation converged in 6 iterations.
a. 3 components extracted.
Component Transformation Matrix
Component 1 2 3
1 .776 .625 .083
2 -.340 .305 .890
3 .531 -.719 .449
Extraction Method: Principal Component Analysis. Rotation Method: Varimax with Kaiser Normalization.

225
Appendix G AMOS Output
G-1: Project Phase Measurement Model Fit
Table G-1: Project phase fit model measures, standardized loading, standardized residual and
modification indices (MI)
Overall Model Fit Measures Chi-square = 55.432 Degrees of freedom = 30 Probability level = .003
CMIN= 1.848 GFI=.921 TLI=.966 CFI=.977 RMSEA=.080
Standardized Loading [Direct Effects]
Project Phase Handover Phase Construction Phase Design Phase
Handover Phase .624 - - -
Construction Phase .852 - - -
Design Phase .612 - - -
Part2_D_3 - .844 - -
Part2_D_2 - .962 - -
Part2_D_1 - .887 - -
Part2_C_8 - - .921 -
Part2_C_7 - - .905 -
Part2_C_6 - - .767 -
Part2_C_9 - - .759 -
Part2_B_8 - - - .858
Part2_B_9 - - - .943
Part2_B_6 - - - .815
Modification Indices (MI)
M.I. Par Change
e19 <--> e26 5.184 -.110
e19 <--> e24 4.670 .100
Standardized Residual for Error
Part2_D_3 Part2_D_2 Part2_D_1 Part2_C_8 Part2_C_7 Part2_C_6 Part2_C_9 Part2_B_8 Part2_B_9 Part2_B_6
Part2_D_3 .00
Part2_D_2 .11 ..00
Part2_D_1 .12 .17 .00
Part2_C_8 -.18 .46 .24 .00
Part2_C_7 -.50 -.23 .25 -.04 .00
Part2_C_6 -.09 -.47 -.02 -.14 .32 .00
Part2_C_9 -.56 -.79 -.64 -.19 .19 .16 ..00
Part2_B_8 -.44 1.69 .99 2.17 1.85 .81 .40 .00
Part2_B_9 -1.31 -.19 -.90 -.20 -.82 -1.58 -1.06 -.02 .00
Part2_B_6 -1.65 .37 .27 .02 -.69 -1.20 -1.07 -.45 .19 .00

226
G-2: Individual Factors Measurement Model Fit
Table G-2: individual factors fit model measures, standardized loading, standardized residual
and modification indices (MI)
Overall Model Fit Measures
Chi-square = 10.546 Degrees of freedom = 5 Probability level = .061
CMIN= 2.109 GFI=.978 TLI=.976 CFI=.987 RMSEA=.080
Standardized Loading [Direct Effects]
Individual Factors
Part3_A_13 .519
Part3_A_10 .973
Part3_A_3 .638
Part3_A_9 .825
Part3_A_11 .728
Modification Indices (MI)
None
Standardized Residual for Error
Part3_A_13 Part3_A_10 Part3_A_3 Part3_A_9 Part3_A_11
Part3_A_13 .000
Part3_A_10 .112 .000
Part3_A_3 -.346 .024 .000
Part3_A_9 -.703 .026 -.642 .000
Part3_A_11 .064 -.108 .957 .400 .000
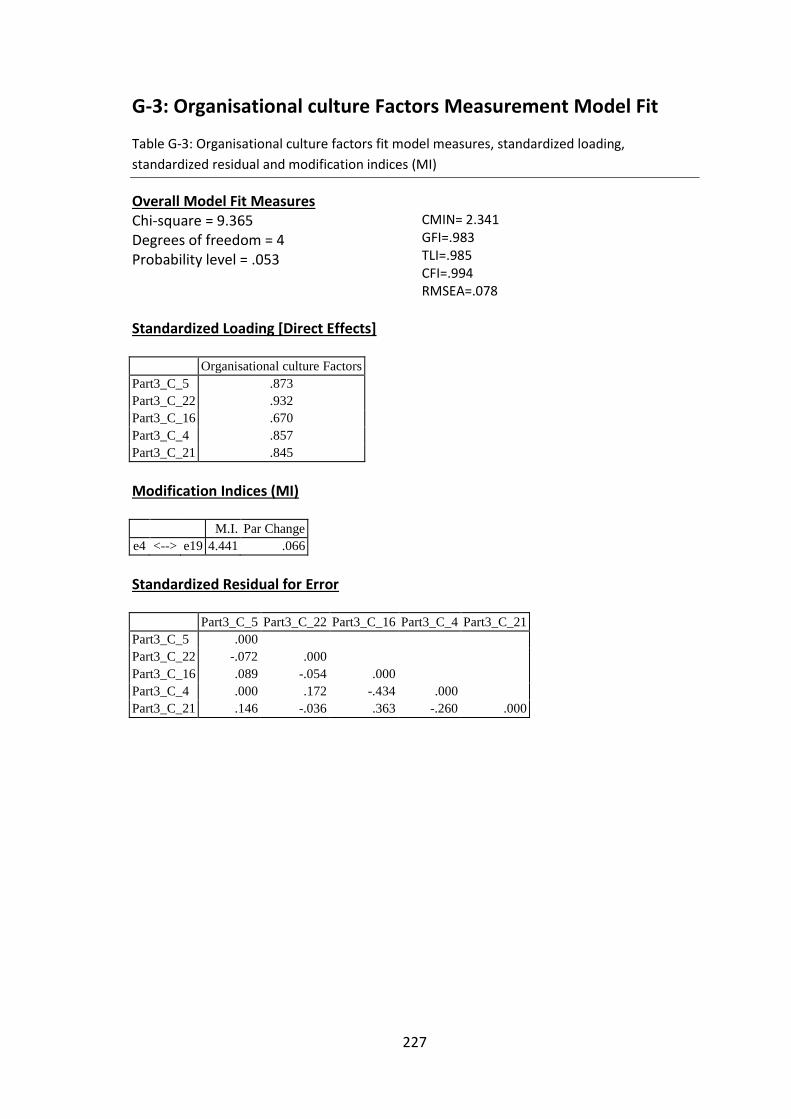
227
G-3: Organisational culture Factors Measurement Model Fit
Table G-3: Organisational culture factors fit model measures, standardized loading,
standardized residual and modification indices (MI)
Overall Model Fit Measures
Chi-square = 9.365 Degrees of freedom = 4 Probability level = .053
CMIN= 2.341 GFI=.983 TLI=.985 CFI=.994 RMSEA=.078
Standardized Loading [Direct Effects]
Organisational culture Factors
Part3_C_5 .873
Part3_C_22 .932
Part3_C_16 .670
Part3_C_4 .857
Part3_C_21 .845
Modification Indices (MI)
M.I. Par Change
e4 <--> e19 4.441 .066
Standardized Residual for Error
Part3_C_5 Part3_C_22 Part3_C_16 Part3_C_4 Part3_C_21
Part3_C_5 .000
Part3_C_22 -.072 .000
Part3_C_16 .089 -.054 .000
Part3_C_4 .000 .172 -.434 .000
Part3_C_21 .146 -.036 .363 -.260 .000

228
G-4: Whole Structural Model with Individual Factors
Table G-4: whole structure fit model measures with individual factors only, standardized
loading, standardized residual and modification indices (MI)
Overall Model Fit Measures
Chi-square = 114.402 Degrees of freedom = 59 Probability level = .000
CMIN= 1.939 GFI=.900 TLI=.956 CFI=.967 RMSEA=.078
Standardized Loading [Direct Effects]
Individual Factors Project Phase Handover Phase Construction Phase Project Delivery Expectation
Project Phase .199 - - - -
Client Involvement .846 .391 - - -
Handover Phase - .652 - - -
Construction Phase - .835 - - -
Project Delivery Expectation - - - - -
Part2_C_9 - - - .753 -
Part2_D_3 - - - - -
Part2_D_2 - - - - -
Part2_D_1 - - - - -
Part2_C_8 - - - .921 -
Part2_C_7 - - - .903 -
Part2_C_6 - - - .759 -
Part3_D_3 [Quality] - - - - .901
Part3_D_2 [Cost] - - - - .961
Part3_D_1 [Time] - - - - .935
Part3_A_3 .673 - - - -
Part3_A_10 .933 - - - -
Part3_A_11 .751 - - - -
Modification Indices (MI)
M.I. Par Change
e14 <--> e16 5.141 .081
e2 <--> e11 5.573 .080
e2 <--> e14 5.580 .084
e2 <--> e12 5.506 -.083
e1 <--> e17 6.225 -.139
e1 <--> e16 9.852 .124
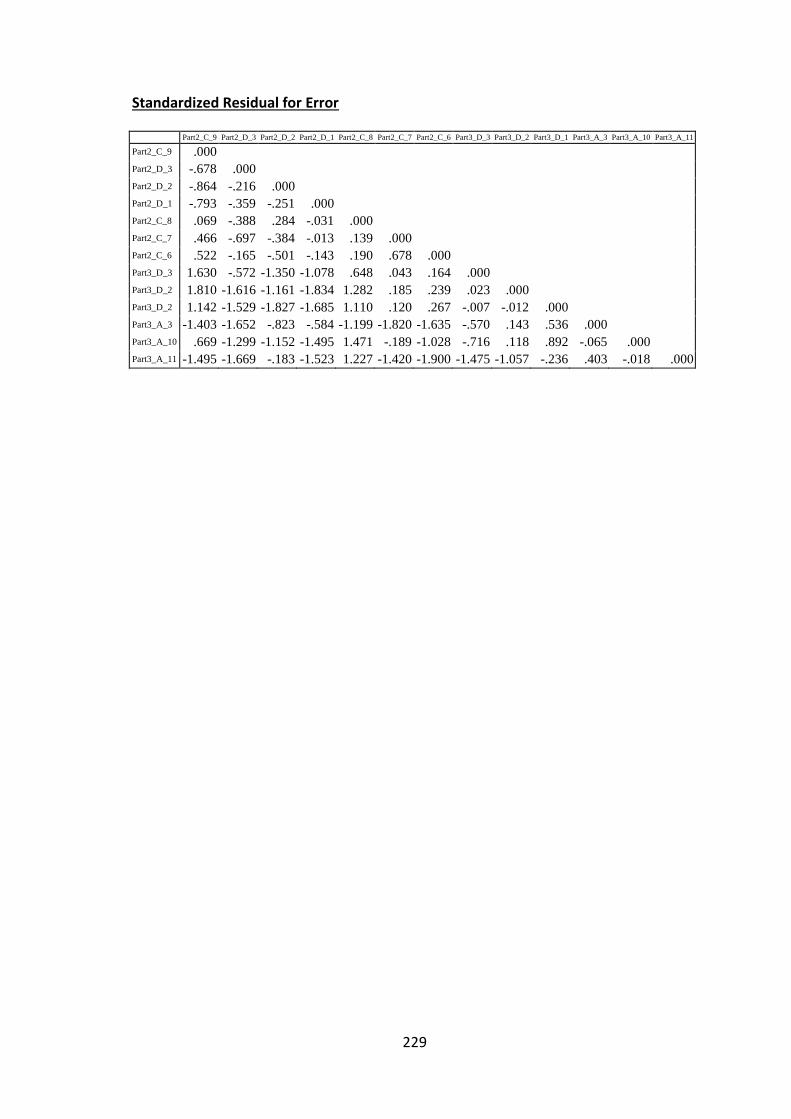
229
Standardized Residual for Error
Part2_C_9 Part2_D_3 Part2_D_2 Part2_D_1 Part2_C_8 Part2_C_7 Part2_C_6 Part3_D_3 Part3_D_2 Part3_D_1 Part3_A_3 Part3_A_10 Part3_A_11
Part2_C_9 .000
Part2_D_3 -.678 .000
Part2_D_2 -.864 -.216 .000
Part2_D_1 -.793 -.359 -.251 .000
Part2_C_8 .069 -.388 .284 -.031 .000
Part2_C_7 .466 -.697 -.384 -.013 .139 .000
Part2_C_6 .522 -.165 -.501 -.143 .190 .678 .000
Part3_D_3 1.630 -.572 -1.350 -1.078 .648 .043 .164 .000
Part3_D_2 1.810 -1.616 -1.161 -1.834 1.282 .185 .239 .023 .000
Part3_D_2 1.142 -1.529 -1.827 -1.685 1.110 .120 .267 -.007 -.012 .000
Part3_A_3 -1.403 -1.652 -.823 -.584 -1.199 -1.820 -1.635 -.570 .143 .536 .000
Part3_A_10 .669 -1.299 -1.152 -1.495 1.471 -.189 -1.028 -.716 .118 .892 -.065 .000
Part3_A_11 -1.495 -1.669 -.183 -1.523 1.227 -1.420 -1.900 -1.475 -1.057 -.236 .403 -.018 .000

230
G-5: Whole Structural Model with Organisational Culture Factors
Table G-5: Whole structure fit model measures with organisational culture factors only,
standardized loading, standardized residual and modification indices (MI)
Overall Model Fit Measures
Chi-square = 129.072 Degrees of freedom = 59 Probability level = .000
CMIN= 2.188 GFI=.922 TLI=.963 CFI=.972 RMSEA=.073
Standardized Loading [Direct Effects]
Organisational
culture Factors
Project
Phase
Project Delivery
Expectation
Handover
Phase
Construction
Phase
Project Phase .187 - - - -
Client Involvement .819 .440 - - -
Project Delivery Expectation - - - - -
Handover Phase - .657 - - -
Construction Phase - .825 - - -
Part2_C_9 - - - - .753
Part3_D_3 [Quality] - - .903 - -
Part3_D_2 [Cost] - - .959 - -
Part3_D_1 [Time] - - .935 - -
Part3_C_16 .649 - - - -
Part3_C_4 .857 - - - -
Part3_C_22 .949 - - - -
Part2_D_3 - - - .854 -
Part2_D_2 - - - .957 -
Part2_D_1 - - - .895 -
Part2_C_7 - - - - .906
Part2_C_8 - - - - .918
Part2_C_6 - - - - .766
Modification Indices (MI)
M.I. Par Change
e19 <--> e3 4.086 .034
e18 <--> e3 4.787 -.034
e14 <--> e21 4.010 .047
e13 <--> e21 4.357 -.041
e7 <--> e14 7.053 .116
e7 <--> e13 4.466 -.077
e6 <--> e7 4.093 .074
e5 <--> e23 8.595 .088

231
Standardized Residual for Error
Part2_C_9 Part3_D_3 Part3_D_2 Part3_D_1 Part3_C_16 Part3_C_4 Part3_C_22 Part2_D_3 Part2_D_2 Part2_D_1 Part2_C_7 Part2_C_8 Part2_C_6
Part2_C_9 .000
Part3_D_3 1.673 .000
Part3_D_2 1.863 .015 .000
Part3_D_1 1.191 -.028 .002 .000
Part3_C_16 -.946 .225 -.618 .214 .000
Part3_C_4 -.412 1.246 .559 1.172 -.197 .000
Part3_C_22 -.065 -.298 -.610 .280 .061 .001 .000
Part2_D_3 -.678 -.565 -1.600 -1.516 1.584 .235 .607 .000
Part2_D_2 -.827 -1.332 -1.138 -1.807 1.909 -1.585 -.510 -.209 .000
Part2_D_1 -.716 -1.055 -1.812 -1.664 1.846 -.314 -.282 -.283 -.081 .000
Part2_C_7 .410 .088 .240 .171 -.589 -.535 -.598 -.716 -.351 .066 .000
Part2_C_8 .061 .705 1.349 1.172 1.255 .797 1.176 -.376 .356 .084 .097 .000
Part2_C_6 .409 .178 .260 .284 -.685 -1.589 -.705 -.248 -.543 -.145 .471 .035 .000

232
G-6: Whole Structural Model with Individual Factors and Organisational Culture Factors
Table G-6: Whole structure fit model measures with individual factors and organisational
culture factors, standardized loading, standardized residual and modification indices (MI)
Overall Model Fit Measures
Chi-square = 187.641 Degrees of freedom = 96 Probability level = .000
CMIN= 1.955 GFI=.870 TLI=.940 CFI=.952 RMSEA=.080
Standardized Loading [Direct Effects]
Organisational
culture Factors
Individual
Factors
Project
Phase
Handover
Phase
Construction
Phase
Project Delivery
Expectation
Organisational culture
Factors - -.171 - - - -
Individual Factors .685 - - - - -
Project Phase .122 .110 - - - -
Client Involvement .391 .571 .365 - - -
Handover Phase - - .654 - - -
Construction Phase - - .829 - - -
Project Delivery
Expectation - - - - - -
Part3_C_16 .629 - - - - -
Part3_C_4 .831 - - - - -
Part3_C_22 .980 - - - - -
Part2_C_9 - - - - .754 -
Part2_D_3 - - - .852 - -
Part2_D_2 - - - .957 - -
Part2_D_1 - - - .896 - -
Part2_C_8 - - - - .920 -
Part2_C_7 - - - - .904 -
Part2_C_6 - - - - .761 -
Part3_D_3 [Quality] - - - - - .902
Part3_D_2 [Cost] - - - - - .960
Part3_D_1 [Time] - - - - - .935
Part3_A_3 - .701 - - - -
Part3_A_10 - .896 - - - -
Part3_A_11 - .775 - - - -
Modification Indices (MI)
M.I. Par Change
e12 <--> e19 9.562 -.145
e11 <--> e19 5.065 .121
e10 <--> e12 5.244 .083
e2 <--> e17 6.566 .089
e2 <--> e10 5.039 .081
e2 <--> e8 5.922 -.087
e1 <--> e13 8.161 -.161
e1 <--> e12 9.681 .136

233
Standardized Residual for Error
Part3_C_16 Part3_C_4 Part3_C_22 Part2_C_9 Part2_D_3 Part2_D_2 Part2_D_1 Part2_C_8 Part2_C_7 Part2_C_6 Part3_D_3 Part3_D_2 Part3_D_1 Part3_A_3 Part3_A_10 Part3_A_11
Part3_C_16 .000
Part3_C_4 .246 .000
Part3_C_22 .054 -.019 .000
Part2_C_9 -.911 -.367 -.120 .000
Part2_D_3 1.648 .299 .586 -.665 .000
Part2_D_2 1.956 -1.526 -.549 -.847 -.153 .000
Part2_D_1 1.871 -.267 -.328 -.774 -.298 -.173 .000
Part2_C_8 1.302 .854 1.112 .024 -.351 .335 .017 .000
Part2_C_7 -.541 -.473 -.652 .410 -.669 -.344 .026 .114 .000
Part2_C_6 -.638 -1.531 -.740 .454 -.162 -.491 -.132 .127 .603 .000
Part3_D_3 .386 1.455 -.306 1.645 -.562 -1.339 -1.067 .679 .071 .180 .000
Part3_D_2 -.455 .773 -.624 1.830 -1.604 -1.147 -1.822 1.319 .219 .259 .026 .000
Part3_D_1 .375 1.381 .264 1.159 -1.520 -1.816 -1.676 1.142 .150 .283 -.022 -.008 .000
Part3_A_3 -1.080 .875 .866 -1.329 -1.598 -.760 -.524 -1.108 -1.731 -1.561 -.569 .152 .538 .000
Part3_A_10 -1.426 .102 -.188 .892 -1.113 -.936 -1.296 2.755 .083 -.804 -.396 .471 1.233 -.065 .000
Part3_A_11 -.998 -.236 .121 -1.403 -1.600 -.098 -1.448 1.340 -1.309 -1.808 -1.445 -1.018 -.205 -.106 .055 .000