by rui fan1 trade consultant law offices of stewart …s excess capacity...trade consultant . law...
TRANSCRIPT

1
China’s Excess Capacity: Drivers and Implications
By Rui Fan1 Trade Consultant
Law Offices of Stewart and Stewart
June 2015 (Updated as of February 2016)
China became the world’s second largest economy in 2010, in the midst of a swift
recovery from the 2008 financial crisis. While its achievement is widely recognized, China is facing both internal and external economic challenges to sustaining a high level of growth. Excess capacity in the manufacturing industries is one of the main challenges. On October 6, 2013, China’s State Council issued the “Guiding Opinion on Eliminating Severe Excess Capacities” (hereinafter referred to as the Guiding Opinion), to highlight the urgency of tackling excess capacity in China’s “traditional manufacturing industries” such as steel, aluminum and flat glass.2 This paper first explores the main drivers for China’s excess capacity, and then examines the Chinese industries identified with excess capacity. It also discusses the implications of excess capacity on China’s trade relations through the lens of trade remedies.
I. Characterization of the Issue Capacity utilization is defined as the ratio of an industry’s actual output to its estimated
potential output.3 The Federal Reserve Board of the United States, for example, publishes capacity utilization rates on a monthly basis, which covers 89 industries in the manufacturing, mining, and utilities industries.4 Unlike the United States, China does not have a country-level measure for capacity utilization. Instead, the Chinese government estimates capacity utilization based on “a comprehensive assessment of key business indicators”.5 It also publishes industry-specific capacity utilization rates in various policy papers.
1Rui Fan is a trade consultant at Stewart and Stewart, and provides economic, financial, and data analysis for antidumping and countervailing duty proceedings in a wide array of industrial sectors. Prior to joining Stewart and Stewart, Ms. Fan worked as a Senior Trade Officer at UK Trade & Investment at the British Embassy in Beijing. Ms. Fan is not an attorney.
2State Council, “Guiding Opinion on Eliminating Severe Excess Capacity”, Guofa [2013] No.41, available at: http://www.gov.cn/zwgk/2013-10/15/content_2507143.htm.
3Definition by the United Nations. 4The Federal Reserve Board uses a capacity utilization rate, which equals to an output index divided by a capacity
index, to measure capacity utilization in 89 U.S. industries, including 71 in manufacturing, 16 in mining and 2 in utilities. http://www.federalreserve.gov/releases/g17/CapNotes.htm
5Tao, Zhongyuan, 2011, “The Formation Mechanism of Chinese Excessive Capacity under Open Economy”, Economic Survey, No.4 2011. The business indicators used to estimate capacity utilization include inventories, ratio of sales to production, prices, corporate profits or losses, number of bankrupt companies and trade barriers and frictions.

2
Excess capacity, or surplus capacity, exists when too much potential supply exists relative to demand. According to the Federal Reserve Board, the total U.S. capacity utilization rate was 80.1 percent from 1972 to 2013, which is generally seen as a normal level. By contrast, the Guiding Opinion pointed out that the capacity utilization rates for five manufacturing industries in China, including steel, cement, aluminum, flat glass, and shipbuilding in 2012, were 72%, 73.7%, 71.9%, 73.1% and 75%, respectively, much lower than the 80% level.
China has had chronic excess capacity in its manufacturing industries and has
experienced three periods of severe excess capacity so far, namely from 1998 to 2001, from 2003 to 2006, and from 2009 to present.6 The Chinese government has taken numerous efforts to address the problem since the early 2000s, but the challenge persists. Recently, 15 industries were identified by the government to have continued excess capacity, only a few less than the previous year.7
In the terms of industrial economics, excess capacity is a short-term phenomenon and is
self-correcting in the market. The persistence and severity of excess capacity in China’s manufacturing industries reflects fundamental problems within the Chinese economy. It also has significant implications on international trade, given the growing influence of China in the global trading system.
II. Drivers for excess capacity Excess capacity can be caused by overinvestment, repressed demand, technology
improvement, and external shocks (such as financial crises), among other reasons.8 The Guiding Opinion also suggested a few contributing factors to China’s excess capacity, including overinvestment, low levels of market concentration, growth-driven investment policy, and distorted factor markets, in the context of China’s rapid industrialization and urbanization. This section will focus on three main drivers of China’s excess capacity: China’s investment-driven growth model, incentives for Chinese companies, and the stimulus programs implemented after the 2008 financial crisis.
First, on the macro level, China’s economy has maintained rapid growth for almost three
decades, with the average rate of GDP growth between 1978 and 2014 at 9.8%. Investment has been the largest contributor to GDP growth in half of the years since 2001 (see Figure 1). In 2009, a year after the financial crisis, investment contributed 7.9% to the total 9.2% of GDP growth. By contrast, net exports dragged the growth down by 3.9% that same year.
6Lu, Feng, 2010, “Tackling Excess Capacity”, summary of the 399th academic seminar of the Unirule Institute of Economics.
7Ministry of Industry and Information Technology, “Circular on Formulating Targets for Eliminating Backward and Excess Capacity of Key Industries during the 13th Five-Year Period”, Gongxinbuchanye [2014] No. 419
8Tao, Zhongyuan, 2011.

3
Source: China Statistical Year Book 2015, National Bureau of Statistics Specifically, over half of China’s fixed-
asset investment was in manufacturing and real estate between 2003 and 2014 (see Figure 2). During this period, investment in both sectors rose at an average annual rate of 25% and 24%, respectively. This massive and rapid investment growth has built up significant production capacity in some basic industries, including construction materials such as steel, cement, and flat glass, as well as chemicals, textiles, metals, and paper. This trend continued after the financial crisis and resulted in overinvestment when the market failed to eliminate unproductive capacities.
Source: National Bureau of Statistics
The Chinese government, both at the central and local levels, has played a significant role
in developing and sustaining China’s investment-driven growth model. The government has formulated and implemented growth-centric policies, including five-year plans and industrial strategies, complemented by fiscal, financial, and trade policies. Such policies are used to stimulate investment in certain priority industries with significant impact on economic growth and employment, which are often capital-intensive. Local government in particular is motivated

4
to sustain high levels of investment growth, even in the face of excess capacity and overinvestment.
Second, on the industry level, China’s robust economic growth has fostered strong
market confidence, motivating Chinese companies, both state-owned and private, to undertake substantial capital investments as part of their growth strategy. The size of the Chinese market and the overall transitional nature of the Chinese economy, however, have made market coordination and access to reliable information difficult.9 Moreover, Chinese companies tend to focus on investing in a number of “promising” industries where over-competition has led to over-investment.10
In addition, under China’s current fiscal system, as well as its evaluation mechanism for
government officials, local governments compete to attract investments that will contribute to local GDP growth, tax revenue, and employment.11 Companies as a result are offered incentives such as access to subsidies, land, energy, raw materials, and finance. Therefore, they are willing to carry excess capacities because their investment incentives have been distorted by government support. In some cases, local governments have set up exit barriers for market-driven bankruptcies, and mergers and acquisitions, in order to retain investment and jobs in their respective jurisdiction.12
The dominance of state-owned enterprises (SOEs) in the manufacturing and real estate
sectors has also contributed to the overexpansion of production capacity.13 Chinese SOEs operate under not only commercial, but also policy goals, including job creation and growing state-owned assets. SOEs as a result receive significant benefits and subsidized credit to finance their investments. Their productivity, however, lags behind private and foreign companies.14 SOE monopoly has also constricted investment opportunities for private companies, which end up concentrating in a limited number of industries.
Third, following the outbreak of the 2008 financial crisis, the Chinese government
implemented vigorous stimulus programs to stabilize the economy, entailing substantial public spending and infrastructure investments. The 4 trillion RMB stimulus package, crafted in November 2008, channeled the largest portion of investments to transport and power
9Lu, Feng, 2010. 10Lin, Justin Yifu, 2010, “‘Wave Phenomena’ and Formation of Excess Capacity”, Economic Research, volume
No.10. 11Yu, Li and Zhang, Jie, 2014, “Fundamental Cause and Solution of China’s Excess Capacity: Non-market
Factors and Three-Step-Strategy”, Industrial Economy, volume No. 2. 12Wang, Liguo, Gao, Yueqing and Wang, Shandong, 2013, “Curbing Excess Capacity and Promoting A Healthy
Growth of the Cement Industry”, Macroeconomic Research. 13Feng, Liguo and Gao, Rui, 2013, “A Survey on Certain Industries with Excess Capacity and Solutions”, China
Development Observation, volume No.6. 14Lardy, Nicholas, “Markets over Mao: The Rise of Private Business in China”, Peterson Institute for
International Economics.

5
infrastructure (see Figure 3).15 That in turn generated rapid recovery and expansion in upstream sectors such as steel, cement, and metals, which were hit hard by the crisis. Besides fiscal stimulus, the government also resorted to credit expansion and lowered interest rates to stimulate growth.
Source: National Bureau of Statistics; National Development and Reform Commission In addition, the government issued the “adjustment and promotion plans” to boost
employment and growth in ten key industries, including steel, shipbuilding, textiles, light manufacturing, nonferrous metals, equipment manufacturing, petrochemicals, automobiles, electronic and information technology, and logistics. These plans launched more supporting policies, including government funds, credit support, and tax cuts. As a result of these efforts, the Chinese economy recovered quickly from the financial crisis. The stimulus programs, however, have undoubtedly exacerbated China’s previously existing excess capacity issues.
To summarize, China’s economic growth has been heavily dependent on investment,
especially in the manufacturing and real estate sectors. This growth model, combined with distorted investment incentives for Chinese companies and the recent economic stimulus, gave rise to excess capacity in many of China’s manufacturing industries. The phenomenon started to emerge in the late 1990s and lasts until today. Industries that were invested in most heavily tend to have the worst excess capacity. The section below will discuss what these industries are and how their performance has been affected by excess capacity.
15News report, available at: http://finance.people.com.cn/GB/10274329.html

6
III. Industries with excess capacity The Guiding Opinion listed five industries with severe excess capacity in 2012, including
steel, cement, aluminum, flat glass, and shipbuilding. Beyond those, more than a dozen industries in the manufacturing sector face sustained excess capacity. In order to address the problem, the Chinese government has set up an administrative program to directly phase out excess capacities in those overinvested industries. The structure and focus of the program will be discussed in further detail below.
The Capacity Elimination Program Administered by the Ministry of Industry and Information Technology (MIIT), the
program mandates companies to shut down production capacities that are included in the annual capacity elimination targets, which are submitted by the local governments based on their economic planning priorities. The program was originally named the “Backward Capacity Elimination Program,” which referred to plants or factories using polluting or energy-intensive technology or equipment. It was renamed to the “Excess Capacity Elimination Program” in 2013, following the issuance of the Guiding Opinion. The industries covered by the program before and after 2013 remained the same, as did the general levels of the elimination targets, reflecting a consistent policy focus (see Table 1).
The industries covered by this program include heavy raw materials (metals and non-
metallic minerals) and light industries (paper, leather, and textiles). The program started with 12 industries in 2007 and later increased to 19 in 2012 and 2013. The level of capacity cuts for most of the industries rose substantially in 2010 and only started to moderate in recent years. It is worth noting that the program’s elimination targets only consist of a small portion of total production of these industries, and don’t reflect net capacity reductions because new capacity might have been added as these targets were being implemented. Nevertheless, the aggravating trend is indicative of how excess capacity has become more severe and extensive overtime.
7
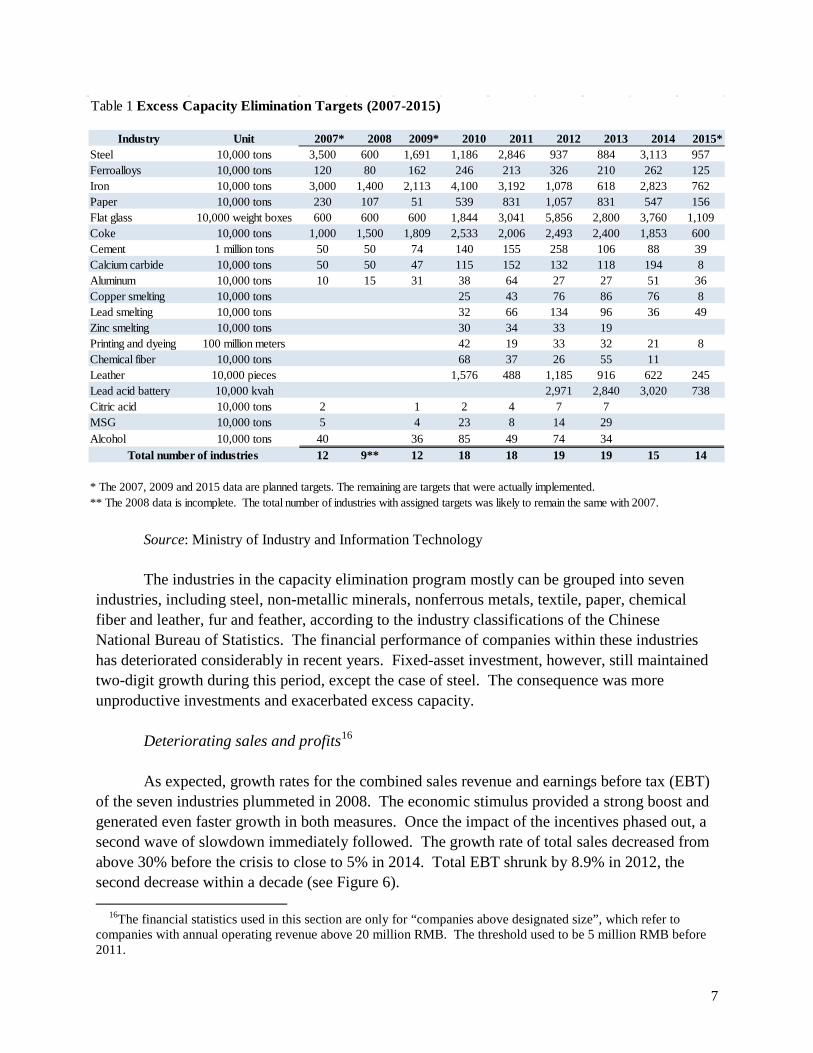
Source: Ministry of Industry and Information Technology The industries in the capacity elimination program mostly can be grouped into seven
industries, including steel, non-metallic minerals, nonferrous metals, textile, paper, chemical fiber and leather, fur and feather, according to the industry classifications of the Chinese National Bureau of Statistics. The financial performance of companies within these industries has deteriorated considerably in recent years. Fixed-asset investment, however, still maintained two-digit growth during this period, except the case of steel. The consequence was more unproductive investments and exacerbated excess capacity.
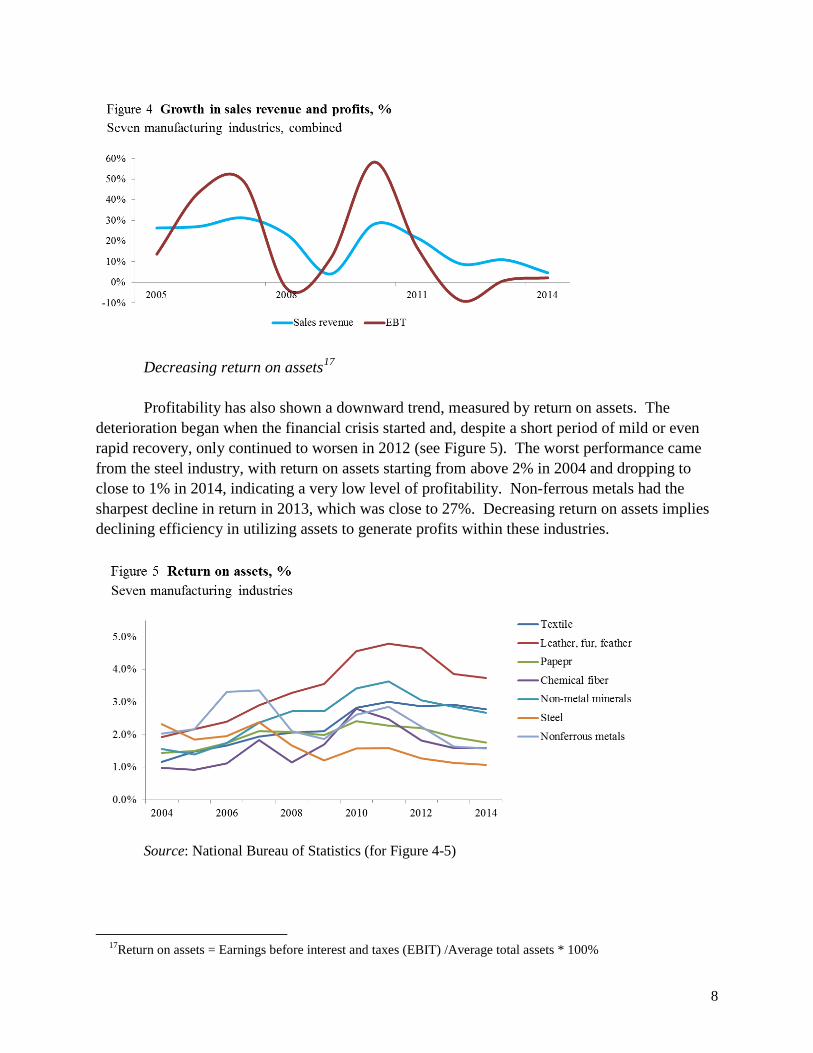
Deteriorating sales and profits16 As expected, growth rates for the combined sales revenue and earnings before tax (EBT)
of the seven industries plummeted in 2008. The economic stimulus provided a strong boost and generated even faster growth in both measures. Once the impact of the incentives phased out, a second wave of slowdown immediately followed. The growth rate of total sales decreased from above 30% before the crisis to close to 5% in 2014. Total EBT shrunk by 8.9% in 2012, the second decrease within a decade (see Figure 6).
16The financial statistics used in this section are only for “companies above designated size”, which refer to companies with annual operating revenue above 20 million RMB. The threshold used to be 5 million RMB before 2011.
Table 1 Excess Capacity Elimination Targets (2007-2015)
Industry Unit 2007* 2008 2009* 2010 2011 2012 2013 2014 2015*Steel 10,000 tons 3,500 600 1,691 1,186 2,846 937 884 3,113 957Ferroalloys 10,000 tons 120 80 162 246 213 326 210 262 125Iron 10,000 tons 3,000 1,400 2,113 4,100 3,192 1,078 618 2,823 762Paper 10,000 tons 230 107 51 539 831 1,057 831 547 156Flat glass 10,000 weight boxes 600 600 600 1,844 3,041 5,856 2,800 3,760 1,109Coke 10,000 tons 1,000 1,500 1,809 2,533 2,006 2,493 2,400 1,853 600Cement 1 million tons 50 50 74 140 155 258 106 88 39Calcium carbide 10,000 tons 50 50 47 115 152 132 118 194 8Aluminum 10,000 tons 10 15 31 38 64 27 27 51 36Copper smelting 10,000 tons 25 43 76 86 76 8Lead smelting 10,000 tons 32 66 134 96 36 49Zinc smelting 10,000 tons 30 34 33 19Printing and dyeing 100 million meters 42 19 33 32 21 8Chemical fiber 10,000 tons 68 37 26 55 11Leather 10,000 pieces 1,576 488 1,185 916 622 245Lead acid battery 10,000 kvah 2,971 2,840 3,020 738Citric acid 10,000 tons 2 1 2 4 7 7MSG 10,000 tons 5 4 23 8 14 29Alcohol 10,000 tons 40 36 85 49 74 34
12 9** 12 18 18 19 19 15 14
* The 2007, 2009 and 2015 data are planned targets. The remaining are targets that were actually implemented. ** The 2008 data is incomplete. The total number of industries with assigned targets was likely to remain the same with 2007.
Total number of industries
8
Decreasing return on assets17 Profitability has also shown a downward trend, measured by return on assets. The
deterioration began when the financial crisis started and, despite a short period of mild or even rapid recovery, only continued to worsen in 2012 (see Figure 5). The worst performance came from the steel industry, with return on assets starting from above 2% in 2004 and dropping to close to 1% in 2014, indicating a very low level of profitability. Non-ferrous metals had the sharpest decline in return in 2013, which was close to 27%. Decreasing return on assets implies declining efficiency in utilizing assets to generate profits within these industries.
Source: National Bureau of Statistics (for Figure 4-5)
17Return on assets = Earnings before interest and taxes (EBIT) /Average total assets * 100%
9
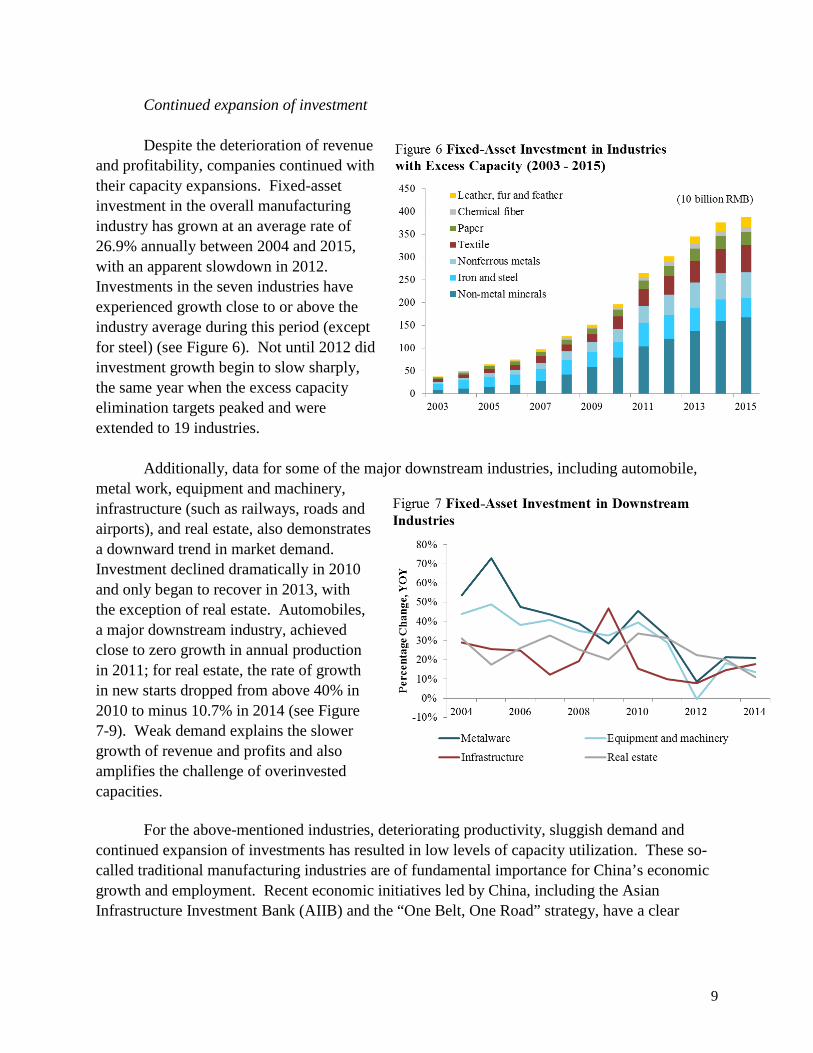
Continued expansion of investment Despite the deterioration of revenue
and profitability, companies continued with their capacity expansions. Fixed-asset investment in the overall manufacturing industry has grown at an average rate of 26.9% annually between 2004 and 2015, with an apparent slowdown in 2012. Investments in the seven industries have experienced growth close to or above the industry average during this period (except for steel) (see Figure 6). Not until 2012 did investment growth begin to slow sharply, the same year when the excess capacity elimination targets peaked and were extended to 19 industries.
Additionally, data for some of the major downstream industries, including automobile,
metal work, equipment and machinery, infrastructure (such as railways, roads and airports), and real estate, also demonstrates a downward trend in market demand. Investment declined dramatically in 2010 and only began to recover in 2013, with the exception of real estate. Automobiles, a major downstream industry, achieved close to zero growth in annual production in 2011; for real estate, the rate of growth in new starts dropped from above 40% in 2010 to minus 10.7% in 2014 (see Figure 7-9). Weak demand explains the slower growth of revenue and profits and also amplifies the challenge of overinvested capacities.
For the above-mentioned industries, deteriorating productivity, sluggish demand and continued expansion of investments has resulted in low levels of capacity utilization. These so-called traditional manufacturing industries are of fundamental importance for China’s economic growth and employment. Recent economic initiatives led by China, including the Asian Infrastructure Investment Bank (AIIB) and the “One Belt, One Road” strategy, have a clear

10
element of tackling domestic excess capacity through overseas investments and infrastructure cooperation, among other economic goals.
Source: National Bureau of Statistics (for Figure 6-9) IV. Implications on international trade 1) Trade statistics Between 1990 and 2015, China’s total trade in goods, exports and imports all achieved
double-digit average growth, i.e. 15.4%, 16.3% and 14.7%, respectively. Especially after China joined the World Trade Organization in 2001, the average growth for its annual trade was 27.5% for the first six years. The recent financial crisis had a strong negative impact on China’s exports, which decreased by 16% in 2009, the same year when net exports of goods and services dragged down GDP growth by 3.9%. Recovery after the crisis was strong but short-lived, which however

11
Source: National Bureau of Statistics
did not stop China from overtaking the United States to become the world’s largest trading nation in goods in 2013.18 China’s total trade surpassed 4 trillion USD in 2013 and trade surplus was nearly 260 billion USD, although still below the peak level in 2008 of 298 billion USD (see Figure 10).
China is the world’s largest producer for most of the manufacturing industries identified
with excess capacity.19 Figure 11 shows the aggregate trade data from 2007 to 2015 for the 19 industries identified in MIIT’s capacity elimination program. During this period, total exports increased by 65.9% and exceeded 250 billion USD in 2014. Net exports more than doubled and accounted for over 42% of the total trade in 2015. Exports declined dramatically in 2009, followed by an instant recovery and then a sharp slowdown in 2012. After two years of mild growth, total exports fell by 2.4% in 2015 but net exports still grew by 8.1%.
Source: China Customs China is a net exporter for 16 out of the 19 industries, except for copper, zinc and glass.
Among them, China is also the world’s largest exporter of steel, aluminum, leather and chemical fiber. Given the magnitude of Chinese exports, the impact of excess capacity in these industries is naturally reflected in China’s trade relations with its partners. Companies in more and more countries view Chinese exports as a threat to their domestic markets, as evidenced by the trends in trade remedy cases over the past two decades.
18News report, available at: http://www.bloomberg.com/news/articles/2013-02-09/china-passes-u-s-to-become-
the-world-s-biggest-trading-nation 19Various news reports.

12
2) Trade remedies As China’s clout grows in the
international trading system, the competition between Chinese exporters and foreign companies has increasingly intensified. Trade frictions with partner countries have resulted in China becoming the most frequently targeted nation by trade remedies. According to WTO statistics, between 1995 and 2014, antidumping actions against China peaked during the financial crisis and continued to increase after a brief period of decline. Countervailing duty actions followed a similar path, although on a much smaller scale.
Figure 12 shows the top 10 exporting countries by the total number of initiations of
antidumping cases between 1995 and 2014. China is ranked at the top with 1,052 cases, among which 759 cases resulted in the imposition of anti-dumping duties. In total, China was targeted by 22.1% of all the antidumping initiations and 24.8% of all the antidumping measures during this period. The countries that have undertaken the most trade remedies against China are India, the United States, and the European Union. The United States launched 124 antidumping proceedings against China and among those, issued 99 antidumping orders (see Figure 13).

13
Unlike antidumping, countervailing duties are applied much less often in international trade and the total number of cases greatly fluctuates. Regardless, other than two years (2005 and 2006), China has been consistently ranked at the top both in terms of case initiations and final measures, since the first countervailing duty cases were launched against China in 2004. China dwarfed any other country in countervailing duty cases, with 90 initiations and 56 measures, over half of which were undertaken by the United States (see Figure 14- 15).
Source: World Trade Organization (for Figure 12-15) In terms of the sectorial distribution of trade remedies, more than 80% of the
antidumping and countervailing duty cases are concentrated in six industries: base metal, chemical, machinery and equipment, textile, rubber and plastics and stone, cement, and glass. In particular, base metal, including steel, copper, and aluminum, accounted for over a quarter of the antidumping cases and over half of the countervailing duty cases. These statistics have proven that the industries with excess capacity are exactly the reason why China is facing the most frictions in international trade.

14
Notably, 2015 saw a global surge of trade remedy cases against China’s steel exports in the context of shrinking global demand. The following countries have either imposed new antidumping or countervailing duty measures or launched new investigations on China’s steel exports: the United States, the European Union, Malaysia, India, South Korea, Australia, Peru, Mexico, Canada, Thailand, Brazil, and Pakistan.20 Two months into 2016, the European Union has already imposed two provisional measures and launched three new cases on the imports of steel products from China.21 Party in response to this trend, China has recently announced the plan of cutting its crude steel production capacity by approximately 10% over the next five years.22
V. Conclusions China’s economy has continued to slow down in 2015, driven by a slow recovery in the
real estate sector and exports. China is trying to reform its growth model to reduce its reliance on investment and move up the global value chain. To achieve the goal of “letting the market play the decisive role in allocating resources,”23 however, China still has a long way to go.
After almost two decades, excess capacity has become rampant in many manufacturing
industries that are crucial to China’s economy and exports. In light of the current economic slowdown, the capacity elimination program is likely to continue in the medium run, while the AIIB and the “One Belt, One Road” strategy may help tackle the problem in the long run. In the meantime, exports of those industries with excess capacity have recovered to pre-crisis levels and will continue to grow. Trading partners have increasingly turned to trade remedies to ease pressure on their domestic markets. It seems unlikely that such trends will be reversed any time soon.
20 Ganglian Holdings, 2016, www.glinfo.com 21 European Commission, 2016, “Commission launches new anti-dumping investigations into several steel products”, available at: http://europa.eu/rapid/press-release_IP-16-287_en.htm 22 Xinhua News, 2016, “China to cut steel capacity by 100-150 mln tonnes in 5 years”, available at: http://news.xinhuanet.com/english/2016-02/04/c_135075575.htm
23News report, 2014, “Decision of the Central Committee of the Communist Party of China on Some Major Issues Concerning Comprehensively Deepening the Reform”, available at: http://www.china.org.cn/china/third_plenary_session/2014-01/16/content_31212602.htm

15
Addendum to the Paper: Issues specific to the USCC hearing on the Chinese economy
1. What is the scope of production, exports, and capacity in these sectors? As available data indicates, seven manufacturing industries have had almost continuous
growth in both production and production capacity during the period between 2002 and 2014. The chart below shows that the cement, flat glass, coke, and chemical fiber industries have added much more capacity than the actual increase of production annually over recent years.24 The faster pace of capacity expansion indicates that there is more production capacity installed each year than actually needed, exacerbating the excess capacity problem in these industries.
Source: National Bureau of Statistics
24 The units of measurement for these industries are 10,000 tons for total production and 10,000 tons per year for production capacity, except for flat glass (10,000 weight boxes and 10,000 weight boxes per year, respectively). These are also the units of measurement for iron, steel, and aluminum.

16
During the same period, growth of production capacity in the iron and steel industry has lagged growth of total production. Although the Guiding Opinion noted that capacity utilization of the steel industry was 72% in 2012, China still added a total of 27 million tons of iron and 47 million tons of crude steel capacity in 2013 and 2014.
Investment in the industry has apparently slowed, and even decreased by 13.63% in the
first ten months of 2015 (the lion’s share was in steel rolling). Nevertheless, nearly 3,000 projects were added in 2015, and China’s crude steel production still accounted for over half of the world’s total. The largest Chinese steel companies, ranked by the World Steel Association, are also actively pursuing domestic and overseas opportunities for expansion.
Company WSA ranking
Production (million tons)
Planned capacity expansion
Hebei Iron and Steel 3 47.094
China's Hebei Steel plans to build plant in South Africa in 2017 - official
Baosteel 4 43.347 Baosteel highlights Zhanjiang's greenness
Shagang Group 6 35.332 N/A
Ansteel 7 34.348 Ansteel plans to build plant in Indonesia
WISCO 8 33.053 WISCO, Tidfore agree to build steel plant in Liberia

17
Source: China Iron and Steel Association, World Steel Association, and various news reports The electrolyzed aluminum industry had the lowest capacity utilization, 71.9%, among
the five industries with severe excess capacity, according to the Guiding Opinion. The industry has experienced rapid growth since the financial crisis. On average, total production increased by 16.6% annually between 2010 and 2014, and production capacity increased by 1.1 million tons during the same period. The significant increase in production and capacity has been reflected in exports: the combined exports of unwrought aluminum and rolled aluminum products increased by an average annual rate of 23.4% during this period.
Page 11, Section IV of the paper has covered the export trends of the 19 manufacturing
industries.
2. How much has the Chinese Producer Price Index declined in recent years? Excess capacity has created a downward pressure on industrial product prices. The
Producer Price Index (PPI) for all industrial products has dropped below 100 four times since 2003, including in the past three years. Among the seven broad manufacturing industries with excess capacity, only leather, fur, and feather managed to maintain a PPI above 100 from 2012 onwards.

18
3. Do overcapacity levels vary by province and city?
The Guiding Opinion noted that the key areas for eliminating excess iron and steel
capacity are the following provinces: Shandong, Hebei, Liaoning, Jiangsu, Shanxi, and Jiangxi. It also identified the major producing provinces for flat glass, i.e. Hebei, Guangdong, Jiangsu, and Shandong, which it noted require comprehensive structural reform. Following the issuance of the Guiding Opinion, these provinces along with some other industrialized provinces such as Anhui launched implementation measures and roadmaps for eliminating excess capacity for their own provinces. Because capacity utilization varies across different regions and provinces, each province has identified a number of industries to focus on (more than just the ones with severe excess capacity), and developed elimination targets for each industry and for major cities.
4. How is the central government addressing the overcapacity problem? Will creating more external demand through China-led initiative like the AIIB or the “One Belt, One Road” project divert oversupply of steel and other commodities to participating economies?
The Chinese central government views excess capacity as a serious economic challenge
and has developed various policies to tackle it. These efforts have unfortunately achieved limited success, as demonstrated by the continued expansion of production capacity and investment in manufacturing industries. The government is increasingly treating excess capacity as a macroeconomic issue and a priority in its reform agenda and initiatives abroad.

19
1) Capacity Elimination Programs (2007 to present)
The Chinese central government launched a capacity elimination program in 2007, using mandatory targets to cut backward and excess industrial capacity. Despite that this program is still in place today, the prevalence and severity of excess capacity in manufacturing industries require implementing more effective policies. Starting from 2015, the central government is rolling out a capacity swap program for four industries with severe excess capacity, including steel, cement, electrolyzed aluminum, and flat glass.25 Under this program, any new build, renovation, and/or expansion project will only be approved by being “swapped” with an eliminated project of the same capacity, or of 1.25 times of the planned capacity in environmentally sensitive regions. These capacity elimination programs aim to tackle excess capacity in the most direct way, especially in the above-mentioned four industries.
2) The 13th Five-Year Plan (March 2016)
As discussed in the paper, a fundamental driver for China’s excess capacity has been its
investment-driven growth model. China’s rapid economic growth has been fueled by investment in manufacturing and real estate, while declining returns and profitability of its companies reveal that this approach is not sustainable. The Chinese economy grew 6.9% in 2015, the lowest in twenty five years.26 In order to boost economic growth, the Chinese leadership has been contemplating a shift of economic policy from stimulating investment and exports to a focus on the supply-side – eliminating industrial excess capacity, optimizing and restructuring the industrial sector, and making the traditional industries more productive.27 The Chinese government will launch its 13th Five-year Plan this March and will release key policy measures on supply-side reforms.
3) The Silk Road Economic Belt and the 21st-century Maritime Silk Road (“One Belt, One Road”) strategy and the Asian Infrastructure Investment Bank (“AIIB”)
Besides eliminating domestic excess capacity and improving supply-side productivity,
China is also tapping into trade and investment opportunities abroad through launching mega economic initiatives. The “One Belt, One Road” strategy aims to integrate China with Central Asia, Southeast Asia, Africa, and Europe and to strengthen infrastructure in countries in these regions. A $40 billion Silk Road Fund has been established and 18 border and coastal provinces
25 The Ministry of Industry and Information Technology, “Circular on Printing and Issuing the Implementation Measures on Capacity Swap for Industries with Severe Excess Capacity”, Gongxinbuchanye [2015] No. 127. 26 Fortune, 2016, “China’s Real GDP Growth Figure Is Less Than 6.9%”, available at: http://fortune.com/2016/01/19/chinas-real-gdp-growth-figure-is-less-than-6-9/ 27 Xinhua News Agency, 2016, “China Headlines: Supply-side reform to keep Chinese economy fit”, available at: http://news.xinhuanet.com/english/2016-01/04/c_134977011.htm

20
have started developing economic projects for the initiative.28 The AIIB is an international financial institution focusing on developing infrastructure in the Asian region. It was initiated by China, participated by 57 founding members (by January 2016), and has a registered capital of 100 billion USD. China is the largest shareholder of the AIIB holding a 30.34% stake and has a 20.06% voting share.29 Given AIIB’s governance structure, China is poised to exert significant influence on setting future priorities and strategy for the bank.
These initiatives are expected to help China tap into the global infrastructure market,
including railways, roads, airports, and bridges, through foreign direct investment and exports, which could help relocate and/or utilize China’s domestic excess capacity in the steel, cement, flat glass, and metal industries.30 The extent to which they will help alleviate China’s phenomenal excess capacity, however, is open to question.31 Two trade routes under One Belt, One Road: AIIB Founding Members:
28 The Jamestown Foundation, 2015, “Chinese Provinces Aim to Find Their Place Along New Silk Road”, China Brief, Volume 15; available at: http://www.jamestown.org/single/?tx_ttnews%5Btt_news%5D=43915&no_cache=1#.Vr0guPkrKUk 29 China Daily, 2015, “China gets 30% stake in AIIB as bank takes shape”, available at: http://www.chinadaily.com.cn/bizchina/2015-06/29/content_21130572.htm 30 Reuters, 2015, “China’s ‘One Belt, One Road’ looks to take construction binge offshore”, available at: http://uk.reuters.com/article/uk-china-economy-silkroad-idUKKCN0R60X820150906 31 Dollar, David, 2015, “China’s rise as a regional and global power: The AIIB and the ‘one belt, one road’”, The Brookings Institution; available at: http://www.brookings.edu/research/papers/2015/07/china-regional-global-power-dollar