by noting the distance the jogger moves in equal time intervals, you can determine that the jogger...
TRANSCRIPT


By noting the distance the jogger moves in equal time intervals, you can determine that the jogger is standing still (a), moving at a constant speed (b),
speeding up (c), and slowing down (d).

The particle-model version of the motion diagram indicates the runner’s changing velocity not only by the change in spacing of the position dots, but also
by the change in length of the velocity vectors.

Average and Instantaneous Acceleration
The average acceleration of an object is the change in velocity during some measurable time
interval divided by that time interval. Average acceleration is measured in m/s2.
The change in velocity at an instant of time is called instantaneous acceleration. The instantaneous
acceleration of an object can be found by drawing a tangent line on the velocity-time graph at the point
of time in which you are interested. The slope of this line is equal to the instantaneous acceleration. (In
Calculus, we take the Derivitive of the function describing the line at the point of interest!)

The Average Acceleration can be determined by examining the SLOPE of the Velocity vs.
Time graph…

Looking at two consecutive velocity vectors and finding the difference between them yields the
average acceleration vector for thattime interval.


These four motion diagrams represent the four different possible ways to move along a straight line with constant acceleration (a). When the velocity vectors of the motion
diagram and acceleration vectors point in the same direction, an object’s speed increases. When they point in opposite
directions, the object slows down (b).

Graphs A and E show motion with constant velocity in opposite directions. Graph B shows both positive velocity and positive acceleration. Graph C shows positive velocity and negative acceleration. Graph D shows motion with constant positive acceleration that slows down while velocity is negative and
speeds up when velocity is positive.

Suppose you run wind sprints back and forth across the gym. You first run at 4.0 m/s toward the wall. Then, 10.0 s later, you
run at 4.0 m/s away from the wall. What is your average acceleration if the positive direction is toward the wall?


Velocity with Average Acceleration
If you know an object’s average acceleration during a time interval, you can use it to determine how much the velocity changed during that time.
The definition of average acceleration:

Vf = Vi + at
Final Velocity Initial Velocity Acceleration Time

The slope of a position-time graph of a car moving with a constant acceleration gets steeper as time
goes on…
SLOPE 1
SLOPE 2

A unique position-time graph cannot be created using a velocity-time graph because it does not
contain any information about the object’s position. However, the velocity-time graph does
contain information about the object’s displacement. Recall that for an object moving at
a constant velocity,
v = v = Δd/ Δ t, so Δ d = v Δ t
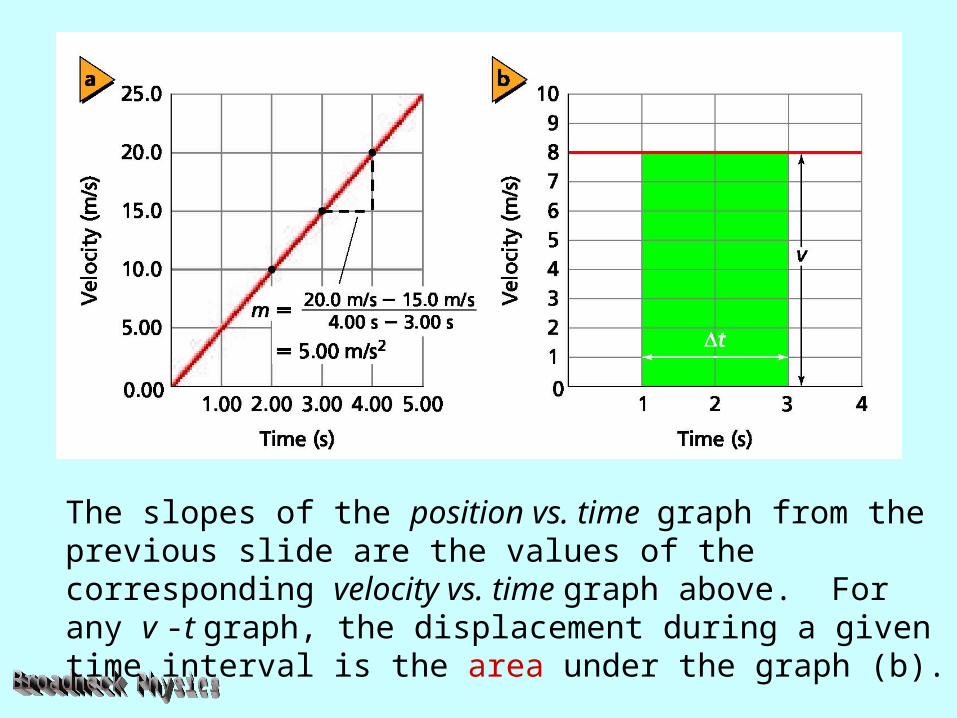
The slopes of the position vs. time graph from the previous slide are the values of the corresponding velocity vs. time graph above. For any v -t graph, the displacement during a given time interval is the area under the graph (b).


V
(m/s)
T (s)0
Vi
Vf
Area of Triangle = ½ base x height
(a = Δv/Δt so Δv = aΔt)

So you don’t have “time” for this stuff, huh…?

Our Three Primary “Kinematic Equations”


Two-Part Motion
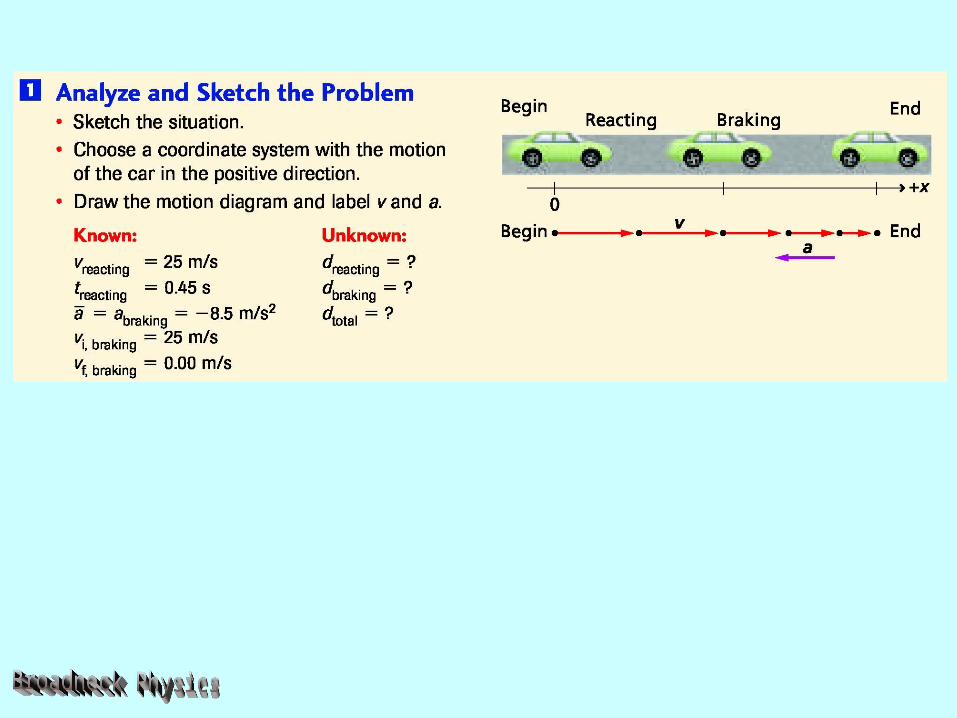
You are driving a car, traveling at a constant velocity of 25 m/s, when you see a child
suddenly run onto the road. It takes 0.45 s for you to react and apply the brakes. As a
result, the car slows with a steady acceleration of 8.5 m/s2 and comes to a stop. What is the total distance that the car moves
before it stops?We know: V= 25 m/s t1= 0.45s a =-8.45 m/s2
We want: distance


Acceleration Due to Gravity
About 400 years ago, Galileo Galilei recognized that to make progress in
the study of the motion of falling objects, the effects of the substance through which the object falls have to be ignored. At that time, Galileo
had nomeans of taking position or velocity data for falling objects, so he rolled balls down inclined planes. By
“diluting” gravity in this way, he could make careful measurements even with simple instruments.

The acceleration due to gravity is the acceleration of an object in free fall that results from the influence of Earth’s gravity. Suppose you drop a rock. After 1 s, its velocity is 9.80 m/s downward, and 1 s after that, its velocity is 19.60 m/s downward. For each second that the rock is falling, its downward velocity increases by 9.80 m/s
An egg accelerates at 9.80 m/s2 in free fall. If the upward direction is chosen as positive, then both the velocity and the acceleration of this egg in free
fall are negative

An object thrown
straight up reaches its
highest point – and an upward
velocity of 0 m/s.