by nishka kishore a thesis submitted in partial
TRANSCRIPT

Expression of alternative oxidase (AOX) in the filamentous fungus Neurospora crassa.
by
Nishka Kishore
A thesis submitted in partial fulfillment of the requirements for the degree of
Master of Science
in
Molecular Biology and Genetics
Department of Biological Sciences
University of Alberta
© Nishka Kishore, 2015

ii
Abstract
When chemical inhibitors or mutations impair the standard mitochondrial electron
transport chain (sETC) in Neurospora crassa, alternative oxidase (AOX) is induced.
AOX transfers electrons directly from coenzyme Q to oxygen, thus bypassing the later
steps of the sETC. In N. crassa AOX is encoded by the nuclear aod-1 gene. Over the
years, some genes playing a role in the expression of AOX have been identified using
traditional genetic screens. More recently, the gene knockout (KO) library of N. crassa
was screened for mutants unable to grow in the presence of antimycin A (AA), an
inhibitor of Complex III of the sETC. AOX levels in such mutants were determined using
western blotting following growth in the presence of chloramphenicol (Cm, inhibitor of
mitochondrial translation).
Eight new mutants with severe AOX deficiencies were identified. As part of this
thesis, in an attempt to further characterize two of these strains, it was found that the
AOX deficiency in them could not be rescued by transformation with the wild-type gene
thought to be affected in each strain. This led to a detailed analysis of all eight AOX
deficient KO mutants. PCR amplification analysis, Southern blotting and crossing the KO
mutants with wild-type strains suggested the presence of additional secondary random
mutation(s), in the genome of seven of the eight KO mutant strains tested. Sequencing
the aod-1 gene from the remaining seven strains suggested the presence of an identical
frame-shift mutation in the coding region of the aod-1 gene in two of these KO strains.
This frame-shift leads to production of a truncated AOX protein due to the occurrence of
a premature stop codon. The other five KO strains have a wild-type aod-1 gene. Thus,
they likely carry secondary mutation(s) in a regulatory gene for AOX production.

iii
The KO mutant library screen also identified strains that showed very poor or no
growth in the presence of AA but had virtually normal levels of AOX protein under Cm
inducing conditions. The proteins affected in these mutants were thought to play a role in
assembly of AOX into a functional protein or its insertion into the MIM. As part of this
thesis, five such KO strains were tested by carbonate extraction to determine the
possibility of aberrant membrane association of AOX in these mutants. No conclusions
could be reached based on these experiments.

iv
Acknowledgements
I would like to express my sincere gratitude to my supervisor Dr. Frank Nargang for
his guidance, encouragement and constant support throughout the course of my degree.
I am grateful to my examination committee, Dr. Martin Srayko, Dr. John Locke and
Dr. Andrew Waskiewicz for their valuable time and support. I am also grateful to Dr.
John Locke for providing me with positively charged nylon membrane for Southern
blotting, Dr.Richard Rachubinski and late Mr. Rick Poirier (former lab technician in the
Rachubinski lab) for help with cytochrome spectra generation and analysis, Dr. Kirst
King-Jones for granting me access to the RT-PCR machine and members of the King-
Jones lab for their technical insights and support.
I would also like to thank the past and present members of the Nargang lab including
Zhigang Qi, Natasa Bosnjak, Sebastian Lakey, Beau Desaulniers and Jeremy Wideman
for their advice and technical assistance. Special thanks to Kelly Adames for designing
several plasmids that I used throughout my study. I am extremely thankful to Kelly
Adames and Annie Wong for helping me out and training me when I was new to the lab.
I would also like to thank the staff at the Molecular Biology Services Unit (MBSU)
including Cheryl Nargang, Sophie Dang and Troy Locke for all their help and technical
assistance.
I would like to acknowledge my entire family including, my father Deepak Kishore,
mother, Vibha Kishore, sister Vartika Kishore and brother-in-law Harshit Jaiswal for
always supporting me, encouraging me and motivating me to perform to the best of my
abilities. I would also like to express my sincere gratitude to all my friends, who were my
family away from home, and were always there for me through good times and bad.

v
Table of Contents
Abstract ............................................................................................................................... ii
Acknowledgements ............................................................................................................ iv
List of Figures .................................................................................................................. viii
List of Tables ...................................................................................................................... x
List of Abbreviations ......................................................................................................... xi
Chapter 1: Introduction ....................................................................................................... 1
1.1 Mitochondrial structure, morphology and dynamics ................................................ 1
1.2 Mitochondrial origin ............................................................................................ 6
1.3 Mitochondrial DNA .................................................................................................. 8
1.4 Mitochondrial functions ....................................................................................... 9
1.5 Role of mitochondria in aging and disease ............................................................. 16
1.6 Mitochondrial protein import .................................................................................. 18
1.7 Mitochondria and cellular signaling ........................................................................ 21
1.8 Mitochondrial retrograde regulation .................................................................. 22
1.9 Alternative oxidase (AOX) ..................................................................................... 26
1.9.1 Taxonomic distribution of AOX ...................................................................... 27
1.9.2 Structure of AOX ............................................................................................. 30
1.9.3 Functions of AOX ............................................................................................ 34
1.9.4 Regulation of AOX transcription ..................................................................... 37
1.9.5 Post-translational regulation of AOX ............................................................... 41
1.10 Neurospora crassa AOX ....................................................................................... 43
1.10.1 Knockout mutant library screening ................................................................ 48
1.11 Objective of this study .......................................................................................... 51
References ..................................................................................................................... 54
Chapter 2: Materials and Methods .................................................................................... 73
2.1 Growth of N. crassa strains ..................................................................................... 73
2.2 Growth rate measurements ...................................................................................... 79
2.3 Mitochondrial isolation ........................................................................................... 79
2.4 Isolation of whole cell extracts ............................................................................... 79

vi
2.5 Growth of E. coli cells, transformation of competent E. coli cells and plasmid DNA
isolations ....................................................................................................................... 80
2.6 Agarose gel electrophoresis and isolation of DNA from gels ................................. 80
2.7 Ethanol precipitation of DNA ................................................................................. 81
2.8 PCR amplification and mutagenesis ....................................................................... 81
2.9 Genomic DNA isolation .......................................................................................... 81
2.10 Genetic crosses and isolation of progeny .............................................................. 83
2.11 Southern blotting and hybridization ...................................................................... 84
2.12 SDS-PAGE (sodium dodecyl sulfate - polyacrylaminde gel electrophoresis) and
western blotting ............................................................................................................. 85
2.13 Carbonate extraction ............................................................................................. 86
2.14 Cytochrome spectra ............................................................................................... 87
2.15 Transformation of N. crassa by electroporation and purification of transformants
....................................................................................................................................... 87
2.16 Spot growth tests ................................................................................................... 88
2.17 DNA Sequencing and analysis of sequencing data ............................................... 88
2.18 RNA isolation, cDNA synthesis and qPCR .......................................................... 88
2.19 PCR analysis of KO strains ................................................................................... 89
2.20 Cloning of NCU08887 (NcMFS) and NCU01542 (NcHbrB) .............................. 91
2.21 Plasmids and oligonucleotides .............................................................................. 92
References ................................................................................................................... 109
Chapter 3: Results ........................................................................................................... 110
3.1 Analysis of possible assembly mutants ................................................................. 110
3.1.1 Preliminary tests to confirm phenotypes of possible assembly mutants ........ 110
3.2 Study of class I KO mutant strains ........................................................................ 116
3.2.1 The NCU08887 hypothetical protein (NcMFS) contains a major facilitator
superfamily (MFS) domain ..................................................................................... 120
3.2.1.1 Cytochrome spectra analysis of mutant 23H2 (KO-NcMFS)........... 121
3.2.1.2 Inability to rescue KO mutant 23H2 (KO-NcMFS) ......................... 123
3.2.1.5 aod-1 transcript levels in mutant 23H2 (KO-NcMFS) ..................... 131

vii
3.2.1.4 Expression of NcMFS....................................................................... 131
3.2.2 NCU01542 (NcHbrB): Hypothetical protein, with an HbrB domain ............. 131
3.2.2.2 Gene rescue using tagged NcHbrB ................................................... 134
3.2.2.3 Inability to rescue KO mutant 88H8 (KO-NcHbrB) ........................ 140
3.2.2.5 aod-1 transcript levels in mutant 88H8 (KO-NcHbrB) .................... 144
3.2.3 Verifying the integrity of eight AOX deficient mutant strains ....................... 144
3.2.3.1 Verification of predicted gene KO by PCR analysis ........................ 146
3.2.3.2 Genetic analysis of the AOX deficient KO strains ........................... 146
3.2.3.3 Southern blot analysis of the eight KO mutant strains analyzed ...... 150
3.2.3.4 Mutant aod-1 gene in strains 23H2 (KO-NcMFS) and 88H8 (KO-
NcHbrB) ............................................................................................................... 160
References ................................................................................................................... 168
Chapter 4: Discussion ..................................................................................................... 170
4.1 Analysis of possible assembly mutants ................................................................. 170
4.2 AA and Cm: chemical inducers of AOX .............................................................. 177
4.3 Class 1 knockout mutant strain analysis ............................................................... 180
References ................................................................................................................... 189

viii
List of Figures
Figure 1. Mitochondrial structure and subcompartmentalization………………………...2
Figure 2. Basic schematic of the Krebs cycle……...…………………………………….10
Figure 3. The Electron Transport chain and ATP Synthase……………………..……...14
Figure 4: AOX in the the sETC……………………..…………………………………...28
Figure 5. General features of the structural model of AOX……………….………...…..32
Figure 6. Current model of N. crassa AOX regulation…….……………………………49
Figure 7. Generalized schematic of primer design strategy for KO mutant
verification…………………………………………………………….……………........90
Figure 8. AOX levels in strains selected for analysis of AOX assembly………..…..…113
Figure 9. Basic schematic of carbonate extraction……………………………………..114
Figure 10. Carbonate extractions of putative assembly mutants……………….………117
Figure 11. Inconsistencies in carbonate extract results for strain 13G11………………119
Figure 12. Hydropathy analysis of the NcMFS protein………………………………..122
Figure 13. Cytochrome spectra of 23H2 (KO-NcMFS)………...…..…………….……124
Figure 14. Cloning strategy for NcMFS gene…..……………………………….……...125
Figure 15. Growth of N-Myc tagged NcMFS transformants……………………...…...128
Figure 16. Growth of C-HA tagged NcMFS transformants…………………….……...129
Figure 17. Examination of transformants for expression of tagged protein…………...130
Figure 18. Transcript levels of the aod-1 gene in mutant 23H2 (KO-NcMFS)….….…132
Figure 19. Transcription of NcMFS gene…..……………………………….……....….133
Figure 20. Initial cloning strategy for NcHbrB gene…. …………………………….…135
Figure 21. Alignment of NcHbrB from various fungal species……….………….….....137

ix
Figure 22. RNA-seq data for NcHbrB gene………………………………..….....….....141
Figure 23. Cloning strategy for assembling predicted complete NcHbrB gene……......142
Figure 24. Transcript levels of the aod-1 gene in mutant 88H8 (KO-NcHbrB) ……….145
Figure 25. Primer design strategy for KO mutants to be verified by PCR analysis........147
Figure 26. PCR amplification products for strains 41G7, 83H3, 52D8 and 47H10…...148
Figure 27. PCR amplification products for 40E6, 113G8, 23H2 and 88H8…………...149
Figure 28. Predicted cosegregation of hygromycin resistance and AA sensitivity
(AntAS) ………………………………………………………………………………...151
Figure 29. Schematic representation of Southern blot strategy………………………..153
Figure 30. Southern blot analysis for six class 1 KO strains…………………………..156
Figure 31. Southern blot analysis for two class 1 KO strains………………………….158
Figure 32. Sequencing strategy for the aod-1, aod-2 and aod-5 genes………………..162
Figure 33. Nucleotide and protein sequence of the N. crassa aod-1 gene coding
region in wild-type and mutants 23H2 (KO-NcMFS) and 88H8 (KO-NcHbrB)….…..164
Figure 34. Position of insertion in the aod-1 gene in mutants 23H2 (KO-NcMFS)
and 88H8(KO-NcHbrB)….…..………………………………………....………….…167
Figure 35. Possible mechanisms for AOX assembly into the MIM…………………...171
Figure 36. Possible mechanism of action of AA and Cm…………………………......181

x
List of Tables
Table 1. NCU numbers and gene product information for the eight mutants with
severe AOX deficiencies………....…...……………………….………………….…….52
Table 2. NCU numbers and gene product information for possible assembly mutants...53
Table 3. Strains used for the duration of this study………………………………….....74
Table 4. List of plasmids used in this study…………………………………………….93
Table 5. Oligonucleotides relevant to this study………………………………………..96
Table 6. Growth test data for possible KO assembly mutant strains and the wild
type control………………………………………………………………………….….111
Table 7. Cross progeny analysis……………………………………………………..…152
Table 8. Restriction enzymes used for Southern blots………………………………...155
xi
List of Abbreviations
∆ deletion
°C degree Celsius
µg microgram
µL microliter
µm micrometer
A adenine or alanine
AA antimycin A
AMP adenosine monophosphate
Amp ampicillin
AmpR ampicillin resistance
AOX alternative oxidase
ATP adenosine triphosphate
Bm bleomycin
BmR
bleomycin resistance (conferred by the ble gene)
C cytosine
cDNA complementary DNA
cfu colony forming units
CJ cristae junction
cm centimeter
Cm chloramphenicol
CM cristae membrane
CoQ coenzyme Q/ ubiquinone
Cys cysteine
dH2O distilled water
DIC differential interference contrast
DNA deoxiribonucleic acid
E glutamic acid
FADH2 flavin adenine dinucleotide
g gram(s)
G guanine

xii
GFP green fluorescent protein
GMP guanosine monophosphate
GTP guanosine triphosphate
H histidine
HA hemaglutinin
hr hour(s)
HygR hygromycin resistance (conferred by the hph gene)
IBM inner boundary membrane
IMS intermembrane space region
Kb kilobasepair(s)
kDa kilodalton(s)
KO knockout
L liter
LB luria Bertani medium
M molar
MBSU molecular biology services unit
mg microgram(s)
MICOS mitochondrial contact site and cristae organizing system
MIM mitochondrial inner membrane
min minute(s)
mL milliliter
mM millimolar
MMP mitochondrial membrane potential
MOM mitochondrial outer membrane
MOPS 4-morpholinepropanesulfonic acid
mRNA messenger RNA
mtDNA mitochondrial DNA
NaCO3 sodium carbonate
NADH nicotinamide adenine dinucleotide reduced form
ng nanogram(s)
nM nanomolar

xiii
PAGE polyacrylaminde gel electrophoresis
PCR polymerase chain reaction
PMSF phenylmethylsulfonyl fluoride
qPCR quantitative real time PCR
RNA ribonucleic acid
RNAase ribonuclease
rRNA ribosomal RNA
RT-PCR reverse transcriptase PCR
SDS sodium dodecyl sulfate
sETC standard electron transport chain
T thymine
TCA cycle tricarboxylic acid cycle
TCA Trichloroacetic acid
TIM translocase of the inner membrane
TMD transmembrane domain
TOM translocase of the outer membrane
tRNA transfer RNA
VSuTB Vogel’s sucrose medium

1
Chapter 1: Introduction
1.1 Mitochondrial structure, morphology and dynamics
Mitochondria are multifunctional organelles found in almost all eukaryotic cells.
Although mitochondria vary in size, depending on cell type and physiological conditions,
they generally have a diameter of 0.5-1µm (GRIPARIC and VAN DER BLIEK 2001). They
are made up of two membranes, termed the mitochondrial inner membrane (MIM) and
the mitochondrial outer membrane (MOM). The existence of the two membranes divides
the mitochondria into four functionally distinct regions: the MIM, MOM, the
intermembrane space region (IMS) and the matrix.
The MIM is a highly convoluted structure and forms invaginations called cristae.
The MIM can be further subdivided into the inner boundary membrane (IBM) and the
cristae membrane (ZICK et al. 2009). The IBM is the part of the MIM that is in parallel to
the outer membrane while the MIM that forms the cristae is known as the cristae
membrane (CM). The composition of these two forms of the MIM is known to differ
(VAN DER LAAN et al. 2012). The outer membrane and the inner membrane also form
contact sites (CSs). These are regions where the two membranes are in close proximity to
each other. These contact regions are thought to facilitate protein import. The
translocases of the MOM and MIM, the TOM (translocase of the outer membrane) and
TIM23 (translocase of the inner membrane) complexes respectively, seem to be in close
contact at these sites (LOGAN 2006; VAN DER LAAN et al. 2012; PFANNER et al. 2014).
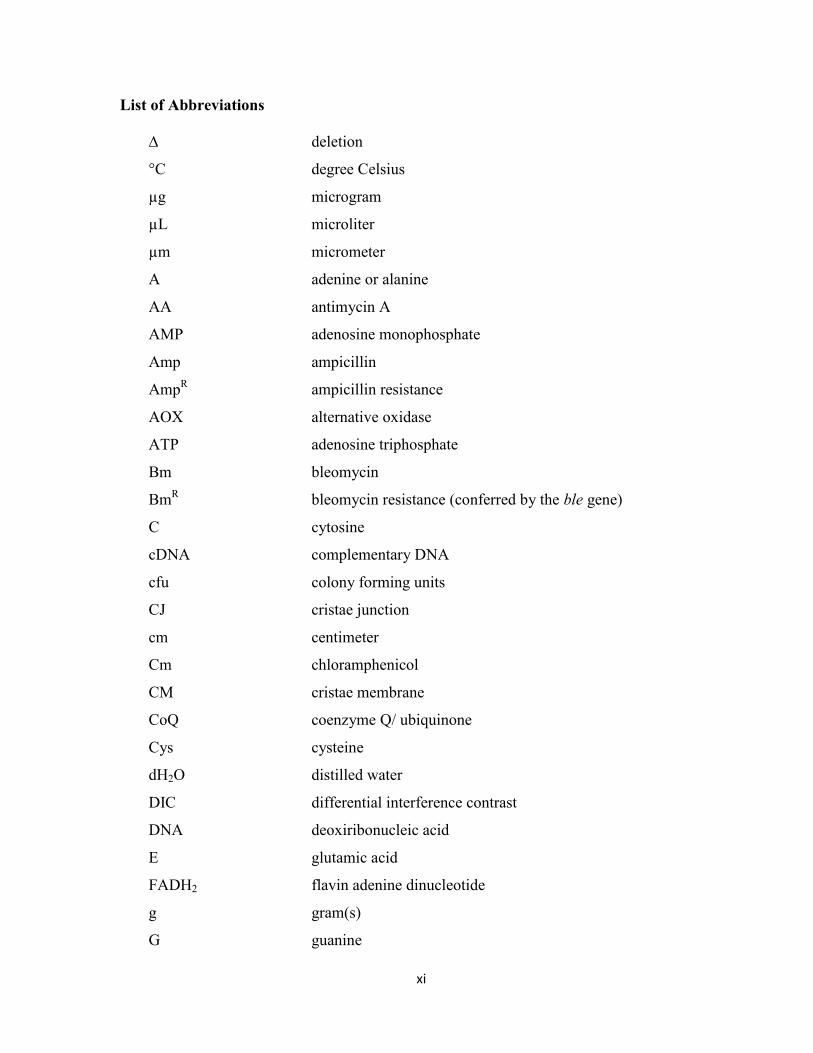
These features are shown in Fig. 1.
2
Figure 1. Mitochondrial structure and subcompartmentalization. The presence of
two membranes divides the mitochondria into four sub-compartments: the MOM, the
MIM, the IMS and the matrix. The MIM is further subdivided into the IBM and the CM.
The cristae are connected to the IBM via narrow tubular regions called the CJs. The
MOM and the MIM also form regions of close proximity termed contact sites. The TOM
and TIM23 complexes seem to be in close contact at these sites facilitating efficient
transport of precursor proteins into the mitochondria.

3
Electron microscopy images have revealed that cristae are not merely wide in-
foldings or invaginations of the MIM (as proposed by the ‘baffle model’), but are
microcompartments that are connected to the IBM via narrow tubular regions termed
cristae junctions (CJs) (LOGAN 2006; MANNELLA 2008). One proposed functional
consequence of the cristae junction is that these narrow tubular regions may limit
metabolite diffusion into and out of the cristae thus playing a regulatory role in certain
mitochondrial processes (MANNELLA 2006; ZICK et al. 2009; HERRMANN and RIEMER
2010).
A highly conserved (from yeast to humans) hetero-oligomeric protein complex of the
MIM, the mitochondrial contact site and cristae organizing system (MICOS) complex
(PFANNER et al. 2014), exists predominantly at the CJs. The complex has been shown to
play a role in formation and maintenance of CSs and maintenance of CJs (MUN et al.
2010; HARNER et al. 2011; HEAD et al. 2011; HERRMANN 2011; HOPPINS et al. 2011;
VON DER MALSBURG et al. 2011; PFANNER et al. 2014; HORVATH et al. 2015). The
MICOS complex has also been shown to interact with proteins and protein complexes of
the MOM (HARNER et al. 2011; HOPPINS et al. 2011; KÖRNER et al. 2012; ZERBES et al.
2012; PFANNER et al. 2014; HORVATH et al. 2015).
The MOM houses protein complexes, such as the TOM complex, that play an
important role in import of nuclear encoded mitochondrial proteins into the mitochondria
(GELLERICH et al. 2000; SCHMITT et al. 2006; LISTER et al. 2007; BECKER et al. 2009;
ENDO and YAMANO 2010; DUDEK et al. 2013). Other proteins embedded in the MOM are
involved in maintenance of mitochondrial morphology, lipid homeostasis, apoptosis,
fission and fusion processes and in the transport of metabolites into the mitochondria

4
(KORNMANN and WALTER 2010; FRIEDMAN et al. 2011; LINDSAY et al. 2011; OSMAN et
al. 2011; MISHRA and CHAN 2014). The inner membrane (MIM) is a protein rich
compartment, housing proteins known to play a role in protein import, such as the TIM23
complex (enriched in the IBM), components of the respiratory chain and ATP synthase
(enriched in the CM), and many proteins involved in transport of metabolites (BECKER et
al. 2009). The intermembrane space contains several soluble proteins. This compartment
includes proteins involved in shuttling MIM or matrix targeted proteins to the import
machinery of the MIM, proteins involved in exchange of metals and proteins that play a
role in lipid homeostasis or exchange of lipids between the mitochondrial membranes
(HERRMANN and RIEMER 2010; AFRODITI and KOSTAS 2013). The IMS also houses
Mia40 and Erv1 which are involved in the disulfide relay system for import of a
structurally related class of proteins into the IMS (HERRMANN and RIEMER 2012). The
mitochondrial matrix is the site of several important metabolic processes such as the
citric acid cycle. The matrix also harbors the mtDNA (mitochondrial DNA) and
mitochondrial ribosomes as well as the enzymes involved in transcription and translation
of mtDNA genes (GRIFFITHS et al. 1995).
Mitochondria are highly dynamic organelles and undergo constant fusion, fission
and movement along the cytoskeletal network. These dynamic changes are influenced by
the cell type, the metabolic state of the cell and the organelle, and by environmental
conditions (VAN DER BLIEK et al. 2013).
Fusion of mitochondria and formation of large interconnected networks seems to be
important in cells that have a high demand for ATP (i.e. metabolically active cells).
Fused mitochondria also seem to play a role in calcium signaling and in mixing contents

5
of mitochondria, which may be beneficial in alleviating errors caused by accumulating
mtDNA damage in certain mitochondria (WESTERMANN 2008). Mitochondrial fission on
the other hand seems to play a role in apoptosis, as prior to cytochrome c release,
mitochondria in the cell appear to undergo rapid fragmentation by fission (YOULE and
KARBOWSKI 2005).
A delicate balance between biogenesis, fission and fusion determines the number,
size and shape of mitochondria in a cell. If this balance is perturbed the mitochondria can
become fragmented (if fusion is reduced) or can become highly fused and form
elongated, interconnected networks (if fission is reduced) (CHAN 2006; BERMAN et al.
2008; WESTERMANN 2008; CHAN 2012). Defects in fission or fusion proteins have been
linked to human diseases and lethality during gestation in knockout mice (CHEN and
CHAN 2010; CHAN 2012).
Mitochondria move throughout the cell and interact with each other (via fission and
fusion) using the cytoskeletal elements and their associated motor proteins in the cell
(BOLDOGH and PON 2007). Association of mitochondria to the cytoskeletal elements is
also important for efficient inheritance of mitochondria by daughter cells. The inheritance
of mitochondria by daughter cells has been studied in great detail in the budding yeast
Saccharomyces cerevisiae and actin microfilaments seem to play a major role in this
process. Mitochondria in this budding yeast appear to move in an anterograde (movement
towards the developing bud) and a retrograde manner (movement towards the mother
cell) (FREDERICK and SHAW 2007; WU et al. 2013) .
Microtubules play a major role in the movement of mitochondria in fission yeasts, in
pollen tubes (in higher plants), neurons and also in filamentous fungi (FREDERICK and

6
SHAW 2007). Microtubule-associated motor proteins, kinesins and dyneins are involved
in movement of mitochondria along the microtubules (SAXTON and HOLLENBECK 2012;
MISHRA and CHAN 2014). Kinesins help transport mitochondria in an anterograde
fashion, whereas dyneins transport mitochondria in a retrograde manner. Several adaptor
and linker proteins have been proposed to be involved in mitochondrial motility along
cytoskeletal tracks.
1.2 Mitochondrial origin
The endosymbiotic origin of plastids was first speculated upon in 1905 by
Konstantin Mereschkowski. In 1923, Ivan Wallin proposed that mitochondria have
bacterial origins (WALLIN 1923; MARTIN and KOWALLIK 1999; MCINERNEY et al. 2014).
However, this idea that mitochondria have bacterial origins and the general theory of
endosymbiosis were not well accepted until the concepts were reintroduced by Lynn
Margulis in 1967 (SAGAN 1967; MARGULIS 1970; ARCHIBALD 2011).
It is now well accepted that mitochondria originated from an endosymbiotic
relationship between a bacterium and a host cell more than 1.5 billion years ago (DYALL
et al. 2004; GROSS and BHATTACHARYA 2009; MCINERNEY et al. 2014). Various lines of
evidence support the theory that the mitochondrial ancestor was most likely an α-
proteobacterium. Sequencing data for the large and small subunit rRNAs from several
eukaryotic mitochondrial and bacterial species, suggests that ancestors of the
mitochondria probably originated from the order Rickettsiales within the α-
proteobacterium class of bacteria (YANG et al. 1985; GRAY 2012). In addition, the
lifestyle of several α-proteobacterium species suggests possible mechanisms that led to
their acquisition as mitochondria. The class α-proteobacteria consists of several species
7
that form intracellular associations with several simple and complex eukaryotes (BATUT
et al. 2004). An unusual example of such an interaction is the association of Holospora
obtuse with a Paramecium. The endosymbiont migrates into the macronucleus of the
Paramecium and once it has multiplied and matured it leaves the host cell without
causing any apparent damage to the cell (LANG 2014). Just as in mitochondria, several
Rickettsiales species have undergone reductive genome evolution, or loss of genes over
evolutionary time, further supporting the idea that the mitochondrial ancestor was most
likely an α-proteobacterium (BATUT et al. 2004). In case of the mitochondria, genes
encoded originally by the ancestral mitochondrial endosymbiont are believed to have
been transferred to the nucleus by EGT (endosymbiotic gene transfer) (TIMMIS et al.
2004; O’MALLEY 2010)).
Although the idea of mitochondria originating from an α-proteobacterial
endosymbiont is widely accepted, the nature of the host, the nature of the association
between host and endosymbiont, and the timeline of the transition of this endosymbiotic
cell into a eukaryote is still unclear and highly debated (O’MALLEY 2010; VAN DER
GIEZEN 2011; MCINERNEY et al. 2014). Many hypotheses have been suggested to explain
the evolution of eukaryotes. These include the ‘three domain hypothesis’ which suggests
that eukaryotes, eubacteria and archaebacteria are monophyletic lineages with the
eukaryotes and archaebacteria sharing a common ancestor (WOESE 1987; MCINERNEY et
al. 2014). Another hypothesis proposed by LAKE et al. (1984) called the ‘eocyte
hypothesis’ suggests that eukaryotes evolved from a branch of archaebacteria called
eocytes (MCINERNEY et al. 2014). RIVERA and LAKE (2004) further postulated the ‘ring
of life hypothesis’ which suggests that eukaryotes arose from the merger of a

8
eubacterium with an eocyte. Several lines of evidence, including the observation that the
eukaryotic nuclear genome appears to be a mix of genes having both archaebacterial and
bacterial origin (RIBEIRO and GOLDING 1998; ANDERSSON 2013; MCINERNEY et al.
2014), point towards eukaryogenesis resulting from the merger of two prokaryotes.
However, debate on the nature and origin of the first eukaryote continues (MCINERNEY et
al. 2014).
1.3 Mitochondrial DNA
Mitochondria contain their own DNA called mitochondrial DNA (mtDNA). The
mtDNA of all eukaryotes seems to encode two categories of products. The first are genes
that play a role in protein synthesis machinery of the mitochondria (e.g., tRNA genes and
mitochondrial rRNA genes). The second category includes genes for proteins that are
subunits of the complexes of the oxidative phosphorylation process (SACCONE 2011).
mtDNA in most species is a circular double stranded molecule, but several species
containing other mtDNA organizations have also been observed. These genome
organizations include single or multiple linear chromosomes. Examples of organisms
possessing a single linear mtDNA molecule include some fungi, apicomplexans, most
ciliates and many cnidarians (BURGER et al. 2003; SACCONE 2011; BERNT et al. 2013).
mtDNA in the fungus Spizellomyces punctatus and the animal species Globodera and
Dicyema exists as a population of multiple circular DNA molecules with different
circular molecules encoding a different set of mitochondrial proteins (WATANABE et al.
1999; ARMSTRONG et al. 2000; BURGER et al. 2003; BURGER and LANG 2003). Other
organisms (e.g. trypanosomatid parasites) have been observed to possess both maxi and
mini circular molecules (BURGER et al. 2003). Trypanosomatid mtDNA is called

9
kinetoplastid DNA (kDNA) and is a network of topologically interlocked maxi circles
(encoding typical mitochondrial proteins and rRNA, but not tRNA) and mini circles
(encoding guide RNAs that play a role in editing maxicircle mRNAs) (SHAPIRO and
ENGLUND 1995; MORRIS et al. 2001; SHLOMAI 2004).
The size of the mitochondrial genome varies considerably among eukaryotes. The
average mtDNA molecule is about 15-60 Kb depending on the organism (BURGER et al.
2003). However, the possible range in size of the mitochondrial genome is large. For
example, that of Plasmodium falciparum is only 6 Kb while that of many land plants
approaches 1 Mb (ROUSSEAU-GUEUTIN et al. 2012; BERNT et al. 2013). The average size
of fungal mtDNA ranges from 18-175 Kb (BURGER et al. 2003). Neurospora crassa
contains a single circular 64,840 bp mtDNA molecule that encodes 28 proteins, 28 tRNA
molecules and 2 rRNA molecules (BORKOVICH et al. 2004; MCCLUSKEY 2012).
1.4 Mitochondrial functions
Mitochondria are most notably known for the role they play in the production of
energy in the form of ATP by the process of oxidative phosphorylation. Most of the
substrates for this process are produced via the Krebs cycle.
The Krebs cycle (also known as the citric acid cycle or the tricarboxylic acid (TCA)
cycle) takes place in the mitochondrial matrix. Acetyl-CoA generated by glycolysis, β-
oxidation of fatty acids or breakdown of certain amino acids undergoes condensation
with oxaloacetate (OAA) to generate citrate (OSELLAME et al. 2012). The Krebs cycle
proceeds through several oxidation steps that lead to carbon dioxide production,
regeneration of OAA, production of electron donors NADH+H+ and FADH2, and
phosphorylation of GDP to GTP (Fig. 2). Some Krebs cycle intermediates can serve as
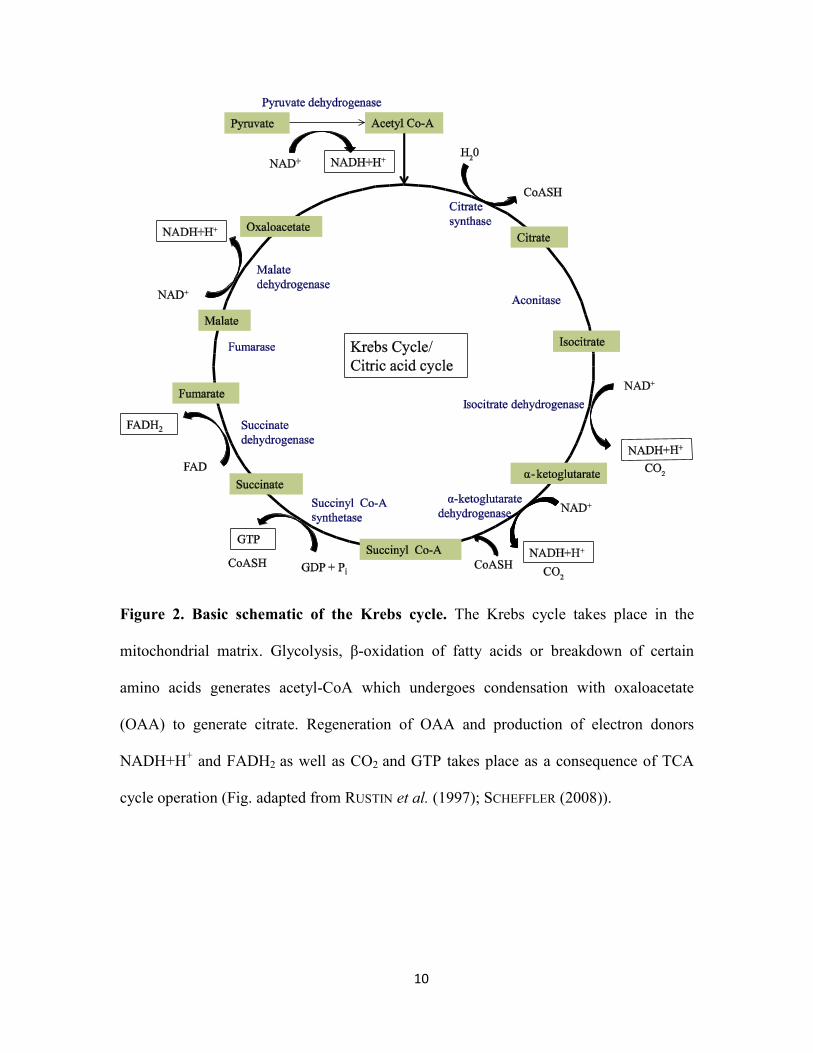
10
Figure 2. Basic schematic of the Krebs cycle. The Krebs cycle takes place in the
mitochondrial matrix. Glycolysis, β-oxidation of fatty acids or breakdown of certain
amino acids generates acetyl-CoA which undergoes condensation with oxaloacetate
(OAA) to generate citrate. Regeneration of OAA and production of electron donors
NADH+H+ and FADH2 as well as CO2 and GTP takes place as a consequence of TCA
cycle operation (Fig. adapted from RUSTIN et al. (1997); SCHEFFLER (2008)).

11
building blocks for synthesis of amino acids, fatty acids and glucose (OWEN et al. 2002;
SWEETLOVE et al. 2010).
Oxidative phosphorylation is the process whereby electron transfer is coupled to the
establishment of a chemiosmotic gradient of protons that leads to production of ATP in
the mitochondria (SCHULTZ and CHAN 2001; LENAZ and GENOVA 2010; PAPA et al.
2012; GENOVA 2014). The Krebs cycle and glycolysis generate NADH+H+ and FADH2
molecules that act as electron donors for the standard electron transport chain (sETC).
Under normal conditions, the reduced electron carriers NADH+H+ and FADH2, donate
electrons to complex I (NADH-ubiquinone oxidoreductase) and complex II (succinate-
ubiquinone oxidoreductase) of the electron transport chain, respectively. These electrons
then travel via the sETC in sequence to ubiquinone, complex III (ubiquinol-cytochrome c
oxidoreductase), cytochrome c, complex IV (cytochrome c oxidase), and the terminal
electron acceptor, molecular oxygen. During electron transfer, complexes I, III and IV
pump protons from the matrix to the IMS. The chemisomotic gradient thus generated is
harnessed by the F0F1 ATP synthase for ATP production.
Apart from the standard NADH-ubiquinone oxidoreductase (complex I), plants,
fungi and a few metazoan species (MATUS-ORTEGA et al. 2011) also possess alternative
NADH dehydrogenases (JOSEPH-HORNE et al. 2001; RASMUSSON et al. 2004; LENAZ and
GENOVA 2010). These MIM proteins can be internal (catalyzing the oxidation of NADH
from the mitochondrial matrix side) or external (catalyze the oxidation of NADH from
the IMS). They transfer electrons from NADH+H+
to ubiquinone but are not involved in
proton pumping across the MIM. S. cerevisiae lacks complex I of the respiratory chain
and thus in this yeast electron transfer from NADH+H+
to ubiquinone takes place solely

12
via one internal and two external alternative NADH dehydrogenases (LUTTIK et al. 1998;
SMALL and MCALISTER-HENN 1998). One internal and three external alternative NADH
dehydrogenases have been identified in Neurospora crassa (CARNEIRO et al. 2007).
Complexes of the sETC and ATP synthase are not arranged in the MIM as randomly
dispersed components, as proposed by the ‘random diffusion model’, (HACKENBROCK et
al. 1986; LENAZ and GENOVA 2012) but are organized into distinct dynamic
supercomplexes. Evidence for the existence of sETC supercomplexes came from electron
microscopy and BN-PAGE (blue native polyacrylamide gel electrophoresis) analysis of
mitochondria from organisms belonging to different eukaryotic kingdoms (CHABAN et al.
2014). Four groups of supercomplexes have been identified thus far, including: I + III2,
III2 + IV 1-2, I + III2 + IV 1-4 and ATP synthase dimers (CHABAN et al. 2014). Fungi have
an abundance of the III2 + IV2 type supercomplex (HEINEMEYER et al. 2007; CHABAN et
al. 2014). The presence of the I-III-IV type and III-IV type supercomplexes has been
observed in N. crassa along with complex I dimers (MARQUES et al. 2007). One
suggested function of these complexes is the efficient transfer of electrons from one
complex to another which minimizes the chances of loss of electrons and formation of
ROS (reactive oxygen species) (CHABAN et al. 2014). Formation of ATP synthase dimers
has been suggested to play a role in maintaining cristae morphology by locally bending
cristae membranes (STRAUSS et al. 2008).
Mitochondria are also involved in maintenance of cellular iron homeostasis and in
the assembly of iron-sulfur clusters and heme molecules (AJIOKA et al. 2006; STEHLING
and LILL 2013; MALLIKARJUN et al. 2014). Heme is an important prosthetic group found
in proteins like hemoglobin, cytochromes and myoglobin. The biosynthesis of heme

13
occurs in eight steps, some of which occur in the mitochondria (AJIOKA et al. 2006;
CHIABRANDO et al. 2014). Iron-sulfur clusters biogenesis takes place within the
mitochondria. These protein co-factors are important components of several proteins of
the mitochondria, cytosol and the nucleus and play an important role in regulatory and
catalytic processes, as well as in electron transfer reactions (LILL 2009; STEHLING and
LILL 2013). The mechanism and components for the biosynthesis and assembly of iron-
sulfur clusters seem to be highly conserved from yeast to humans (STEHLING and LILL
2013; MAIO and ROUAULT 2014). Most components of the iron-sulfur cluster
biosynthesis and maturation pathways are essential for the viability of yeast and
mammalian cells (LILL 2009; MAIO and ROUAULT 2014).
Mitochondria also play an important role in cellular calcium homeostasis. Calcium ions
are essential for several processes such as muscle contraction, mitochondrial metabolism,
cell differentiation, fertilization and proliferation (BERRIDGE et al. 1998; CLAPHAM 2007;
RIZZUTO et al. 2012). It has been demonstrated that a rise in cytosolic [Ca2+
] promotes
the uptake of calcium by the mitochondria via the mitochondrial calcium uniporter
(MCU) (CONTRERAS et al. 2010; OSELLAME et al. 2012; RIZZUTO et al. 2012). Calcium is
stored mainly in the endoplasmic reticulum (ER). The release of Ca2+
from the ER causes
microdomains of high Ca2+
concentrations at areas of close contact between the
mitochondria and the ER called MAMs (Mitochondria associated membranes, (MARCHI
et al. 2014)), following this the mitochondria imports Ca2+
into the matrix (RIZZUTO et al.
2012). The accumulation of calcium in the mitochondrial matrix helps in buffering local
and bulk calcium levels in the cytosol. Ca2+
can also indirectly increase ATP production
by activation of dehydrogenases in the matrix (specifically, isocitrate dehydrogenase,

14
H+
NADH+ H+
Complex I
NAD+
Complex II
FADH2
FAD + 2H+
CoQ
Complex III
H+
Cyt c
Complex IV
H+
4 H+ + O
2
2H2O
2e-
2e-
2e-
2e- 2e
-
MIM
IMS
Matrix
ATP
Synthase
H+
ATP
H+ H
+
ADP + Pi
Figure 3. The Electron Transport chain and ATP Synthase. Electrons from NADH +H+
and FADH2
are transferred via complex I
and complex II respectively to ubiquinone (coenzyme Q or CoQ). Complex III then transfers them to cytochrome c (Cyt c) and then
complex IV, which donates them to molecular oxygen. This movement of electrons is coupled to proton pumping (from the
mitochondrial matrix into the intermembrane space (IMS)) across complex I, III and IV creating a chemiosmotic gradient across the
MIM. This chemiosmotic gradient is harnessed by ATP synthase for ATP production.
14

15
pyruvate dehydrogenase and α-ketoglutarate dehydrogenase). When mitochondria
become overloaded with Ca2+
, cell death pathways may become activated (PIZZO et al.
2012; RIZZUTO et al. 2012).
Mitochondria are involved in the MPT (mitochondrial permeability transition)
dependent necrosis and also in apoptotic cell death pathways (GALLUZZI et al. 2014).
Necrosis can occur when the cell experiences severe stress which leads to MPT formation
in the MIM, in a cyclophilin D dependent manner (PARSONS and GREEN 2010; GALLUZZI
et al. 2014). Cyclophilin D is a mitochondrial protein belonging to the peptidyl prolyl-cis,
trans-isomerase family of proteins, thought to act as a regulator of MPT formation
(GUTIÉRREZ-AGUILAR and BAINES 2014). MPT formation leads to destabilization of
membrane potential which can further lead to matrix swelling and rupture of the MOM.
The mechanism of MPT formation is still poorly understood.
Intrinsic apoptosis (caused by internal cellular factors such as DNA damage) and
extrinsic apoptosis (activated when death receptors, such as Fas, associate with the
plasma membrane of a cell) in cells are brought about with the help of caspase signaling
(PARSONS and GREEN 2010; TAIT and GREEN 2010). Mitochondria play an essential role
in intrinsic apoptosis by releasing apoptogens like cytochrome c and SMAC/DIABLO
(second mitochondrial activator of caspases/ direct inhibitor of apoptosis-binding protein
with low pI) into the cytosol which can activate the caspase cascade and eventually leads
to cell death. The release of apoptogens into the cytosol is mediated by the formation of
MOMP (mitochondrial outer membrane permeabilization) (JÄGER and FEARNHEAD
2013). This is brought about by the pro-apoptotic factors Bak and Bax, members of the
Bcl-2 family, which reside on the MOM. Upon activation, these proteins form an

16
oligomer that creates holes in the MOM and leads to permeabilization of the MOM.
Caspase-independent cell death is induced by release of the apoptogen AIF (apoptosis
inducing factor) into the cytosol, which enters the nucleus and causes chromatin
condensation and DNA fragmentation (ZHU et al. 2007; JÄGER and FEARNHEAD 2013).
1.5 Role of mitochondria in aging and disease
Aging is a time-dependent degradative and degenerative process caused by
accumulated cellular damage, that eventual leads to death as a consequence of tissue
failure and cellular dysfunction (LEE and WEI 2012). Mitochondria have been implicated
in aging as proposed by the famous ‘mitochondrial free radical theory of aging’
(MFRTA). This theory suggests that ROS molecules (such as superoxide anions,
peroxynitrite anions, hydrogen peroxide and hydroxide ions) generated during transport
(mainly at complex I and complex III), are highly toxic and cause damage to various
cellular macromolecules which eventually leads to aging (BALABAN et al. 2005; MURPHY
2009; BRATIC et al. 2013). The MFRTA is supported by the findings that with age, there
is a decline in enzymes that scavenge ROS molecules and there is an increase in mtDNA
mutations (BRATIC et al. 2013). It has also been demonstrated by studies in several
models that mitochondrial number and morphology changes as cells age. This is
accompanied by an overall decline in mitochondrial functionality (LEE and WEI 2012).
However, the finding that ROS molecules can be important signaling molecules have
raised doubts about the role of ROS in aging and the MFRTA (COPELAND et al. 2009;
YANG and HEKIMI 2010).
That mtDNA mutations play a strong role in the aging process was suggested based
on studies using mtDNA mutator mice. These mice have homozygous knock-in

17
mutations causing expression of a proof reading deficient version of the catalytic subunit
of mtDNA polymerase (TRIFUNOVIC et al. 2004; BRATIC et al. 2013). As a consequence
these mice accumulate several different types of mtDNA mutations that lead to defects in
the respiratory chain subunits and premature aging phenotypes. (EDGAR et al. 2009).
Further investigations suggested that mutations in respiratory chain subunit genes caused
sETC dysfunction in somatic stem cells at an early stage during embryogenesis in these
mice (AHLQVIST et al. 2012).
Recently, mitochondrial derived peptides (MDPs), a newly identified set of
mitochondrial signals generated due to mitochondrial stress, have also been implicated in
lifespan extension (HILL and VAN REMMEN 2014). One example of a MDP is humanin,
which is a protein of possible mitochondrial origin (its origin is still poorly understood).
This protein appears to be released by human cells under stress conditions and plays a
role in suppressing apoptosis (LEE et al. 2013). Humanin is also present in human plasma
and has a neuroprotective role in mice model of diabetes (XU et al. 2006).
Several disorders arising from mutations in mtDNA are known to occur in humans.
They affect several different organs and can produce symptoms at any age with very
broad phenotypic variability (YLIKALLIO and SUOMALAINEN 2012). The progression of
several neurological diseases also seems to involve mitochondrial dysfunction, though
not necessarily due to mtDNA mutations. These include Parkinson’s disease
(KAZLAUSKAITE and MUQIT 2014), Huntington’s disease (DUAN 2013), Alzheimer’s
disease (CARLSON et al. 2013) and amyotrophic lateral sclerosis (COZZOLINO et al. 2013).
Several studies have also proposed the involvement of mitochondria in type 2 diabetes
mellitus due to an impairment of oxidative function and reduction in mitochondrial mass,

18
as observed in muscle tissues (KELLEY et al. 2002; PATTI and CORVERA 2010;
GOODPASTER 2013). Mitochondrial dysfunction and mtDNA mutations have also been
linked to carcinogenesis (TOKARZ and BLASIAK 2014).
1.6 Mitochondrial protein import
Based on large scale proteome analysis and other studies, it has been estimated that
mammalian mitochondria contain ~ 1100-1500 proteins (PAGLIARINI et al. 2008) whereas
yeast mitochondria house ~ 1000 proteins (REINDERS et al. 2006; MEISINGER et al. 2008).
Thus, given the small coding capacity of mtDNA (section 1.3) it is estimated that in most
eukaryotes ~ 1% of mitochondrial proteins are encoded by the mtDNA. The remaining ~
99% are encoded by the nuclear genome (SCHMIDT et al. 2010). These nuclear encoded
mitochondrial proteins are translated on cytosolic ribosomes as precursor proteins, and
are imported into the mitochondria via the mitochondrial import machinery (NEUPERT
and HERRMANN 2007; DUDEK et al. 2013). Import of precursors takes place both post-
translationally and co-translationally (YOGEV et al. 2007; LESNIK et al. 2014). Precursor
proteins are targeted to different sub compartments of the mitochondria based on the
import signals they carry (SCHMIDT et al. 2010). Most mitochondrial precursor proteins
contain a cleavable N-terminal targeting presequence. Some others, like the metabolite
carrier proteins (e.g. the ADP/ATP carrier, AAC) of the MIM contain internal import
signals that are not cleaved and are present in the coding region of the mature protein
(DUDEK et al. 2013; FERRAMOSCA and ZARA 2013).
Precursor proteins in the cytosol remain associated with chaperones (Hsc70, Hsp90
and other chaperones and co-chaperones) to prevent aggregation and misfolding (YOUNG
et al. 2003; BHANGOO et al. 2007). Almost all protein precursors (except some MOM

19
proteins with membrane spanning α helical domains) cross the MOM via interactions
with the translocase of the outer membrane (TOM) protein complex (DUDEK et al. 2013).
Once a precursor protein crosses the MOM, it can interact with several different
components of the import machinery depending on the import signal it contains. For
example, β-barrel proteins are found only in the MOM (PASCHEN et al. 2003) and they
are inserted from the IMS side. Once these proteins cross the MOM via the TOM
complex, they associate with the small Tim proteins in the IMS (DUDEK et al. 2013). The
β-barrel precursors are then transferred to the SAM complex (sorting and assembly
machinery) which folds and assembles the protein into the MOM (PASCHEN et al. 2003;
KUTIK et al. 2008). The insertion of MOM proteins with α-helical domains is catalyzed
by the interaction of the precursor proteins with the Mim1 protein (mitochondrial import
protein 1) on the outer surface of the MOM (BECKER et al. 2007; PAPIĆ et al. 2011;
HARBAUER et al. 2014).
Proteins that are inserted into the MIM are localized by one of two import pathways,
depending on their import signal. Some MIM proteins have an N-terminal, cleavable
presequence and use the TIM23 preprotein translocase complex (translocase of the inner
membrane, with Tim23 as the central pore component) (BAUER et al. 2000; DUDEK et al.
2013). The TOM complex and the TIM23 complex are in close proximity to each other at
the contact sites of the MIM and MOM and interact with each other via certain subunits
of each complex (CHACINSKA et al. 2003). MIM-destined presequence-containing
proteins pass through the TOM complex to the TIM23 complex, which can laterally
insert proteins into the MIM. This is done via a stop transfer mechanism that is activated
by hydrophobic transmembrane segment(s) present following the targeting signal in these

20
MIM-destined proteins (SCHMIDT et al. 2010; DUDEK et al. 2013). Precursors destined
for the matrix use a similar pathway. However these proteins contain no stop transfer
signal and continue through the TIM23 complex to the PAM (presequence translocase-
associated motor) which is associated with the TIM23 complex on the matrix side
(DUDEK et al. 2013). Association with PAM aids in translocation of proteins through the
MIM into the matrix. In the matrix the presequence is removed by the mitochondrial
processing peptidase (MPP). Other modifications of the precursor protein take place in
the matrix to ensure generation of a mature and properly folded mitochondrial protein
(MOSSMANN et al. 2012).
A second import pathway is used by MIM-destined precursors of the carrier protein
class. These proteins contain hydrophobic internal import signals and lack the N-terminal
presequence. These precursors pass through the MOM via the TOM complex and
associate with the small Tims in the IMS to prevent aggregation (KOEHLER et al. 1998;
DUDEK et al. 2013). They are then transferred to the TIM22 (translocase of the inner
membrane, with Tim22 as the core pore forming component) complex of the MIM
(GEBERT et al. 2008; DUDEK et al. 2013). The mechanisms of translocation across the
TIM22 complex and insertion of proteins into the MIM are not well understood processes
(SCHMIDT et al. 2010; DUDEK et al. 2013).
Proteins that are destined to be located in the IMS contain mitochondrial IMS sorting
signals (MISS) that are recognized by the Mia40 protein of the MIA (mitochondrial
intermembrane space assembly) machinery that operates the disulfide relay system
(DUDEK et al. 2013). Mia40 is an oxidoreductase and also serves as a receptor for
identification of IMS destined proteins (STOJANOVSKI et al. 2012). Mia40 forms transient
21
disulfide bonds with IMS destined precursor protein and then catalyzes the formation of
intramolecular disulfide bonds within the precursor protein, thereby acting like a protein
disulfide carrier (SCHMIDT et al. 2010; STOJANOVSKI et al. 2012). This creates mature
folded proteins of the IMS that cannot escape back out into the cytosol. Mia40 is then
reoxidized by the Erv1 protein which is a sulphhydryl oxidase that transfers electrons to
cytochrome c to achieve its own reoxidation (SCHMIDT et al. 2010).
1.7 Mitochondria and cellular signaling
Mitochondria play an essential role as signaling organelles. It is thought that one
reason for this is to prevent discrepancy between the metabolic demand of the cell and
the capacity of the mitochondria to meet those demands (CHANDEL 2014). One major
mechanism by which mitochondria take part in cellular signaling processes is by release
of ROS molecules. At low levels, mitochondrial ROS are involved in maintenance of
several biological processes such as oxygen sensing, autophagy, immune response,
hormone response and epigenetics (HAMANAKA and CHANDEL 2009; LI et al. 2011;
WEST et al. 2011; SCHROEDER et al. 2013). Slightly higher levels of ROS are involved
with activation of several stress response pathways, while very high levels of ROS lead to
cell death via apoptosis (CIRCU and AW 2010; RUNKEL et al. 2014). One example of ROS
acting as a signaling molecule comes from the observation that hydrogen peroxide can
oxidize cysteine residues within proteins causing allosteric changes that alter protein
function (FINKEL 2012; SCHIEBER and CHANDEL 2014).
Mitochondria also act as scaffolds for assembly of signaling complexes. It has been
demonstrated that A-kinase-anchoring proteins (AKAPs) tether to the MOM (SONG et al.
2007; TAYLOR et al. 2013). They associate with cAMP-dependent protein kinase A

22
(PKA) and help in PKA’s association to several signaling proteins, thus assembling a
signaling hub which brings about PKA dependent signaling within the mitochondria
(WONG and SCOTT 2004; FELICIELLO et al. 2005; CHANDEL 2014).
1.8 Mitochondrial retrograde regulation
Since the majority of mitochondrial proteins are encoded by the nuclear genome,
proper communication from the nucleus to the mitochondria (anterograde signaling) and
from the mitochondria to nucleus (retrograde signaling) is important to insure proper
organelle function and biogenesis (WOODSON and CHORY 2008). The nuclear genome
senses cellular and environmental cues and coordinates expression of nuclear encoded
mitochondrial genes as part of anterograde signaling. Mitochondria drive retrograde
regulation by conveying their metabolic and developmental status to the nucleus,
resulting in altered expression patterns of nuclear encoded mitochondrial proteins (LIU
and BUTOW 2006; BLANCO et al. 2014).
Mitochondrial retrograde signaling was first studied in detail in the budding yeast S.
cerevisiae, where a change in expression of several nuclear genes was observed in cells
lacking mtDNA (rho0) as compared to yeast cells with normal mtDNA (rho
+) (BUTOW
and AVADHANI 2004; LIU and BUTOW 2006; WOODSON and CHORY 2008; JAZWINSKI and
KRIETE 2012; JAZWINSKI 2013). It was initially found that when mitochondria of S.
cerevisiae became dysfunctional, the expression levels of the CIT2 gene (encoding the
peroxisomal isoform of citrate synthase) was upregulated by 30-fold or more, in
comparison to rho+ yeast cells, depending on the starting strains used (LIAO et al. 1991;
BUTOW and AVADHANI 2004). Upregulation of CIT2 is beneficial as it leads to enhanced
peroxisomal biogenesis and increased activity of the glyoxylate cycle, which enhances

23
citrate production (LIU and BUTOW 2006). Citrate is then transported into the
mitochondria where it ensures that the production of α-ketogutarate continues. The latter
molecule is important as a precursor to glutamate, which is an essential nitrogen donor
during biogenesis of amino acids and nucleotides in yeast cells. Upregulation of CIT2 in
rho0 cells occurs as a consequence of the disruption of the TCA cycle. The TCA cycle
cannot occur to completion in rho0 cells due to accumulation of NADH + H
+ and FADH2
and depletion of their oxidized forms, which act as substrates in the cycle (LIU and
BUTOW 2006). Thus, a retrograde signaling pathway is activated which enhances
transcription of several genes involved in metabolism and stress response, one of which
is the CIT2 gene (EPSTEIN et al. 2001; TRAVEN et al. 2001).
The upregulation of CIT2 and other retrograde responsive genes in S. cerevisiae is
controlled by the retrograde response genes (RTG) rtg1 and rtg3, which require the
activity of the rtg2 gene for proper functioning (LIAO and BUTOW 1993; JIA et al. 1997;
JAZWINSKI and KRIETE 2012). RTG1 and RTG3 are basic helix-loop-helix leucine zipper
family transcription factor proteins that form a heterodimer (JIA et al. 1997). Under
normal conditions, this heterodimer remains localized in the cytosol with RTG3
phosphorylated at multiple sites. Under conditions that lead to retrograde signaling, the
RTG2 protein, which possesses phosphatase activity, partially dephosphorylates RTG3.
This leads to the nuclear translocation of the RTG1-RTG3 heterodimer, which binds to
the R box (GTCAC) in the promoter of genes involved in the retrograde response and
enhances their transcription (SEKITO et al. 2000; LIU and BUTOW 2006; JAZWINSKI 2013).
Several positive and negative regulators of the RTG pathway have been identified. The
RTG pathway also seems to interact with other pathways like the TOR signaling pathway

24
(TORC1) (KOMEILI et al. 2000; JAZWINSKI and KRIETE 2012). The signaling molecule
that activates the RTG pathway and the mechanism by which this molecule activates
RTG2 is poorly understood. However, it has been shown that loss of mitochondrial
membrane potential in yeast cells is essential for activation of the RTG retrograde
response (MICELI et al. 2011).
Retrograde regulation has also been studied in other organisms. It has been
suggested that when some Caenorhabditis elegans genes involved in the respiratory
chain are compromised, the life span of the worm is extended as a consequence of
activation of retrograde responses (JAZWINSKI and KRIETE 2012; HILL and VAN REMMEN
2014; RUNKEL et al. 2014). For example, worms with mutations in isp-1 (encoding a
rieske iron sulfur protein of complex III of the sETC) and clk-1 (encoding a
demethoxyubiquinone hydroxylase, involved in ubiquinone biosynthesis) have a gene
expression profile similar to yeast rho0 strains (CRISTINA et al. 2009). This suggests that
these C. elegans mutants have an activated retrograde response(s) to compensate for loss
of mitochondrial proteins as observed in the yeast system. In two independent studies
where the cco-1 gene (encoding the COX5B subunit of cytochrome c oxidoreductase) in
worms was knocked down, a different set of transcription factors was found to be
involved in activation of the retrograde response and extension of lifespan. In one study,
aimed at identifying genes that regulate HIF-1 (hypoxia-inducible factor) activity, cco-1
(RNAi) caused significantly higher levels of GFP tagged HIF-1 (LEE et al. 2010). In
these worms ROS acted as the signaling molecule and activated HIF-1 that extends
lifespan by activating survival genes (LEE et al. 2010). In a similar study, extended
lifespan of cco-1 (RNAi) worms was attributed to the role played by ubiquitin like

25
protein UBL5 and homeobox protein DVE1, these proteins are effectors of mtUPR
(mitochondrial unfolded protein response) (DURIEUX et al. 2011). In Drosophila
melanogaster RNAi knockdown of some genes encoding components of the respiratory
pathway also leads to extended lifespan (COPELAND et al. 2009), as do mutations
affecting the sbo gene (small boy), which is involved in coenzyme Q biosynthesis (LIU et
al. 2011).
In mammalian cells, respiratory chain dysfunctions have also shown to enhance
nuclear gene expression via possible involvement of the NFκB signaling or the calcium
signaling pathway (BUTOW and AVADHANI 2004; JAZWINSKI and KRIETE 2012). The
replicative lifespan of human fibroblasts treated with dinitrophenol (a mitochondrial
uncoupler) has also been seen to increase as a consequence of decreased mitochondrial
membrane potential, which in turn lowers ROS levels and retards telomere shortening.
Telomere shortening was observed to be positively correlated to ROS levels in these cells
(PASSOS et al. 2007). Studies in mice with reduced activity of a protein involved in
coenzyme Q biosynthesis (MCLK1) revealed defective electron transport and an
extension of lifespan due to activation of a retrograde pathway in a manner similar to the
clk-1 mutant in C. elegans (LAPOINTE and HEKIMI 2008).
In plants, the mitochondrial retrograde response may be activated in response to
mitochondrial dysfunctions arising from mutations, certain chemicals, biotic or abiotic
stress and expression of transgene(s) that alter mitochondrial function (RHOADS 2011).
The plant mitochondrial retrograde response has been proposed to involve nuclear
transcription factors, calcium signaling and protein kinases (WOODSON and CHORY 2008;
LEISTER 2012; NG et al. 2014). An example of plant mitochondrial retrograde pathway

26
activity is observed in NCS (non-chromosomal stripe) mutants of maize (GABAY-
LAUGHNAN and NEWTON 2005). These mutant plants have a characteristic striped pattern
on their leaves and have a slow growth phenotype due to mtDNA mutations. These
mutations cause enhanced expression of several nuclear genes, including the nucleus
encoded heat shock proteins (KUZMIN et al. 2004; FUJII and TORIYAMA 2009; TOUZET
and H. MEYER 2014).
The mtUPR is another mitochondria-to-nucleus signaling pathway. Accumulation of
unfolded proteins in the mitochondria leads to enhanced transcription of chaperone
genes, proteases, ROS detoxification genes and genes involved in mitochondrial import
(HILL and VAN REMMEN 2014; JOVAISAITE et al. 2014). Induction of this pathway has
been associated with stresses such as chemicals (that lead to ROS production), depletion
of the mitochondrial genome, depletion of sETC components, impairment of
mitochondrial protease activity and stochastic imbalance between nuclear and
mitochondrial sETC complex components (MARTINUS et al. 1996; YONEDA et al. 2004;
ALDRIDGE et al. 2007; CRISTINA et al. 2009; DURIEUX et al. 2011; HOUTKOOPER et al.
2013).
1.9 Alternative oxidase (AOX)
Alternative oxidase (AOX) is a terminal ubiquinol oxidase that is present in all
higher plants, several fungi, some protists, a few bacterial species and a few animal
species (MCDONALD and VANLERBERGHE 2006; MCDONALD 2008; MCDONALD et al.
2009). In several organisms, expression of AOX can be induced (as is the case in N.
crassa) as a consequence of mitochondrial dysfunction. This makes the protein a good

27
model for understanding the molecular mechanisms and signaling molecules involved in
mitochondrial retrograde responses.
AOX is an interfacial membrane protein that associates with the inner leaflet of the
mitochondrial inner membrane (BERTHOLD et al. 2000; BERTHOLD and STENMARK 2003).
AOX provides a branch point from the standard electron transport chain (sETC) at the
ubiquinol pool. It catalyzes the oxidation of ubiquinol (Fig. 4) and transfers electrons
directly to molecular oxygen, reducing it to water (RICH and MOORE 1976; MOORE et al.
2013). Unlike complex I, III and IV of the sETC, AOX does not pump protons across the
MIM to the IMS (MOORE et al. 1978). The activity of AOX is inhibited by hydroxamic
acids (e.g. salicylhydroxamic acid, SHAM). It is insensitive to cyanide and antimycin A
(AA), which inhibit complex IV and III of the sETC, respectively (SCHONBAUM et al.
1971; MCDONALD and VANLERBERGHE 2006).
1.9.1 Taxonomic distribution of AOX
The taxonomic distribution of AOX is extremely wide. AOX is present in some
organisms in all kingdoms of life, except Archaebacteria (MCDONALD 2008). AOX is
present in many basal plant groups and is widespread in angiosperms. The presence of
AOX has been reported in several eubacterial species, but is restricted to proteobacteria
(e.g. Novosphingobium aromaticivorans). Many Ascomycota (e.g. N. crassa) and
Basidiomycota (e.g. Cryptococcus neoformans) fungal species contain AOX and it also
seems to be present is some basal Zygomycota (e.g. Rhizopus oryzae) and Chytrid fungal
species (e.g. Spizellomyces punctacus) (MCDONALD and VANLERBERGHE 2006). Twenty
eight species in the animal kingdom have also been shown to possess AOX (e.g. the sea
squirt Ciona intestinalis belonging to the phylum chordate) (MCDONALD et al. 2009).

28
H
+
NADH +H+
Complex I
NAD+
Complex
II
FADH2
FAD
+ 2H+
CoQ
Complex III
H+
Cyt c
Complex IV
H+
4 H+ + O
2
2H2O
2e-
2e-
2e-
2e- 2e
-
MIM
IMS
Matrix
H+ H
+
Alternative
Oxidase
2e-
4 H+
+ O
2
2H2O
Cyanide Antimycin A
Figure 4. AOX in the sETC. AOX associates with the inner leaflet of the MIM, accepts electrons from ubiquinol
(CoQ) and passes them directly to molecular oxygen, thus bypassing complex III and Complex IV. In many
organisms, AOX is only produced when the sETC is inhibited. Some organisms (e.g. plants) have AOX present in
some tissues even without sETC inhibition.
28

29
In many plants (mainly in angiosperms) AOX is present as a multigene family
(CONSIDINE et al. 2001; DJAJANEGARA et al. 2002; KARPOVA et al. 2002; SAIKA et al.
2002; TAKUMI et al. 2002; CLIFTON et al. 2006). These AOX genes are generally placed
into subfamilies called AOX1 and AOX2. The AOX1 gene family is present in all
angiosperms and is induced as a consequence of cellular stress. The AOX2 gene family is
present only in dicot angiosperms and is expressed either constitutively or
developmentally (CONSIDINE et al. 2002). Several gene copies of the AOX1 subfamily
are present in many plants, whereas the AOX2 subfamily seems to be less expanded. For
example, the Arabidopsis genome contains four AOX1 type genes (AOX1a, AOX1b,
AOX1c and AOX1d) and one AOX2 type gene (AOX2) (CLIFTON et al. 2006).
Several fungi like Podospora anserina, Candida maltosa and Candida tropicalis
have also been found to contain more than one AOX gene (MCDONALD and
VANLERBERGHE 2006; MCDONALD 2008). In N. crassa the aod-1 gene encodes an AOX
that is inducible in response to sETC perturbation. A gene with unknown function, the
aod-3 gene, shows high sequence similarity to aod-1, but no evidence of the expression
of this gene under standard growth or sETC impared growth was established (TANTON et
al. 2003). No animal or eubacterial species examined to date contains more than one
AOX encoding gene (MCDONALD and VANLERBERGHE 2006).
Distribution of AOX in plants seems to be ubiquitous, whereas in protists, fungi and
animals the appearance of AOX is more sporadic (MCDONALD and VANLERBERGHE
2004). The reasons for this are unclear since in two closely related species, one may have
AOX while the other does not. For example, S. cerevisiae lack AOX whereas other
yeasts, such as Candida albicans and Pichia stipites do possess AOX (VEIGA et al. 2003;

30
MCDONALD 2008). The nematode Meliodogyne hapla has AOX whereas C. elegans
lacks AOX (MCDONALD 2008). Eukaryotic AOX is proposed to have originated from the
endosymbiotic event that gave rise to mitochondria since AOX is widespread among
proteobacteria. Following the endosymbiotic event that gave rise to mitochondria AOX
spread throughout eukaryotes by vertical inheritance (MCDONALD and VANLERBERGHE
2006).
1.9.2 Structure of AOX
Alternative oxidase belongs to the diiron carboxylate protein family (BENDALL and
BONNER 1971; NORDLUND and EKLUND 1995; SIEDOW et al. 1995; BERTHOLD and
STENMARK 2003; MOORE et al. 2013). Members of this protein family have a
characteristic diiron center with two EXXH motifs coordinating the metal iron center
(BERTHOLD and STENMARK 2003). Diiron carboxylate proteins contain a four α-helical
bundle within which the diiron center is buried and the metal center is coordinated by
conserved glutamate and histidine residues provided by the four α-helices (BERTHOLD
and STENMARK 2003). An early model of AOX structure (SIEDOW et al. 1995) was found
to have several anomalies relative to other diiron carboxylate proteins. A newer model
was proposed in which the structure of ∆9 desaturase, another diiron carboxylate protein,
was used as a modelling template (ANDERSSON and NORDLUND 1999; BERTHOLD et al.
2000; BERTHOLD and STENMARK 2003). The structure of AOX and ∆9 desaturase, in
terms of spacing of iron ligands, was the best match in comparison to other diiorn
proteins with available crystal structures at that time. This model proposed AOX was an
interfacial membrane protein that interacts with the inner leaflet of the MIM and contains
no transmembrane domains (TMDs). It further proposed that the α-helical domains

31
containing the conserved EXXH motifs also contained two conserved glutamate residues
that act as terminal ligands. Based on this structure a hydrophobic pocket was predicted
between helix 2 and helix 3 which was proposed to be the ubiquinol binding site of AOX
(ANDERSSON and NORDLUND 1999; MOORE and ALBURY 2008). Substitution mutations
of conserved amino acid residues in this region were shown to cause loss of AOX activity
(ALBURY et al. 2010). General features of the structural model of AOX are demonstrated
in Fig.5
The crystal structure of the Trpanosoma brucei AOX was recently determined
(SHIBA et al. 2013). The structure showed that AOX is indeed an interfacial membrane
diiron carboxylate protein and confirmed most features of the model proposed by
ANDERSSON and NORDLUND (1999). AOX was found to contain six long (termed α1 to
α6) and four short (termed αS1 to αS4) α-helices arranged in an antiparallel fashion
(MOORE et al. 2013). α-helices α2, α3, α5 and α6 form the four α-helical bundle that
coordinates the metal iron center. The crystal structure also revealed that the average
distance between the two iron atoms in AOX is 3.16 Å. In agreement with the previous
structural model, the crystal structure analysis suggested that the active site includes: a
hydroxo bridge between the two iron atoms, four highly conserved glutamate residues,
and two highly conserved histidine residues (MOORE et al. 2013). These histidine
residues are involved in formation of a hydrogen bond network which has been proposed
to be involved in active site stabilization. Based on the distance of the tyrosine-220
residue from the diirion center and also based on mutational analysis this tyrosine residue
has been proposed to play a role in the catalytic cycle of AOX (MOORE et al. 2013).
Based on the crystal structure, substrate binding and inhibitor binding pockets for AOX

32
Figure 5. General features of the structural model of AOX. The model proposed by
ANDERSSON and NORDLUND (1999) and modified by BERTHOLD et al. (2000). This model
proposed AOX is an interfacial membrane protein that interacts with the inner leaflet of
the MIM and contains no TMDs. The conserved EXXH motifs are present in helix 2 and
4. They coordinate the metal diiron center (iron atoms are shown as filled black circles),
as shown using dotted black lines. Helix 3 and 1 provide two conserved glutamate
residues that act as terminal ligands. Modified from BERTHOLD et al. (2000). The basics
of the model are confirmed by the recently obtained crystal structure (MOORE et al.
2013).

33
were also predicted (MOORE et al. 2013). Over the years, using a combination of multiple
sequence alignments and mutational analysis, several universally conserved residues in
AOX (in addition to the ones that play an important role in coordinating the metal iron
center) have been identified. These residues seem to play a role in diverse functions such
as substrate binding, dimer interface, membrane binding and inter-helical interactions to
name a few (MOORE et al. 2013).
It was previously proposed that plant AOX exists as a non-covalently linked dimer,
while the fungal and protist AOX’s associate with the MIM as monomers (MCDONALD
2008). In most plants the non-covalently associated monomers can become covalently
linked via a reversible disulfide bond. This bond forms between cysteine residues (called
CysI) in the N-terminal region of each monomer (see also section 1.9.5). Non-plant
AOXs do not have this cysteine. In its oxidized form, when the disulfide bond links the
two subunits, AOX is less active. When the bond is reduced, AOX is in a more active
form (VANLERBERGHE et al. 1995; UMBACH et al. 2006; ALBURY et al. 2009). In the
reduced form, the dimer can become further activated by the addition of keto acids
(especially pyruvate) to CysI (UMBACH et al. 1994; VANLERBERGHE et al. 1995). The
crystal structure of T. brucei suggested that since several residues believed to play a role
in non-covalent dimer formation are highly conserved across all known AOX sequences,
formation of a homodimer may be a universally conserved feature (MOORE et al. 2013).
The α helices, α2, α3 and α4 are proposed to be involved in dimer interface formation
with six universally conserved and eight highly conserved residues present within this
region (MOORE et al. 2013). It has also been suggested that the region formed by α1, α4,

34
the N-terminal region of α5 and the C-terminal of α2 in both monomers of the dimer is
involved in the binding of AOX to the MIM (MOORE et al. 2013).
1.9.3 Functions of AOX
It has been proposed that the original role of diiron carboxylate proteins was to act as
an oxidase to protect early anaerobic organisms from rising oxygen levels in the
atmosphere (GOMES et al. 2001). Several diiron carboxylate proteins still have the ability
to catalyze conversion of oxygen to water in addition to their main cellular function
(BROADWATER et al. 1998; GASSNER and LIPPARD 1999; GOMES et al. 2001). Examples
of such diiron carboxylate proteins include, rubrerythrin (a NADH peroxidase involved
in catalysis of hydrogen peroxide and oxygen free radicals into water (SZTUKOWSKA et
al. 2002)); ∆9 desaturase (catalyzes the desaturation of steryl-acetyl carrier protein to
oleoyl-acetyl carrier protein in a fatty acid biosynthesis pathway (FOX et al. 1993)); and
methane monooxygenase (catalyzes the conversion of methane to methanol (MERKX et
al. 2001)). Thus, it has been suggested that AOX might have originated as an oxygen
scavenging enzyme that has been retained over evolutionary time as an adaptation to
oxygen stress (MCDONALD 2008).
AOX provides metabolic flexibility to organisms under stress and helps in
maintaining a balance in the organism’s carbon metabolism and energy production via
electron transport (MCDONALD 2008). Under conditions that impair the sETC, AOX can
allow for continued glycolysis and maintain Krebs cycle flux by ensuring continued
NAD+ generation via complex I. This, in turn, ensures continued generation of important
carbon metabolites that are precursors to other molecules like amino acids, which are
essential for growth and repair (VANLERBERGHE and MCINTOSH 1997; MCDONALD

35
2008). AOX has also been suggested to play a role in providing metabolic flexibility to
certain organisms, as can be seen in proteobacterial species. Proteobacteria (e.g.
Novospingobium aromaticivorans) can grow on a variety of carbon and energy sources.
Since AOX levels in N. aromaticivorans were higher when grown in the presence of
glucose than when grown in lactate, AOX is thought to provide the organism with the
ability to handle electron transport and carbon metabolism imbalances in rapidly
changing environments (STENMARK and NORDLUND 2003).
AOX also seems to provide protection from oxidative stress by lowering the levels
of ROS produced from the sETC under certain conditions (MCDONALD 2008). If the
sETC complexes are over reduced, large amounts of ROS are produced at complexes I
and III. In several organisms, AOX seems to attenuate high ROS levels by using up
excess electrons in the sETC and preventing over reduction of the complexes
(VANLERBERGHE and MCINTOSH 1997; MCDONALD 2008). In support of this idea, when
AOX was either overexpressed or suppressed in transgenic tobacco cultures, an inverse
relationship between ROS level and AOX level was observed (MAXWELL et al. 1999). A
similar association of decreased ROS production in the presence of high levels of AOX
was found in the fungal species Ustilago maydis (JUÁREZ et al. 2006). In P. anserina,
AOX dependent reduction of ROS levels has also been associated with increased lifespan
(GREDILLA et al. 2006).
To defend against pathogenic organisms host cells often release ROS molecules or
poisonous chemicals. For example, several plant tissues produce cyanogenic glycosides
or cyanolipids, which are hydrolyzed into hydrogen cyanide following ingestion by a
herbivore (POULTON 1990; BALLHORN et al. 2009). Plants also produce increased levels

36
of ROS in response to attack by fungal pathogens (HELLER and TUDZYNSKI 2011).
Several pathogenic organisms seem to use AOX to evade such host defense mechanisms
(MCDONALD and VANLERBERGHE 2006; MCDONALD 2008). The pathogenicity of the
fungus Cryptococcus neoformans, which infects individuals with compromised immune
systems is known to involve AOX (AKHTER et al. 2003; FANG and BEATTIE 2003). When
the organism is grown at the host temperature of 37°C, the AOX1 gene is upregulated,
suggesting a role for AOX in infection. Supporting this idea is the observation that AOX1
mutants were found to be significantly less virulent in this fungus (AKHTER et al. 2003).
Similarly, in the protozoan parasite T. brucei brucei (known to cause sleeping sickness)
the bloodstream form of the organism lacks mitochondrial cytochromes and possesses
AOX which is essential for its respiration (CHAUDHURI et al. 2002).
AOX has also been suggested to be involved in resistance to metal toxicity, as seen
by an increase in AOX capacity (maximum AOX activity as measured by estimating
possible flux of electrons through AOX) in Euglena gracilis exposed to cadmium stress
(CASTRO-GUERRERO et al. 2008). A 4.5 times higher capacity of AOX was observed in
cells exposed to cadmium. Similarly, a cadmium induced increase in transcript levels of
AOX was observed in Arabidopsis thaliana (KEUNEN et al. 2013). In animals inhabiting
harsh environments AOX has been suggested to play a role in protection against harmful
chemicals and toxins. One example of such a harmful environment would be marine
sediments with potentially high levels of sulfide that inhibit cytochrome oxidase
(complex IV) (GRIESHABER and VÖLKEL 1998; MCDONALD 2008; MCDONALD et al.
2009). The resistance of AOX to several known inhibitors of components of the sETC
such as AA, azide, nitric oxide and sulfide would make it useful in many such harsh

37
environments (AZCÓN-BIETO et al. 1989; HUANG et al. 2002; BAURAIN et al. 2003; CHAE
et al. 2007a).
In thermogenic plants, heat is generated in certain tissues to facilitate scent
volatilization for attracting pollinators and also to allow for proper pollen tube formation
(ZHU et al. 2011). In several thermogenic plants like the sacred lotus (Nelumbo nucifera),
voodoo lily (Sauromatum guttatum), Arum lily (Arum maculatum) and skunk cabbage
(Symplocarpus renifolius), it has been demonstrated that the ability to generate heat is a
consequence of the activity of AOX (CRICHTON et al. 2005; GRANT et al. 2008; WAGNER
et al. 2008; ITO-INABA et al. 2009). Since AOX is not involved in proton pumping across
the MIM, and bypasses two sites of proton pumping, the high potential energy thus
generated is dissipated as heat when the alternative pathway of respiration is used.
1.9.4 Regulation of AOX transcription
Several metabolites, chemicals and environmental conditions can stimulate the
activity or expression of AOX (MCDONALD 2008). In plants, AOX activity is enhanced
by treatment with ketoacids (see section 1.9.5), especially pyruvate (VANLERBERGHE et
al. 1995; RASMUSSON et al. 2009; CARRÉ et al. 2011). The TCA cycle intermediates
citrate, isocitrate, 2-oxoglutarate and malate are also linked to increased activation and
increased AOX mRNA levels in plants (VANLERBERGHE et al. 1995; DJAJANEGARA et al.
2002; RASMUSSON et al. 2009).
ROS molecules also have an effect on AOX expression (MINAGAWA et al. 1992;
WAGNER 1995; MAGNANI et al. 2007; VAN AKEN et al. 2009). Treatment with hydrogen
peroxide led to increased expression of the inducible AOX1 in tobacco (VANLERBERGHE
and MCLNTOSH 1996), and maize (POLIDOROS et al. 2005). A similar observation was

38
seen for AOX in the fungus Magnaporthe grisea (YUKIOKA et al. 1998). In Arabidopsis
thaliana, ROS treatment led to increased expression of the AOX1a (an AOX1 type gene)
gene but repression of the AOX2 gene, emphasizing the different roles played by the two
subclasses of AOX genes in dicots (CLIFTON et al. 2005). In plants, several stresses like
salinity, low temperature, ozone treatment, osmotic stress/drought and pathogen attack
have also shown to induce AOX expression (SIMONS et al. 1999; BARTOLI et al. 2005;
EDERLI et al. 2006; COSTA et al. 2007; PASQUALINI et al. 2007; WATANABE et al. 2008;
FENG et al. 2013). In the eubacterium N. aromaticivorans, the expression levels of AOX
are greatly influenced by the oxygenation status and the carbon source of the growth
medium (STENMARK and NORDLUND 2003).
Exposure to respiratory chain inhibitors also causes an increase in transcript levels of
AOX in many organisms. These responses have been studied using nuclear run-on
experiments, northern blots, microarray analysis or real time PCR (MCDONALD 2008).
AA, an inhibitor of complex III of the sETC, causes increased expression of the inducible
form of AOX in soybean and A. thaliana (SAISHO et al. 1997; DJAJANEGARA et al. 2002).
Potassium cyanide (KCN), an inhibitor of complex IV, also leads to increased expression
of the Aox1a gene in maize (POLIDOROS et al. 2005). In the fungus M. grisea, a fungicide
that inhibits complex III has also been shown to cause accumulation of AOX mRNA
(YUKIOKA et al. 1998). Transcript levels of the aod-1 gene in N. crassa also increase in
cells grown in the presence of respiratory chain inhibitors (BERTRAND et al. 1983;
TANTON et al. 2003). In the above cases, the increase in transcript levels also corresponds
with an increase in the levels of the AOX protein as determined using western blots or
activity measurements. The above examples, as well as nuclear run-on assays from

39
studies of M. grisea and N. crassa, suggest that AOX is regulated at the level of
transcription.
In M. grisea and N. crassa, a low constitutive expression of the AOX transcript was
seen in uninduced or unstimulated cultures, though no protein was observed using
western blots. This suggests that, in certain organisms, AOX may also be regulated at the
post-transcriptional level (YUKIOKA et al. 1998; TANTON et al. 2003). In T. brucei and M.
grisea, treatment of cells with cycloheximide, an inhibitor of cytosolic protein synthesis,
lead to accumulation of AOX mRNA in uninduced cells, suggesting that under normal
conditions (no cycloheximide) the AOX transcript is degraded readily by an unknown
protein factor. In the absence of this factor mRNA accumulation occurs, further
suggestive of post-transcriptional regulation (YUKIOKA et al. 1998; CHAUDHURI et al.
2002; CLAYTON and SHAPIRA 2007).
The mechanism of transcriptional control of AOX is poorly understood. The
promoter regions of the AOX-encoding genes from various organisms have been
studied over the years and both positive and negative regulatory elements have been
identified (POLIDOROS et al. 2009). A study of the promoter region of the S. guttatum
AOX1 gene revealed the presence of cis-acting regulatory transcriptional elements that
could be binding sites for basic leucine zipper proteins (bZIP) and zinc finger proteins
(RHOADS and MCINTOSH 1993). Analysis of the A. thaliana AOX1a gene also showed
the presence of several regulatory elements, including two CCAAT box motifs (in S.
cerevisiae, this motif is known to regulate the sETC complex subunits) and also seven
motifs known to bind bZIP proteins (DOJCINOVIC et al. 2005). Similarly, several
negative and positive elements have been identified in the promoter region of the
40
soybean AOX1, AOX2 and AOX2b genes (THIRKETTLE-WATTS et al. 2003). A
transcription factor, ABI4 (abscisic acid insensitive 4), that represses AOX1a by binding
to the promoter region of the gene has been identified in A. thaliana (GIRAUD et al.
2009). ABI4 was previously shown to act as a transcriptional repressor in response to
the chloroplast retrograde signals arising from Mg-protoporphyrin IX accumulation in
the chloroplast and also from inhibition of plastid gene expression (KOUSSEVITZKY et
al. 2007; WOODSON and CHORY 2008). Mutants lacking the abi4 gene showed greater
than four-fold increase in AOX1a promoter activity. These mutants could also not be
induced any further by rotenone (complex I inhibitor) suggesting that the AOX1a gene
was already fully derepressed (GIRAUD et al. 2009). This study also suggests that
another abscisic acid signaling transcription factor, ABI3, may act as a positive
regulator of AOX1a.
Another study in A. thaliana identified two transcription factors that bind to W
box elements in the promoter region of AOX1a gene (VAN AKEN et al. 2013). W boxes
contain the TTGAC motif which is known to be a binding site for WRKY transcription
factors. Yeast one-hybrid assays using two W box regions from the AOX1a promoter, in
addition to EMSA and mutational analysis, showed that AtWRKY40 and AtWRKY63
bind to the AOX1a promoter region. AtWRKY40 acts as a repressor and AtWRKY63
acts as an activator of the AOX1a gene. These transcription factors played similar roles
with other nuclear encoded stress responsive chloroplast and mitochondrial protein
encoding genes. Expression levels of AOX1a in atwrky40 mutant plants grown in the
presence of AA were significantly higher (>2 fold) in comparison to AA-treated wild-
type plants, supporting a role for this transcription factor in limiting the expression of
41
AOX1a under AA-induced conditions (VAN AKEN et al. 2013). In atwrky63 mutant
plants treated with flg22 (a biotic stress signal), AOX1a induction was reduced by
approximately 2 fold in comparison to the wild-type flg22 treated plants (VAN AKEN et
al. 2013). High light treatment was also used to study the role of AtWRKY63 and
AtWRKY40 in chloroplast retrograde signaling, as high light treatment induces
chloroplast retrograde signaling pathways. In atwrky40 mutants AOX1a transcript levels
were more than two fold higher in comparison to wild-type plants subjected to high
light. atwrky40 over expressing plants did not show a significant increase or decrease in
AOX1a expression levels (VAN AKEN et al. 2013). In atwrky63 overexpressing plants,
expression levels of AOX1a were significantly higher, by approximately 2 fold,
following a high light treatment. The atwrky63 mutant plants subjected to high light had
a slight, though not statistically significant decrease in expression of AOX1a (VAN
AKEN et al. 2013). These data suggested that AtWRKY63 and AtWRKY40 play a role
in regulation of genes that respond to mitochondrial as well as chloroplast dysfunction.
Promoter elements and transcription factors necessary for expression of N. crassa AOX
have also been identified (see section 1.10).
1.9.5 Post-translational regulation of AOX
As discussed in section 1.9.2, AOX in all organisms likely exists as a non-covalently
associated homo-dimer. However, the N-terminal region of AOX in most plants contains
two highly conserved cysteine residues (called CysI and CysII) (UMBACH and SIEDOW
1993; BERTHOLD et al. 2000; UMBACH et al. 2006). Using site directed mutagenesis, it
has been demonstrated that CysI is involved in disulfide bond formation between the
molecules of the homodimer (RHOADS et al. 1998; VANLERBERGHE et al. 1998).
42
Formation of the disulfide bond to give a covalently joined dimer reduces AOX activity
compared to the non-covalently associated form (UMBACH and SIEDOW 1993; MOORE et
al. 2013)
The CysI and CysII of plant AOX’s have been shown to be involved in another form
of post-translational regulation involving α-keto acids (UMBACH et al. 2002; UMBACH et
al. 2006; GRANT et al. 2009). α-keto acids like pyruvate can activate the AOX protein in
several plant species (MILLAR et al. 1993; UMBACH et al. 2006; GRANT et al. 2009).
Pyruvate activation takes place only when the AOX dimer is in its reduced state
(UMBACH et al. 1994; VANLERBERGHE et al. 1995). Activation by other α-keto acids like
glyoxylate, hydroxypyruvate and 2-oxoglutarate has also been demonstrated (MILLAR et
al. 1993). Activation of AOX by pyruvate is abolished if CysI is mutated but no such
effect was observed when CysII was mutated, suggesting pyruvate activation is
dependent on CysI (RHOADS et al. 1998; VANLERBERGHE et al. 1998). On the other hand,
activation via glyoxylate is dependent on CysII and this activation takes place only when
the protein has been previously activated via pyruvate at CysI (UMBACH et al. 2006). In
some plant AOXs, amino acid substitutions at the conserved cysteine residues have been
observed. This includes a tomato (LeAOX1b) and a maize (ZmAOX3) AOX isozyme,
where a serine (SerI) residue replaces CysI (KARPOVA et al. 2002; HOLTZAPFFEL et al.
2003; UMBACH et al. 2006). In tomato, the LeAOX1b protein seems to be insensitive to
activation by α-keto acids but is activated by succinate (HOLTZAPFFEL et al. 2003;
UMBACH et al. 2006; MCDONALD 2008). Studies using sacred lotus (N. nucifera) have
also identified AOX isozymes (NnAOX1a and NnAOX1b) from the receptacles of this
plant that lack CysI, which has been replaced by serine. AOX in the sacred lotus was

43
present in the non-covalently joined state and just as in LeAOX1b it was activated by
succinate as opposed to pyruvate (GRANT et al. 2009). These studies suggest the presence
of species-specific variations in AOX regulation at the posttranslational level (UMBACH
et al. 2006).
Unlike plants, the animal, bacterial, fungal and protist AOX’s lack the highly
conserved cysteine residues. Thus, post-translational regulation as a result of covalent
dimer formation or by α-keto acids is not observed in these organisms (JARMUSZKIEWICZ
et al. 2002; MCDONALD 2008). In the fungal species Yarrowia lipolytica and N. crassa,
and in the protists Acanthamoeba castellani and Dictyostelium discoideum AOX activity
has been shown to be enhanced by the purine nucleoside 5’ monophosphates GMP or
AMP (VANDERLEYDEN et al. 1980; JARMUSZKIEWICZ et al. 2002; MEDENTSE et al. 2004;
JARMUSZKIEWICZ et al. 2005).
1.10 Neurospora crassa AOX
The cyanide-insensitive respiratory pathway in N. crassa was first observed in the
mitochondrial mutant [poky] (LAMBOWITZ and SLAYMAN 1971; RIFKIN and LUCK 1971;
AKINS and LAMBOWITZ 1984). The [poky] mutant is characterized by high levels of
cytochrome c and low levels of the cytochromes with mitochondrially encoded
components, cytochrome aa3 and b (LAMBOWITZ et al. 1972). Subsequently, it was
demonstrated that impairment of the sETC by the chemical inhibitors AA (inhibits
complex III), cyanide (inhibits complex IV), and chloramphenicol (Cm, inhibits
mitochondrial protein synthesis) also lead to induction of cyanide-insensitive respiration
in N. crassa (LAMBOWITZ and SLAYMAN 1971; EDWARDS et al. 1974; EDWARDS and
ROSENBERG 1976). Although Cm does not directly inhibit a complex of the sETC, it
44
leads to deficiencies of complex I, III and IV since they contain mitochondrially encoded
subunits. A similar effect was seen with mutations that effect components of the sETC, or
growth of cells in copper (a component of complex IV) deficient medium (BORGHOUTS et
al. 2001).
Initial attempts to understand cyanide-insensitive respiration and identify the
alternative oxidase protein in N. crassa were carried out using mutagen based screening
(BERTRAND et al. 1983). This led to the identification of several strains that were unable
to grow in the presence of AA after mutagen treatment, suggesting the presence of
mutations affecting AOX production in these strains. The mutations were found to
comprise two complementation groups, aod-1 and aod-2. Visualization of radio-labelled
(35
S) proteins from mutant strains showed that 19 of the 20 mutants placed in the aod-1
complementation group contained a radiolabelled protein that only appeared when strains
were grown under AOX inducing conditions. All 4 strains in the aod-2 complementation
group did not contain the protein. This led to the suggestion that aod-1 is the structural
gene for AOX in N. crassa whereas aod-2 is involved in the regulation of AOX. Later,
LAMBOWITZ et al. (1989) identified proteins, of similar size (36.5 kDa and 37 kDa) in a
N. crassa wild-type strain treated with Cm. Monoclonal antibodies specific to S. guttatum
AOX were used for AOX detection in this study. The lone strain in the aod-1
complementation group that lacked the protein was later shown to contain a frame-shift
mutation in its coding region (LI et al. 1996). The remaining mutants are assumed to
carry missense mutations.
It is now accepted that the structural gene for AOX in N. crassa is the nuclear aod-1
gene. This gene contains two introns and encodes a 363 amino acid protein

45
corresponding to a 41.4 kDa protein which is processed to a mature 34.7 kDa protein by
removal of the MTS (mitochondrial targeting sequence). LI et al. (1996) cloned and
sequenced the N. crassa aod-1 gene and identified potential CAAT and TATA boxes in
the upstream region, as well as a transcription start site using a primer extension strategy.
A possible cAMP responsive element (CRE) was also identified in the promoter region
(746 bps upstream from the transcription start site) of the aod-1 gene. However, deletion
of portions of the promoter sequence showed that the CRE is not essential for AOX
induction in N. crassa (TANTON et al. 2003).
Northern blot analysis of wild-type strains grown in the presence or absence of Cm
suggested that AOX induction in N. crassa takes place at the level of transcription. High
mRNA levels were observed in cells grown under Cm induced conditions while
transcripts were not detectable in cells grown in non-induced conditions (LI et al. 1996).
The idea that N. crassa AOX is regulated at the level of transcription was further
supported by nuclear run-on experiments. N. crassa cultures treated with AA showed a
rapid increase in transcript levels and a corresponding increase in protein levels as
compared to uninduced cultures (TANTON et al. 2003). These nuclear run-on assays also
suggested that uninduced cultures have a low constitutive expression of the AOX
transcript but no corresponding AOX protein. This was later confirmed in RT-PCR
experiments (CHAE et al. 2007b). Also, some N. crassa strains have been identified that
readily accumulate detectable levels of aod-1 mRNA under non-inducing conditions but
lack any detectable AOX protein on western blots (TANTON et al. 2003; DESCHENEAU et
al. 2005). This suggests that regulation also takes place at the post-transcriptional level. It
was suggested that translation of the aod-1 transcript may either be inhibited by a

46
cytosolic protein or a cytosolic protein present only in inducing conditions, plays an
important role in translation of the aod-1 transcript (TANTON et al. 2003).
BLAST searches of the N. crassa genome led to identification of a second alternative
oxidase structural gene (TANTON et al. 2003). This gene was named aod-3 and shows
55% identity to the aod-1 gene. Transcription of aod-3 was not observed on Northern
blots when a wild-type strain was grown in uninduced or induced conditions using Cm. It
was hypothesized that this gene may be developmentally regulated or is induced under
unidentified stress conditions.
To identify additional genes involved in regulation of AOX in N. crassa a reporter
construct containing 3.3 Kb of the upstream sequence of aod-1 gene was fused to the
tyrosinase gene coding sequence (DESCHENEAU et al. 2005). This construct was
subsequently transformed into a tyrosinase null strain and the strain was subjected to
ethyl methanesulfonate (EMS) mutagenesis. Strains unable to induce tyrosinase
expression, identified as colonies that did not turn brown upon exposure to tyrosine, were
potential AOX regulatory mutants. These were analyzed via complementation and
genetic mapping studies, which helped identify four new AOX regulatory genes, aod-4,
aod-5, aod-6 and aod-7. The function and identity of the aod-4, aod-6 and aod-7 are still
unknown. This screen was likely not saturated, as multiple isolates were identified at only
the aod-4 locus.
Gene rescue experiments were carried out to identify the aod-2 and aod-5 genes.
These genes were shown to encode fungal-specific zinc cluster transcription factors
(MACPHERSON et al. 2006; CHAE et al. 2007b). The C-terminal region of the gene
products of these genes also possessed PAS (Per-ANT-Sim) domains. These domains are

47
known to act as signal sensors and are also involved in protein dimerization (TAYLOR and
ZHULIN 1999; MÖGLICH et al. 2009). Using site-directed mutagenesis it was shown that
two conserved glycine residues in the PAS domain are essential for proper functioning of
the AOD2 and AOD5 proteins (CHAE et al. 2007b).
Initial promoter deletion studies suggested that the region 255 bp upstream of the
transcription start site of the aod-1 gene contains the regulatory element essential for
proper AOX induction (TANTON et al. 2003). Further analysis of this region revealed the
presence of the AIM (alternative oxidase induction motif) sequence. The AIM consists of
two CGG repeats separated by seven base pairs and represents a typical binding site for
fungal zinc cluster transcription factors (CHAE et al. 2007a). EMSA analysis using the
AOD2 and/or AOD5 DNA binding domain, and probes containing the AIM sequence,
demonstrated that AOD2 and AOD5 bind synergistically as a heterodimer to the AIM
sequence (CHAE et al. 2007b). Pull-down assays and size exclusion chromatography
using affinity purified tagged versions of the AOD2 and AOD5 proteins further
supported the notion that the proteins physically interact with each other. Orthologs of
the AOD2 and AOD5 proteins in Aspergillus nidulans (AcuM and AcuK) and Podospora
anserina (RSE2 and RSE3) also play a role in AOX induction as well as in the induction
of genes required for gluconeogenesis (SUZUKI et al. 2012; BOVIER et al. 2014).
Based on the above, the current model of AOX regulation in N. crassa is that when
the sETC is disrupted, an as yet unknown signaling molecule (or signaling cascade)
probably originating in the mitochondria, either directly or indirectly, activates the
AOD2-AOD5 heterodimer bound to the promoter of the aod-1 gene. This activation leads
to enhanced transcription of the aod-1 gene. The aod-1 mRNA is then translated on
48
cytosolic ribosomes and the AOX protein is imported into mitochondria (Fig. 6). Apart
from the above-mentioned regulatory factors, no other players in the AOX regulatory
pathway have been characterized.
1.10.1 Knockout mutant library screening
The mutagenesis based screen described above (DESCHENEAU et al. 2005) was not
saturated and was mainly designed to identify mutants with AOX transcriptional
regulatory defects. More recently the N. crassa knockout mutant (KO) library (COLOT et
al. 2006) was screened, to further identify mutants unable to produce AOX (NARGANG et
al. 2012). This screen was based on the idea that KO mutant strains growing very poorly
or not at all in the presence of AA should lack AOX. The gene knocked out in such a
mutant could be involved in the proper functioning or production of AOX (NARGANG et
al. 2012). KO strains identified as having no (or very slow) growth on medium
containing AA were then grown in the presence of Cm and mitochondria were isolated.
Western blot analysis of mitochondrial proteins was carried out to determine levels of
AOX. Sixty-two strains were identified that had lower levels of AOX. These mutants
were placed into three classes, designated, class 1, 2 and 3. Class 1 consisted of strains
that had virtually no AOX under inducing conditions at one or both the time points
tested. This class included previously identified genes (aod-1, aod-2 and aod-5 KO
mutants) as well as eight new mutants. Class 2 consisted of twenty mutants with
moderate reductions of AOX levels. Class 3 consists of thirty-four mutants with slight
reductions in AOX levels. Subsequent to the study, an additional class 1 mutant was
identified (mutant 113G8, KO of NCU03071).

49
Figure 6. Current model of N. crassa AOX regulation. A) AOX regulation in non-
inducing conditions. Under non-inducing conditions, the AOD2-AOD5 heterodimer
remains bound to the promoter of the aod-1 gene and a low level of constitutive
expression of the aod-1 gene occurs. B) AOX regulation in inducing conditions. When
the sETC is disrupted, an unknown signaling molecule activates the AOD2-AOD5

50
heterodimer. A signaling cascade may also be involved. This leads to enhanced
transcription of the aod-1 gene (beginning at the upstream region, represented by an
arrow) and translation of AOX protein in the cytosol. The AOX protein is subsequently
imported into mitochondria.

51
1.11 Objective of this study
The study of class 1 strains was thought to provide an excellent opportunity to
identify genes and mechanisms involved in the functioning and regulation of AOX, as
knockout of the genes in these strains lead to an absence of detectable amounts of AOX
protein at 24 and/or 48 hours of growth in the presence of Cm. Two of these genes
(NCU08887 and NCU01542) were studied to understand AOX function and/or
regulation. Unexpected results suggested that the genes were not involved in AOX
function. This led to a thorough examination of all novel class 1 mutants (Table 1) with
respect to their authenticity.
The above-mentioned KO mutant screen also identified a different set of mutant
strain. These showed very poor or no growth in the presence of AA but had virtually
normal levels of AOX protein under inducing conditions (+Cm). It was hypothesized that
these strains may lack an element essential for the proper assembly of the AOX protein or
integration of AOX into the inner leaflet of the MIM. It was also possible that the genes
affected in these strains played a role in post-translational modification steps to the
activate the AOX protein in N. crassa. Such strains were termed putative ‘assembly
mutants’. Five such strains (Table 2) were further analyzed with the aim of identifying an
assembly mutant.

52
Table 1. NCU numbers and gene product information for the eight mutants with
severe AOX deficiencies (NARGANG et al. 2012).
Strains NCU number Gene/Protein KO
23H2 NCU08887 Hypothetical protein (major facilitator superfamily)
40E6* NCU05600
NCU12096
Stk-33/ Serine/ Threonine protein kinase-33
Aspartyl aminopeptidase
41G7 NCU03589 Hypothetical protein
47H10 NCU00778 Sed5 vesicle protein (Transmembrane adaptor Erv26)
52D8 NCU07281 Glucose-6-phosphate isomerase (gpi-1) (phosphoglucose
isomerase)
83H3 NCU08365 RNA polymerase II mediator complex component Med8
88H8 NCU01542 Hypothetical protein (HbrB like domain)
100B5** NCU08158 Dual specificity phosphatase
113G8*** NCU03071 MAP kinase kinase kinase SskB (os-4)
* Initial analysis of the genome sequence identified a single coding sequence. This was
used during construction of the KO mutant library. Subsequent analysis showed two
genes in the region that were removed in the KO.
** Not examined as part of this study. Previously examined (DESAULNIERS 2013)
*** Identified after the publication of the initial KO screen (NARGANG et al. 2012).

53
Table 2. NCU numbers and gene product information for possible assembly
mutants.
Strains NCU number Gene/Protein KO
13G11 NCU04566 Protein kinase 10
28B10 NCU08137 Hypothetical protein
85H5 NCU09803 Thioredoxin
99B8 NCU09327 Cytochrome-4/ protein phosphatase
101D3 NCU09560 Superoxide dismutase

54
References
AFRODITI, C., and T. KOSTAS, 2013 The mitochondrial intermembrane space: a hub for
oxidative folding linked to protein biogenesis. Antioxid. Redox Signal. 19: 54-62.
AHLQVIST, KATI J., RIIKKA H. HÄMÄLÄINEN, S. YATSUGA, M. UUTELA, M. TERZIOGLU
et al., 2012 Somatic Progenitor Cell Vulnerability to Mitochondrial DNA
Mutagenesis Underlies Progeroid Phenotypes in Polg Mutator Mice. Cell Metab.
15: 100-109.
AJIOKA, R. S., J. D. PHILLIPS and J. P. KUSHNER, 2006 Biosynthesis of heme in
mammals. Biochim. Biophys. Acta - Mol. Cell Res. 1763: 723-736.
AKHTER, S., H. C. MCDADE, J. M. GORLACH, G. HEINRICH, G. M. COX et al., 2003 Role
of alternative oxidase gene in pathogenesis of Cryptococcus neoformans. Infect.
Immun. 71: 5794-5802.
AKINS, R. A., and A. M. LAMBOWITZ, 1984 The [poky] mutant of Neurospora contains a
4-base-pair deletion at the 5' end of the mitochondrial small rRNA. Proc. Natl.
Acad. Sci. USA 81: 3791-3795.
ALBURY, M. S., C. ELLIOTT and A. L. MOORE, 2009 Towards a structural elucidation of
the alternative oxidase in plants. Physiol. Plant. 137: 316-327.
ALBURY, M. S., C. ELLIOTT and A. L. MOORE, 2010 Ubiquinol-binding site in the
alternative oxidase: Mutagenesis reveals features important for substrate binding
and inhibition. Biochim. Biophys. Acta - Bioenergetics 1797: 1933-1939.
ALDRIDGE, J. E., T. HORIBE and N. J. HOOGENRAAD, 2007 Discovery of Genes Activated
by the Mitochondrial Unfolded Protein Response (mtUPR) and Cognate Promoter
Elements. PLoS One 2: e874.
ANDERSSON, J. O., 2013 Gene Transfer and the Chimeric Nature of Eukaryotic Genomes,
pp. 181-197 in Lateral Gene Transfer in Evolution, edited by U. GOPHNA.
Springer New York.
ANDERSSON, M. E., and P. NORDLUND, 1999 A revised model of the active site of
alternative oxidase. FEBS Lett. 449: 17-22.
ARCHIBALD, J., 2011 Origin of eukaryotic cells: 40 years on. Symbiosis 54: 69-86.
ARMSTRONG, M. R., V. C. BLOK and M. S. PHILLIPS, 2000 A Multipartite Mitochondrial
Genome in the Potato Cyst Nematode Globodera pallida. Genetics 154: 181-192.
AZCÓN-BIETO, J., M. RIBAS-CARBÓ, M. A. GONZÁLEZ-MELER and J. PEÑUELAS, 1989
Sulfide-Resistant Respiration in Leaves of Elodea canadensis Michx Comparison
with Cyanide-Resistant Respiration. Plant Physiol. 90: 1249-1251.
BALABAN, R. S., S. NEMOTO and T. FINKEL, 2005 Mitochondria, Oxidants, and Aging.
Cell 120: 483-495.
BALLHORN, D. J., S. KAUTZ, M. HEIL and A. D. HEGEMAN, 2009 Analyzing plant
defenses in nature. Plant Signal Behav. 4: 743-745.
BARTOLI, C. G., F. GOMEZ, G. GERGOFF, J. J. GUIAMÉT and S. PUNTARULO, 2005 Up-
regulation of the mitochondrial alternative oxidase pathway enhances
photosynthetic electron transport under drought conditions. J. Exp. Bot. 56: 1269-
1276.
BATUT, J., S. G. E. ANDERSSON and D. O'CALLAGHAN, 2004 The evolution of chronic
infection strategies in the [alpha]-proteobacteria. Nat. Rev. Microbiol. 2: 933-945.

55
BAUER, M. F., S. HOFMANN, W. NEUPERT and M. BRUNNER, 2000 Protein translocation
into mitochondria: the role of TIM complexes. Trends Cell Biol. 10: 25-31.
BAURAIN, D., M. DINANT, N. COOSEMANS and R. F. MATAGNE, 2003 Regulation of the
Alternative Oxidase Aox1 Gene inChlamydomonas reinhardtii. Role of the
Nitrogen Source on the Expression of a Reporter Gene under the Control of
theAox1 Promoter. Plant Physiol. 131: 1418-1430.
BECKER, T., M. GEBERT, N. PFANNER and M. VAN DER LAAN, 2009 Biogenesis of
mitochondrial membrane proteins. Curr. Opin. Cell Biol. 21: 484-493.
BECKER, T., S. PFANNSCHMIDT, B. GUIARD, D. STOJANOVSKI, D. MILENKOVIC et al.,
2007 Biogenesis of the mitochondrial TOM complex: Mim1 promotes insertion
and assembly of signal-anchored receptors. J. Biol. Chem. 283: 120-127.
BENDALL, D. S., and W. D. BONNER, 1971 Cyanide-insensitive respiration in plant
mitochondria. Plant Physiol. 47: 236-245.
BERMAN, S. B., F. J. PINEDA and J. M. HARDWICK, 2008 Mitochondrial fission and fusion
dynamics: the long and short of it. Cell Death Differ. 15: 1147-1152.
BERNT, M., R. MACHNÉ, A. H. SAHYOUN, M. MIDDENDORF and P. F. STADLER, 2013
Mitochondrial Genome Evolution in eLS. John Wiley & Sons, Ltd.
BERRIDGE, M. J., M. D. BOOTMAN and P. LIPP, 1998 Calcium - a life and death signal.
Nature 395: 645-648.
BERTHOLD, D. A., M. E. ANDERSSON and P. NORDLUND, 2000 New insight into the
structure and function of the alternative oxidase. Biochim. Biophys. Acta -
Bioenergetics 1460: 241-254.
BERTHOLD, D. A., and P. STENMARK, 2003 Membrane-bound diiron carboxylate proteins.
Annu. Rev. Plant Biol. 54: 497-517.
BERTRAND, H., C. A. ARGAN and N. A. SZAKACS, 1983 Genetic control of the biogenesis
of cyanide insensitive respiration in Neurospora crassa, pp. 495-507 in
Mitochondria. Walter de Gruyter, Berlin.
BHANGOO, M. K., S. TZANKOV, A. C. Y. FAN, K. DEJGAARD, D. Y. THOMAS et al., 2007
Multiple 40-kDa Heat-Shock Protein Chaperones Function in Tom70-dependent
Mitochondrial Import. Mol. Biol. Cell. 18: 3414-3428.
BLANCO, N. E., M. GUINEA-DÍAZ, J. WHELAN and Å. STRAND, 2014 Interaction between
plastid and mitochondrial retrograde signalling pathways during changes to
plastid redox status. Philos. Trans. R. Soc. Lond., Ser. B: Biol. Sci. 369.
BOLDOGH, I. R., and L. A. PON, 2007 Mitochondria on the move. Trends Cell Biol. 17:
502-510.
BORGHOUTS, C., A. WERNER, T. ELTHON and H. D. OSIEWACZ, 2001 Copper-Modulated
Gene Expression and Senescence in the Filamentous Fungus Podospora anserina.
Mol. Cell. Biol. 21: 390-399.
BORKOVICH, K. A., L. A. ALEX, O. YARDEN, M. FREITAG, G. E. TURNER et al., 2004
Lessons from the Genome Sequence of Neurospora crassa: Tracing the Path from
Genomic Blueprint to Multicellular Organism. Microbiol. Mol. Biol. Rev. 68: 1-
108.
BOVIER, E., C. H. SELLEM, A. HUMBERT and A. SAINSARD-CHANET, 2014 Genetic and
Functional Investigation of Zn2Cys6 Transcription Factors RSE2 and RSE3 in
Podospora anserina. Eukaryot. Cell 13: 53-65.

56
BRATIC, A., N.-G. LARSSON, XF and RAN, 2013 The role of mitochondria in aging. J.
Clin. Invest. 123: 951-957.
BROADWATER, J. A., J. AI, T. M. LOEHR, L. SANDERS and B. G. FOX, 1998
Peroxodiferric Intermediate of Stearoyl-Acyl Carrier Protein Δ9 Desaturase:
Oxidase Reactivity during Single Turnover and Implications for the Mechanism
of Desaturation. Biochemistry 37: 14664-14671.
BURGER, G., M. W. GRAY and B. FRANZ LANG, 2003 Mitochondrial genomes: anything
goes. Trends Genet. 19: 709-716.
BURGER, G., and B. F. LANG, 2003 Parallels in Genome Evolution in Mitochondria and
Bacterial Symbionts. IUBMB Life 55: 205-212.
BUTOW, R. A., and N. G. AVADHANI, 2004 Mitochondrial signaling: the retrograde
response. Mol. Cell 14: 1-15.
CARLSON, E. A., V. K. RAO and S. S. YAN, 2013 From a cell's viewpoint: targeting
mitochondria in Alzheimer's disease. Drug Discov. Today Ther. Strateg. 10: e91-
e98.
CARNEIRO, P., M. DUARTE and A. VIDEIRA, 2007 The External Alternative NAD(P)H
Dehydrogenase NDE3 Is Localized both in the Mitochondria and in the
Cytoplasm of Neurospora crassa. J. Mol. Biol. 368: 1114-1121.
CARRÉ, J. E., C. AFFOURTIT and A. L. MOORE, 2011 Interaction of purified alternative
oxidase from thermogenic Arum maculatum with pyruvate. FEBS Lett. 585: 397-
401.
CASTRO-GUERRERO, N., J. RODRÍGUEZ-ZAVALA, A. MARÍN-HERNÁNDEZ, S. RODRÍGUEZ-
ENRÍQUEZ and R. MORENO-SÁNCHEZ, 2008 Enhanced alternative oxidase and
antioxidant enzymes under Cd2+ stress in Euglena. J. Bioenerg. Biomembr. 40:
227-235.
CHABAN, Y., E. J. BOEKEMA and N. V. DUDKINA, 2014 Structures of mitochondrial
oxidative phosphorylation supercomplexes and mechanisms for their stabilisation.
Biochim. Biophys. Acta - Bioenergetics 1837: 418-426.
CHACINSKA, A., P. REHLING, B. GUIARD, A. E. FRAZIER, A. SCHULZE‐SPECKING et al.,
2003 Mitochondrial translocation contact sites: separation of dynamic and
stabilizing elements in formation of a TOM–TIM–preprotein supercomplex.
EMBO J. 22: 5370-5381.
CHAE, M. S., C. C. LIN, K. E. KESSLER, C. E. NARGANG, L. L. TANTON et al., 2007a
Identification of an alternative oxidase induction motif in the promoter region of
the aod-1 gene in Neurospora crassa. Genetics 175: 1597-1606.
CHAE, M. S., C. E. NARGANG, I. A. CLEARY, C. C. LIN, A. T. TODD et al., 2007b Two
zinc-cluster transcription factors control induction of alternative oxidase in
Neurospora crassa. Genetics 177: 1997-2006.
CHAN, D. C., 2006 Mitochondrial Fusion and Fission in Mammals. Annu. Rev. Cell. Dev.
Biol. 22: 79-99.
CHAN, D. C., 2012 Fusion and Fission: Interlinked Processes Critical for Mitochondrial
Health. Annu. Rev. Genet. 46: 265-287.
CHANDEL, N. S., 2014 Mitochondria as signaling organelles. BMC Biol. 12: 34.
CHAUDHURI, M., R. SHARAN and G. C. HILL, 2002 Trypanosome Alternative Oxidase is
Regulated Post-transcriptionally at the Level of RNA Stability. J. Eukaryot.
Microbiol. 49: 263-269.

57
CHEN, H., and D. C. CHAN, 2010 Physiological functions of mitochondrial fusion. Ann.
N. Y. Acad. Sci. 1201: 21-25.
CHIABRANDO, D., S. MERCURIO and E. TOLOSANO, 2014 Heme and erythropoieis: more
than a structural role. Haematologica 99: 973-983.
CIRCU, M. L., and T. Y. AW, 2010 Reactive oxygen species, cellular redox systems, and
apoptosis. Free Radical Biol. Med. 48: 749-762.
CLAPHAM, D. E., 2007 Calcium Signaling. Cell 131: 1047-1058.
CLAYTON, C., and M. SHAPIRA, 2007 Post-transcriptional regulation of gene expression
in trypanosomes and leishmanias. Mol. Biochem. Parasitol. 156: 93-101.
CLIFTON, R., R. LISTER, K. L. PARKER, P. G. SAPPL, D. ELHAFEZ et al., 2005 Stress-
induced co-expression of alternative respiratory chain components in Arabidopsis
thaliana. Plant Mol. Biol. 58: 193-212.
CLIFTON, R., A. H. MILLAR and J. WHELAN, 2006 Alternative oxidases in Arabidopsis: A
comparative analysis of differential expression in the gene family provides new
insights into function of non-phosphorylating bypasses. Biochim. Biophys. Acta -
Bioenergetics 1757: 730-741.
COLOT, H. V., G. PARK, G. E. TURNER, C. RINGELBERG, C. M. CREW et al., 2006 A high-
throughput gene knockout procedure for Neurospora reveals functions for
multiple transcription factors. Proc. Natl. Acad. Sci. USA 103: 10352-10357.
CONSIDINE, M. J., D. O. DALEY and J. WHELAN, 2001 The Expression of Alternative
Oxidase and Uncoupling Protein during Fruit Ripening in Mango. Plant Physiol.
126: 1619-1629.
CONSIDINE, M. J., R. C. HOLTZAPFFEL, D. A. DAY, J. WHELAN and A. H. MILLAR, 2002
Molecular Distinction between Alternative Oxidase from Monocots and Dicots.
Plant Physiol. 129: 949-953.
CONTRERAS, L., I. DRAGO, E. ZAMPESE and T. POZZAN, 2010 Mitochondria: The calcium
connection. Biochim. Biophys. Acta - Bioenergetics 1797: 607-618.
COPELAND, J. M., J. CHO, T. LO JR, J. H. HUR, S. BAHADORANI et al., 2009 Extension of
Drosophila Life Span by RNAi of the Mitochondrial Respiratory Chain. Curr.
Biol. 19: 1591-1598.
COSTA, J. H., Y. JOLIVET, M.-P. HASENFRATZ-SAUDER, E. G. ORELLANO, M. DA GUIA
SILVA LIMA et al., 2007 Alternative oxidase regulation in roots of Vigna
unguiculata cultivars differing in drought/salt tolerance. J. Plant Physiol. 164:
718-727.
COZZOLINO, M., A. FERRI, C. VALLE and M. T. CARRÌ, 2013 Mitochondria and ALS:
Implications from novel genes and pathways. Mol. Cell. Neurosci. 55: 44-49.
CRICHTON, P. G., C. AFFOURTIT, M. S. ALBURY, J. E. CARRÉ and A. L. MOORE, 2005
Constitutive activity of Sauromatum guttatum alternative oxidase in
Schizosaccharomyces pombe implicates residues in addition to conserved
cysteines in α-keto acid activation. FEBS Lett. 579: 331-336.
CRISTINA, D., M. CARY, A. LUNCEFORD, C. CLARKE and C. KENYON, 2009 A Regulated
Response to Impaired Respiration Slows Behavioral Rates and Increases Lifespan
in Caenorhabditis elegans. PLoS Genet. 5: e1000450.
DESAULNIERS, A. B., 2013 The role of YVH1, a dual specificity phosphatase, in the
production of alternative oxidase in the filamentous fungus Neurospora crassa pp.
in Department of Biological Sciences. University of Alberta, Edmonton, Alberta.
58
DESCHENEAU, A. T., I. A. CLEARY and F. E. NARGANG, 2005 Genetic evidence for a
regulatory pathway controlling alternative oxidase production in Neurospora
crassa. Genetics 169: 123-135.
DJAJANEGARA, I., P. FINNEGAN, C. MATHIEU, T. MCCABE, J. WHELAN et al., 2002
Regulation of alternative oxidase gene expression in soybean. Plant Mol. Biol.
50: 735-742.
DOJCINOVIC, D., J. KROSTING, A. HARRIS, D. WAGNER and D. RHOADS, 2005
Identification of a region of the Arabidopsis AtAOX1a promoter necessary for
mitochondrial retrograde regulation of expression. Plant Mol. Biol. 58: 159-175.
DUAN, W., 2013 Targeting Sirtuin-1 in Huntington’s Disease: Rationale and Current
Status. CNS Drugs 27: 345-352.
DUDEK, J., P. REHLING and M. VAN DER LAAN, 2013 Mitochondrial protein import:
Common principles and physiological networks. Biochim. Biophys. Acta - Mol.
Cell Res. 1833: 274-285.
DURIEUX, J., S. WOLFF and A. DILLIN, 2011 The Cell-Non-Autonomous Nature of
Electron Transport Chain-Mediated Longevity. Cell 144: 79-91.
DYALL, S. D., M. T. BROWN and P. J. JOHNSON, 2004 Ancient Invasions: From
Endosymbionts to Organelles. Science 304: 253-257.
EDERLI, L., R. MORETTINI, A. BORGOGNI, C. WASTERNACK, O. MIERSCH et al., 2006
Interaction between Nitric Oxide and Ethylene in the Induction of Alternative
Oxidase in Ozone-Treated Tobacco Plants. Plant Physiol. 142: 595-608.
EDGAR, D., I. SHABALINA, Y. CAMARA, A. WREDENBERG, M. A. CALVARUSO et al., 2009
Random Point Mutations with Major Effects on Protein-Coding Genes Are the
Driving Force behind Premature Aging in mtDNA Mutator Mice. Cell Metab. 10:
131-138.
EDWARDS, D. L., and E. ROSENBERG, 1976 Regulation of Cyanide‐Insensitive
Respiration in Neurospora. Eur. J. Biochem. 62: 217-221.
EDWARDS, D. L., E. ROSENBERG and P. A. MARONEY, 1974 Induction of Cyanide-
insensitive Respiration in Neurospora crassa. J. Biol. Chem. 249: 3551-3556.
ENDO, T., and K. YAMANO, 2010 Transport of proteins across or into the mitochondrial
outer membrane. Biochim. Biophys. Acta - Mol. Cell Res. 1803: 706-714.
EPSTEIN, C. B., J. A. WADDLE, W. HALE, V. DAVÉ, J. THORNTON et al., 2001 Genome-
wide responses to mitochondrial dysfunction. Mol. Biol. Cell. 12: 297-308.
FANG, J., and D. S. BEATTIE, 2003 Alternative oxidase present in procyclic Trypanosoma
brucei may act to lower the mitochondrial production of superoxide. Arch.
Biochem. Biophys. 414: 294-302.
FELICIELLO, A., M. E. GOTTESMAN and E. V. AVVEDIMENTO, 2005 cAMP-PKA signaling
to the mitochondria: protein scaffolds, mRNA and phosphatases. Cell. Signal. 17:
279-287.
FENG, H., D. GUAN, K. SUN, Y. WANG, T. ZHANG et al., 2013 Expression and signal
regulation of the alternative oxidase genes under abiotic stresses. Acta Biochim.
Biophys. Sin. 45: 985-994.
FERRAMOSCA, A., and V. ZARA, 2013 Biogenesis of mitochondrial carrier proteins:
Molecular mechanisms of import into mitochondria. Biochim. Biophys. Acta -
Mol. Cell Res. 1833: 494-502.

59
FINKEL, T., 2012 From sulfenylation to sulfhydration: what a thiolate needs to tolerate.
Sci. Signal. 5: pe10.
FOX, B. G., J. SHANKLIN, C. SOMERVILLE and E. MÜNCK, 1993 Stearoyl-acyl carrier
protein delta 9 desaturase from Ricinus communis is a diiron-oxo protein. Proc.
Natl. Acad. Sci. USA 90: 2486-2490.
FREDERICK, R. L., and J. M. SHAW, 2007 Moving Mitochondria: Establishing
Distribution of an Essential Organelle. Traffic 8: 1668-1675.
FRIEDMAN, J. R., L. L. LACKNER, M. WEST, J. R. DIBENEDETTO, J. NUNNARI et al., 2011
ER Tubules Mark Sites of Mitochondrial Division. Science 334: 358-362.
FUJII, S., and K. TORIYAMA, 2009 Suppressed expression of retrograde-regulated male
sterility restores pollen fertility in cytoplasmic male sterile rice plants. Proc. Natl.
Acad. Sci. USA 106: 9513-9518.
GABAY-LAUGHNAN, S., and K. J. NEWTON, 2005 Mitochondrial mutations in maize.
Maydica 50: 349.
GALLUZZI, L., J. M. BRAVO-SAN PEDRO and G. KROEMER, 2014 Organelle-specific
initiation of cell death. Nat. Cell Biol. 16: 728-736.
GASSNER, G. T., and S. J. LIPPARD, 1999 Component Interactions in the Soluble Methane
Monooxygenase System from Methylococcus capsulatus (Bath). Biochemistry
38: 12768-12785.
GEBERT, N., A. CHACINSKA, K. WAGNER, B. GUIARD, C. M. KOEHLER et al., 2008
Assembly of the three small Tim proteins precedes docking to the mitochondrial
carrier translocase. EMBO Rep. 9: 548-554.
GELLERICH, F. N., S. TRUMBECKAITE, J. R. OPALKA, E. SEPPET, H. N. RASMUSSEN et al.,
2000 Function of the mitochondrial outer membrane as a diffusion barrier in
health and diseases. Biochem. Soc. Trans. 28: 164–169.
GENOVA, M., 2014 Electron Transport in the Mitochondrial Respiratory Chain, pp. 401-
417 in The Structural Basis of Biological Energy Generation, edited by M. F.
HOHMANN-MARRIOTT. Springer Netherlands.
GIRAUD, E., O. VAN AKEN, L. H. M. HO and J. WHELAN, 2009 The Transcription Factor
ABI4 Is a Regulator of Mitochondrial Retrograde Expression of ALTERNATIVE
OXIDASE1a. Plant Physiol. 150: 1286-1296.
GOMES, C. M., J. LE GALL, A. V. XAVIER and M. TEIXEIRA, 2001 Could a Diiron-
Containing Four-Helix-Bundle Protein Have Been a Primitive Oxygen
Reductase? ChemBioChem 2: 583-587.
GOODPASTER, B. H., 2013 Mitochondrial Deficiency Is Associated With Insulin
Resistance. Diabetes 62: 1032-1035.
GRANT, N., Y. ONDA, Y. KAKIZAKI, K. ITO, J. WATLING et al., 2009 Two Cys or Not
Two Cys? That Is the Question; Alternative Oxidase in the Thermogenic Plant
Sacred Lotus. Plant Physiol. 150: 987-995.
GRANT, N. M., R. E. MILLER, J. R. WATLING and S. A. ROBINSON, 2008 Synchronicity of
thermogenic activity, alternative pathway respiratory flux, AOX protein content,
and carbohydrates in receptacle tissues of sacred lotus during floral development.
J. Exp. Bot. 59: 705-714.
GRAY, M. W., 2012 Mitochondrial Evolution. Cold Spring Harb Perspect Biol. 4:
a011403.
60
GREDILLA, R., J. GRIEF and H. D. OSIEWACZ, 2006 Mitochondrial free radical generation
and lifespan control in the fungal aging model Podospora anserina. Exp. Gerontol.
41: 439-447.
GRIESHABER, M. K., and S. VÖLKEL, 1998 Animal adaptations for tolerance and
exploitation of poisonous sulfide. Annu. Rev. Physiol. 60: 33-53.
GRIFFITHS, A. J. F., R. A. COLLINS and F. E. NARGANG, 1995 Mitochondrial genetics of
Neurospora, pp. 93-105 in The Mycota II, Genetics and Biotechnology (U. Kück,
Ed.).
GRIPARIC, L., and A. M. VAN DER BLIEK, 2001 The many shapes of mitochondrial
membranes. Traffic 2: 235-244.
GROSS, J., and D. BHATTACHARYA, 2009 Mitochondrial and plastid evolution in
eukaryotes: an outsiders' perspective. Nat. Rev. Genet. 10: 495-505.
GUTIÉRREZ-AGUILAR, M., and C. P. BAINES, 2014 Structural mechanisms of cyclophilin
D-dependent control of the mitochondrial permeability transition pore. Biochim.
Biophys. Acta Biochim Biophys Acta.
HACKENBROCK, C., B. CHAZOTTE and S. GUPTE, 1986 The random collision model and a
critical assessment of diffusion and collision in mitochondrial electron transport.
J. Bioenerg. Biomembr. 18: 331-368.
HAMANAKA, R. B., and N. S. CHANDEL, 2009 Mitochondrial reactive oxygen species
regulate hypoxic signaling. Curr. Opin. Cell Biol. 21: 894-899.
HARBAUER, ANGELIKA B., RENÉ P. ZAHEDI, A. SICKMANN, N. PFANNER and C.
MEISINGER, 2014 The Protein Import Machinery of Mitochondria—A Regulatory
Hub in Metabolism, Stress, and Disease. Cell Metab. 19: 357-372.
HARNER, M., C. KÖRNER, D. WALTHER, D. MOKRANJAC, J. KAESMACHER et al., 2011
The mitochondrial contact site complex, a determinant of mitochondrial
architecture. EMBO J. 30: 4356-4370.
HEAD, B. P., M. ZULAIKA, S. RYAZANTSEV and A. M. VAN DER BLIEK, 2011 A novel
mitochondrial outer membrane protein, MOMA-1, that affects cristae morphology
in Caenorhabditis elegans. Mol. Biol. Cell. 22: 831-841.
HEINEMEYER, J., H.-P. BRAUN, E. J. BOEKEMA and R. KOUŘIL, 2007 A Structural Model
of the Cytochrome c Reductase/Oxidase Supercomplex from Yeast Mitochondria.
J. Biol. Chem. 282: 12240-12248.
HELLER, J., and P. TUDZYNSKI, 2011 Reactive Oxygen Species in Phytopathogenic
Fungi: Signaling, Development, and Disease. Annu. Rev. Phytopathol. 49: 369-
390.
HERRMANN, JOHANNES M., 2011 MINOS Is Plus: A Mitofilin Complex for
Mitochondrial Membrane Contacts. Dev. Cell 21: 599-600.
HERRMANN, J. M., and J. RIEMER, 2010 The Intermembrane Space of Mitochondria.
Antioxid. Redox Signal. 13.
HERRMANN, J. M., and J. RIEMER, 2012 Mitochondrial Disulfide Relay: Redox-regulated
Protein Import into the Intermembrane Space. J. Biol. Chem. 287: 4426-4433.
HILL, S., and H. VAN REMMEN, 2014 Mitochondrial stress signaling in longevity: A new
role for mitochondrial function in aging. Redox Biol. 2: 936-944.
HOLTZAPFFEL, R. C., J. CASTELLI, P. M. FINNEGAN, A. H. MILLAR, J. WHELAN et al.,
2003 A tomato alternative oxidase protein with altered regulatory properties.
Biochim. Biophys. Acta - Bioenergetics 1606: 153-162.

61
HOPPINS, S., S. R. COLLINS, A. CASSIDY-STONE, E. HUMMEL, R. M. DEVAY et al., 2011
A mitochondrial-focused genetic interaction map reveals a scaffold-like complex
required for inner membrane organization in mitochondria. J. Cell Biol. 195: 323-
340.
HORVATH, S. E., H. RAMPELT, S. OELJEKLAUS, B. WARSCHEID, M. VANDERLAAN et al.,
2015 Role of membrane contact sites in protein import into mitochondria. Protein
Sci. 24: 277-297.
HOUTKOOPER, R. H., L. MOUCHIROUD, D. RYU, N. MOULLAN, E. KATSYUBA et al., 2013
Mitonuclear protein imbalance as a conserved longevity mechanism. Nature 497:
451-457.
HUANG, X., U. VON RAD and J. DURNER, 2002 Nitric oxide induces transcriptional
activation of the nitric oxide-tolerant alternative oxidase in Arabidopsis
suspension cells. Planta 215: 914-923.
ITO-INABA, Y., Y. HIDA and T. INABA, 2009 What is critical for plant thermogenesis?
Differences in mitochondrial activity and protein expression between thermogenic
and non-thermogenic skunk cabbages. Planta 231: 121-130.
JÄGER, R., and H. O. FEARNHEAD, 2013 Mitochondrial Regulation of Cell-Death, pp. 33-
60 in Mitochondria as Targets for Phytochemicals in Cancer Prevention and
Therapy, edited by D. CHANDRA. Springer New York.
JARMUSZKIEWICZ, W., M. CZARNA and F. SLUSE, 2005 Substrate kinetics of the
Acanthamoeba castellanii alternative oxidase and the effects of GMP. Biochim.
Biophys. Acta - Bioenergetics 1708.
JARMUSZKIEWICZ, W. A., M. BEHRENDT, R. NAVET and F. E. SLUSE, 2002 Uncoupling
protein and alternative oxidase of Dictyostelium discoideum: occurrence,
properties and protein expression during vegetative life and starvation-induced
early development. FEBS Lett. 532: 459-464.
JAZWINSKI, S. M., 2013 The retrograde response: When mitochondrial quality control is
not enough. Biochim. Biophys. Acta - Mol. Cell Res. 1833: 400-409.
JAZWINSKI, S. M., and A. KRIETE, 2012 The yeast retrograde response as a model of
intracellular signaling of mitochondrial dysfunction. Front. Physiol. 3: 139.
JIA, Y., B. ROTHERMEL, J. THORNTON and R. A. BUTOW, 1997 A basic helix-loop-helix-
leucine zipper transcription complex in yeast functions in a signaling pathway
from mitochondria to the nucleus. Mol. Cell. Biol. 17: 1110-1117.
JOSEPH-HORNE, T., D. W. HOLLOMON and P. M. WOOD, 2001 Fungal respiration: a
fusion of standard and alternative components. Biochim. Biophys. Acta -
Bioenergetics 1504: 179-195.
JOVAISAITE, V., L. MOUCHIROUD and J. AUWERX, 2014 The mitochondrial unfolded
protein response, a conserved stress response pathway with implications in health
and disease. J. Exp. Biol. 217: 137-143.
JUÁREZ, O., G. GUERRA, I. VELÁZQUEZ, O. FLORES‐HERRERA, R. E. RIVERA‐PÉREZ et al.,
2006 The physiologic role of alternative oxidase in Ustilago maydis. FEBS J.
273: 4603-4615.
KARPOVA, O. V., E. V. KUZMIN, T. E. ELTHON and K. J. NEWTON, 2002 Differential
Expression of Alternative Oxidase Genes in Maize Mitochondrial Mutants. Plant
Cell 14: 3271-3284.

62
KAZLAUSKAITE, A., and M. M. K. MUQIT, 2014 PINK1 and Parkin – mitochondrial
interplay between phosphorylation and ubiquitylation in Parkinson's disease.
FEBS J. 282: 215-223.
KELLEY, D. E., J. HE, E. V. MENSHIKOVA and V. B. RITOV, 2002 Dysfunction of
Mitochondria in Human Skeletal Muscle in Type 2 Diabetes. Diabetes 51: 2944-
2950.
KEUNEN, E., M. JOZEFCZAK, T. REMANS, J. VANGRONSVELD and A. CUYPERS, 2013
Alternative respiration as a primary defence during cadmium-induced
mitochondrial oxidative challenge in Arabidopsis thaliana. Environ. Exp. Bot. 91:
63-73.
KOEHLER, C. M., S. MERCHANT, W. OPPLIGER, K. SCHMID, E. JAROSCH et al., 1998
Tim9p, an essential partner subunit of Tim10p for the import of mitochondrial
carrier proteins. EMBO J. 17: 6477-6486.
KOMEILI, A., K. P. WEDAMAN, E. K. O'SHEA and T. POWERS, 2000 Mechanism of
Metabolic Control: Target of Rapamycin Signaling Links Nitrogen Quality to the
Activity of the Rtg1 and Rtg3 Transcription Factors. J. Cell Biol. 151: 863-878.
KÖRNER, C., M. BARRERA, J. DUKANOVIC, K. EYDT, M. HARNER et al., 2012 The C-
terminal domain of Fcj1 is required for formation of crista junctions and interacts
with the TOB/SAM complex in mitochondria. Mol. Biol. Cell. 23: 2143-2155.
KORNMANN, B., and P. WALTER, 2010 ERMES-mediated ER-mitochondria contacts:
molecular hubs for the regulation of mitochondrial biology. J. Cell Sci. 123:
1389-1393.
KOUSSEVITZKY, S., A. NOTT, T. C. MOCKLER, F. HONG, G. SACHETTO-MARTINS et al.,
2007 Signals from Chloroplasts Converge to Regulate Nuclear Gene Expression.
Science 316: 715-719.
KUTIK, S., D. STOJANOVSKI, L. BECKER, T. BECKER, M. MEINECKE et al., 2008
Dissecting Membrane Insertion of Mitochondrial β-Barrel Proteins. Cell 132:
1011-1024.
KUZMIN, E. V., O. V. KARPOVA, T. E. ELTHON and K. J. NEWTON, 2004 Mitochondrial
respiratory deficiencies signal up-regulation of genes for heat shock proteins. J.
Biol. Chem. 279: 20672-20677.
LAKE, J. A., E. HENDERSON, M. OAKES and M. W. CLARK, 1984 Eocytes: a new
ribosome structure indicates a kingdom with a close relationship to eukaryotes.
Proc. Natl. Acad. Sci. USA 81: 3786-3790.
LAMBOWITZ, A. M., J. R. SABOURIN, H. BERTRAND, R. NICKELS and L. MCINTOSH, 1989
Immunological identification of the alternative oxidase of Neurospora crassa
mitochondria. Mol. Cell. Biol. 9: 1362-1364.
LAMBOWITZ, A. M., and C. W. SLAYMAN, 1971 Cyanide-Resistant Respiration in
Neurospora crassa. J. Bacteriol. 108: 1087-1096.
LAMBOWITZ, A. M., C. W. SLAYMAN, C. L. SLAYMAN and W. D. BONNER, 1972 The
electron transport components of wild type and poky strains of Neurospora crassa.
J. Biol. Chem. 247: 1536-1545.
LANG, B. F., 2014 Mitochondria and the Origin of Eukaryotes, pp. 3-18 in
Endosymbiosis, edited by W. LÖFFELHARDT. Springer Vienna.
LAPOINTE, J., and S. HEKIMI, 2008 Early mitochondrial dysfunction in long-lived
Mclk1+/-mice. J. Biol. Chem. 283: 26217-26227.

63
LEE, C., K. YEN and P. COHEN, 2013 Humanin: a harbinger of mitochondrial-derived
peptides? Trends Endocrinol. Metab. 24: 222-228.
LEE, H.-C., and Y.-H. WEI, 2012 Mitochondria and Aging, pp. 311-327 in Advances in
Mitochondrial Medicine, edited by R. SCATENA, P. BOTTONI and B. GIARDINA.
Springer Netherlands.
LEE, S.-J., A. B. HWANG and C. KENYON, 2010 Inhibition of Respiration Extends C.
elegans Life Span via Reactive Oxygen Species that Increase HIF-1 Activity.
Curr. Biol. 20: 2131-2136.
LEISTER, D., 2012 Retrograde signaling in plants: from simple to complex scenarios.
Front. Plant. Sci. 3: 135.
LENAZ, G., and M. GENOVA, 2012 Supramolecular Organisation of the Mitochondrial
Respiratory Chain: A New Challenge for the Mechanism and Control of
Oxidative Phosphorylation, pp. 107-144 in Mitochondrial Oxidative
Phosphorylation, edited by B. KADENBACH. Springer New York.
LENAZ, G., and M. L. GENOVA, 2010 Structure and Organization of Mitochondrial
Respiratory Complexes: A New Understanding of an Old Subject. Antioxid.
Redox Signaling 12: 961-1008.
LESNIK, C., Y. COHEN, A. ATIR-LANDE, M. SCHULDINER and Y. ARAVA, 2014 OM14 is a
mitochondrial receptor for cytosolic ribosomes that supports co-translational
import into mitochondria. Nat Commun. 5: 5711.
LI, Q., R. G. RITZEL, L. L. MCLEAN, L. MCINTOSH, T. KO et al., 1996 Cloning and
analysis of the alternative oxidase gene of Neurospora crassa. Genetics 142: 129-
140.
LI, Z.-Y., Y. YANG, M. MING and B. LIU, 2011 Mitochondrial ROS generation for
regulation of autophagic pathways in cancer. Biochem. Biophys. Res. Commun.
414: 5-8.
LIAO, X., and R. A. BUTOW, 1993 RTG1 and RTG2: Two yeast genes required for a
novel path of communication from mitochondria to the nucleus. Cell 72: 61-71.
LIAO, X. S., W. C. SMALL, P. A. SRERE and R. A. BUTOW, 1991 Intramitochondrial
functions regulate nonmitochondrial citrate synthase (CIT2) expression in
Saccharomyces cerevisiae. Mol. Cell. Biol. 11: 38-46.
LILL, R., 2009 Function and biogenesis of iron–sulphur proteins. Nature 460: 831-838.
LINDSAY, J., M. D. ESPOSTI and A. P. GILMORE, 2011 Bcl-2 proteins and mitochondria—
Specificity in membrane targeting for death. Biochim. Biophys. Acta - Mol. Cell
Res. 1813: 532-539.
LISTER, R., C. CARRIE, O. DUNCAN, L. H. M. HO, K. A. HOWELL et al., 2007 Functional
Definition of Outer Membrane Proteins Involved in Preprotein Import into
Mitochondria. Plant Cell 19: 3739-3759.
LIU, J., Q. WU, D. HE, T. MA, L. DU et al., 2011 Drosophila sbo regulates lifespan
through its function in the synthesis of coenzyme Q in vivo. J. Genet. Genomics
38: 225-234.
LIU, Z., and R. A. BUTOW, 2006 Mitochondrial Retrograde Signaling. Annu. Rev. Genet.
40: 159-185.
LOGAN, D. C., 2006 The mitochondrial compartment. J. Exp. Bot. 57: 1225–1243.
LUTTIK, M. A. H., K. M. OVERKAMP, P. KÖTTER, S. DE VRIES, J. P. VAN DIJKEN et al.,
1998 The Saccharomyces cerevisiae NDE1 andNDE2 Genes Encode Separate
64
Mitochondrial NADH Dehydrogenases Catalyzing the Oxidation of Cytosolic
NADH. J. Biol. Chem. 273: 24529-24534.
MACPHERSON, S., M. LAROCHELLE and B. TURCOTTE, 2006 A Fungal Family of
Transcriptional Regulators: the Zinc Cluster Proteins. Microbiol. Mol. Biol. Rev.
70: 583-604.
MAGNANI, T., F. M. SORIANI, V. P. MARTINS, A. M. NASCIMENTO, V. G. TUDELLA et al.,
2007 Cloning and functional expression of the mitochondrial alternative oxidase
of Aspergillus fumigatus and its induction by oxidative stress. FEMS Microbiol.
Lett. 271: 230-238.
MAIO, N., and T. A. ROUAULT, 2014 Iron–sulfur cluster biogenesis in mammalian cells:
New insights into the molecular mechanisms of cluster delivery. Biochim.
Biophys. Acta - Mol. Cell Res. 1853: 1493-1512.
MALLIKARJUN, V., A. SRIRAM, F. SCIALO and A. SANZ, 2014 The interplay between
mitochondrial protein and iron homeostasis and its possible role in ageing. Exp.
Gerontol. 56: 123-134.
MANNELLA, C. A., 2006 Structure and dynamics of the mitochondrial inner membrane
cristae. Biochim. Biophys. Acta - Mol. Cell Res. 1763: 542-548.
MANNELLA, C. A., 2008 Structural Diversity of Mitochondria. Ann. N. Y. Acad. Sci.
1147: 171-179.
MARCHI, S., S. PATERGNANI and P. PINTON, 2014 The endoplasmic reticulum–
mitochondria connection: One touch, multiple functions. Biochim. Biophys. Acta
- Bioenergetics 1837: 461-469.
MARGULIS, L., 1970 Origin of Eukaryotic Cells. Yale University Press, New Haven.
MARQUES, I., N. A. DENCHER, A. VIDEIRA and F. KRAUSE, 2007 Supramolecular
Organization of the Respiratory Chain in Neurospora crassa Mitochondria.
Eukaryot. Cell 6: 2391-2405.
MARTIN, W., and K. V. KOWALLIK, 1999 Annotated English translation of
Mereschkowsky's 1905 paper. Eur. J. Phycol. 34: 287-295.
MARTINUS, R. D., G. P. GARTH, T. L. WEBSTER, P. CARTWRIGHT, D. J. NAYLOR et al.,
1996 Selective Induction of Mitochondrial Chaperones in Response to Loss of the
Mitochondrial Genome. Eur. J. Biochem. 240: 98-103.
MATUS-ORTEGA, M. G., K. G. SALMERÓN-SANTIAGO, O. FLORES-HERRERA, G. GUERRA-
SÁNCHEZ, F. MARTÍNEZ et al., 2011 The alternative NADH dehydrogenase is
present in mitochondria of some animal taxa. Comp. Biochem. Physiol. Part D
Genomics Proteomics 6: 256-263.
MAXWELL, D. P., Y. WANG and L. MCINTOSH, 1999 The alternative oxidase lowers
mitochondrial reactive oxygen production in plant cells. Proc. Natl. Acad. Sci.
USA 96: 8271-8276.
MCCLUSKEY, K., 2012 Variation in mitochondrial genome primary sequence among
whole-genome-sequenced strains of Neurospora crassa. IMA Fungus 3: 93-98.
MCDONALD, A. E., 2008 Alternative oxidase: an inter-kingdom perspective on the
function and regulation of this broadly distributed'cyanide-resistant'terminal
oxidase. Funct. Plant Biol. 35: 535-552.
MCDONALD, A. E., and G. C. VANLERBERGHE, 2004 Branched Mitochondrial Electron
Transport in the Animalia: Presence of Alternative Oxidase in Several Animal
Phyla. IUBMB Life 56: 333-341.

65
MCDONALD, A. E., and G. C. VANLERBERGHE, 2006 Origins, evolutionary history, and
taxonomic distribution of alternative oxidase and plastoquinol terminal oxidase.
Comp. Biochem. Physiol. Part D Genomics Proteomics 1: 357-364.
MCDONALD, A. E., G. C. VANLERBERGHE and J. F. STAPLES, 2009 Alternative oxidase in
animals: unique characteristics and taxonomic distribution. J. Exp. Biol. 212:
2627-2634.
MCINERNEY, J. O., M. J. O'CONNELL and D. PISANI, 2014 The hybrid nature of the
Eukaryota and a consilient view of life on Earth. Nat. Rev. Microbiol. 12: 449-
455.
MEDENTSE, A. G., A. Y. ARINBASAROVA, N. M. SMIRNOVA and V. K. AKIMENKO, 2004
Activation of the alternative oxidase of Yarrowia lipolytica by adenosine
monophosphate. Microbiology 73: 117-123.
MEISINGER, C., A. SICKMANN and N. PFANNER, 2008 The Mitochondrial Proteome: From
Inventory to Function. Cell 134: 22-24.
MERKX, M., D. A. KOPP, M. H. SAZINSKY, J. L. BLAZYK, J. MÜLLER et al., 2001
Dioxygen Activation and Methane Hydroxylation by Soluble Methane
Monooxygenase: A Tale of Two Irons and Three Proteins. Angew. Chem. Int. Ed.
40: 2782-2807.
MICELI, M. V., J. C. JIANG, A. TIWARI, J. F. RODRIGUEZ-QUIÑONES and S. M.
JAZWINSKI, 2011 Loss of Mitochondrial Membrane Potential Triggers the
Retrograde Response Extending Yeast Replicative Lifespan. Front. Genet. 2: 102.
MILLAR, A. H., J. T. WISKICH, J. WHELAN and D. A. DAY, 1993 Organic acid activation
of the alternatlve oxidase of plant mitochondria. FEBS Lett. 329: 259-262.
MINAGAWA, N., S. KOGA, M. NAKANO, S. SAKAJO and A. YOSHIMOTO, 1992 Possible
involvement of superoxide anion in the induction of cyanide-resistant respiration
in Hansenula anomala. FEBS Lett. 302: 217-219.
MISHRA, P., and D. C. CHAN, 2014 Mitochondrial dynamics and inheritance during cell
division, development and disease. Nat. Rev. Mol. Cell Biol. 15: 634-646.
MÖGLICH, A., R. A. AYERS and K. MOFFAT, 2009 Structure and signaling mechanism of
Per-ARNT-Sim domains. Structure 17: 1282-1294.
MOORE, A. L., and M. S. ALBURY, 2008 Further insights into the structure of the
alternative oxidase: from plants to parasites. Biochem. Soc. Trans. 36: 1022-1026.
MOORE, A. L., W. D. BONNER JR and P. R. RICH, 1978 The determination of the proton-
motive force during cyanide-insensitive respiration in plant mitochondria. Arch.
Biochem. Biophys. 186: 298-306.
MOORE, A. L., T. SHIBA, L. YOUNG, S. HARADA, K. KITA et al., 2013 Unraveling the
heater: new insights into the structure of the alternative oxidase. Annu. Rev. Plant
Biol. 64: 637-663.
MORRIS, J. C., M. E. DREW, M. M. KLINGBEIL, S. A. MOTYKA, T. T. SAXOWSKY et al.,
2001 Replication of kinetoplast DNA: an update for the new millennium. Int. J.
Parasitol. 31: 453-458.
MOSSMANN, D., C. MEISINGER and F. N. VÖGTLE, 2012 Processing of mitochondrial
presequences. Biochim. Biophys. Acta - Gene Regulatory Mechanisms 1819:
1098-1106.

66
MUN, J. Y., T. H. LEE, J. H. KIM, B. H. YOO, Y. Y. BAHK et al., 2010 Caenorhabditis
elegans mitofilin homologs control the morphology of mitochondrial cristae and
influence reproduction and physiology. J. Cell. Physio. 224: 748-756.
MURPHY, M. P., 2009 How mitochondria produce reactive oxygen species. Biochem.
J. 417 1–13.
NARGANG, F. E., K. ADAMES, C. RÜB, S. CHEUNG, N. EASTON et al., 2012 Identification
of Genes Required for Alternative Oxidase Production in the Neurospora crassa
Gene Knockout Library. G3 (Bethesda) 2: 1345-1356.
NEUPERT, W., and J. M. HERRMANN, 2007 Translocation of Proteins into Mitochondria.
Annu. Rev. Biochem. 76: 723-749.
NG, S., I. DE CLERCQ, O. VAN AKEN, S. R. LAW, A. IVANOVA et al., 2014 Anterograde
and Retrograde Regulation of Nuclear Genes Encoding Mitochondrial Proteins
during Growth, Development, and Stress. Mol. Plant 7: 1075-1093.
NORDLUND, P., and H. EKLUND, 1995 Di-iron—carboxylate proteins. Curr. Opin. Struct.
Biol. 5: 758-766.
O’MALLEY, M. A., 2010 The first eukaryote cell: an unfinished history of contestation.
Studies Histor. Philos. Biol. Biomed. Sci. 41: 212-224.
OSELLAME, L. D., T. S. BLACKER and M. R. DUCHEN, 2012 Cellular and molecular
mechanisms of mitochondrial function. Best Pract. Res. Clin. Endocrinol. Metab.
26: 711-723.
OSMAN, C., D. R. VOELKER and T. LANGER, 2011 Making heads or tails of phospholipids
in mitochondria. J. Cell Biol. 192: 7-16.
OWEN, O. E., S. C. KALHAN and R. W. HANSON, 2002 The Key Role of Anaplerosis and
Cataplerosis for Citric Acid Cycle Function. J. Biol. Chem. 277: 30409-30412.
PAGLIARINI, D. J., S. E. CALVO, B. CHANG, S. A. SHETH, S. B. VAFAI et al., 2008 A
Mitochondrial Protein Compendium Elucidates Complex I Disease Biology. Cell
134: 112-123.
PAPA, S., P. MARTINO, G. CAPITANIO, A. GABALLO, D. DE RASMO et al., 2012 The
Oxidative Phosphorylation System in Mammalian Mitochondria, pp. 3-37 in
Advances in Mitochondrial Medicine, edited by R. SCATENA, P. BOTTONI and B.
GIARDINA. Springer Netherlands.
PAPIĆ, D., K. KRUMPE, J. DUKANOVIC, K. S. DIMMER and D. RAPAPORT, 2011 Multispan
mitochondrial outer membrane protein Ugo1 follows a unique Mim1-dependent
import pathway. J. Cell Biol. 194: 397-405.
PARSONS, M. J., and D. R. GREEN, 2010 Mitochondria in cell death. Essays Biochem. 47:
99–114.
PASCHEN, S. A., T. WAIZENEGGER, T. STAN, M. PREUSS, M. CYRKLAFF et al., 2003
Evolutionary conservation of biogenesis of [beta]-barrel membrane proteins.
Nature 426: 862-866.
PASQUALINI, S., F. PAOLOCCI, A. BORGOGNI, R. MORETTINI and L. EDERLI, 2007 The
overexpression of an alternative oxidase gene triggers ozone sensitivity in tobacco
plants. Plant, Cell Environ. 30: 1545-1556.
PASSOS, J. F., G. SARETZKI, S. AHMED, G. NELSON, T. RICHTER et al., 2007
Mitochondrial dysfunction accounts for the stochastic heterogeneity in telomere-
dependent senescence. PLoS Biol. 5: e110.

67
PATTI, M.-E., and S. CORVERA, 2010 The Role of Mitochondria in the Pathogenesis of
Type 2 Diabetes. Endocr. Rev. 31: 364-395.
PFANNER, N., M. VAN DER LAAN, P. AMATI, R. A. CAPALDI, A. A. CAUDY et al., 2014
Uniform nomenclature for the mitochondrial contact site and cristae organizing
system. J. Cell Biol. 204: 1083-1086.
PIZZO, P., I. DRAGO, R. FILADI and T. POZZAN, 2012 Mitochondrial Ca2+ homeostasis:
mechanism, role, and tissue specificities. Pflug. Arch. Eur. J. Phy. 464: 3-17.
POLIDOROS, A. N., P. V. MYLONA and B. ARNHOLDT-SCHMITT, 2009 Aox gene structure,
transcript variation and expression in plants. Physiol. Plant. 137: 342-353.
POLIDOROS, A. N., P. V. MYLONA, K. PASENTSIS, J. G. SCANDALIOS and A. S.
TSAFTARIS, 2005 The maize alternative oxidase 1a (Aox1a) gene is regulated by
signals related to oxidative stress. Redox Rep. 10: 71-78.
POULTON, J. E., 1990 Cyanogenesis in Plants. Plant Physiol. 94: 401-405.
RASMUSSON, A. G., A. R. FERNIE and J. T. VAN DONGEN, 2009 Alternative oxidase: a
defence against metabolic fluctuations? Physiol. Plant. 137: 371-382.
RASMUSSON, A. G., K. L. SOOLE and T. E. ELTHON, 2004 Alternative NAD (P) H
dehydrogenases of plant mitochondria. Annu. Rev. Plant Biol. 55: 23-39.
REINDERS, J., R. P. ZAHEDI, N. PFANNER, C. MEISINGER and A. SICKMANN, 2006 Toward
the Complete Yeast Mitochondrial Proteome: Multidimensional Separation
Techniques for Mitochondrial Proteomics. J. Proteome Res. 5: 1543-1554.
RHOADS, D., 2011 Plant Mitochondrial Retrograde Regulation, pp. 411-437 in Plant
Mitochondria, edited by F. KEMPKEN. Springer New York.
RHOADS, D. M., and L. MCINTOSH, 1993 The salicylic acid-inducible alternative oxidase
gene aox1 and genes encoding pathogenesis-related proteins share regions of
sequence similarity in their promoters. Plant Mol. Biol. 21: 615-624.
RHOADS, D. M., A. L. UMBACH, C. R. SWEET, A. M. LENNON, G. S. RAUCH et al., 1998
Regulation of the cyanide-resistant alternative oxidase of plant mitochondria.
Identification of the cysteine residue involved in alpha-keto acid stimulation and
intersubunit disulfide bond formation. J. Biol. Chem. 273: 30750-30756.
RIBEIRO, S., and G. B. GOLDING, 1998 The mosaic nature of the eukaryotic nucleus. Mol.
Biol. Evol. 15: 779-788.
RICH, P. R., and A. L. MOORE, 1976 The involvement of the protonmotive ubiquinone
cycle in the respiratory chain of higher plants and its relation to the branchpoint of
the alternate pathway. FEBS Lett. 65: 339-344.
RIFKIN, M. R., and D. J. L. LUCK, 1971 Defective Production of Mitochondrial
Ribosomes in the Poky Mutant of Neurospora crassa. Proc. Natl. Acad. Sci. USA
68: 287-290.
RIVERA, M. C., and J. A. LAKE, 2004 The ring of life provides evidence for a genome
fusion origin of eukaryotes. Nature 431: 152-155.
RIZZUTO, R., D. DE STEFANI, A. RAFFAELLO and C. MAMMUCARI, 2012 Mitochondria as
sensors and regulators of calcium signalling. Nat. Rev. Mol. Cell Biol. 13: 566-
578.
ROUSSEAU-GUEUTIN, M., A. LLOYD, A. SHEPPARD and J. TIMMIS, 2012 Gene Transfer to
the Nucleus, pp. 147-171 in Organelle Genetics, edited by C. E. BULLERWELL.
Springer Berlin Heidelberg.

68
RUNKEL, E. D., R. BAUMEISTER and E. SCHULZE, 2014 Mitochondrial stress: Balancing
friend and foe. Exp. Gerontol. 56: 194-201.
RUSTIN, P., T. BOURGERON, B. PARFAIT, D. CHRETIEN, A. MUNNICH et al., 1997 Inborn
errors of the Krebs cycle: a group of unusual mitochondrial diseases in human.
Biochimica et Biophysica Acta (BBA) - Molecular Basis of Disease 1361: 185-
197.
SACCONE, C., 2011 Mitochondrial Genome. eLS.
SAGAN, L., 1967 On the origin of mitosing cells. J. Theor. Biol. 14: 225-IN226.
SAIKA, H., K. OHTSU, S. HAMANAKA, M. NAKAZONO, N. TSUTSUMI et al., 2002 AOX1c,
a novel rice gene for alternative oxidase; comparison with rice AOX1a and
AOX1b. Genes Genet. Syst. 77: 31.
SAISHO, D., E. NAMBARA, S. NAITO, N. TSUTSUMI, A. HIRAI et al., 1997 Characterization
of the gene family for alternative oxidase from Arabidopsis thaliana. Plant Mol.
Biol. 35: 585-596.
SAXTON, W. M., and P. J. HOLLENBECK, 2012 The axonal transport of mitochondria. J.
Cell Sci. 125: 2095-2104.
SCHEFFLER, I. E., 2008 Mitochondria. J. Wiley and Sons, Inc., Hoboken, New Jersey,
462.
SCHIEBER, M., and N. S. CHANDEL, 2014 ROS Function in Redox Signaling and
Oxidative Stress. Curr. Biol. 24: R453-R462.
SCHMIDT, O., N. PFANNER and C. MEISINGER, 2010 Mitochondrial protein import: from
proteomics to functional mechanisms. Nat. Rev. Mol. Cell Biol. 11: 655-667.
SCHMITT, S., H. PROKISCH, T. SCHLUNCK, D. G. CAMP, U. AHTING et al., 2006 Proteome
analysis of mitochondrial outer membrane from Neurospora crassa. Proteomics 6:
72-80.
SCHONBAUM, G. R., W. D. BONNER, B. T. STOREY and J. T. BAHR, 1971 Specific
inhibition of the cyanide-insensitive respiratory pathway in plant mitochondria by
hydroxamic acids. Plant Physiol. 47: 124-128.
SCHROEDER, E. A., N. RAIMUNDO and G. S. SHADEL, 2013 Epigenetic silencing mediates
mitochondria stress-induced longevity. Cell Metab. 17: 954-964.
SCHULTZ, B. E., and S. I. CHAN, 2001 Structures and proton-pumping strategies of
mitochondrial respiratory enzymes. Annu. Rev. Biophys. Biomol. Struct. 30: 23-
65.
SEKITO, T., J. THORNTON and R. A. BUTOW, 2000 Mitochondria-to-nuclear signaling is
regulated by the subcellular localization of the transcription factors Rtg1p and
Rtg3p. Mol. Biol. Cell. 11: 2103-2115.
SHAPIRO, T. A., and P. T. ENGLUND, 1995 The structure and replication of kinetoplast
DNA. Annu. Rev. Microbiol. 49: 117-143.
SHIBA, T., Y. KIDO, K. SAKAMOTO, D. K. INAOKA, C. TSUGE et al., 2013 Structure of the
trypanosome cyanide-insensitive alternative oxidase. Proc. Natl. Acad. Sci. USA
110: 4580-4585.
SHLOMAI, J., 2004 The structure and replication of kinetoplast DNA. Curr. Mol. Med. 4:
623-647.
SIEDOW, J. N., A. L. UMBACH and A. L. MOORE, 1995 The active site of the cyanide-
resistant oxidase from plant mitochondria contains a binuclear iron center. FEBS
Lett. 362: 10-14.

69
SIMONS, B. H., F. F. MILLENAAR, L. MULDER, L. C. VAN LOON and H. LAMBERS, 1999
Enhanced Expression and Activation of the Alternative Oxidase during Infection
of Arabidopsis withPseudomonas syringae pv tomato. Plant Physiol. 120: 529-
538.
SMALL, W. C., and L. MCALISTER-HENN, 1998 Identification of a Cytosolically Directed
NADH Dehydrogenase in Mitochondria of Saccharomyces cerevisiae. J.
Bacteriol. 180: 4051-4055.
SONG, Z., H. CHEN, M. FIKET, C. ALEXANDER and D. C. CHAN, 2007 OPA1 processing
controls mitochondrial fusion and is regulated by mRNA splicing, membrane
potential, and Yme1L. The Journal of Cell Biology 178: 749-755.
STEHLING, O., and R. LILL, 2013 The Role of Mitochondria in Cellular Iron–Sulfur
Protein Biogenesis: Mechanisms, Connected Processes, and Diseases. Cold
Spring Harb Perspect Biol. 5: a011312.
STENMARK, P., and P. NORDLUND, 2003 A prokaryotic alternative oxidase present in the
bacterium Novosphingobium aromaticivorans. FEBS Lett. 552: 189-192.
STOJANOVSKI, D., P. BRAGOSZEWSKI and A. CHACINSKA, 2012 The MIA pathway: A
tight bond between protein transport and oxidative folding in mitochondria.
Biochim. Biophys. Acta - Mol. Cell Res. 1823: 1142-1150.
STRAUSS, M., G. HOFHAUS, R. R. SCHRÖDER and W. KÜHLBRANDT, 2008 Dimer ribbons
of ATP synthase shape the inner mitochondrial membrane. EMBO J. 27: 1154-
1160.
SUZUKI, Y., S. L. MURRAY, K. H. WONG, M. A. DAVIS and M. J. HYNES, 2012
Reprogramming of carbon metabolism by the transcriptional activators AcuK and
AcuM in Aspergillus nidulans. Mol. Microbiol. 84: 942-964.
SWEETLOVE, L. J., K. F. M. BEARD, A. NUNES-NESI, A. R. FERNIE and R. G. RATCLIFFE,
2010 Not just a circle: flux modes in the plant TCA cycle. Trends Plant Sci. 15:
462-470.
SZTUKOWSKA, M., M. BUGNO, J. POTEMPA, J. TRAVIS and D. M. KURTZ JR, 2002 Role of
rubrerythrin in the oxidative stress response of Porphyromonas gingivalis. Mol.
Microbiol. 44: 479-488.
TAIT, S. W. G., and D. R. GREEN, 2010 Mitochondria and cell death: outer membrane
permeabilization and beyond. Nat. Rev. Mol. Cell Biol. 11: 621-632.
TAKUMI, S., M. TOMIOKA, K. ETO, N. NAYDENOV and C. NAKAMURA, 2002
Characterization of two non-homoeologous nuclear genes encoding mitochondrial
alternative oxidase in common wheat. Genes Genet. Syst. 77: 81-88.
TANTON, L. L., C. E. NARGANG, K. E. KESSLER, Q. LI and F. E. NARGANG, 2003
Alternative oxidase expression in Neurospora crassa. Fungal Genet. Biol. 39:
176-190.
TAYLOR, B. L., and I. B. ZHULIN, 1999 PAS domains: internal sensors of oxygen, redox
potential, and light. Microbiol. Mol. Biol. Rev. 63: 479-506.
TAYLOR, S. S., P. ZHANG, J. M. STEICHEN, M. M. KESHWANI and A. P. KORNEV, 2013
PKA: lessons learned after twenty years. Biochimica et Biophysica Acta (BBA)-
Proteins and Proteomics 1834: 1271-1278.
THIRKETTLE-WATTS, D., T. C. MCCABE, R. CLIFTON, C. MOORE, P. M. FINNEGAN et al.,
2003 Analysis of the Alternative Oxidase Promoters from Soybean. Plant Physiol.
133: 1158-1169.

70
TIMMIS, J. N., M. A. AYLIFFE, C. Y. HUANG and W. MARTIN, 2004 Endosymbiotic gene
transfer: organelle genomes forge eukaryotic chromosomes. Nat. Rev. Genet. 5:
123-135.
TOKARZ, P., and J. BLASIAK, 2014 Role of mitochondria in carcinogenesis. Acta
Biochim. Pol.
TOUZET, P., and E. H. MEYER, 2014 Cytoplasmic male sterility and mitochondrial
metabolism in plants. Mitochondrion 19, Part B: 166-171.
TRAVEN, A., J. M. S. WONG, D. XU, M. SOPTA and C. J. INGLES, 2001 Interorganellar
communication Altered nuclear gene expression profiles in a yeast mitochondrial
DNA mutant. J. Biol. Chem. 276: 4020-4027.
TRIFUNOVIC, A., A. WREDENBERG, M. FALKENBERG, J. N. SPELBRINK, A. T. ROVIO et
al., 2004 Premature ageing in mice expressing defective mitochondrial DNA
polymerase. Nature 429: 417-423.
UMBACH, A. L., M. A. GONZÀLEZ-MELER, C. R. SWEET and J. N. SIEDOW, 2002
Activation of the plant mitochondrial alternative oxidase: insights from site-
directed mutagenesis. Biochim. Biophys. Acta - Bioenergetics 1554: 118-128.
UMBACH, A. L., V. S. NG and J. N. SIEDOW, 2006 Regulation of plant alternative oxidase
activity: A tale of two cysteines. Biochim. Biophys. Acta - Bioenergetics 1757:
135-142.
UMBACH, A. L., and J. N. SIEDOW, 1993 Covalent and noncovalent dimers of the
cyanide-resistant alternative oxidase protein in higher plant mitochondria and
their relationship to enzyme activity. Plant Physiol. 103: 845-854.
UMBACH, A. L., J. T. WISKICH and J. N. SIEDOW, 1994 Regulation of alternative oxidase
kinetics by pyruvate and intermolecular disulfide bond redox status in soybean
seedling mitochondria. FEBS Lett. 348: 181-184.
VAN AKEN, O., E. GIRAUD, R. CLIFTON and J. WHELAN, 2009 Alternative oxidase: a
target and regulator of stress responses. Physiol. Plant. 137: 354-361.
VAN AKEN, O., B. ZHANG, S. LAW, R. NARSAI and J. WHELAN, 2013 AtWRKY40 and
AtWRKY63 Modulate the Expression of Stress-Responsive Nuclear Genes
Encoding Mitochondrial and Chloroplast Proteins. Plant Physiol. 162: 254-271.
VAN DER BLIEK, A. M., Q. SHEN and S. KAWAJIRI, 2013 Mechanisms of Mitochondrial
Fission and Fusion. Cold Spring Harb Perspect Biol. 5: pii: a011072.
VAN DER GIEZEN, M., 2011 Mitochondria and the Rise of Eukaryotes. Bioscience 61:
594-601.
VAN DER LAAN, M., M. BOHNERT, N. WIEDEMANN and N. PFANNER, 2012 Role of
MINOS in mitochondrial membrane architecture and biogenesis. Trends Cell
Biol. 22: 185-192.
VANDERLEYDEN, J., C. PEETERS, H. VERACHTERT and H. BERTRAND, 1980 Stimulation
of the alternative oxidase of Neurospora crassa by Nucleoside phosphates.
Biochem. J. 188: 141-144.
VANLERBERGHE, G. C., D. A. DAY, J. T. WISKICH, A. E. VANLERBERGHE and L.
MCINTOSH, 1995 Alternative Oxidase Activity in Tobacco Leaf Mitochondria
(Dependence on Tricarboxylic Acid Cycle-Mediated Redox Regulation and
Pyruvate Activation). Plant Physiol. 109: 353-361.
VANLERBERGHE, G. C., and L. MCINTOSH, 1997 Alternative oxidase: From gene to
function. Annu. Rev. Plant Physiol. Plant Mol. Biol. 48: 703-734.
71
VANLERBERGHE, G. C., L. MCINTOSH and J. Y. H. YIP, 1998 Molecular localization of a
redox-modulated process regulating plant mitochondrial electron transport. Plant
Cell 10: 1551-1560.
VANLERBERGHE, G. C., and L. MCLNTOSH, 1996 Signals regulating the expression of the
nuclear gene encoding alternative oxidase of plant mitochondria. Plant Physiol.
111: 589-595.
VEIGA, A., J. D. ARRABAÇA and M. C. LOUREIRO‐DIAS, 2003 Cyanide‐resistant
respiration, a very frequent metabolic pathway in yeasts. FEMS Yeast Res. 3:
239-245.
VON DER MALSBURG, K., JUDITH M. MÜLLER, M. BOHNERT, S. OELJEKLAUS, P.
KWIATKOWSKA et al., 2011 Dual Role of Mitofilin in Mitochondrial Membrane
Organization and Protein Biogenesis. Dev. Cell 21: 694-707.
WAGNER, A. M., 1995 A role for active oxygen species as second messengers in the
induction of alternative oxidase gene expression in Petunia hybrida cells. FEBS
Lett. 368: 339-342.
WAGNER, A. M., K. KRAB, M. J. WAGNER and A. L. MOORE, 2008 Regulation of
thermogenesis in flowering Araceae: the role of the alternative oxidase. Biochim.
Biophys. Acta - Bioenergetics 1777: 993-1000.
WALLIN, I. E., 1923 The Mitochondria Problem. Am. Nat. 57: 255-261.
WATANABE, C. K., T. HACHIYA, I. TERASHIMA and K. O. NOGUCHI, 2008 The lack of
alternative oxidase at low temperature leads to a disruption of the balance in
carbon and nitrogen metabolism, and to an up-regulation of antioxidant defence
systems in Arabidopsis thaliana leaves. Plant, Cell Environ. 31: 1190-1202.
WATANABE, K. I., Y. BESSHO, M. KAWASAKI and H. HORI, 1999 Mitochondrial genes are
found on minicircle DNA molecules in the mesozoan animal Dicyema1. J. Mol.
Biol. 286: 645-650.
WEST, A. P., G. S. SHADEL and S. GHOSH, 2011 Mitochondria in innate immune
responses. Nat. Rev. Immunol. 11: 389-402.
WESTERMANN, B., 2008 Molecular Machinery of Mitochondrial Fusion and Fission. J.
Biol. Chem. 283: 13501-13505.
WOESE, C. R., 1987 Bacterial evolution. Microbiol. Rev. 51: 221-271.
WONG, W., and J. D. SCOTT, 2004 AKAP signalling complexes: focal points in space and
time. Nat. Rev. Mol. Cell Biol. 5: 959-970.
WOODSON, J. D., and J. CHORY, 2008 Coordination of gene expression between
organellar and nuclear genomes. Nat. Rev. Genet. 9: 383-395.
WU, M., A. KALYANASUNDARAM and J. ZHU, 2013 Structural and biomechanical basis of
mitochondrial movement in eukaryotic cells. Int. J. Nanomedicine 8: 4033-4042.
XU, X., C. C. CHUA, J. GAO, R. C. HAMDY and B. H. L. CHUA, 2006 Humanin Is a Novel
Neuroprotective Agent Against Stroke. Stroke 37: 2613-2619.
YANG, D., Y. OYAIZU, H. OYAIZU, G. J. OLSEN and C. R. WOESE, 1985 Mitochondrial
origins. Proc. Natl. Acad. Sci. USA 82: 4443-4447.
YANG, W., and S. HEKIMI, 2010 A Mitochondrial Superoxide Signal Triggers Increased
Longevity in Caenorhabditis elegans. PLoS Biol. 8: e1000556.
YLIKALLIO, E., and A. SUOMALAINEN, 2012 Mechanisms of mitochondrial diseases. Ann.
Med. 44: 41-59.

72
YOGEV, O., S. KARNIELY and O. PINES, 2007 Translation-coupled Translocation of Yeast
Fumarase into Mitochondria in Vivo. J. Biol. Chem. 282: 29222-29229.
YONEDA, T., C. BENEDETTI, F. URANO, S. G. CLARK, H. P. HARDING et al., 2004
Compartment-specific perturbation of protein handling activates genes encoding
mitochondrial chaperones. J. Cell Sci. 117: 4055-4066.
YOULE, R. J., and M. KARBOWSKI, 2005 Mitochondrial fission in apoptosis. Nat. Rev.
Mol. Cell Biol. 6: 657-663.
YOUNG, J. C., N. J. HOOGENRAAD and F. U. HARTL, 2003 Molecular Chaperones Hsp90
and Hsp70 Deliver Preproteins to the Mitochondrial Import Receptor Tom70. Cell
112: 41-50.
YUKIOKA, H., S. INAGAKI, R. TANAKA, K. KATOH, N. MIKI et al., 1998 Transcriptional
activation of the alternative oxidase gene of the fungus Magnaporthe grisea by a
respiratory-inhibiting fungicide and hydrogen peroxide. Biochim. Biophys. Acta -
Gene Struct. Expr. 1442: 161-169.
ZERBES, R. M., M. BOHNERT, D. A. STROUD, K. VON DER MALSBURG, A. KRAM et al.,
2012 Role of MINOS in Mitochondrial Membrane Architecture: Cristae
Morphology and Outer Membrane Interactions Differentially Depend on Mitofilin
Domains. J. Mol. Biol. 422: 183-191.
ZHU, C., X. WANG, J. DEINUM, Z. HUANG, J. GAO et al., 2007 Cyclophilin A participates
in the nuclear translocation of apoptosis-inducing factor in neurons after cerebral
hypoxia-ischemia. J. Exp. Med. 204: 1741-1748.
ZHU, Y., J. LU, J. WANG, F. CHEN, F. LENG et al., 2011 Regulation of Thermogenesis in
Plants: The Interaction of Alternative Oxidase and Plant Uncoupling
Mitochondrial Protein. J. Integr. Plant Biol. 53: 7-13.
ZICK, M., R. RABL and A. S. REICHERT, 2009 Cristae formation—linking ultrastructure
and function of mitochondria. Biochim. Biophys. Acta - Mol. Cell Res. 1793: 5-
19.

73
Chapter 2: Materials and Methods
2.1 Growth of N. crassa strains
All strains used in this study are listed in Table 3. The methods of DAVIS and DE
SERRES (1970) were used for culturing and handling N. crassa strains. Unless otherwise
noted, strains were grown at 30°C on standard Vogel’s medium with addition of
supplements as required. The standard components of Vogel’s are described in DAVIS
and DE SERRES (1970). The medium contains inorganic salts, 1.5% sucrose as the carbon
source, trace elements and biotin. Our lab abbreviates the medium as VSuTB. When
conidia were required, strains were grown in 250 mL Erlenmeyer flasks (termed “conidia
flasks”) containing 50 mL of Vogel’s medium made solid with 1.5% agar. Following
inoculation of conidia onto the center of the medium in the flask, they were incubated for
two to three days at 30°C, followed by incubation at room temperature in a well-lit room
for another four to five days. Conidia were used three to fourteen days after formation.
Working stains were maintained in test tubes containing slants of VSuTB plus any
required supplements.
Liquid cultures were set up by collecting conidia from conidia flasks using sterile
dH2O. Harvested conidia were then used to inoculate liquid VSuTB in baffled flasks,
followed by incubation at 30°C with constant shaking for the desired time. When
required, conidia were counted using a hemocytometer and 2X10⁶ conidia were added
per mL of Vogel’s medium. Whenever required, inhibitors were added at the following
concentrations: Cm at 2 mg/mL, AA at 0.5 µg/mL, bleomycin (Bm) at 1 µg/mL, and
hygromycin B at 0.19 Units/L (each mg of hygromycin consists of 396 units of activity)
(EDM Chemicals Inc., San Diago, CA).
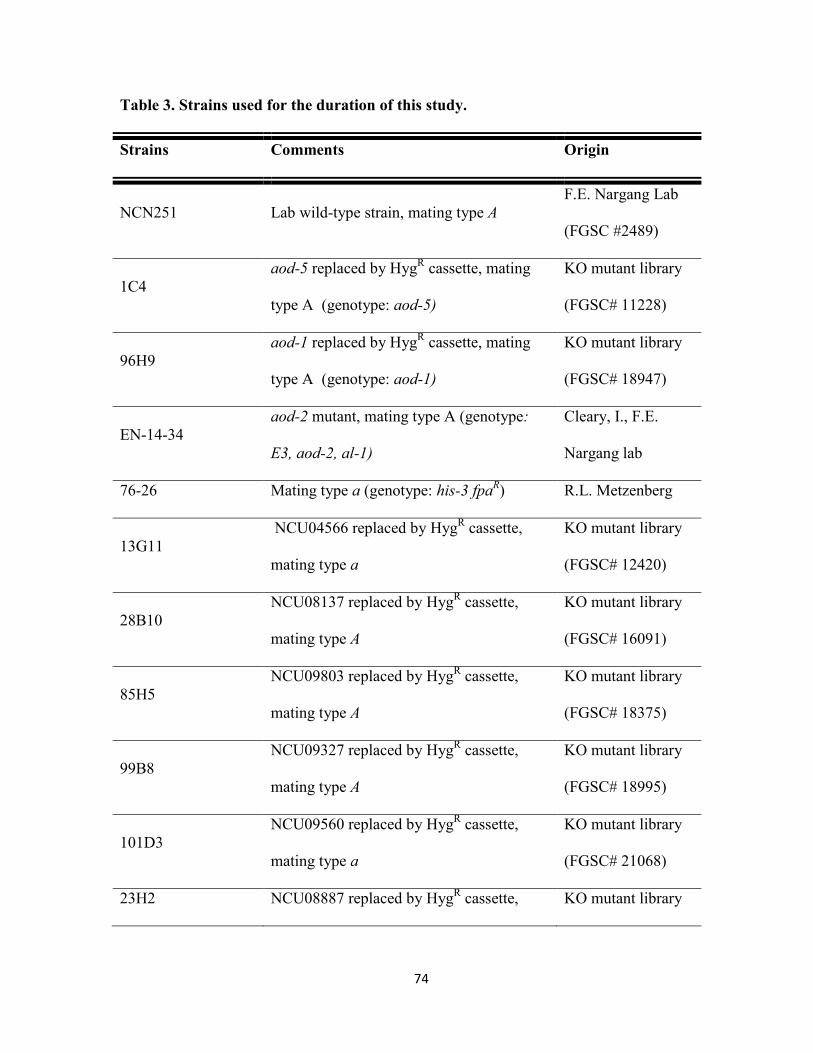
74
Table 3. Strains used for the duration of this study.
Strains Comments Origin
NCN251 Lab wild-type strain, mating type A
F.E. Nargang Lab
(FGSC #2489)
1C4
aod-5 replaced by HygR cassette, mating
type A (genotype: aod-5)
KO mutant library
(FGSC# 11228)
96H9
aod-1 replaced by HygR cassette, mating
type A (genotype: aod-1)
KO mutant library
(FGSC# 18947)
EN-14-34
aod-2 mutant, mating type A (genotype:
E3, aod-2, al-1)
Cleary, I., F.E.
Nargang lab
76-26 Mating type a (genotype: his-3 fpaR) R.L. Metzenberg
13G11
NCU04566 replaced by HygR cassette,
mating type a
KO mutant library
(FGSC# 12420)
28B10
NCU08137 replaced by HygR cassette,
mating type A
KO mutant library
(FGSC# 16091)
85H5
NCU09803 replaced by HygR cassette,
mating type A
KO mutant library
(FGSC# 18375)
99B8
NCU09327 replaced by HygR cassette,
mating type A
KO mutant library
(FGSC# 18995)
101D3
NCU09560 replaced by HygR cassette,
mating type a
KO mutant library
(FGSC# 21068)
23H2 NCU08887 replaced by HygR cassette, KO mutant library

75
mating type A (FGSC# 15957)
40 E6
NCU05600 replaced by HygR cassette,
mating type a
KO mutant library
(FGSC# 13805)
41G7
NCU03589 replaced by HygR cassette,
mating type A
KO mutant library
(FGSC# 13924)
47H10
NCU00778 replaced by HygR cassette,
mating type a
KO mutant library
(FGSC# 16938)
52D8
NCU07281 replaced by HygR cassette,
mating type A
KO mutant library
(FGSC# 14469)
83H3
NCU08365 replaced by HygR cassette,
mating type a
KO mutant library
(FGSC# 18277)
88H8
NCU01542 replaced by HygR cassette,
mating type a
KO mutant library
(FGSC# 19221)
113G8
NCU03071 replaced by HygR cassette,
mating type a
KO mutant library
(FGSC# 18202)
NCN184, [poky]
Mitochondrial mutant, 4 bp mtDNA
deletion, mating type a ( genotype: nic-1,
al-2)
H. Bertrand
N Myc-1 (to 21)
Transformants, generated by transforming
23H2 with pBS520 AscI 23H2_5' NI_Myc
This study
C HA-1 (to 19)
Transformants, generated by transforming
23H2 with pBS520 AscI 23H2_3' NI_HA
This study
88H8-C-HA-1 (to Transformants, generated by transforming This study

76
25) 88H8 with pBS520 AscI 88H8 predicted
gene containing 3' HA
23-1-(F1-F12, M1-
M15,S1-S5)*
Cross progeny strains from a 23H2 X 76-
26 cross
This study
23-2-(F1-F12, M1-
M15,S1-S5)
Cross progeny strains from a 23H2 X 76-
26 cross
This study
40-1-(F1-F12, M1-
M13, S1-S5)
Cross progeny strains from a 40E6 X
NCN251 cross
This study
40-2-(F1-F12, M1-
M13, S2-S5)
Cross progeny strains from a 40E6 X
NCN251 cross
This study
41-1-(F1-F12, M1-
M15, S1-S5, H1-12,
H14, HS3- HS6)**
Cross progeny strains from a 41G7 X 76-
26 cross
This study
41-2-(F1-F12, M1-
M15, S1-S6, H1-15,
HS2, HS3, HS5,
HS6)
Cross progeny strains from a 41G7 X 76-
26 cross
This study
47-1-(F1-F10, M1-
M15, S1-S5, H1,
H5-H8, H10-H15,
HS2, HS3, HS5)
Cross progeny strains from a 47H10 X
NCN251 cross
This study
47-2-(F1-F10, M1-
M15, S1-S3, S5, H1-
Cross progeny strains from a 47H10 X
NCN251 cross
This study

77
H15, HS2, HS5)
52-1-(F1-F10, M1-
M15, S2-S5,H3, H6,
H9, H11, HS2)
Cross progeny strains from a 52D8 X 76-
26 cross
This study
52-2-(F1-F10, M1-
M15, S2, S5, H6-H8,
H11)
Cross progeny strains from a 52D8 X 76-
26 cross
This study
83-1-(F1-F12, M1-
M7, M9-M15, S1-
S6, H1-H15,HS2)
Cross progeny strains from a 83H3 X
NCN251 cross
This study
83-2-(F1-F13, M2-
M10, M12-M15,S1-
S5, H1-H6, H8-H15)
Cross progeny strains from a 83H3 X
NCN251 cross
This study
88-1-(F1, F3-F7, F9,
F10, F15, M1, M5-
M10, S2, S4)
Cross progeny strains from a 88H8 X
NCN251 cross
This study
88-2-(F1-F15, M2,
M5-M10)
Cross progeny strains from a 88H8 X
NCN251 cross
This study
88-N-(F1-F3, F6, F9,
F10-12, F14-F16,
F18)
Cross progeny strains from a 88H8 X
NCN251 cross
This study
113-1-(F1, F4-F12,
M1-M15, S1 - S4,
Cross progeny strains from a 113G8 X
NCN251 cross
This study

78
H1-H9, H13, H15,
HS3)
113-2-(F1-F6, F8-
F10, M1, M3-M15,
S1-S4, H1-H3, H5-
H8, H10-H13, H15,
HS2, HS3
Cross progeny strains from a 113G8 X
NCN251 cross
This study
*Cross progeny were denoted as F if they were generated from ascospores that
germinated faster than the other ascospores on Vogel’s sorbose-containing plates, M if
they were generated from ascospores germinating slower than the F category, S if they
were generated from very slowly germinating ascospores.
**H, denotes strains that were generated from germinating ascospores that were activated
and plated on Vogel’s sorbose-containing plates with hygromycin added.

79
2.2 Growth rate measurements
For a crude estimation of growth rate, strains of interest were allowed to conidiate on
VSuTB slants. Conidia from slants were picked using a sterile inoculating needle, and
inoculated at the center of VSuTB agar plates (with appropriate antibiotics added as
required). Plates were incubated at 30°C for two to three days. Linear growth from the
site of inoculation was measured every 24 hr.
2.3 Mitochondrial isolation
Cultures were grown in liquid medium for specific times (24 or 48 hr) at 30°C and
harvested by vacuum filtration. When required, Cm was added at a concentration of 2
mg/mL to the culture prior to inoculation. Mitochondria were isolated from harvested N.
crassa mycelium by differential centrifugation, using the procedure described by
NARGANG and RAPAPORT (2007). Isolated mitochondria samples were either used
immediately or placed at -80°C until required.
2.4 Isolation of whole cell extracts
For preparation of whole cell extracts, strains of interest were grown in liquid
medium at 30°C for 24 hr and/or 48 hr, following which, mycelium was collected by
vacuum filtration. 1 g of mycelium was ground using a mortar and pestle with 1 mL of
SEMP (0.25M sucrose; 1 mM EDTA (ethylenediaminetetraacetic acid); 10 mM 4-
morpholinepropanesulfonic acid (MOPS), 0.2 mM phenylmethylsulfonyl fluoride
(PMSF)) buffer containing 2% SDS (sodium dodecyl sulfate) and 1 g of sand (Sigma-
Aldrich, St. Louis, MO). This slurry was centrifuged at 3600 x g for 10 min in a Sorvall
RC-5C Plus centrifuge SA-600 rotor (Sorvall, Mandel Scientific, Guelph, ON), following

80
which the supernatant was collected and proteins in the sample were quantified using the
BCA protein assay kit (Pierce, Rockford, IL).
2.5 Growth of E. coli cells, transformation of competent E. coli cells and plasmid
DNA isolations
E. coli cells were grown in LB medium (Lysogeny broth: 10g/L tryptone, 5g/L yeast
extract, 5g/L NaCl, 1g/L glucose), at 37°C with constant shaking as per the protocol of
SAMBROOK and RUSSELL (2001). When E. coli cells were grown on LB agar plates, cells
were placed in a gravity convection incubator at 37°C for 18-24 hr. Ampicillin (Amp)
was added to the medium when needed at a concentration of 100 mg/L.
Competent XL-2 Blue E. coli cells were prepared following growth at 18°C using
the Inoue method (SAMBROOK and RUSSELL 2001). The transformation efficiency of
these competent cells was determined to be approximately 1X10⁷
cfu/µg using
supercoiled plasmid DNA (pBSK II) when the transformation protocol of SAMBROOK and
RUSSELL (2001) was used. When required, transformants of interest were picked and
inoculated into LB Amp broth. After overnight growth, plasmid DNA was reisolated
using the GeneJET plasmid miniprep kit (Thermo Scientific, Waltham, MA). The
manufacturer’s instructions were followed to isolate plasmid from 5 mL of liquid culture
grown overnight.
2.6 Agarose gel electrophoresis and isolation of DNA from gels
DNA of interest was separated via electrophoresis through 1% agarose gels. The gel
was placed on a UV transilluminator, bands of interest were cut out of the gel using a
scalpel and were placed in a microfuge tube. Three volumes of 6M sodium iodide was
added to the gel pieces. This mixture was incubated at 65°C for 15 min to melt the agar

81
slabs and the dissolved mixture was added to GeneJET spin columns (Thermo Scientific,
Waltham, MA) to bind DNA from the solution. The column was then washed twice with
the washing buffer supplied by the manufacturer of the kit and DNA was eluted in 40-50
µL of sterile milliQ water.
2.7 Ethanol precipitation of DNA
To precipitate DNA from a solution, 1/10 volume of 3M sodium acetate and 2
volumes of ice cold 95% ethanol were added to the solution containing DNA. This
mixture was incubated at -20°C for 2 hr to overnight, and then spun at 16,000 x g for 15
min in a tabletop microcentrifuge. The supernatant was discarded and the pellet was
washed twice with ice cold 70% ethanol and allowed to air dry for 30 min. The pellet was
then resuspended in the desired amount of sterile milliQ water.
2.8 PCR amplification and mutagenesis
PCR amplification and site-directed mutagenesis were carried out based on the
protocols of SAMBROOK and RUSSELL (2001). The PCR amplification primers used were
designed with the help of the software Primer Premier (Version 5, Premier Biosoft
International) or the NCBI primer design tool (National Centre for Biotechnology
Information). Pfu DNA polymerase (Thermo Scientific) was used for all reactions.
2.9 Genomic DNA isolation
N. crassa genomic DNA was isolated using a procedure modified from WENDLAND
et al. (1996). VSuTB liquid media was inoculated with conidia from the strain of interest.
Cultures were grown with shaking at 30°C for 24 to 72 hr depending on the growth rate
of the strain. Mycelium was harvested by vacuum filtration, wrapped in foil and placed

82
on ice. Typically, 2 gm of mycelium was used per isolation. For each gram, 1.5 g of sand
(Sigma-Aldrich, St. Louis, MO) and 2 mL of “new isolation buffer” (10 mM EDTA, pH
8.0; 1% SDS; 100 mM Tris-HCl, pH 8.0) was added. This mixture was kept on ice at all
times. The mycelium was ground into a fine slurry of even consistency using a mortar
and pestle. This slurry was then transferred into a tube for a Sorvall RC-5C Plus
centrifuge SA-600 rotor (Sorvall, Mandel Scientific, Guelph, ON) and additional new
isolation buffer was added to the slurry to bring up the volume to 10 mL. The tube was
then covered with parafilm and shaken vigorously, then inverted slowly for 1 min. It was
then placed into a 70°C water bath for 1 hr, following which the tube was placed on ice
for 10 min. 0.64 mL of 8 M potassium acetate pH 4.3 was added to the mixture and,
following shaking, the tube was placed on ice for another 1 hr. The mixture was then
centrifuged at 28,000 x g at 4°C in a Sorvall SA-600 rotor for 15 min. The supernatant
was transferred to a fresh centrifuge tube and an equal volume of isopropanol was added.
Following mixing, the tubes were placed on ice for 15 min to allow for precipitation of
DNA, and then centrifuged at 14,000 x g for 15 min to pellet the DNA. The pellet was
rinsed twice with 70% ethanol and allowed to air dry for 30 min. The pellet was
resuspended in 400 µL of 1 mM EDTA pH 8, after which the solution was transferred to
a microfuge tube and 200 µL of Hi Salt buffer (100 mM sodium chloride; 25 mM Tris-
HCl, pH 7.4; 2 mM EDTA) and 15 µL of boiled RNase A (10 mg/mL) were added to the
tube. After incubation at 37°C for 30 min the mixture was extracted with an equal
volume of water equilibrated phenol:chloroform (1:1). Genomic DNA was then
precipitated by addition of 1/10 volume of 3 M sodium acetate and 2 volumes of 95%
ethanol. The DNA was pelleted at 16,000 x g for 20 min, washed with 70% ethanol and

83
allowed to air dry at room temperature for 30 min. The pellet was resuspended in 50-400
µL of sterile milliQ water and the concentration of gDNA was determined using a
NanoDrop 1000 Spectrophotometer (Thermo Scientific, Waltham, MA) at the Molecular
Biology Services Unit (MBSU), Department of Biological Sciences.
2.10 Genetic crosses and isolation of progeny
Crosses were set up using the basic procedure described by DAVIS and DE SERRES
(1970) with modifications. The parent chosen to serve as the female (the wild-type strain
NCN251A or 76-26a his-3) was inoculated on a sterile filter paper (serving as the sole
carbon source) placed on low nitrogen Westergaard’s medium petridish. When 76-26 was
used as the female parent, histidine was added to the medium at a concentration of 15
mg/L, as this strain is auxotrophic for histidine. The plates were incubated for two days at
30°C and then placed in the dark for ten days at room temperature to allow formation of
protoperithecia. The male strains (class one knockout mutants being tested, see section
1.10) were allowed to conidiate in slants of VSuTB medium. Conidia from these slants
were harvested with sterile dH2O and spread on the plates containing female
protoperithecia. The lids of the plates were replaced by clean sterile lids at this time. The
plates were then placed in the dark at room temperature for ten more days, to allow
fertilization and formation of ascospores, and then moved to a well-lit area for 5 days to
allow for ejection of ascospores. A sterile wooden applicator, dipped in sterile distilled
water, was used to harvest ascospores off the lid of the crossing plates. These ascospores
were placed in 1 mL sterile dH2O and incubated at room temperature overnight,
following which they were heat activated at 60°C for 45 min. Aliquots of the ascospore
suspension were plated on Vogel’s sorbose-containing plates and incubated at 30°C
84
overnight to allow for colony formation (DAVIS and DE SERRES 1970). A dissecting
microscope was then used to identify germinated ascospores. These germinated
ascospores were individually picked onto slants and allowed to conidiate. These cross
progeny were then used for further analysis.
2.11 Southern blotting and hybridization
Genomic DNA was digested overnight with appropriate restriction enzymes and then
precipitated. The DNA was resuspended in milliQ water and quantified using the Qubit
Flourometer (Life Technologies, Burlington, ON). 10-15 µg of digested DNA was
electrophoresed on 0.8% agarose gels (20 cm X 14.5 cm) at 50-60 V until the dye front
migrated approximately 15 cm.
The gel was then photographed alongside a fluorescent ruler following which excess
lanes and regions of the gel were trimmed off. The gel was processed according to the
Southern blotting protocol of SAMBROOK and RUSSELL (2001) and was transferred to a
positively charged nylon membrane (Immobilon NY+, Millipore Corporation, Etobicoke,
ON). Following transfer, the membrane was blotted dry, soaked in 2XSSC (saline sodium
citrate buffer: 0.03 M trisodium citrate and 0.3 M sodium chloride, pH 7.5) for 5 min, and
baked in a 80°C oven for 2 hr for crosslinking DNA onto the nylon membrane.
The nylon membrane was soaked in pre-hybridization solution (5X SSC, 1%
blocking reagent (Supplied with the DIG (digoxigenin) DNA labelling and detection kit,
Roche Applied Science, Indianapolis, IN), 0.1% N-laurylsacrosine and 0.02% SDS) and
pre-hybridized in a 65°C rotating hybridization incubator (Tyler research instruments,
Edmonton, AB) for 1 hr. DIG labelled DNA probe specific to parts of the HygR gene
cassette was created using the DIG DNA labelling and detection kit (Roche Applied

85
Science, Indianapolis, IN) as per the manufacturer’s instructions. The labelled probe was
denatured at 95°C for 10 min followed by chilling on ice for 10 min. The probe was then
added to 50 mL of pre-hybridization solution (preheated to 65°C) to make the
hybridization solution. The membrane was placed in the hybridization solution at 65°C in
the rotating incubator overnight. Stringency washes and probe detection was carried out
as per the direction of the kit manufacturer.
2.12 SDS-PAGE (sodium dodecyl sulfate - polyacrylaminde gel electrophoresis) and
western blotting
SDS-PAGE gels (12.5% polyacrylamide gels; 29:1 acrylamide: bisacrylamide) were
prepared as described by SAMBROOK and RUSSELL (2001). Mitochondrial proteins for
electrophoresis were prepared by resuspending 30 µg of mitochondrial proteins in
cracking buffer (0.06 M Tris-HCl, pH 6.7, 2.5% SDS, 0.01% β-mercaptoethanol, 5%
sucrose). Following electrophoresis, proteins were electro-blotted onto nitrocellulose
membrane. The membrane was then placed in blocking buffer (5% skimmed milk
powder in TBST (0.02M Tris HCl, pH 7.5; 0.15M NaCl; 0.5% Tween)) for 1 hr at room
temperature with constant shaking. The blocking solution was poured off and the
membrane was incubated with primary antibody milk (consisting of antibody raised in
rabbits diluted in blocking buffer containing 0.02% sodium azide) for 1 hr with constant
shaking. The membrane was then washed thrice with TBST for 5 min and incubated with
the secondary antibody solution (consisting of a 1:3000 dilution of goat anti-rabbit
antibody HRP-conjugate solution (BioRad, Mississauga, ON) in 50 mL blocking buffer)
for 1 hr with shaking at room temperature. The membrane was then washed twice with
TBST, once with TBS (TBST buffer without Tween) and finally with dH2O for 5 min

86
each. The LumiGLO chemiluminescent detection assay (Mandel Scientific Company
Inc., Guelph, ON) was used for antibody detection with Kodak XAR film.
2.13 Carbonate extraction
The procedure of WIDEMAN et al. (2010) was used for carbonate extraction. 30-50
µg of the mitochondrial pellet was resuspended in 50 µL of sterile dH2O and transferred
to an ultracentrifuge tube for the TLA55 rotor (Beckman Coulter, Mississauga, ON). 1
mL of freshly prepared 100 mM sodium carbonate (Na2CO3) was added to the
mitochondria. The pH of NaCO3 was either adjusted to 11.0 using 1 M NaOH, or used
directly at approximately 10.8. The contents of the tube were gently mixed and then
placed on ice for 30 min. The tube was then centrifuged in a TLA55 rotor of the
Beckman Optima MAX ultracenrifuge (Beckman Coulter, Mississauga, ON) at 125,000 x
g for 1 hr at 4°C. The pellet fraction was resuspended in cracking buffer and either loaded
immediately on a SDS-PAGE gel or stored at -80°C until further use. The supernatant
fraction was collected in a separate microfuge tube. To precipitate proteins in this
fraction, 210 µL of 72% TCA (Trichloroacetic acid) was added and the mixture was
placed on ice for 1 hr followed by a 15 min spin at 160,000 x g in a Beckman Coulter
TLA55 rotor ultracentrifuge. Following this, the supernatant was discarded and 1 mL of
acetone was added to the pellet. The tube was then shaken for 5 min and centrifuged for 5
min at 16,000 x g. The acetone was removed, the pellet dried at 37°C for 30 min and then
resuspended in cracking buffer. The sample was either loaded onto an SDS-PAGE gel or
stored at -80°C until further use.

87
2.14 Cytochrome spectra
Cytochrome spectra were obtained as described previously by BERTRAND and
PITTENGER (1969). Briefly, mitochondrial pellets were suspended in 1mL of SEMP, and
lysed using 1 mL of a solution containing 10 mM MOPS; pH 7.2 and 5% sodium
deoxycholate. The solution was mixed by gentle pipetting and centrifuged at 16,000 x g
for 5 min. The supernatant was divided equally into two cuvettes. The reference in one
cuvette was fully oxidized by addition of a few crystals of potassium ferricyanide. The
sample in the other cuvette was reduced by addition of a few crystals of sodium
dithionite. A Biochrom Ultrospec 3100 pro spectrophotometer (GE Healthcare,
Mississauga, ON) was used to obtain difference spectra (sample vs a reference) over
wavelengths 500 to 650 nm. The spectra were then traced and scanned into Adobe
Photoshop.
2.15 Transformation of N. crassa by electroporation and purification of
transformants
Transformation of N. crassa was achieved by electroporation as described by
HOPPINS et al. (2007). Transformants were selected in the presence of appropriate
antibiotics added to agar plates. Single transformant colonies were picked using sterile
glass pasture pipettes and transferred onto half strength antibiotic VSuTB slants. Upon
conidiation, these transformants were subjected to another round of single colony
isolations on full-strength antibiotic plates. Single colony transformants generated in this
manner were then allowed to conidiate on VSuTB slants lacking antibiotics and were
used for further analysis.

88
2.16 Spot growth tests
For spot growth test analysis, conidia from each strain were collected in 1 to 5 mL of
sterile dH2O. The conidia were counted using a microscope and a hemocytometer and
adjusted to a concentration of 1X10⁴ conidia/µL. This suspension was serially diluted so
as to have suspensions with concentrations of 1X10³, 1X10
2 and 1X10
1 conidia/µL. 10
µL of each dilution was spotted onto Vogel’s sorbose-containing plates with addition of
desired antibiotics and nutritional supplements. These plates were incubated at 30°C for
two to three days.
2.17 DNA Sequencing and analysis of sequencing data
DNA sequencing was carried out using the protocol and reagents of the Big Dye
Terminator cycle sequencing kit (Life Technologies, Burlington, ON). Initially, the
sequencing reaction and PCR runs were carried out in the Nargang lab and the sequence
profile determination was carried out by the MBSU of the Biological Sciences
Department using a 3730 DNA Analyzer (Applied Biosystems, Foster City, CA).
Towards the later stages of this thesis, the PCR reactions were also carried out at the
MBSU. Software including DNAMAN version 6.0.3.99 (Lynnon Biosoft, Vaudreuil,
QB) and FinchTV version 1.4 (Geospiza Inc., Seattle, WA) were used for sequence
alignment and analysis.
2.18 RNA isolation, cDNA synthesis and qPCR
To ensure all glassware, forceps, mortars, pestles and aluminum foils were free of
RNase contamination they were baked in an oven overnight (for at least 18 hr) at 240°C
prior to use. For each strain of interest, four biological replicates were grown for each
condition being tested. One liter baffled flasks containing 250 mL liquid VSuTB medium
89
was inoculated with 1X10⁶ conidia/mL. These flasks were incubated in a shaking
incubator at 30°C for 16 hr (without Cm) or 18 hr (with added Cm). Mycelium was
harvested by vacuum filtration and 100 mg of mycelium was weighed and flash frozen in
liquid nitrogen. RNA was isolated from these flash frozen mycelial pads using the
Qiagen RNeasy Plant Mini system following the manufacture’s protocol (Qiagen,
Mississauga, ON).
The quality and integrity of isolated RNA was assessed using a Bioanalyzer 2100
nano chip (Agilent technologies, Mississauga, ON). If the quality of the RNA was
sufficiently good (RNA integrity number (RIN) > 8), cDNA was synthesized using 1 µg
RNA per reaction and Superscript III reverse transcriptase (Invitrogen, Carlsbad, CA).
This cDNA was used for the qPCR reactions. The qPCR reactions were performed using
a StepOnePlus RT-PCR system (Applied Biosystems, Foster City, CA) using 5 ng of
cDNA and 200 nM primer per reaction, in a 96 well plate set up. The β-tubulin gene was
used as an endogenous control for the ΔΔCt quantification assay.
2.19 PCR analysis of KO strains
A PCR amplification strategy was used to verify the proposed gene KO in mutants of
interest. PCR amplification was carried out using wild-type or mutant genomic DNA.
When the size of the target gene was 3 Kb or less, only one primer pair was used for PCR
amplification (Fig.7A). When target genes of interest were >3 Kb, they proved difficult
to amplify using a single primer pair. Therefore, multiple primer pairs (e.g. F1 and R1;
F2 and R2; F3 and R3 (F, forward primer; R, reverse primer)) were used to amplify target
genes from the wild-type strain. Primer pair (F1 and R3), outside the replacement region
was used to amplify the region of interest in the knockout mutant since it should contain

90
A B
Figure 7. Generalized schematic of primer design strategy for KO mutant verification. A) Schematic diagram of primer
design strategy for verifying KO mutants in which the target gene was ≤ 3Kb. In these cases, only one primer pair was used for
PCR amplification (shown as red arrows). B) Schematic diagram of primer design strategy for KO mutants in which the target
gene was >3Kb. Since these genes proved difficult to amplify using a single primer pair, multiple primer pairs (i.e. F1 and R1
(red arrows); F2 and R2 (dark blue arrows); F3 and R3 (light blue arrows)) were used to amplify target genes from the wild
type strain. Primer pair (F1 and R3), outside the replacement region was used to amplify the region of interest in the KO
mutant since it should contain the smaller HygR
cassette. Figure describing specific gene amplification strategies are given in
section 3.2.3.1. X, Y and Z represent PCR amplified fragments. F, Forward primer, R, Reverse primer.
Wild-type
control
KO
mutant
Forward primer
Reverse primer
Forward primer
Reverse primer
1.47 Kb
≤ 3Kb
Wild-type copy of gene
HygR
cassette
Wild-type
control
KO
mutant
F1
1.47 Kb
Wild-type copy of gene
X Y
Z
F2 F3
R1 R2
R3
R3 F1 HygR
cassette
> 3Kb
90
91
the smaller HygR
cassette (Fig. 7B). When products from both the endogenous gene and
the disruption were predicted to be of similar size, a restriction enzyme that cut one of the
products (but not the other) was used to differentiate between them. Based on the size of
the target gene or the HygR cassette, the size of the expected PCR product could be
predicted.
2.20 Cloning of NCU08887 (NcMFS) and NCU01542 (NcHbrB)
The gene NCU08887 was previously cloned into the pBS520 AscI vector (K.
Adames, Nargang lab). The cloning strategy involved: PCR amplification of the gene
from cosmid pMOCosX G2X6 (obtained from the Fungal Genetics Stock Center
(FGSC)) (ORBACH 1994). The region amplified contained: 495 bp upstream of the start
codon, the coding sequence of the gene (4284 bp), and 608 bp downstream of the stop
codon. Cloning the gene of interest into the pBS520 AscI vector, mutagenesis of the NotI
site in the coding sequence of the gene, and insertion of NotI sites at the 3’ or the 5’ end
of the coding sequence by mutagenesis for insertion of epitope tags (3XHA or 3XMyc) is
described in the results (see section 3.2.1.2). The SnapGene software (GSL Biotech LLC,
Chicago, IL, USA) was used for generation of plasmid models.
A portion of the NCU01542 gene was previously cloned into the pBS520 AscI vector
(A.B. Desaulniers, Nargang lab). The construct contained 601 bp upstream of the initially
predicted start codon, 3468 bp of the initially predicted coding sequence (start codon to
stop codon) and 566 bp downstream of the stop codon. It was later determined that this
construct lacked part of the N-terminal coding sequence of the gene (119 bp at the 5’ end,
see section 3.2.2.2 and 3.2.2.3). Therefore, a 1.7 kb fragment containing part of the
coding sequence (995 bp) and 744 bp upstream of the corrected start codon was PCR
92
amplified from cosmid pMOCosX X18A9 (obtained from the Fungal Genetics Stock
Center (FGSC)) (ORBACH 1994) and was cloned into the previously created construct.
Details are shown in the results, section 3.2.2.2 and 3.2.2.3. The SnapGene software
(GSL Biotech LLC, Chicago, IL, USA) was used for creation of plasmid models.
2.21 Plasmids and oligonucleotides
All the plasmids and oligonucleotides relevant to this thesis are listed in Table 4 and
Table 5 respectively.

93
Table 4. List of plasmids used in this study.
Plasmid name Comment(s) Origin
pBS520 AscI
Bluescript vector, Amp and Bm resistance
genes (AmpR and Bm
R), NotI site
mutagenized to AscI site
F.E. Nargang,
Nargang lab
pBS520 AscI
23H2_3' NI_HA
NCU08887 (along with 495 bp upstream
and 605 bp downstream sequence) cloned
into pBS520 AscI, 3XHA tag added before
stop codon
K. Adames,
Nargang lab
pBS520 AscI
23H2_5' NI_Myc
NCU08887 (along with 495 bp upstream
and 605 bp downstream sequence) cloned
into pBS520 AscI, 3XMyc tag added after
start codon
K. Adames,
Nargang lab
pBS520 AscI
88H8_3' NI_HA
NCU01542 (along with 601 bp upstream
and 566 bp downstream sequence) cloned
into pBS520 AscI, 3XHA tag added before
stop codon
A.B. Desaulniers,
Nargang lab
pBS520 AscI
88H8_3' NI_Myc
NCU01542 (along with 601 bp upstream
and 566 bp downstream sequence) cloned
into pBS520 AscI, 3XMyc tag added before
stop codon
A.B. Desaulniers,
Nargang lab

94
pBS520 AscI
88H8_5' NI_HA
NCU01542 (along with 601 bp upstream
and 566 bp downstream sequence) cloned
into pBS520 AscI, 3XHA tag added after
start codon
A.B. Desaulniers,
Nargang lab
pBS520 AscI
88H8_5' NI_Myc
NCU01542 (along with 601 bp upstream
and 566 bp downstream sequence) cloned
into pBS520 AscI, 3XMyc tag added after
start codon
A.B. Desaulniers,
Nargang lab
pBS520 AscI 88H8
predicted complete
gene untagged
1.7 kb insert directionally cloned into
pBS520 AscI bd 88H8_5' NI_HA to
assemble predicted functional copy of
NCU01542 (along with 744 bp upstream
sequence)
This study
pBS520 AscI 88H8
predicted complete
gene containing
3'HA
1.7 kb insert directionally cloned into
pBS520 AscI 88H8_3' NI_HA to assemble
3’ 3XHA tag containing predicted
functional copy of NCU01542 (along with
744 bp upstream sequence)
This study
pBS520 AscI 88H8
predicted complete
gene containing
3'Myc
1.7 kb insert directionally cloned into
pBS520 AscI 88H8_3' NI_Myc to assemble
3’ 3XMyc tag containing predicted
functional copy of NCU01542 (along with
744 bp upstream sequence)
This study

95
pBSK II
Plasmid used for testing transformation
efficiency of XL-2 Blue E. coli cells
N. Go, Nargang
lab
p-aod-2 Hyg
Plasmid used for creation of HygR gene
probe used for Southern blot analysis
Z. Qi, Nargang lab

96
Table 5. Oligonucleotides relevant to this study.
Primer name Comment(s) Sequence
23H2 aod-1 F
(2)
Forward primer to PCR
amplify aod-1 gene
5' - AAGATGCCCGATGAAGATGAGG
- 3'
23H2 aod-1 R
(2)
Reverse primer to PCR
amplify aod-1 gene
5' - CAACTTGGTCCAAAAACGCCT -
3'
23H2 aod-2 F1
(2)
Forward primer to PCR
amplify aod-2 gene-set 1
5' - TGGTTGCGGTCAACAGACTT - 3'
23H2 aod-2 R1
(2)
Reverse primer to PCR
amplify aod-2 gene-set 1
5' - TCATGTGCTAAGGCAGCCAA - 3'
23H2 aod-2 F2
(2)
Forward primer to PCR
amplify aod-2 gene-set 2
5' - AAAGGCTGGCTCGGAATCAA - 3'
23H2 aod-2 R2
(2)
Reverse primer to PCR
amplify aod-2 gene-set 2
5' - GTTGCTCGGAAGTGAGACCA - 3'
23H2 aod-5 F1
(2)
Forward primer to PCR
amplify aod-5 gene-set 1
5' - CAGAGATTCCACTTTGCGGC - 3'
23H2 aod-5 R1
(2)
Reverse primer to PCR
amplify aod-5 gene-set 1
5' - AGCACCCTTCTTTCTGACGG - 3'
23H2 aod-5 F2
(2)
Forward primer to PCR
amplify aod-5 gene-set 2
5' - CTCACGGTCGACCACAAAGT - 3'
23H2 aod-5 R2
(2)
Reverse primer to PCR
amplify aod-5 gene-set 2
5' - GGAAAGTTGGCGATACGGGA - 3'

97
23H2 aod-5 F3
(2)
Forward primer to PCR
amplify aod-5 gene-set 3
5' - CATGCCAACGGTGCATCAAA - 3'
23H2 aod-5 R3
(2)
Reverse primer to PCR
amplify aod-5 gene-set 3
5' - ATGAACCCAGCGAAGCAGTC - 3'
aod-1 seq 1 aod-1 sequencing primer 5' - ACAAAAACCATCAGTTCGCC - 3'
aod-1 seq 2 aod-1 sequencing primer 5' - GCAGAGCTTTAGCATCCAC - 3'
aod -1 seq 3 aod-1 sequencing primer 5' - GCGACTGGTGTTCCGTTTC - 3'
aod-1 seq 4 aod-1 sequencing primer 5' - CTCAAGCGAGTTCCATTACA - 3'
aod-1 seq 5 aod-1 sequencing primer 5' - TGTTCTATGGAGCCCTACG - 3'
aod-1 seq 6 aod-1 sequencing primer 5' - GGGGCGTTAATCATACATTG - 3'
aod-2 seq 1 aod-2 sequencing primer 5' - GCCGACAAATCGTGGACAAG - 3'
aod-2 seq 2 aod-2 sequencing primer 5' - CCAAGCCATCACTCAAAGGT - 3'
aod-2 seq 3 aod-2 sequencing primer 5' - AGAGAGCCATTTTCCCGAGA - 3'
aod-2 seq 4 aod-2 sequencing primer 5' - ACGGGAACAGAAGCCACGG - 3'
aod-2 seq 5 aod-2 sequencing primer 5' - AGAGCGTGCTTGGGACTTCG - 3'
aod-2 seq 6 aod-2 sequencing primer 5' - GATAGGGAAGCCCGCGAGTA - 3'
aod-2 seq 7 aod-2 sequencing primer
5' -
AGAGTCGAACGTGAGATACTGGG -
3'
aod-5 seq 1
aod-5 sequencing primer
(N. Go, Nargang lab)
5' - ACCCCACGATGATGCTAATG - 3'
aod-5 seq 2
aod-5 sequencing primer
(N. Go, Nargang lab)
5'- TCTATGTCGCCGTCGTCCTA -3'

98
aod-5 seq 3
aod-5 sequencing primer
(N. Go, Nargang lab)
5' - GTTTGATAAGCGACTTCCTG - 3'
aod-5 seq 4
aod-5 sequencing primer
(N. Go, Nargang lab)
5' - TGGCACTAACTCGGATACTC - 3'
aod-5 seq 5
aod-5 sequencing primer
(N. Go, Nargang lab)
5' - ACTGGAAAGAGATGGTAAGC - 3'
aod-5 seq 1
new
aod-5 sequencing primer 5' - GGTCTTTCCAATGTTGTGAG - 3'
aod-5 seq 2
new
aod-5 sequencing primer
5' - GCAGGGCATTGGGCTGATTGA -
3'
aod-5 seq 3
new
aod-5 sequencing primer 5' - CTCGGTTTTGCTTCTTGCC - 3'
aod-5 seq 4
new
aod-5 sequencing primer 5' - CGCAATAGTTTGTTACCAGG - 3'
aod-5 seq 5
new
aod-5 sequencing primer
5' -
CAGCAAGTCCAGTGAGAATACGA -
3'
aod-5-seq 2.5 aod-5 sequencing primer 5' - TGCAGCAACACAATTAGGAT - 3'
23H2 aod-5-2
seq fwd
Forward primer for
confirmation of mutation
in aod-1 gene in 23H2 and
88H8
5' - CCGAGGTCACTACCAAGGACGA
- 3'
23H2 aod-5-2 Reverse primer for 5' -GGGGAGCATCGTGGAGATACTTT

99
seq rev confirmation of mutation
in aod-1 gene in 23H2 and
88H8
- 3'
seq primer-
23H2
Primer for confirmation of
mutation in aod-1 gene in
23H2 and 88H8
5' -TCTCAAACTTTTCGTCGCTCCACT
- 3'
113G8 2F 4
Forward primer to PCR
amplify NCU03071 set 1
5' - GTGCGGCAAGAGAAGAAACG -
3'
113G8 2R 4
Reverse primer to PCR
amplify NCU03071 set 1
5' - GCGCGCATTCAATAGTCTGG - 3'
113G8 1F 4
Forward primer to PCR
amplify NCU03071 set 2
5' - GCACGGACCAAACTGGACTA - 3'
113G8 1R 4
Reverse primer to PCR
amplify NCU03071 set 2
5' - AAGGCCTCATCATTGGAGCC - 3'
113G8 3F 4
Forward primer to PCR
amplify NCU03071 set 3
5' - GGCTGCCAACCCAGACTATT - 3'
113G8 3R 4
Reverse primer to PCR
amplify NCU03071 set 3
5' - CGTGTCGAACCGAGCCTAAT - 3'
40E6 F-2100
Forward primer to PCR
amplify NCU05600 set 1
(K. Adames, Nargang lab)
5' -
GGAGGCGACGCCTTGGCAGCACAT
G - 3'
40E6 R-2200
Reverse primer to PCR
amplify NCU05600 set 1
5' -
GTACGAAGATCCCCGTGCCGTTTGG

100
(K. Adames, Nargang lab) - 3'
40E6 F-4000
Forward primer to PCR
amplify NCU05600 set 2
(K. Adames, Nargang lab)
5' -
TCGCGCAGGTCTACAGGGCCAAGC
T - 3'
40E6 R-4200
Reverse primer to PCR
amplify NCU05600 set 2
(K. Adames, Nargang lab)
5' -
CTCGACACCAGGGTGCAGCACTTTG
- 3'
40E6-F
Forward primer to PCR
amplify NCU05600 set 3
(K. Adames, Nargang lab)
5' -
GGCATTGTTGGGCAGTGCGACTTTG
- 3'
40E6-2R
Reverse primer to PCR
amplify NCU05600 set 3
(K. Adames, Nargang lab)
5' -
GGGCATGACACGCTTGGGGCCATC
G - 3'
41G6-f
Forward primer to PCR
amplify NCU03589 (K.
Adames, Nargang lab)
5' - CTCATCATCGCCCACTGCAC - 3'
41G6-2r
Reverse primer to PCR
amplify NCU03589 (K.
Adames, Nargang lab)
5' -
GGGAATCCGCTGCTGTTGCCACAG -
3'
52D8-Fwd
(2nd)
Forward primer to PCR
amplify NCU03589 (K.
Adames, Nargang lab)
5' -
GGCGATCAACGGGGAGCGAGTGAC
- 3'
52D8-Rev Reverse primer to PCR 5' -
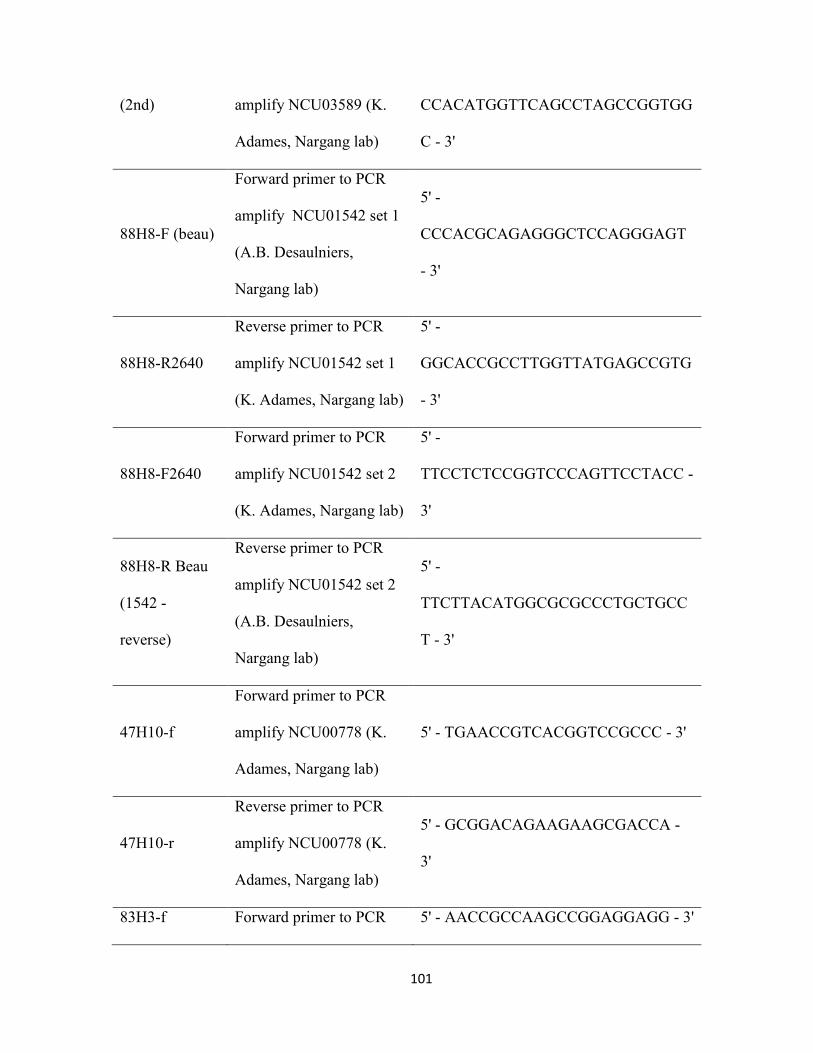
101
(2nd) amplify NCU03589 (K.
Adames, Nargang lab)
CCACATGGTTCAGCCTAGCCGGTGG
C - 3'
88H8-F (beau)
Forward primer to PCR
amplify NCU01542 set 1
(A.B. Desaulniers,
Nargang lab)
5' -
CCCACGCAGAGGGCTCCAGGGAGT
- 3'
88H8-R2640
Reverse primer to PCR
amplify NCU01542 set 1
(K. Adames, Nargang lab)
5' -
GGCACCGCCTTGGTTATGAGCCGTG
- 3'
88H8-F2640
Forward primer to PCR
amplify NCU01542 set 2
(K. Adames, Nargang lab)
5' -
TTCCTCTCCGGTCCCAGTTCCTACC -
3'
88H8-R Beau
(1542 -
reverse)
Reverse primer to PCR
amplify NCU01542 set 2
(A.B. Desaulniers,
Nargang lab)
5' -
TTCTTACATGGCGCGCCCTGCTGCC
T - 3'
47H10-f
Forward primer to PCR
amplify NCU00778 (K.
Adames, Nargang lab)
5' - TGAACCGTCACGGTCCGCCC - 3'
47H10-r
Reverse primer to PCR
amplify NCU00778 (K.
Adames, Nargang lab)
5' - GCGGACAGAAGAAGCGACCA -
3'
83H3-f Forward primer to PCR 5' - AACCGCCAAGCCGGAGGAGG - 3'

102
amplify NCU08365 (K.
Adames, Nargang lab)
83H3-r
Reverse primer to PCR
amplify NCU08365 (K.
Adames, Nargang lab)
5' - GACCCGCCATCACCGTGCTG - 3'
23H2-2F
Forward primer to PCR
amplify NCU08887 set 1
(K. Adames, Nargang lab)
5' -
GGGGGAAACGAAAGGGTTGATCTA
C - 3'
23H2-R2400
Reverse primer to PCR
amplify NCU08887 set
1(K. Adames, Nargang
lab)
5' -
CCTAAAGCGGGCGCGAGCGAGGCG
G - 3'
08887-
sequene-4
Forward primer to PCR
amplify NCU08887 set 2
(K. Adames, Nargang lab)
5' - CCTCTGCTACTACGCCTTTG -3'
23H2-R4200
Reverse primer to PCR
amplify NCU08887 set 2
(K. Adames, Nargang lab)
5' -
CCGATTAAGAGGGAGGAATGTAGT
G - 3'
08887-
sequence-8
Forward primer to PCR
amplify NCU08887 set 3
(K. Adames, Nargang lab)
5' - CTCCCATCCTCACCCTCCGT -3'
23H2-2R
Reverse primer to PCR
amplify NCU08887 set 3
5' -
TGTTCCCGGCGTAACTCCCAAGACG

103
(K. Adames, Nargang lab) - 3'
NCU01542 5'
Forward primer to cone
NCU01542 (K. Adames,
Nargang lab)
5'-
TATATATATAGGCGCGCCCGTCCGT
CCCCATCGACCGTGTCC - 3'
NCU01542
reverse
Reverse primer to cone
NCU01542 (N. Go,
Nargang lab)
5' -
TTCTTACATGGCGCGCCCTGCTGCC
TCTGCGTTCGTATGTGG - 3'
NotI removal 1
Mutagenesis primer used
for 1st NotI site removal
(A.B. Desaulniers,
Nargang lab)
5' -
CCATACCCTTGCTGCCACAGCGGCT
GCGAACGTGGTGTTCCCCCG - 3'
NotI removal 2
Mutagenesis primer used
for 2nd NotI site removal
(A.B. Desaulniers,
Nargang lab)
5' -
CCTCAAACTCAACTGGCTCGGCCGA
GGCCGCACCGGTCGCAACAG -3'
NotI 5'
Primer for adding NotI
site after start to make 5'
tag containing clones
(A.B. Desaulniers,
Nargang lab)
5' - /5Phos/
CGTCGCGCGCAACGAGACATGGCG
GCCGCTCCGCCAGCCACATTGCTGC
-3'
NotI 3'
Primer for adding NotI
site before stop to make 3'
tag containing clones
5' - /5Phos/
CCTCAAACTCAACTGGCTCGGCCGA
GGCCGCACCGGTCGCAACCA G -3'

104
(A.B. Desaulniers,
Nargang lab)
88H8 BstXI
mutagenesis
Primr to mutagenize BstXI
site to clone extra
fragment into incomplete
88H8 clone
5'-
/5Phos/GTGGATGGTGACGAAACCTC
TGGAGAGATGGGCACTTGGACTTG
GGATGGGG -3'
88H8 AflII site
insertion
Inserting an AflII site
(mutagenesis) into
previously cloned
incomplete gene so as to
add in extra fragment
5'-
/5Phos/CAAGAGCGGCGGTCCGATGA
GCCCTCCCATCTTAAGCTTGACAGA
GGCGAG -3'
88H8 Fwd
primer(BstXI)
Forward primer for PCR
amplification of additional
fragment (with BstXI site)
5'-
AAATATAACCACCGCGGTGGGGAA
CACTTTAGGGCGATCTAG -3'
88H8 Rev
Primer (AflII)
Reverse primer for PCR
amplification of additional
fragment (with AflII site)
5'-
CGCGCTCGCCTCTGTCAAGCTTAAG
ATGGGAG -3'
88H8InsertNotI
-5’tag new start
Mutagenesis primer for
adding NotI site after start
to make 5' tag containing
clones
5'-
/5Phos/CAGAAGCAAGCAAACAATCA
ATGGCGGCCGCCAACCCATGAGTG
GAAGAGG -3'
88H8InsertNotI
-5’tag bd
Mutagenesis primer for
adding NotI site after start
5'-
/5Phos/CAAACAATCAATGCAACCCA

105
to make 5' tag containing
clones (with beaus
proposed start)
TGGCGGCCGCAGTGGAAGAGGAAC
CCCCG -3'
88H8 seq 1
Sequencing primer (A.B.
Desaulniers, Nargang lab)
5' - GGGTAGGCGTACACTCGGGC - 3'
88H8 seq 2
Sequencing primer (A.B.
Desaulniers, Nargang lab)
5' - CCACAACGGCCTCGCCGGAA -3'
88H8 seq 3
Sequencing primer (A.B.
Desaulniers, Nargang lab)
5' - GGCCTACAGATCCCACAGCC - 3'
88H8 seq 4
Sequencing primer (A.B.
Desaulniers, Nargang lab)
5' - CCGCTTGATCCCTGCTCTTG - 3'
88H8 seq 5
Sequencing primer (A.B.
Desaulniers, Nargang lab)
5' - CCTCCATGTCCAACCCCGTT - 3'
88H8 seq 6
Sequencing primer (A.B.
Desaulniers, Nargang lab)
5' - CCCCCACTCCTCCACGGGCA - 3'
88H8 seq 7
Sequencing primer (A.B.
Desaulniers, Nargang lab)
5' - CCGGTCGCAACAGAAGGGGC - 3'
NCU08887-5'
PCR amplification primer
to clone NCU08887,
forward primer (K.
Adames, Nargang lab)
5' -
CAGCTAGCGAGGCGCGCCGTGATG
GATGATGTATCTGGACCAC - 3'
NCU08887-3'
PCR amplification primer
to clone NCU08887,
5' -
AGTCAGGCTAGGCGCGCCTGGCTG

106
reverse primer (K.
Adames, Nargang lab)
GTGATGGAAGGACGCAGCC -3'
NCU08887-5'-
NotI
Mutagenesis primer used
for NotI site removal (K.
Adames, Nargang lab)
5' - /5Phos/
CTCTTTCCCCCACGCCAGCAGCAGC
CGCCTCCACCGCACACCCACACCC -
3'
8887 NotI
removal-
sequence
Sequencing primer to
check if NotI site has been
mutaganized (K. Adames,
Nargang lab)
5' - GTGCCACGAACCGGCACCAC - 3'
NotI insertion-
5'
Primer to Add NotI site
after start to make 5' tag
containing clones (K.
Adames, Nargang lab)
5' - /5Phos/
TACTTCCAAAGCTTATGATGGCGGC
CGCTCCTCTACTGATGCAATTAC - 3'
NotI insertion-
3'
Primer to add NotI site
before stop to make 3' tag
containing clones (K.
Adames, Nargang lab)
5' - /5Phos/
GGTTTGTTGTTGGGAATCAAGCGGC
CGCTGATGGGGCTGTGATAGGGA -
3'
08887-
sequence -1
Sequencing primer (K.
Adames, Nargang lab)
5' - TACTTTTGAGCTGACTGCAT - 3'
08887-
sequence-2
Sequencing primer (K.
Adames, Nargang lab)
5' - TCACAGCACCACCAGTGCTT - 3'
08887- Sequencing primer (K. 5' AGAAGACGCCCGTACACTCC- 3'

107
sequence-3 Adames, Nargang lab)
08887-
sequence-4
Sequencing primer (K.
Adames, Nargang lab)
5' - CCTCTGCTACTACGCCTTTG -3'
08887-
sequence-5
Sequencing primer (K.
Adames, Nargang lab)
5' - TTATACATGATGCTGATGCT - 3'
08887-
sequence-6
Sequencing primer (K.
Adames, Nargang lab)
5' - ATACCCCGCTGAACATCAAT - 3'
08887-
sequence -8
Sequencing primer (K.
Adames, Nargang lab)
5' - CTCCCATCCTCACCCTCCGT -3'
08887-
sequence-9
Sequencing primer (K.
Adames, Nargang lab)
5' - TTATTGGTTTGGGGGTTTTG -3'
08887-
sequence-4.5
Sequencing primer (K.
Adames, Nargang lab)
5' - GGGAGGAGGATCGTGTTGGT - 3'
08887-
sequence-5
reverse
Sequencing primer (K.
Adames, Nargang lab)
5' - AGCATCAGCATCATGTATAA -3'
aod-1 qPCR
primer F
qPCR forward primer for
aod-1 (Z.Qi, Nargang lab)
5’ – GGGGCGTTAATCATACATTGA -
3’
aod-1 qPCR
primer R
qPCR reverse primer for
aod-1(Z.Qi, Nargang lab)
5’ – AGTCGCTCACAAACGGATTC –
3’
β-tubulin
qPCR primer F
qPCR forward primer for
β-tubulin (Z.Qi, Nargang
lab)
5’ – GCCTCCGGTGTGTACAATG – 3’

108
β-tubulin
qPCR primer R
qPCR forward primer for
β-tubulin (Z.Qi, Nargang
lab)
5’ – CGGAAGCCTCGTTGAAGTAG –
3’

109
References
BERTRAND, H., and T. H. PITTENGER, 1969 Cytoplasmic Mutants Selected from
Continuously Growing Cultures of Neurospora crassa. Genetics 61: 643-659.
DAVIS, R., and F. DE SERRES, 1970 Genetic and microbiological research techniques for
Neurospora crassa. Methods Enzymol. 17A: 79-143.
HOPPINS, S. C., N. E. GO, A. KLEIN, S. SCHMITT, W. NEUPERT et al., 2007 Alternative
splicing gives rise to different isoforms of the Neurospora crassa Tob55 protein
that vary in their ability to insert beta-barrel proteins into the outer mitochondrial
membrane. Genetics 177: 137-149.
NARGANG, F. E., and D. RAPAPORT, 2007 Neurospora crassa as a model organism for
mitochondrial biogenesis. Methods Mol. Biol. 372: 107-123.
ORBACH, M. J., 1994 A cosmid with a HyR marker for fungal library construction and
screening. Gene 150: 159-162.
SAMBROOK, J., and D. W. RUSSELL, 2001 Molecular Cloning: A laboratory manual. Cold
Spring Harbor Laboratory Press, Cold Spring Harbor, N.Y.
WENDLAND, J., K. B. LENGELER and E. KOTHE, 1996 An instant preparation method for
nucleic acids of filamentous fungi. Fungal Genet. Newsl. 43: 54-55.
WIDEMAN, J. G., N. E. GO, A. KLEIN, E. REDMOND, S. W. LACKEY et al., 2010 Roles of
the Mdm10, Tom7, Mdm12, and Mmm1 proteins in the assembly of
mitochondrial outer membrane proteins in Neurospora crassa. Mol. Biol. Cell. 21:
1725-1736.

110
Chapter 3: Results
3.1 Analysis of possible assembly mutants
Screening of the N. crassa KO mutant library identified several mutants with varying
degrees of AOX deficiency (NARGANG et al. 2012). Some of the KO strains were found
to have very poor or no growth in the presence of AA, but had wild-type levels (or near
wild-type levels) of AOX in their mitochondria under Cm inducing conditions. One
possible explanation for these data was that AOX protein was produced and imported
into the mitochondria, but was not properly assembled into a functional protein. Thus, the
KO strains could be assembly mutants affecting such processes as iron integration,
unknown but required post-translational modifications, or integration of AOX into the
MIM.
3.1.1 Preliminary tests to confirm phenotypes of possible assembly mutants
I chose five such mutant strains to analyze as possible assembly mutants, based on
the severity of the AA sensitivity in these strains (as reported previously (NARGANG et al.
2012)). Four of these strains (13G11, 28B10, 85H5 and 101D3) had no growth and one
strain (99B8) grew very slowly on AA-containing plates. All these strains were
previously found to have AOX levels either slightly lower or comparable to wild-type
levels on western blots following growth in the presence of Cm. As a first step, I wished
to confirm the growth test and western blot data obtained during the large scale KO
mutant library screen. Table 6 contains growth test data for the five KO mutant strains on
standard Vogel’s medium plates with or without addition of AA. Consistent with the
previous observations, these KO mutant strains have very little to no growth on AA

111
Table 6. Growth test data for possible KO assembly mutant strains and the wild-
type control.
Strain
number
NCU
number
Mating
type
Gene description* Growth on plates at
48 hrs**
AA- AA+
Wild-type
control
NCN251 A N/A 4.2*** 4.2
13G11 NCU04566 a Protein kinase 10 4.2 0
28B10 NCU08137 A Hypothetical protein 4.2 0
85H5 NCU09803 A Thioredoxin 4.2 0
99B8 NCU09327 A Cytochrome-4 4.2 0.2
101D3 NCU09560 a Superoxide dismutase 4.2 0
* From the BROAD Institute Neurospora genome website and fungidb.org.
** Measured in cm from the point of inoculation at the center of the plate.
***This number represents the radius of the plate. Thus, at the 48 hr time point, the strain
of interest, inoculated at the center of the plate, completely covered the surface of the
plate.

112
containing plates and grow at normal rates on standard medium. It should be noted that
previous work gave similar results for strains with mutations in aod-1 the AOX structural
gene (LI et al. 1996; DESCHENEAU et al. 2005).
The strains were then grown in the presence of Cm for 24 and 48 hr to determine if
AOX was inducible. Levels of AOX in these strains were examined by subjecting
mitochondrial proteins to SDS-PAGE followed by western blot analysis. As shown in
Fig. 8, AOX is present in all strains. The levels seem to be slightly lower than the control
(NCN251) in some strains (13G11, 28B10 and 85H5) but comparable to the control in
the other strains. Thus, these data confirm that the strains selected for analysis as possible
assembly mutants, have very poor or no growth in the presence of AA even though they
have substantial AOX levels under conditions that induce the expression of the enzyme.
One possibility for an AOX assembly defect would be an inability of the protein to
be properly inserted into the MIM. This was tested using carbonate extraction
experiments. A schematic overview of this technique is outlined in Fig. 9. In general,
peripheral membrane proteins, associated with the membrane via electrostatic
interactions, can be removed from the membrane by treatment with sodium carbonate at
pH 11.0. However, this treatment does not disrupt the interaction of integral membrane
proteins that contain hydrophobic trans-membrane domains inserted into the membrane
lipid bilayer. Thus, integral membrane proteins partition with the membrane fraction
(pellet) upon centrifugation while peripheral membrane proteins are present in the
supernatant fraction (along with soluble proteins) (FUJIKI et al. 1982a; FUJIKI et al.
1982b). Past results with interfacial membrane proteins (like AOX) have shown that
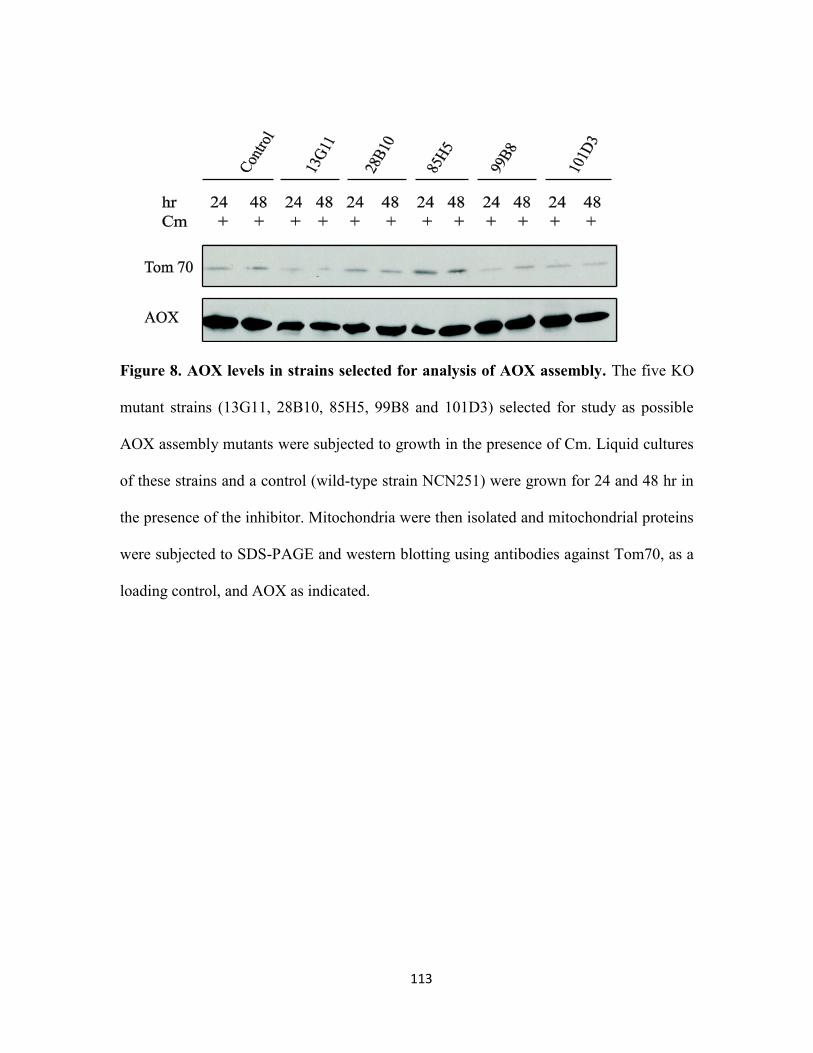
113
Figure 8. AOX levels in strains selected for analysis of AOX assembly. The five KO
mutant strains (13G11, 28B10, 85H5, 99B8 and 101D3) selected for study as possible
AOX assembly mutants were subjected to growth in the presence of Cm. Liquid cultures
of these strains and a control (wild-type strain NCN251) were grown for 24 and 48 hr in
the presence of the inhibitor. Mitochondria were then isolated and mitochondrial proteins
were subjected to SDS-PAGE and western blotting using antibodies against Tom70, as a
loading control, and AOX as indicated.
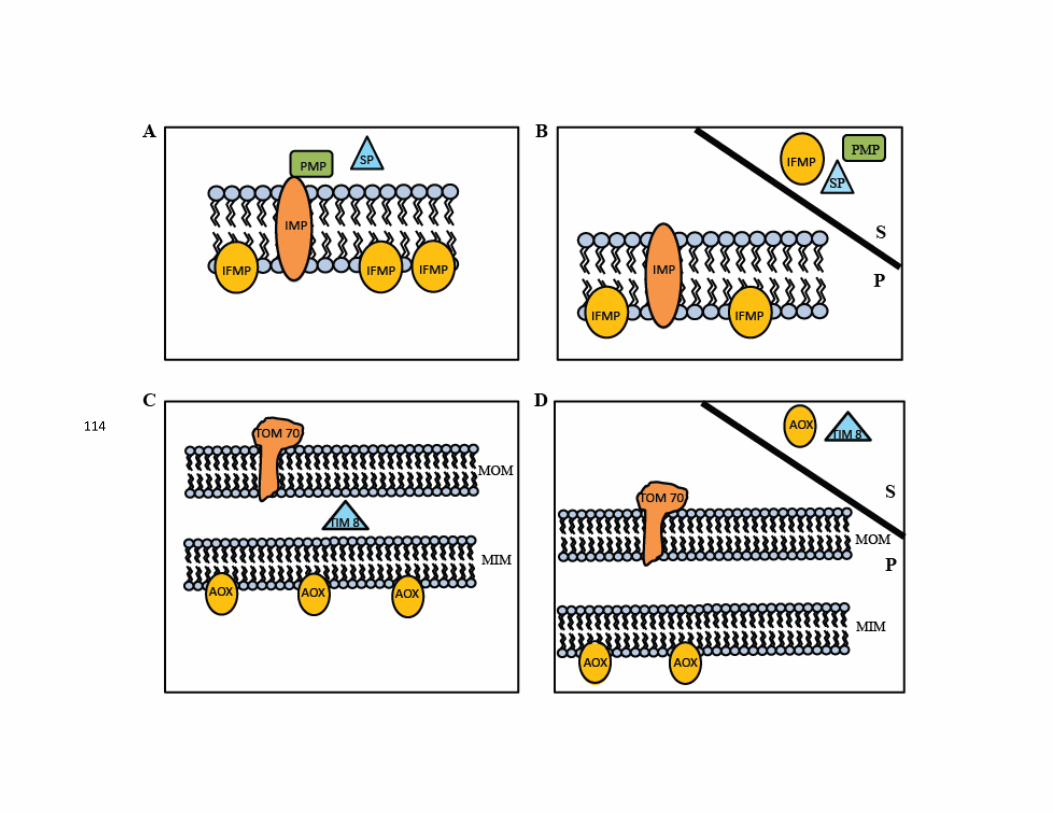
114
114

115
Figure 9. Basic schematic of carbonate extraction. A) A general membrane system
with its associated proteins (IMP, integral membrane protein; PMP, peripheral membrane
protein; SP, soluble protein and IFMP, interfacial membrane protein). B) Upon treatment
of the membrane system with 0.1M sodium carbonate (pH 11.0), followed by
centrifugation, the pellet fraction (P) should contain the integral membrane protein and
some proportion of the interfacial membrane proteins. The soluble protein, some of the
interfacial membrane proteins and the peripheral membrane protein are present in the
supernatant fraction (S). C) N. crassa mitochondrial membrane proteins examined in this
study. Tom70 is an integral membrane protein of the MOM, Tim8 is a soluble protein of
the IMS whereas AOX is an interfacial membrane protein of the MIM. D) Upon
carbonate treatment, the majority of Tom70 is expected to partition into the pellet
fraction, Tim8 is expected to be present in the supernatant fraction whereas AOX is
expected to be present in both the pellet and supernatant fraction.

116
these proteins fractionate to both the supernatant and pellet fraction (JANSSEN et al. 2002;
CLAYPOOL et al. 2006a; SINGHA et al. 2009; POVELONES et al. 2013).
Based on the carbonate extraction results in Fig. 10, the five strains under study were
divided into two subclasses. One subclass denoted ‘wild-type like’ consisted of strains
28B10, 99B8 and 101D3 which had an almost wild-type pattern of partitioning AOX in
the pellet and the supernatant fractions. The other subclass was denoted as ‘possible
AOX insertion mutants’ and consisted of strains 85H5 and 13G11. In the case of 13G11,
at both time points tested, AOX seems to partition mostly in the supernatant fraction,
unlike the pattern observed with AOX in the wild-type strain. A similar pattern was seen
in 85H5 at 24 hr. This suggested that AOX may not be properly inserted into the MIM in
these strains.
Unfortunately, when the carbonate extractions were done repeatedly on some of
these strains, it became apparent that the data were not consistent. For example in strain
13G11, identical experiments seemed to produce a very different AOX partitioning
pattern (Fig. 11). Similar variations occurred in other strains examined (not shown).
These inconsistencies led us to abandon further study of assembly mutants by carbonate
extraction.
3.2 Study of class I KO mutant strains
As described in section 1.10.1, a large scale screen of the N. crassa KO library identified
eight new mutants that had no growth, or very poor growth, on AA containing medium
and had virtually no AOX following growth in Cm (NARGANG et al. 2012). One mutant
(100B5), lacking the NCU08158 gene (encoding a dual specificity phosphatase protein)
was previously characterized (DESAULNIERS 2013) leaving seven new uncharacterized

117
Figure 10. Carbonate extractions of putative assembly mutants. N. crassa strains
were grown in the presence of Cm to induce AOX. Mitochondria were isolated and
subjected to sodium carbonate extraction at pH 11.0. The Tom70 protein (MOM protein,
present mainly in the P fraction) and the Tim8 protein (IMS protein present mainly in the

118
S fraction) serve as controls. A) Carbonate extraction of strains 28B10, 99B8 and 101D3.
B) Carbonate extraction of strains 13G11 and 85H5. The control is the wild-type strain
NCN251.

119
Figure 11. Inconsistencies in carbonate extraction results for strain 13G11. The
AOX partitioning patterns from two identical experiments with strain 13G11. A) A
separate experiment from that shown in Fig. 10B shows a similar AOX partitioning
pattern as in Fig. 10B. B) An identical experiment on the same strain produces an AOX
partitioning pattern that is similar to the control. The control is the wild-type strain
NCN251. S, supernatant fraction; P, pellet fraction.

120
mutants with severe AOX deficiencies. Work in this thesis began by focusing on two
mutants 23H2 (KO-NcMFS) and 88H8 (KO-NcHbrB) as these strains had good growth
and conidiation on standard medium in comparison to the other class 1 KO strains.
However, as described below, it became apparent that these genes were likely not
involved in AOX expression. Therefore, experiments turned to assessing the integrity and
authenticity of the other five class 1 KO mutant strains identified by the screen that lack
AOX protein at 24 and/or 48 hr of growth in the presence of Cm. An additional KO
strain, 113G8 (lacking the NCU03071 gene, encoding a MAP kinase kinase kinase
protein), was included in this study. This strain was identified in our lab after the initial
study, as having an AOX deficiency characteristic of other class 1 KO mutants.
3.2.1 The NCU08887 hypothetical protein (NcMFS) contains a major facilitator
superfamily (MFS) domain
The gene NCU08887 encodes a 1068 amino acid long hypothetical protein (referred
to in this thesis as NcMFS) annotated as containing a major facilitator superfamily (MFS)
domain. Members of this superfamily are present in all kingdoms of life and are involved
in the transport of small solute molecules coupled to a chemiosmotic ion gradient (PAO et
al. 1998; REDDY et al. 2012). Homologs of NcMFS are found in several fungal species
including Sordaria macrospora, Podospora anserina and Chaetomium thermophilus.
However, upon performing BLAST searches, no clear homologs of this protein are
observed in humans, mice, Drosophila, zebrafish and C. elegans.
The MFS superfamily is a large family of secondary transport proteins consisting of
76 different subfamilies (YAN 2013). The superfamily includes antiporters, symporters
and uniporters that show high substrate specificity and transport substrates including:

121
drugs, sugars, organophosphates, metabolites, organic and inorganic anions,
monocarboxylic acids and aromatic acids to name a few (PAO et al. 1998; REDDY et al.
2012; YAN 2013). Most proteins of this superfamily have either 12 or 14 transmembrane
α-helical domains (TMDs) but some with more TMDs have also been observed (REDDY
et al. 2012; YAN 2013). MFS proteins show very poor sequence similarity but all possess
a common structural motif termed the MFS motif (YAN 2013).
As shown in Fig. 12, hydropathy analysis of the NcMFS protein using the WHAT
2.0 (Web based hydropathy and amphipathicity predictions (http://www.tcdb.org))
software suggested the presence of 12 transmembrane α-helical domains (TMDs).
Recently, the N. crassa database (http://www.broadinstitute.org/annotation/genome/
neurospora) has annotated the gene product of NCU08887 as a drug/toxin transport
protein.
3.2.1.1 Cytochrome spectra analysis of mutant 23H2 (KO-NcMFS)
Given that the function of NCU08887 might be that of a transport protein acting on
drugs or toxins it was possible that loss of the protein in the KO strain might affect entry
of Cm into the cell. If Cm did not enter the cell, then no signal for AOX production
would be generated. This would explain the lack of AOX in 23H2 (KO-NcMFS)
following growth in Cm. An example of an antibiotic entering cells via an MFS
transporter has been seen in E. coli and Pseudomonas aeruginosa where the antibiotic
fosfomycin enters cells using the Glycerol-3-phosphate transporter (LEMIEUX et al. 2004;
CASTAÑEDA-GARCÍA et al. 2009; SANTORO et al. 2011). However, it should be noted that
although the scenario presented above could explain lack of AOX in 23H2 (KO-NcMFS)
following growth in Cm, it would not explain why mutant 23H2 (KO-NcMFS) is unable
1 2 3 4 5 6 8 9

122
Figure 12. Hydropathy analysis of the NcMFS protein. The WHAT 2.0 software was
used to determine the number of TMDs in the predicted protein product of the
NCU08887 gene. The orange bars represent predicted TMDs and are numbered at the
top. The blue line denotes hydropathy whereas the red line denotes amphipathicity
(http://www.tcdb.org).
1 2 3
2 3 4 5 6 2 3
7 2 3
8 9 10 11 12 2 3

123
to grow in the presence of AA. To determine if Cm was entering cells using the NcMFS
protein, cytochrome spectra analysis of mitochondria from mutant 23H2 (KO-NcMFS)
and a wild-type control grown in the presence and absence of Cm was carried out. Cm
inhibits mitochondrial, but not cytosolic, translation. Its effects are seen by severe
reduction in the levels of cytochrome b and cytochrome aa3, which have mtDNA encoded
components that are poorly translated in the presence of Cm. As can be seen in Fig. 13,
the cytochrome spectrum of 23H2 (KO-NcMFS) following growth in Cm lacks
cytochrome b and aa3, similar to the wild-type control. This demonstrates that Cm is
efficiently inhibiting mitochondrial translation in this strain.
3.2.1.2 Inability to rescue KO mutant 23H2 (KO-NcMFS)
Since some MFS proteins are involved in transport of metabolites NcMFS may be
involved in transport of the AOX induction signaling molecule out of the mitochondria.
Once in the cytosol this signaling molecule could either enter the nucleus to directly
activate the expression of AOX or act indirectly via a signaling cascade to initiate the
production of AOX. Thus, the absence of NcMFS in mutant 23H2 (KO-NcMFS) would
trap the AOX signaling molecule in the mitochondria and prevent AOX induction.
An initial test of this hypothesis would be to determine if the NcMFS was present in
the MIM. Therefore, a rescue based approach using a gene encoding this protein with
identifiable tags was used. A plasmid containing selectable markers and the NcMFS gene
was previously created in the Nargang lab (K. Adames). The plasmid was further
manipulated to contain either a 3XMyc tag at the N-terminal end of the coding sequence
(termed N-Myc 23H2) or a 3XHA tag at the C-terminal end (termed C-HA 23H2) (Fig.
14). The tags were inserted to facilitate localization studies. The constructs were

124
Figure 13. Cytochrome spectra of 23H2 (KO-NcMFS). The control strain (NCN251)
and strain 23H2 (KO-NcMFS) were grown in the presence and absence of Cm for 24 hr.
Mitochondria were isolated and processed as described in section 2.14 to obtain
difference spectra (reduced sample vs oxidized reference) over wavelengths 500 to 650
nm. The Y axis represents absorbance of the sample (arbitrary units).

125
125

126
Figure 14. Cloning strategy for NcMFS gene. The NcMFS gene (along with 495 bp
upstream and 608 bp downstream from the start and stop codon, respectively) was PCR
amplified from cosmid pMOCosX G2X6 and cloned into plasmid vector pBS520 AscI.
The plasmid contains BmR and Amp
R markers. A NotI site in the coding sequence of the
NcMFS gene was removed by site directed mutagenesis without altering the amino acid
specificity of the codon affected. Following this, NotI sites were introduced at the 3’ or
the 5’ end of the coding sequence by mutagenesis (before the stop codon or after the start
codon, respectively) for insertion of epitope tags (3XHA or 3XMyc) at these sites to
create 3’ 3XHA and 5’ 3XMyc tagged versions of the NcMFS protein. The construction
of the plasmid described above was done by K. Adames, a technician at the Nargang lab.

127
linearized with SacI and transformed into mutant strain 23H2 (KO-NcMFS) conidia via
electroporation. Transformed conidia were spread onto Bm-containing selection plates.
Following a five day incubation period, 19 colonies from the C-HA 23H2 transformation
plates and 21 colonies from the N-Myc 23H2 transformation plates were picked for
further analysis. These transformants were subsequently purified via one round of single
colony isolation and stocks were maintained on slants without Bm.
Conidia from four transformants of the N-Myc transformation (Fig. 15) and four
from the C-HA transformation (Fig. 16) were spotted onto medium containing AA to
determine if the AOX deficient phenotype was rescued. Surprisingly, no growth was
observed for any of the tranformants, demonstrating AOX function was not restored.
Three possibilities could explain these results. First, it was conceivable that only the
selected BmR cassette from the plasmid constructs was inserted into the genome of the
transformants. However, this seemed unlikely given the usual results of similar N. crassa
transformations and the number of transformants tested. Second, the transformed strains
may not express functional NcMFS protein due to interference of the inserted tag or
incomplete promoter sequence in the plasmid. The third possibility was that NcMFS may
not play a role in AOX production in N. crassa and the AOX deficient phenotype of the
strain may be due to another mutation.
To determine if tagged NcMFS was being expressed in the transformed strains, they were
grown in either the presence or absence of Cm. Whole cell extracts were prepared and
these were analyzed by SDS-PAGE and western blot analysis using antibodies to the
protein tags. As can be seen in Fig. 17, NcMFS protein was not detected in the eight
tranformants tested. Thus, the other two possibilities listed above could not be eliminated.

128
Figure 15. Growth of N-Myc tagged NcMFS transformants. 10 µL of suspension
containing tenfold dilutions of conidia from the indicated strains was spotted onto
standard medium with or without the indicated inhibitors. NCN251 is the wild-type
control that is resistant to AA but sensitive to Bm. BmR gene was present on the plasmids
used for transformation. The control is also sensitive to hygromycin. A HygR cassette was
used to disrupt genes in the KO library. The original KO strain 23H2 (KO-NcMFS) was
used as a negative control for growth on AA and as a positive control for growth on
hygromycin.
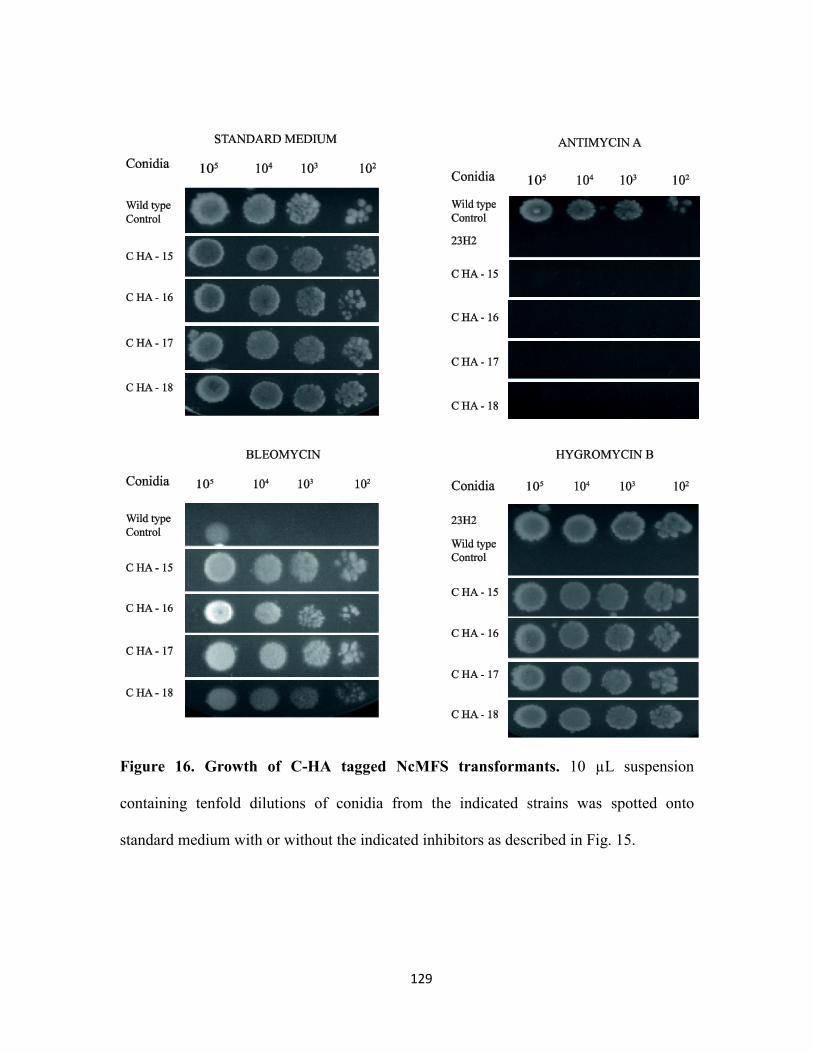
129
Figure 16. Growth of C-HA tagged NcMFS transformants. 10 µL suspension
containing tenfold dilutions of conidia from the indicated strains was spotted onto
standard medium with or without the indicated inhibitors as described in Fig. 15.

130
Figure 17. Examination of transformants for expression of tagged protein. A) Whole
cell extracts were isolated from four N-Myc tagged NcMFS transformants grown in
either the absence (-) or presence (+) of Cm. The control is the wild-type strain NCN251.
Western blot analysis, using antibodies indicted on the left, was performed. The band
appearing in the upper panel is a non-specific band as it is also present in the control
lanes. Arginase and Tob55 serve as loading controls. B) Whole cell extracts were isolated
from four C-HA tag containing transformants and analyzed as in panel A.

131
3.2.1.5 aod-1 transcript levels in mutant 23H2 (KO-NcMFS)
To determine if the lack of the AOX protein in 23H2 (KO-NcMFS) is due to an effect on
aod-1 transcription, aod-1 transcript levels in mutant 23H2 (KO-NcMFS) and in a wild-
type control (NCN251) were quantified. qPCR data (Fig. 18) suggests that the aod-1
transcript levels in these two strains are similar. This suggests that lack of AOX in strain
23H2 (KO-NcMFS) is most likely due to a post-transcriptional process.
3.2.1.4 Expression of NcMFS
While the experiments described above were being performed, RNA-seq data for a
wild-type strain and class 1 mutant strain 100B5 was obtained (DESAULNIERS 2013). As
shown in Fig. 19, there was virtually no transcript for the NCU08887 gene in either the
wild-type or 100B5 in either the presence or absence of Cm. Even when the scale of the
Y axis is lowered, virtually no transcript for this gene is observed. These data suggest that
the NcMFS protein may either be expressed only at a particular developmental stage, or it
may be under strict regulatory control, possibly being produced only in the presence of its
specific substrate. Lack of expression either with or without Cm makes it difficult to see
a role for NCU08887 in AOX production.
3.2.2 NCU01542 (NcHbrB): Hypothetical protein, with an HbrB domain
The second AOX deficient strain that I planned to investigate in this study was 88H8
(KO-NcHbrB) (section 3.2). The gene that was knocked out in this strain is NCU01542
which was initially listed at the BROAD website as encoding a 1155 amino acid protein
(referred to in this thesis as NcHbrB) that contains the HbrB superfamily domain. A
protein containing this domain was seen to play a role in polarized growth in Aspergillus
nidulans. Temperature-sensitive mutants of the A. nidulans hbrB3 gene (homolog of

132
Figure 18. Transcript levels of the aod-1 gene in mutant 23H2 (KO-NcMFS). RNA
was isolated and cDNA was synthesized from the wild-type control (NCN251) and
mutant 23H2 (KO-NcMFS) grown in either the presence or absence of Cm. qPCR
reactions were performed using 5 ng of cDNA from each sample. β-tubulin was used as
an endogenous control for the ΔΔCt quantification assay. Four biological replicates and
three technical replicates were used per treatment. Error bars represent standard error.
0
1
2
3
4
5
6
7
8
9
aod-1
NCN251 -Cm
NCN251 +Cm
23H2 -Cm
23H2 +Cm

133
NCU08888
Phenylalanyl tRNA synthetase subunit β
NCU08886
Amidohydrolase
NCU08887
NcMFS protein
NCN251 + Cm
NCN251 - Cm
100B5 + Cm
100B5 - Cm
Figure 19. Transcription of NcMFS gene (DESAULNIERS 2013). RNA-seq was performed on wild type strain (NCN251) and
the class 1 AOX mutant 100B5 (KO of NCU08158, dual specificity phosphatase protein). Both strains were grown in the
presence and absence of Cm for 12 hr. RNA was isolated, cDNA libraries were created, and sequencing was performed by
Delta Genomics using the Illumina platform. The number of cDNA reads were mapped onto the genome of N. crassa (shown
in purple for the wild-type strain and in red for mutant 100B5). The box surrounds the region of the genome corresponding to
the NcMFS gene. Strains and conditions are indicated on the left.
133

134
NCU01542) appear to hyperbranch as a consequence of hyperseptation at the restrictive
temperature of 42°C (GATHERAR et al. 2004). These mutants also appear to be
osmosensitive, suggesting a possible role of the hbrB domain in cell wall biogenesis. The
HbrB domain appears to be fungal specific as no clear homologs of this protein are
observed outside of the filamentous fungi group (GATHERAR et al. 2004).
3.2.2.2 Gene rescue using tagged NcHbrB
To gain insight into the role played by NcHbrB in the production of AOX, gene
rescue experiments with versions of the gene designed to express tagged protein were
previously attempted (A.B. Desaulniers, unpublished). The goal was to localize the
tagged protein as part of an attempt to discern its function. NCU01542 (and 601 bp
upstream and 566 bp downstream from the start and stop codon, respectively) was cloned
into plasmid vector pBS520 AscI (A.B. Desaulniers, unpublished) based on the cloning
strategy depicted in Fig. 20. However, attempts to rescue the mutant phenotype of 88H8
(KO-NcHbrB) using these plasmids were unsuccessful.
A possible reason for the inability to rescue the gene defect using the original
plasmids became apparent upon performing a multiple sequence alignment of NcHbrB
with homologous proteins from other fungal species (Chaetomium globosum, Thielavia
terrestris, Sordaria macrospora and Myceliophthora thermophila). By extending the
translation of NcHbrB further into the upstream region the N-terminus of NcHbrB could
be extended with good similarity to homologous proteins from other species. Thus, the
alignment data (Fig. 21) suggest that the true start site might be 720 base pairs (or 240
amino acids) upstream of the initially predicted start site at the BROAD website. RNA-
seq data (DESAULNIERS 2013) for the NCU01542 gene (Fig. 22) also supports the longer

135
135

136
Figure 20. Initial cloning strategy for the NcHbrB gene. The NcHbrB gene (and 601
bp upstream and 566 bp downstream from the start and stop codon, respectively) was
PCR amplified and cloned into plasmid vector pBS520 AscI containing a BmR and Amp
R
marker. Two NotI sites in the coding sequence of the NcHbrB gene were removed by site
directed mutagenesis without altering the amino acid specificity of the codon affected.
Following this, NotI sites were introduced at the 3’ or the 5’ end of the coding sequence
(before the stop codon or after the start codon, respectively) by mutagenesis for insertion
of epitope (3XHA or 3XMyc) tags to create 3’ or 5’ 3XHA or 3XMyc tagged versions of
the NcHbrB protein. The construction of the plasmids described above was done by A.B.
Desaulniers in the Nargang lab.

137
M.thermophila ------------------MQP------SRPPPRAPGSFSPLPASNSASAADLS------- 29
C.globosum ------------------MQP------TRPTPRAPGSFSPLPASNPASTTDLS------- 29
T.terrestris ------------------MQP------ARPPPRAPGSFSPLSPSNSASVTDDS------- 29
N. crassa NGSIERAPLNAAEASKQSMQPMSGRGTPGPTQRAPGSFSPLPASTNSTVNALAGADMGLV 42
S.macrospora ------------------MQ--STRGTPGPTQRAPGSFSPLPAITNSTGGVNA---DGIV 37
** . *. *********.. . :: :
M.thermophila RATQTRQGSV--------SGDEPPPLNVPKTRNPQ---GPSP------------------ 60
C.globosum RTRQNRQDSL--------SSDEPAPLDIHKTRGQT---APTP------------------ 60
T.terrestris RPRR--------------SSDEPAPLNVVKTRTPQPPTAPSP------------------ 57
N. crassa RPHRPSPGPVRIISASTSTSDDLTPLTIPRPSDQPTAPSPQPGGRPDASGFGGR—AGAS 100
S.macrospora RPHRPSPGPVRMISASTSSNDDLTPLTIPRSANQSTAPSPQPGGGLGASGFGGRPAGGAS 97
*. : :.*: .** : :. .* *
M.thermophila ----------------------IPSSTNLGSG------SNNSTTNPQTVSRPTVS--TAV 90
C.globosum ----------------------TPIYTSFTTG------ANNSTTNLQNFSRPTVS--TAV 90
T.terrestris ----------------------TPIYTSFTSGNSANAKADAGTAGPQNFSRPTVS--TAV 93
N. crassa PERRGGGG---TTPTPGRES-ATPIYSSFTSP----SNSASAPSLQTNFSRPTVSTTAAL152
S.macrospora PERRGVGGGTTPTPTPGRESSATPIYSSFTSQ----ANSATTPSLQTNFSRPTLSNTAAL153
* :.: : : .: ..****:* :*:
M.thermophila S--AARSVTGPQSPSDTLPRNGPSPLTLPPAGTSSPVTPT-SSSRGFSHSRKHSQNAGLF 147
C.globosum S--AARSVAGPQSPSDAVPRNGPSPLTLPPT-TSSPVTPT-FSSRGVSHSRKTSQNAGLF 146
T.terrestris S--AARSVAGTHSPVDALPRSGASPLTLPPA-TSSPVTPT-FGGR-LGHSRKHSQNAGLF 148
N. crassa S--TARSVAGTLSPIDTAPRNGPSPLTLPPTSATS-TTSTSFSGRVGVHSRKHSANAGLF 209
S.macrospora SAAAARSVAGTHSPIDTAPRNGPSPLTLPPTSATTSSTPTSFAGRVGAHSRKHSANAGLF 213
* :****:*. ** *: **.*.*******: ::: *.* ..* **** * *****
M.thermophila EPTLPSTSISNLSHVGLGNQSPKRAPA---PHRDMSASQIAAQAAVMQH---QNQQQ--- 198
C.globosum EPTLPSTSTSNLPNIGLTNHSPKRVPP---AHREMSASQIAAQAAVMQH---QNQQQQAQ 200
T.terrestris EPTLPSTSTSNLSQIGLTKQSPRAAPA---PHREMSASQIAAQAAVMQH---QNQQQ--- 199
N. crassa EPTLPSTSTSNLDQIQAE--SPKLSPTPSQAQRDMSASHIAAQAAVSKSQLTQQQQQQQP 267
S.macrospora EPTLPSTSTSNLGQFQAD--SPKLGPT---AQRDMSASHIAAQAAVSKSQLIQQQQQQQ- 267
******** *** :. **: *. .:*:****:******* : *:***
M.thermophila QAQQQVQQGVHA-------------RQRSQTAAP---DEADDAPPNKRASAGSVTLNPPI 242
C.globosum QAQQAQQQAQHS-------------RQRSQTAPG---PAADDPPPSKRASGSSIPLNTPM 244
T.terrestris ----QAQQAQQA-------------RQRSQTVPP---HGADDQP-AKRGSGG--PLNPPL 236
N. crassa QQQQQQQQQQQAPPFAHQHLVHLQHRQRSQTIPPSGEHHEQTSVANKRKSGG--PMSPPI 325
S.macrospora ----QQQQQQQAPTYAHQHLLHLQHRQRSQTIPPSTEHNEQTSVANKRISGG--PMSPPM 321
** :: ****** . : ** *.. .:..*:
M.thermophila LSLTEASVPRDNAFGGQTYHNGLAGNHTLAAATAANLVFPRSTQASPGLPTQSITPPP-- 300
C.globosum LSLTEASVPRDNAFGGQNYHNGLVGNHTLAATAAANLVFPRSTQASPGIPSQSFTPQPQP 304
T.terrestris LSLTEASVPRDNAFGGETYHNGLPGNHTLAATAAANLVFPRSAQATPGIPTQSLAPQPPP 296
N. crassa LSLTEASAPRDNVFGSQGNHNGLAGNHTLAATAAANVVFPRSAQSSPKLPAQPTNPLTPT 385
S.macrospora LSLTEASAPRDNVFGSQGYHNGLPGNHTLAATAAANVVFPRSAQSSPKLPTQSTNPLTPT 381
*******.****.**.: **** *******::***:*****:*::* :*:*. * .
M.thermophila PPPPPASEKPQKPEKSKVKLFSRPVKIGSSRSDNKEKPLPSPGKVGHALANLQRGNFSTT 360
C.globosum PPPPPASEKPQKPEKSKVKLFSRQVKIGS-KSDSKDKPLPSPGKVGHAFANLQRGNFSTT 363
T.terrestris PPPPPASEKPVKPEKSKVKLFSRQVKIGG-KSDLKDKPLPSPGKVGHVFANLQRGNFSTT 355
N. crassa PPPVAAEKPAVKSEKSKVKLFSRPGKSSSKAESSKEKPLPSPGKLGHAFSNLQRANYSTT 445
S.macrospora PPPVVAEKPVVKSEKSKVKLFSRPGKSSSKGESSKDKPLPSPGKLGHAFSNLQRANFSTT 441
*** *.: *.********** * .. .. *:********:**.::****.*:***
M.thermophila SLDS-TSQSFYNFSNSSAATIRPADMAPEKEGKEKEKKH-HFLSRQKHKLKDDHHLPLSS 418
C.globosum SLES-SSQSFYSLPNSSAATIRPADMPTEKEGKEKEKKH-HFLSRQKHKLKDDHHLPLSS 421
T.terrestris SLDS-TSQSFYSLPNSSAATIRPVEMPPEKEGKEKEKKH-HFLSRQKHKLKDDYHLPLSS 413
N. crassa SLESNMQQPFYAHGNSSTATIRPAEAT-EKEVKEKEKKHGHFLKRQKEKLIEAYHLPLSS 504
S.macrospora SLES-TMQPFYAHGNSSTATIRPAEAT-EKEVKEKEKKHGHFLKRQKEKLIEAYHLPLSS 499
**:* *.** ***:*****.: . *** ******* ***.***.** : :******
M.thermophila AMSNSRPTDPNAPSSLYSFSLPQSPVPNSTSFKSALDLRHGGRAFREKRKEDKSSGFDDV 478
C.globosum AMSNSRPADPSAPSSLYNFSLPQSPGPNTTGFKSALDLRHGGRAFRERRKEEKS---LDE 478
T.terrestris AMSNSRPTDPNAPSSLYSFSLPQSPGPSSTTFKSALDLRHGGRALREKRKEEKA--LEDA 471
New translation start
Old
translation
start
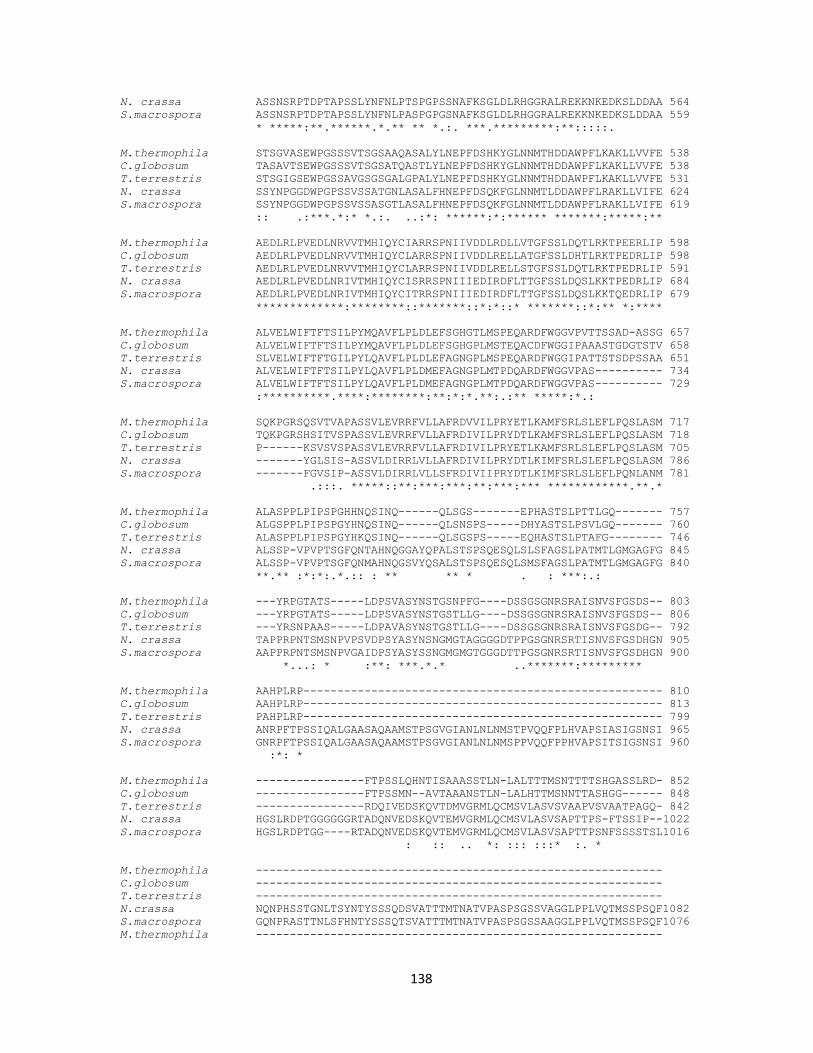
138
N. crassa ASSNSRPTDPTAPSSLYNFNLPTSPGPSSNAFKSGLDLRHGGRALREKKNKEDKSLDDAA 564
S.macrospora ASSNSRPTDPTAPSSLYNFNLPASPGPGSNAFKSGLDLRHGGRALREKKNKEDKSLDDAA 559
* *****:**.******.*.** ** *.:. ***.*********:**:::::.
M.thermophila STSGVASEWPGSSSVTSGSAAQASALYLNEPFDSHKYGLNNMTHDDAWPFLKAKLLVVFE 538
C.globosum TASAVTSEWPGSSSVTSGSATQASTLYLNEPFDSHKYGLNNMTHDDAWPFLKAKLLVVFE 538
T.terrestris STSGIGSEWPGSSAVGSGSGALGPALYLNEPFDSHKYGLNNMTHDDAWPFLKAKLLVVFE 531
N. crassa SSYNPGGDWPGPSSVSSATGNLASALFHNEPFDSQKFGLNNMTLDDAWPFLRAKLLVIFE 624
S.macrospora SSYNPGGDWPGPSSVSSASGTLASALFHNEPFDSQKFGLNNMTLDDAWPFLRAKLLVIFE 619
:: .:***.*:* *.:. ..:*: ******:*:****** *******:*****:**
M.thermophila AEDLRLPVEDLNRVVTMHIQYCIARRSPNIIVDDLRDLLVTGFSSLDQTLRKTPEERLIP 598
C.globosum AEDLRLPVEDLNRVVTMHIQYCLARRSPNIIVDDLRELLATGFSSLDHTLRKTPEDRLIP 598
T.terrestris AEDLRLPVEDLNRVVTMHIQYCLARRSPNIIVDDLRELLSTGFSSLDQTLRKTPEDRLIP 591
N. crassa AEDLRLPVEDLNRIVTMHIQYCISRRSPNIIIEDIRDFLTTGFSSLDQSLKKTPEDRLIP 684
S.macrospora AEDLRLPVEDLNRIVTMHIQYCITRRSPNIIIEDIRDFLTTGFSSLDQSLKKTQEDRLIP 679
*************:********::*******::*:*::* *******::*:** *:****
M.thermophila ALVELWIFTFTSILPYMQAVFLPLDLEFSGHGTLMSPEQARDFWGGVPVTTSSAD-ASSG 657
C.globosum ALVELWIFTFTSILPYMQAVFLPLDLEFSGHGPLMSTEQACDFWGGIPAAASTGDGTSTV 658
T.terrestris SLVELWIFTFTGILPYLQAVFLPLDLEFAGNGPLMSPEQARDFWGGIPATTSTSDPSSAA 651
N. crassa ALVELWIFTFTSILPYLQAVFLPLDMEFAGNGPLMTPDQARDFWGGVPAS---------- 734
S.macrospora ALVELWIFTFTSILPYLQAVFLPLDMEFAGNGPLMTPDQARDFWGGVPAS---------- 729
:**********.****:********:**:*:*.**:.:** *****:*.:
M.thermophila SQKPGRSQSVTVAPASSVLEVRRFVLLAFRDVVILPRYETLKAMFSRLSLEFLPQSLASM 717
C.globosum TQKPGRSHSITVSPASSVLEVRRFVLLAFRDIVILPRYDTLKAMFSRLSLEFLPQSLASM 718
T.terrestris P------KSVSVSPASSVLEVRRFVLLAFRDIVILPRYETLKAMFSRLSLEFLPQSLASM 705
N. crassa -------YGLSIS-ASSVLDIRRLVLLAFRDIVILPRYDTLKIMFSRLSLEFLPQSLASM 786
S.macrospora -------FGVSIP-ASSVLDIRRLVLLSFRDIVIIPRYDTLKIMFSRLSLEFLPQNLANM 781
.:::. *****::**:***:***:**:***:*** ************.**.*
M.thermophila ALASPPLPIPSPGHHNQSINQ------QLSGS-------EPHASTSLPTTLGQ------- 757
C.globosum ALGSPPLPIPSPGYHNQSINQ------QLSNSPS-----DHYASTSLPSVLGQ------- 760
T.terrestris ALASPPLPIPSPGYHKQSINQ------QLSGSPS-----EQHASTSLPTAFG-------- 746
N. crassa ALSSP-VPVPTSGFQNTAHNQGGAYQPALSTSPSQESQLSLSFAGSLPATMTLGMGAGFG 845
S.macrospora ALSSP-VPVPTSGFQNMAHNQGSVYQSALSTSPSQESQLSMSFAGSLPATMTLGMGAGFG 840
**.** :*:*:.*.:: : ** ** * . : ***:.:
M.thermophila ---YRPGTATS-----LDPSVASYNSTGSNPFG----DSSGSGNRSRAISNVSFGSDS-- 803
C.globosum ---YRPGTATS-----LDPSVASYNSTGSTLLG----DSSGSGNRSRAISNVSFGSDS-- 806
T.terrestris ---YRSNPAAS-----LDPAVASYNSTGSTLLG----DSSGSGNRSRAISNVSFGSDG-- 792
N. crassa TAPPRPNTSMSNPVPSVDPSYASYNSNGMGTAGGGGDTPPGSGNRSRTISNVSFGSDHGN 905
S.macrospora AAPPRPNTSMSNPVGAIDPSYASYSSNGMGMGTGGGDTTPGSGNRSRTISNVSFGSDHGN 900
*...: * :**: ***.*.* ..*******:*********
M.thermophila AAHPLRP----------------------------------------------------- 810
C.globosum AAHPLRP----------------------------------------------------- 813
T.terrestris PAHPLRP----------------------------------------------------- 799
N. crassa ANRPFTPSSIQALGAASAQAAMSTPSGVGIANLNLNMSTPVQQFPLHVAPSIASIGSNSI 965
S.macrospora GNRPFTPSSIQALGAASAQAAMSTPSGVGIANLNLNMSPPVQQFPPHVAPSITSIGSNSI 960
:*: *
M.thermophila ----------------FTPSSLQHNTISAAASSTLN-LALTTTMSNTTTTSHGASSLRD- 852
C.globosum ----------------FTPSSMN--AVTAAANSTLN-LALHTTMSNNTTASHGG------ 848
T.terrestris ----------------RDQIVEDSKQVTDMVGRMLQCMSVLASVSVAAPVSVAATPAGQ- 842
N. crassa HGSLRDPTGGGGGGRTADQNVEDSKQVTEMVGRMLQCMSVLASVSAPTTPS-FTSSIP--1022
S.macrospora HGSLRDPTGG----RTADQNVEDSKQVTEMVGRMLQCMSVLASVSAPTTPSNFSSSSTSL1016
: :: .. *: ::: :::* :. *
M.thermophila ------------------------------------------------------------
C.globosum ------------------------------------------------------------
T.terrestris ------------------------------------------------------------
N.crassa NQNPHSSTGNLTSYNTYSSSQDSVATTTMTNATVPASPSGSSVAGGLPPLVQTMSSPSQF1082
S.macrospora GQNPRASTTNLSFHNTYSSSQTSVATTTMTNATVPASPSGSSAAGGLPPLVQTMSSPSQF1076
M.thermophila ------------------------------------------------------------

139
C.globosum ------------------------------------------------------------
T.terrestris ------------------------------------------------------------
N. crassa SSPSSPATPTANSPGPLPPRPSISSLSASLATSG--ISGAGNNSLPNTPTAANATTPTTP1140
S.macrospora SSPSSPATPTANSPGPLPPRPSISSLSASLAGFGSRDNGFGRDSVPNTPTGTAPRDSATT1136
M.thermophila ---------------------------------QNVEDSKQVTDMVGRMLQCMSVLASVG 879
C.globosum ------------------------------------------------------------
T.terrestris ---------------------------------DADEGARRIEELNKLLKLNWLGRGRTG 869
N.crassa TAPANAAAGGGGGGGGGGGAGGPGGGTGGYGNVPPDESSRMIEELNKLLKLNWLGRGRTG1200
S.macrospora IAATTAGGISANANGGG----------------PPDESSRMIEELNKLLKLNWLGRGRTG1180
M.thermophila VTPLVVAGQSGAGAAAVGRAD--------------------------------------- 900
C.globosum -------GGPAAAAASAASAN--------------------------------------- 862
T.terrestris RNRRGMVGGRATRKAAGGASG--------------------------------------- 890
N. crassa RNRRGIVGGRVKRAGAGSGSGSALAFSMGAGS-AGMGYASSSSYGGYAGQGGGGGGGGGG1259
S.macrospora RNRRGIVGGRVKRAGAGSGSGSALAFSMGAGSGSGMGMGYASSYGGYSGHGHGGGYAG--1238
* .: . :.
M.thermophila ------------------------------------------------------------
C.globosum ------------------------------------------------------------
T.terrestris ------------------------------------------------------------
N.crassa GGGGGGGGYAGSLGTGPAGVSMNSLGTTGTMGSMMSIGTVGSGFGGGLLQGQQAERDRGG1319
S.macrospora ----------SSLGTGPAGVSMNSLGTMG----SMSIG----------------TRRRNS1268
M.thermophila DSDEANKKIEELNKLLKLNWLGRGRTGRNRRGMVGGRATKRGGSTGVQPPPPTLVPSSWA 960
C.globosum KTSKT----------------------------------------------PSKSPK-WS 875
T.terrestris GGDTAAG----------------------------AGAGAVGTSPEVRVPQPPPPPQSSS 922
N.crassa GGWTGTGTGSGLGTSASIIAGTTGTGGMMMSSLPIGASVSATTAGTVGAGAALAGAAGVS1379
S.macrospora DGRDGFRTGYYLYLLWCWDRYTTASGG--MSSPPT--TLAAGGAGTVGAGAALA-PAGSA1323
. . :
M.thermophila ESGSGAGAG--------------------------------------------------- 969
C.globosum AACCSA------------------------------------------------------ 881
T.terrestris SVSASSSMGV-------------------------------------------------- 932
N.crassa MPAAAAGSLSNEIVVDNWMVTKPLERWALGLGMGTRQKCMKEEKKKDIRVKWRHGVGIGV1438
S.macrospora MTGAGAGMAGGAGTIG------------AGAAMPGPPTTVGPAAP---------------1356
..:
M.thermophila -------------------------------------------
C.globosum -------------------------------------------
T.terrestris -------------------------------------------
N. crassa KFWIIGCSLGEHLHSSVIKTTHIYICICKSIQIIFSSALPLGT 1482
S.macrospora -----GVSGGPGAGSSSSNS---------NSEVMVDN------ 1379
Figure 21. Alignment of NcHbrB from various fungal species. Hypothetical protein
SMAC_02302, Sordaria macrospora k-hell, hypothetical protein MYCTH_2311840,
Myceliophthora thermophile, hypothetical protein CHGG_07991, Chaetomium globosum
CBS 148.51 and hypothetical protein THITE_2123534, Thielavia terrestris NRRL 8126
are aligned with the N. crassa NcHbrB protein. The M residue in the box indicates the
newly predicted translation start site for the N. crassa gene, whereas the M residue in the
circle indicates the BROAD institute’s initially predicted start site.

140
version of the gene predicted by the alignment. Although this could simply represent a
5’-UTR, the presence of a well conserved amino acid sequence when compared to
orthologs from several species, argues for the presence of coding sequence. Thus, in the
previous rescue attempts, the lack of rescue was most likely due to transformation with
an incomplete gene. To correct this error, a 1.7 Kb fragment, including 995 bp of the
coding region and 744 bp of upstream sequence was added to the N-terminus of the
previous clone, as depicted in Fig. 23.
3.2.2.3 Inability to rescue KO mutant 88H8 (KO-NcHbrB)
Gene rescue experiments were carried out by transforming strain 88H8 (KO-NcHbrB)
with the newly assembled 3’ 3XHA tag containing clone (linearized with BstXI) carrying
the predicted complete 3XHA tagged version of the NcHbrB gene. Twenty five
transformants were selected following plating on Bm-containing medium. Colonies were
isolated and purified by single colony isolation. These were tested for rescue of the AOX
deficient phenotype by inoculating the center of AA plates with conidia from each
transformant. No growth of the transformants on AA was observed, indicating no rescue
of the mutant phenotype. Since selection was done for Bm, it was possible that
integration of the whole plasmid had not occurred. Thus, to select for transformants
resistant to AA, transformation was repeated using the 3’ 3XMyc tag containing clone.
Transformed conidia were directly plated onto AA containing plates. After 9 days of
incubation at 30°C no colonies were observed. Rescue on AA plates for previously
analyzed AOX mutants was typically seen after 5 to 7 days. These data show that
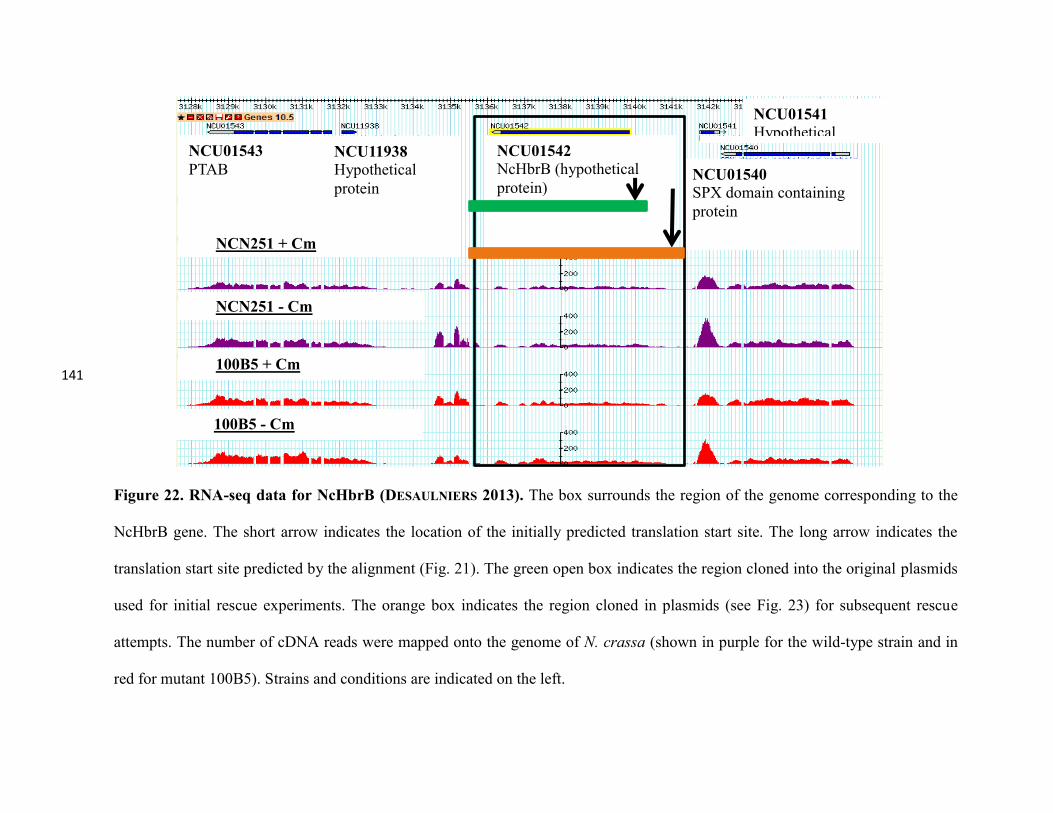
141
Figure 22. RNA-seq data for NcHbrB (DESAULNIERS 2013). The box surrounds the region of the genome corresponding to the
NcHbrB gene. The short arrow indicates the location of the initially predicted translation start site. The long arrow indicates the
translation start site predicted by the alignment (Fig. 21). The green open box indicates the region cloned into the original plasmids
used for initial rescue experiments. The orange box indicates the region cloned in plasmids (see Fig. 23) for subsequent rescue
attempts. The number of cDNA reads were mapped onto the genome of N. crassa (shown in purple for the wild-type strain and in
red for mutant 100B5). Strains and conditions are indicated on the left.
NCU01542 NcHbrB (hypothetical
protein)
NCN251 - Cm
100B5 + Cm
100B5 - Cm
NCU01543
PTAB NCU01540 SPX domain containing
protein
NCU11938 Hypothetical
protein
NCN251 + Cm
NCU01541 Hypothetical
protein
141

142
142

143
Figure 23. Cloning strategy for assembling predicted complete NcHbrB gene. A 1.7
Kb insert containing 995 bp of the newly predicted coding sequence and 744 bp upstream
of the newly predicted translation start site was PCR amplified from cosmid pMOCosX
X18A9 and digested with BstXI and AflII (BstXI and AflII sites has been introduced into
the ends of the PCR amplification product to facilitate subsequent directional cloning).
The previously designed plasmid clone carrying a 3’ 3XHA or 3’ 3XMyc tags and the
previously designed plasmid clone carrying 5’ 3XHA tagged version of the NcHbrB gene
(as described in Fig. 20) were also digested with BstXI and AflII. This allowed directional
cloning of the insert into the preexisting plasmid clones. Thus, an untagged version of the
complete gene and 3’ 3XHA and 3’ 3XMyc tagged versions of the complete NcHbrB
gene were obtained.

144
transfomants believed to express epitope tagged version of NcHbrB are unable to rescue
the mutant phenotype of 88H8 (KO-NcHbrB), suggesting that this protein, like NcMFS,
may not play a role in AOX production.
3.2.2.5 aod-1 transcript levels in mutant 88H8 (KO-NcHbrB)
qPCR was done to determine if the lack of the AOX protein in mutant 88H8 (KO-
NcHbrB) was the result of lack of aod-1 transcription in Cm induced conditions. As
shown in Fig. 24, the aod-1 transcript levels in mutant 88H8 (KO-NcHbrB) were
comparable to that of the wild-type control in both the presence and absence of Cm. This
suggests that lack of AOX in strain 88H8 (KO-NcHbrB) is most likely due to a post-
transcriptional process.
3.2.3 Verifying the integrity of eight AOX deficient mutant strains
As described above, attempts to rescue two of the class 1 AOX mutants (23H2 (KO-
NcMFS) and 88H8 (KO-NcHbrB)) that were identified in the large scale screen of N.
crassa KO library were unsuccessful. This led us to suspect that the strains being used
did not carry the specific KO assigned to them. Therefore, further research into the
integrity of all eight uncharacterized class 1 (severely AOX deficient) mutant strains was
undertaken. This included seven of the eight original class one mutants (23H2, 40E6,
41G7, 47H10, 52D8, 83H3, 88H8) (NARGANG et al. 2012), but not 100B5 which was
previously characterized and could be rescued (DESAULNIERS 2013). It also included
mutant 113G8 which was identified as a class 1 mutant among additional strains added to
the KO library after the NARGANG et al. (2012) study. My initial goal was to verify that
the assigned KO was actually present in the appropriate strain. Although this

145
Figure 24. Transcript levels of the aod-1 gene in mutant 88H8 (KO-NcHbrB). RNA
was isolated from 88H8 (KO-NcHbrB) and the control strain (NCN251) grown either in
the absence or presence of Cm. cDNA was prepared and the qPCR reactions were
performed. β-tubulin was used as an endogenous control for the ΔΔCt quantification
assay. Four biological and three technical replicates were used per sample. Error bars
represent standard error.
0
1
2
3
4
5
6
7
aod-1
NCN251 -Cm
NCN251 +Cm
88H8 -Cm
88H8 +Cm

146
had been done previously for the original class 1 mutant isolates (K. Adames and F.E.
Nargang, unpublished), my results prompted the need to confirm the data for the working
strains being used by me in the lab.
3.2.3.1 Verification of predicted gene KO by PCR analysis
To determine the authenticity of the eight AOX deficient mutants, PCR amplification of
the genes that were proposed to be knocked out in these mutants was carried out. Primers
were designed outside each gene replacement region and PCR amplification was carried
out using genomic DNA from a wild-type control and each mutant. The KO mutant
library was created by replacing the gene of interest with a HygR cassette (COLOT et al.
2006). Thus, based on the size of the target gene versus the HygR cassette, the size of the
expected PCR product could be predicted. Fig. 25 shows the primer design strategy used
for the study. When the wild-type gene was greater than 3 Kb a strategy involving two or
more sets of primer pairs was employed to increase PCR efficiency. All eight mutants
were found to have the expected size of PCR amplification fragments for the replacement
HygR
cassette (Fig. 26 and 27). These data show that the proposed genes were indeed
knocked out in the genome of the corresponding mutants.
3.2.3.2 Genetic analysis of the AOX deficient KO strains
Since all the mutants examined appeared to be correct in terms of the expected gene
KOs, I wished to determine if unknown mutations in additional genes might be the reason
for the AOX deficiency phenotype. To this end, crosses were made between each of the
eight AOX deficient mutants and a wild-type strain (either NCN251A or 76-26a his-3)
with the aim of analyzing the phenotypes of the haploid progeny. If loss of the gene

147
A B
Figure 25. Primer design strategy for KO mutants to be verified by PCR analysis. A) Schematic diagram of primer design strategy
for KO mutants in which the target gene was ≤ 3Kb. In these cases, only one primer pair (denoted as red arrows) was used for PCR
amplification (strain 41G7 is used as an example, with the expected fragment sizes denoted). B) Schematic diagram of primer design
strategy for KO mutants in which the target gene was >3Kb. Since these genes proved difficult to amplify using a single primer pair,
multiple primer pairs (i.e. F1 and R1 (red arrows); F2 and R2 (dark blue arrows); F3 and R3 (light blue arrows)) were used to amplify
target genes from the wild type strain. Primer pair (F1 and R3), outside the replacement region was used to amplify the region of interest
in the KO mutant since it should contain the smaller HygR
cassette. X, Y and Z represent predicted PCR amplified fragments (strain
40E6 is used as an example with the sizes of expected fragments denoted). F, Forward primer, R, Reverse primer.
Wild-type
control
40E6
F1
1.47 Kb
2.01 Kb
Wild-type copy of gene
X
2.21 Kb Y
2.14 Kb
Z
2.18 Kb
F2 F3 R1 R2
R3
R3 F1 HygR
cassette
Wild-type
control
41G7
Forward primer
Reverse primer
Forward primer
Reverse primer
1.47 Kb
1.81Kb
1.28 Kb
1.5 Kb
Wild-type copy of gene
HygR
cassette
147

148
Figure 26. PCR amplification products for strains 41G7, 83H3, 52D8 and 47H10. PCR amplification from genomic DNA of the
strains indicated at the top of the figure was done using the primer design outlined in Fig. 25A. In the case of mutant 47H10, products
from both the endogenous gene and the disruption were predicted to be of similar size. Therefore, restriction enzymes that cut only one
of the products were used to differentiate between them. Smaller fragments (0.35 Kb and 0.15 Kb) although not clearly visible here,
were faintly visible on the gel and the change in size of the original larger fragments is indicative of successful digestion. M, marker
fragments from HindIII digestion of λ phage (23.1 Kb, 9.4 Kb, 6.5 Kb, 2.3 Kb, 2.0 Kb); 47, 47H10; WT, wild type (NCN251) control.
148

149
Figure 27. PCR amplification products for 40E6, 113G8, 23H2 and 88H8. Strains examined are indicated at the top of the panel.
Sizes of predicted fragments are displayed below each lane. PCR confirmation for mutants 40E6, 23H2 (KO-NcMFS), 88H8 (KO-
NcHbrB) and 113G8 was carried out using the primer design strategy described in Fig.25B. For 23H2, the third set of primers with
wild type genomic DNA produced an additional bright band of ~2Kb (red arrow). This band was also visible (red arrow) when
genomic DNA from mutant 23H2 was used as a template (negative control), suggesting that it is a non-specific band. The correct size
fragment is indicated with a green arrow. M, marker fragments from HindIII digestion of λ phage (23.1 Kb, 9.4 Kb, 6.5 Kb, 2.3 Kb,
2.0 Kb); WT, wild type (NCN251) control.
149

150
knocked out (due to insertion of HygR
cassette) in each of the eight strains was causing
the AOX deficiency (as determined by AA sensitivity) then the phenotypic traits of HygR
and AAS
(AA sensitivity), should co-segregate completely and a 50:50 ratio of the
parental phenotypes of HygRAA
S (mutant parent) and Hyg
SAA
R (wild-type parent)
should be observed (Fig. 28). Ascospores were picked from these crosses and the
progeny were tested for their resistance to hygromycin and AA.
Only one of the crosses (40E6 X wild-type strain) showed the predicted complete co-
segregation of the parental phenotypes. Cross progeny of the other 7 mutants appear to
have additional recombinant phenotypes (Table 7). These data suggest that the other
seven strains carry a random mutation(s) or randomly inserted extra HygR cassette(s) (or
portion(s) thereof) in their genomes that result in the AOX deficiency. The latter may
have arisen in these strains during construction of the KO mutant library.
3.2.3.3 Southern blot analysis of the eight KO mutant strains analyzed
To address the possibility that additional HygR cassettes were incorporated into the
genome of the mutants during the integration of the cassette for the KO procedure
(COLOT et al. 2006), Southern blot analysis was carried out with a DIG labelled DNA
probe against the HygR gene cassette (Fig. 29). Using the known gene sequence and
selected restriction enzymes, predicted fragment sizes for the HygR cassette in each
mutant were determined (Table 8). As seen in the Southern blots (Fig. 30 and Fig. 31), all
eight AOX deficient mutants appear to have one band corresponding to the predicted size
fragment. Though other bands are present, they are non-specific as they are also present
in the negative control groups. Thus, it appears that no obvious additional insertion of
HygR cassettes or portions of the cassette occurred during generation of the KO’s.

151
Figure 28. Predicted cosegregation of hygromycin resistance (HygR) and AA
sensitivity (AAS). The class 1 KO mutants are predicted to have a gene affecting AOX
production replaced by a hygromycin resistance cassette (leading to the HygR and AA
S
phenotype). Mutant strains were crossed with a wild-type strain (NCN251A or 76-26a
his-3), that carries no HygR cassette and produces normal levels of AOX, and therefore is
HygS and AA
R. Cross progeny are expected to have a 1:1 ratio of parental phenotype (i.e.
AAS Hyg
R or AA
R Hyg
S).

152
Table 7. Cross progeny analysis.
*R, resistant; S, sensitive
Strain Phenotypes of ascospores and number of ascospores with each
phenotype (% of those examined)
Total
ascospores
examined Expected parental phenotype Unexpected recombinant
phenotype
HygRAA
S*
(% of analyzed
progeny)
HygSAA
R
(% of analyzed
progeny)
HygRAA
R
(% of analyzed
progeny)
HygSAA
S
(% of analyzed
progeny)
23H2 12 (19%) 15 (23%) 14 (22%) 23 (36%) 64
40 E6 21 (36%) 38 (64%) 0 (0%) 0 (0%) 59
41G7 9 (9%) 44 (44%) 46 (45%) 2 (2%) 101
47H10 6 (9%) 52 (58%) 30 (33%) 0 (0%) 90
52D8 8 (12%) 53 (81%) 3 (5%) 1 (2%) 65
83H3 5 (6%) 55 (60%) 31 (34%) 0 (0%) 91
88H8 12 (24%) 12 (24%) 12 (24%) 14 (28%) 50
113G8 17 (21%) 54 (65%) 11 (13%) 1 (1%) 83

153
Figure 29. Schematic representation of Southern blot strategy. A) Creation of the
HygR cassette probe. The probe used for Southern blot analysis was prepared by isolation
of a HygR containing restriction fragment from a plasmid (p-aod-2 Hyg) followed by
DIG labelling of this fragment. B) Genomic DNA from each mutant and a wild-type
control (NCN251) was digested with an appropriate restriction enzyme selected for each
154
gene to produce a known size restriction fragment based on the genome sequence.
Digested genomic DNA was electrophoresed on agarose gels, and transferred to
nitrocellulose membrane. The membrane was incubated with the labelled HygR cassette
probe followed by washing and detection of bound probe using DIG specific antibody
and a chemiluminescence based assay.

155
Table 8. Restriction enzymes used for Southern blots.
Strains Restriction enzyme used for
digesting gDNA
Predicted hygromycin
containing fragment size (Kb)
23H2 BclI 3.9
40 E6 StuI 5.7
41G7 KpnI 5.7
47H10 BspHI 5.5
52D8 XmnI 4.7
83H3 PvuII 5.3
88H8 NruI 6.9
113G8 BstXI 5.0
96H9* ApaI 5.7
* Control KO strain of NCU07953, the aod-1 gene.
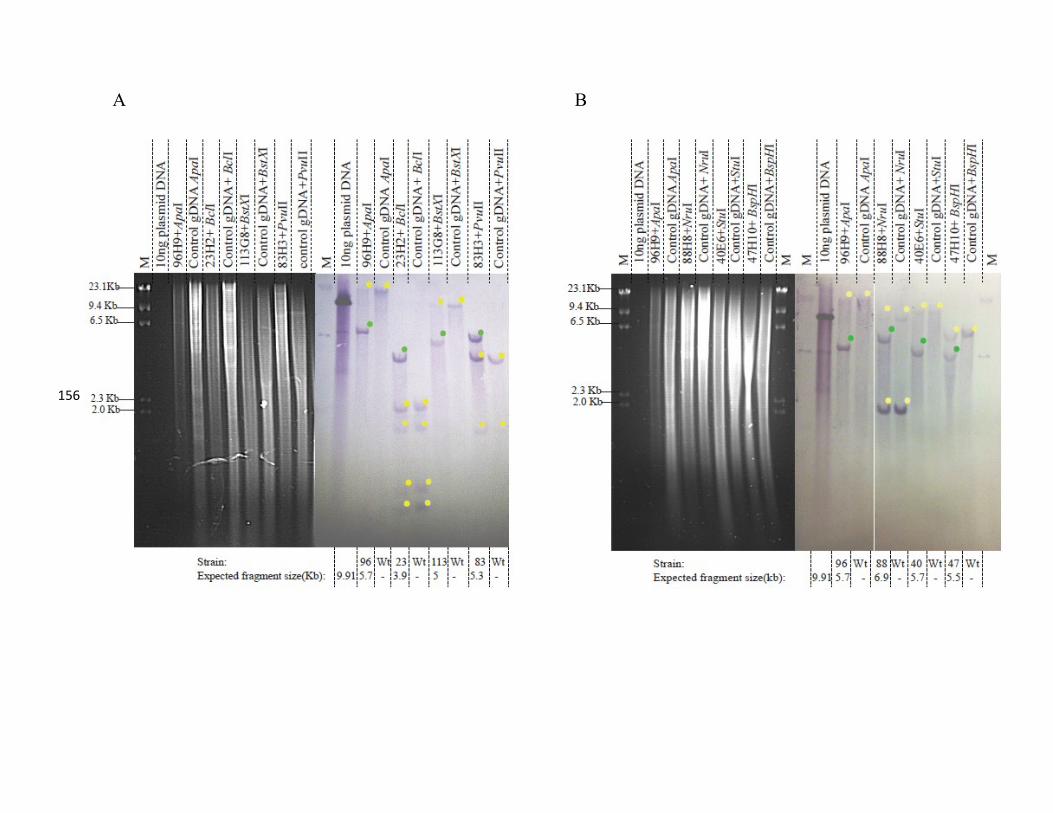
156
A B
156

157
Figure 30. Southern blot analysis for six class 1 KO strains. Southern blots were
analyzed for the presence of bands hybridizing to a HygR cassette probe. In panels A and
B, photos of agarose gels with digested genomic DNA are on the left with the
corresponding Southern blots on the right for KO strains 23H2, 40E6, 47H10, 83H3,
88H8 and 113G8. Green dots indicate predicted fragments. The size of predicted HygR
containing fragments is shown below the figure. The aod-1 KO mutant 96H9 serves as a
positive control whereas wild-type control (NCN251) genomic DNA serves as a negative
control. Yellow dots indicate bands present at the same position in both the negative
control and mutant lanes. M, marker fragments from HindIII digestion of λ phage (23.1
Kb, 9.4 Kb, 6.5 Kb, 2.3 Kb, 2.0 Kb); 23, 23H2; 40, 40E6; 47, 47H10; 83, 83H3; 88,
88H8, 96, 96H9, 113, 113G8; WT, wild-type (NCN251) control; gDNA, genomic DNA.

158
Figure 31. Southern blot analysis for two class 1 KO strains. Southern blots were
analyzed as described in Fig. 30. Photos of agarose gels with digested genomic DNA are
on the left with the corresponding Southern blots on the right for KO strains 41G7 and
52D8. Green dots indicate predicted fragments. The size of predicted HygR containing
fragments is shown below the figure. The aod-1 KO mutant 96H9 serves as a positive
control whereas wild-type control (NCN251) genomic DNA serves as a negative control.
Yellow dots indicate bands present at the same position in both the negative control and
mutant lanes. M, marker fragments from HindIII digestion of λ phage (23.1 Kb, 9.4 Kb,

159
6.5 Kb, 2.3 Kb, 2.0 Kb); 41, 41G7; 52, 52D8; 96, 96H9; WT, wild-type (NCN251)
control; gDNA, genomic DNA.

160
3.2.3.4 Mutant aod-1 gene in strains 23H2 (KO-NcMFS) and 88H8 (KO-NcHbrB)
The findings described above showed that the correct gene was knocked out in each
strain and that no detectable integration of the HygR cassette had occurred elsewhere in
the genome of the mutants. Thus, the most obvious possibility remaining to explain lack
of AOX production in these strains (except 40E6, which stands as a correct mutant, based
on the genetic results) was the existence of random mutation(s) in other gene(s) that
affect AOX production. At this point the best described genes known to be necessary for
AOX production in N. crassa are the AOX regulatory genes (aod-2 and aod-5) and the
AOX structural gene (aod-1) (LI et al. 1996; CHAE et al. 2007b; CHAE and NARGANG
2009). To examine the possibility that these genes might be affected in the mutants, the
aod-1, aod-2 and aod-5 genes from mutants 23H2 (KO-NcMFS) and 88H8 (KO-
NcHbrB) were sequenced. In addition, the aod-1 gene from mutants 40E6, 41G7, 47H10,
52D8, 83H3 and 113G8 was sequenced. A representation of each gene, the position of
primers used to generate PCR products and the sequencing primers is shown in Fig. 32.
Sequencing data for strains 40E6, 41G7, 47H10, 52D8, 83H3 and 113G8 showed
that these strains carry a wild-type copy of the aod-1 gene. Sequencing data for mutants
23H3 (KO-NcMFS) and 88H8 (KO-NcHbrB) showed wild-type versions of aod-2 and
aod-5 genes in the mutants. However, the data demonstrate the presence of a cytosine (C)
insertion in the coding region of the aod-1 gene at an identical position in both 23H2
(KO-NcMFS) and 88H8 (KO-NcHbrB) (Fig. 33). This insertion leads to the production
of a frame-shift in the reading frame at codon 237 of the 363 codon aod-1 gene, which
would result in a truncated protein due to the occurrence of a stop codon after 31 codons
following the frame-shift (Fig. 34). Since the AOX antibody used for western blot

161
analysis is specific to 122 amino acids at the C terminal end of the coding sequence, the
truncated protein would not be detected by the antibody used (Fig. 34).

162
Figure 32. Sequencing strategy for the aod-1, aod-2 and aod-5 genes. The gene
sequences of aod-1, aod-2 and aod-5 are depicted with introns as lines and exons as solid
blocks. The positions of the forward (Fwd) and reverse (Rev) PCR amplification primers
(used for amplifying regions to be sequenced) are indicated. The sequencing primers are

163
indicated by half arrows and numbers along the sequence. Green regions represent
5’UTRs whereas red regions represent 3’UTRs. Teal regions represent the coding region
of each gene. The start and stop codons are indicated as ATG and TGA respectively.
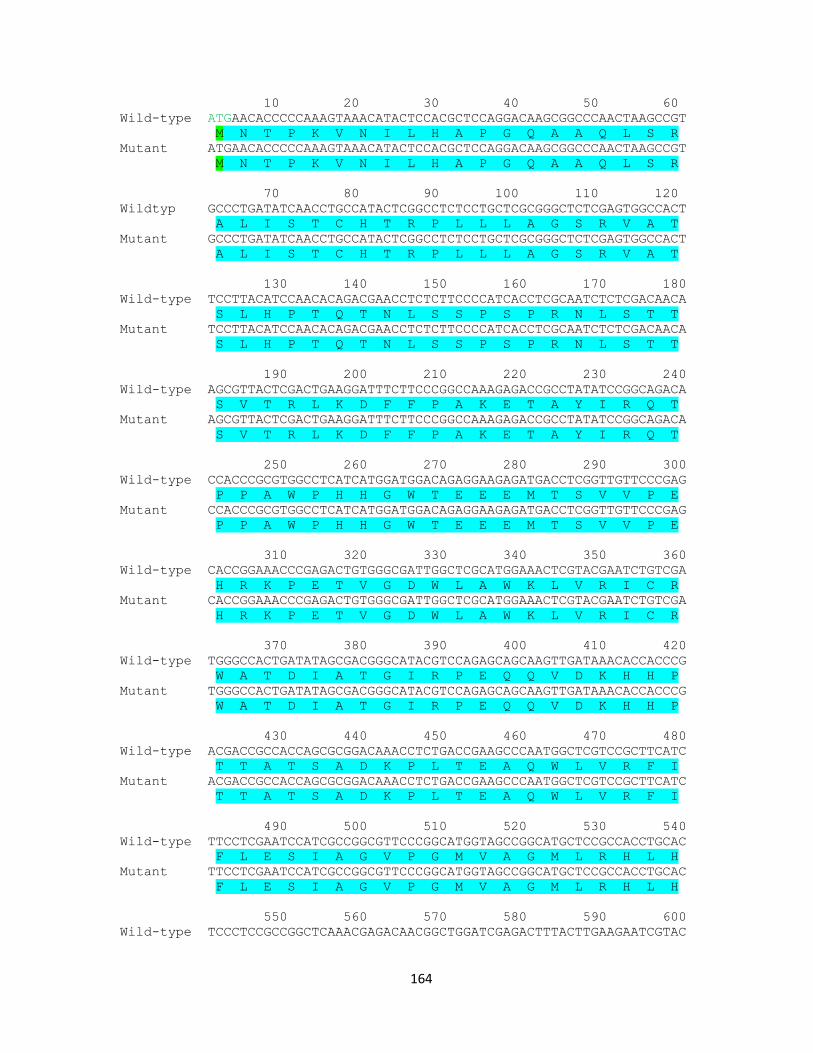
164
10 20 30 40 50 60
Wild-type ATGAACACCCCCAAAGTAAACATACTCCACGCTCCAGGACAAGCGGCCCAACTAAGCCGT
M N T P K V N I L H A P G Q A A Q L S R
Mutant ATGAACACCCCCAAAGTAAACATACTCCACGCTCCAGGACAAGCGGCCCAACTAAGCCGT
M N T P K V N I L H A P G Q A A Q L S R
70 80 90 100 110 120
Wildtyp GCCCTGATATCAACCTGCCATACTCGGCCTCTCCTGCTCGCGGGCTCTCGAGTGGCCACT
A L I S T C H T R P L L L A G S R V A T
Mutant GCCCTGATATCAACCTGCCATACTCGGCCTCTCCTGCTCGCGGGCTCTCGAGTGGCCACT
A L I S T C H T R P L L L A G S R V A T
130 140 150 160 170 180
Wild-type TCCTTACATCCAACACAGACGAACCTCTCTTCCCCATCACCTCGCAATCTCTCGACAACA
S L H P T Q T N L S S P S P R N L S T T
Mutant TCCTTACATCCAACACAGACGAACCTCTCTTCCCCATCACCTCGCAATCTCTCGACAACA
S L H P T Q T N L S S P S P R N L S T T
190 200 210 220 230 240
Wild-type AGCGTTACTCGACTGAAGGATTTCTTCCCGGCCAAAGAGACCGCCTATATCCGGCAGACA
S V T R L K D F F P A K E T A Y I R Q T
Mutant AGCGTTACTCGACTGAAGGATTTCTTCCCGGCCAAAGAGACCGCCTATATCCGGCAGACA
S V T R L K D F F P A K E T A Y I R Q T
250 260 270 280 290 300
Wild-type CCACCCGCGTGGCCTCATCATGGATGGACAGAGGAAGAGATGACCTCGGTTGTTCCCGAG
P P A W P H H G W T E E E M T S V V P E
Mutant CCACCCGCGTGGCCTCATCATGGATGGACAGAGGAAGAGATGACCTCGGTTGTTCCCGAG
P P A W P H H G W T E E E M T S V V P E
310 320 330 340 350 360
Wild-type CACCGGAAACCCGAGACTGTGGGCGATTGGCTCGCATGGAAACTCGTACGAATCTGTCGA
H R K P E T V G D W L A W K L V R I C R
Mutant CACCGGAAACCCGAGACTGTGGGCGATTGGCTCGCATGGAAACTCGTACGAATCTGTCGA
H R K P E T V G D W L A W K L V R I C R
370 380 390 400 410 420
Wild-type TGGGCCACTGATATAGCGACGGGCATACGTCCAGAGCAGCAAGTTGATAAACACCACCCG
W A T D I A T G I R P E Q Q V D K H H P
Mutant TGGGCCACTGATATAGCGACGGGCATACGTCCAGAGCAGCAAGTTGATAAACACCACCCG
W A T D I A T G I R P E Q Q V D K H H P
430 440 450 460 470 480
Wild-type ACGACCGCCACCAGCGCGGACAAACCTCTGACCGAAGCCCAATGGCTCGTCCGCTTCATC
T T A T S A D K P L T E A Q W L V R F I
Mutant ACGACCGCCACCAGCGCGGACAAACCTCTGACCGAAGCCCAATGGCTCGTCCGCTTCATC
T T A T S A D K P L T E A Q W L V R F I
490 500 510 520 530 540
Wild-type TTCCTCGAATCCATCGCCGGCGTTCCCGGCATGGTAGCCGGCATGCTCCGCCACCTGCAC
F L E S I A G V P G M V A G M L R H L H
Mutant TTCCTCGAATCCATCGCCGGCGTTCCCGGCATGGTAGCCGGCATGCTCCGCCACCTGCAC
F L E S I A G V P G M V A G M L R H L H
550 560 570 580 590 600
Wild-type TCCCTCCGCCGGCTCAAACGAGACAACGGCTGGATCGAGACTTTACTTGAAGAATCGTAC

165
S L R R L K R D N G W I E T L L E E S Y
Mutant TCCCTCCGCCGGCTCAAACGAGACAACGGCTGGATCGAGACTTTACTTGAAGAATCGTAC
S L R R L K R D N G W I E T L L E E S Y
610 620 630 640 650 660
Wild-type AACGAGCGCATGCACCTCCTCACCTTTATGAAGATGTGCGAACCCGGCCTCCTCATGAAG
N E R M H L L T F M K M C E P G L L M K
Mutant AACGAGCGCATGCACCTCCTCACCTTTATGAAGATGTGCGAACCCGGCCTCCTCATGAAG
N E R M H L L T F M K M C E P G L L M K
670 680 690 700 710 720
Wild-type ACGCTCATCTTGGGAGCGCAGGGCGTCTTCTTCAACGCCATGTTTCTCAGCTACCTGATC
T L I L G A Q G V F F N A M F L S Y L I
Mutant ACGCTCATCTTGGGAGCGCAGGGCGTCTTCTTCAACGCCATGTTTCTCCAGCTACCTGAT
T L I L G A Q G V F F N A M F L Q L P D
730 740 750 760 770 780
Wild-type TCCCCCAAAATCACCCACCGGTTTGTCGGTTACCTCGAGGAGGAGGCCGTACATACCTAC
S P K I T H R F V G Y L E E E A V H T Y
Mutant CTCCCCCAAAATCACCCACCGGTTTGTCGGTTACCTCGAGGAGGAGGCCGTACATACCTA
L P Q N H P P V C R L P R G G G R T Y L
790 800 810 820 830 840
Wild-type ACGCGGTGCATCAGGGAGATTGAGGAAGGTCACTTGCCAAAGTGGAGCGACGAAAAGTTT
T R C I R E I E E G H L P K W S D E K F
Mutant CACGCGGTGCATCAGGGAGATTGAGGAAGGTCACTTGCCAAAGTGGAGCGACGAAAAGTT
H A V H Q G D * G R S L A K V E R R K V
850 860 870 880 890 900
Wild-type GAGATCCCGGAGATGGCGGTGAGGTATTGGCGCATGCCGGAGGGGAAGCGGACGATGAAG
E I P E M A V R Y W R M P E G K R T M K
Mutant TGAGATCCCGGAGATGGCGGTGAGGTATTGGCGCATGCCGGAGGGGAAGCGGACGATGAA
281 * D P G D G G E V L A H A G G E A D D E
910 920 930 940 950 960
Wild-type GACTTGATCCATTATATCCGCGCGGACGAGGCAGTGCACAGGGGCGTTAATCATACATTG
D L I H Y I R A D E A V H R G V N H T L
Mutant GGACTTGATCCATTATATCCGCGCGGACGAGGCAGTGCACAGGGGCGTTAATCATACATT
G L D P L Y P R G R G S A Q G R * S Y I
970 980 990 1000 1010 1020
Wild-type AGCAATTTGGACCAGAAGGAGGATCCGAATCCGTTTGTGAGCGACTATAAGGAGGGCGAG
S N L D Q K E D P N P F V S D Y K E G E
Mutant GAGCAATTTGGACCAGAAGGAGGATCCGAATCCGTTTGTGAGCGACTATAAGGAGGGCGA
E Q F G P E G G S E S V C E R L * G G R
1030 1040 1050 1060 1070 1080
Wild-type GGCGGGAGGAGACCGGTCAATCCGGCTTTGAAGCCGACGGGATTTGAAAGGGCGGAGGTC
G G R R P V N P A L K P T G F E R A E V
Mutant GGGCGGGAGGAGACCGGTCAATCCGGCTTTGAAGCCGACGGGATTTGAAAGGGCGGAGGT
G R E E T G Q S G F E A D G I * K G G G
1090
Wild-type ATCGGTTGA
I G *
Mutant CATCGGTTGA
H R L
166
Figure 33. Nucleotide and protein sequence of the N. crassa aod-1 gene coding region
in wild-type and mutants 23H2 (KO-NcMFS) and 88H8 (KO-NcHbrB). The protein
coding region of AOX from mutants and a wild-type strain is shown, with the start and
stop codon marked in green and red, respectively. The respective amino acid sequences
are highlighted. The wild-type aod-1 gene encodes a 34.7 kDa protein (363 amino acids,
shown in teal). The insertion of C (marked in magenta) in mutants 23H2 (KO-NcMFS)
and 88H8 (KO-NcHbrB) would result in a 23.3 kDa (268 amino acids) truncated protein.
In the mutants, AOX amino acids are shown in teal up to the C insertion. Following the
frame-shift the amino acids are shown in dark green up to the red premature stop codon.
167
Figure 34. Position of insertion in the aod-1 gene in mutants 23H2 (KO-NcMFS) and 88H8 (KO-NcHbrB). The aod-1 gene from
wild-type (top) and mutants 23H2 and 88H8 (bottom) are represented along with features of the gene and coding sequence. The
cytosine insertion in the aod-1 gene of mutants 23H2 and 88H8 occurs 870 nucleotides (870 bp including intronic sequence and 708
bp excluding introns) after the translation start site. The region of the protein used for antibody production is shown under the wild-
type sequence. Teal boxes, exons; thin black lines, introns; black box, frame-shift altered codons; red, premature stop codon.
ATG TGA
Intron Intron
C insertion in 23H2 and 88H8
Wild-type
aod-1 coding
sequence
41.3kDa
(34.7kDa without MTS)
Mitochondrial
targeting
sequence
Premature stop codon
Intron Intron
C insertion in 23H2 and 88H8
Altered codons due to frame-shift
23H2 and
88H8 aod-1
coding
sequence
30.6 kDa
(23.3kDa without MTS)
AOX antibody specific to C
terminal 122 amino acids
180 bp
ATG
Mitochondrial
targeting
sequence
167

168
References
CASTAÑEDA-GARCÍA, A., A. RODRÍGUEZ-ROJAS, J. R. GUELFO and J. BLÁZQUEZ, 2009
The Glycerol-3-Phosphate Permease GlpT Is the Only Fosfomycin Transporter in
Pseudomonas aeruginosa. J. Bacteriol. 191: 6968-6974.
CHAE, M. S., C. E. NARGANG, I. A. CLEARY, C. C. LIN, A. T. TODD et al., 2007 Two
zinc-cluster transcription factors control induction of alternative oxidase in
Neurospora crassa. Genetics 177: 1997-2006.
CHAE, M. S., and F. E. NARGANG, 2009 Investigation of regulatory factors required for
alternative oxidase production in Neurospora crassa. Physiol. Plant. 137: 407-418.
CLAYPOOL, S. M., J. M. MCCAFFERY and C. M. KOEHLER, 2006 Mitochondrial
mislocalization and altered assembly of a cluster of Barth syndrome mutant
tafazzins. J. Cell Biol. 174: 379-390.
COLOT, H. V., G. PARK, G. E. TURNER, C. RINGELBERG, C. M. CREW et al., 2006 A high-
throughput gene knockout procedure for Neurospora reveals functions for
multiple transcription factors. Proc. Natl. Acad. Sci. USA 103: 10352-10357.
DESAULNIERS, A. B., 2013 The role of YVH1, a dual specificity phosphatase, in the
production of alternative oxidase in the filamentous fungus Neurospora crassa pp.
in Department of Biological Sciences. University of Alberta, Edmonton, Alberta.
DESCHENEAU, A. T., I. A. CLEARY and F. E. NARGANG, 2005 Genetic evidence for a
regulatory pathway controlling alternative oxidase production in Neurospora
crassa. Genetics 169: 123-135.
FUJIKI, Y., S. FOWLER, H. SHIO, A. L. HUBBARD and P. B. LAZAROW, 1982a Polypeptide
and phospholipid composition of the membrane of rat liver peroxisomes:
comparison with endoplasmic reticulum and mitochondrial membranes. J. Cell
Biol. 93: 103-110.
FUJIKI, Y., A. L. HUBBARD, S. FOWLER and P. B. LAZAROW, 1982b Isolation of
intracellular membranes by means of sodium carbonate treatment: application to
endoplasmic reticulum. J. Cell Biol. 93: 97-102.
GATHERAR, I. M., S. POLLERMAN, N. DUNN-COLEMAN and G. TURNER, 2004
Identification of a novel gene hbrB required for polarised growth in Aspergillus
nidulans. Fungal Genet. Biol. 41: 463-471.
JANSSEN, M. J. F. W., F. VAN VOORST, G. E. J. PLOEGER, P. M. LARSEN, M. R. LARSEN
et al., 2002 Photolabeling Identifies an Interaction between Phosphatidylcholine
and Glycerol-3-phosphate Dehydrogenase (Gut2p) in Yeast Mitochondria.
Biochemistry 41: 5702-5711.
LEMIEUX, M. J., Y. HUANG and D.-N. WANG, 2004 Glycerol-3-phosphate transporter of
Escherichia coli: Structure, function and regulation. Res. Microbiol. 155: 623-
629.

169
LI, Q., R. G. RITZEL, L. L. MCLEAN, L. MCINTOSH, T. KO et al., 1996 Cloning and
analysis of the alternative oxidase gene of Neurospora crassa. Genetics 142: 129-
140.
NARGANG, F. E., K. ADAMES, C. RÜB, S. CHEUNG, N. EASTON et al., 2012 Identification
of Genes Required for Alternative Oxidase Production in the Neurospora crassa
Gene Knockout Library. G3 (Bethesda) 2: 1345-1356.
PAO, S. S., I. T. PAULSEN and M. H. SAIER, 1998 Major Facilitator Superfamily.
Microbiol. Mol. Biol. Rev. 62: 1-34.
POVELONES, M. L., C. TIENGWE, E. GLUENZ, K. GULL, P. T. ENGLUND et al., 2013
Mitochondrial shape and function in trypanosomes requires the outer membrane
protein, TbLOK1. Mol. Microbiol. 87: 713-729.
REDDY, V. S., M. A. SHLYKOV, R. CASTILLO, E. I. SUN and M. H. SAIER, 2012 The
Major Facilitator Superfamily (MFS) Revisited. FEBS J. 279: 2022-2035.
SANTORO, A., A. R. CAPPELLO, M. MADEO, E. MARTELLO, D. IACOPETTA et al., 2011
Interaction of fosfomycin with the Glycerol 3-phosphate Transporter of
Escherichia coli. Biochimica et Biophysica Acta (BBA) - General Subjects 1810:
1323-1329.
SINGHA, U. K., S. SHARMA and M. CHAUDHURI, 2009 Downregulation of Mitochondrial
Porin Inhibits Cell Growth and Alters Respiratory Phenotype in Trypanosoma
brucei. Eukaryot. Cell 8: 1418-1428.
YAN, N., 2013 Structural advances for the major facilitator superfamily (MFS)
transporters. Trends Biochem. Sci. 38: 151-159.

170
Chapter 4: Discussion
The initial goal of this thesis, was to determine the role that thirteen genes play in the
production and/or function of AOX. These genes were originally identified in a screen of
the N. crassa KO library (NARGANG et al. 2012).
4.1 Analysis of possible assembly mutants
Of the thirteen genes, five (KO in mutants 13G11, 28B10, 85H5, 99B8 and 101D3)
were hypothesized to be involved in the assembly of AOX into a functional protein or
insertion of AOX into the MIM. KO mutants of these genes were sensitive to AA but had
wild-type, or near wild-type, levels of AOX following growth in Cm (NARGANG et al.
2012). The predicted functions of the proteins encoded by the five genes are varied. For
some, a possible relationship to AOX function is relatively straightforward. For others,
this is not the case. The mechanism by which AOX associates with the MIM once the
AOX preprotein enters the mitochondria is unknown. Fig. 35 shows some possible
mechanisms by which AOX might assemble into the MIM.
Mutant 13G11 is a KO of protein kinase 10 (prk-10). Prk-10 belongs to the
serine/threonine kinase family and is highly conserved in eukaryotes from yeast to
humans. The human ortholog of prk-10 is AMPK (AMP-activated kinase) (HARDIE et al.
1998; GHILLEBERT et al. 2011). AMPK family proteins have been shown to play a role in
sensing cellular energy levels in order to bring about energy homeostasis in the cell
(HARDIE et al. 1998; HARDIE 2007). The S. cerevisiae homolog of prk-10, SNF1, has
been found to hyperphosphorylate RDS2 (ortholog of the N. crassa AOD2

171
Figure 35. Possible mechanisms for AOX assembly into the MIM. AOX enters the mitochondria via the TOM complex and the TIM23
complex. Upon entering the matrix, it may either spontaneously assemble into the inner leaflet of the MIM, or may require unknown
protein(s) and other factor(s) for assembly. These factors could include proteins involved in the assembly of the diiron center upon transport
of the AOX preprotein into the matrix (possibly, the gene product of the gene KO in strain 85H5) and proteins involved in post-translational
modification of AOX which might be important for protein maturation and assembly (possibly, gene products of gene KO in strain 13G11
and 99B8). Other proteins may also be required for insertion of AOX into the MIM.
171

172
protein) (SOONTORNGUN et al. 2007). This hyperphosphorylation of RDS2 by SNF1 leads
to its activation under glucose repressing conditions. While it might be expected that the
prk-10 protein similarly phosphorylates AOD2 in N. crassa, it is also possible that it is
involved in an unknown mechanism that leads to phosphorylation of AOX or
phosphorylation of a factor that is involved in the assembly of AOX into the MIM. Thus,
loss of the prk-10 protein might lead to loss of AOX activity due to inactive AOX protein
or due to loss of assembly into the MIM.
Mutant 28B10 is a KO of NCU08137. The BROAD website lists it as a hypothetical
protein of unknown function. However, further analysis of this protein using the
MITOPROT II software (CLAROS and VINCENS 1996), predicts presence of a
mitochondrial targeting sequence (with a 0.9907 probability of export to mitochondria).
In addition, BLAST searches suggest sequence similarity to the mitochondrial protein
YMR-31 and alignment of NCU08137 with homologous proteins from several fungal and
animal species showed a relationship with the YMR-31 protein from yeast (HEUBLEIN et
al. 2014). YMR-31 was initially proposed to be a mitochondrial ribosomal protein
(MATSUSHITA et al. 1989), but a recent study on the S. cerevisiae YMR-31 protein
suggests that YMR-31 (now termed KGD4) is a component of the α-ketogutarate
dehydrogenase protein complex and acts as a molecular adaptor to ensure proper
organization of the complex (HEUBLEIN et al. 2014). It is difficult to suggest how a
protein involved in the organization of α-ketogutarate dehydrogenase could be involved
in the assembly or production of AOX.
The Neurospora genome database describes mutant 85H5 as lacking a gene encoding
a thioredoxin protein (NCU09803). This protein has a thioredoxin domain at its N-
173
terminus and a glutaredoxin domain at its C-terminus indicating it belongs to the
monothiol glutaredoxin subfamily (NARGANG et al. 2012). Monothiol glutaredoxins have
been shown to play a role in cellular iron homeostasis maintenance (HERRERO and DE LA
TORRE-RUIZ 2007; HOFFMANN et al. 2011). A study in S. cerevisiae demonstrated that
depletion of monothiol glutaredoxin (grx3/grx4) led to impairment of iron insertion into
proteins (MÜHLENHOFF et al. 2010; HOFFMANN et al. 2011). Since AOX is a diiron
carboxylate protein, it was hypothesized that deletion of NCU09803 in mutant 85H5
might cause errors in AOX diiron center assembly (NARGANG et al. 2012).
In mutant 99B8, the gene previously described as cytochrome-4 (Cyt-4) has been
knocked out. Mutants of this gene were originally identified in N. crassa as being cold-
sensitive (mutants grow slowly at 25°C) and deficient in mitochondrial cytochromes b
and aa3 (GARRIGA et al. 1984; DOBINSON et al. 1989). The cyt-4 mutants grew faster at
37°C (in comparison to at 25 °C, but still slower than the wild-type strain) and had
cytochrome b (but no cytochrome aa3) deficiency at this temperature. The Neurospora
genome database describes the gene product of this gene as a phosphatase with an RNB
domain (the catalytic domain of the RNase II superfamily of exoribonucleases). Proteins
with this domain are known to processively hydrolyze single stranded RNA in the 3’ to
5’ direction and generate 5’ mononucleotides (FRAZAO et al. 2006; BARBAS et al. 2008).
Studies of Cyt-4 mutants in N. crassa have suggested that CYT4 is a mitochondrial
protein that plays a role in mitochondrial RNA splicing, processing and RNA turnover
(DOBINSON et al. 1989; TURCQ et al. 1992). The CYT4 protein has been proposed to be
involved in the regulation of these processes via its role as a phosphatase (TURCQ et al.
1992). Though it is unlikely that processing of mtRNA would directly affect AOX, it is

174
conceivable that the activity of a phosphatase could be required for activation or
assembly of AOX.
Mutant 101D3 is a KO of a gene encoding a superoxide dismutase. The protein has
been shown to be localized to the mitochondrial matrix and to utilize manganese as its
metal cofactor (KEEPING et al. 2011; NARGANG et al. 2012; SARSOUR et al. 2013; XU et
al. 2014). Manganese superoxide dismutases (MnSODs) are involved in detoxification of
superoxide anions (SARSOUR et al. 2013; XU et al. 2014). It is difficult to suggest a direct
effect of this enzyme on AOX assembly or function. However, it is conceivable that
higher levels of ROS might be produced in cultures grown in AA than in Cm (see section
4.2). Absence of the MnSOD might allow accumulation of ROS in AA cultures leading
to cell death. This might account for the phenotype of mutant 85H5 i.e. inability to grow
in the presence of AA, but having near wild-type growth and wild-type levels of AOX
when grown in the presence of Cm.
To determine if any of these five strains had a defect in the assembly of AOX into
the MIM, I began by performing carbonate extractions of mitochondria. A similar
approach was successfully used to study four mutants of the S. cerevisiae tafazzin protein
(CLAYPOOL et al. 2006). The tafazzin protein is an interfacial membrane protein like
AOX, although it is associated with the outer leaflet of the MIM and inner leaflet of the
MOM, facing the IMS. Mutations in the human tafazzin gene (TAZ) cause the Barth
syndrome. The above mentioned four S. cerevisiae mutants had been modelled to
represent the most frequently observed amino acid changes in the tafazzin protein
membrane anchor region of Barth syndrome patients (CLAYPOOL et al. 2006). The wild-
type protein was found in both the pellet and the supernatant fraction following carbonate

175
extractions, with more entering the supernatant fraction as the pH of the extraction was
increased from 10.9 to 12.5 (CLAYPOOL et al. 2006). Upon performing carbonate
extractions on the four Barth syndrome model mutants, it was found that the tafazzin
protein from these mutants was significantly more extractable in comparison to wild-type
tafazzin, suggesting altered membrane association of the tafazzin protein in these
mutants.
AOX has also been used as a control in carbonate extraction studies aimed at
determining mitochondrial localization of other proteins in T. brucei. In one study
trypanosome mitochondria were subjected to carbonate extraction at pH 11.5. The TAO
(trypanosome AOX) was found exclusively associated with the pellet fraction
(POVELONES et al. 2013). In a similar study, carbonate extraction of mitochondria at pH
11.0 showed that the majority of TAO partitioned to the pellet fraction (SINGHA et al.
2009).
To test the possibility of aberrant membrane association of AOX in the five KO
mutant strains of interest, carbonate extractions were performed on isolated mitochondria
from these strains at pH 11.0. However, inconsistent results were obtained. One possible
reason for this could be that there were slight variations in the pH of the sodium
carbonate used in different experiments which might affect the partitioning pattern of
proteins.
An alternative technique that can be used to study membrane association of
mitochondrial proteins is digitonin fractionation of mitochondria. At low concentrations,
digitonin specifically disrupts the MOM, leading to loss of MOM proteins from the pellet
fraction. At higher concentrations of digitionin, MIM proteins begin to be lost from the

176
pellet fraction (SCHMIDT et al. 1984). Various studies have shown that digitonin
fractionation can be successfully used for analyzing the sub-mitochondrial localization of
proteins (NAIR and MCGUIRE 2005; ARNOULT et al. 2009; CSORDÁS et al. 2013). Such
studies use increasing concentrations of digitonin and examination of pellet and
supernatant fractions with antibodies on western blots. In these studies, proteins of
known sub-mitochondrial localizations are used as controls so that the placement of the
protein of interest can be determined.
To my knowledge, no study has used digitonin fractionation to analyze AOX
assembly. However, a study aimed at identifying the role played by the TbLOK1 protein
(POVELONES et al. 2013), thought to be involved in maintenance of mitochondrial
morphology and function in the procyclic form of T. brucei (ENGLUND et al. 2005;
MOTYKA et al. 2006), did use this technique. AOX was examined as a control in this
study and was seen to be released from the MIM at a digitonin concentration of 0.1%
(POVELONES et al. 2013). Thus, I propose that future experiments aimed at studying the
membrane association of AOX in KO mutant strains of N. crassa be performed using
digitonin fractionation of mitochondria.
In light of my results showing that two of the class 1 KO mutants contained a
mutation in the aod-1 gene (section 3.2.3.4), another explanation should be considered as
a possible basis for the phenotype in the five mutants discussed above. That is, missense
mutations affecting the AOX protein could have occurred during construction of the KO
library which could result in lack of AOX activity. This would result in no growth in the
presence of AA. However, wild-type or near wild-type levels of inactive AOX protein
might be observed following growth in Cm. Inactive AOX protein was observed in

177
mitochondria in early studies of aod-1 mutants (BERTRAND et al. 1976; LI et al. 1996).
The activity of AOX in these strains could be tested in respiratory studies. For cultures
grown in the presence of Cm, measurements of oxygen consumption in a respirometer
(TANTON et al. 2003; DESCHENEAU et al. 2005) would show whether or not any
respiratory activity remained after addition of potassium cyanide (KCN) to the culture. If
so, the AOX must be active, if not, the AOX detected on western blots would be deemed
inactive. An alternative, or perhaps complementary approach, would be to sequence the
aod-1 gene from each of the mutants.
4.2 AA and Cm: chemical inducers of AOX
The KO mutant screening that identified the strains used in this study used AA
(inhibitor of complex III of the sETC) for the initial screening and identification of
strains presumed to be AOX deficient because of their inability to grow in the presence of
this inhibitor (NARGANG et al. 2012). Following identification of such strains, Cm was
used to induce AOX and the amount of AOX produced was determined using western
blotting analysis, since further work with the strains could not be done using AA. Both of
these inhibitors lead to AOX induction in wild-type N. crassa, but it is conceivable that
they might use different signaling pathways and effector molecules for AOX induction.
AA inhibits sETC complex III between cytochrome b and c1 (SLATER 1973; HUANG
et al. 2005; HAN et al. 2009). This leads to breakdown of the mitochondrial membrane
potential and production of large amounts of ROS via complexes I and III. Cm inhibits
mitochondrial translation by binding to the large subunit of the mitochondrial ribosomes
and inhibiting peptidyl transferase (COUTSOGEORGOPOULOS 1966; BALBI 2004). Since
the mtDNA encodes subunits of the sETC complexes I, III and IV, inhibition of

178
mitochondrial protein synthesis leads to impairment of the sETC at several positions.
Furthermore, at the concentrations commonly used, AA totally inhibits complex III,
whereas a low amount of mitochondrial translation and thus formation of sETC
complexes occurs in the presence of Cm. To date, the signaling pathway(s), by which
these chemicals bring about their effects has not been defined. But some isolated studies
in various organisms have proposed roles of certain pathways and/or effector molecules
in response to the inhibitory effect of these chemicals.
A common theme in mammalian systems treated with AA or Cm seems to be the
activation of MAPK signaling pathways. For example, one study aimed at testing the
effect of AA and of MAPK inhibitors on calf pulmonary artery endothelial cells found
that use of MAPK inhibitors on AA-treated cells augmented cell death via loss of
mitochondrial membrane potential (MMP), increase in the level of ROS, and depletion of
glutathione (GSH). This suggested that MAPK signaling pathways may be involved in
the response to AA inhibition and may be positively involved in the response against AA
in mammalian cells (HAN et al. 2010). Similarly, LI et al. (2010) found that treatment of
H1299 cells (non-small-cell lung cancer cells) with Cm led to activation of the ERK
(extracellular signal regulated kinase), JNK (c-Jun N-terminal kinase/stress-activated
protein kinase), p38-MAPK and Atk (protein kinase B) MAP kinases. This, in turn, led to
induction of MMP-13 (matrix metalloproteinase 13). Matrix metalloproteinases are zinc
dependent endopeptidase proteins known to cause extracellular matrix (ECM)
degradation of the cell during senescence (CHAKRABORTI et al. 2003).
AA leads to production of large amounts of ROS, and one study found that treatment
of HeLa cells with 100 µM AA for 72 hr leads to apoptosis in 70% of the cells. Loss of

179
MMP, downregulation of Bcl-2 and upregulation of Bax was also observed in these AA-
treated HeLa cells (PARK et al. 2007b). The susceptibility of AA-treated cells to
apoptosis has been proposed to depend on the cell type. For example, As.4.1
juxtaglomerular cells undergo apoptosis in the presence of AA concentrations of as low
as 50 nM (PARK et al. 2007a; PARK et al. 2007b).
On the other hand, treatment of cells with Cm seems to prevent apoptosis as seen in
studies by YUAN and SHI (2008) and LI et al. (2005). In one study, HepG2 cells (human
liver carcinoma cells) treated with 20 and 100 µg/mL Cm for 48 hr showed attenuation of
apoptosis. This was thought to be the result of the cyclin dependent kinase inhibitor p21
(LI et al. 2005). Another study, aimed at understanding Cm induced leukemia
development used mouse primary splenocytes treated with 500 µg/mL Cm for 1 week
(YUAN and SHI 2008). This study found inhibition of activation induced cell death as a
consequence of blocked FasL expression by Cm.
These data suggest that at least in mammalian cells, some differences exist in the
signaling pathways activated by AA and Cm. It is possible that differences in induction
of AOX by AA and Cm may also exist in N. crassa. Such differences could account for
the observation that some strains seem to be severely deficient in AOX activity when
tested on AA but seem to have near wild-type growth (and AOX levels) following
growth in the presence of Cm (as is the case in KO mutant 101D3). Fig. 36 demonstrates
possible differences in the ways AA and Cm could bring about their effects. However, it
should be noted that on one level, the effects of the two inhibitors are very similar. Both
would be expected to cause a reduction in electron transport, H+ pumping, membrane
potential, ATP synthesis, and loss of oxidation of reduced electron carriers.

180
4.3 Class 1 knockout mutant strain analysis
Of the thirteen genes examined in this study, the products of eight genes were
hypothesized to play an essential role in the production and/or regulation of AOX. KO
mutants of these genes had negligible amounts of AOX following growth for 24 and/or
48 hr in the presence of Cm. Such mutants were termed class 1 KO mutants (NARGANG et
al. 2012).
Initially, I started working with two class 1 KO mutants, 23H2 (KO-NcMFS) and
88H8 (KO-NcHbrB). The gene knocked out in 23H2, NCU08887 (NcMFS gene),
encodes a major facilitator superfamily protein, termed NcMFS. The gene knocked out in
88H8 is NCU01542 (NcHbrB gene), which encodes a protein termed NcHbrB, because it
contains an HbrB domain. At the beginning of my study, the wild-type versions of the
genes had been previously cloned into suitable plasmid vectors (K. Adames and A.B.
Desaulniers) to be used in gene rescue experiments. Based on homology studies, I added
additional sequence to the clone of the NCU01542 gene. Several attempts to rescue the
AA sensitivity of mutants 23H2 (KO-NcMFS) and 88H8 (KO-NcHbrB) were made using
the cloned genes, but no rescue of either mutant phenotype was ever observed.
Furthermore, analysis of preliminary RNA-seq data (DESAULNIERS 2013) for NCU08887
shows virtually no transcript from this gene following growth in the presence or absence
of Cm.
Even though the class 1 strains had previously been tested for carrying the correct
KO by PCR analysis (K. Adames, F. E. Nargang, unpublished data), the inability to
rescue mutant phenotype in 23H2 (KO-NcMFS) and 88H8 (KO-NcHbrB) led us to
suspect that the strains being used as my stocks might not carry the specific KO assigned

181
Figure 36. Possible mechanism of action of AA and Cm in AOX induction. A) AA
inhibits sETC complex III activity between cytochrome b and c1. This leads to blockage
of electron flow along the sETC, and eventual inhibition of complex I, leading to
182
breakdown of the mitochondrial membrane potential. These effects may lead to
activation or production of unknown effector molecule(s) (shown in red) that is
transported out of the mitochondria and into the cytoplasm where it may initiate an AA
specific signaling cascade(s). Alternatively, they may be transported to the nucleus where
they alter the transcription levels of target genes. B) Cm binds to the large subunit of the
mitochondrial ribosome which leads to a severe (but not complete) inhibition of
mitochondrial translation. This causes deficiencies (represented as exclamation marks in
blue boxes) of mitochondrially encoded subunits of complex I, III, IV and ATP synthase
and eventual breakdown of the mitochondrial membrane potential. This may lead to
activation or production of unknown effector molecule(s) (shown in blue) that is
transported out of the mitochondria to achieve their effects as described for A.

183
to them. Thus, experiments to verify the integrity of mutants 23H2, 88H8 and six other
class 1 KO mutant strains (40E6, 41G7, 47H10, 52D8, 83H3, 113G8) were carried out.
In the end, my investigation included PCR amplification analysis for the correct KO
(section 3.2.3.1), Southern blot analysis (section 3.2.3.3) and crossing the KO mutants
with wild-type strains (section 3.2.3.2). These experiments suggested that the presence of
additional secondary random mutation(s), in the genome of seven of the eight KO mutant
strains tested, was responsible for the AOX deficiency observed in these strains.
However, it should be noted that in case of mutant 52D8, only four out of the sixty five
cross progeny analyzed had recombinant phenotypes. Thus, it could be possible that these
cross progeny were mis-scored and that the gene KO in 52D8 may indeed play a role in
AOX production. Another additional class 1 mutant, 100B5 (not analyzed as part of this
study), was previously characterized (DESAULNIERS 2013) and the AOX deficiency was
found to be due to the knocked out gene.
Once the genetic data had shown the presence of additional mutations in the strains,
it seemed reasonable that these might have occurred in known AOX regulatory genes
(aod-2 and aod-5) or the AOX structural gene (aod-1). Similarly, mutations in one of the
genes knocked out in the two class 1 KO mutants (40E6 and 100B5) found to be correct
from the KO screen and subsequent analysis, might also account for the phenotypes.
Finally, it was also conceivable that secondary mutations could be present in as yet
uncharacterized AOX regulatory genes. To begin an investigation of these possibilities,
the aod-1, aod-2 and aod-5 genes from mutants 23H2 (KO-NcMFS) and 88H8 (KO-
NcHbrB) were sequenced. aod-1 was also sequenced from mutants 40E6, 41G7, 47H10,
52D8, 83H3 and 113G8. Sequencing of aod-1 from strains 23H2 (KO-NcMFS) and

184
88H8 (KO-NcHbrB) revealed the presence of an identical single nucleotide insertion
(insertion of a C, 708 bp (excluding introns) after the translation start site) in the coding
sequence of the gene in both mutants. The mutation resulted in a frame-shift following
the insertion leading to production of a truncated protein as the result of a premature stop
codon (see Fig. 33 and 34, section 3.2.3.4). The frame-shift and premature stop codon
affect fifteen universally conserved AOX residues (MOORE et al. 2013), leading to loss of
eight and changes in seven of these amino acid residues. These residues are known to
play an important role in several AOX functions including dimer formation, membrane
binding, and coordinating the diiron center (MOORE et al. 2013). Since our AOX
antibody would not detect the truncated protein, it is not known if the protein fragment is
present or degraded, or if degradation of the aod-1 mRNA occurs prior to translation due
to nonsense mediated decay (CONTI and IZAURRALDE 2005; SCHWEINGRUBER et al.
2013).
Sequencing results for aod-2 and aod-5 from mutants 23H2 (KO-NcMFS) and 88H8
(KO-NcHbrB) indicated the presence of wild-type sequences for these genes. Sequencing
data for the aod-1gene from mutants 40E6, 41G7, 47H10, 52D8, 83H3 and 113G8
indicated the presence of the wild-type sequence of this gene in these mutant strains.
Thus, these strains seem likely to carry secondary mutations in different genes as
discussed above.
It is not entirely clear how two strains, not present on the same 96 well plate and
carrying KOs of genes not linked to each other (NCU08887 (NcMFS), knocked out in
23H2, present on chromosome 5; NCU01542 (NcHbrB), knocked out in 88H8, present
on chromosome 2) could have the same mutation at the same position in the aod-1 gene.
185
The knockout mutant library was created by transforming conidia from ∆mus51 or
∆mus52 strains with HygR containing knockout cassettes specific to each N. crassa gene
(COLOT et al. 2006). The mus51 and mus52 genes encode proteins that play a role in non-
homologous end joining. Elimination of their function prevents integration of
transformed DNA at heterologous sites and increases the frequency of transformants with
integration of exogenous DNA at homologous sites to near 100% (NINOMIYA et al.
2004). The initial transformants were crossed with a wild-type strain to generate
homokaryons containing a wild-type copy of the mus51 and mus52 genes and a
disruption of the gene of interest (COLOT et al. 2006). It is possible that a proportion of
the conidia used for transformations during creation of the KO mutant library carried the
aod-1 mutation which was inherited by mutants 23H2 (KO-NcMFS) and 88H8 (KO-
NcHbrB). Alternatively, conidia harboring this mutation may have contaminated the
wild-type stock during the process of crossing to generate homokaryons. However, it is
still not clear how this would result in the same mutation in both these mutants, but not
others.
To examine the possibility that the lab bench stocks for mutant 23H2 (KO-NcMFS)
and 88H8 (KO-NcHbrB) accumulated spontaneous mutations over several generations of
subculturing, conidia from the freezer stock taken directly from the KO mutant library
were acquired for these two strains. The aod-1 gene was resequenced from these fresh
stocks. These sequencing data confirmed the presence of the same mutation in both
strains, effectively ruling out the possibility that the mutation was generated during
subculturing in our lab. It is worth noting that the mutation observed in strains 23H2
186
(KO-NcMFS) and 88H8 (KO-NcHbrB) is not the same as any mutation found in any of
the previously characterized aod-1 mutant strains in the Nargang lab (LI et al. 1996).
Based on the work done in this thesis, the only strain examined that seems to be a
true new class 1 KO strain is strain 40E6. Mutant 40E6 has a region encoding two genes
knocked out from its genome due to an annotation error that was not corrected before the
KO library was constructed. According to the Neurospora genome database, these genes
encode a protein involved in ubiquinone biosynthesis (NCU05600) and an aspartyl
aminopeptidase (NCU17088). A BLAST search with NCU17088 revealed that the
protein is homologous to proteins of the glycoside hydrolase 71 family that contain the
GH71 domain. Glycoside hydrolases are involved in hydrolysis of bonds between a
carbohydrate and another compound such as another carbohydrate, a lipid or a protein
(HENRISSAT 1991; CANTAREL et al. 2009; TYLER et al. 2010). When the fission yeast
genome was searched for homologs of NCU17088, BLAST searches showed 30%
identity to Agn2, a glucan-endo-1,3-alpha-glucosidase. Agn2 seems to play a role in
hydrolysis of alpha-1,3-glucan, thereby aiding in endolysis of the ascus wall during
ascospore release in S. pombe (DEKKER et al. 2004; DEKKER et al. 2007; ENCINAR DEL
DEDO et al. 2009). Thus, it seems unlikely that loss of this gene affects production of
AOX.
NCU05600 has been assigned the gene name stk-33 by the Neurospora genome
database. This protein contains an atypical serine threonine kinase domain (PARK et al.
2011; NARGANG et al. 2012). The closest homolog of this protein from S. cerevisiae,
YPL109c (HomoloGene analysis, NCBI, (NARGANG et al. 2012)), has no known
function. The human homolog of the protein ADCK2 (aarF domain containing kinase 2,

187
belonging to the aarF domain containing (ADC) proteins family) has been seen to play a
role in breast cancer cell viability (BROUGH et al. 2011; NARGANG et al. 2012; STEFELY
et al. 2015). Proteins belonging to the ADC family are mostly mitochondrial proteins and
have been shown to play a role in ubiquinone biosynthesis (STEFELY et al. 2015). Both,
NCU05600 and YPL109c seem to be related to Coq8 from S. cerevisiae. Coq8 has been
shown to play a role in regulating the function of Coq3, a ubiquinone biosynthesis
pathway enzyme. It has been proposed that this regulation may be direct, via
phosphorylation of Coq3 by Coq8 (DO et al. 2001; TAUCHE et al. 2008; NARGANG et al.
2012; GONZÁLEZ-MARISCAL et al. 2014). Alternatively, it is possible that another
intermediate protein is involved in the regulation of Coq3 activity (CHI et al. 2007;
TAUCHE et al. 2008). Due to the involvement of ubiquinone in the alternative respiration
pathway, it has been previously proposed that of the two genes knocked out in 40E6,
NCU05600 is more likely to be involved in AOX production and/or regulation
(NARGANG et al. 2012).
At the time of the completion of this thesis, genes known to play a role in the
production and regulation of AOX include aod-1, aod-2, aod-5, NCU05600 and/or
NCU17088 (genes knocked out in mutant 40E6) and YVH1 (knocked out in 100B5,
encodes a dual specificity phosphatase). It is interesting to note that there is a temporal
pattern of AOX appearance in mutants 41G7 and 52D8 following 24 and 48 hr of growth
in the presence of Cm that is similar to that of 40E6 (a verified class 1 KO mutant). AOX
is reduced at 24 hr and absent at 48 hr. Thus, it is conceivable that 41G7 and 52D8 carry
random mutations in the region knocked out in 40E6. This region should be sequenced

188
from the two strains. If this shows no mutations, then the aod-2 and aod-5 genes should
be examined.
Strains 47H10, 83H3 and 113G8 lack AOX completely at both times. Since I have
shown that the aod-1 gene is not affected in these strains, future work should be aimed at
sequencing the promoter and coding regions of the aod-2 and aod-5 genes from these
mutants. This approach would reveal whether the secondary mutation present in these
strains has disrupted one of these two known AOX regulatory genes. It would also be
interesting to cross class 2 mutants identified in the KO library screen to determine if the
defects observed in any of these mutants are due to the specific gene KO, or due to
secondary mutations.

189
References
ARNOULT, D., F. SOARES, I. TATTOLI, C. CASTANIER, D. J. PHILPOTT et al., 2009 An N-
terminal addressing sequence targets NLRX1 to the mitochondrial matrix. J. Cell
Sci. 122: 3161-3168.
BALBI, H. J., 2004 Chloramphenicol: A Review. Pediatr Rev 25: 284-288.
BARBAS, A., R. G. MATOS, M. AMBLAR, E. LÓPEZ-VIÑAS, P. GOMEZ-PUERTAS et al.,
2008 New Insights into the Mechanism of RNA Degradation by Ribonuclease II:
Identification of the residue responsible for setting the RNase II end product. J.
Biol. Chem. 283: 13070-13076.
BERTRAND, H., N. A. SZAKACS, F. E. NARGANG, C. A. ZAGOZESKI, R. A. COLLINS et al.,
1976 The function of mitochondrial genes in Neurospora crassa. Can J Genet
Cytol 18: 397-409.
BROUGH, R., J. R. FRANKUM, D. SIMS, A. MACKAY, A. M. MENDES-PEREIRA et al., 2011
Functional Viability Profiles of Breast Cancer. Cancer Discov. 1: 260-273.
CANTAREL, B. L., P. M. COUTINHO, C. RANCUREL, T. BERNARD, V. LOMBARD et al.,
2009 The Carbohydrate-Active EnZymes database (CAZy): an expert resource for
Glycogenomics. Nucleic Acids Res. 37: D233-D238.
CHAKRABORTI, S., M. MANDAL, S. DAS, A. MANDAL and T. CHAKRABORTI, 2003
Regulation of matrix metalloproteinases: An overview. Mol. Cell. Biochem. 253:
269-285.
CHI, A., C. HUTTENHOWER, L. Y. GEER, J. J. COON, J. E. P. SYKA et al., 2007 Analysis of
phosphorylation sites on proteins from Saccharomyces cerevisiae by electron
transfer dissociation (ETD) mass spectrometry. Proc. Natl. Acad. Sci. USA 104:
2193-2198.
CLAROS, M. G., and P. VINCENS, 1996 Computational Method to Predict Mitochondrially
Imported Proteins and their Targeting Sequences. Eur. J. Biochem. 241: 779-786.
CLAYPOOL, S. M., J. M. MCCAFFERY and C. M. KOEHLER, 2006 Mitochondrial
mislocalization and altered assembly of a cluster of Barth syndrome mutant
tafazzins. J. Cell Biol. 174: 379-390.
COLOT, H. V., G. PARK, G. E. TURNER, C. RINGELBERG, C. M. CREW et al., 2006 A high-
throughput gene knockout procedure for Neurospora reveals functions for
multiple transcription factors. Proc. Natl. Acad. Sci. USA 103: 10352-10357.
CONTI, E., and E. IZAURRALDE, 2005 Nonsense-mediated mRNA decay: molecular
insights and mechanistic variations across species. Curr. Opin. Cell Biol. 17: 316-
325.
COUTSOGEORGOPOULOS, C., 1966 On the mechanism of action of chloramphenicol in
protein synthesis. Biochim. Biophys. Acta, Nucleic Acids Protein Synth. 129:
214-217.
CSORDÁS, G., T. GOLENÁR, ERIN L. SEIFERT, KIMBERLI J. KAMER, Y. SANCAK et al.,
2013 MICU1 Controls Both the Threshold and Cooperative Activation of the
Mitochondrial Ca2+ Uniporter. Cell Metab. 17: 976-987.
DEKKER, N., D. SPEIJER, C. H. GRÜN, M. VAN DEN BERG, A. DE HAAN et al., 2004 Role
of the α-Glucanase Agn1p in Fission-Yeast Cell Separation. Mol. Biol. Cell. 15:
3903-3914.
190
DEKKER, N., J. VAN RIJSSEL, B. DISTEL and F. HOCHSTENBACH, 2007 Role of the α-
glucanase Agn2p in ascus-wall endolysis following sporulation in fission yeast.
Yeast 24: 279-288.
DESAULNIERS, A. B., 2013 The role of YVH1, a dual specificity phosphatase, in the
production of alternative oxidase in the filamentous fungus Neurospora crassa pp.
in Department of Biological Sciences. University of Alberta, Edmonton, Alberta.
DESCHENEAU, A. T., I. A. CLEARY and F. E. NARGANG, 2005 Genetic evidence for a
regulatory pathway controlling alternative oxidase production in Neurospora
crassa. Genetics 169: 123-135.
DO, T. Q., A. Y. HSU, T. JONASSEN, P. T. LEE and C. F. CLARKE, 2001 A Defect in
Coenzyme Q Biosynthesis Is Responsible for the Respiratory Deficiency in
Saccharomyces cerevisiae abc1Mutants. J. Biol. Chem. 276: 18161-18168.
DOBINSON, K. F., M. HENDERSON, R. L. KELLEY, R. A. COLLINS and A. M. LAMBOWITZ,
1989 Mutations in Nuclear Gene Cyt-4 of Neurospora Crassa Result in
Pleiotropic Defects in Processing and Splicing of Mitochondrial Rnas. Genetics
123: 97-108.
ENCINAR DEL DEDO, J., E. DUEÑAS, Y. ARNÁIZ, F. DEL REY and C. R. VÁZQUEZ DE
ALDANA, 2009 β-Glucanase Eng2 Is Required for Ascus Wall Endolysis after
Sporulation in the Fission Yeast Schizosaccharomyces pombe. Eukaryot. Cell 8:
1278-1286.
ENGLUND, P. T., E. E. AGBO, M. E. LINDSAY, B. LIU, Y. LIU et al., 2005 RNAi libraries
and kinetoplast DNA. Biochem. Soc. Trans. 33: 1409-1412.
FRAZAO, C., C. E. MCVEY, M. AMBLAR, A. BARBAS, C. VONRHEIN et al., 2006
Unravelling the dynamics of RNA degradation by ribonuclease II and its RNA-
bound complex. Nature 443: 110-114.
GARRIGA, G., H. BERTRAND and A. M. LAMBOWITZ, 1984 RNA splicing in neurospora
mitochondria: Nuclear mutants defective in both splicing and 3′ end synthesis of
the large rRNA. Cell 36: 623-634.
GHILLEBERT, R., E. SWINNEN, J. WEN, L. VANDESTEENE, M. RAMON et al., 2011 The
AMPK/SNF1/SnRK1 fuel gauge and energy regulator: structure, function and
regulation. FEBS J. 278: 3978-3990.
GONZÁLEZ-MARISCAL, I., E. GARCÍA-TESTÓN, S. PADILLA, A. MARTÍN-MONTALVO, T.
POMARES VICIANA et al., 2014 The Regulation of Coenzyme Q Biosynthesis in
Eukaryotic Cells: All That Yeast Can Tell Us. Mol Syndromol. 5: 107-118.
HAN, Y. H., H. J. MOON, B. R. YOU, S. Z. KIM, S. H. KIM et al., 2009 p38 Inhibitor
Intensified Cell Death in Antimycin A-treated As4.1 Juxtaglomerular Cells via
the Enhancement of GSH Depletion. Anticancer Res. 29: 4423-4431.
HAN, Y. H., B. R. YOU, H. J. MOON, S. Z. KIM, S. H. KIM et al., 2010 The effects of
MAPK inhibitors on antimycin A-treated calf pulmonary arterial endothelial cells
in relation to cell death, reactive oxygen species and glutathione. Mol Med Rep.
3: 161-166.
HARDIE, D. G., 2007 AMP-activated/SNF1 protein kinases: conserved guardians of
cellular energy. Nat. Rev. Mol. Cell Biol. 8: 774-785.
HARDIE, D. G., D. CARLING and M. CARLSON, 1998 THE AMP-ACTIVATED/SNF1
PROTEIN KINASE SUBFAMILY: Metabolic Sensors of the Eukaryotic Cell?
Annu. Rev. Biochem. 67: 821-855.
191
HENRISSAT, B., 1991 A classification of glycosyl hydrolases based on amino acid
sequence similarities. Biochem. J. 280: 309-316.
HERRERO, E., and M. A. DE LA TORRE-RUIZ, 2007 Monothiol glutaredoxins: a common
domain for multiple functions. Cell. Mol. Life Sci. 64: 1518-1530.
HEUBLEIN, M., M. A. BURGUILLOS, F. N. VÖGTLE, P. F. TEIXEIRA, A. IMHOF et al., 2014
The novel component Kgd4 recruits the E3 subunit to the mitochondrial α-
ketoglutarate dehydrogenase. Mol. Biol. Cell. 25: 3342-3349.
HOFFMANN, B., M. A. UZARSKA, C. BERNDT, J. R. GODOY, P. HAUNHORST et al., 2011
The Multidomain Thioredoxin-Monothiol Glutaredoxins Represent a Distinct
Functional Group. Antioxid. Redox Signaling 15: 19-30.
HUANG, L.-S., D. COBESSI, E. Y. TUNG and E. A. BERRY, 2005 Binding of the respiratory
chain inhibitor antimycin to the mitochondrial bc(1) complex: a new crystal
structure reveals an altered intramolecular hydrogen-bonding pattern J. Mol.
Biol. 351: 573-597.
KEEPING, A., D. DEABREU, M. DIBERNARDO and R. A. COLLINS, 2011 Gel-based mass
spectrometric and computational approaches to the mitochondrial proteome of
Neurospora. Fungal Genet. Biol. 48: 526-536.
LI, C.-H., Y.-W. CHENG, P.-L. LIAO, Y.-T. YANG and J.-J. KANG, 2010 Chloramphenicol
Causes Mitochondrial Stress, Decreases ATP Biosynthesis, Induces Matrix
Metalloproteinase-13 Expression, and Solid-Tumor Cell Invasion. Toxicol. Sci.
116: 140-150.
LI, C.-H., S.-L. TZENG, Y.-W. CHENG and J.-J. KANG, 2005 Chloramphenicol-induced
Mitochondrial Stress Increases p21 Expression and Prevents Cell Apoptosis
through a p21-dependent Pathway. J. Biol. Chem. 280: 26193-26199.
LI, Q., R. G. RITZEL, L. L. MCLEAN, L. MCINTOSH, T. KO et al., 1996 Cloning and
analysis of the alternative oxidase gene of Neurospora crassa. Genetics 142: 129-
140.
MATSUSHITA, Y., M. KITAKAWA and K. ISONO, 1989 Cloning and analysis of the nuclear
genes for two mitochondrial ribosomal proteins in yeast. Molec. Gen. Genet. 219:
119-124.
MOORE, A. L., T. SHIBA, L. YOUNG, S. HARADA, K. KITA et al., 2013 Unraveling the
heater: new insights into the structure of the alternative oxidase. Annu. Rev. Plant
Biol. 64: 637-663.
MOTYKA, S. A., M. E. DREW, G. YILDIRIR and P. T. ENGLUND, 2006 Overexpression of a
Cytochrome b5 Reductase-like Protein Causes Kinetoplast DNA Loss in
Trypanosoma brucei. J. Biol. Chem. 281: 18499-18506.
MÜHLENHOFF, U., S. MOLIK, J. R. GODOY, M. A. UZARSKA, N. RICHTER et al., 2010
Cytosolic Monothiol Glutaredoxins Function in Intracellular Iron Sensing and
Trafficking via Their Bound Iron-Sulfur Cluster. Cell Metab. 12: 373-385.
NAIR, J. R., and J. J. MCGUIRE, 2005 Submitochondrial localization of the mitochondrial
isoform of folylpolyglutamate synthetase in CCRF-CEM human T-lymphoblastic
leukemia cells. Biochim. Biophys. Acta - Mol. Cell Res. 1746: 38-44.
NARGANG, F. E., K. ADAMES, C. RÜB, S. CHEUNG, N. EASTON et al., 2012 Identification
of Genes Required for Alternative Oxidase Production in the Neurospora crassa
Gene Knockout Library. G3 (Bethesda) 2: 1345-1356.

192
NINOMIYA, Y., K. SUZUKI, C. ISHII and H. INOUE, 2004 Highly efficient gene
replacements in Neurospora strains deficient for nonhomologous end-joining.
Proc. Natl. Acad. Sci. USA 101: 12248-12253.
PARK, G., J. A. SERVIN, G. E. TURNER, L. ALTAMIRANO, H. V. COLOT et al., 2011 Global
Analysis of Serine-Threonine Protein Kinase Genes in Neurospora crassa.
Eukaryot. Cell 10: 1553-1564.
PARK, W.-H., Y.-W. HAN, S.-W. KIM, S.-H. KIM, K.-W. CHO et al., 2007a Antimycin A
induces apoptosis in As4.1 juxtaglomerular cells. Cancer Lett. 251: 68-77.
PARK, W. H., Y. W. HAN, S. H. KIM and S. Z. KIM, 2007b An ROS generator, antimycin
A, inhibits the growth of HeLa cells via apoptosis. J. Cell. Biochem. 102: 98-109.
POVELONES, M. L., C. TIENGWE, E. GLUENZ, K. GULL, P. T. ENGLUND et al., 2013
Mitochondrial shape and function in trypanosomes requires the outer membrane
protein, TbLOK1. Mol. Microbiol. 87: 713-729.
SARSOUR, E. H., A. L. KALEN and P. C. GOSWAMI, 2013 Manganese Superoxide
Dismutase Regulates a Redox Cycle Within the Cell Cycle. Antioxid. Redox
Signaling 20: 1618-1627.
SCHMIDT, B., E. WACHTER, W. SEBALD and W. NEUPERT, 1984 Processing peptidase of
Neurospora mitochondria. Eur. J. Biochem. 144: 581-588.
SCHWEINGRUBER, C., S. C. RUFENER, D. ZÜND, A. YAMASHITA and O. MÜHLEMANN,
2013 Nonsense-mediated mRNA decay — Mechanisms of substrate mRNA
recognition and degradation in mammalian cells. Biochim. Biophys. Acta - Gene
Regulatory Mechanisms 1829: 612-623.
SINGHA, U. K., S. SHARMA and M. CHAUDHURI, 2009 Downregulation of Mitochondrial
Porin Inhibits Cell Growth and Alters Respiratory Phenotype in Trypanosoma
brucei. Eukaryot. Cell 8: 1418-1428.
SLATER, E. C., 1973 The mechanism of action of the respiratory inhibitor, antimycin.
Biochim. Biophys. Acta - Bioenergetics 301: 129-154.
SOONTORNGUN, N., M. LAROCHELLE, S. DROUIN, F. ROBERT and B. TURCOTTE, 2007
Regulation of Gluconeogenesis in Saccharomyces cerevisiae Is Mediated by
Activator and Repressor Functions of Rds2. Mol. Cell. Biol. 27: 7895-7905.
STEFELY, JONATHAN A., ANDREW G. REIDENBACH, A. ULBRICH, K. ORUGANTY,
BRENDAN J. FLOYD et al., 2015 Mitochondrial ADCK3 Employs an Atypical
Protein Kinase-like Fold to Enable Coenzyme Q Biosynthesis. Mol. Cell 57: 83-
94.
TANTON, L. L., C. E. NARGANG, K. E. KESSLER, Q. LI and F. E. NARGANG, 2003
Alternative oxidase expression in Neurospora crassa. Fungal Genet. Biol. 39:
176-190.
TAUCHE, A., U. KRAUSE-BUCHHOLZ and G. RÖDEL, 2008 Ubiquinone biosynthesis in
Saccharomyces cerevisiae: the molecular organization of O-methylase Coq3p
depends on Abc1p/Coq8p. FEMS Yeast Res. 8: 1263-1275.
TURCQ, B., K. F. DOBINSON, N. SERIZAWA and A. M. LAMBOWITZ, 1992 A protein
required for RNA processing and splicing in Neurospora mitochondria is related
to gene products involved in cell cycle protein phosphatase functions. Proc. Natl.
Acad. Sci. USA 89: 1676-1680.
193
TYLER, L., J. BRAGG, J. WU, X. YANG, G. TUSKAN et al., 2010 Annotation and
comparative analysis of the glycoside hydrolase genes in Brachypodium
distachyon. BMC Genomics 11: 1-21.
XU, Y., S. MIRIYALA, F. FANG, V. BAKTHAVATCHALU, T. NOEL et al., 2014 Manganese
superoxide dismutase deficiency triggers mitochondrial uncoupling and the
Warburg effect. Oncogene.
YUAN, Z.-R., and Y. SHI, 2008 Chloramphenicol Induces Abnormal Differentiation and
Inhibits Apoptosis in Activated T Cells. Cancer Res. 68: 4875-4881.