by: navaid ali khan and priya sharma effect of women
TRANSCRIPT

By: Navaid Ali Khan and Priya Sharma
Effect of Women autonomy on Maternal Care among Muslim: a cross countries
comparative study in India, Bangladesh and Indonesia
Introduction:
Autonomy is ideally define as self-sufficient or capability of a women in decision making. The
dimensions of women’s autonomy in terms of outside mobility, access to economic resources and
involvement in household decisions has association with maternal and child health. Women's "status"
refers to both the respect accorded to individuals and the personal power available to them. While
women value prestige, it is the level of personal autonomy that appears to influence demographic
behavior and resulting outcomes. Autonomy has been defined as the capacity to manipulate one's
personal environment through control over resources and information in order to make decisions about
one's own concerns or about close family members (Basu 1992; Dyson and Moore 1983; Miles-Done
and Bisharat 1990). Women's autonomy thus can be conceptualized as their ability to determine events
in their lives, even though men and other women may be opposed to their wishes.
Social and economic status of women uses to judge the status of a country in terms of development.
Women autonomy is a composition of decision making of women within and outside the family,
mobility, freedom from threatening relations with husband, and access to and control over economic
resources. India is second Populated country in the world with 1.27 billion population and containing
approximately 17.5% of the world’s population. Some of the well known reasons for India's rapidly
growing population are poverty, illiteracy, high fertility rate, rapid decline in death rates or mortality
rates and immigration. Currently, there are about 51 births in India in a minute, if current trend of
population growth continue, it is projected to be the world's most populous country by 2025. India has
more than 50% of its population below the age of 25 and more than 65% below the age of 35. It is
expected that, in 2020, the average age of an Indian will be 29 years.
People live in India belongs to different regions speak different languages and they have different
culture but fallow mainly four religions Hindu, Muslim, Sikh, Christian and a small proportion also
share by Buddhist. Muslim is a second majority in India. Women’s belong to Muslim religion consider
as more vulnerable In India. Female autonomy has widely been acknowledged as a major factor that
contributes to better demographic outcomes. Female autonomy is a multi-dimensional entity, which

refers to different aspects of women’s life. We cannot imagine the better future without contribute of
female. The Current sex ratio of India is 940 females for every 1000 males. It continuously decreases
from birth to ages. This indicates towards gender disparity which is exists not only in India, Indonesia
and Bangladesh but all over the world and especially in Asian. Muslim women are poor in autonomy
and social capital; many national and international study and research address the poor autonomy and
social capital which is directly linked with poor health and demographic outcome of women among
Muslim, such as Caldwell state that Islam restricts women’s activities in ways that other religions do
not (Caldwell 1986). Many argue that Muslim societies are predisposed to high fertility, unmet need for
contraception, pron-atalism, and infant and child mortality (e.g. Caldwell 1986; Faour 1989; Kirk 1968;
Nagi1984;Youssef 1978). One hypothesis that has been offered to explain this poor demographic
performance is that Islam promotes restrictions on women’s power and autonomy in way that
compromise women’s ability to limit fertility or secure good health for themselves and their children.
In India and Bangladesh the status of women has been subject to many great changes over the past few
millennia. From equal status with men in ancient times through the low points of the medieval
period, to the promotion of equal rights by many reformers, the history of women in India has been
eventful. Still the status of women is not equal men.
The Meaning of Women's Autonomy:
Autonomy defines as the capacity for a woman to achieve well being and a role in decision-making.
Female autonomy has widely been acknowledged as a major factor that contributes to better health,
demographic and social outcomes and health of children as well. Female autonomy is a multi-
dimensional entity, which refers to different aspects of women’s life.
Autonomy as ‘the capacity to manipulate one’s personal environment and the ability – technical, social
and psychological to obtain information and to use it as the basis for making decisions about one’s
private concerns and those of one’s intimates’.

Need of the study:
Some of the well known reasons for India's rapidly growing population are poverty, illiteracy, high
fertility rate, rapid decline in death rates or mortality rates and immigration from Bangladesh and
Nepal. Development having slower growth rate and our resources are not capable to cope up with rapid
growing population, rapid growing population is a result of decline in mortality and high fertility rate
which was high in older time and also high at this time. Low level of literacy is due to lower level of
education among female, male get the preference at all resources as well as in education also. Female
education and work participation are being considered as the two major proxy variables of women’s
autonomy. Studies conducted in the context of developing countries have documented the relative
significance of these two factors particularly that of female education, in determining better
demographic outcomes such as low fertility, child mortality and better health status etc.
The female disadvantage in less-developed countries like India and Bangladesh and in India also with
regard to health and well-being has been documented abundantly (Santow 1995). The health status of
both women and children, particularly female children, suffers in relation to that of males in areas
where patriarchal kinship and economic systems limit women's autonomy (Caldwell 1986). Gender is a
salient source of social stratification across many societies and the study of the autonomy and power of
women relative to men reveals important insights about women’s wellbeing (Presser 1997).
Constraints on women’s autonomy are also thought to relate to a variety of Demographic and health
outcomes.
Women with closer ties to natal kin are more likely to have greater autonomy in each of these three
areas. Women with greater freedom of movement, excess to economic resources and decision making
in large and small household matters obtained higher levels of antenatal care and are more likely to use
safe delivery care and personal and child health care. The influence of women's autonomy on the use of
health care appears to be as important as other known determinants such as education. Female
education, work participation and excess of economic resources and more importantly decision making
power are being considered as the major proxy variables of women’s autonomy. Particularly female
education and excess to resources are use in determining better demographic outcomes such as low
fertility, child mortality and better health status etc.
Muslim is the second majority in India and spared all over the India. Indonesia and Bangladesh are they
countries where Muslim are in Majority. In India Muslim are most vulnerable people they are at the
lower level in terms of education, social and economically according to Sachar Committee report, so
we can understand the condition of Muslim and imagine the status of women among Muslim. The
report is first of its kind revealing the backwardness of Indian Muslims, according to Sachar Committee
report some of the major concerns are:
The status of Indian Muslims is below the conditions of Scheduled Castes and Scheduled Tribes.
The overall percentage of Muslims in bureaucracy in India is just 2.5% whereas Muslims constitute
above 14% of Indian population.
When compared to the Scheduled Castes and Scheduled Tribes the growth in literacy for Muslims was
lower than for the former. The female urban enrolment in literacy ratio for the SCs/STs In Hindu was
40 percent in 1965 that rose to 83 per cent in 2001. The equivalent rate for Muslims—that was
considerably higher in 1965 (52 per cent)—recorded a figure of 80 per cent, lower than the figure for
the SCs / STs in Hindu.
So, we can understand the social, economic and educational condition of the Muslim community in
India. Women’s belong to Muslim religion consider as more vulnerable In India. Many study based on
women autonomy and empowerment in Asia and India address that Islam is an obstacle in the
development of women. The poor outcome of demography such as high fertility, poor health and
nutritional condition of women and child among the people belong to the Muslim religion and low
status and poor autonomy among Muslim women not only in India and Bangladesh but also in all over
the Asia especially in South-east Asia. And these factors which mention above are strongly associated
with maternal, infant and child health and subsequent maternal mortality, But the infant mortality
(including parental and neonatal) are approximately equal to the people belong to Hindu religion.
Yet the relationship of these broad socio-demographic characteristics to actual behavior patterns and
resulting health outcomes is not consistent across or within cultures. For example, greater selective
discrimination against girls and higher birth order was observed among younger, more highly educated
women in Punjab, India (Das Gupta 1987). Several studies in South Asia have observed variation in the
effects 67% of these factors on direct measures of women's behavior and have concluded that socio-
demographic variables are not reliable indicators of women's position. Rather, investigation~ of the
impact of women's position on demographic and health outcomes should use direct measures reflecting
women's degree of control and autonomy and in their lives. Evidence Show that Muslims in India are
poor in terms of social and demographic indicators compare to the Bangladesh and Indonesia.

In this context this study, is an attempt make the understanding about the factors determining female
autonomy among Muslim In India, Bangladesh and Indonesia and the relative significance of the some
proxy variables of Autonomy which affect the maternal. Also, more important is to understand the
indicators of the well being of women, which are often expected as the outcome of exercising their
autonomy. Hence, the association between female autonomy and selected indicators of their well being
such as health, Child care and survival and education in broad sense better demographic outcome,
incidence of domestic violence and contraceptive acceptance also having need to analyzed.
Objective of the Study:
To examine the state of women autonomy and its determinants among married Muslim women
To examine the effect of women autonomy on maternal care.
Data Source and Methodology:
Present Study uses the data from Demographic Health Survey (DHS) .DHS 2007 for Bangladesh and
Indonesia and for India DHS 2006, which is global standard for systematically monitoring. DHS have
large sample sizes (usually between 5,000 and 30,000 households) and typically are conducted about
every 5 years, to allow comparisons over time. Demographic and Health Surveys (DHS) are nationally-
representative household surveys that provide data for a wide range of monitoring and impact
evaluation indicators in the areas of population, health, and nutrition etc. The 2007 Bangladesh
Demographic and Health Surveys (DHS) is a nationally representative survey of 3,771 men age 15-54
from 10,400 households.
In Indonesia DHS is a nationally representative survey of 40,701 households, 32,895ecer married
women age 15-49 and 8,758 currently married men age 15-54. In India DHs which is popularly known
as National family Health Survey 2005-06 NFHS-3 collected information from a nationally
representative sample of 109,041 households, 124,385 women age 15-49, and 74,369 men age 15-54.
The NFHS-3 sample covers 99 percent of India’s population living in all 29 states. From among all the
women and men interviewed nationwide, 102,946 were tested for HIV. This data provide the
information such as religious and cultural contribution in empowerment and autonomy, health
information and reported health problem., through which this cross-sectional study will provide a 'snap
shot' of the autonomy of women, social capital, condition and use of health care services, provision of
maternal services, and the level of child and maternal health care utilization.

Bi- variate and logistic regression techniques have been used for analyzing the level and differentials of
Autonomy of women and its impact on Maternal care across the selected countries. Where Bi-variate
show the relationship between two variables (dependent and independent) and logistic regression use to
observed the effect of independent variables on dependent variables since data is also providing
information of family planning, maternal care use. Family planning, maternal cares have been
considered as dependent variables.
The Level of women autonomy and its determinants among married Muslim
women across the selected countries
Table 1 shows the level of autonomy, mean value gives the average value of women autonomy or
decision making across the countries and within the different background categories, if women take
decision alone. Women’s in Indonesia are having higher value of autonomy in all background
characteristics fallowed by India and Bangladesh. Table shows as age of women increasing autonomy
of women also increasing till\age group 40-44 and then get decline with elder ages in Indonesia and
Bangladesh but in case of India it get starts decline with 35-39 age group. The variation of autonomy or
decision making power with age of women varies with faster rate in India and in Bangladesh which is
not happening in Indonesia. In Indonesia it is fluctuating from younger to elder ages. By the place of
residence it is always high in urban area in all selected countries, by the education of women it is high
among educated women and low among uneducated women both In India and Bangladesh but in
Indonesia the situation is inverse, it is high among uneducated although very less proportion of women
in Indonesia belongs to non-educated category .Table shows that sex of head of household is very
crucial in building women autonomy if the head of household is male there is low autonomy among
women. If it is females, women are having great autonomy and it is seem more crucial factor in
Bangladesh. Wealth of women is not showing any significant impact on women autonomy in all
selected countries although is varies from poor to higher but with fluctuation and with very small
difference. Occupations of women are showing as important factor for autonomy, women who are
professional, services and skilled and unskilled manual they are rich in autonomy.

Figure 1.1 Mean score of women alone autonomy across the countries
Figure shows the level of autonomy, mean value gives the average value of women autonomy or
decision making across the countries, if women take decision alone. Figure shows that women’s in
Indonesia are having higher value of autonomy fallowed by India and Bangladesh.
Figure 1.2 Percentage distributions of women alone Autonomy across the selected countries:
Figure shows women’s in India and Indonesia are having approximately equal distribution of women
alone autonomy but women in Bangladesh over all are having higher autonomy.
0
10
20
30
40
50
India Bangladesh Indonesia
20.8116.28
44.74
40
42
44
46
48
50
52
54
56
Low High Low High Low High
India Bangladesh Indonesia
50.2 49.8
45.5
54.5
50.8
49.2

Figure 1.3 Mean score of women alone autonomy by age group of women in across selected
countries
Figure shows as age of women increasing autonomy of women also increasing till\age group 40-44 and
then get decline with elder ages in Indonesia and Bangladesh but in case of India it get starts decline
with 35-39 age group. The variation of autonomy or decision making power with age of women varies
with faster rate in India and in Bangladesh which is not happening in Indonesia. In Indonesia it is
continue fluctuating from younger to elder ages.
Figure 1.4 Mean score of women alone autonomy by place of residence in across selected
countries
Figure Shows that the level of autonomy of women alone by the place of residence it is always high in
urban area in all selected countries compare to the rural areas but higher differences observe in
Bangladesh fallowed by India and Indonesia.
0
10
20
30
40
50
60
15-19 20-24 25-29 30-34 35-39 40-44 45-49
India
Bangladesh
Indonesia
0
10
20
30
40
50
India Bangladesh Indonesia
22.63 21.48
45.7
20.1514.89
43.78
Urban
Rural
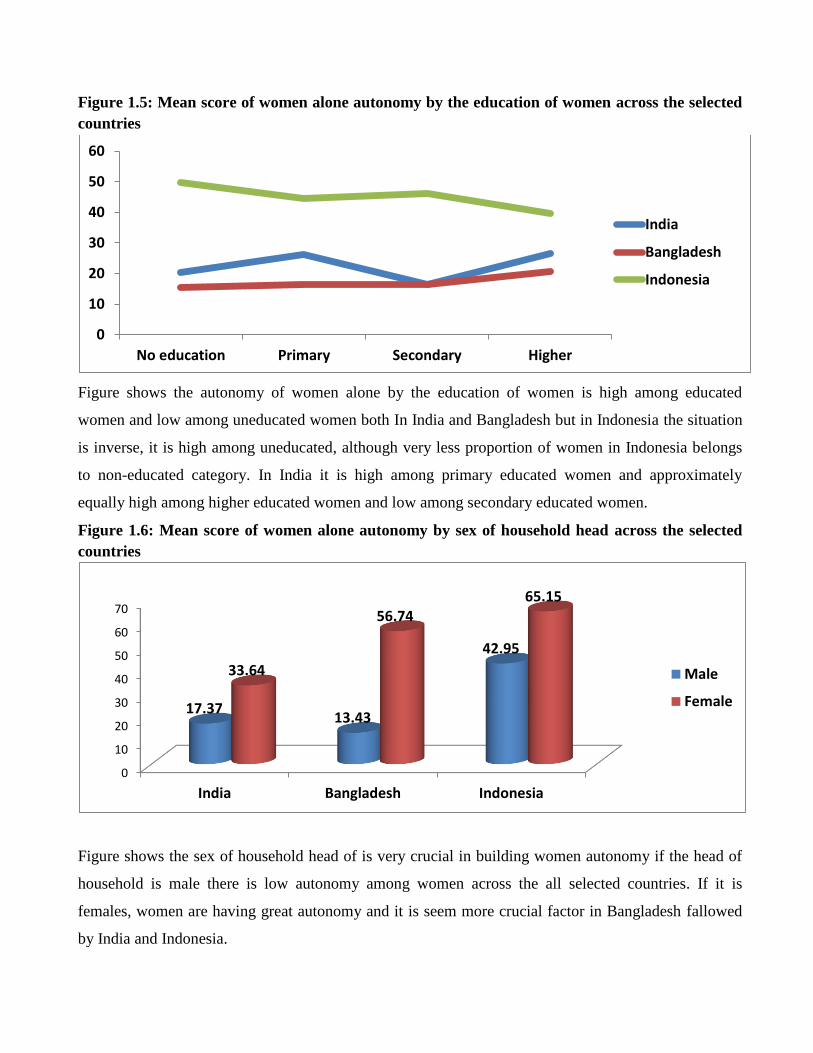
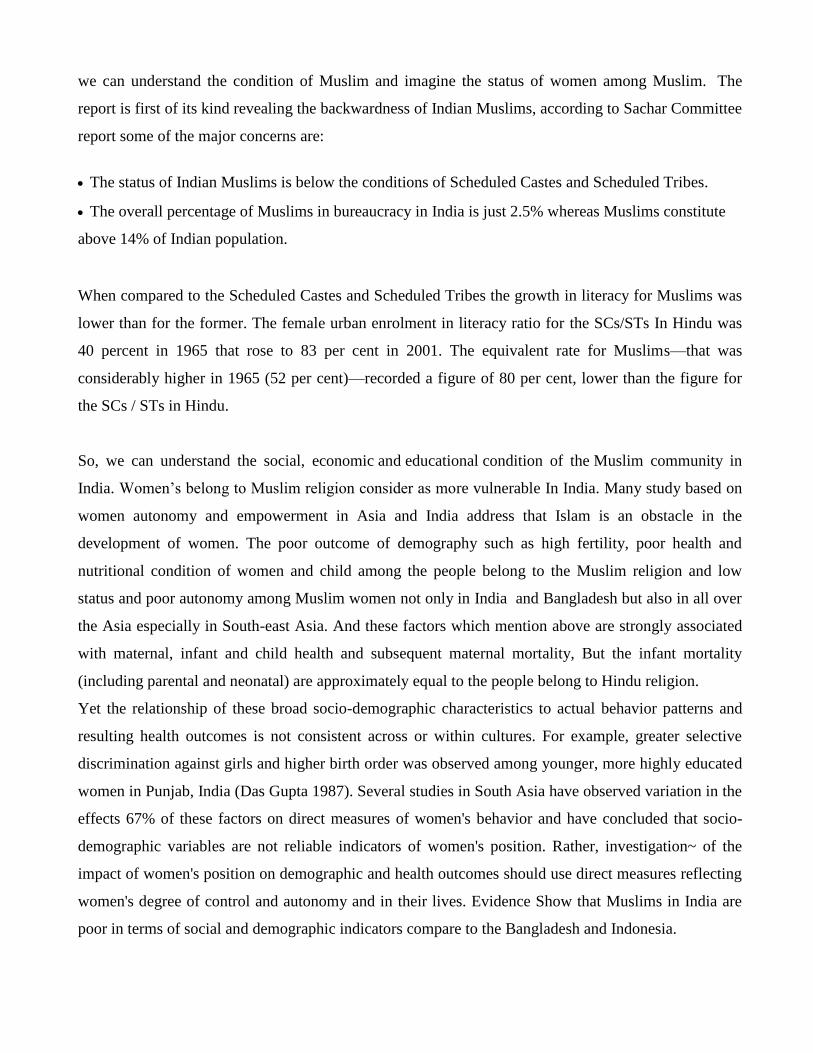
Figure 1.5: Mean score of women alone autonomy by the education of women across the selected
countries
Figure shows the autonomy of women alone by the education of women is high among educated
women and low among uneducated women both In India and Bangladesh but in Indonesia the situation
is inverse, it is high among uneducated, although very less proportion of women in Indonesia belongs
to non-educated category. In India it is high among primary educated women and approximately
equally high among higher educated women and low among secondary educated women.
Figure 1.6: Mean score of women alone autonomy by sex of household head across the selected
countries
Figure shows the sex of household head of is very crucial in building women autonomy if the head of
household is male there is low autonomy among women across the all selected countries. If it is
females, women are having great autonomy and it is seem more crucial factor in Bangladesh fallowed
by India and Indonesia.
0
10
20
30
40
50
60
No education Primary Secondary Higher
India
Bangladesh
Indonesia
0
10
20
30
40
50
60
70
India Bangladesh Indonesia
17.3713.43
42.95
33.64
56.7465.15
Male
Female

Figure 1.7: Mean score of women alone autonomy by wealth of women across the selected
countries
Figure show the autonomy score of women with wealth quintile of women. Figure shows as the level of
wealth of women increase autonomy of women also increase. In Indonesia and Bangladesh autonomy
of women is high among rich and richest women but in India it is high among poorer women than
among the women belong to richest wealth quintiles.
Figure 1.8: Mean score of women alone autonomy by profession of women across the selected
countries
Figure shows that women who are professional (including teacher, professor, bankers, clerks etc.) are
having higher autonomy in India and in Bangladesh but in Indonesia higher autonomy associated with
sales and services than skilled and unskilled manual.
0
10
20
30
40
50
Poorest Poorer Middle Richer Richest
India
Bangladesh
Indonesia
05
101520253035404550
Unemployed Professionals Sale andService
Agriculture Skilled &Unskilledmanual
India
Bangladesh
Indonesia
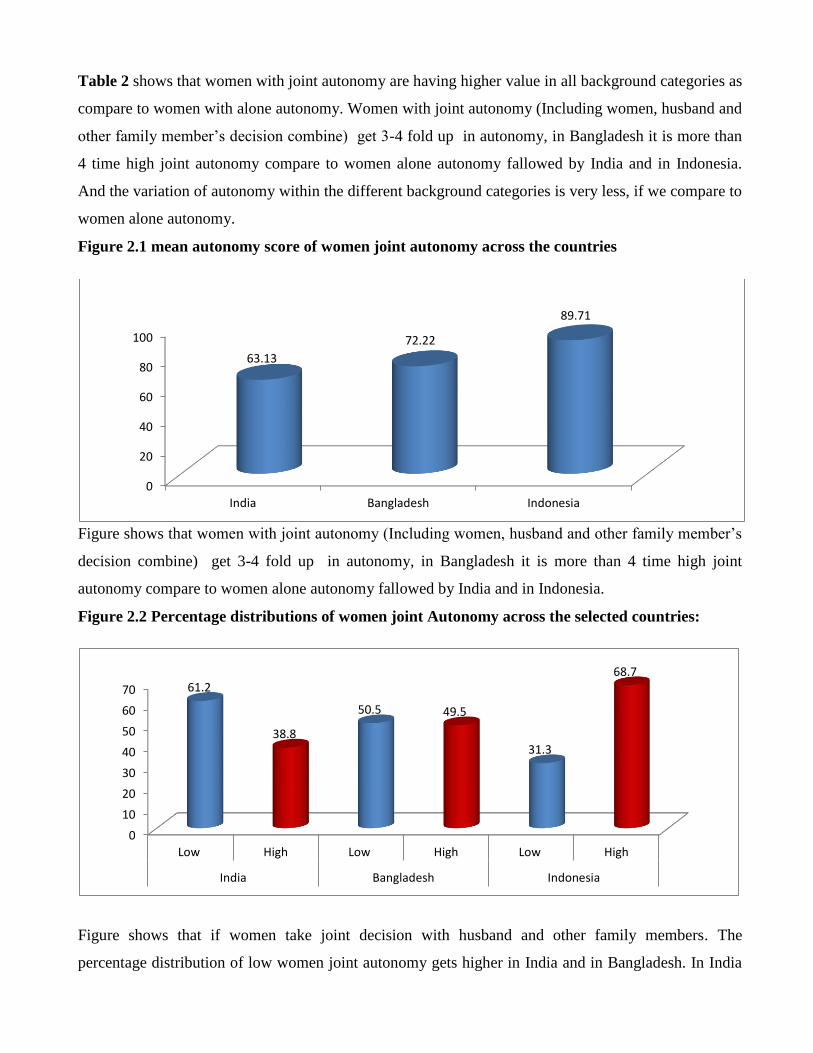
Table 2 shows that women with joint autonomy are having higher value in all background categories as
compare to women with alone autonomy. Women with joint autonomy (Including women, husband and
other family member’s decision combine) get 3-4 fold up in autonomy, in Bangladesh it is more than
4 time high joint autonomy compare to women alone autonomy fallowed by India and in Indonesia.
And the variation of autonomy within the different background categories is very less, if we compare to
women alone autonomy.
Figure 2.1 mean autonomy score of women joint autonomy across the countries
Figure shows that women with joint autonomy (Including women, husband and other family member’s
decision combine) get 3-4 fold up in autonomy, in Bangladesh it is more than 4 time high joint
autonomy compare to women alone autonomy fallowed by India and in Indonesia.
Figure 2.2 Percentage distributions of women joint Autonomy across the selected countries:
Figure shows that if women take joint decision with husband and other family members. The
percentage distribution of low women joint autonomy gets higher in India and in Bangladesh. In India
0
20
40
60
80
100
India Bangladesh Indonesia
63.13
72.22
89.71
0
10
20
30
40
50
60
70
Low High Low High Low High
India Bangladesh Indonesia
61.2
38.8
50.5 49.5
31.3
68.7
this difference gets higher percentage if we compare to women alone autonomy and in Bangladesh also
but in Indonesia percentage of women with higher joint autonomy increase when women take joint
decision. This was approximately equal if woman take alone decision.
Figure 2.3: Mean autonomy score of women joint autonomy by age group of women across the
selected countries.
Figure shows that women joint autonomy increasing with increasing age but a certain point come from
where autonomy goes down in all selected countries same as women alone autonomy in India and in
Bangladesh it starts down with 40-44 age groups where in Indonesia it starts decline with 35-39 age
group and in Indonesia it is also more fluctuation in autonomy with age.
Figure 2.4: Mean score of women joint autonomy by place of residence across the selected
countries
0
20
40
60
80
100
15-19 20-24 25-29 30-34 35-39 40-44 45-49
India
Bangladesh
Indonesia
0
20
40
60
80
100
India Bangladesh Indonesia
69.3477.93
90.19
60.8470.56
89.27
Urban
Rural
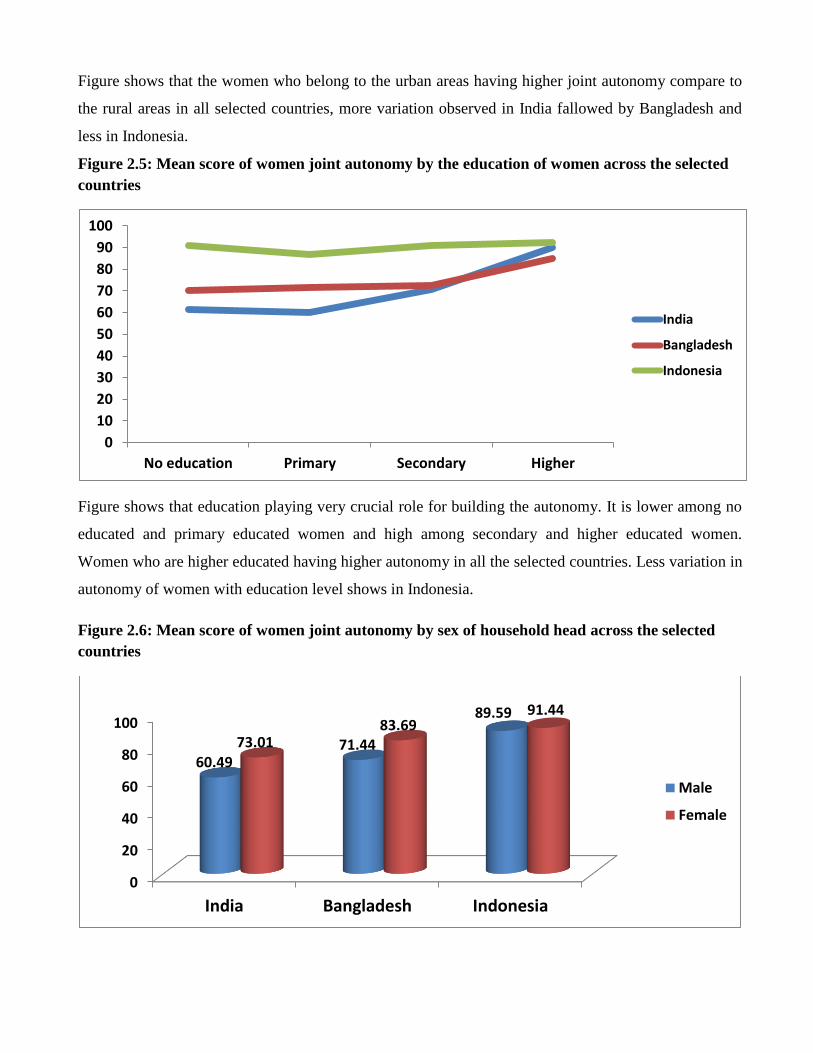
Figure shows that the women who belong to the urban areas having higher joint autonomy compare to
the rural areas in all selected countries, more variation observed in India fallowed by Bangladesh and
less in Indonesia.
Figure 2.5: Mean score of women joint autonomy by the education of women across the selected
countries
Figure shows that education playing very crucial role for building the autonomy. It is lower among no
educated and primary educated women and high among secondary and higher educated women.
Women who are higher educated having higher autonomy in all the selected countries. Less variation in
autonomy of women with education level shows in Indonesia.
Figure 2.6: Mean score of women joint autonomy by sex of household head across the selected
countries
0
10
20
30
40
50
60
70
80
90
100
No education Primary Secondary Higher
India
Bangladesh
Indonesia
0
20
40
60
80
100
India Bangladesh Indonesia
60.4971.44
89.59
73.0183.69
91.44
Male
Female
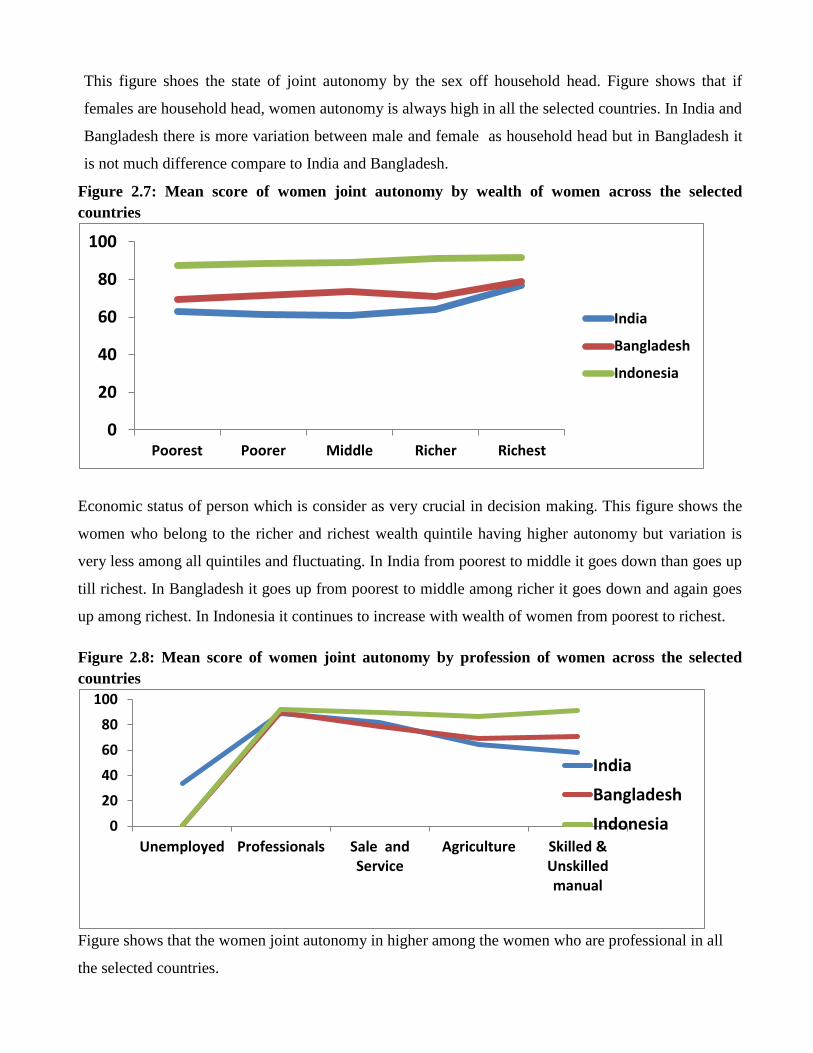
This figure shoes the state of joint autonomy by the sex off household head. Figure shows that if
females are household head, women autonomy is always high in all the selected countries. In India and
Bangladesh there is more variation between male and female as household head but in Bangladesh it
is not much difference compare to India and Bangladesh.
Figure 2.7: Mean score of women joint autonomy by wealth of women across the selected
countries
Economic status of person which is consider as very crucial in decision making. This figure shows the
women who belong to the richer and richest wealth quintile having higher autonomy but variation is
very less among all quintiles and fluctuating. In India from poorest to middle it goes down than goes up
till richest. In Bangladesh it goes up from poorest to middle among richer it goes down and again goes
up among richest. In Indonesia it continues to increase with wealth of women from poorest to richest.
Figure 2.8: Mean score of women joint autonomy by profession of women across the selected
countries
Figure shows that the women joint autonomy in higher among the women who are professional in all
the selected countries.
0
20
40
60
80
100
Poorest Poorer Middle Richer Richest
India
Bangladesh
Indonesia
0
20
40
60
80
100
Unemployed Professionals Sale andService
Agriculture Skilled &Unskilledmanual
India
Bangladesh
Indonesia

Differentials in Maternal Care by Autonomy of women across the selected
Countries:
Table 3 shows the distribution ANC cares among No, full and partly ANC Care across the selected
countries by background characteristics. In India, Muslim women who take ANC care for last child out
of total 46.3 percent women are partly and 34.7 percent full and 19 percent are No ANC care, in
Bangladesh 66 percent partly and 16.3 percent full and 17.7 are take No ANC care and in Indonesia
50.6 percent partly, 46.2 percent take full ANC care and only 5.9 percent are No ANC care. By the Age
of women as the age of women increases women are shifting from full to partly and No ANC care and
it is also happen in Indonesia but in Bangladesh although it very less percentage of full ANC, there is
fluctuating as the age of women increase shifting from partly and full ANC care to No ANC care. By
the education of women in India higher percentage of partly ANC among partly ANC among no
educated women and higher Full ANC percentage among higher educated women which is also in
Bangladesh and Indonesia but in India women with higher percentage of ANC among higher educated
women. By the place of residence higher percentage of full ANC in urban area all countries and lower
in rural area. There is no much affect of sex of household in India and Indonesia but in Bangladesh high
percentage of full ANC associated with female as household head. By the wealth quintile, high
percentage of full ANV among the women belongs to rich and riches wealth quintiles and lowers
among poorest and poor. By occupation of women high percentage of full ANC among Professional in
India and in Bangladesh, in Indonesia is higher among skilled and unskilled manual.
Figure 3.1: Percentage distribution of ANC care across the selected countries.
0
50
100
NoANC
partlyANC
FullANC
NoANC
partlyANC
FullANC
NoANC
partlyANC
FullANC
India Bangladesh Indonesia
19
46.334.7
17.7
66
16.35.9
50.6 43.5
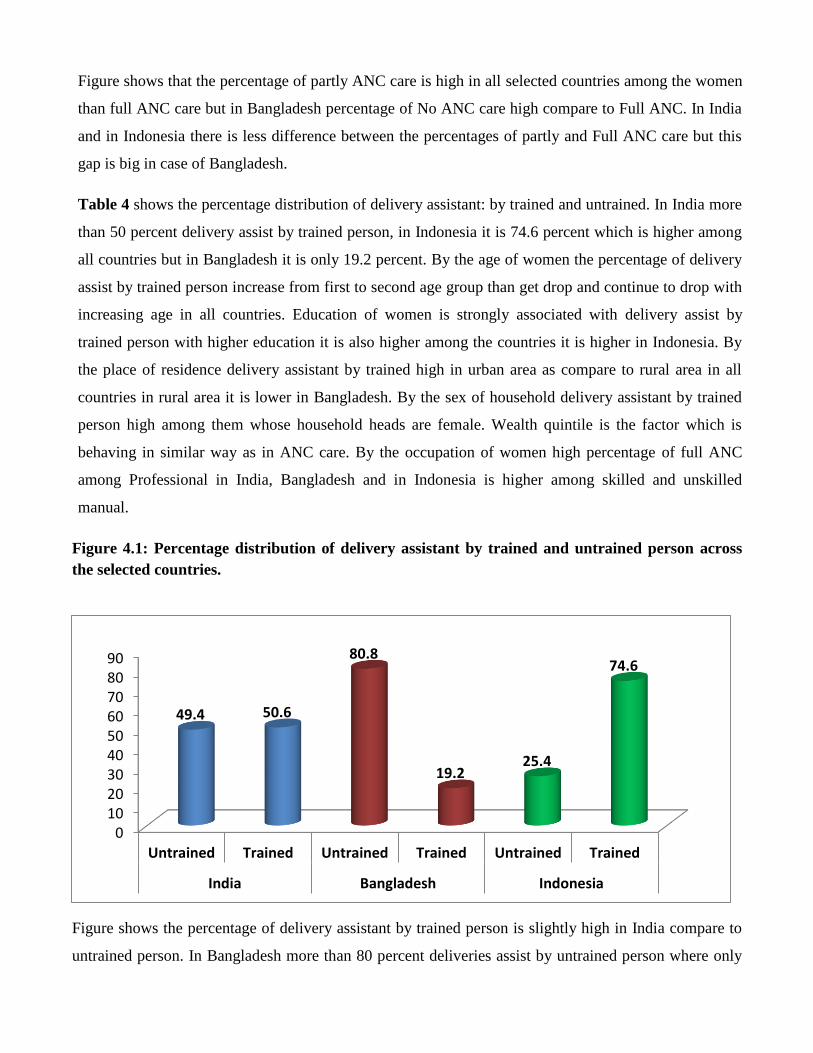
Figure shows that the percentage of partly ANC care is high in all selected countries among the women
than full ANC care but in Bangladesh percentage of No ANC care high compare to Full ANC. In India
and in Indonesia there is less difference between the percentages of partly and Full ANC care but this
gap is big in case of Bangladesh.
Table 4 shows the percentage distribution of delivery assistant: by trained and untrained. In India more
than 50 percent delivery assist by trained person, in Indonesia it is 74.6 percent which is higher among
all countries but in Bangladesh it is only 19.2 percent. By the age of women the percentage of delivery
assist by trained person increase from first to second age group than get drop and continue to drop with
increasing age in all countries. Education of women is strongly associated with delivery assist by
trained person with higher education it is also higher among the countries it is higher in Indonesia. By
the place of residence delivery assistant by trained high in urban area as compare to rural area in all
countries in rural area it is lower in Bangladesh. By the sex of household delivery assistant by trained
person high among them whose household heads are female. Wealth quintile is the factor which is
behaving in similar way as in ANC care. By the occupation of women high percentage of full ANC
among Professional in India, Bangladesh and in Indonesia is higher among skilled and unskilled
manual.
Figure 4.1: Percentage distribution of delivery assistant by trained and untrained person across
the selected countries.
Figure shows the percentage of delivery assistant by trained person is slightly high in India compare to
untrained person. In Bangladesh more than 80 percent deliveries assist by untrained person where only
0102030405060708090
Untrained Trained Untrained Trained Untrained Trained
India Bangladesh Indonesia
49.4 50.6
80.8
19.225.4
74.6

19 percent5 deliveries assist by trained person but in Indonesia this scenario is completely opposite, in
Indonesia more than 74 percent delivery assist by trained person where only fourth delivery assist by
untrained person.
Table 5 shows that the distribution of Muslim women between home and institutional delivery which is
based on last child. Institutional delivery across the selected countries is lower as compare to home
delivery and it is lower in Bangladesh among all selected countries. Place of delivery at institute by the
of women it increase from first to second age group and then continue to reduce till above ages.
Education of women which is shows by the table is strongly associated with institutional delivery and
home delivery, institutional delivery is high among higher educated and lower among non educated
women. Place of residence is also strong influence on institutional delivery, in urban are it is high and in
rural area it is low. If female is household head there is high percentage of institutional delivery in All
countries. In India and in Indonesia women from richer and riches wealth quintiles are having more
institutional delivery but in Bangladesh home delivery is high among all the women belong to any
wealth quintiles. By the occupation of women, professional women are having higher percentage of
institutional delivery
Figure 5.1: Percentage distribution of Place of delivery across the selected countries.
Figure shows the percentage of delivery take place at home in India is high compare to institutional
delivery, in Bangladesh percentage of delivery take place at home is very high which is more than 84
percent and approximately 16 percent delivery take place at institute, if we compare among all the
0
10
20
30
40
50
60
70
80
90
Home Institute Home Institute Home Institute
India Bangladesh Indonesia
55.2
44.8
84.4
15.6
51.7 48.3

selected countries Bangladesh has the higher percentage of home delivery. In Indonesia there is slit
difference between the percentage of home and institutional delivery although, like other countries in
Indonesia the percentage of home delivery is high.
Table 6 shows the affect of women autonomy in India on maternal care including ANC care, delivery
assist by person and place of delivery if women take decision alone. All response variable are in
dichotomous form 0 and 1 (0= partly ANC, 1= Full ANC) (0= Delivery assist by trained person, 1=
delivery assist by trained person) (0= delivery at home, 1 = delivery at institute). This regression table
shows the uncontrolled and control effect of autonomy on our response variables. Without controlling
the background factor odds shows the female with higher autonomy are significantly 0.833 times less
likely to have full ANC care as compare to women with lower autonomy which is reference category
but in Delivery assist by trained person and institution delivery is significantly more likely in higher
autonomous women compare to lower autonomous women. If we control the background factors full
ANC is significantly less likely and Delivery assists by trained person and institution delivery are
significantly more likely among the women who are with higher autonomy compare to the women with
lower autonomy which is reference category.
Table 7 shows the affect of women autonomy on maternal care including ANC care, delivery assist by
person and place of delivery in Bangladesh, if women take decision alone. Model-1 of table show the
effect of autonomy on our response variable without controlling the background factor odds shows the
female with higher autonomy are significantly more likely to have full ANC care Delivery assist by
trained person and institution delivery. Model -2 shoes the effect of autonomy on our response variable
with controlling the effect of background factors. Women with higher autonomy are significantly more
likely have full ANC care Delivery assist by trained person and institution delivery.
Table 8 shows the affect of women autonomy on maternal care including ANC care, delivery assist by
person and place of delivery in Indonesia, if women take decision alone. Model-1 of table show the effect
of autonomy on our response variable without controlling the background factor, odds shows the female
with higher autonomy are significantly more likely to have full ANC care Delivery assist by trained
person and less likely to have institution delivery. Model -2 of table shows the effect of autonomy on our
response variable with controlling the effect of background factors. Odds shoes the Women with higher
autonomy are significantly more likely to have full ANC care and less like significantly less likely to
Delivery assist by trained person and institution delivery.

Table 9 shows the affect of women joint autonomy in India on maternal care including ANC care,
delivery assist by person and place of delivery if women take decision jointly with husband and other
family members in India. Model-1 of table show the effect of autonomy on our response variable without
controlling the background factor, odds shows the female with higher autonomy are significantly more
likely to have full ANC care Delivery assist by trained person and institution delivery. Model -2 shoes
the effect of autonomy on our response variable with controlling the effect of background factors. Odds
shows that the women with higher autonomy are significantly more likely to having full ANC care
Delivery assist by trained person and institution delivery as compare to the women with lower joint
autonomy, which is reference category.
Table 10 shows the affect of women joint autonomy in Bangladesh on maternal care including ANC
care, delivery assist by person and place of delivery if women take decision jointly with husband and
other family members in Bangladesh. Model-1 of table show the effect of autonomy on our response
variable without controlling the background factor, odds shows the female with higher autonomy are
significantly more likely to have full ANC care Delivery assist by trained person and institution delivery.
Model -2 shoes the effect of autonomy on our response variable with controlling the effect of background
factors. Odds shows that the women with higher autonomy are significantly more likely to having full
ANC care and significantly less likely to having Delivery assist by trained person and institution delivery
as compare to the women with lower joint autonomy, which is reference category.
Table 11 shows the affect of women joint autonomy in Indonesia on maternal care including ANC care,
delivery assist by person and place of delivery if women take decision jointly with husband and other
family members in Indonesia. Model-1 of table show the effect of autonomy on our response variable
without controlling the background factor, odds shows the female with higher autonomy are significantly
more likely to have full ANC care Delivery assist by trained person and institution delivery. Model -2
shoes the effect of autonomy on our response variable with controlling the effect of background factors.
Odds shows that the women with higher autonomy are significantly more likely to have full ANC care
Delivery assist by trained person and institution delivery as compare to the women with lower joint
autonomy, which is reference category.

Discussion and conclusion:
The dimensions of women’s autonomy in terms of outside mobility, access to economic resources and
involvement in household decisions. All these dimensions are positive with socio-economic, linked to
good maternal health care. In this study, the findings are the social –economic demographic factor of
women is not affecting their autonomy in similar way. From younger ages to elder ages women are
getting autonomous and a certain point come when they starts losses the autonomy. Which is in
Bangladesh and Indonesia come at 40-44 age groups but in India in come early at 35-39 age groups?
Female joint autonomy although increase with increase the social-economic and demographic level but if
we talk about women alone as autonomous. In India it is high among poorer women but in Bangladesh it
high among richer and richest women. As the level of education of women increase mean of autonomy
start increase in India and in Bangladesh autonomy of women is high among higher educated women but
in Indonesia it is high among non educated women. The affect of household sex if it female, female
autonomy ultimately increase.
In India if women alone autonomy is high results more institutional delivery and delivery assist by
trained person and but if women take decision jointly means if joint autonomy is high results good
maternal care compare to alone.
In Bangladesh if women are alone having high autonomy results good maternal cares compare to low
autonomy. High Joint autonomy of women is not much affective in Bangladesh.
In Indonesia there is no much effect of alone lower and higher autonomy of women on maternal care but
if joint autonomy of women is high, resulting better maternal care .
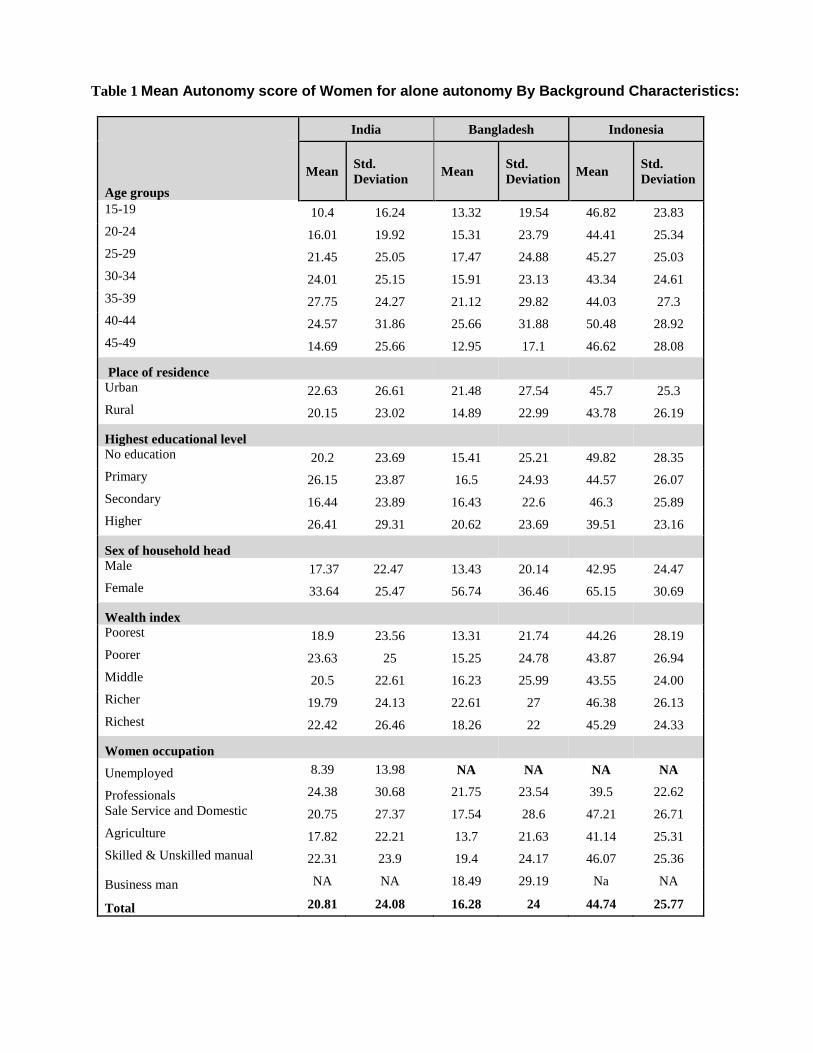
Table 1 Mean Autonomy score of Women for alone autonomy By Background Characteristics:
India Bangladesh Indonesia
Age groups
Mean Std.
Deviation Mean
Std.
Deviation Mean
Std.
Deviation
15-19 10.4 16.24 13.32 19.54 46.82 23.83
20-24 16.01 19.92 15.31 23.79 44.41 25.34
25-29 21.45 25.05 17.47 24.88 45.27 25.03
30-34 24.01 25.15 15.91 23.13 43.34 24.61
35-39 27.75 24.27 21.12 29.82 44.03 27.3
40-44 24.57 31.86 25.66 31.88 50.48 28.92
45-49 14.69 25.66 12.95 17.1 46.62 28.08
Place of residence
Urban 22.63 26.61 21.48 27.54 45.7 25.3
Rural 20.15 23.02 14.89 22.99 43.78 26.19
Highest educational level
No education 20.2 23.69 15.41 25.21 49.82 28.35
Primary 26.15 23.87 16.5 24.93 44.57 26.07
Secondary 16.44 23.89 16.43 22.6 46.3 25.89
Higher 26.41 29.31 20.62 23.69 39.51 23.16
Sex of household head
Male 17.37 22.47 13.43 20.14 42.95 24.47
Female 33.64 25.47 56.74 36.46 65.15 30.69
Wealth index
Poorest 18.9 23.56 13.31 21.74 44.26 28.19
Poorer 23.63 25 15.25 24.78 43.87 26.94
Middle 20.5 22.61 16.23 25.99 43.55 24.00
Richer 19.79 24.13 22.61 27 46.38 26.13
Richest 22.42 26.46 18.26 22 45.29 24.33
Women occupation
Unemployed 8.39 13.98 NA NA NA NA
Professionals 24.38 30.68 21.75 23.54 39.5 22.62
Sale Service and Domestic 20.75 27.37 17.54 28.6 47.21 26.71
Agriculture 17.82 22.21 13.7 21.63 41.14 25.31
Skilled & Unskilled manual 22.31 23.9 19.4 24.17 46.07 25.36
Business man NA NA 18.49 29.19 Na NA
Total 20.81 24.08 16.28 24 44.74 25.77

Table 2 Mean Autonomy score of Women for joint autonomy By Background Characteristics:
India Bangladesh Indonesia
Age groups
Mean
Std.
Deviation Mean
Std.
Deviation Mean
Std.
Deviation
15-19 39.58 29.66 66.39 30.58 79.82 23.14
20-24 54.29 33.0 69.97 31.87 89.08 19.9
25-29 64.39 33.96 72.41 30.73 90.44 16.54
30-34 70.24 31.33 75.72 28.11 89.48 19.05
35-39 71.51 31.69 79.33 30.01 91.34 16.26
40-44 77.68 27.65 82.4 29.59 88.97 19.21
45-49 74.16 18.23 72.1 31.77 85.3 20.3
Place of residence
Urban 69.34 33.63 77.93 26.8 90.19 18.22
Rural 60.84 33.19 70.56 31.65 89.27 18.22
Highest educational level
No education 61.29 34.07 70.17 33.4 91.07 15.37
Primary 59.99 30.07 71.49 29.47 86.77 20.23
Secondary 70.49 33.14 72.34 30.16 91.21 16.88
Higher 89.88 23.49 84.76 22.95 92.54 16.2
Sex of household head
Male 60.49 34.43 71.44 30.86 89.59 18.42
Female 73.01 27.77 83.69 26.59 91.44 15.69
Wealth index
Poorest 62.73 33.15 69.22 31.57 87.22 21.21
Poorer 61.59 33.36 71.67 30.76 88.4 18.13
Middle 60.88 32.85 73.7 31.18 88.97 18.46
Richer 64.31 35.3 71.08 32.85 91.36 17.39
Richest 76.83 32.2 78.92 24.78 91.51 16.41
Women occupation
Unemployed 33.31 24.54 NA NA NA NA
Professionals 88.71 23.76 89.61 13.42 92.22 16.04
Sale Service and Domestic 82.01 26.79 79 27.85 89.49 18.43
Agriculture 64.25 33.41 69.08 31.48 86.31 20.65
Skilled & Unskilled manual 58.38 33.17 71.07 31.61 91.03 16.87
Business man NA NA 77.1 27.84 NA NA
Total 63.13 33.5 72.22 30.71 89.71 18.24

Table 3 Percentage Distribution of ANC care among women across the selected countries by background Characteristics:
India Bangladesh Indonesia
No ANC partly ANC Full ANC No ANC
partly ANC Full ANC No ANC
partly ANC Full ANC
Age group 15-19 9.4 52.0 38.6 15.6 67.4 17.0 5.6 52.8 41.6
20-24 13.7 45.7 40.6 13.7 68.4 18.0 5.4 52.0 42.6
25-29 18.0 46.3 35.7 19.5 64.9 15.6 4.6 51.4 44.0
30-34 21.6 46.9 31.5 21.5 64.3 14.2 4.9 49.1 45.9
35-39 33.6 44.3 22.1 21.2 64.9 13.9 6.8 49.0 44.2
40-44 42.5 43.0 14.5 34.4 53.3 12.3 10.3 52.2 37.5
45-49 54.8 38.1 7.10C 23.5 52.9 23.5 24.1 45.8 30.0
Place of residence Urban 10.3 41.8 47.9 13.8 59.3 26.8 2.7 50.5 46.7
Rural 23.3 48.5 28.2 18.8 67.8 13.4 8.3 50.7 41.0
Level of Education No education 30.2 51.8 18.0 30.1 63.3 6.6 31.0 52.5 16.5
Primary 8.5 49.4 42.1 18.6 69.7 11.7 9.6 54.1 36.3
Secondary 3.5 36.0 60.5 10.9 66.6 22.4 2.1 47.8 50.1
Higher 0.0 16.4 83.6 3.4 55.2 41.4 .1 48.3 51.6
Sex of Household head Male 18.4 46.2 35.4 18.0 66.2 15.8 5.9 50.6 43.6
Female 22.4 46.7 30.9 15.3 64.6 20.1 6.4 51.2 42.3
Wealth Quintiles Poorest 32.8 52.9 14.3 27.8 64.4 7.8 14.7 52.3 32.9
Poorer 24.8 53.4 21.8 20.5 70.5 9.0 8.3 50.3 41.4
Middle 20.2 46.2 33.6 18.0 67.3 14.7 4.4 51.4 44.2
Richer 7.3 42.1 50.6 12.9 68.2 18.9 2.1 46.0 51.8
Richest 2.9 30.5 66.6 7.2 59.3 33.5 .5 53.3 46.2
Occupation of women
Unemployed 17.9 45.7 36.4 16.9 66.1 17.0 5.1 50.0 44.9
Professionals 6.0 26.0 68.0 0.0 47.8 52.2 .2 52.7 47.2
Sale Service and Domestic 22.0 43.1 35.0 22.5 63.6 13.9 4.8 50.8 44.4
Agriculture 31.3 47.0 21.8 23.2 66.2 10.6 12.9 52.3 34.8
Skilled & Unskilled manual 15.8 52.0 32.2 13.7 67.7 18.5 3.3 50.2 46.4
Businessman NA NA NA 13.8 75.9 10.3 NA NA NA
Total 19.0 46.3 34.7 17.7 66.0 16.3 5.9 50.6 43.5

Table 4 Percentage Distribution of Delivery Assist by person among Muslim women by background
Characteristics:
India Bangladesh Indonesia
Age Untrained Trained Untrained Trained Untrained Trained
15-19 54.9 45.1 82.6 17.4 39.7 60.3
20-24 45.7 54.3 79.5 20.5 27.4 72.6
25-29 46.1 53.9 79.1 20.9 23.5 76.5
30-34 50.7 49.3 81.6 18.4 23.4 76.6
35-39 56.0 44.0 82.6 17.4 22.4 77.6
40-44 76.1 23.9 90.2 9.8 30.9 69.1
45-49 89.7 10.3 100.0 NA 41.9 58.1
Education
No education 69.8 30.2 94.6 5.4 60.8 39.2
Primary 52.8 47.2 90.6 9.4 40.9 59.1
Secondary 22.6 77.4 71.3 28.7 13.4 86.6
Higher 4.4 95.6 34.3 65.7 1.3 98.7
Place of residence
Urban 33.3 66.7 61.9 38.1 12.6 87.4
Rural 64.5 35.5 86.0 14.0 35.2 64.8
Sex of Household head
Male 49.9 50.1 81.4 18.6 25.6 74.4
Female 46.0 54.0 76.1 23.9 22.4 77.6
Wealth Index
Poorest 87.2 12.8 95.1 4.9 53.4 46.6
Poor 74.8 25.2 92.8 7.2 34.6 65.4
Middle 57.1 42.9 87.8 12.2 22.5 77.5
Richer 31.2 68.8 75.2 24.8 13.4 86.6
Richest 14.3 85.7 49.0 51.0 4.6 95.4
Occupation
Unemployed 47.0 53.0 78.7 21.3 24.5 75.5
Professional 14.3 85.7 26.1 73.9 3.1 96.9
Sale & service 48.9 51.1 92.0 8.0 17.1 82.9
Agriculture 64.9 35.1 92.3 7.7 49.3 50.7
Skilled & Unskilled manual 57.6 42.4 70.6 29.4 19.3 80.7
Businessman NA NA 93.1 6.9 NA NA
Total 49.4 50.6 80.8 19.2 25.4 74.6
Table 5 Percentage Distribution of place of delivery among Muslim women by background
Characteristics:
India Bangladesh Indonesia
Age Home Institute Home Institute Home Institute
15-19 62.3 37.7 85.5 14.5 67.6 32.4
20-24 51.9 48.1 83.5 16.5 52.7 47.3
25-29 51.0 49.0 83.5 16.5 50.8 49.2
30-34 56.2 43.8 85.0 15.0 49.3 50.7
35-39 63.6 36.4 84.6 15.4 49.5 50.5
40-44 78.7 21.3 91.7 8.3 55.6 44.4
45-49 92.3 7.7 100.0 00.0 63.5 36.5
Education
No education 76.7 23.3 96.8 3.2 82.6 17.4
Primary 57.8 42.2 93.0 7.0 69.0 31.0
Secondary 27.7 72.3 76.6 23.4 40.2 59.8
Higher 5.2 94.8 38.5 61.5 15.8 84.2
Place of residence
Urban 38.1 61.9 67.9 32.1 29.4 70.6
Rural 71.1 28.9 88.9 11.1 68.7 31.3
Sex of Household head
Male 55.7 44.3 84.7 15.3 51.9 48.1
Female 51.3 48.7 82.1 17.9 49.1 50.9
Wealth Index
Poorest 92.5 7.5 95.4 4.6 84.6 15.4
Poor 81.2 18.8 94.7 5.3 67.8 32.2
Middle 63.6 36.4 91.7 8.3 52.0 48.0
Richer 38.1 61.9 80.2 19.8 38.6 61.4
Richest 17.7 82.3 56.4 43.6 16.7 83.3
Occupation
Unemployed 52.4 47.6 82.6 17.4 50.8 49.2
Professional 14.3 85.7 28.3 71.7 25.0 75.0
Sale & service 56.8 43.2 93.4 6.6 41.9 58.1
Agriculture 71.8 28.2 93.8 6.2 80.1 19.9
Skilled & Unskilled manual 65.6 34.4 78.2 21.8 43.3 56.7
Businessman NA NA 96.6 3.4 NA NA
Total 55.2 44.8 84.4 15.6 51.7 48.3

Table 6 Women joint Autonomy in India:
Modal 1 Modal 2
Full ANC
Delivery
Assist by
Trained
Institutional
Delivery Full ANC
Delivery
Assist by
Trained
Institutional
Delivery
Joint autonomy
Lower 1 1 1 1 1 1
Higher 1.385** 1.577*** 1.565*** 1.051** 1.224** 1.05**
Age
15-19
1 1 1
20-24
1.118 0.982 1.157
25-29
0.948 0.705 1.018
30-34
1.194 0.839 1.084
35-39
0.698 1.181 1.099
40-44
0.315 0.267** 0.587
45-49
3.077 0 0
Education
No education
1 1 1
Primary
1.831*** 1.469* 1.915***
Secondary
2.372*** 3.494*** 4.659***
Higher
6.484*** 5.048** 7.442**
Place of residence
Urban
1 1 1
Rural
0.952 0.954 0.754
Sex of Household head
Male
1 1 1
Female
0.608** 0.747 0.674
Wealth Index
Poorest
1 1 1
Poor
1.98** 1.787** 2.099**
Middle
3.939*** 3.43*** 3.928***
Richer
3.979*** 4.788*** 5.708***
Richest
6.02*** 12.861*** 14.095***
Occupation
Unemployed
1 1 1
Professional
2.5 8.2 6.7
Sale & service and domestic 3.19 6.21 3.275
Agriculture
3.441 5.146 3.356
Skilled & Unskilled manual 3.344 4.906 2.914
Business
NA NA NA
Constant 0.838 0.05 0.041

Table 7 Women Alone Autonomy in Bangladesh:
Modal 1 Modal 2
Full ANC
Delivery
Assist by
Trained
Institutional
Delivery Full ANC
Delivery
Assist by
Trained
Institutional
Delivery
Autonomy of women Alone
Lower 1 1 1 1 1 1
Higher 1.10** 1.50*** 1.70*** 1.047** 1.099** 1.228**
Age
15-19
1 1 1
20-24
0.649 0.742 0.985
25-29
0.0538** 1.125 1.625
30-34
.0.499** 1.259 1.402
35-39
0.406** 2.018 3.120**
40-44
0.926 3.320* 4.767**
45-49
2.532 1.45 3.039
Education
No education
1 1 1
Primary
2.062** 1.726 3.030**
Secondary
3.525*** 4.917*** 8.118***
Higher
4.620*** 12.859*** 23.477***
Place of residence
Urban
1 1 1
Rural
0.754 .527*** 0.534**
Sex of Household head
Male
1 1 1
Female
0.87 0.939 1.088
Wealth Index
Poorest
1 1 1
Poor
1.045 0.851 0.992
Middle
1.357 0.953 0.681
Richer
1.213 1.972* 1.942
Richest
2.439*** 4.067*** 3.158***
Occupation
Unemployed
NA NA NA
Professional
1 1 1
Sale & service and domestic
0.647 0.338** 0.263**
Agriculture
0.591 0.385** 0.356**
Skilled & Unskilled manual
0.471* 0.556 0.445**
Business
0.588 0.409 0.417**
Constant 0.335*** 0.276*** 0.227***
Table 8 Alone women Autonomy in Indonesia:
Modal 1 Modal 2
Full
ANC
Delivery
Assist by
Trained
Institutional
Delivery
Full
ANC
Delivery
Assist by
Trained
Institutional
Delivery
Autonomy of women Alone
Lower 1 1 1 1 1 1
Higher 1.101*** 1.109** 0.967** 1.05** 0.893* 0.935**
Age
15-19®
1 1 1
20-24
1.246 1.147 0.682
25-29
1.449 0.861 0.612
30-34
1.473 1.087 0.659
35-39
1.438 1.011 0.638
40-44
1.283 0.879 0.629
45-49
0.811 0.631 0.716
Education
No education
1 1 1
Primary
1.879** 1.376 1.23
Secondary
2.203*** 2.850*** 2.347***
Higher
2.319*** 10.066*** 4.236***
Place of residence
Urban
1 1 1
Rural
1.263*** .538*** .387***
Sex of Household head
Male
1 1 1
Female
0.774** 0.983 1.007
Wealth Index
Poorest
1 1 1
Poor
1.019 1.669*** 1.990***
Middle
1.250* 3.153*** 3.675***
Richer
1.429*** 3.624*** 4.743***
Richest
1.012 9.103*** 9.202***
Occupation
Unemployed
NA
Professional
1 1 1
Sale & service and domestic
0.88 .508*** 1.253*
Agriculture
0.733** .401*** 0.744
Skilled & Unskilled manual
0.821 0.686 1.872***
Business
NA NA NA
Constant 0.594*** 5.673 0.857
Table 9 Women joint Autonomy in India:
Modal 1 Modal 2
Full ANC
Delivery
Assist by
Trained
Institutional
Delivery Full ANC
Delivery
Assist by
Trained
Institutional
Delivery
Joint autonomy
Lower 1 1 1 1 1 1
Higher 1.385** 1.577*** 1.565*** 1.051** 1.224** 1.05**
Age
15-19
1 1 1
20-24
1.118 0.982 1.157
25-29
0.948 0.705 1.018
30-34
1.194 0.839 1.084
35-39
0.698 1.181 1.099
40-44
0.315 0.267** 0.587
45-49
3.077 0 0
Education
No education
1 1 1
Primary
1.831*** 1.469* 1.915***
Secondary
2.372*** 3.494*** 4.659***
Higher
6.484*** 5.048** 7.442**
Place of residence
Urban
1 1 1
Rural
0.952 0.954 0.754
Sex of Household head
Male
1 1 1
Female
0.608** 0.747 0.674
Wealth Index
Poorest
1 1 1
Poor
1.98** 1.787** 2.099**
Middle
3.939*** 3.43*** 3.928***
Richer
3.979*** 4.788*** 5.708***
Richest
6.02*** 12.861*** 14.095***
Occupation
Unemployed
1 1 1
Professional
2.5 8.2 6.7
Sale & service and domestic 3.19 6.21 3.275
Agriculture
3.441 5.146 3.356
Skilled & Unskilled manual 3.344 4.906 2.914
Business
NA NA NA
Constant 0.838 0.05 0.041

Table 10 Women joint Autonomy in Bangladesh:
Modal 1 Modal 2
Full ANC
Delivery
Assist by
Trained
Institutional
Delivery Full ANC
Delivery
Assist by
Trained
Institutional
Delivery
Joint autonomy
Lower 1 1 1 1 1 1
Higher 1.69*** 1.40** 1.50*** 1.536*** 0.863** 0.885**
Age
15-19
1 1 1
20-24
0.625* 0.752 1.000
25-29
0.507** 1.162 1.678
30-34
0.468** 1.312 1.469
35-39
0.355** 2.128* 3.290**
40-44
0.868 3.481* 5.046**
45-49
2.263 1.484 3.018
Education
No education
1 1 1
Primary
2.155** 1.708 3.048**
Secondary
3.468*** 4.994*** 8.252***
Higher
4.576*** 13.079*** 23.831***
Place of residence
Urban
1 1 1
Rural
0.752 0.525*** 0.529**
Sex of Household head
Male
1 1 1
Female
0.840 0.978 1.156
Wealth Index
Poorest
1.0 1.0 1.0
Poor
1.032 0.85 0.987
Middle
1.306 0.964 0.692
Richer
1.202 2.008* 2.012*
Richest
2.377** 4.127*** 3.222***
Occupation
Unemployed
NA NA NA
Professional
1 1 1
Sale & service and domestic
0.657 0.338** 0.261**
Agriculture
0.630 0.378* 0.315**
Skilled & Unskilled manual
0.496 0.553 0.446*
Business
0.438 0.41 0.42
Constant 0.320*** 0.286*** 0.239***

Table 11 Women joint Autonomy in Indonesia:
Modal 1 Modal 2
Full ANC
Delivery
Assist by
Trained
Institutional
Delivery Full ANC
Delivery
Assist by
Trained
Institutional
Delivery
Joint autonomy
Lower 1 1 1 1 1 1
Higher 1.035*** 1.224*** 1.351*** 1.01 1.201** 1.099
Age
15-19
1 1 1
20-24
1.267 1.111 0.67
25-29
1.480 0.837 0.606
30-34
1.499 1.041 0.648
35-39
1.457 0.977 0.626
40-44
1.321 0.833 0.621
45-49
.824 0.621 0.711
Education
No education
1 1 1
Primary
1.86** 1.394 1.23
Secondary
2.181*** 2.877*** 2.336***
Higher
2.278*** 10.16*** 4.206***
Place of residence
Urban
1 1 1
Rural
1.256*** 0.540*** 0.386***
Sex of Household head
Male
1 1 1
Female
0.799* 0.927 1.009
Wealth Index
Poorest
1 1 1
Poor
1.021 1.678*** 1.996***
Middle
1.254* 3.189*** 3.693***
Richer
1.435*** 3.62*** 4.748***
Richest
1.015 9.095*** 9.221***
Occupation
Unemployed
NA NA NA
Professional
1 1 1
Sale & service and domestic
0.88 0.511*** 1.261*
Agriculture
0.733** 0.409*** 0.749
Skilled & Unskilled manual
0.821 0.686*** 1.888***
Business
NA NA NA
Constant 0.594*** 5.37 0.844

References:
Acharya, M. and L. Bennett (1982) “Women and the Subsistence Sector: Economic
Participation and Household Decision Making in Nepal”, World Bank Working Paper no.
526.
Agarwal, B. (1994) A Field of One’s Own: Gender and Land Rights in South Asia, Cambridge
University Press, Cambridge.
Amin, S. (1997) “The Poverty-Purdah trap in Rural Bangladesh: Implications for Women’s Roles
in the Family”, Development and Change, 28, 213-233
Beneria, L, and G. Sen (1986) “Accumulation, Reproduction, and Women’s Role in Economic
Development: Boserup Revisited” in Women’s Work, Chapter 9, E. Leacock and H. Safa (eds.),
Bergin and Garvey, South Hadley, MA.
Bergstrom, T. (1996), “A Survey of Theories of the Family”, in Hanbook of Population and Family
Economics, eds. M.R. Rosenzweig and O. Stark, North Holland, Amsterdam.
Caldwell, J. and P. Caldwell (1987) “The Cultural Context of High Fertility in Sub-Saharan
Africa”, Population and Development Review, 13(3), 409-437.
Ecevit, Y. (1991) “Shop Floor Control: the Ideological Construction of Turkish Women Factory
Workers” in Working Women: International Perspectives on Labour and Gender Ideology, N.
Redclift and M. Sinclair (eds.) Routledge, New York, 56-78.
Engels, F. (1884), The Origin of the Family, Private Property, and the State, Pathfinder Press New
York, 1972.
Eswaran, M. (2002) “The Empowerment of Women, Fertility, and Child Mortality: Towards a
Theoretical Analysis”, Journal of Population Economics, 15, pp. 433-454.
Eswaran, M. and A. Kotwal (1986), “Access to Capital and Agrarian Production Organization”,
Economic Journal, June 1986, pp. 482-498.
Finaly, B. (1989) the Women of Azua: Work and Family in Rural Dominican Republic, Praeger,
London.
Folbre, N. (1984) “Household Production in the Philippines: a Non-Neoclassical Approach”,
Economic Development and Cultural Change 32(2), 303-330.
Folbre, N. (1986) “Cleaning House: New Perspectives on Household and economic development”
journal of development economics, 22, 5-40.
Geisler, G. (1993) “Silences Speak Louder Than Claims: Gender, Household, and Agricultural
Development in Southern Africa”, World Development, 21(12), 1965-1980.

Gray, J (1998) “Divorce-Law Changes, Household Bargaining, and Married Women’s Labor
Supply”, American Economic Review, 88(3), 628-642.
Hashemi, S., S. Schuler, and A. Riley (1996) “Rural Credit Programs and women empowerment in
Bangladesh” World development, 24(4), 635-353
Lundberg, S. and R. Pollack (1993) “Separate Spheres Bargaining and the Marriage Market”,
Journal of Political Economy, 101 (6), 988-1010.
Lundberg, S. R. Pollak, and T. Wales (1997) “Do Husbands and Wives Pool Their Resources?
Evidence from the UK Child Benefit System”, Journal of Human Resources, 32(3), 463-480.
Manser, M. and M. Brown (1980) “Marriage and Household Decision-Making: A Bargaining
Analysis”, International Economic Review, 21(1), 31-44.
Mason, K. O. (1984), The Status of Women: A Review of its Relationships to Fertility and
Mortality, Rockefeller Foundation, New York.
Nizamuddin Khan and Usha Ram, "Can women’s perceptions of their own autonomy enable them
to generate changes in their reproductive behaviour? Evidences from gender perspectives” (2008)
Journal of Demography, 16, pp. 462-486
SHARON j. GHUMAN (2003) ‘Women’s Autonomy and Child Survival: A Comparison of
Muslims and Non-Muslims in Four Asian Countries, Demography, Volume 40-Number 3, August
2003: 419–436
Shelah S. Bloom and David Wypij (2001) “Dimensions of Women's Autonomy and the Influence
on Maternal Health Care Utilization in a North Indian City” Demography, Vol. 38, No. 1. (Feb.,
2001),