by mike cahn, richard smith, laura murphy and tim hartz · by mike cahn, richard smith, laura...
TRANSCRIPT
Mik
e Ca
hn
Field trials show the fertilizer value of nitrogen in irrigation waterby Mike Cahn, Richard Smith, Laura Murphy and Tim Hartz
Increased regulatory activity designed to protect groundwater from degradation by nitrate-nitrogen (NO3-N) is focusing attention on the efficiency of agricultural use of nitrogen (N). One area drawing scrutiny is the way in which growers consider the NO3-N concentration of irrigation water when determining N fertilizer rates. Four drip-irrigated field studies were conducted in the Salinas Valley evaluating the impact of irrigation water NO3-N concentration and irrigation efficiency on the N uptake efficiency of lettuce and broccoli crops. Irrigation with water NO3-N concentrations from 2 to 45 milligrams per liter were compared with periodic fertigation of N fertilizer. The effect of irrigation efficiency was determined by comparing an efficient (110% to 120% of crop evapotranspiration, ETc) and an inefficient (160% to 200% of ETc) irrigation treatment. Across these trials, NO3-N from irrigation water was at least as efficiently used as fertilizer N; the uptake efficiency of irrigation water NO3-N averaged approximately 80%, and it was not affected by NO3-N concentration or irrigation efficiency.
California agriculture faces increas-ing regulatory pressure to im-prove nitrogen (N) management
to protect groundwater quality. Ground-water in agricultural regions, such as the Salinas Valley and the Tulare Lake Basin, has been adversely impacted by agricul-tural practices, with nitrate-N (NO3-N) in many wells exceeding the federal
drinking water standard of 10 mg/L (Har-ter et al. 2012). The threat to groundwater is particularly acute in the Salinas Valley, where the intensive production of veg-etable crops has resulted in an estimated net loading (fertilizer N application − N removal with crop harvest) of > 100 lb/ac (> 112 kg/ha) of N annually (Rosenstock et al. 2014).
Levels of NO3-N in irrigation wells in the Salinas Valley commonly range from 10 to 40 mg/L. Given the typical volume of irrigation water applied to veg-etable fields, NO3-N in irrigation water
could represent a substantial fraction of crop N requirements, provided that crops can efficiently use this N source. Indeed, the concept of “pump and fertilize” (substituting irrigation water NO3-N for fertilizer N) has been suggested as a re-mediation technique to improve ground-water quality in agricultural regions (Harter et al. 2012).
Cooperative Extension publications from around the country (Bauder et al. 2011; DeLaune and Trostle 2012; Hopkins et al. 2007) agree that the fertilizer value of irrigation water NO3-N can be signifi-cant, but they differ as to what fraction of water NO3-N should be credited against the fertilizer N recommendation. There is a paucity of field data documenting the efficiency of crop utilization of irriga-tion water N. Francis and Schepers (1994) documented that corn could use irrigation water NO3-N, but in their study N uptake efficiency from irrigation water was low, which they attributed to the timing of ir-rigation relative to crop N demand and the availability of N from other sources. Martin et al. (1982) suggested that uptake efficiency of irrigation water NO3-N could actually be higher than from fertilizer N, but their conclusion was based on a com-puter simulation, not on field trials.
With this near total lack of relevant field data, California growers have le-gitimate concerns about the degree to
Online: https://doi.org/10.3733/ca.2017a0010
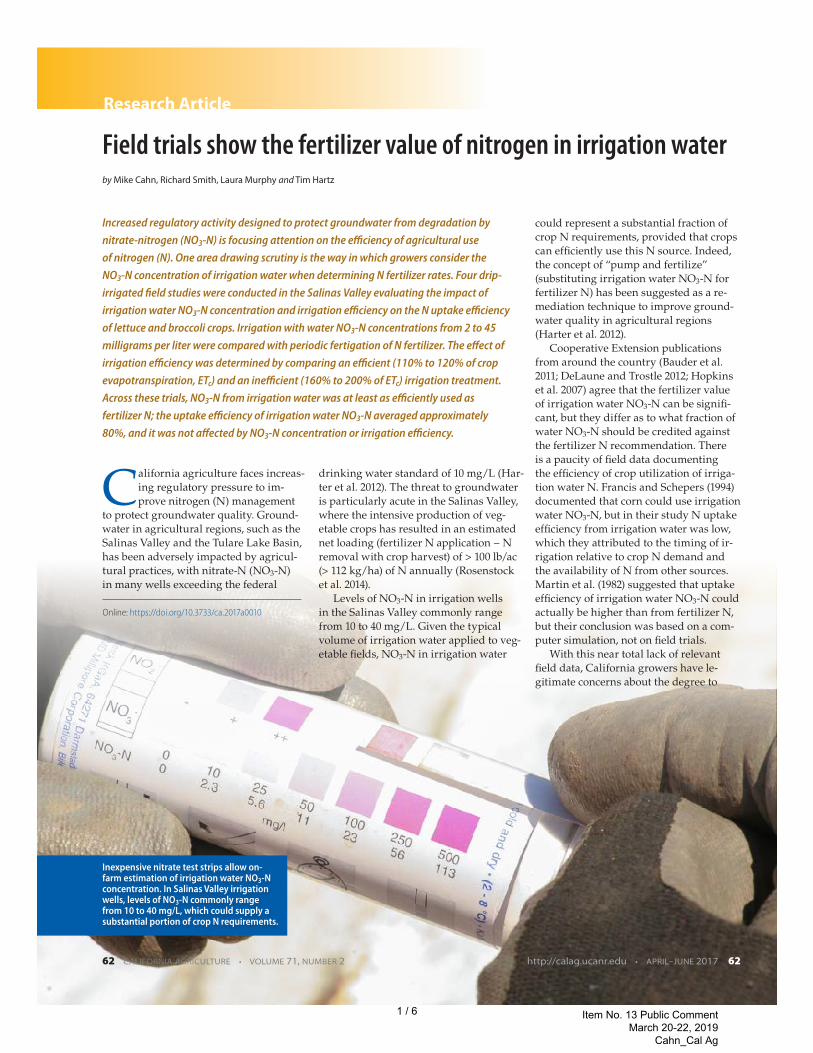
Inexpensive nitrate test strips allow on-farm estimation of irrigation water NO3-N concentration. In Salinas Valley irrigation wells, levels of NO3-N commonly range from 10 to 40 mg/L, which could supply a substantial portion of crop N requirements.
Research Article
62 CALIFORNIA AGRICULTURE • VOLUME 71, NUMBER 2 http://calag.ucanr.edu • APRIL–JUNE 2017 62
1 / 6 Item No. 13 Public Comment March 20-22, 2019
Cahn_Cal Ag
Mik
e Ca
hn
which irrigation water NO3-N can sub-stitute for fertilizer N. Two questions commonly asked by growers are whether plants can effectively use N at the low concentrations common in irrigation water, and to what degree irrigation inef-ficiency reduces water NO3-N availability. We undertook this study to document the agronomic value of irrigation water NO3-N in the production of vegetable crops under field conditions representa-tive of the Salinas Valley.
Irrigation water NO3-N trialsFour field trials were conducted at the U.S. Department of Agriculture Agri-cultural Research Service (USDA ARS) facility near Salinas between 2013 and 2015. The soil was a Chualar sandy loam. Before planting, fields were sprinkler-irri-gated to leach residual soil NO3-N so that all trials were conducted with low back-ground soil N availability. The well water used for pre-plant leaching as well as for all in-season irrigation ranged between 2 and 4 mg/L NO3-N over the course of this study. The experimental design for each trial was a randomized complete block, with four replications. Individual plots consisted of four beds, each 40 inches (1 meter) wide and 40 feet (12.2 meters) long, with all data collected from the middle two beds.
Crisphead lettuce ‘Telluride’ was seeded on May 16, 2013, in two rows per
bed and germinated using sprinklers. A soil anticrustant solution containing 17 lb/ac (19 kg/ha) of N was applied to all treat-ments at planting to improve germina-tion. After plants were thinned to a final in-row spacing of approximately 12 inches (30 centimeters), drip tape was installed on top of the beds and the field was drip-irrigated for the rest of the season.
Crop growth and N uptake were com-pared across a range of treatments simu-lating different irrigation water NO3-N concentrations during the drip-irrigated
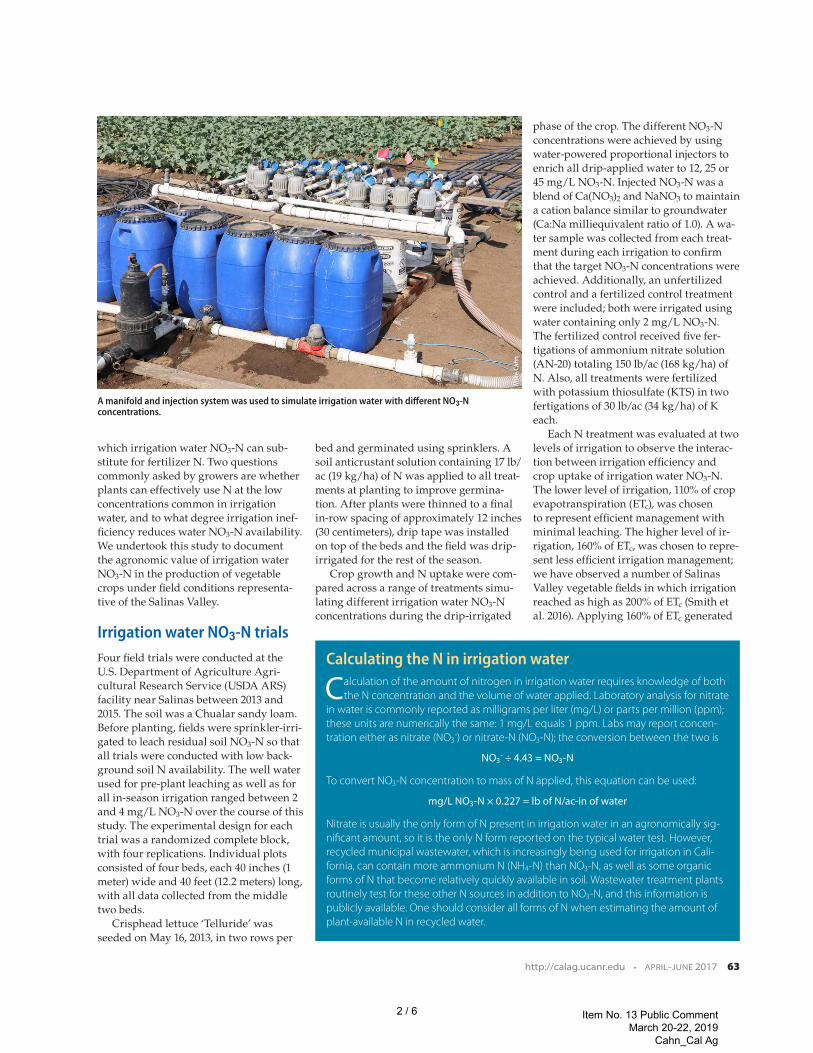
phase of the crop. The different NO3-N concentrations were achieved by using water-powered proportional injectors to enrich all drip-applied water to 12, 25 or 45 mg/L NO3-N. Injected NO3-N was a blend of Ca(NO3)2 and NaNO3 to maintain a cation balance similar to groundwater (Ca:Na milliequivalent ratio of 1.0). A wa-ter sample was collected from each treat-ment during each irrigation to confirm that the target NO3-N concentrations were achieved. Additionally, an unfertilized control and a fertilized control treatment were included; both were irrigated using water containing only 2 mg/L NO3-N. The fertilized control received five fer-tigations of ammonium nitrate solution (AN-20) totaling 150 lb/ac (168 kg/ha) of N. Also, all treatments were fertilized with potassium thiosulfate (KTS) in two fertigations of 30 lb/ac (34 kg/ha) of K each.
Each N treatment was evaluated at two levels of irrigation to observe the interac-tion between irrigation efficiency and crop uptake of irrigation water NO3-N. The lower level of irrigation, 110% of crop evapotranspiration (ETc), was chosen to represent efficient management with minimal leaching. The higher level of ir-rigation, 160% of ETc, was chosen to repre-sent less efficient irrigation management; we have observed a number of Salinas Valley vegetable fields in which irrigation reached as high as 200% of ETc (Smith et al. 2016). Applying 160% of ETc generated
Calculating the N in irrigation water
Calculation of the amount of nitrogen in irrigation water requires knowledge of both the N concentration and the volume of water applied. Laboratory analysis for nitrate
in water is commonly reported as milligrams per liter (mg/L) or parts per million (ppm); these units are numerically the same: 1 mg/L equals 1 ppm. Labs may report concen-tration either as nitrate (NO3
-) or nitrate-N (NO3-N); the conversion between the two is
NO3- ÷ 4.43 = NO3-N
To convert NO3-N concentration to mass of N applied, this equation can be used:
mg/L NO3-N × 0.227 = lb of N/ac-in of water
Nitrate is usually the only form of N present in irrigation water in an agronomically sig-nificant amount, so it is the only N form reported on the typical water test. However, recycled municipal wastewater, which is increasingly being used for irrigation in Cali-fornia, can contain more ammonium N (NH4-N) than NO3-N, as well as some organic forms of N that become relatively quickly available in soil. Wastewater treatment plants routinely test for these other N sources in addition to NO3-N, and this information is publicly available. One should consider all forms of N when estimating the amount of plant-available N in recycled water.
A manifold and injection system was used to simulate irrigation water with different NO3-N concentrations.
Mik
e Ca
hn
http://calag.ucanr.edu • APRIL–JUNE 2017 63
2 / 6 Item No. 13 Public Comment March 20-22, 2019
Cahn_Cal Ag
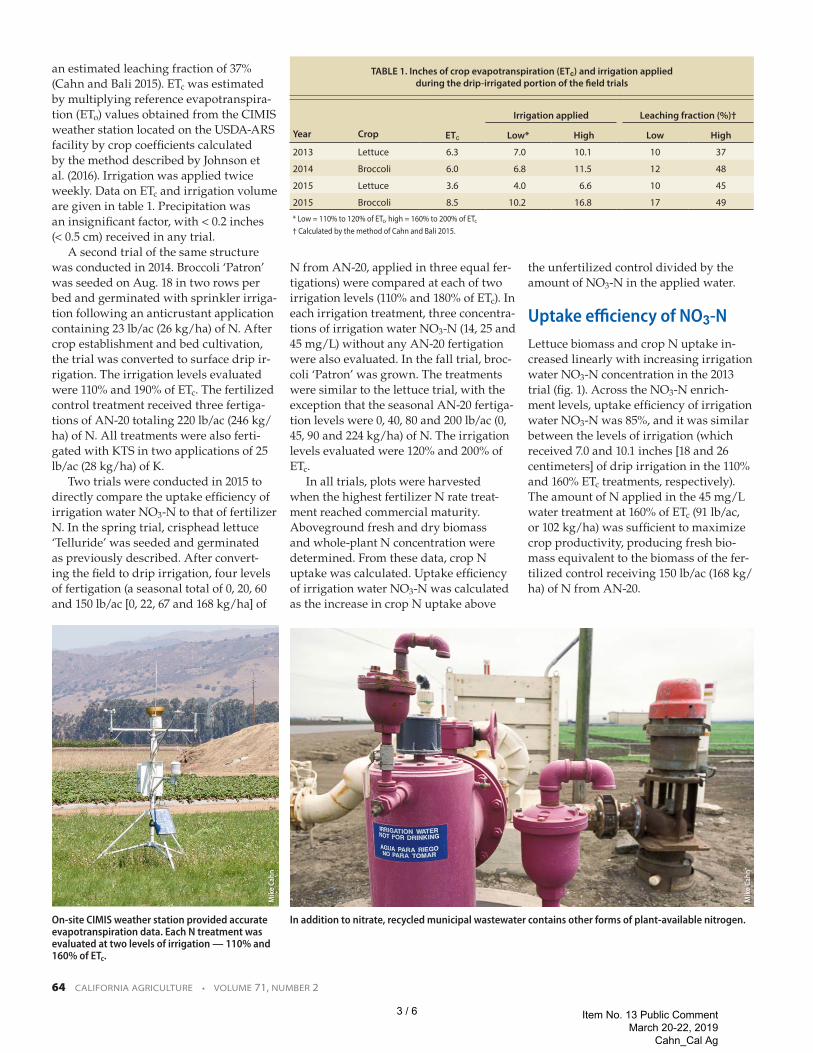
an estimated leaching fraction of 37% (Cahn and Bali 2015). ETc was estimated by multiplying reference evapotranspira-tion (ETo) values obtained from the CIMIS weather station located on the USDA-ARS facility by crop coefficients calculated by the method described by Johnson et al. (2016). Irrigation was applied twice weekly. Data on ETc and irrigation volume are given in table 1. Precipitation was an insignificant factor, with < 0.2 inches (< 0.5 cm) received in any trial.
A second trial of the same structure was conducted in 2014. Broccoli ‘Patron’ was seeded on Aug. 18 in two rows per bed and germinated with sprinkler irriga-tion following an anticrustant application containing 23 lb/ac (26 kg/ha) of N. After crop establishment and bed cultivation, the trial was converted to surface drip ir-rigation. The irrigation levels evaluated were 110% and 190% of ETc. The fertilized control treatment received three fertiga-tions of AN-20 totaling 220 lb/ac (246 kg/ha) of N. All treatments were also ferti-gated with KTS in two applications of 25 lb/ac (28 kg/ha) of K.
Two trials were conducted in 2015 to directly compare the uptake efficiency of irrigation water NO3-N to that of fertilizer N. In the spring trial, crisphead lettuce ‘Telluride’ was seeded and germinated as previously described. After convert-ing the field to drip irrigation, four levels of fertigation (a seasonal total of 0, 20, 60 and 150 lb/ac [0, 22, 67 and 168 kg/ha] of
N from AN-20, applied in three equal fer-tigations) were compared at each of two irrigation levels (110% and 180% of ETc). In each irrigation treatment, three concentra-tions of irrigation water NO3-N (14, 25 and 45 mg/L) without any AN-20 fertigation were also evaluated. In the fall trial, broc-coli ‘Patron’ was grown. The treatments were similar to the lettuce trial, with the exception that the seasonal AN-20 fertiga-tion levels were 0, 40, 80 and 200 lb/ac (0, 45, 90 and 224 kg/ha) of N. The irrigation levels evaluated were 120% and 200% of ETc.
In all trials, plots were harvested when the highest fertilizer N rate treat-ment reached commercial maturity. Aboveground fresh and dry biomass and whole-plant N concentration were determined. From these data, crop N uptake was calculated. Uptake efficiency of irrigation water NO3-N was calculated as the increase in crop N uptake above
the unfertilized control divided by the amount of NO3-N in the applied water.
Uptake efficiency of NO3-N Lettuce biomass and crop N uptake in-creased linearly with increasing irrigation water NO3-N concentration in the 2013 trial (fig. 1). Across the NO3-N enrich-ment levels, uptake efficiency of irrigation water NO3-N was 85%, and it was similar between the levels of irrigation (which received 7.0 and 10.1 inches [18 and 26 centimeters] of drip irrigation in the 110% and 160% ETc treatments, respectively). The amount of N applied in the 45 mg/L water treatment at 160% of ETc (91 lb/ac, or 102 kg/ha) was sufficient to maximize crop productivity, producing fresh bio-mass equivalent to the biomass of the fer-tilized control receiving 150 lb/ac (168 kg/ha) of N from AN-20.
TABLE 1. Inches of crop evapotranspiration (ETc) and irrigation applied during the drip-irrigated portion of the field trials
Irrigation applied Leaching fraction (%)†
Year Crop ETc Low* High Low High
2013 Lettuce 6.3 7.0 10.1 10 37
2014 Broccoli 6.0 6.8 11.5 12 48
2015 Lettuce 3.6 4.0 6.6 10 45
2015 Broccoli 8.5 10.2 16.8 17 49
* Low = 110% to 120% of ETc, high = 160% to 200% of ETc † Calculated by the method of Cahn and Bali 2015.
In addition to nitrate, recycled municipal wastewater contains other forms of plant‐available nitrogen.On-site CIMIS weather station provided accurate evapotranspiration data. Each N treatment was evaluated at two levels of irrigation — 110% and 160% of ETc.
Mik
e Ca
hn
Mik
e Ca
hn
64 CALIFORNIA AGRICULTURE • VOLUME 71, NUMBER 2
3 / 6 Item No. 13 Public Comment March 20-22, 2019
Cahn_Cal Ag
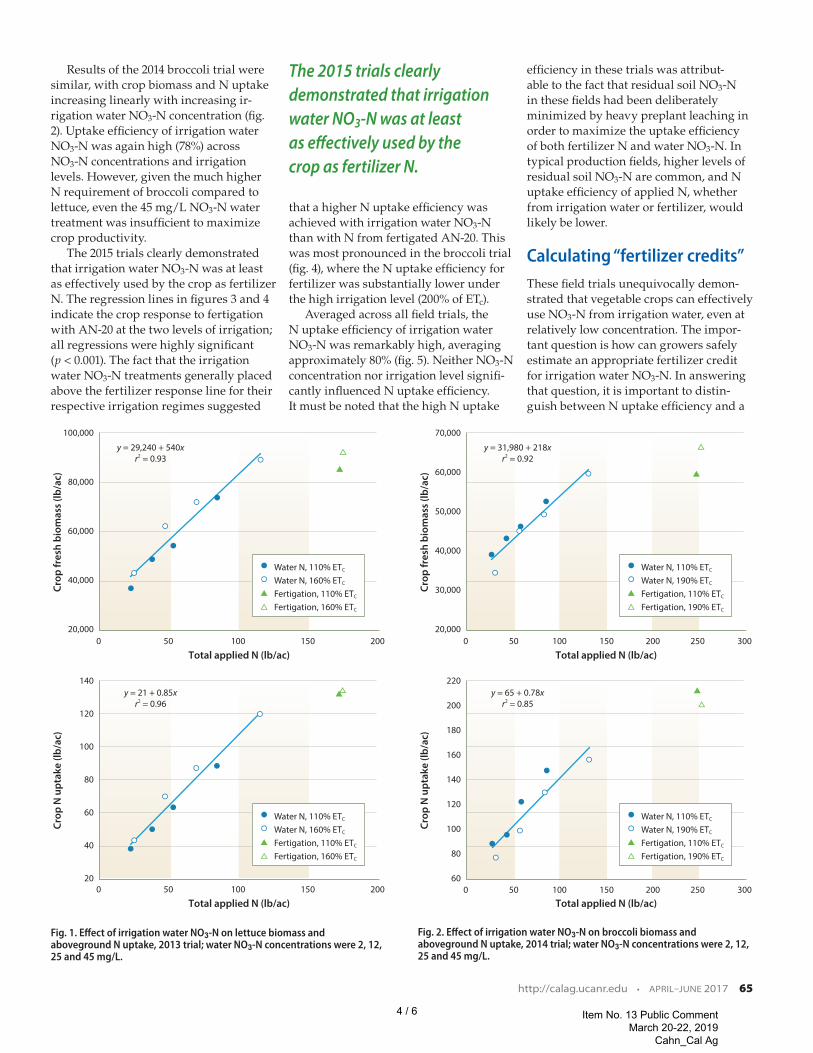
Results of the 2014 broccoli trial were similar, with crop biomass and N uptake increasing linearly with increasing ir-rigation water NO3-N concentration (fig. 2). Uptake efficiency of irrigation water NO3-N was again high (78%) across NO3-N concentrations and irrigation levels. However, given the much higher N requirement of broccoli compared to lettuce, even the 45 mg/L NO3-N water treatment was insufficient to maximize crop productivity.
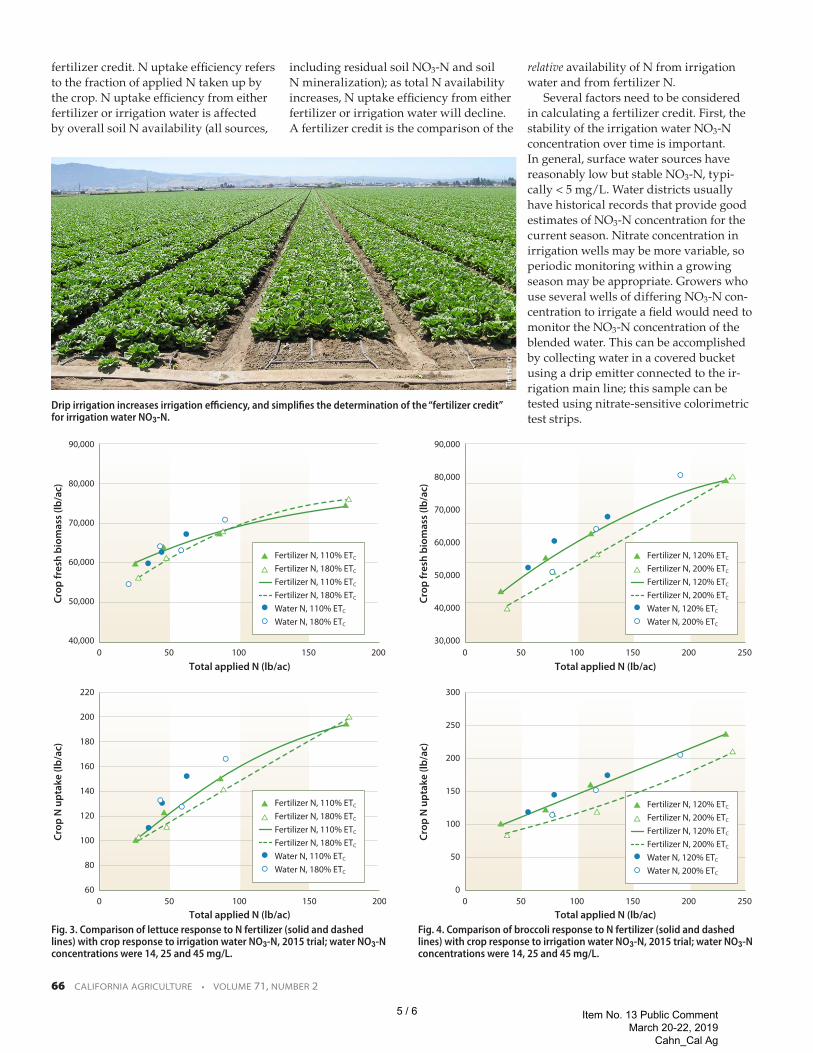
The 2015 trials clearly demonstrated that irrigation water NO3-N was at least as effectively used by the crop as fertilizer N. The regression lines in figures 3 and 4 indicate the crop response to fertigation with AN-20 at the two levels of irrigation; all regressions were highly significant (p < 0.001). The fact that the irrigation water NO3-N treatments generally placed above the fertilizer response line for their respective irrigation regimes suggested
that a higher N uptake efficiency was achieved with irrigation water NO3-N than with N from fertigated AN-20. This was most pronounced in the broccoli trial (fig. 4), where the N uptake efficiency for fertilizer was substantially lower under the high irrigation level (200% of ETc).
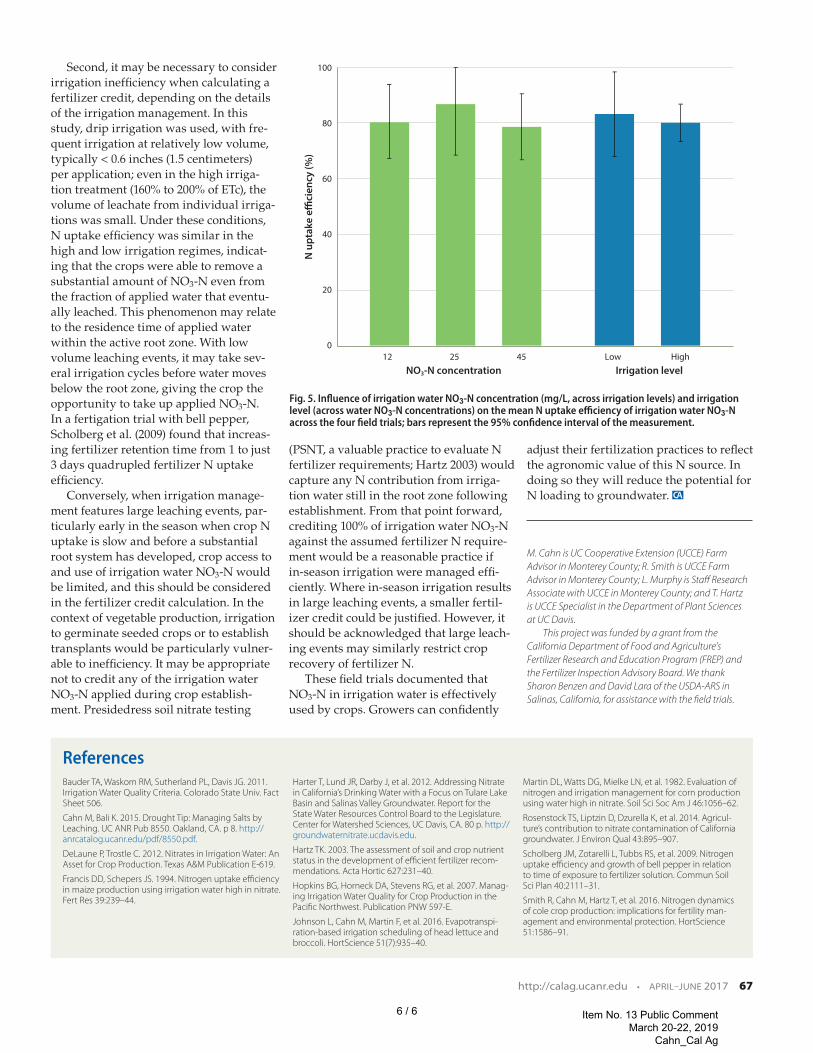
Averaged across all field trials, the N uptake efficiency of irrigation water NO3-N was remarkably high, averaging approximately 80% (fig. 5). Neither NO3-N concentration nor irrigation level signifi-cantly influenced N uptake efficiency. It must be noted that the high N uptake
efficiency in these trials was attribut-able to the fact that residual soil NO3-N in these fields had been deliberately minimized by heavy preplant leaching in order to maximize the uptake efficiency of both fertilizer N and water NO3-N. In typical production fields, higher levels of residual soil NO3-N are common, and N uptake efficiency of applied N, whether from irrigation water or fertilizer, would likely be lower.
Calculating “fertilizer credits” These field trials unequivocally demon-strated that vegetable crops can effectively use NO3-N from irrigation water, even at relatively low concentration. The impor-tant question is how can growers safely estimate an appropriate fertilizer credit for irrigation water NO3-N. In answering that question, it is important to distin-guish between N uptake efficiency and a
Water N, 110% ETC
Water N, 160% ETC
Fertigation, 110% ETC
Fertigation, 160% ETC
Water N, 110% ETC
Water N, 160% ETC
Fertigation, 110% ETC
Fertigation, 160% ETC
0 50 100 150 200
Crop
fres
h bi
omas
s (lb
/ac)
Total applied N (lb/ac)
20,000
40,000
60,000
80,000
100,000
0 50 100 150 200
Crop
N u
ptak
e (lb
/ac)
Total applied N (lb/ac)
20
40
60
80
100
120
140y = 21 + 0.85x
r2 = 0.96
y = 29,240 + 540xr2 = 0.93
Water N, 110% ETC
Water N, 190% ETC
Fertigation, 110% ETC
Fertigation, 190% ETC
Water N, 110% ETC
Water N, 190% ETC
Fertigation, 110% ETC
Fertigation, 190% ETC
0 50 100 150 200 250 300
0 50 100 150 200 250 300
Crop
fres
h bi
omas
s (lb
/ac)
Total applied N (lb/ac)
20,000
40,000
30,000
50,000
60,000
70,000Cr
op N
upt
ake
(lb/a
c)
Total applied N (lb/ac)
60
100
80
120
140
160
200
180
220y = 65 + 0.78x
r2 = 0.85
y = 31,980 + 218xr2 = 0.92
Fig. 1. Effect of irrigation water NO3-N on lettuce biomass and aboveground N uptake, 2013 trial; water NO3-N concentrations were 2, 12, 25 and 45 mg/L.
Fig. 2. Effect of irrigation water NO3-N on broccoli biomass and aboveground N uptake, 2014 trial; water NO3-N concentrations were 2, 12, 25 and 45 mg/L.
The 2015 trials clearly demonstrated that irrigation water NO3-N was at least as effectively used by the crop as fertilizer N.
http://calag.ucanr.edu • APRIL–JUNE 2017 65
4 / 6 Item No. 13 Public Comment March 20-22, 2019
Cahn_Cal Ag
fertilizer credit. N uptake efficiency refers to the fraction of applied N taken up by the crop. N uptake efficiency from either fertilizer or irrigation water is affected by overall soil N availability (all sources,
including residual soil NO3-N and soil N mineralization); as total N availability increases, N uptake efficiency from either fertilizer or irrigation water will decline. A fertilizer credit is the comparison of the
relative availability of N from irrigation water and from fertilizer N.
Several factors need to be considered in calculating a fertilizer credit. First, the stability of the irrigation water NO3-N concentration over time is important. In general, surface water sources have reasonably low but stable NO3-N, typi-cally < 5 mg/L. Water districts usually have historical records that provide good estimates of NO3-N concentration for the current season. Nitrate concentration in irrigation wells may be more variable, so periodic monitoring within a growing season may be appropriate. Growers who use several wells of differing NO3-N con-centration to irrigate a field would need to monitor the NO3-N concentration of the blended water. This can be accomplished by collecting water in a covered bucket using a drip emitter connected to the ir-rigation main line; this sample can be tested using nitrate-sensitive colorimetric test strips.
Fertilizer N, 110% ETC
Fertilizer N, 180% ETC
Fertilizer N, 110% ETC
Fertilizer N, 180% ETC
Water N, 110% ETC
Water N, 180% ETC
Fertilizer N, 110% ETC
Fertilizer N, 180% ETC
Fertilizer N, 110% ETC
Fertilizer N, 180% ETC
Water N, 110% ETC
Water N, 180% ETC
0 50 100 150 200
0 50 100 150 200
Crop
fres
h bi
omas
s (lb
/ac)
Total applied N (lb/ac)
40,000
60,000
50,000
70,000
80,000
90,000
Crop
N u
ptak
e (lb
/ac)
Total applied N (lb/ac)
60
100
80
120
140
160
200
180
220
Fertilizer N, 120% ETC
Fertilizer N, 200% ETC
Fertilizer N, 120% ETC
Fertilizer N, 200% ETC
Water N, 120% ETC
Water N, 200% ETC
Fertilizer N, 120% ETC
Fertilizer N, 200% ETC
Fertilizer N, 120% ETC
Fertilizer N, 200% ETC
Water N, 120% ETC
Water N, 200% ETC
0 50 100 150 200 250
0 50 100 150 250200
Crop
fres
h bi
omas
s (lb
/ac)
Total applied N (lb/ac)
30,000
40,000
60,000
50,000
70,000
80,000
90,000
Crop
N u
ptak
e (lb
/ac)
Total applied N (lb/ac)
0
50
100
150
250
200
300
Fig. 3. Comparison of lettuce response to N fertilizer (solid and dashed lines) with crop response to irrigation water NO3-N, 2015 trial; water NO3-N concentrations were 14, 25 and 45 mg/L.
Fig. 4. Comparison of broccoli response to N fertilizer (solid and dashed lines) with crop response to irrigation water NO3-N, 2015 trial; water NO3-N concentrations were 14, 25 and 45 mg/L.
Drip irrigation increases irrigation efficiency, and simplifies the determination of the “fertilizer credit” for irrigation water NO3‐N.
Tim
Har
tz
66 CALIFORNIA AGRICULTURE • VOLUME 71, NUMBER 2
5 / 6 Item No. 13 Public Comment March 20-22, 2019
Cahn_Cal Ag
Second, it may be necessary to consider irrigation inefficiency when calculating a fertilizer credit, depending on the details of the irrigation management. In this study, drip irrigation was used, with fre-quent irrigation at relatively low volume, typically < 0.6 inches (1.5 centimeters) per application; even in the high irriga-tion treatment (160% to 200% of ETc), the volume of leachate from individual irriga-tions was small. Under these conditions, N uptake efficiency was similar in the high and low irrigation regimes, indicat-ing that the crops were able to remove a substantial amount of NO3-N even from the fraction of applied water that eventu-ally leached. This phenomenon may relate to the residence time of applied water within the active root zone. With low volume leaching events, it may take sev-eral irrigation cycles before water moves below the root zone, giving the crop the opportunity to take up applied NO3-N. In a fertigation trial with bell pepper, Scholberg et al. (2009) found that increas-ing fertilizer retention time from 1 to just 3 days quadrupled fertilizer N uptake efficiency.
Conversely, when irrigation manage-ment features large leaching events, par-ticularly early in the season when crop N uptake is slow and before a substantial root system has developed, crop access to and use of irrigation water NO3-N would be limited, and this should be considered in the fertilizer credit calculation. In the context of vegetable production, irrigation to germinate seeded crops or to establish transplants would be particularly vulner-able to inefficiency. It may be appropriate not to credit any of the irrigation water NO3-N applied during crop establish-ment. Presidedress soil nitrate testing
(PSNT, a valuable practice to evaluate N fertilizer requirements; Hartz 2003) would capture any N contribution from irriga-tion water still in the root zone following establishment. From that point forward, crediting 100% of irrigation water NO3-N against the assumed fertilizer N require-ment would be a reasonable practice if in-season irrigation were managed effi-ciently. Where in-season irrigation results in large leaching events, a smaller fertil-izer credit could be justified. However, it should be acknowledged that large leach-ing events may similarly restrict crop recovery of fertilizer N.
These field trials documented that NO3-N in irrigation water is effectively used by crops. Growers can confidently
adjust their fertilization practices to reflect the agronomic value of this N source. In doing so they will reduce the potential for N loading to groundwater. c
M. Cahn is UC Cooperative Extension (UCCE) Farm Advisor in Monterey County; R. Smith is UCCE Farm Advisor in Monterey County; L. Murphy is Staff Research Associate with UCCE in Monterey County; and T. Hartz is UCCE Specialist in the Department of Plant Sciences at UC Davis.
This project was funded by a grant from the California Department of Food and Agriculture’s Fertilizer Research and Education Program (FREP) and the Fertilizer Inspection Advisory Board. We thank Sharon Benzen and David Lara of the USDA-ARS in Salinas, California, for assistance with the field trials.
References Bauder TA, Waskom RM, Sutherland PL, Davis JG. 2011. Irrigation Water Quality Criteria. Colorado State Univ. Fact Sheet 506.
Cahn M, Bali K. 2015. Drought Tip: Managing Salts by Leaching. UC ANR Pub 8550. Oakland, CA. p 8. http://anrcatalog.ucanr.edu/pdf/8550.pdf.
DeLaune P, Trostle C. 2012. Nitrates in Irrigation Water: An Asset for Crop Production. Texas A&M Publication E-619.
Francis DD, Schepers JS. 1994. Nitrogen uptake efficiency in maize production using irrigation water high in nitrate. Fert Res 39:239–44.
Harter T, Lund JR, Darby J, et al. 2012. Addressing Nitrate in California’s Drinking Water with a Focus on Tulare Lake Basin and Salinas Valley Groundwater. Report for the State Water Resources Control Board to the Legislature. Center for Watershed Sciences, UC Davis, CA. 80 p. http://groundwaternitrate.ucdavis.edu.
Hartz TK. 2003. The assessment of soil and crop nutrient status in the development of efficient fertilizer recom-mendations. Acta Hortic 627:231–40.
Hopkins BG, Horneck DA, Stevens RG, et al. 2007. Manag-ing Irrigation Water Quality for Crop Production in the Pacific Northwest. Publication PNW 597-E.
Johnson L, Cahn M, Martin F, et al. 2016. Evapotranspi-ration-based irrigation scheduling of head lettuce and broccoli. HortScience 51(7):935–40.
Martin DL, Watts DG, Mielke LN, et al. 1982. Evaluation of nitrogen and irrigation management for corn production using water high in nitrate. Soil Sci Soc Am J 46:1056–62.
Rosenstock TS, Liptzin D, Dzurella K, et al. 2014. Agricul-ture’s contribution to nitrate contamination of California groundwater. J Environ Qual 43:895–907.
Scholberg JM, Zotarelli L, Tubbs RS, et al. 2009. Nitrogen uptake efficiency and growth of bell pepper in relation to time of exposure to fertilizer solution. Commun Soil Sci Plan 40:2111–31.
Smith R, Cahn M, Hartz T, et al. 2016. Nitrogen dynamics of cole crop production: implications for fertility man-agement and environmental protection. HortScience 51:1586–91.
12 25 45 Low High
N u
ptak
e e�
cien
cy (%
)
NO3-N concentration Irrigation level
0
100
20
40
60
80
Fig. 5. Influence of irrigation water NO3-N concentration (mg/L, across irrigation levels) and irrigation level (across water NO3-N concentrations) on the mean N uptake efficiency of irrigation water NO3-N across the four field trials; bars represent the 95% confidence interval of the measurement.
http://calag.ucanr.edu • APRIL–JUNE 2017 67
6 / 6 Item No. 13 Public Comment March 20-22, 2019
Cahn_Cal Ag
Dry matter and nitrogen content of various vegetables produced on the central coast
Michael Cahn and Richard Smith
UC Cooperative Extension, Monterey County
The dry matter and nitrogen content of economically significant vegetables produced on the central coast are summarized in Table 1. These data were compiled from studies in commercial fields conducted during the last 15 years on the central coast. The values presented in Table 1 can be used to estimate the N removed from the marketable portion of crop using the following equation:
N removed (lbs N/acre) =
Marketable Yield (lbs/acre) × % dry matter content × % N content ÷ 10,000
Example: Marketable yield of iceberg lettuce = 43,000 lbs/acre
N removed = 43,000 lbs/acre × 4.7% × 3.5% ÷ 10,000 = 71 lbs N/acre
Note that for leafy green vegetables listed in Table 1, we have determined the dry matter and N content of the above ground biomass rather than only the harvested portion of the crop. Although these values for the above ground and marketable portions are likely very similar, we plan to conduct further studies to verify that this assumption is true. We are also continuing to evaluate the N uptake of additional vegetable commodities grown on the central coast, such as artichoke, carrots, peas, and onions during the 2019 season.
1 / 3 Item No. 13 Public Comment March 20-22, 2019
Cahn_N content
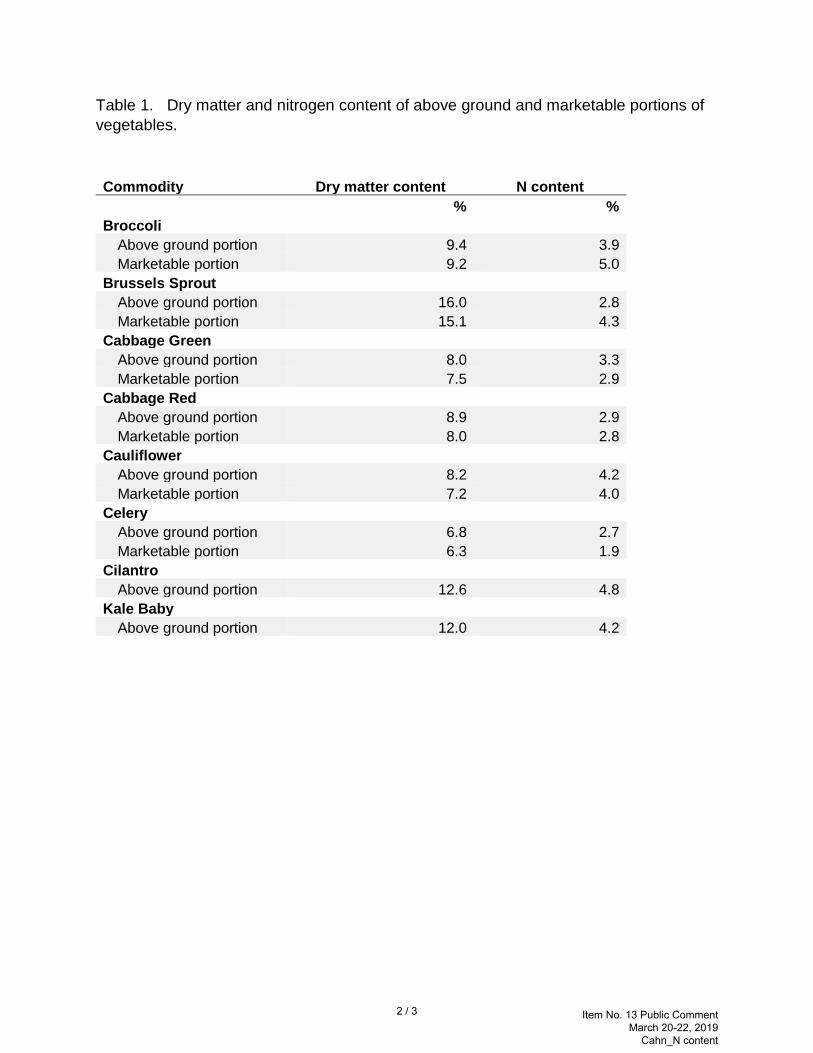
Table 1. Dry matter and nitrogen content of above ground and marketable portions of vegetables.
Commodity Dry matter content N content % % Broccoli
Above ground portion 9.4 3.9 Marketable portion 9.2 5.0
Brussels Sprout Above ground portion 16.0 2.8 Marketable portion 15.1 4.3
Cabbage Green Above ground portion 8.0 3.3 Marketable portion 7.5 2.9
Cabbage Red Above ground portion 8.9 2.9 Marketable portion 8.0 2.8
Cauliflower Above ground portion 8.2 4.2 Marketable portion 7.2 4.0
Celery Above ground portion 6.8 2.7 Marketable portion 6.3 1.9
Cilantro Above ground portion 12.6 4.8
Kale Baby Above ground portion 12.0 4.2
2 / 3 Item No. 13 Public Comment March 20-22, 2019
Cahn_N content
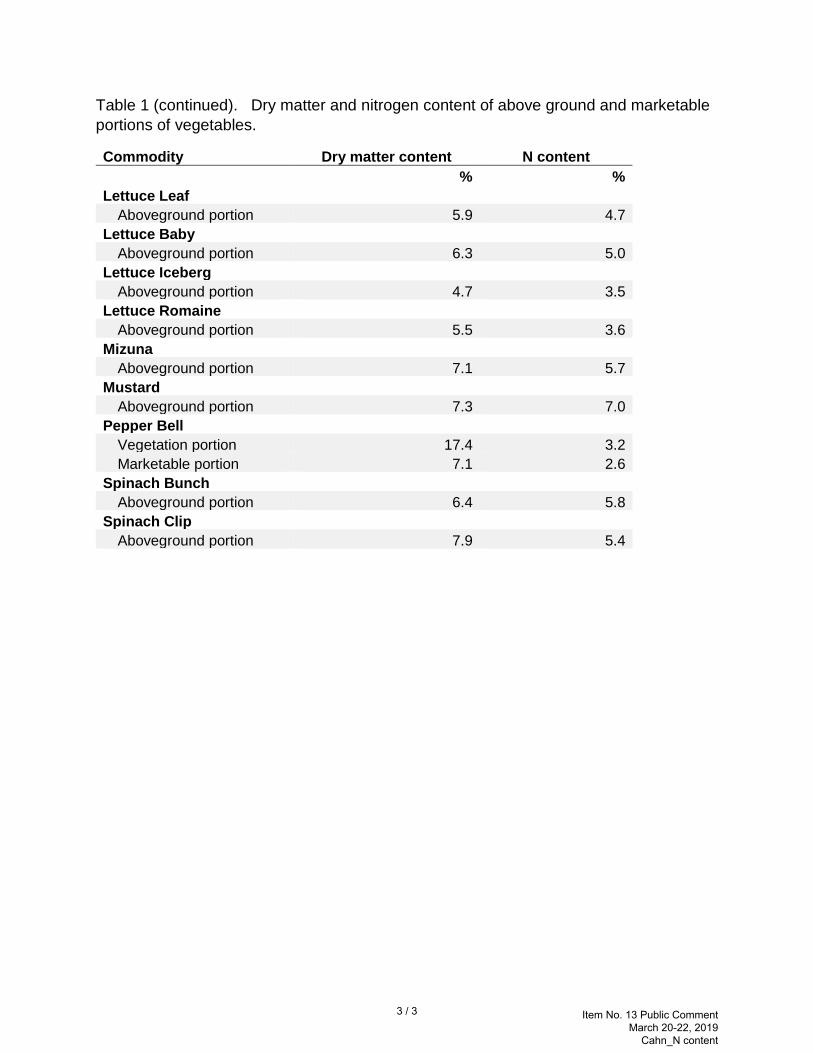
Table 1 (continued). Dry matter and nitrogen content of above ground and marketable portions of vegetables.
Commodity Dry matter content N content % % Lettuce Leaf
Aboveground portion 5.9 4.7 Lettuce Baby
Aboveground portion 6.3 5.0 Lettuce Iceberg
Aboveground portion 4.7 3.5 Lettuce Romaine
Aboveground portion 5.5 3.6 Mizuna
Aboveground portion 7.1 5.7 Mustard
Aboveground portion 7.3 7.0 Pepper Bell
Vegetation portion 17.4 3.2 Marketable portion 7.1 2.6
Spinach Bunch Aboveground portion 6.4 5.8
Spinach Clip Aboveground portion 7.9 5.4
3 / 3 Item No. 13 Public Comment March 20-22, 2019
Cahn_N content