by j. kent crawford and david r. lenat - usgs
TRANSCRIPT
EFFECTS OF LAND USE ON THE WATER QUALITY AND BIOTA OF THREE
STREAMS IN THE PIEDMONT PROVINCE OF NORTH CAROLINA
By J. Kent Crawford and David R. Lenat
U.S. GEOLOGICAL SURVEY
Water-Resources Investigations Report 89-4007
Prepared in cooperation with the
NORTH CAROLINA DEPARTMENT OF NATURAL RESOURCES AND COMMUNITY DEVELOPMENT
Raleigh, North Carolina
1989
DEPARTMENT OF THE INTERIOR
MANUEL LUJAN, JR., Secretary
U.S. GEOLOGICAL SURVEY
Dallas L. Peck, Director
For additional information, write to:
District ChiefU.S. Geological SurveyPost Office Box 2857Raleigh, North Carolina 27602
Copies of this report may be purchased from:
Books and Open-File Reports U.S. Geological Survey Federal Center, Building 810 Box 25425 Denver, Colorado 80225
CONTENTS
Page
Abstract ............................................................. 1
Introduction ......................................................... 2
Purpose and scope ............................................... 2
Previous investigations ......................................... 4
Acknowledgments ................................................. 9
Methods of investigation ............................................. 9
Watershed selection ............................................. 9
Suspended sediment .............................................. 10
Bottom material ................................................. 11
Water chemistry ................................................. 13
Interstitial water .............................................. 13
Aquatic invertebrates ........................................... 17
Kick-net sampling .......................................... 17
Standardized qualitative sampling .......................... 18
Fish ............................................................ 18
Land use and soils in the study watersheds ........................... 19
Land use ........................................................ 19
Soils ........................................................... 21
Water quality ........................................................ 22
Suspended sediment .............................................. 22
Bottom material ................................................. 24
General water-quality properties ................................ 29
Nutrients ....................................................... 32
Trace metals .................................................... 34
Interstitial water .............................................. 38
Aquatic invertebrates ................................................ 39
Taxa richness ................................................... 39
Abundance ....................................................... 44
Number of unique taxa ........................................... 45
Species level data .............................................. 47
Feeding type .................................................... 51
Fish ................................................................. 52
Effects of land use on water quality and biota ....................... 55
Summary .............................................................. 56
References ........................................................... 59
111
ILLUSTRATIONS
Page
Figure 1. Map showing the location of study watersheds .............. 3
2. Graph showing the relations between manually sampled and
automatically sampled suspended-sediment.
concentrations in the study watersheds .................. 23
3. Graph showing the relations between suspended-sediment
discharge and stream discharge for
the study watersheds .................................... 25
TABLES
Page
Table 1. Chemical analyses performed on stream samples during
this study ............................................... 14
2. Land use in the study watersheds, 1981-82 .................. 19
3. Annual suspended-sediment loads and yields for the period
February 1984 to January 1985 for the study watersheds ... 26
4. Size distribution of bottom material in the study
watersheds ............................................... 26
5. Chemical analyses of stream-bottom material ................ 27
6. Classification scheme for metals in stream sediments ....... 28
7. Summary statistics for general water-quality characteristics
of stream water from the study watersheds ................ 30
8. Summary statistics for nutrient concentrations in stream
water from the study watersheds .......................... 33
9. Summary of results for mean nutrientj concentrations in
the study streams as related to watershed land use ....... 33
10. Summary statistics for dissolved metal concentrations in
stream water from the study watersheds ................... 35
11. Summary statistics for total metal concentrations in stream
water from the study watersheds .......................... 36
12. Results of completely randomized on^-way analyses of variance
for tests of differences between Concentrations
of metals in the study streams ........................... 37
13. Results of nutrient analyses of interstitial water and
near-bottom water from the study watersheds .............. 38
14. Mean taxa richness for invertebrate collections from the
study watersheds 40
IV
Page
15. Total taxa richness for invertebrate collections from the
study watersheds ......................................... 42
16. Reduction in taxa richness for streams draining agricultural
and urban watersheds, compared to the stream draining
the forested watershed ................................... 43
17. Percentage of invertebrate communities from Piedmont streams
contributed by various groups of organisms ............... 46
18. Numbers of unique taxa in invertebrate collections from
the study watersheds ..................................... 47
19. Comparisons of common and abundant species of macro-
invertebrates from the study watersheds .................. 48
20. Dominant species of macroinvertebrates in the study
watersheds ............................................... 49
21. Percentage composition by feeding type of invertebrate
communities in the study watersheds ...................... 51
22. Summary of combined fish collections from the study
watersheds ............................................... 52
23. Maximum length for selected fish species collected from
the study watersheds ..................................... 53
24. Mean weight for selected fish species collected from
the study watersheds ..................................... 54
25. Summary of findings on relative quality of stream water,
sediments, and biota for the study watersheds ............ 55
v
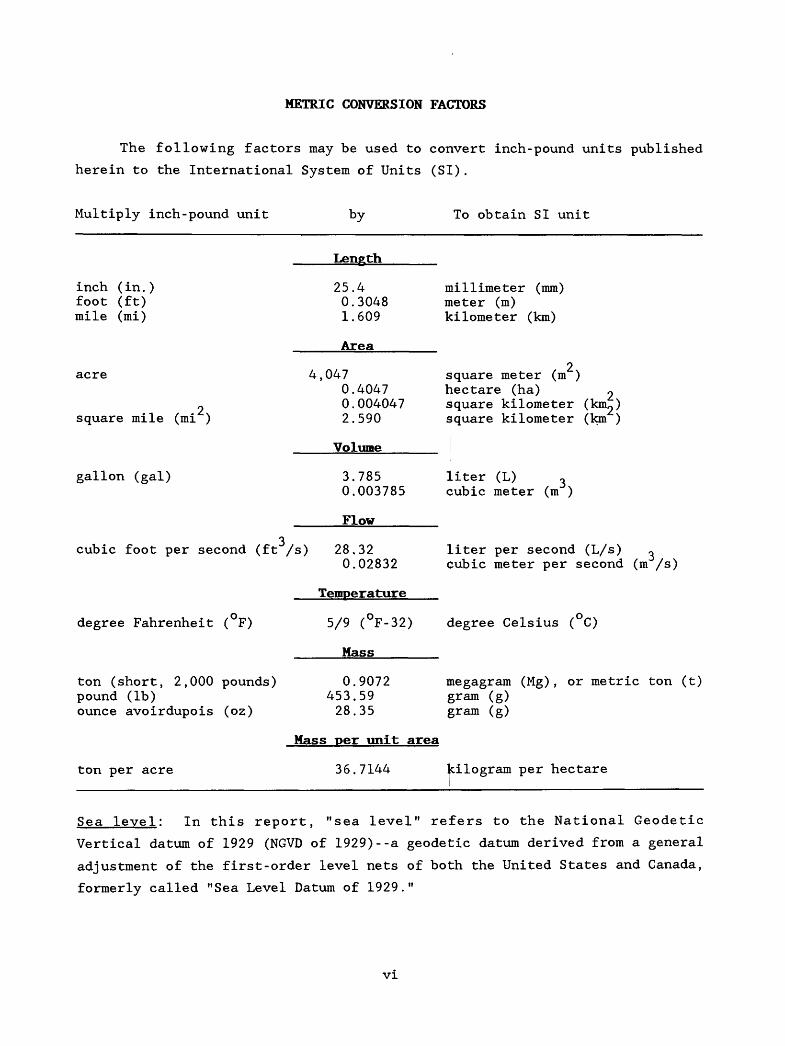
METRIC CONVERSION FACTORS
The following factors may be used to convert inch-pound units published
herein to the International System of Units (SI).
Multiply inch-pound unit by To obtain SI unit
Length
inch (in.)foot (ft)mile (mi)
25.40.30481.609
Area
acre
2 square mile (mi )
gallon (gal)
4,0470.40470.0040472.590
Volume
3.7850.003785
Flow
cubic foot per second (ft /s) 28.320.02832
Temperature
degree Fahrenheit ( F)
ton (short, 2,000 pounds)pound (Ib)ounce avoirdupois (oz)
ton per acre
5/9 (°F-32)
Mass____
millimeter (mm) meter (m) kilometer (km)
quare meter (m ) hectare (ha) «quare kilometer (km,,) Square kilometer (km )
liter (L) ~ cubic meter (m )
liter per second (L/s) ^ cubic meter per second (m /s)
degree Celsius ( C)
0.9072453.5928.35
Mass per unit area
36.7144
megagram (Mg), or metric ton (t) gram (g) gram (g)
kilogram per hectare
Sea level: In this report, "sea level" re fers to the National Geodetic
Vertical datum of 1929 (NGVD of 1929)--a geodetic datum derived from a general
adjustment of the first-order level nets of both the United States and Canada,
formerly called "Sea Level Datum of 1929."
VI
EFFECTS OF LAND USE ON WATER QUALITY AND BIOTA OF THREE STREAMS
IN THE PIEDMONT PROVINCE OF NORTH CAROLINA
By J. Kent Crawford 1 and David R. Lenat 2
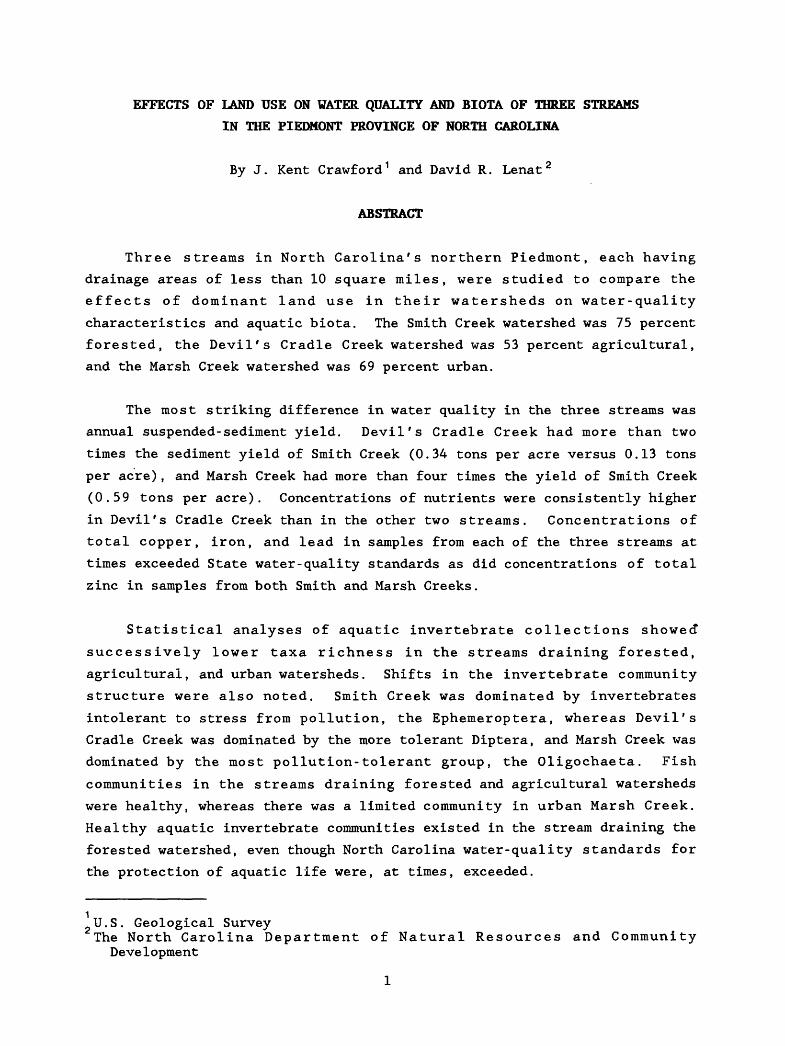
ABSTRACT
Three streams in North Carolina's northern Piedmont, each having
drainage areas of less than 10 square miles, were studied to compare the
effects of dominant land use in their watersheds on water-quality
characteristics and aquatic biota. The Smith Creek watershed was 75 percent
forested, the Devil's Cradle Creek watershed was 53 percent agricultural,
and the Marsh Creek watershed was 69 percent urban.
The most striking difference in water quality in the three streams was
annual suspended-sediment yield. Devil's Cradle Creek had more than two
times the sediment yield of Smith Creek (0.34 tons per acre versus 0.13 tons
per acre), and Marsh Creek had more than four times the yield of Smith Creek
(0.59 tons per acre). Concentrations of nutrients were consistently higher
in Devil's Cradle Creek than in the other two streams. Concentrations of
total copper, iron, and lead in samples from each of the three streams at
times exceeded State water-quality standards as did concentrations of total
zinc in samples from both Smith and Marsh Creeks.
Statistical analyses of aquatic invertebrate collections showed
successively lower taxa richness in the streams draining forested,
agricultural, and urban watersheds. Shifts in the invertebrate community
structure were also noted. Smith Creek was dominated by invertebrates
intolerant to stress from pollution, the Ephemeroptera, whereas Devil's
Cradle Creek was dominated by the more tolerant Diptera, and Marsh Creek was
dominated by the most pollution-tolerant group, the Oligochaeta. Fish
communities in the streams draining forested and agricultural watersheds
were healthy, whereas there was a limited community in urban Marsh Creek.
Healthy aquatic invertebrate communities existed in the stream draining the
forested watershed, even though North Carolina water-quality standards for
the protection of aquatic life were, at times, exceeded.
2 U.S. Geological SurveyThe North Carolina Department of Natural Resources and Community
Development
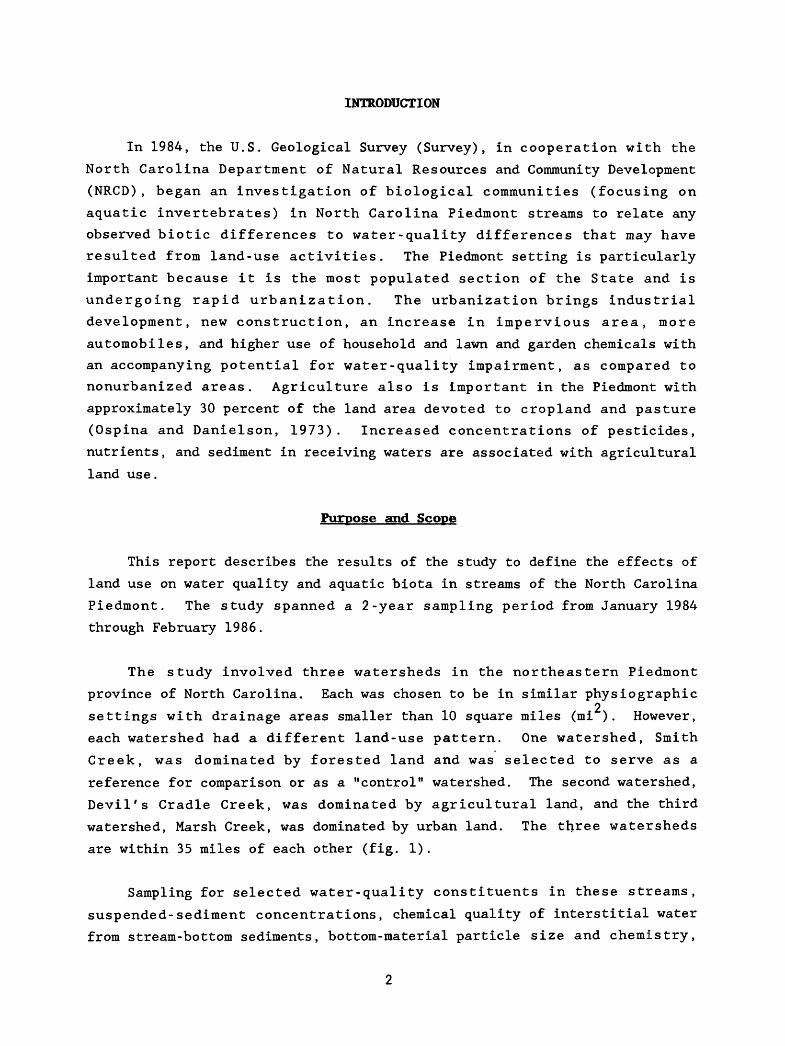
INTRODUCTION
In 1984, the U.S. Geological Survey (Survey), in cooperation with the
North Carolina Department of Natural Resources and Community Development
(NRCD), began an investigation of biological communities (focusing on
aquatic invertebrates) in North Carolina Piedmont streams to relate any
observed biotic differences to water-quality differences that may have
resulted from land-use activities. The Piedmont setting is particularly
important because it is the most populated section of the State and is
undergoing rapid urbanization. The urbanization brings industrial
development, new construction, an increase in impervious area, more
automobiles, and higher use of household and lawn and garden chemicals with
an accompanying potential for water-quality impairment, as compared to
nonurbanized areas. Agriculture also is important in the Piedmont with
approximately 30 percent of the land area devoted to cropland and pasture
(Ospina and Danielson, 1973). Increased concentrations of pesticides,
nutrients, and sediment in receiving waters are associated with agricultural
land use.
Purpose and Scope
This report describes the results of the study to define the effects of
land use on water quality and aquatic biota in streams of the North Carolina
Piedmont. The study spanned a 2-year sampling period from January 1984
through February 1986.
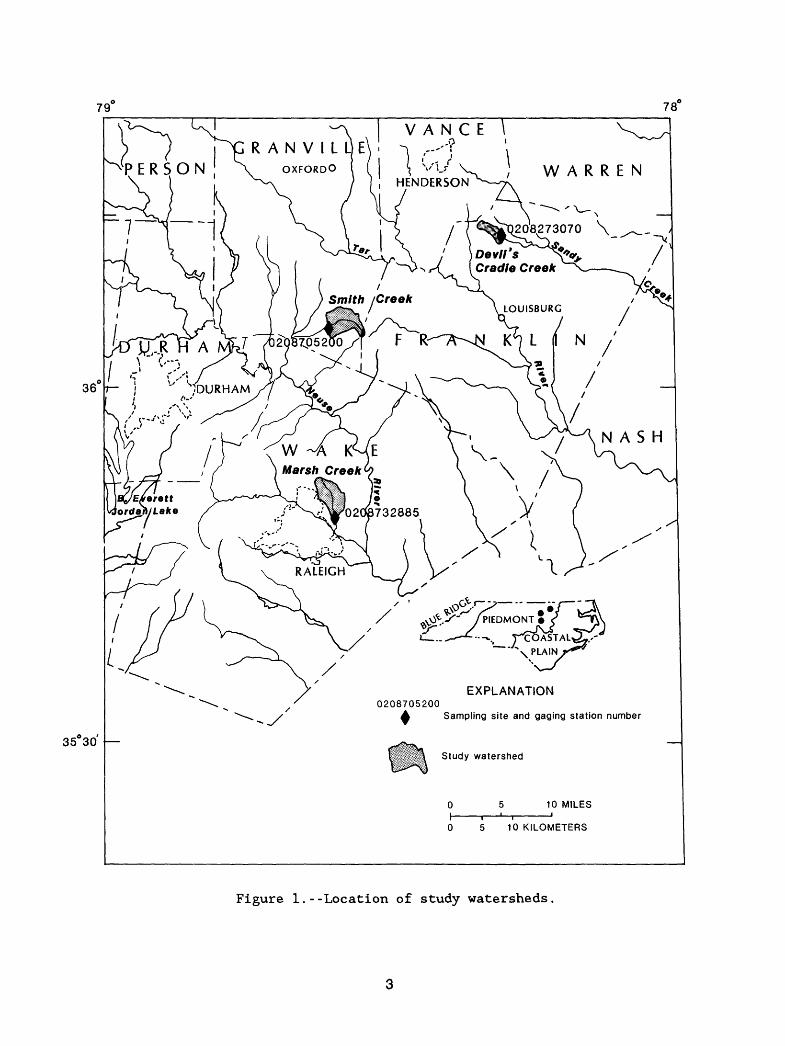
The study involved three watersheds in the northeastern Piedmont
province of North Carolina. Each was chosen to be in similar physiographic2 settings with drainage areas smaller than 10 square miles (mi ). However,
each watershed had a different land-use pattern. One watershed, Smith
Creek, was dominated by forested land and was selected to serve as a
reference for comparison or as a "control" watershed. The second watershed,
Devil's Cradle Creek, was dominated by agricultural land, and the third
watershed, Marsh Creek, was dominated by urban land. The three watersheds
are within 35 miles of each other (fig. 1) .
Sampling for selected water-quality constituents in these streams,
suspended-sediment concentrations, chemical quality of interstitial water
from stream-bottom sediments, bottom-material particle size and chemistry,
A N C E 1
WARRENHENDERSON
2018273070 \
Cradle Creek
Smith /Creek
rBZP5200 /T F R
Marsh Creek
erett ordaTl/Lake
\PLAIN N^->
EXPLANATION0208705200
A Sampling site and gaging station number
Study watershed
0 5 10 KILOMETERS
35 30
Figure 1.--Location of study watersheds.
macroinvertebrate communities, and fish populations at each site was
scheduled for a 1-year period. During January and February of 1984, stream-
gaging stations were installed at each site for continuous monitoring of
stream discharge. Water-quality sampling began in February 1984. Most of
the needed data were on hand at the end of the 1-year sampling period, but
interstitial water sampling, bottom-material sampling, and high-flow
suspended-sediment sampling could not be completed until the fall of 1985.
The final sampling of fish populations at the three sites was conducted in
February 1986.
For this study, NRCD collected all the biological data and the Survey
collected the data on water quality, sediments, interstitial water, and
stream discharge. Biological laboratory work was handled by NRCD; the
Survey conducted laboratory chemical analyses.
Previous Investigations
As land use in Piedmont watersheds changes from a pristine, forested
setting to agricultural and urban uses, stream-water quality and the
biological community of the streams change. Various researchers have
examined relations between land use and stream-water quality. Previous
investigations summarized in the paragraphs that follow will consider, in
turn, studies dealing with sediment, those dealing with agricultural
effects, and those focusing on urban effects. None of the studies to date
have integrated land use, water quality, and biota in a detailed examination
of the relations between these three components.
Sediment has received most of the attention given to studies of water-
quality changes resulting from land use changes. Many studies have shown
that land use is a major determinant of stream sediment. For example, the
Soil Conservation Service (U.S. Department of Agriculture, 1977) has shown
that erosion in North Carolina is strongly influenced by land use, with the
highest erosion rates being associated with construction activities. They
found that erosion rates from highway construction sites were 300 times
greater than those from forested land. Erosion rates from roadsides and
general construction activities were more than 50 times greater than those
from forested land; rates from cropland and general urban areas were,
respectively, about 10 and 4 times greater than those from forested land.
Pasture land had erosion rates slightly less than general urban areas.
Other investigators have related land use to the quantity of sediment
delivered to streams. Simmons (1976, p. 18) estimated that "... about 30 to
40 percent of these eroded soils become waterborne sediment in streams." He
showed that basins in the North Carolina Piedmont with a higher percentage
of forest cover than other basins have lower annual suspended-sediment
yields. Lietman and others (1983) showed that suspended-sediment
concentrations during storms were higher in drainage from a cornfield than
in drainage from a residential area or pasture land. Therefore, it has been
established that land use is a major factor in determining sediment
concentrations in streams.
Unstable sand deposits are not suitable substrate for most stream life.
When sediment blankets the normal rocky substrate, diversity and
productivity of benthic macroinvertebrates is reduced. Fish are also
affected, especially through a reduction in suitable habitat for
reproduction and survival (Karr, 1981).
The clay soils typical of the Piedmont are highly erodible. Once
eroded, the fine clay-sized particles stay in suspension longer than larger
sand particles. They also adsorb trace metals (Wilber and Hunter, 1979;
Horowitz, 1985; Demas and Curwick, 1986) and organic compounds (Sartor and
others, 1974; Feltz, 1980; Kites and Lopez-Avila, 1980) and can dominate the
transport of these substances, some of which are potentially harmful.
Erosion control measures and best-management practices can reduce the
amount of sediment reaching streams. Agricultural operations have been
shown to be particularly amenable to erosion and sediment reduction. For
example, Atkins (1984) reported dramatic reductions in mobilization and
delivery of both coarse and fine suspended sediment at a farm site where
best management practices were used compared to a nearby farm without best-
management practices. Lenat (1984) found lower erosion rates and healthier
macroinvertebrate communities in well managed versus poorly managed
agricultural watersheds. Both of these studies included data from areas in
the Piedmont of North Carolina.
The North Carolina Department of Natural Resources and Community
Development has declared sediment and its effects on stream environments to
be the most widespread water-quality problem in North Carolina (North
Carolina Department of Natural Resources and Community Development, 1979).
However, our understanding of the chemical quality of sediments and the
effects of sediment on water quality and aquatic biota needs to be
strengthened.
Although sediment has been the most widely studied aspect of stream-
water quality that is influenced by land use, it may not always be the most
important. Land-use activities also can result in elevated concentrations
of nutrients, metals, and organic compounds in receiving streams.
In comparison with streams in forested drainage areas, streams in
agricultural settings typically have greater concentrations of nutrients,
particulate organics, sediment, and toxic organic compounds (especially
pesticides) (Loehr, 1974, 1979; Baker, 1983; Lenat, 1984). Streams in
agricultural settings also may have higher temperatures than streams in
forested settings due to reduced shading because of cleared areas and
greater flow variability attributed to channelization and land drainage.
Several investigators (Welch and others, 1977; Hirose and Kuramoto, 1981;
Lenat, 1984) reported elevated specific-conductance levels associated with
streams draining agricultural areas; this reflects high concentrations of
dissolved chemicals in the streams.
In addition, croplands may be heavily fertilized, and excess nutrients
(nitrogen and phosphorus) may be washed into nearby streams. A nationwide
survey by Omernick (1977) indicated that concentrations of nitrogen and
phosphorus in agricultural watersheds were almost an order of magnitude
greater than those in forested watersheds. The combination of these
increased nutrients with a reduced amount of shading commonly stimulates
periphyton production (Schlosser and Karr, 1981; Cook and others, 1983).
There have been several studies of the effects of agricultural runoff
on stream fauna. A review by Baker and Johnson (1983) found that the
relationship between chemical concentrations in agricultural runoff and the
health of the aquatic fauna in receiving streams is very poorly understood.
Most studies indicate a reduction in the taxa richness of the most
intolerant groups: Ephemeroptera, Plecoptera, and Trichoptera (Welch and
others, 1977; McCafferty, 1978; Dance and Hynes, 1980; Cook and others,
1983; Lenat, 1984). Effects of agricultural runoff on other groups are more
variable, but some studies indicate increases in either the taxa richness or
abundance of Odonata (Dance and Hynes, 1980), Trichoptera (Brooks, 1983;
Freeman and Wallace, 1984), Coleoptera (Dance and Hynes, 1980; Brooks,
1983), and Diptera (Baker, 1983; Lenat, 1984; Cooper, 1987). Total density,
or abundance, may either increase (Cook and others, 1983; Lenat, 1984) or
decrease (Welch and others, 1977; Bratton and others, 1980). Most studies
indicate that sediment is a major problem (Lenat, 1984; Cooper, 1987), but
other studies suggest that chemical changes in water quality also may have
affected stream biota (Welch and others, 1977; Cook and others, 1983; Lenat,
1984). No clear picture emerges from the existing literature about how
agricultural land use will affect the fauna of a given stream.
Of particular concern to those studying the effects of agriculture on
stream fauna is the concentration of pesticides. In at least two
investigations (Heckman, 1982; Penrose and Lenat, 1982), pesticide runoff
was believed to be a problem. However, these studies looked at runoff from
orchards, where there were heavy applications of pesticides. In another
pesticide runoff study, Wauchope (1978) indicated that pesticide losses are
usually less than 1 percent of the amount applied, unless heavy rainfall
occurs within 2 weeks of application. However, another survey of
agricultural watersheds in southern Ontario, Canada, (Frank and others,
1982) indicated that pesticides entered stream water both from storm runoff
and from carelessness. They found a number of pesticides in stream water,
five of which were at levels exceeding water-quality criteria. Many of
these pesticides had not been in use for several years, and their detection
reflects the persistence of chlorinated hydrocarbon pesticides.
The chlorinated hydrocarbons are being replaced by a more biodegradable
class of compounds, especially organophosphates. Ramande and others (1984)
characterized these as "extremely noxious, but labile compounds." Such
compounds have a great potential to affect stream life (especially aquatic
insects), but are hard to detect chemically. Some research (Streit and
Schwoerbel, 1976; Besch and others, 1977) indicates that sublethal effects
may be observed at very low concentrations.
Many streams draining urban watersheds have been shown to contain a
wide variety of contaminants (see review by Klein, 1985). For example, a
survey of Ellerbe Creek (Durham, N.C.) indicated potential problems due to
runoff from impervious surfaces (paved surfaces, roofs, and so forth),
nutrient inputs (a fertilized golf course), erosion, a leaking toxic-waste
dump, small sporadic point sources (gas stations, car washes, and so forth),
sewer overflows, and a permitted discharge from a wastewater treatment plant
(Edward A. Holland, Triangle J Council of Governments, oral commun., 1983).
This mixture of problems is typical of most streams draining urban
watersheds. A review of "priority pollutants" in storm-water runoff
indicated a number of toxic materials, especially heavy metals, may enter
streams draining urban watersheds (Cole and others, 1984).
Urban runoff may be directly toxic to stream invertebrates during
storms (Medeiros and others, 1983). However, toxic conditions may also
exist during periods of base flow. Pratt and others (1981) and Medeiros and
others (1983) suggest that materials in the stream bed may affect stream
life. Many studies have indicated that streams draining urban watersheds
are characterized by high levels of sediment metals (Wilber and Hunter,
1979; Duda and others, 1982; Kelly and Kite, 1984).
Changes in the fauna of streams draining urban areas have been
associated with both point-source and nonpoint-source inputs. The effects
of nonpoint runoff from impervious surfaces can be more severe than the
effects from point-source discharges. In localized studies, Klein (1979)
concluded that the effects of urban runoff on biological communities in
streams will be noticed when the percent of impervious surface exceeds 15
percent of the watershed; and Benke and others (1981) found changes in the
benthos if the amount of developed land is greater than 30 percent of the
watershed. The effects of nonpoint-source input from impervious and
developed areas make any analysis of the effects of point-source discharges
more difficult. Additionally, many small point-source discharges can have
an effect similar to nonpoint discharges and complicate attempts to resolve
the source of impairment of streams in urban areas (Duda and others, 1982).
Taxa richness, especially for Ephemeroptera, Plecoptera, Trichoptera,
and Coleoptera, is drastically reduced in some streams draining urban
watersheds relative to control sites (Benke and others, 1981; Cook and
others, 1983). Diptera and Oligochaeta become dominant, with the most
abundant Chironomidae usually belonging to the "toxic assemblage" described
by Simpsan and Bode (1980) and Winner and others (1980). These species are
known to be tolerant of many heavy metals. Total abundance of invertebrates
in streams also is reduced, except in some cases where sewer overflows and
(or) cross connections between storm sewers and sanitary sewers exist. This
situation may produce a classic organic pollution assemblage, with low taxa
8
richness and high abundance of a few species (Duda and others, 1982). Such
buildups of organic indicator species, such as tubificid worms or
Chironomidae, are highly unstable and may be washed out by storms. Studies
of the fauna of streams draining urban areas of large North Carolina cities
have consistently found low organism densities, low taxa richness, low
diversity, and low biotic index values (Lenat and others, 1979; Penrose and
others, 1980; Lenat and Eagleson, 1981).
Studies of urban runoff in small towns, or in lightly developed
watersheds, have indicated less severe pollution than in large cities. In
towns with a population of less than 20,000, Lenat and others (1981) found
that sediment impacts were of greater significance than toxic or organic
problems. Similarly, Benke and others (1981) found that in watersheds with2 housing densities of 100-500 houses per mi , streams had higher invertebrate
taxa richness than streams in watersheds with a housing density of greater2 than 500 houses per mi .
Acknowledgments
The authors express their appreciation to their many colleagues in the
Survey and NRCD who assisted in the data collection and analysis and the
preparation of this report. Frank McBride and his staff from the North
Carolina Division of Inland Fisheries assisted in fish collections to
support the study. Vince Schneider of the Division of Environmental
Management (DEM), NRCD, did the fish identifications.
METHODS OF INVESTIGATION
In this section, methods will be presented that cover the rationale for
selection of the study watersheds, suspended-sediment sampling and analysis,
bottom-material sampling and analysis, water-column sampling and analysis,
interstitial water sampling and analysis, aquatic invertebrate collection
methods, and fish collection and preservation. Two different invertebrate
collection techniques were used concurrently and methodology for both is
presented.
Watershed Selection
At the outset of the study, a search was made to select watersheds of
2 less than 10 mi and no permitted point-source discharges in the Piedmont
where land use was dominated by one of the three different types: forested,
agricultural, and urban. Selection of watersheds having appropriate land
uses and verification of the land use in each watershed was made by using a
4-step process involving map reconnaissance, field reconnaissance, aerial
photography, and digitized data. U.S. Geological Survey topographic maps
were used to identify potential study sites and then field reconnaissance
was used to verify existing conditions. Smith Creek in southern Granville
County was selected as the forested watershed, Devil's Cradle Creek in
northern Franklin County as the agricultural watershed, and Marsh Creek in
central Wake County as the urban watershed (fig. 1). Smith Creek is a2 second-order stream with a drainage area of 6.23 mi ; Devil's Cradle Creek
2 is a second-order stream with a drainage area of 2.89 mi ; and Marsh Creek2 is a third-order stream with a drainage area of 6.84 mi .
Further verification of the land use within each watershed was taken
from U.S. Department of Agriculture aerial photographs. Basin boundaries
were outlined on aerial photos and land-use types within each basin were
planimetered and the areas summed. A second calculation of land use was
used for the Smith Creek watershed where the U.S. Soil Conservation Service
has mapped agricultural land-use types, and the information has been
digitized by the NRCD's Land Resources Information Service. Watershed
boundaries were digitized at the same scale as the land-use data and a
computer overlay technique used to calculate the areas of various land-use
types within each watershed. The Survey's land use and land cover maps were
also examined in an attempt for quantitative verification of the land use
within each watershed. However, the watersheds in question are so small in
comparison to the 1:250,000 scale of the land-use maps that useful
quantitative data could not be obtained.
Suspended Sediment
Suspended-sediment samples were collected manually and with automated
sampling equipment. Manual samples were collected using either a hand-held
depth-integrating US DH-48TM sampler or a hand-held, depth-integrating US
DH-59TM sampler. Both of these suspended-sediment samplers use a 1-pint
glass bottle as the sample container. Manual suspended-sediment samples
were collected at multiple vertical sampling points across the stream using
the equal-width increment method with equal transit rates (Guy and Norman,
10
1970; International Hydrological Program, 1977) or by depth integrating at
the centroid of flow or by depth integrating at quarter points in the
stream. Automated samples for suspended-sediment analyses were collected
from a fixed intake point using an Instrumentation Specialties Companyo
(ISCO) model 1680 automated water sampler equipped with an ISCO model 1640
liquid level sample actuator.
The filtration method (Guy, 1969; International Hydrological Program,
1977) was used to determine suspended-sediment concentrations. Regression
equations between concentrations from manual and automated samples were
developed for each stream, and concentrations from the automated, single
point samples were adjusted to correspond with the concentration expected
from a manual, depth-integrated sample.
Bottom Material
Samples of bottom material for particle-size analysis and chemical
analyses were collected in October 1985. A sampling device was fashioned by
cutting the bottom from an acid-rinsed 250-ml polyethylene bottle
(approximate inside diameter, 1.75 inches). Samples were collected by
gently working the sampling device into the stream bed to a depth of
approximately 2 inches (in.). Once the sampler had been inserted into the
stream bed, a small hole was scooped out in the sediments adjacent to the
sampler and an acid-rinsed watch glass was inserted under the bottom of the
sampler with the 2-inch core of bottom material trapped inside. The sampler
was then removed along with the 2-inch sample core of bottom material. Bed
material sampling sites for each stream were selected by drawing three
numbers between zero and 99 from a random number table (Steel and Torrie,
1980) and using these three numbers as sampling distances (in meters)
downstream from the gaging station. At the distances indicated by the
random numbers, five samples were taken at equal intervals along a tag line
stretched across the stream for a total of 15 samples per stream.
For chemical analyses, the sample bed material from 15 sites per stream
was sieved through a 2-millimeter mesh size nalgene sieve and composited in
an acid-rinsed nalgene pan. Material larger than 2 millimeters (mm) in
3 Use of brand names in this report is for identification purposes only and does not constitute endorsement by the U.S. Geological Survey or the North Carolina Department of Natural Resources and Community Development.
11
diameter was discarded. Subsamples were taken from the composite by gently
working the barrel of a 20-cubic-centimeter (cc) disposable sterile syringe
into the pan of composited and mixed sample bed material. As the barrel of
the syringe was worked into the bottom material, the plunger was slowly
withdrawn to create a partial vacuum that helped hold the sub sample in the
barrel of the syringe. Subsamples were composited and then separated into
two size fractions by passing the sample through 0.063-millimeter screen.
Only native water was used to rinse the sample during the screening process.
Thus, two samples of sediment were obtained from each stream for chemical
analysis, one containing material between 0.063 mm and 2 mm (the sand
fraction) and one containing material less than 0.063 mm in diameter (the
silt/clay fraction). Samples were sent to the Survey's central laboratory
in Doraville, Georgia, for chemical analysis.
Cadmium, chromium, copper, iron, lead, manganese, nickel, and zinc were
analyzed in bottom material samples. Prior to analysis, each sample was
subjected to a strong oxidizing agent (hydrogen peroxide) to destroy any
organic matter present, followed by digestion in hot, dilute (approximately
0.3 Molar) hydrochloric acid (Malo, 1977; Skougstad and others, 1979). The
digestion releases sorbed metals but does not break down the mineral
components of the sediment. Analysis for individual metals was done by
direct atomic absorption spectrometry (Skougstad and others, 1979).
For particle - size analysis, samples within each transect were
composited, but samples from the various transects were kept separate.
Thus, there were three samples for particle size from each of the three
sampling sites.
Particle-size analysis of bottom material was done in the Survey
sediment laboratory, Raleigh, N.C., by splitting the sample into subsamples
of 50 to 100 grams (g) each using a laboratory sample splitter. Subsamples
were then dried overnight at 110 degrees Celsius ( C) and passed through a
series of U.S. standard sieves, ranging in mesh size from 2 mm to 0.063 mm.
A portable sieve shaker was used to speed the sieving process . Individual
sieved samples were weighed on an analytical balance and percent composition
for each particle-size class was determined.
12
Water Chemistry
Stream water was sampled for chemical analysis approximately monthly
for a 1-year period from February 1984 through January 1985. An additional
water-quality sample from Smith Creek was collected in November 1985 at the
time when high-flow sampling for suspended sediment was completed. Samples
were collected over a wide range of flow conditions using depth-integrating
methods at the centroid of flow. Analyses focused on nutrients and trace
elements. Table 1 presents the constituents analyzed during the study, the
methods used for analysis, and the detection limit for each constituent.
Several quality-assurance checks were included in the study. Field
results for pH and specific conductance were checked by comparing field
measurements against laboratory measurements of these two properties. Also,
total and dissolved fractions for the various constituents were compared;
total concentrations should always be equal to or greater than dissolved
concentrations. The one exception to this generalization is chromium. The
method used for total chromium is more sensitive than the method for
dissolved chromium. Therefore, when concentrations for this element are
near the detection limit, reported concentrations may be greater for the
dissolved fraction than for the total fraction.
All the water-quality data collected for this study have been placed in
the Survey's computerized national data bank called WATSTORE, and the data
are published in the annual data report for the North Carolina District of
the U.S. Geological Survey (U.S. Geological Survey Water Resources Data for
North Carolina, Water Year 1986).
Interstitial Water
Samples of interstitial water from stream-bottom sediments were
collected once during the study at each of the three stations. A diffusion-
controlled sampler (Simon and others, 1985) was used to sample from 6
depths--2 in. and 0.4 in. above the sediment-water interface and 0.4 in.,
1.2 in., 2 in., and 4 in. below the sediment-water interface. Samples were
analyzed for the nutrients ammonia-nitrogen, nitrite- plus nitrate-nitrogen,
and orthophosphate-phosphorus. Interstitial water samples taken for metals
analyses were accidently discarded in the laboratory prior to conducting the
analyses; and, therefore, no metals data are available for interstitial
water.
13
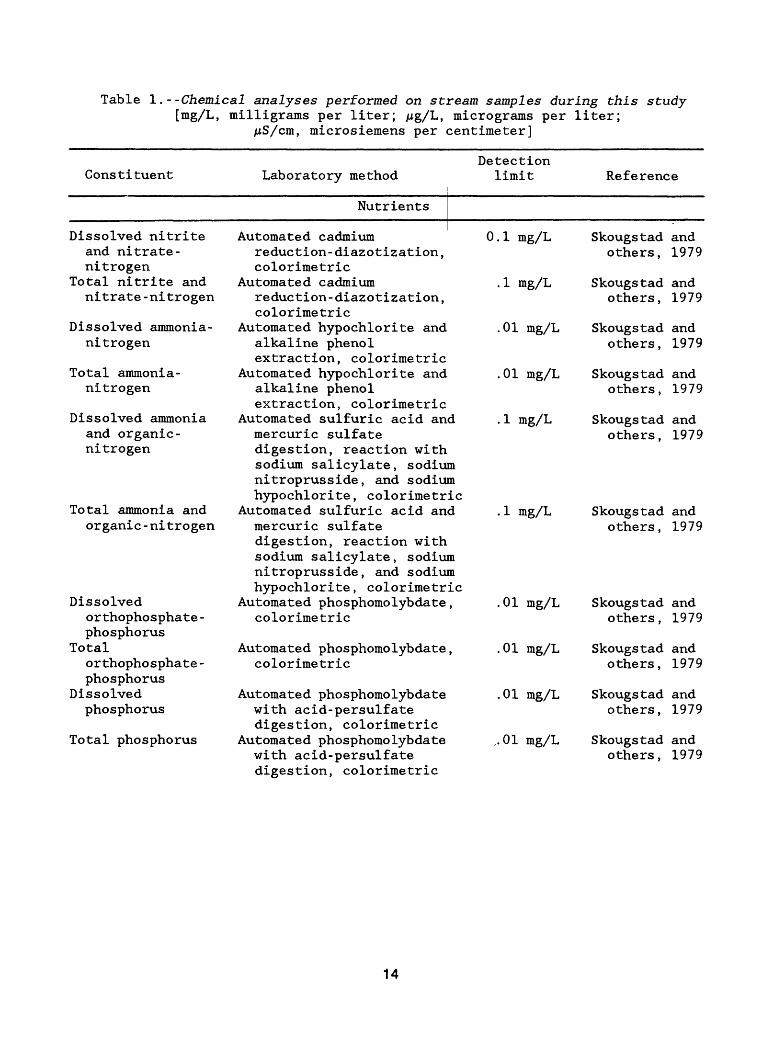
Table 1.- -Chemical analyses performed on stream samples during this study [mg/L, milligrams per liter; ng/~L, micrograms per liter;
jiS/cm, microsiemens per centimeter]
Constituent Laboratory methodDetection
limit Reference
Nutrients
Dissolved nitrite and nitrate- nitrogen
Total nitrite and nitrate-nitrogen
Dissolved ammonia- nitrogen
Total ammonia- nitrogen
Dissolved ammonia and organic- nitrogen
Total ammonia and organic-nitrogen
Dissolvedorthophosphate-phosphorus
Totalorthophosphate-phosphorus
Dissolvedphosphorus
Total phosphorus
Automated cadmium 0.1 mg/Lreduction-diazotization,colorimetric
Automated cadmium .1 mg/Lreduction-diazotization,colorimetric
Automated hypochlorite and .01 mg/Lalkaline phenolextraction, colorimetric
Automated hypochlorite and .01 mg/Lalkaline phenolextraction, colorimetric
Automated sulfuric acid and .1 mg/Lmercuric sulfatedigestion, reaction withsodium salicylate, sodiumnitroprusside, and sodiumhypochlorite, colorimetric
Automated sulfuric acid and .1 mg/Lmercuric sulfatedigestion, reaction withsodium salicylate, sodiumnitroprusside, and sodiumhypochlorite, colorimetric
Automated phosphomolybdate, .01 mg/Lcolorimetric
Automated phosphomolybdate, .01 mg/L colorimetric
Automated phosphomolybdate .01 mg/Lwith acid-persulfatedigestion, colorimetric
Automated phosphomolybdate ,. 01 mg/Lwith acid-persulfatedigestion, colorimetric
Skougstad and others, 1979
Skougstad and others, 1979
Skougstad and others, 1979
Skougstad and others, 1979
Skougstad and others, 1979
Skougstad and others, 1979
Skougstad and others, 1979
Skougstad and others, 1979
Skougstad and others, 1979
Skougstad and others, 1979
14
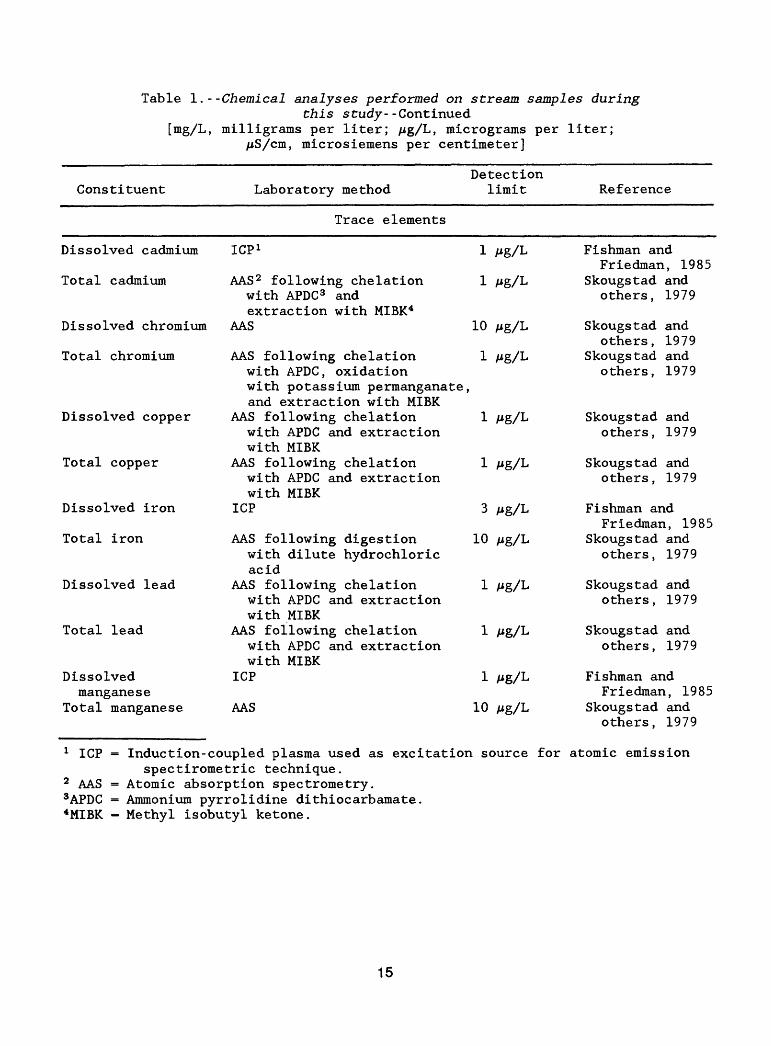
Table 1.- -Chemical analyses performed on stream samples duringthis study--Continued
[mg/L, milligrams per liter; Mg/L, micrograms per liter; MS/cm, microsiemens per centimeter]
Constituent Laboratory methodDetection
limit Reference
Trace elements
Dissolved cadmium
Total cadmium
Dissolved chromium
Total chromium
Dissolved copper
Total copper
Dissolved iron
Total iron
Dissolved lead
Total lead
Dissolvedmanganese
Total manganese
ICP
ICP 1 1 Mg/L
AAS 2 following chelation 1with APDC 3 andextraction with MIBK4
AAS 10
AAS following chelation 1 Mg/Lwith APDC, oxidationwith potassium permanganate,and extraction with MIBK
AAS following chelation 1 Mg/Lwith APDC and extractionwith MIBK
AAS following chelation 1 Mg/Lwith APDC and extractionwith MIBK
ICP 3 Mg/L
AAS following digestion 10 Mg/Lwith dilute hydrochloricacid
AAS following chelation 1 Mg/Lwith APDC and extractionwith MIBK
AAS following chelation 1 Mg/Lwith APDC and extractionwith MIBK
ICP 1 Mg/L
AAS 10 Mg/L
Fishman andFriedman, 1985
Skougstad andothers, 1979
Skougstad and others, 1979
Skougstad and others, 1979
Skougstad and others, 1979
Skougstad and others, 1979
Fishman andFriedman, 1985
Skougstad andothers, 1979
Skougstad and others, 1979
Skougstad and others, 1979
Fishman andFriedman, 1985
Skougstad andothers, 1979
Induction-coupled plasma used as excitation source for atomic emissionspectirometric technique.
2 AAS = Atomic absorption spectrometry. 3APDC = Ammonium pyrrolidine dithiocarbamate. 4MIBK = Methyl isobutyl ketone.
15
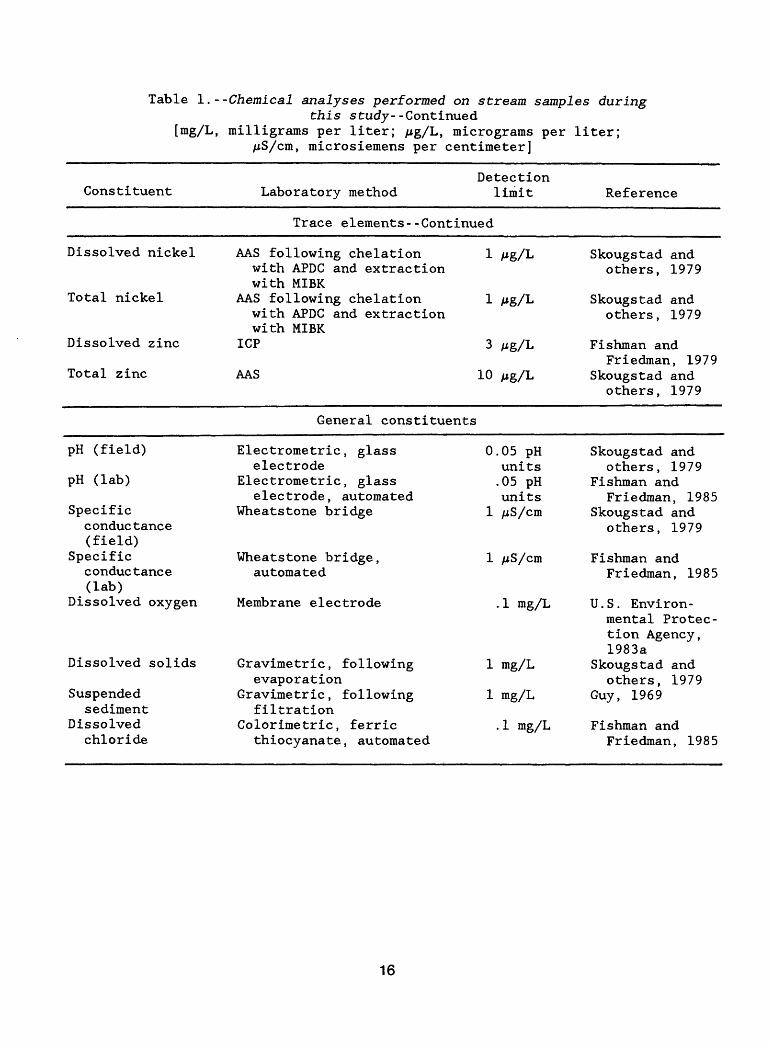
Table I. -
[mg/L,
Chemical analyses performed on stream samples duringthis study- -Continued
milligrams per liter; jug/L, micrograms per liter; , microsiemens per centimeter]
Constituent Laboratory methodDetection
limit Reference
Trace elements--Continued
Dissolved nickel
Total nickel
AAS following chelation 1 /*g/Lwith APDC and extractionwith MIBK
AAS following chelation 1 /*g/Lwith APDC and extractionwith MIBK
Dissolved solids
Suspendedsediment
Dissolvedchloride
Gravimetric, followingevaporation
Gravimetric, followingfiltration
Colorimetric, ferricthiocyanate, automated
1 mg/L
1 mg/L
.1 mg/L
Skougstad and others, 1979
Skougstad and others, 1979
Dissolved zinc
Total zinc
ICP 3
AAS 10
Mg/L
jUg/L
Fishman andFriedman, 1979
Skougstad andothers, 1979
General constituents
pH (field)
pH (lab)
Specificconductance(field)
Specificconductance/lab)
Dissolved oxygen
Electrometric, glass 0electrode
Electrometric, glasselectrode, automated
Wheatstone bridge 1
Wheatstone bridge, 1automated
Membrane electrode
.05 pHunits.05 pHunitsjwS/cm
juS/cm
.1 mg/L
Skougstad andothers, 1979
Fishman andFriedman, 1985
Skougstad andothers, 1979
Fishman andFriedman, 1985
U.S. Environ-mental Protec tion Agency, 1983a
Skougstad and others, 1979
Guy, 1969
Fishman andFriedman, 1985
16
Aquatic Invertebrates
Two different collection techniques, kick nets and standardized
qualitative collections, were used to sample benthic macroinvertebrates.
This "double sampling" was intended both as a test of the techniques and as
a way of independently verifying results.
Kick-Net Sampling
Kick nets (one square meter) were constructed of mesh netting with
approximately 1-millimeter openings (Hornig and Pollard, 1978). Smaller
mesh netting is available, but it has a greater tendency to become clogged
with organic debris and silt, causing flow to be diverted around the net and
reducing collection efficiency. A double layer of netting was used to
obtain a smaller opening, but without the clogging effect of the smaller
mesh.
The net was positioned upright on the streambed while the substrate was
physically disrupted (kicked) to a depth of approximately 4 in. in an2 upstream area of 1 m . Kick-net samples were then rinsed into a wash bucket
(brass wire cloth mesh no. 30, 0.56-millimeter mesh openings) and preserved
with 95 percent ethanol in plastic quart freezer containers. After
carefully washing all specimens, large pieces of organic debris were removed
to increase preservation efficiency.
All samples were stained with rose Bengal (Mason and Yevich, 1967).
Species identifications and enumerations were done in the laboratory of the
NRCD's Biological Monitoring Group. Duplicate samples from each of the
three stream-sampling sites were collected in January, April, June, and
November 1984.
The kick-net technique is less quantitative than other collection
techniques, including Surber samples (Welch, 1948) or artificial substrates,
such as Hester-Dendy multiplates (Hester and Dendy, 1962) and rock-filled
baskets (Henson, 1965). However, it can be used across a wider range of
habitats. Hornig and Pollard (1978) found that the kick-net technique was
superior to both Surber samples and artificial substrates because it
obtained more consistent results.
17
Standardized Qualitative Sampling
The standardized qualitative-sampling procedure (North Carolina
Division of Environmental Management, 1983) uses a variety of collection
techniques and mesh sizes to sample as much of the macroinvertebrate
community as possible. The three sampling devices used (kick net, sweep
net, and wash bucket) had a fairly coarse mesh (0.5 mm) and were intended to
sample the larger macro invertebrates. In addition, two kinds of fine-mesh
(0.3 mm) samplers were used to sample the smaller macroinvertebrates ,
especially Chironomidae. These collection techniques were supplemented by
visual inspection of larger rocks and logs. A total of 10 separate samples
were included in each qualitative collection. Collections were made at each
site in January, April, June, and November. At the sampling site,
macroinvertebrate organisms were separated from the rest of the material
collected. During lab identification, organisms from each sample were
tabulated as rare (1-2 specimens), common (3-9 specimens) , or abundant (>10
specimens).
For both types of collections, species identifications and enumerations
were done in the laboratory of the Biological Monitoring Group of NRCD.
Most invertebrates were identified using a dissecting microscope. However,
representative Chironomids and Oligochaetes were mounted in CMC-10 mounting
media and identified using a compound microscope.
Fish
Fish were collected from each stream site in September 1984 by
personnel from the North Carolina Division of Inland Fisheries. Rotenone
was used to sample all fish in a 328-foot stream reach, which included the
water chemistry sampling point and the stream discharge gaging station. A
second fish collection was conducted by NRCD's Department of Environmental
Management (DEM) personnel in February 1986 to confirm results of the first.
For this second collection, because rotenone is less effective in cold water
and because equipment and personnel needed to use rotenone were not
available, electroshocking, supplemented [by active seining, was used to
sample the same stream sections. All fish collected were preserved in 10-
percent formalin and taken to the laboratory where identifications,
enumerations, and measurements were made by DEM staff.
18
LAND USE AND SOILS IN THE STUDY WATERSHEDS
Land Use
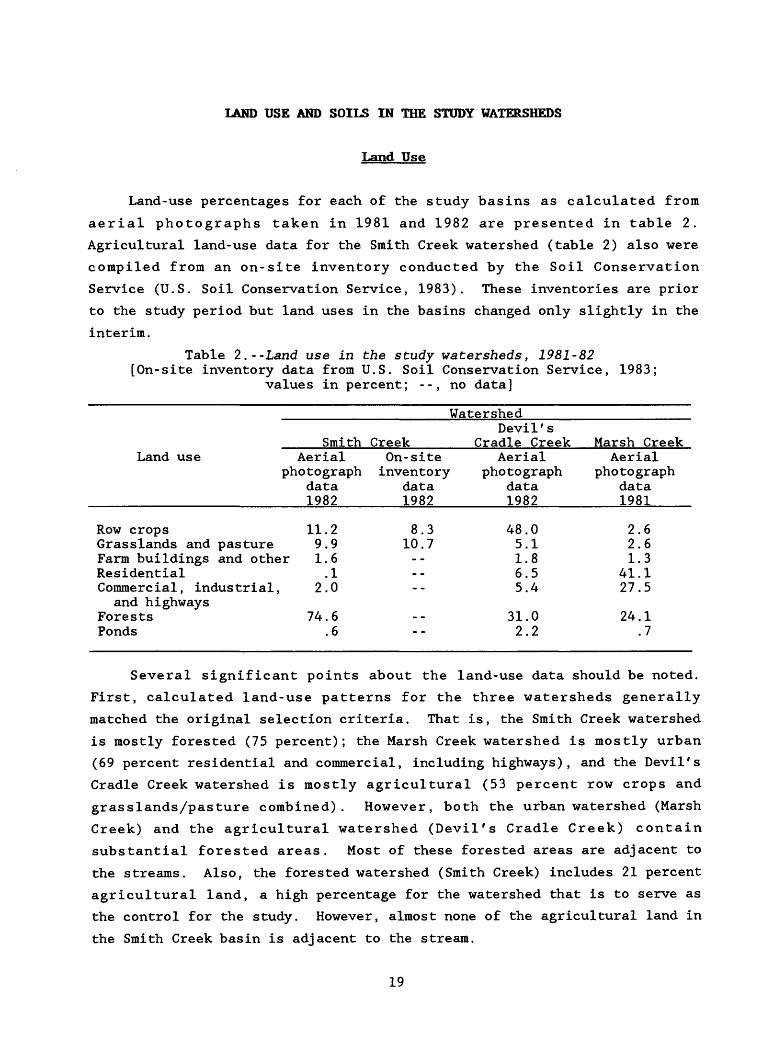
Land-use percentages for each of the study basins as calculated from
aerial photographs taken in 1981 and 1982 are presented in table 2.
Agricultural land-use data for the Smith Creek watershed (table 2) also were
compiled from an on-site inventory conducted by the Soil Conservation
Service (U.S. Soil Conservation Service, 1983). These inventories are prior
to the study period but land uses in the basins changed only slightly in the
interim.
Table 2.--Land use in the study watersheds, 1981-82 [On-site inventory data from U.S. Soil Conservation Service, 1983;
values in percent; --, no data]
Watershed
Land use
Row cropsGrasslands and pasture
SmithAerial
photographdata1982
11.29.9
CreekOn-siteinventory
data1982
8.310.7
Farm buildings and other 1.6ResidentialCommercial, industrial
and highwaysForestsPonds
.12.0
74.6.6
--
Devil'sCradle Creek
Aerialphotograph
data1982
48.05.11.86.55.4
31.02.2
Marsh CreekAerial
photographdata1981
2.62.61.3
41.127.5
24.1.7
Several significant points about the land-use data should be noted.
First, calculated land-use patterns for the three watersheds generally
matched the original selection criteria. That is, the Smith Creek watershed
is mostly forested (75 percent); the Marsh Creek watershed is mostly urban
(69 percent residential and commercial, including highways), and the Devil's
Cradle Creek watershed is mostly agricultural (53 percent row crops and
grasslands/pasture combined). However, both the urban watershed (Marsh
Creek) and the agricultural watershed (Devil's Cradle Creek) contain
substantial forested areas. Most of these forested areas are adjacent to
the streams. Also, the forested watershed (Smith Creek) includes 21 percent
agricultural land, a high percentage for the watershed that is to serve as
the control for the study. However, almost none of the agricultural land in
the Smith Creek basin is adjacent to the stream.
19
Forested land along a stream can act as a filter and attenuate the
effects of land use in parts of the basin that do not border stream
channels. Therefore, all of the streams in the study may not receive the
full impact of runoff from land-use activities in their watersheds. This is
especially true for the forested watershed where agricultural land use in
the basin is relatively far removed from the stream.
Second, the Smith Creek watershed had some development activities in
the watershed during the study. About 30 acres of land in the south central
part of the basin were cleared and a trailer park was established on the
cleared land. The cleared land does not border Smith Creek, but it lies on
both sides of an intermittent stream that is tributary to Smith Creek.
Also, during the study, a gravel road through the upper one-third of the
watershed was regraded and paved. These activities may have an effect on
the water quality of Smith Creek and need to be considered in the analysis
of the data.
Furthermore, for the entire duration of the study, a beaver dam located
about 0.25 mi upstream from the Smith Creek sampling site, may have had an
effect of trapping suspended-sediment, thus reducing suspended sediment
downstream.
The search for a totally forested watershed to serve as the control
revealed that, in the northeastern Piedmont province of North Carolina, no
such undisturbed basins apparently exist. The Smith Creek watershed
represents the best choice identified during the search for suitable
watersheds.
The agricultural watershed had few agricultural best-management
practices in place. Some field borders existed, but they were narrow.
Grass waterways were almost nonexistent, and plowing was seldom done on the
contour. Similarly, most agricultural land in the forested and urban
watersheds did not have progressive land-management practices in place.
Finally, the stream draining the urban watershed, Marsh Creek, is
paralleled by a sanitary sewer line. The line was constructed several years
prior to the study, so any effects of land disturbance from construction
have subsided. However, the chemistry of Marsh Creek could be affected if
this sewer line leaks.
20
Daniels and others (1984) categorized the land area for all three study
watersheds as having soils belonging to the felsic crystalline system of the
Piedmont. These soils are found in a large area of the eastern Piedmont
north of Raleigh and in a broad band about 60 miles wide in the western
Piedmont from Virginia to South Carolina. Soils of this system are derived
from granite, granite gneiss, mica gneiss, and mica schist parent material.
Because all three study watersheds are classified in the same soil system,
the soils in the three watersheds probably have similar and fairly uniform
characteristics and affect stream chemistry similarly.
Although the three watersheds are overlain by the same regional soil
system, individual soil associations within them are variable because of
differences in organic content, mineralogy, permeability, and other factors.
The forested watershed, Smith Creek, contains two different soil
associations: the Cecil association in the southern part of the watershed
and the Creedmoor-White Store association in the northern part of the
watershed (U.S. Department of Agriculture, 1971). Cecil soils are sandy
loams with kaolinitic clay B horizons. The soil credibility factor (K) is a
measure of the susceptiblity of the soil to be eroded by water (U.S.
Department of Agriculture, 1983). The higher the value of K, the more
susceptible a soil is to erosion. Values of 0.25 to 0.30 are typical for
clay loam type soils; values over 0.40 are characteristic of silt loams,
very fine sandy loams, and loamy sands. For Cecil soils, K is 0.28. The
Creedmoor-White Store soils usually occur in association with Creedmoor
soils on upland sites and White Store soil in the valley slopes. Both soil
associations have K values of approximately 0.40 and are moderately well-
drained, clay-textured soils with firm, clayey B horizons of mixed clays.
The General Soil Map of Granville County (U.S. Department of Agriculture,
1971) indicates about 30 percent of the Smith Creek watershed is of
Creedmoor-White Store soils.
The agricultural watershed, Devil's Cradle Creek, is approximately
equally divided between soils of the App ling-Louis burg association, the
Appling association, and Appling-Durham association (U.S. Department of
Agriculture, 1972). Like the Cecil soils of the Smith Creek watershed,
these soils are well drained and have sandy loam textured surface layer and
clay textured B Horizon of kaolinitic clay mineralogy. Appling soils have a
K value of 0.24.
21
In the urban Marsh Creek watershed, soils of the Cecil-Appling
association predominate (Cawthorn, 1970). Again, these soils have sandy
loam surface layers, with a clayey B horizon of kaolinite clay. K values
are about 0.25.
WATER QUALITY
Results from water-quality sampling are presented in the following
sections. All segments of the aquatic environment are included; the water
column, sediments suspended in the water, sediments on the stream bottoms,
and water within the interstices of the bottom material.
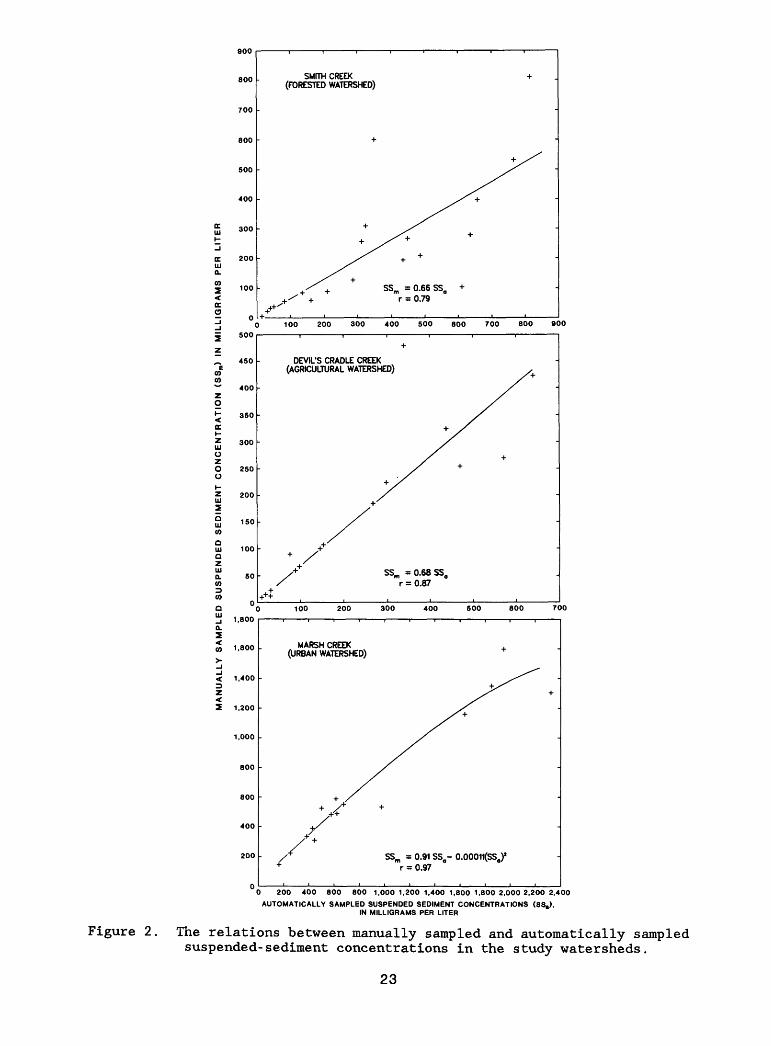
Suspended Sediment
Suspended-sediment concentrations for this study were sampled by two
methods, manual and automated. Manual sampling is the preferred method
because it produces a sample that is both depth-integrated and width-
integrated and, therefore, presumed to be representative of the cross
section of the stream. Automated samples are collected at a single, fixed
point in the stream and are likely to be less representative of
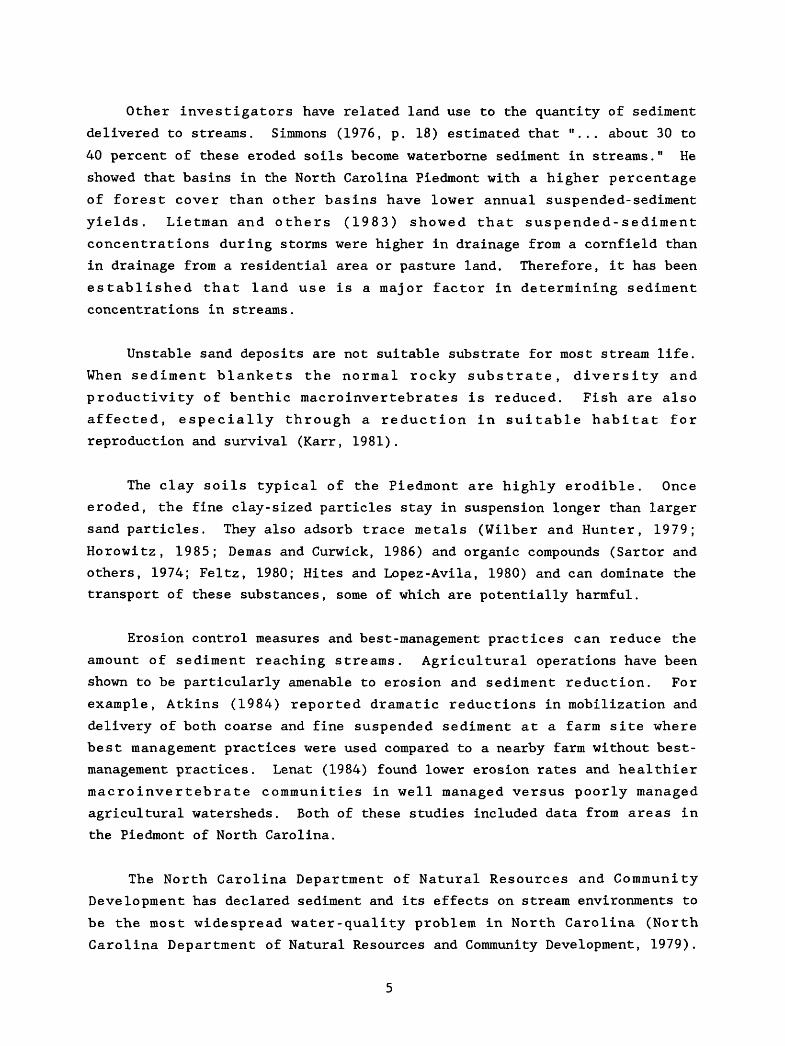
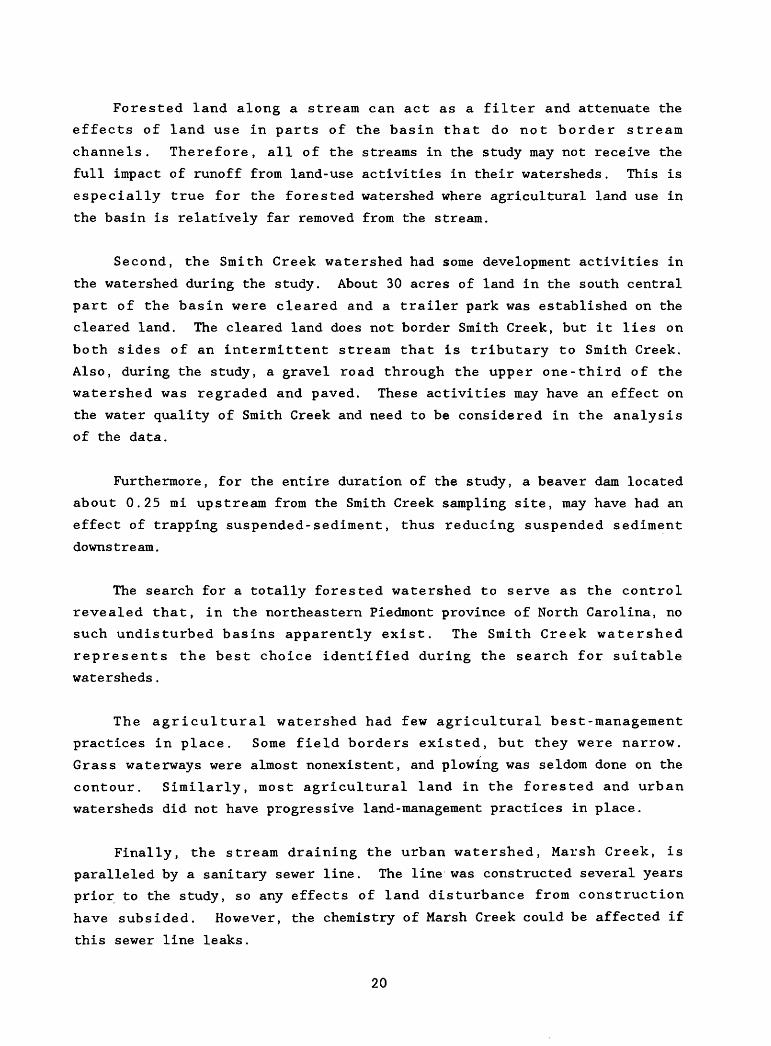
concentrations throughout the entire cross section. Indeed, figure 2 shows
the bias of the samples collected by the automatic sampler--consistently
higher concentrations are found in samples collected by the automatic
sampler than in samples collected manually. Therefore, automated samples
from each sampling site were related by a least-squares regression equation
to concurrently collected manual samples. The relation between automated
and manual samples is statistically significant (fig. 2) for each stream
with correlation coefficients of 0.79 for Smith Creek, 0.87 for Devil's
Cradle Creek, and 0.97 for Marsh Creek. Concentrations of suspended
sediment from samples collected by the automatic sampler were then adjusted
to match the corresponding value which would have been expected from a
manual sample taken at the same time. Adjustments were made by substituting
suspended-sediment concentrations from automatically collected samples into
the regression equation from each station and calculating the corresponding
concentration as if the sample had been collected manually. Both adjusted
concentrations from automated samples and unadjusted concentrations from
manual samples are used in this report.
22
^ 450
SMITH CREEK (FORESTED WATERSHED)
SSm = 0.66 SS0 r = 0.79
100 200 300 400 500 800 700 800 900
DEVIL'S CRADLE CREEK (AGRICULTURAL WATERSHED)
SSm =0.68SS0 r = 0.87
100 200 300 400 500 800 700
1.800
1,400
1,200
1,000
MARSH CREEK (URBAN WATERSHED)
SSm = 0.91 SS0 r = 0.97
0 200 400 800 800 1,000 1,200 1,400 1,800 1,800 2,000 2,200 2.400
AUTOMATICALLY SAMPLED SUSPENDED SEDIMENT CONCENTRATIONS (8S.), IN MILLIGRAMS PER LITER
Figure 2. The relations between manually sampled and automatically sampled suspended-sediment concentrations in the study watersheds.
23
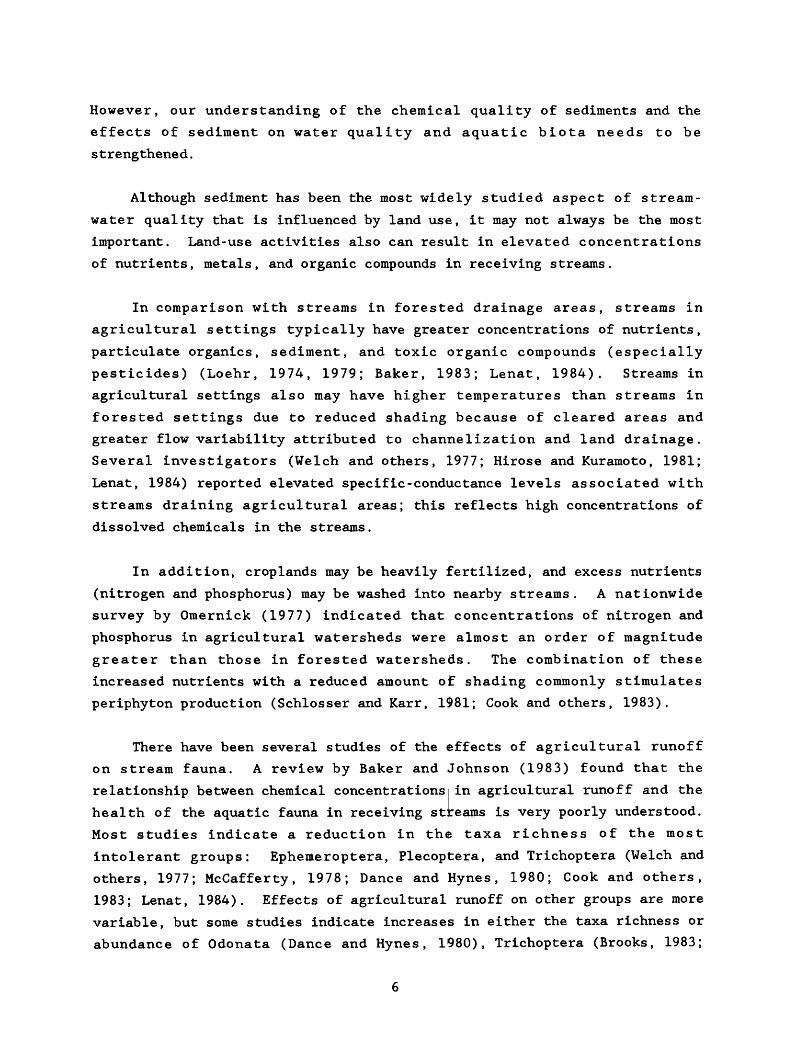
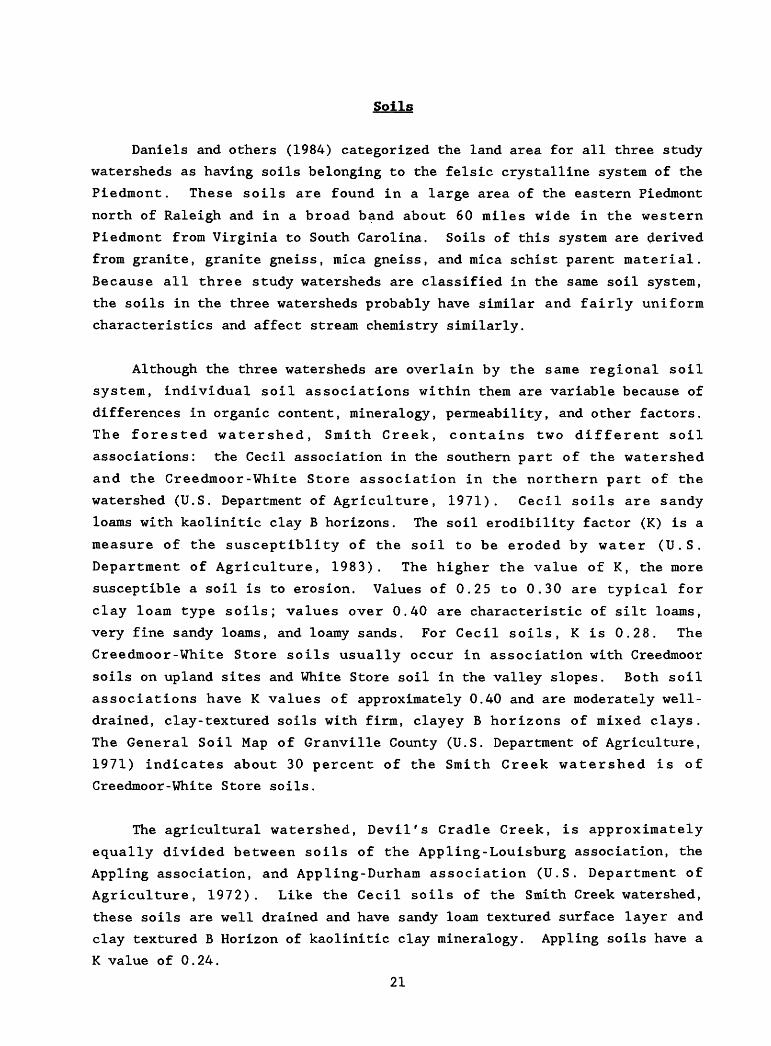
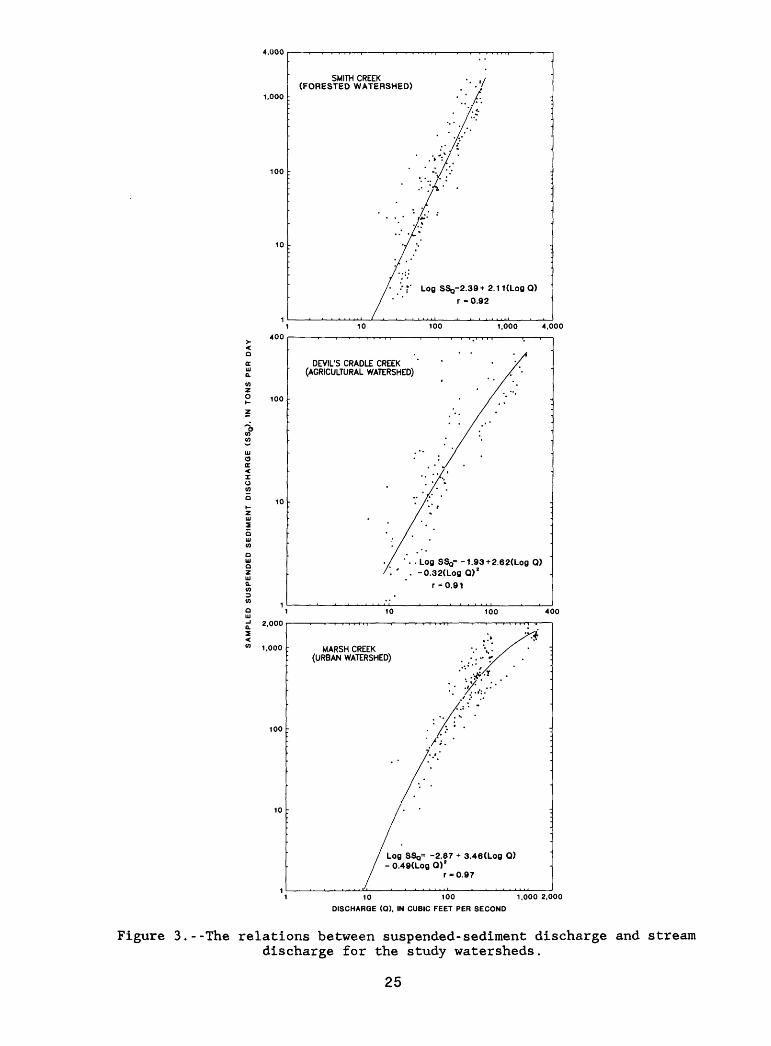
Instantaneous suspended-sediment discharge, in tons per day, is
computed by multiplying suspended-sediment concentration by stream discharge
at the time the suspended-sediment concentration was sampled, or:
Qs = 0.0027 Qw Cs , (1)
where: Q = instantaneous suspended-sediment discharge, in tons per day, s0 = instantaneous water discharge, in cubic feet per second, and
C = concentration of suspended sediment, in milligrams per liter.O
At each of the three study sites, instantaneous suspended-sediment
discharge is statistically related to stream discharge (fig. 3). Because
this relation is well defined for each stream, annual suspended-sediment
discharge values (loads) can be calculated. Regression equations developed
between instantaneous suspended-sediment discharge and instantaneous stream
discharge are used to predict daily suspended-sediment loads from daily
average stream discharges. Daily loads are summed for a 1-year period to
yield an annual load. For Smith Creek, Devil's Cradle Creek, and Marsh
Creek, annual suspended-sediment loads for tl}ie 1-year period, February 1984
through January 1985, are presented in taple 3. Dividing each of the
calculated loads by the drainage area of the study watershed gives a measure
of suspended-sediment load expressed on a per-unit area basis. These load-
per-unit area values, or yields, can be directly compared among watersheds.
The annual yields from Smith, Devil's Cradle, and Marsh Creeks indicate that
the forested basin yields about 0.13 tons of suspended sediment per year for
each acre of land. The agricultural basin yields more than twice (0.31 tons
per acre) the suspended-sediment load of the forested basin, and the urban
basin yields more than four times (0.59 tons per acre) the load of the
forested basin (table 3). These results are in line with previously
reported yields from streams in the North Carolina Piedmont (Simmons, 1987).
Bottom Material
There is a strong association between sediment suspended in the water
of a stream and the sediment on a stream bottom. Any individual sediment
particle is carried in suspension until the^ water velocity slows to the
point that it can no longer provide the force needed to carry the particle.
The particle then settles and changes from suspended sediment to bottom
material. During some future period of increased streamflow, that particle
24
4.000
1,000
SMITH CREEK (FORESTED WATERSHED)
Log SSQ-2.39+ 2.1 KLog Q) r -0.92
1.000 4.000
DEVIL'S CRADLE CREEK (AGRICULTURAL WATERSHED)
. Log SSQ= -1.93 + 2.62(Log Q) -0.32(Log Q) z
r = 0.91
12.000
m 1.000
100
MARSH CREEK (URBAN WATERSHED)
Log SSo= -2.87 + 3.46(Log Q) - 0.49(Log Q) 2
r-0.97
10 100 1,000 2.000
DISCHARGE (O). IN CUBIC FEET PER SECOND
Figure 3.--The relations between suspended-sediment discharge and streamdischarge for the study watersheds.
25
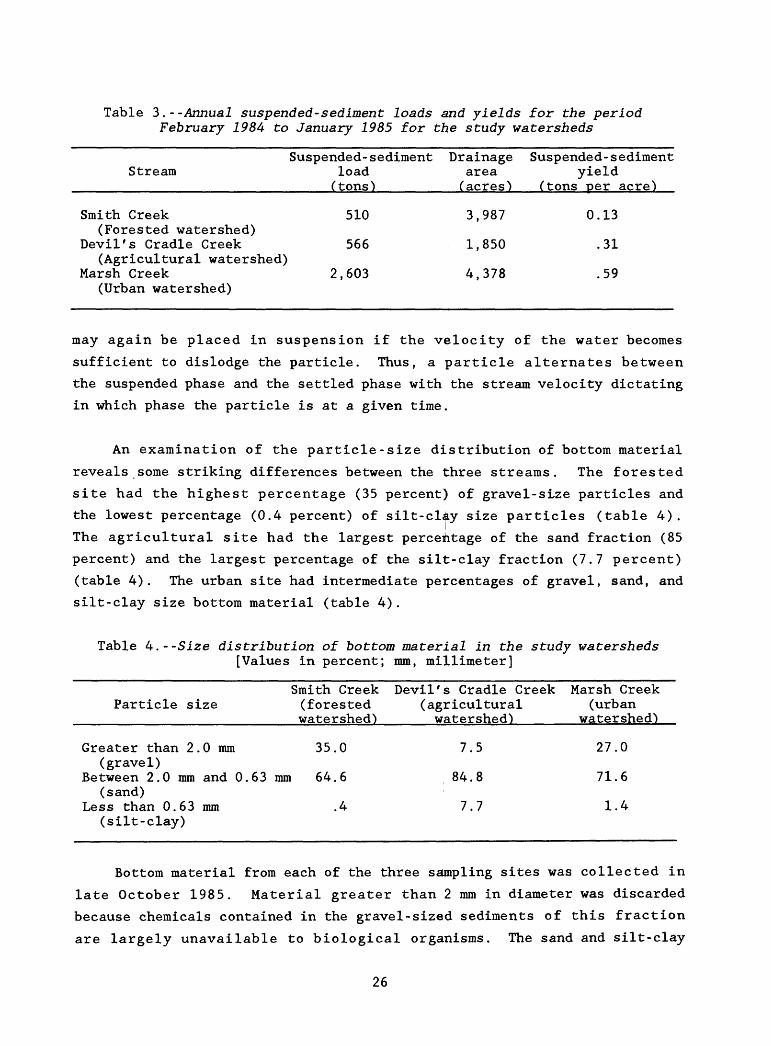
Table 3.--Annual suspended-sediment loads and yields for the period February 1984 to January 1985 for the study watersheds
Suspended-sediment Drainage Suspended-sedimentStream load area yield
(tons)________(acres) (tons per acre)
Smith Creek(Forested watershed)
Devil's Cradle Creek(Agricultural watershed)
Marsh Creek(Urban watershed)
510
566
2,603
3,987
1,850
4,378
0.13
.31
.59
may again be placed in suspension if the velocity of the water becomes
sufficient to dislodge the particle. Thus, a particle alternates between
the suspended phase and the settled phase with the stream velocity dictating
in which phase the particle is at a given time.
An examination of the particle-size distribution of bottom material
reveals some striking differences between the three streams. The forested
site had the highest percentage (35 percent) of gravel-size particles and
the lowest percentage (0.4 percent) of silt-cl£.y size particles (table 4).
The agricultural site had the largest percentage of the sand fraction (85
percent) and the largest percentage of the silt-clay fraction (7.7 percent)
(table 4). The urban site had intermediate percentages of gravel, sand, and
silt-clay size bottom material (table 4).
Table 4.--Size distribution of bottom material in the study watersheds [Values in percent; mm, millimeter]
Smith Creek Devil's Cradle Creek Marsh CreekParticle size (forested (agricultural (urban
watershed) watershed)______watershed)
Greater than 2 . 0 mm(gravel)
Between 2.0 mm and 0.63 mm(sand)
Less than 0.63 mm(silt-clay)
35.0
64.6
.4
7.5
84.8
7.7
27.0
71.6
1.4
Bottom material from each of the three sampling sites was collected in
late October 1985. Material greater than 2 mm in diameter was discarded
because chemicals contained in the gravel-sized sediments of this fraction
are largely unavailable to biological organisms. The sand and silt-clay
26
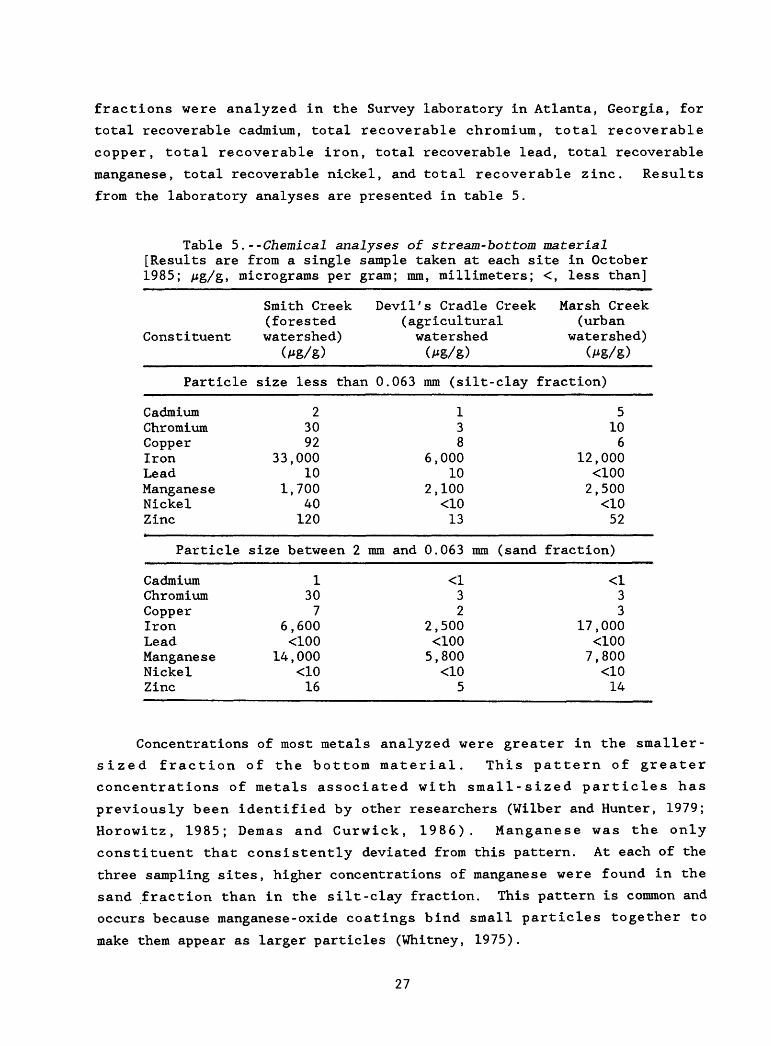
fractions were analyzed in the Survey laboratory in Atlanta, Georgia, for
total recoverable cadmium, total recoverable chromium, total recoverable
copper, total recoverable iron, total recoverable lead, total recoverable
manganese, total recoverable nickel, and total recoverable zinc. Results
from the laboratory analyses are presented in table 5.
Table 5.--Chemical analyses of stream-bottom material [Results are from a single sample taken at each site in October 1985; /Jg/g, micrograms per gram; mm, millimeters; <, less than]
Smith Creek Devil's Cradle Creek Marsh Creek(forested (agricultural (urban
Constituent watershed) watershed watershed)
Particle size less than 0.063 mm (silt-clay fraction)
CadmiumChromiumCopper Iron LeadManganese NickelZinc
23092
33,000 10
1,700 40120
138
6,000 10
2,100 <1013
5106
12,000 <1002,500 <1052
Particle size between 2 mm and 0.063 mm (sand fraction)
CadmiumChromiumCopper Iron LeadManganese NickelZinc
1307
6,600 <100
14,000 <1016
<132
2,500 <1005,800 <10
5
<133
17,000 <1007,800 <1014
Concentrations of most metals analyzed were greater in the smaller-
sized fraction of the bottom material. This pattern of greater
concentrations of metals associated with small-sized particles has
previously been identified by other researchers (Wilber and Hunter, 1979;
Horowitz, 1985; Demas and Curwick, 1986). Manganese was the only
constituent that consistently deviated from this pattern. At each of the
three sampling sites, higher concentrations of manganese were found in the
sand fraction than in the silt-clay fraction. This pattern is common and
occurs because manganese-oxide coatings bind small particles together to
make them appear as larger particles (Whitney, 1975).
27
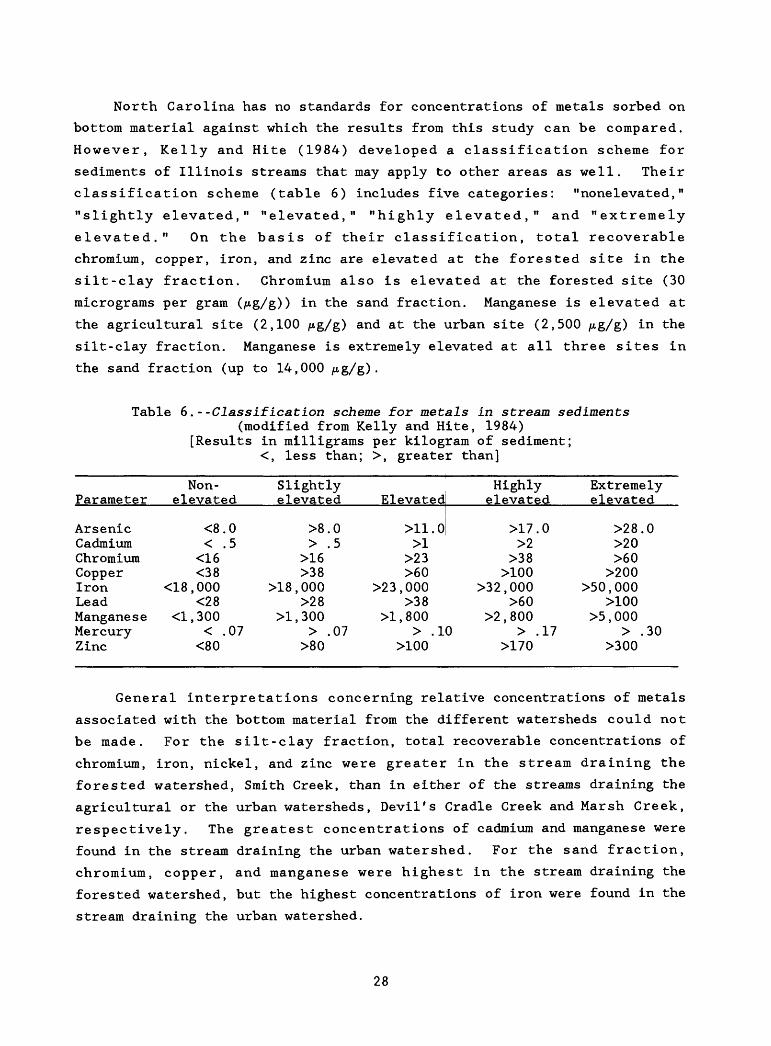
North Carolina has no standards for concentrations of metals sorbed on
bottom material against which the results from this study can be compared.
However, Kelly and Hite (1984) developed a classification scheme for
sediments of Illinois streams that may apply to other areas as well. Their
classification scheme (table 6) includes five categories: "nonelevated,"
"slightly elevated," "elevated," "highly elevated," and "extremely
elevated." On the basis of their classification, total recoverable
chromium, copper, iron, and zinc are elevated at the forested site in the
silt-clay fraction. Chromium also is elevated at the forested site (30
micrograms per gram (/Ag/g)) in the sand fraction. Manganese is elevated at
the agricultural site (2,100 /u.g/g) and at the urban site (2,500 /u,g/g) in the
silt-clay fraction. Manganese is extremely elevated at all three sites in
the sand fraction (up to 14,000 /u,g/g) .
Table 6.- -Classification scheme for metals in stream sediments(modified from Kelly and Hite, 1984)
[Results in milligrams per kilogram of sediment;<, less than; >, greater than]
Parameter
ArsenicCadmiumChromiumCopper Iron LeadManganese Mercury Zinc
Non- elevated
<8<
<16<38
<18,000 <28
<1,300 <
<80
.0
.5
.07
Slightly elevated
>8.0> .5
>16>38
>18,000 >28
>1,300 > .07
>80
Elevated
XL1.0>1
>23>60
>23,000 >38
Highly elevated
>17.0>2
>38>100
>32,000 >60
>1,800 >2,800 > .10 > .17
>100 >170
Extremely elevated
>28.0>20>60
>200 >50,000
XLOO>5,000
> .30 >300
General interpretations concerning relative concentrations of metals
associated with the bottom material from the different watersheds could not
be made. For the silt-clay fraction, total recoverable concentrations of
chromium, iron, nickel, and zinc were greater in the stream draining the
forested watershed, Smith Creek, than in either of the streams draining the
agricultural or the urban watersheds, Devil's Cradle Creek and Marsh Creek,
respectively. The greatest concentrations of cadmium and manganese were
found in the stream draining the urban watershed. For the sand fraction,
chromium, copper, and manganese were highest in the stream draining the
forested watershed, but the highest concentrations of iron were found in the
stream draining the urban watershed.
28
Wilber and Hunter (1977) found that metals loadings to the Saddle
River, New Jersey, decrease as the percentage of residential land increases.
Other research (Wilber and Hunter, 1979; Cole and others, 1984) indicates
that a significant source of metals loadings in streams draining urban
watersheds is automobile related. Pitt and Bozeman (1980) point to
automobile tirewear as a substantial source of zinc, auto exhausts as
contributors of many heavy metals, especially lead, and fluid losses and
mechanical wear as contributors of still more heavy metals. Therefore, a
watershed with a large percentage of impervious area and (or) with a high
volume of traffic would be expected to have high loadings of metals in its
stream sediments.
On the basis of previous research (Loehr, 1974; Sartor and others,
1974; Wilber and Hunter, 1979; U.S. Environmental Protection Agency, 1983b;
Garie and Mclntosh, 1986), highest metal concentrations would be expected in
streams draining urban watersheds. The generally lower concentrations found
in Marsh Creek may be somewhat atypical for streams draining urban
watersheds. The lack of heavy industrial activity in the watershed may
account for this . The Marsh Creek watershed is dominated by residential
development (41.1 percent) and commercial establishments (27.5 percent
commercial, industrial, and highway), with virtually no manufacturing. The
high percentage of residential land and the lack of manufacturing activity
both tend to decrease metals loadings to urban streams and may account for
low concentrations of metals in the sediments of this stream compared with
other streams draining urban watersheds.
General Water-Quality Properties
Several water-quality properties--dissolved oxygen, stream temperature,
pH, and specific conductance-- from water samples collected monthly from
February 1984 through January 1985 were analyzed. Summary statistics for
these general water-quality measures did not indicate impaired water quality
in any of the three streams (table 7). Specific information on these
individual measures will be presented in the paragraphs that follow.
Dissolved oxygen concentrations in each of the streams at the time of
sampling were never lower than 6.2 milligrams per liter (mg/L) . This low
value (71 percent saturation) was determined in a May 29 sample from Devil's
Cradle Creek during high flow, but it is within North Carolina water-quality
29
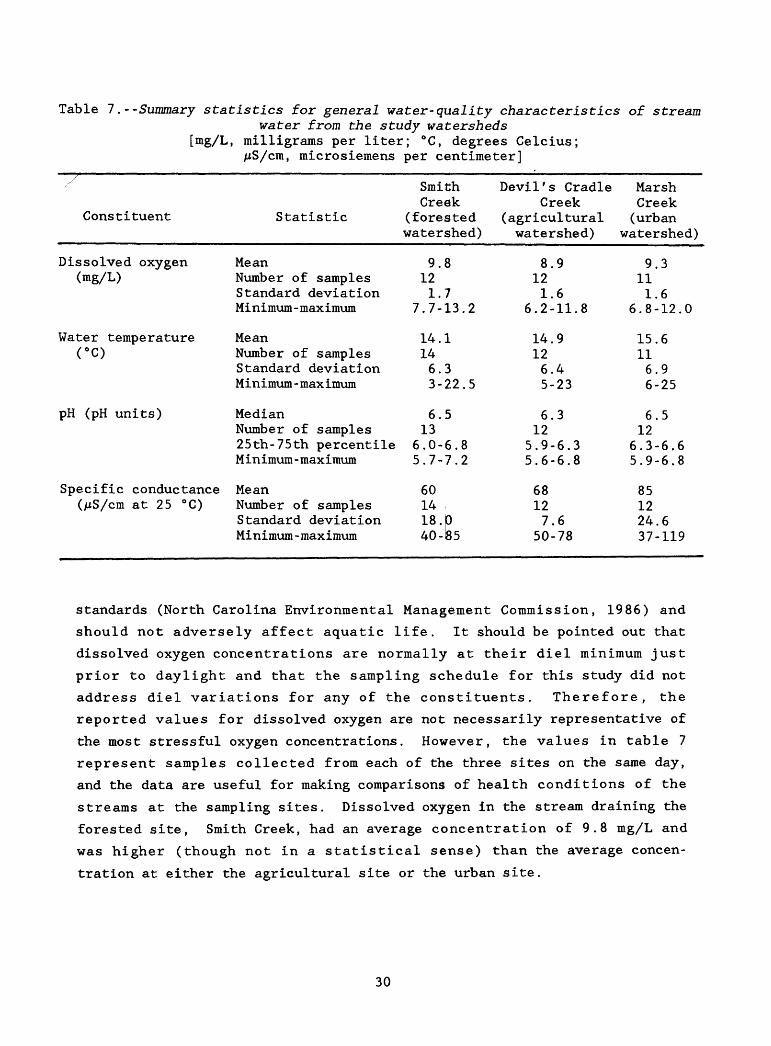
Table 7.--Summary statistics for general water-quality characteristics of streamwater from the study watersheds
[mg/L, milligrams per liter; °C, degrees Celcius; /iS/cm, microsiemens per centimeter]
/
Constituent
Dissolved oxygen(mg/L)
Water temperature(°C)
pH (pH units)
Specific conductance(US/cm at 25 °C)
Smith Creek
Statistic (forested watershed)
MeanNumber of samplesStandard deviationMinimum - max imum
MeanNumber of samplesStandard deviationM in imum - max imum
MedianNumber of samples2 5th- 7 5th per cent ileM in imum - max imum
MeanNumber of samplesStandard deviationMinimum-maximum
9.8121.7
7.7-13.2
14.1146.33-22.5
6.513
6.0-6.85.7-7.2
601418.040-85
Devil's Cradle Marsh Creek Creek
(agricultural (urban watershed) watershed)
8.9121.6
6.2-11.8
14.9126.45-23
6.312
5.9-6.35.6-6.8
68127.6
50-78
9.3111.6
6.8-12.0
15.6116.96-25
6.512
6.3-6.65.9-6.8
851224.637-119
standards (North Carolina Environmental Management Commission, 1986) and
should not adversely affect aquatic life. It should be pointed out that
dissolved oxygen concentrations are normally at their diel minimum just
prior to daylight and that the sampling schedule for this study did not
address diel variations for any of the constituents. Therefore, the
reported values for dissolved oxygen are not necessarily representative of
the most stressful oxygen concentrations. However, the values in table 7
represent samples collected from each of the three sites on the same day,
and the data are useful for making comparisons of health conditions of the
streams at the sampling sites. Dissolved oxygen in the stream draining the
forested site, Smith Creek, had an average concentration of 9.8 mg/L and
was higher (though not in a statistical sense) than the average concen
tration at either the agricultural site or the urban site.
30
Measured stream temperatures indicated no values that could adversely
affect warm-water fish species native to Piedmont streams. The highest
temperature measured during the study was 25 °C in Marsh Creek. This
temperature was recorded on August 14, 1984, and is well below the maximum
32 C prescribed by North Carolina's water-quality standards (North Carolina
Environmental Management Commission, 1986). Mean stream-water temperature
was lowest at the forested sampling site and highest at the urban sampling
site, but the differences were not statistically significant.
Measured pH values were similar at all sites. Median values are used
as a measure of central tendency for pH because the property is expressed as
a logarithmic quantity and an arithmetic mean is not appropriate. Values of
pH from the three sampling sites indicate that Devil's Cradle Creek had a
median value of 6.3 units; Smith Creek and Marsh Creek each had a median pH
of 6.5 units.
North Carolina water-quality standards specify that surface waters
shall have pH values which are "...normal for the waters in the area, which
generally shall range between 6.0 and 9.0..." (North Carolina Environmental
Management Commission, 1986). All three sites in the study at times had pH
values below the 6.0 units standard. Twenty-two percent of pH measurements
made during the study were less than 6.0 pH units. The lowest pH, a value
of 5.6 units, was measured at the agricultural site on May 29, 1984. This
sample was collected during high streamflow and may indicate a depression of
stream pH resulting from an influx of low pH rainwater. Other pH values
less than 6.0 pH units also were from samples collected during times of high
discharge. Rainfall in the region usually has a pH of about 4.5 units, so
the lowest pH in streams would be expected to occur during storms.
Analyses of water samples collected at the three study sites indicate
that the stream draining the forested watershed had the lowest mean specific
conductance (60 microsiemens per centimeter (ju,S/cm)) , and the stream
draining the urban watershed had the highest (85 /iS/cm) . The differences
among streams were statistically significant (F - 6.27, p < 0.005). For
most Piedmont streams, specific conductance is inversely related to stream
discharge, with the highest specific conductance values occurring at the
lowest flow (Daniel and others, 1979; Eddins and Crawford, 1984).
31
Nutrients
Nutrients play an important role in stream quality because they are
required for growth of phytoplankton, periphyton, and bacteria. Nutrients
are especially important in streams that are tributaries to reservoirs
because of the potential for nuisance algal growths in the quiescent,
unshaded lake waters.
Nutrient concentrations vary widely for the three study streams . Mean
concentrations of dissolved or thophosphate-phosphorus, total phosphorus,
dissolved nitrite plus nitrate-nitrogen, dissolved ammonia-nitrogen, and
total nitrogen were all higher in the stream draining the agricultural
watershed, Devil's Cradle Creek, than in either of the streams draining the
forested, Smith Creek, or urban, Marsh Creek, watersheds (tables 8 and 9).
For these data, the log-probability regression method was used to estimate
values for samples reported by the laboratory as being less than the
detection limit (Gilliom and Helsel, 1986; Helsel and Gilliom, 1986).
Concentrations of dissolved nitrite plus nitrate-nitrogen and dissolved
ammonia-nitrogen were higher in the stream draining the urban watershed than
in the stream draining the forested watershed. Dissolved or thophosphate-
phosphorus and total phosphorus concentrations were approximately the same
in the streams draining both the urban and the forested watersheds.
However, total nitrogen concentrations averaged slightly higher in the
forested watershed stream than in the urban watershed stream. The
percentage of nitrogen in the form of available nitrogen (dissolved nitrite
plus nitrate-nitrogen and dissolved ammonia nitrogen) was highest in the
stream draining the agricultural watershed and lowest in the stream draining
the forested watershed (table 8). Therefore, the stream draining the
agricultural watershed contained the greatest total amount of nutrients
available for biological uptake.
The general pattern of highest concentrations of nutrients in the
agricultural watershed is to be expected because fertilization of crops adds
nutrient loads far above naturally occurring levels. Elevated nutrient
concentrations in urban watersheds have been found by other researchers who
cited leaking sewer lines and lawn fertilization as contributing nutrients
to streams (Pitt and Bozeman, 1980; Porter, 1980).
32
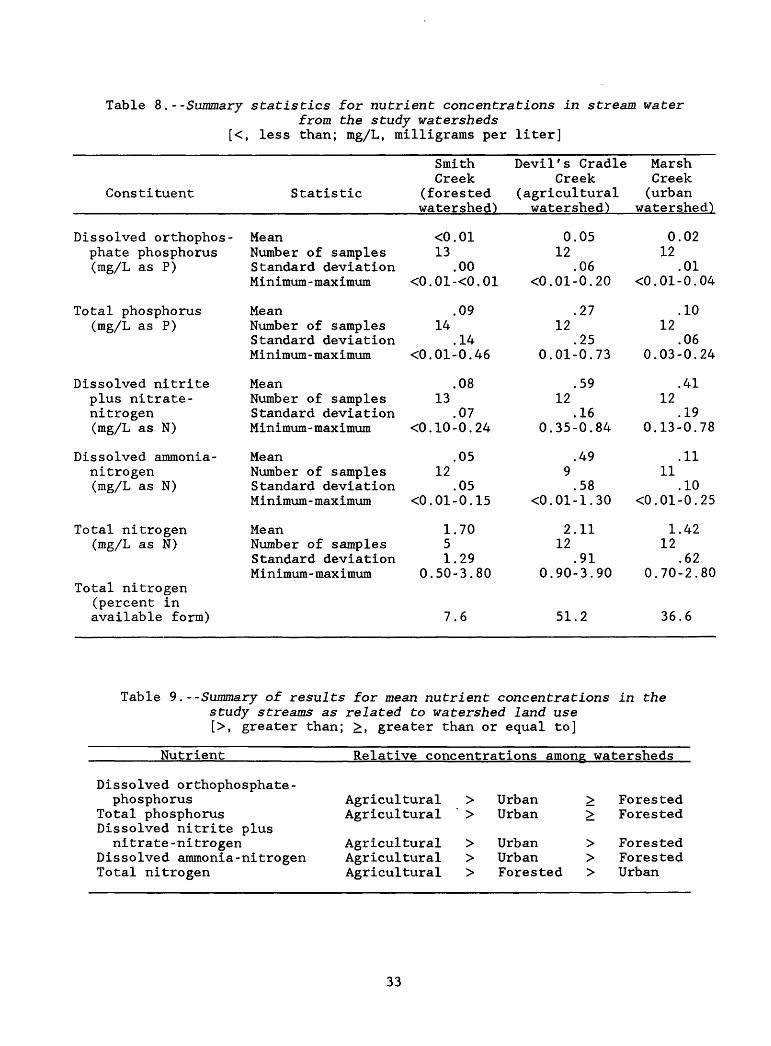
Table 8. --Summary statistics for nutrient concentrations in stream waterfrom the study watersheds
[<, less than; mg/L, milligrams per liter]
Constituent
Dissolved orthophos- phate phosphorus (mg/L as P)
Total phosphorus (mg/L as P)
Dissolved nitriteplus nitrate - nitrogen (mg/L as N)
Dissolved ammonia -nitrogen (mg/L as N)
Total nitrogen (mg/L as N)
Total nitrogen (percent in available form)
Statistic
Mean Number of samples Standard deviation Minimum - maximum
Mean Number of samples Standard deviationMinimum -maximum
MeanNumber of samples Standard deviation M in imum - max imum
MeanNumber of samples Standard deviation M in imum - max imum
Mean Number of samples Standard deviationM in imum - max imum
Smith Creek
(forested watershed)
<0.01 13
.00 <0.01-<0.01
.09 14
.14<0. 01-0. 46
.0813
.07 <0. 10-0. 24
.0512
.05 <0. 01-0. 15
1.70 5 1.29
0.50-3.80
7.6
Devil's Cradle Creek
(agricultural watershed)
0.05 12
.06 <0. 01-0. 20
.27 12
.250.01-0.73
.5912
.16 0.35-0.84
.499 .58
<0. 01-1. 30
2.11 12
.910.90-3.90
51.2
Marsh Creek (urban
watershed)
0.02 12
.01 <0. 01-0. 04
.10 12
.060.03-0.24
.4112
.19 0.13-0.78
.1111
.10 <0. 01-0. 25
1.42 12
.620.70-2.80
36.6
Table 9.--Summary of results for mean nutrient concentrations in the study streams as related to watershed land use [>, greater than; >, greater than or equal to]
Nutrient
Dissolved orthophosphate- phosphorus
Total phosphorus Dissolved nitrite plus nitrate -nitrogen
Dissolved ammonia-nitrogen Total nitrogen
Relative concentrations among watersheds
Agricultural : Agricultural :
Agricultural : Agricultural : Agricultural :
> Urban > > Urban >
> Urban > > Urban > > Forested >
Forested Forested
Forested Forested Urban
33

Trace Metals
Samples for both total and dissolved forms of the trace metals cadmium,
chromium, copper, iron, lead, manganese, nickel, and zinc were analyzed from
the three study sites on an approximately monthly basis. For the purpose of
calculating means, concentrations reported as less than the detection limit
were estimated by using the log-probability regression method (Gilliom and
Helsel, 1986; Helsel and Gilliom, 1986). Summary statistics for these
constituents are presented in tables 10 and 11.
Concentrations of metals in the three streams were lower than those
known to pose a threat to aquatic life. This point is illustrated by
quantitative comparisons between total metal concentrations found during
this study and North Carolina water-quality standards for all freshwaters
(table 11) . Water-quality standards based on total concentrations of the
constituent have been established for all of the metals considered in this
report, with the exception of manganese. Mean concentrations for total
cadmium, total chromium, total copper, total JLead, total nickel, and total
zinc were all below existing water-quality Standards. However, mean total
iron concentrations exceeded the water-quality standard at all three sites.
These high concentrations of iron, however, are not considered harmful to
aquatic life or human health. The existing iron standard of 1,000
micrograms per liter (/ug/L) was established for aesthetic purposes, to
prevent staining of laundry and fixtures.
Although mean concentrations of metals were generally less than
existing water-quality standards, concentrations in individual samples
occasionally exceeded the standards. This was the case for total copper,
total lead, and total zinc at all three sites and for total cadmium at the
forested and agricultural sites. As a| general rule, high metals
concentrations in the streams occurred du|ring periods of high stream
discharge. Therefore, while the norm for these sites is a condition
conducive to a healthy aquatic community, concentrations of metals that may
threaten aquatic life were measured at titoes at all three sites. Even
though water-quality standards for metals were exceeded, healthy biological
communities existed in the streams draining the forested and agricultural
watersheds. Therefore, the use of total metal concentrations for standards
may not be a reliable indicator of the biologically available fraction.
34
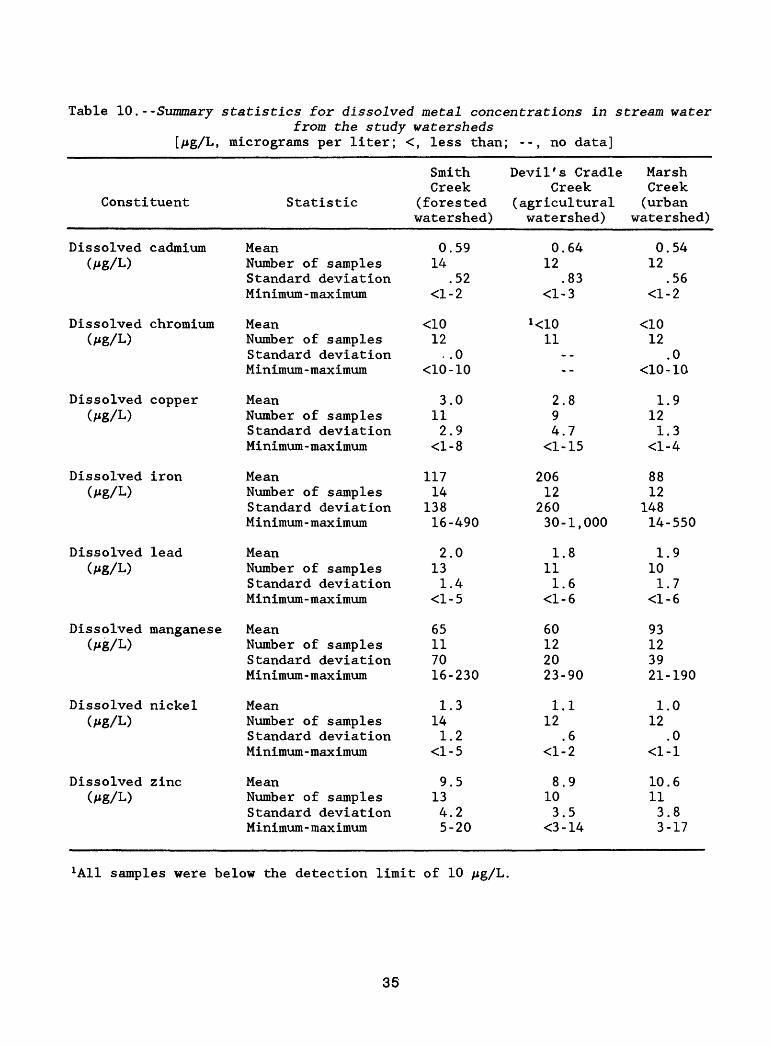
Table 10.- -Summary statistics for dissolved metal concentrations in stream waterfrom the study watersheds
[/jg/L, micrograms per liter; <, less than; --, no data]
Constituent
Dissolved cadmium(/*g/L)
Dissolved chromium(/ g/L)
Dissolved copper(/ g/L)
Dissolved iron(/*g/L)
Dissolved lead</*g/L>
Dissolved manganese(/ g/L)
Dissolved nickel(/*g/L)
Dissolved zinc</*g/L)
Statistic
MeanNumber of samplesStandard deviationMinimum - max imum
MeanNumber of samplesStandard deviationMinimum - max imum
MeanNumber of samplesStandard deviationMinimum - max imum
MeanNumber of samplesStandard deviationMinimum - max imum
MeanNumber of samplesStandard deviationMinimum-maximum
MeanNumber of samplesStandard deviationMinimum - max imum
MeanNumber of samplesStandard deviationMinimum - max imum
MeanNumber of samplesStandard deviationMinimum - max imum
Smith Creek
(forested watershed)
0.5914
.52<l-2
<1012
. .0<10-10
3.0112.9
<l-8
11714
13816-490
2.0131.4
<l-5
65117016-230
1.3141.2
<l-5
9.5134.25-20
Devil's Cradle Creek
(agricultural watershed)
0.6412
.83<l-3
^1011
--
2.894.7
<1-15
20612
26030-1,000
1.8111.6
<l-6
60122023-90
1.112
.6<l-2
8.9103.5
<3-14
Marsh Creek (urban
watershed)
0.5412
.56<l-2
<1012
.0<10-10
1.9121.3
<l-4
8812
14814-550
1.9101.7
<l-6
93123921-190
1.012
.0<1-1
10.6113.83-17
1A11 samples were below the detection limit of 10
35
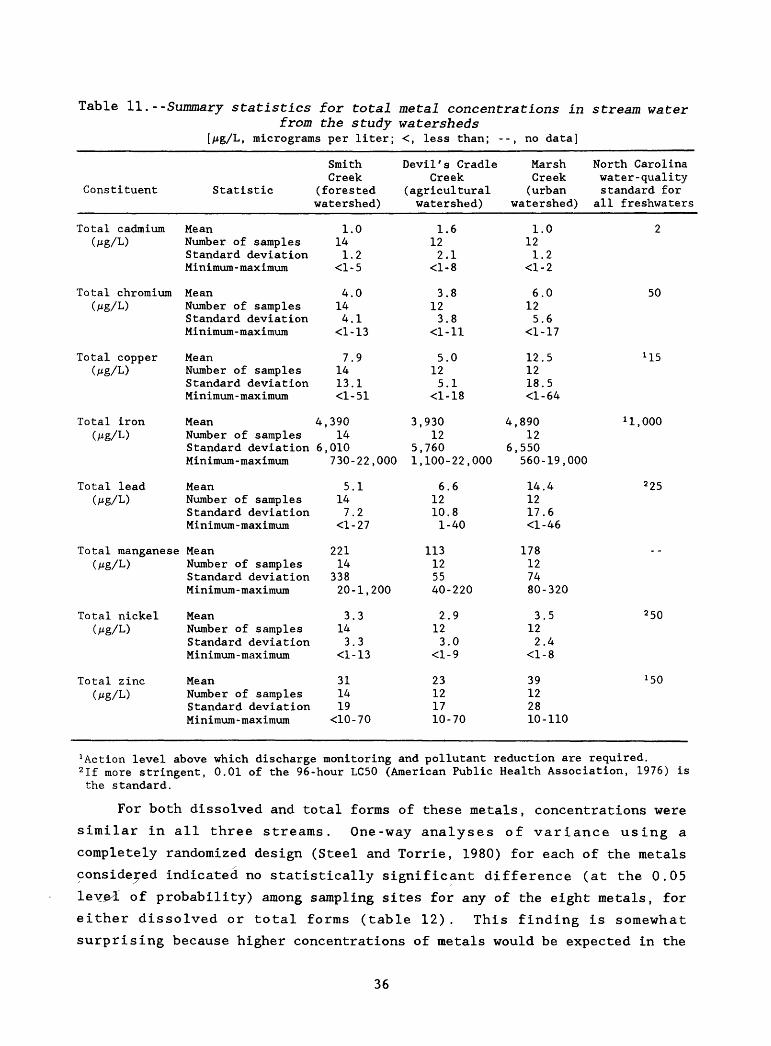
Table 11. --Summary statistics for total metal concentrations in stream waterfrom the study watersheds
[/ig/L, micrograms per liter; <, less than; --, no data]
Constituent
Total cadmium(/zg/L)
Total chromium(/zg/L)
Total copper(/zg/L)
Statistic
MeanNumber of samplesStandard deviationMinimum-maximum
MeanNumber of samplesStandard deviationMinimum-maximum
MeanNumber of samplesStandard deviationMinimum-maximum
SmithCreek
(forestedwatershed)
1.0141.2
<l-5
4.0144.1
<1-13
7.91413.1<1-51
Devil's CradleCreek
(agriculturalwatershed)
1.6122,1
<l-8
3.8123.8
<1-11
5.0125.1
<1-18
MarshCreek(urban
watershed)
1.0121.2
<l-2
6.0125.6
<1-17
12.51218.5<l-64
North Carolinawater -qualitystandard for
all freshwaters
2
50
U5
Total iron Mean 4,390 (/zg/L) Number of samples 14
Standard deviation 6,010 Minimum-maximum 730-22,000
3,930 4,89012 12
5,760 6,5501,100-22,000 560-19,000
^.OOO
Total lead(MgA)
Total manganese
Total nickel(MgA)
Total zinc(MgA)
MeanNumber of samples Standard deviationMinimum - maximum
Mean Number of samples Standard deviationMinimum-maximum
MeanNumber of samples Standard deviationMinimum- maximum
MeanNumber of samples Standard deviationMinimum - maximum
5.114 7.2
<l-27
221 14
33820-1,200
3.314 3.3
<1-13
3114 19
<10-70
6.612 10.81-40
113 125540-220
2.912 3.0
<l-9
2312 1710-70
14.412 17.6<l-46
178 12 7480-320
3.512 2.4
<l-8
3912 2810-110
2 25
--
2 50
*50
Action level above which discharge monitoring and pollutant reduction are required. 2 If more stringent, 0.01 of the 96-hour LC50 (American Public Health Association, 1976) is the standard.
For both dissolved and total forms of these metals, concentrations were
similar in all three streams. One-way analyses of variance using a
completely randomized design (Steel and Torrie, 1980) for each of the metals
considered indicated no statistically significant difference (at the 0.05
leve^l of probability) among sampling sites for any of the eight metals, for
either dissolved or total forms (table 12). This finding is somewhat
surprising because higher concentrations of metals would be expected in the
36
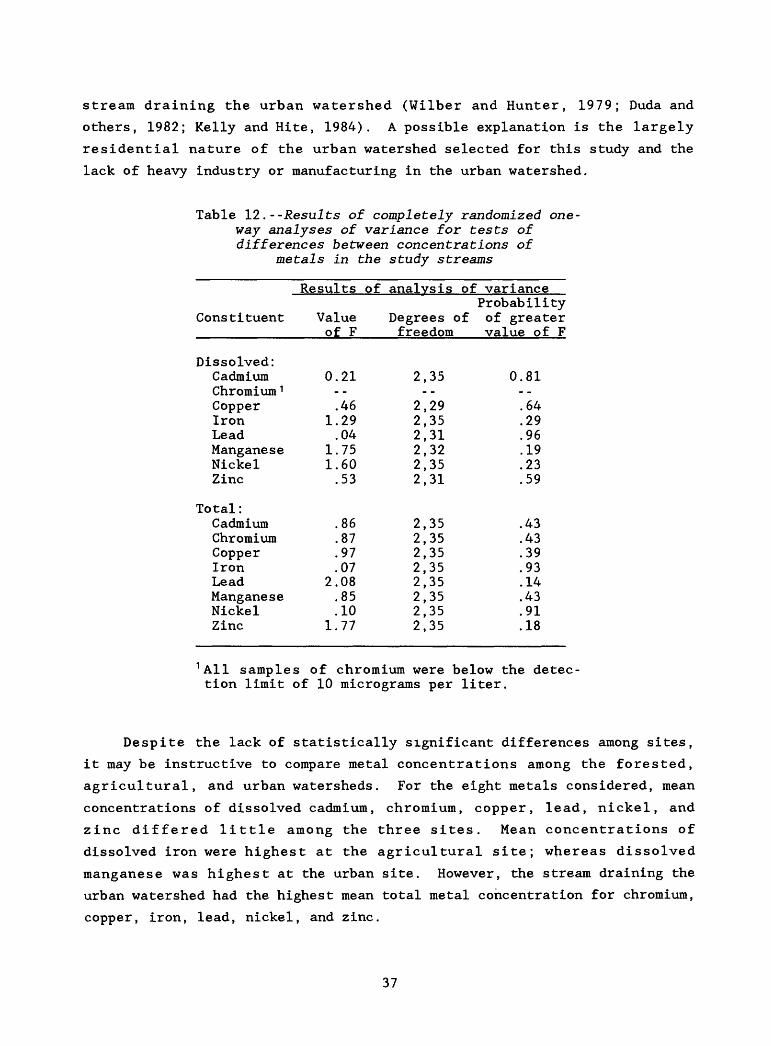
stream draining the urban watershed (Wilber and Hunter, 1979; Duda and
others, 1982; Kelly and Kite, 1984). A possible explanation is the largely
residential nature of the urban watershed selected for this study and the
lack of heavy industry or manufacturing in the urban watershed.
Table 12.- -Results of completely randomized one way analyses of variance for tests of differences between concentrations of
metals in the study streams
Results of analysis of varianceProbability
Constituent Value Degrees of of greater of F____freedom value of F
Dissolved:CadmiumChromium 1CopperIronLeadManganeseNickelZinc
Total:CadmiumChromiumCopperIronLeadManganeseNickelZinc
0.21
.461.29.04
1.751.60.53
.86
.87
.97
.072.08.85.10
1.77
2,35
2,292,352,312,322,352,31
2,352,352,352,352,352,352,352,35
0.81
.64
.29
.96
.19
.23
.59
.43
.43
.39
.93
.14
.43
.91
.18
1 All samples of chromium were below the detec tion limit of 10 micrograms per liter.
Despite the lack of statistically significant differences among sites,
it may be instructive to compare metal concentrations among the forested,
agricultural, and urban watersheds. For the eight metals considered, mean
concentrations of dissolved cadmium, chromium, copper, lead, nickel, and
zinc differed little among the three sites. Mean concentrations of
dissolved iron were highest at the agricultural site; whereas dissolved
manganese was highest at the urban site. However, the stream draining the
urban watershed had the highest mean total metal concentration for chromium,
copper, iron, lead, nickel, and zinc.
37
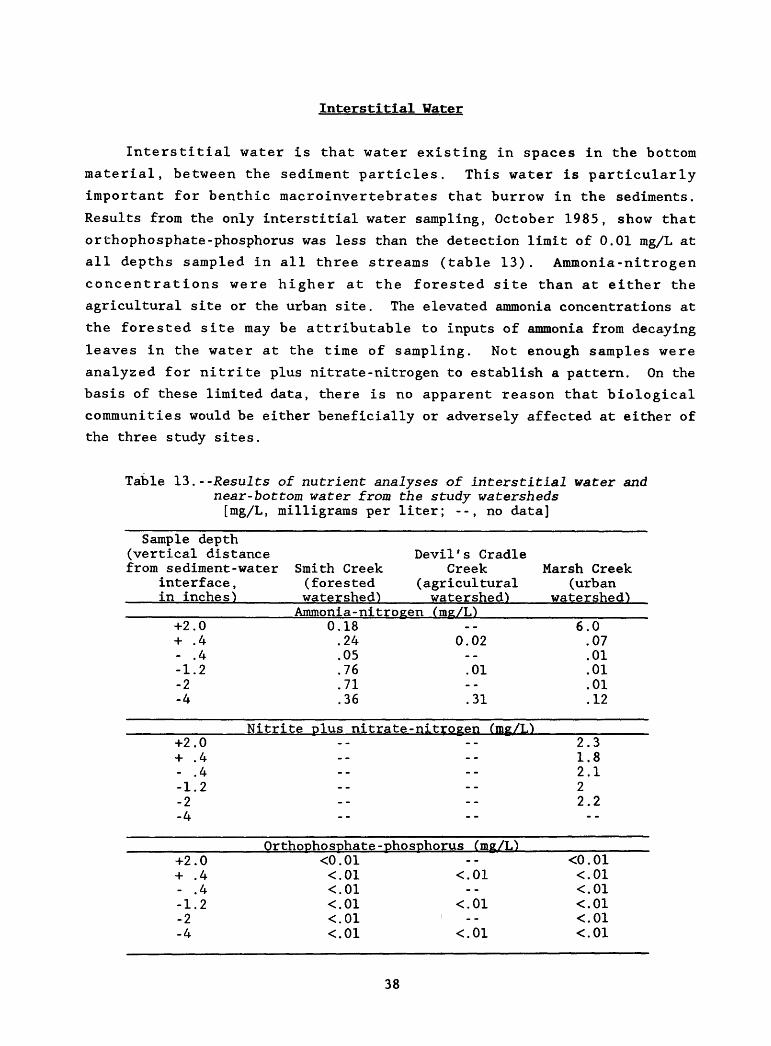
Interstitial Water
Interstitial water is that water existing in spaces in the bottom
material, between the sediment particles. This water is particularly
important for benthic macroinvertebrates that burrow in the sediments.
Results from the only interstitial water sampling, October 1985, show that
orthophosphate-phosphorus was less than the detection limit of 0.01 mg/L at
all depths sampled in all three streams (table 13). Ammonia-nitrogen
concentrations were higher at the forested site than at either the
agricultural site or the urban site. The elevated ammonia concentrations at
the forested site may be attributable to inputs of ammonia from decaying
leaves in the water at the time of sampling. Not enough samples were
analyzed for nitrite plus nitrate-nitrogen to establish a pattern. On the
basis of these limited data, there is no apparent reason that biological
communities would be either beneficially or adversely affected at either of the three study sites.
Table 13. --Results of nutrient analyses of interstitial water andnear-bottom water from the study watersheds
[mg/L, milligrams per liter; --, no data]
Sample depth (vertical distance Devil's Cradle from sediment -water Smith Creek Creek Marsh Creek
interface, (forested (agricultural (urban in inches) watershed) watershed) watershed)
Ammonia-nitroEen (IBE/L)+2.0+ .4- .4-1.2-2-4
0.18.24 0.05.76.71.36
.02
.01
.31
6.0.07.01.01.01.12
Nitrite D!US nitrate-nitrozen (me/L)+2.0+ .4- .4-1.2-2-4
+2.0+ .4- .4-1.2-2-4
--
--
Orthochosphate -phosphorus<0.01<.01 <<.01<.01 <<.01<.01 <
(mg/L)
.01
.01
.01
2.31.82.122.2
<0.01<.01<.01<.01<.01<.01
38
AQUATIC INVERTEBRATES
Benthic macroinvertebrate data from the three streams have been
summarized both for individual taxa and for 12 major taxonomic groups.
Discussions of taxa richness and abundance focus on the data summarized for
these groups (primarily families of aquatic insects). The discussions draw
on concepts of classical stream ecology claiming that certain groups of
stream organisms, especially the insects belonging to the orders
Ephemeroptera, Plecoptera, and Trichoptera, are more sensitive to stress
from pollution and other disturbances than other aquatic invertebrate groups
(Richardson, 1925; Patrick, 1949; Gaufin, 1958; Hynes, 1960). These
concepts have been refined since the pioneering work of the early
researchers and a good update and review has been published by Wiederholm
(1984).
Taxa Richness
Mean taxa richness values (table 14) generally showed the same between-
station patterns for both kick-net and standardized qualitative collections.
However, more species were collected with standardized qualitative samples,
and between-site changes could be more easily detected.
Analysis of variance is the appropriate parametric statistical test for
comparing mean numbers of taxa found at the three sampling sites. Like
other parametric tests, analyses of variance require that the samples are
independent, come from a normally distributed population, and have equal
variances. For the macroinvertebrate data, samples within each of the 12
invertebrate groups, for each of the three stations, and for each of the two
sampling techniques, were tested to see if all three of these assumptions
were met. In all, there were 72 subsamples to be tested. Twenty-two of the
72 subsamples (31 percent) failed to meet at least one of the assumptions.
Nonetheless, the consequences of violating the assumptions are relatively
small when sample sizes are similar (Norusis, 1983). Therefore, the
traditional parametric tests were applied. Where an analysis of variance
indicated a statistically significant difference among means, Duncan's
multiple-range test (Steel and Torrie, 1980) was used to identify the
specific means that were statistically different.
39
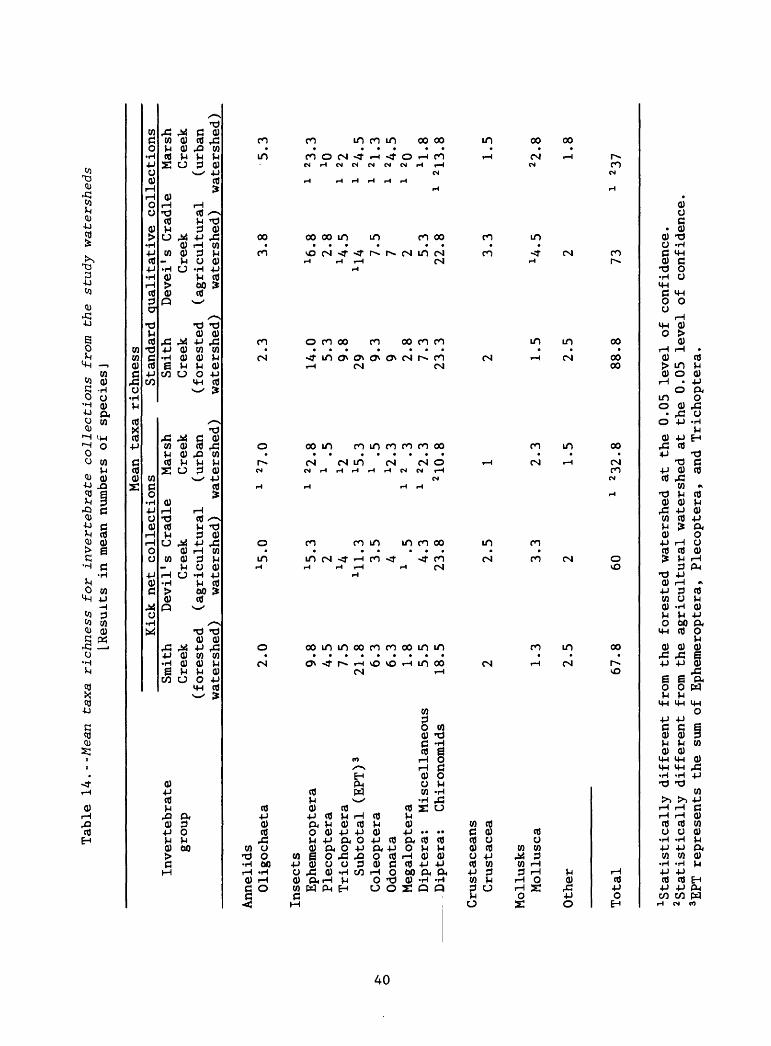
Table 14.--Wean ta
xa richness for invertebrate collections from th
e study watersheds
[Res
ults
in mean nu
mber
s of
sp
ecie
sJ
Mean taxa ri
chne
ssKick net
collections
Invertebrate
Smith
Devi
l's
Cradle
Marsh
group
Creek
Creek
Creek
(for
este
d (agricultural
(urb
an
watershed)
watershed)
wate
rshe
d)
Anne
lids
Olig
ocha
eta
Inse
cts
Ephe
mero
pter
aPlecoptera
Tric
hopt
era
Subt
otal
(E
PT)
3Co
leop
tera
Odonata
Megaloptera
Diptera:
Misc
ella
neou
sDiptera:
Chir
onom
ids
Crustaceans
Crus
tace
a
Moll
usks
Mollusca
Othe
r
Total
2.0
9.8
4.5
7.5
21.8 6.3
6.3
1.8
5.5
18.5 2 1.3
2.5
67.8
l5-°
X5.3 2 U H
i. 3
3.5
4 1 .5
4.3
23.8 2.5
3.3
2 60
1 27.0
1 22.8
1 .5
X2 X5.3
1 .5
X2.3
1 2
.31
22.3
210
.8 1 2.3
1.5
1 232.
8
Standard qualitative
coll
ecti
ons
Smith
Deve
i's
Crad
le
Marsh
Creek
Creek
Creek
(for
este
d (a
gric
ultu
ral
(urban
watershed)
wate
rshe
d)
wate
rshe
d)
2.3
14.0 5.3
9.8
299.3
9 2.8
7.3
23.3 2 1.5
2.5
88.8
3.8
X6.8 2.8
X4.5
X14 7.
57 2 5.3
22.8 3.3
H.5
2 73
5.3
1 23.3
X0i
221
24.5
1 21
.31
24.5
1 20 H.8
1 21
3.8
1.5
22.8 1.8
1 23
7
1Sta
tist
ical
ly di
ffer
ent
from the
fore
sted
watershed at
the
0.05
le
vel
of confidence.
Statistically different
from t
he agricultural watershed at the
0.05
le
vel
of confidence
3EPT represents the
sum
of Ephemeroptera, Pl
ecop
tera
, and
Trichoptera.
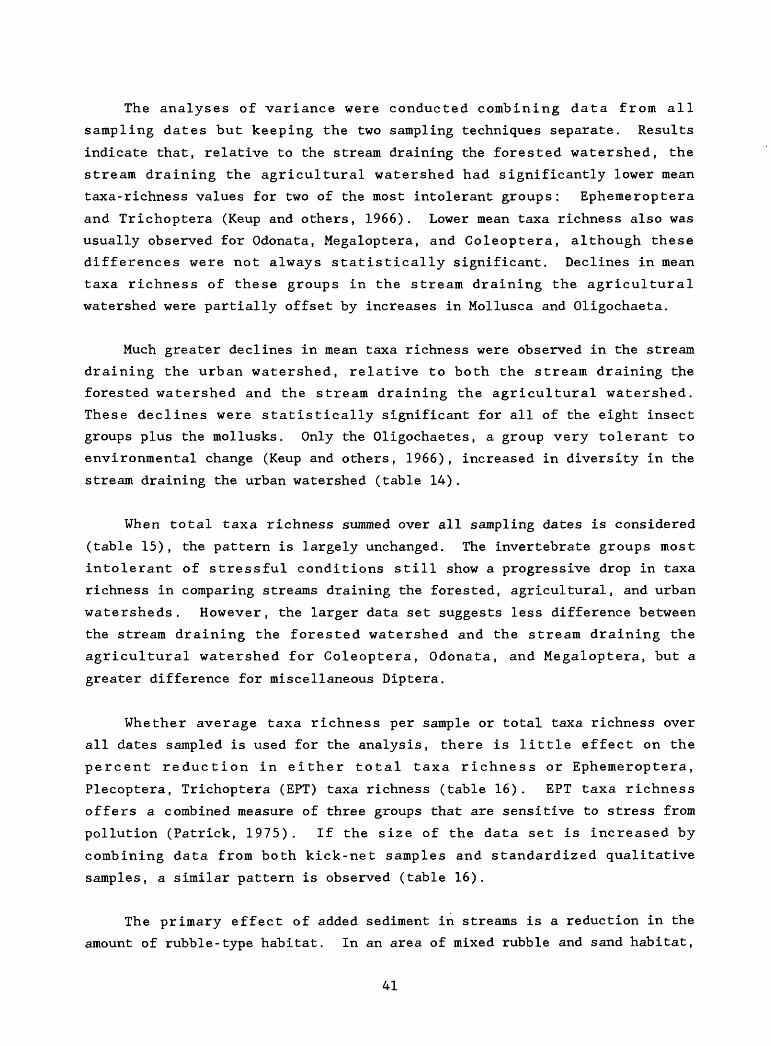
The analyses of variance were conducted combining data from all
sampling dates but keeping the two sampling techniques separate. Results
indicate that, relative to the stream draining the forested watershed, the
stream draining the agricultural watershed had significantly lower mean
taxa-richness values for two of the most intolerant groups: Ephemeroptera
and Trichoptera (Keup and others, 1966). Lower mean taxa richness also was
usually observed for Odonata, Megaloptera, and Coleoptera, although these
differences were not always statistically significant. Declines in mean
taxa richness of these groups in the stream draining the agricultural
watershed were partially offset by increases in Mollusca and Oligochaeta.
Much greater declines in mean taxa richness were observed in the stream
draining the urban watershed, relative to both the stream draining tjie
forested watershed and the stream draining the agricultural watershed.
These declines were statistically significant for all of the eight insect
groups plus the mollusks. Only the Oligochaetes, a group very tolerant to
environmental change (Keup and others, 1966), increased in diversity in the
stream draining the urban watershed (table 14).
When total taxa richness summed over all sampling dates is considered
(table 15), the pattern is largely unchanged. The invertebrate groups most
intolerant of stressful conditions still show a progressive drop in taxa
richness in comparing streams draining the forested, agricultural, and urban
watersheds. However, the larger data set suggests less difference between
the stream draining the forested watershed and the stream draining the
agricultural watershed for Coleoptera, Odonata, and Megaloptera, but a
greater difference for miscellaneous Diptera.
Whether average taxa richness per sample or total taxa richness over
all dates sampled is used for the analysis, there is little effect on the
percent reduction in either total taxa richness or Ephemeroptera,
Plecoptera, Trichoptera (EPT) taxa richness (table 16). EPT taxa richness
offers a combined measure of three groups that are sensitive to stress from
pollution (Patrick, 1975). If the size of the data set is increased by
combining data from both kick-net samples and standardized qualitative
samples, a similar pattern is observed (table 16).
The primary effect of added sediment in streams is a reduction in the
amount of rubble-type habitat. In an area of mixed rubble and sand habitat,
41
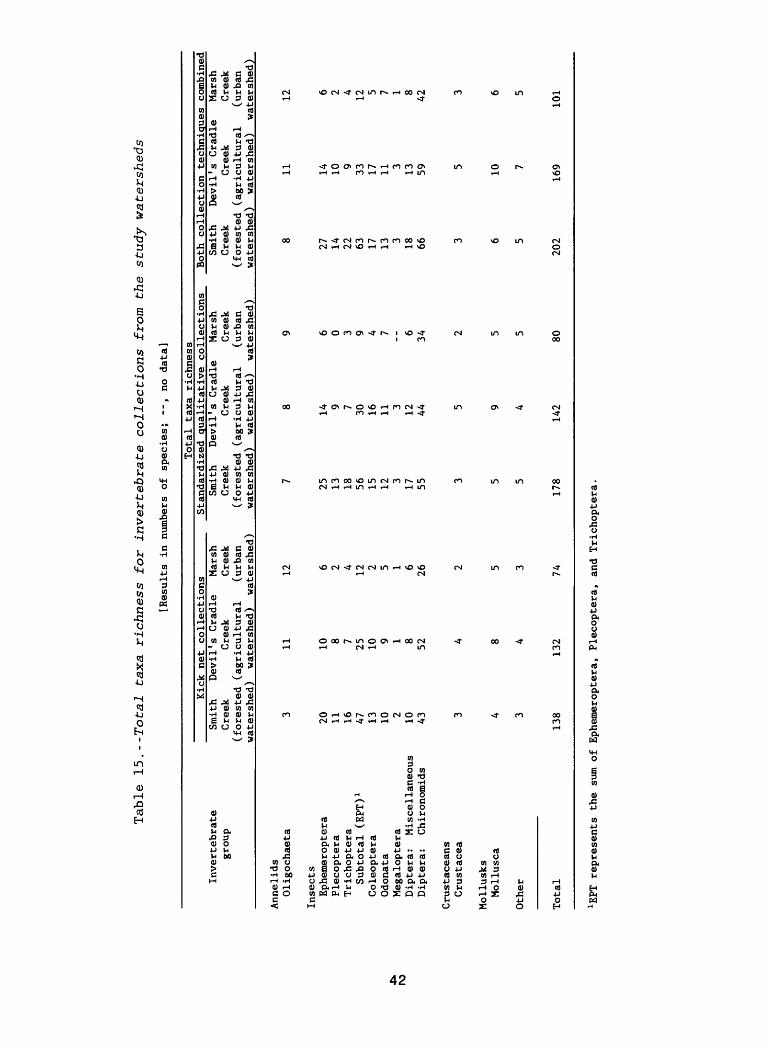
ro
Table 15
.--Total
taxa richness for invertebrate collections from th
e study watersheds
[Res
ults
in
num
bers
of species; --
, no
data
]
Total
taxa ri
chne
ssKick ne
t collections
Invertebrate
group
Annelids
Oligoc
haet
a
Inse
cts
Ephe
mero
pter
aPl
ecop
tera
Tric
hopt
era
Subtotal (E
PT)
1Co
leop
tera
Odonata
Megaloptera
Dipt
era:
Miscellaneous
Dipt
era:
Chironomids
Crus
tace
ans
Crustacea
Mo Husks
Moll
usca
Othe
r
Total
Smith
Creek
(forested
watershed)
3
20 11 16 47 13 10 2 10 43 3 4 3
138
Devi
l's
Crad
le
Marsh
Cree
k Cr
eek
(agr
icul
tura
l (u
rban
wa
ters
hed)
watershed)
11 10 8 7 25 10 9 1 852 4 8 4
132
12 6 2 4 12 2 5 1 6 26 2 5 3
74
Stan
dard
ized
qualitative
Smith
Cree
k (forested
wate
rshe
d)
7 25 13 18 56 15 12 3 17 55 3 5 5
178
coll
ecti
ons
Devi
l's
Crad
le
Marsh
Cree
k Cr
eek
(agr
icul
tura
l (u
rban
watershed)
wate
rshe
d)
8 14 9 7 30 16 11 3 12 44 5 9 4
142
9 6 0 3 9 4 7 -- 6 34 2 5 5 80
Both
collection te
chni
ques
Smith
Cree
k (forested
watershed)
8
27 14 22 63 17 13 3 18 66 3 6 5
202
combined
Devi
l's
Crad
le
Marsh
Cree
k Cr
eek
(agricultural
(urban
watershed)
wate
rshe
d)
11 14 10 9 33 17 11 3 13 59 5 10 7
169
12 6 2 4 12 5 7 1 842 3 6 5
101
XEPT
re
pres
ents
th
e su
m of
Ep
heme
ropt
era,
Plecoptera,
and
Tric
hopt
era.
most of the invertebrates will occupy the rubble substrate. If sedimen
tation causes a decrease in rubble-type habitat, a reduction in taxa
richness will be observed due to the relation between species richness and
area (Gleason, 1922) . In an area affected by sedimentation, if the area
sampled is increased, there is a good probability of including more rubble-
type habitat. Taxa-richness values from sediment-affected areas will then
approach those from nonsediment-affected areas. The net result is that
sedimentation decreases the numbers of individual organisms but not the
number of taxa. In this study, combining samples is, in effect, the same as
increasing the area sampled. Similar reductions in taxa richness were
observed for all sample sizes; therefore, it is likely that effects other
than sedimentation are affecting the benthic fauna (Lenat and others, 1981).
Otherwise, as sample size is increased, taxa richness values would also
increase.
Table 16.- -Reduction in taxa richness for streams draining agricultural and urban watersheds, compared to the stream
draining the forested watershed
Percent reduction in taxa richnessDevil's Cradle Marsh
Measure of taxa richness Creek Creek(agricultural (urban watershed) watershed)
Kick net samples :Mean taxa richnessMean EPT 1 taxa richnessTotal taxa richnessTotal EPT taxa richness
Kick net samples and standardizedqualitative samples combined:
Total taxa richnessTotal EPT taxa richness
12484
47
1648
52764674
5081
indicates the sum of Ephemeroptera, Plecoptera, and Trichoptera.
The observed reductions in taxa richness indicate moderate stress in
the stream draining the agricultural watershed and severe stress in the
stream draining the urban watershed (North Carolina Division of
Environmental Management, 1983). When data from both sampling techniques
and from all sampling dates are combined, total taxa richness relative to
the stream draining the forested watershed was reduced by 16 percent in the
stream draining the agricultural watershed and by 50 percent in the stream
draining the urban watershed (table 16).
43
Abundance
Density (abundance) values often mirrored the patterns observed for
taxa-richness values, but several important differences were seen,
especially in the stream draining the Devil's Cradle Creek watershed. The
abundance of all insect groups was very low $.n the stream draining the Marsh
Creek watershed. Note that quantitative estimates of density were generated
only from kick-net samples.
As expected, the densities of Ephemeroptera and Plecoptera were lower
in the agricultural watershed than in the forested watershed. However, in
contrast with species richness values, no decline in Trichoptera density was
observed in the agricultural watershed compared to the forested watershed.
This pattern indicates that some trichopteran species are tolerant of
agricultural runoff and other changes associated with agricultural land
uses, such as reduced shading, increased sediment, and higher stream
temperatures. The opposite trend was observed for Coleoptera in this
stream. The stream draining the agricultural watershed had many species but
few individuals of Coleoptera, especially in the Dytiscidae and
Hydrophilidae. Elmid beetles, a sensitive coleopteran family (Gaufin,
1973) , were abundant in the stream draining the forested watershed but were
considerably less abundant in the stream draining the agricultural
watershed.
Several groups were found to be in greater abundance in the streams
draining the Devel's Cradle Creek and Marsh Creek watersheds than in the
stream draining the Smith Creek watershed. Chironomidae were very abundant
in the agricultural watershed stream, averaging almost 3,000 per sample
versus 200 to 500 per sample in the other two streams. Oligochaeta were
abundant in both streams draining the agricultural and urban watersheds, but
maximum density was recorded in the urban watershed stream. The
invertebrates making up the "Other" category were most abundant in the
stream draining the agricultural watershed but also were abundant in the
urban watershed stream. This increased density was due primarily to the
appearance in November of the tolerant nemertean, Prostoma graecens.
A different seasonal pattern was noted in the density of insect groups
in the stream draining the agricultural watershed, relative to streams in
44
both the forested and urban watersheds. For the agricultural site, a sharp
maximum was recorded for the summer (June) samples, whereas the stream
draining the urban watershed had a moderate increase in density in June, but
maximum density was recorded in the autumn (November). This pattern
indicates that allochthonous energy sources (that is, leaf-fall in autumn)
were of primary importance at the urban site, while summertime autochthonous
production was most important at the agricultural site. Another
investigation (Schlosser and Karr, 1981) also has suggested that
autochthonous productivity is an important energy source in streams draining
agricultural watersheds.
When density values of individual groups of invertebrates are expressed
as a percentage of total abundance (table 17), it is apparent that the
benthic community structure in the stream draining the forested watershed is
similar to that observed at several other Piedmont streams in forested
watersheds in North Carolina: Olin Creek, Iredell County; Huffines Mill
Creek, Rockingham County; Four-Mile Creek, Davidson County (North Carolina
Division of Environmental Management, 1982). All these sites are dominated
by Ephemeroptera (38 to 46 percent), Diptera (25 to 29 percent), and
Trichoptera (10 to 16 percent). At the agricultural site, dominance
switches from intolerant Ephemeroptera to tolerant Diptera (63 percent) .
Similar results have been observed at agricultural sites in Rockingham
County (North Carolina Division of Environmental Management, 1982) . In the
stream draining the urban watershed, the community is dominated by the most
tolerant group, Oligochaeta. Together, Diptera and Oligochaeta comprise
over 75 percent of the invertebrate fauna in the stream draining the urban
watershed. Streams in urban areas are typically dominated by these two
groups, which are both tolerant of poor water quality (Lenat and others,
1981).
Number of Unique Taxa
The number of unique taxa is defined here as the number of taxa
(excluding grossly tolerant species) occurring in only one of the three
streams. This type of analysis is important because unpolluted streams
often have many intolerant species (species that cannot live in polluted
environments) which occur at low abundances. The most intolerant species
may occur only in the cleanest streams and, therefore, may be important
indicators of water-quality changes, which can not be adequately evaluated
45
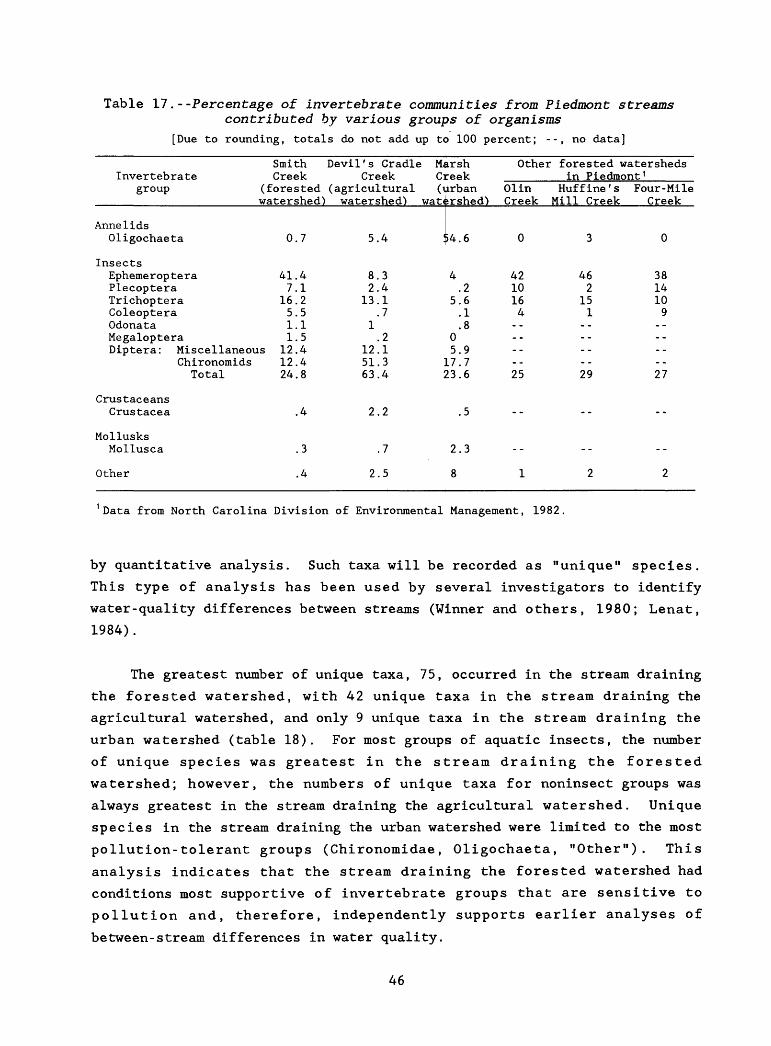
Table 17 . - -Percentage of invertebrate communities from Piedmont streams contributed by various groups of organisms
[Due to rounding, totals do not add up to 100 percent; --, no data]
Invertebrate group
AnnelidsOligochaeta
InsectsEphemeroptera Plecoptera Trichoptera Coleoptera Odonata
Smith Creek
(forested watershed)
0.7
41.4 7.1
16.2 5.5 1.1
Megaloptera 1.5 Diptera: Miscellaneous 12.4
Chironomids 12.4Total
CrustaceansCrustacea
MollusksMollusca
Other
24.8
.4
.3
.4
Devil's Cradle Creek
(agricultural watershed)
5.4
8.3 2.4
13.1 .7
1.2
12.1 51.363.4
2.2
.7
2.5
Marsh Creek (urban
watershed)
^4.6
4 .2
5.6 .1 .8
0 5.9
17.723.6
.5
2.3
8
Other
Olin Creek
0
42 10 16 4
--
25
--
--
1
forested watersheds in Piedmont 1
Huf fine's Four-Mile Mill Creek Creek
3
46 2
15 1
--
29
--
--
2
0
38 14 10 9
--
27
--
--
2
1 Data from North Carolina Division of Environmental Management, 1982.
by quantitative analysis. Such taxa will be recorded as "unique" species.
This type of analysis has been used by several investigators to identify
water-quality differences between streams (Winner and others, 1980; Lenat,
1984).
The greatest number of unique taxa, 75, occurred in the stream draining
the forested watershed, with 42 unique taxa in the stream draining the
agricultural watershed, and only 9 unique taxa in the stream draining the
urban watershed (table 18). For most groups of aquatic insects, the number
of unique species was greatest in the stream draining the forested
watershed; however, the numbers of unique taxa for noninsect groups was
always greatest in the stream draining the agricultural watershed. Unique
species in the stream draining the urban watershed were limited to the most
pollution-tolerant groups (Chironomidae, Oligochaeta, "Other"). This
analysis indicates that the stream draining the forested watershed had
conditions most supportive of invertebrate groups that are sensitive to
pollution and, therefore, independently supports earlier analyses of
between-stream differences in water quality.
46
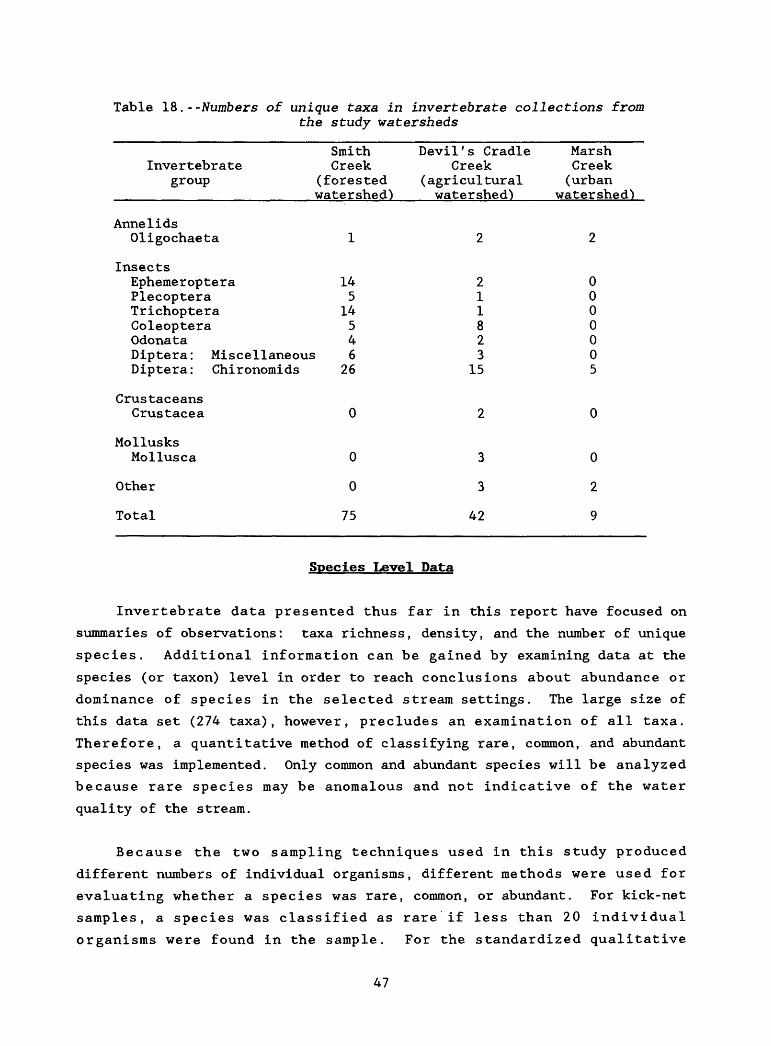
Table 18.--Numbers of unique taxa in invertebrate collections fromthe study watersheds
Invertebrate group
SmithCreek
(forested watershed)
Devil's CradleCreek
(agricultural watershed)
Marsh Creek (urban
watershed)
AnnelidsOligochaeta 1
InsectsEphemeroptera 14Plecoptera 5Trichoptera 14Coleoptera 5Odonata 4Diptera: Miscellaneous 6Diptera: Chironomids 26
211823
15
CrustaceansCrustacea
MollusksMollusca
Other
Total
0
0
0
75
2
3
3
42
0
0
2
9
Species Level Data.
Invertebrate data presented thus far in this report have focused on
summaries of observations: taxa richness, density, and the number of unique
species. Additional information can be gained by examining data at the
species (or taxon) level in order to reach conclusions about abundance or
dominance of species in the selected stream settings. The large size of
this data set (274 taxa), however, precludes an examination of all taxa.
Therefore, a quantitative method of classifying rare, common, and abundant
species was implemented. Only common and abundant species will be analyzed
because rare species may be anomalous and not indicative of the water
quality of the stream.
Because the two sampling techniques used in this study produced
different numbers of individual organisms, different methods were used for
evaluating whether a species was rare, common, or abundant. For kick-net
samples, a species was classified as rare if less than 20 individual
organisms were found in the sample. For the standardized qualitative
47
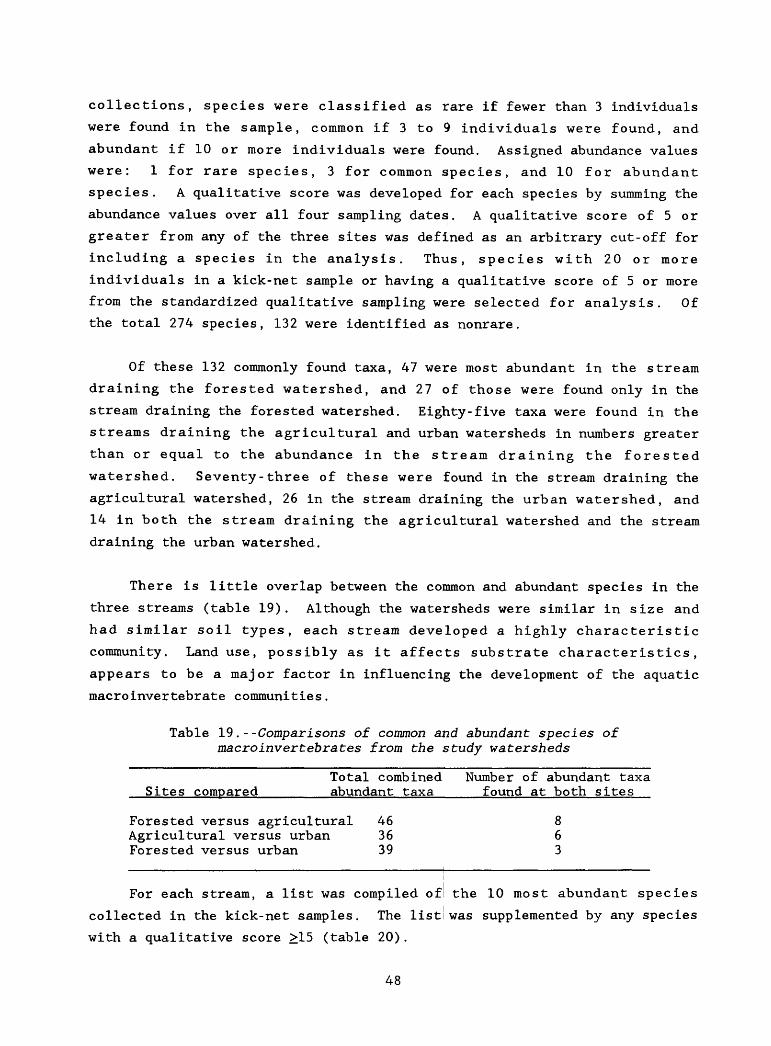
collections, species were classified as rare if fewer than 3 individuals
were found in the sample, common if 3 to 9 individuals were found, and
abundant if 10 or more individuals were found. Assigned abundance values
were: 1 for rare species, 3 for common species, and 10 for abundant
species. A qualitative score was developed for each species by summing the
abundance values over all four sampling dates. A qualitative score of 5 or
greater from any of the three sites was defined as an arbitrary cut-off for
including a species in the analysis. Thus, species with 20 or more
individuals in a kick-net sample or having a qualitative score of 5 or more
from the standardized qualitative sampling were selected for analysis. Of
the total 274 species, 132 were identified as nonrare.
Of these 132 commonly found taxa, 47 were most abundant in the stream
draining the forested watershed, and 27 of those were found only in the
stream draining the forested watershed. Eighty-five taxa were found in the
streams draining the agricultural and urban watersheds in numbers greater
than or equal to the abundance in the stream draining the forested
watershed. Seventy-three of these were found in the stream draining the
agricultural watershed, 26 in the stream draining the urban watershed, and
14 in both the stream draining the agricultural watershed and the stream
draining the urban watershed.
There is little overlap between the common and abundant species in the
three streams (table 19). Although the watersheds were similar in size and
had similar soil types, each stream developed a highly characteristic
community. Land use, possibly as it affects substrate characteristics,
appears to be a major factor in influencing the development of the aquatic
macroinvertebrate communities.
Table 19.- -Comparisons of common and abundant species of macro invertebrates from the study watersheds
Total combined Number of abundant taxa Sites compared_______abundant taxa_____found at both sites
Forested versus agricultural 46 8Agricultural versus urban 36 6Forested versus urban 39 3
For each stream, a list was compiled of the 10 most abundant species
collected in the kick-net samples. The list was supplemented by any species
with a qualitative score >15 (table 20).
48
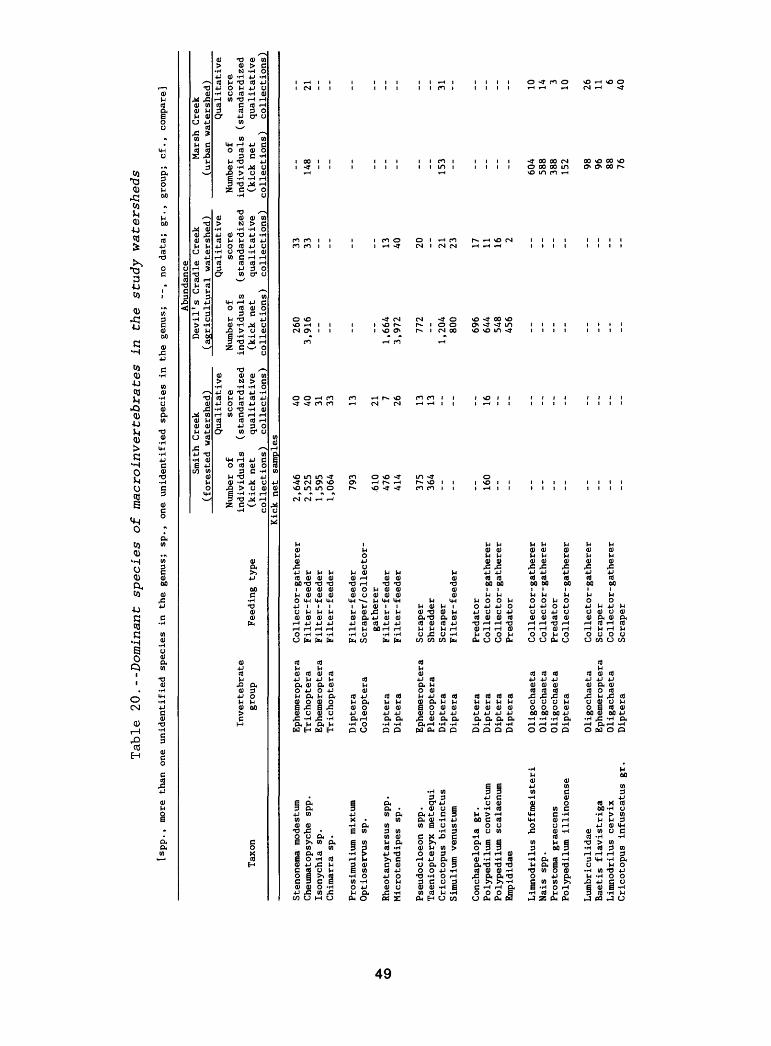
CD
Table 20.-
-Dominant species of macro invertebrates in th
e study watersheds
[spp., mo
re th
an on
e unidenti
fied
sp
ecie
s in the
genus; sp., one
unidentified sp
ecie
s in th
e ge
nus;
--,
no data;
gr., gr
oup;
cf., co
mpar
e]
Abun
danc
eSmith
Creek
(forested
watershed)
Taxon
Inve
rteb
rate
grou
pFeeding
type
Numb
er of
indi
vidu
als
(kic
k net
collections)
Qualitative
score
(standardized
qual
itat
ive
coll
ecti
ons)
Devil's
Cradle Creek
(agricultural
watershed)
Numb
er of
individuals
(kick
net
collections)
Qualitative
score
( sta
ndar
dize
dqu
alit
ativ
ecollections)
Marsh Creek
(urb
an wa
ters
hed)
Numb
er of
individuals
(kick
net
collections)
Qualitative
scor
e( sta
ndar
dize
dqualitative
collections)
Kick
net
samp
les
Sten
onem
a mo
dest
umCheumatopsyche sp
p.Isonychia
sp.
Chimarra sp
.
Pros
imul
ium mixtum
Optioservus
sp.
Rheotanytarsus spp.
Microtendipes
sp.
Pseu
docl
oeon
spp.
Taeniopteryx metequi
Cricotopus bicinctus
Simu
lium
venustum
Conchapelopia
gr.
Polypedilum
convictum
Polypedilum scalaenum
Empi
dida
e
Limnodrilus
hoff
meis
teri
Nais spp.
Prostoma graecens
Polypedilum
illinoense
Lumb
ricu
lida
eBaetis fl
avis
trig
aLi
mnod
rilu
s cervix
Cricotopus infuscatus gr
.
Ephe
mero
pter
aTrichoptera
Ephe
mero
pter
aTrichoptera
Dipt
era
Cole
opte
ra
Diptera
Dipt
era
Ephemeroptera
Plecop
tera
Diptera
Diptera
Diptera
Dipt
era
Dipt
era
Dipt
era
Oligochaeta
Oligochaeta
Oligochaeta
Dipt
era
Oligochaeta
Ephemeroptera
Oligachaeta
Diptera
Coll
ecto
r- gat
here
rFi
lter
- fe
eder
Filt
er-f
eede
rFi
lter
-fee
der
Filt
er- fe
eder
Scraper/collector-
gath
erer
Filt
er-f
eede
rFi
lter
-fee
der
Scraper
Shredder
Scraper
Filt
er-f
eede
r
Pred
ator
Coll
ecto
r-ga
ther
erCollector- gatherer
Pred
ator
Collector-gatherer
Coll
ecto
r -g
athe
rer
Pred
ator
Collector- gatherer
Coll
ecto
r-ga
ther
erScraper
Coll
ecto
r-ga
ther
erScraper
2,64
62,525
1,595
1,064
793
610
476
414
375
364
-- -- -- 160
-- -- -- -- -- -- -- -- -- --
40 40 31 33 13 21 7 26 13 13 -- -- -- 16 -- -- -- -- -- -- -- -- -- --
260
3,916
-- -- -- --1,664
3,97
2
772
--1,204
800
696
644
548
456
-- -- -- -- -- -- -- --
33 33 -- -- -- -- 13 40 20 -- 21 23 17 11 16 2 -- -- -- -- -- -- -- --
__ 148 -- -- -- -- -- -- -- -- 153 -- -- -- -- --
604
588
388
152 98 96 88 76
__ 21 -- -- -- -- -- -- -- -- 31 -- -- -- -- -- 10 14 3 10 26 11 640

Table 20.-
-Dominant species of macro invertebrates in
th
e study watersheds--Continued
[SPP
.» mo
re th
an one
unidentified sp
ecie
s in
the
genus; sp., one unidentified sp
ecie
s in
th
e ge
nus;
--,
no data;
gr., gr
oup;
cf
., co
mpar
e]
Ol O
Abundance
Smith
Creek
(forested watershed)
Taxon
Inve
rteb
rate
group
Feeding
type
Stan
dard
ized
qualitative sa
mple
s
Nigr
onia
serricornis
Boyeria vinosa
Ophi
ogom
phus
sp
.Hydropsyche betteni
Eury
loph
ella
bicolor
Baet
isca
Ca
roli
naMacromia sp.
Cordulegaster
sp.
Psep
henu
s he
rric
kiPa
rame
trio
cnem
us lu
ndbe
cki
Thie
nema
niel
la spp.
Tipu
la ab
domi
nali
sDubiraphia vi
ttat
aCacnis sp.
Tanytarsus sp
p.
Macronychus
glabratus
Progomphus obscurus
Cryp
toch
iron
omus
fu
lvus
Trib
elos
sp
.Di
crot
endi
pes
neom
odes
tus
Orth
ocla
dius
cf .
obumbratus
Orth
ocla
dius
cf.
roba
cki
Argia spp.
Enal
lagm
a sp.
Campeloma
dec i sum
Chironomus sp.
Cambarus sp.
Gyri
nus/
Dine
utes
Anto
cha
sp.
Hydroptila sp
.
Megaloptera
Odonata
Odonata
Trichoptera
Ephemeroptera
Ephemeroptera
Odonata
Odonata
Cole
optera
Diptera
Diptera
Dipt
era
Coleoptera
Ephemer op
ter a
Dipt
era
Cole
opte
raOdonata
Diptera
Diptera
Diptera
Diptera
Diptera
Odonata
Odonata
Mollusca
Diptera
Crustacea
Cole
optera
Diptera
Trichoptera
Pred
ator
Pred
ator
Pred
ator
Filt
er-f
eede
rCo
llec
tor-
gatherer
Coll
ecto
r-ga
ther
erPr
edat
orPr
edat
orScraper
Col lector- gatherer
Coll
ecto
r-ga
ther
erShredder
Collector - gatherer
Collector - gatherer
Coll
ecto
r-ga
ther
er
Coll
ecto
r-ga
ther
erPr
edat
orPr
edat
orCo
llec
tor-
gatherer
Filt
er -fe
eder
Scraper
Scraper
Pred
ator
Pred
ator
Scraper
Col le
ctor
- gatherer
Scav
enge
rPredator
Collector - gatherer
Piercer
Numb
er of
indi
vidu
als
(kick
net
collections)
(qua
lita
tive
168 46 19
265
154 50 12 4 64 62 12 10 108
120
100 42 -- -- -- -- -- -- -- -- -- -- -- -- -- --
Qualitative
score
(sta
ndar
dize
dqualitative
collections)
score
equal
to
33 33 26 24 24 23 19 19 19 19 17 17 17 16 16 15 -- -- -- -- -- -- -- -- -- -- -- -- -- --
Devil's
Crad
le Creek
(agricultural wa
ters
hed)
Numb
er of
indi
vidu
als
(kick
net
coll
ecti
ons)
Qualitative
scor
e(standardized
qualitative
coll
ecti
ons)
Marsh Cr
eek
(urb
an wa
ters
hed)
Numb
er of
indi
vidu
als
(kick ne
tcollections)
Qualitative
scor
e(standardized
qualitative
collections)
or greater
than 15)
__ -- -- 302
-- -- -- -- -- -- 376
-- -- -- -- -- 4722
4 52 104
124
236 16 4 17 21 18 8 16
288
__ -- -- 40 -- -- -- -- -- -- 31 -- -- -- -- -- 24 23 23 21 20 20 19 17 17 16 16 16 15 15
__ -- -- 45 -- -- -- -- -- -- -- -- -- 6 -- -- -- -- -- -- -- 3 2 -- -- 14 -- -- --
__ -- -- 15 -- -- -- -- -- -- -- -- -- 20 -- -- -- -- -- -- -- -- 23 21 -- -- 24 -- -- --

Many of the most abundant species in the stream draining the forested
watershed were absent or reduced in abundance in the stream draining the
agricultural watershed. However, only a small reduction in total species
richness was observed, as many new species were present in the stream
draining the agricultural watershed. This pattern did not occur in the
stream draining the urban watershed, where taxa richness was much reduced
relative to both the stream draining the forested watershed and the stream
draining the agricultural watershed.
Feeding Type
Invertebrates collected during the study were also categorized
according to feeding types (Merritt and Cummins, 1978; North Carolina
Division of Environmental Management, 1987). Analysis of feeding types
suggested that land use also affects the food web in aquatic systems. The
percentages assigned to each feeding type were computed using data from both
the kick-net collections and the standardized collections. Each data set
was given equal weight in this computation.
Streams in both agricultural and urban watersheds had a greater
proportion of scrapers (species feeding on attached periphyton) than the
stream draining the forested watershed (table 21). Shredders (feeding on
coarse particulate organic matter) were found (in small numbers) only in the
stream draining the forested watershed. Conversely, piercers and scavengers
were found only in the streams draining the agricultural and urban water-
Table 21. --Percentage composition by feeding type of invertebratecommunities in the study watersheds
[--, no data]
Feeding type
Filter- feederCollector- gathererScraperPredatorShredderPiercers and
scavengers
SmithCreek
(forestedwatershed")
46344
124
--
Devil's CradleCreek
(agriculturalwatershed)
47191615
3
MarshCreek(urban
watershed)
10462116
7
51
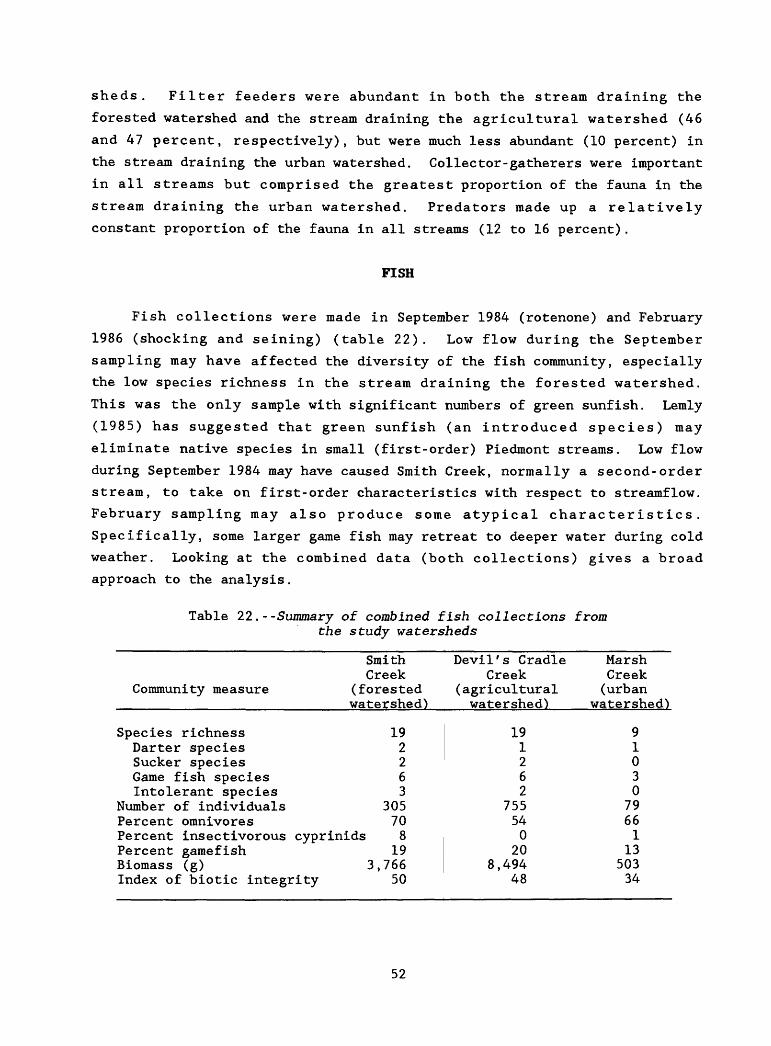
sheds . Filter feeders were abundant in both the stream draining the
forested watershed and the stream draining the agricultural watershed (46
and 47 percent, respectively), but were much less abundant (10 percent) in
the stream draining the urban watershed. Collector-gatherers were important
in all streams but comprised the greatest proportion of the fauna in the
stream draining the urban watershed. Predators made up a relatively
constant proportion of the fauna in all streams (12 to 16 percent).
FISH
Fish collections were made in September 1984 (rotenone) and February
1986 (shocking and seining) (table 22). Low flow during the September
sampling may have affected the diversity of the fish community, especially
the low species richness in the stream draining the forested watershed.
This was the only sample with significant numbers of green sunfish. Lemly
(1985) has suggested that green sunfish (an introduced species) may
eliminate native species in small (first-order) Piedmont streams. Low flow
during September 1984 may have caused Smith Creek, normally a second-order
stream, to take on first-order characteristics with respect to streamflow.
February sampling may also produce some atypical characteristics.
Specifically, some larger game fish may retreat to deeper water during cold
weather. Looking at the combined data (both collections) gives a broad
approach to the analysis.
Table 22.- -Summary of combined fish collections from the study watersheds
Community measure
Species richnessDarter speciesSucker speciesGame fish speciesIntolerant species
Number of individualsPercent omnivoresPercent insectivorousPercent gamefishBiomass (g)
SmithCreek
(forestedwatershed)
192263
30570
cyprinids 819
3,766Index of biotic integrity 50
Devil's CradleCreek
(agriculturalwatershed")
191262
755540
208,494
48
MarshCreek(urban
watershed")
91030
79661
1350334
52
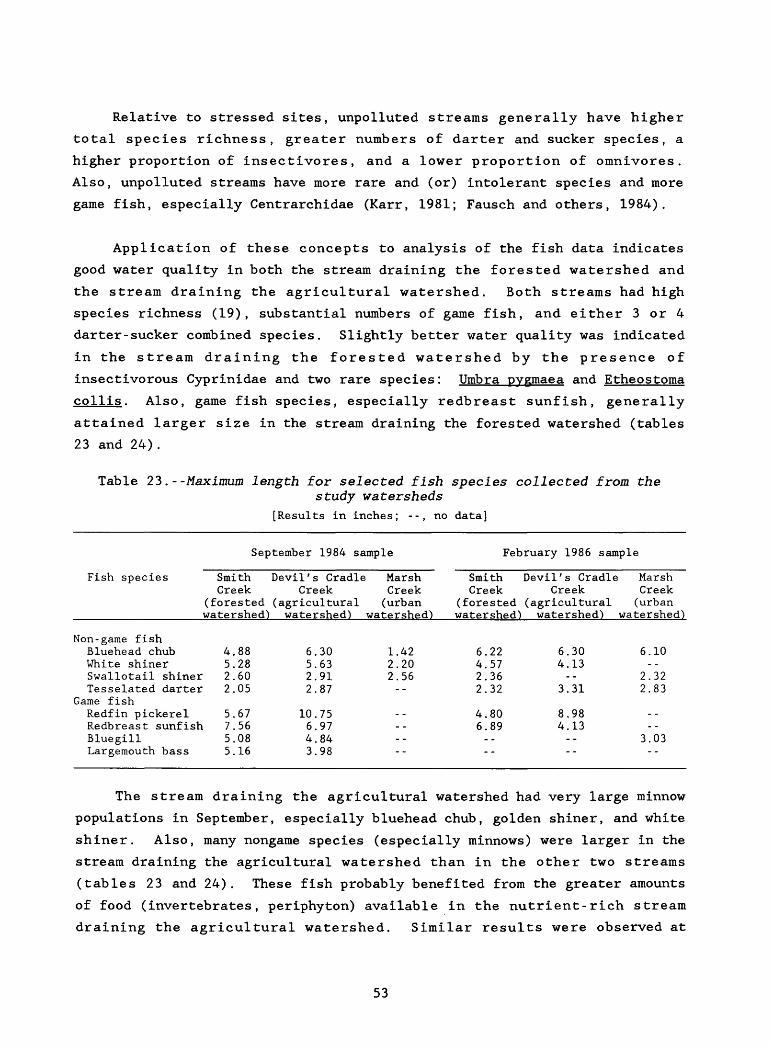
Relative to stressed sites, unpolluted streams generally have higher
total species richness, greater numbers of darter and sucker species, a
higher proportion of insectivores, and a lower proportion of omnivores.
Also, unpolluted streams have more rare and (or) intolerant species and more
game fish, especially Centrarchidae (Karr, 1981; Fausch and others, 1984).
Application of these concepts to analysis of the fish data indicates
good water quality in both the stream draining the forested watershed and
the stream draining the agricultural watershed. Both streams had high
species richness (19), substantial numbers of game fish, and either 3 or 4
darter-sucker combined species. Slightly better water quality was indicated
in the stream draining the forested watershed by the presence of
insectivorous Cyprinidae and two rare species: Umbra pygmaea and Etheostoma
collis. Also, game fish species, especially redbreast sunfish, generally
attained larger size in the stream draining the forested watershed (tables
23 and 24).
Table 23. --Maximum length for selected fish species collected from thestudy watersheds
[Results in inches; --, no data]
September 1984 sample February 1986 sample
Fish species Smith Devil's Cradle Marsh Smith Devil's Cradle MarshCreek Creek Creek Creek Creek Creek
(forested (agricultural (urban (forested (agricultural (urbanwatershed') watershed) watershed) watershed) watershed) watershed)
Non-game fish Bluehead chubWhite shinerSwallotail shinerTesselated darter
Game fishRedfin pickerel Redbreast sunfishBluegill Largemouth bass
4.885.282.602.05
5.67 7.565.08 5.16
6.5.2.2.
10. 6.4. 3.
30639187
,75 ,97,84,98
122
.42
.20
.56
--
6.4.2.2.
4. 6.
-
22573632
80 89
-
6.4.
-3.
8. 4.
-
3013-31
98 13
-
6
22
3
.10
.32
.83
.03
The stream draining the agricultural watershed had very large minnow
populations in September, especially bluehead chub, golden shiner, and white
shiner. Also, many nongame species (especially minnows) were larger in the
stream draining the agricultural watershed than in the other two streams
(tables 23 and 24). These fish probably benefited from the greater amounts
of food (invertebrates, periphyton) available in the nutrient-rich stream
draining the agricultural watershed. Similar results were observed at
53
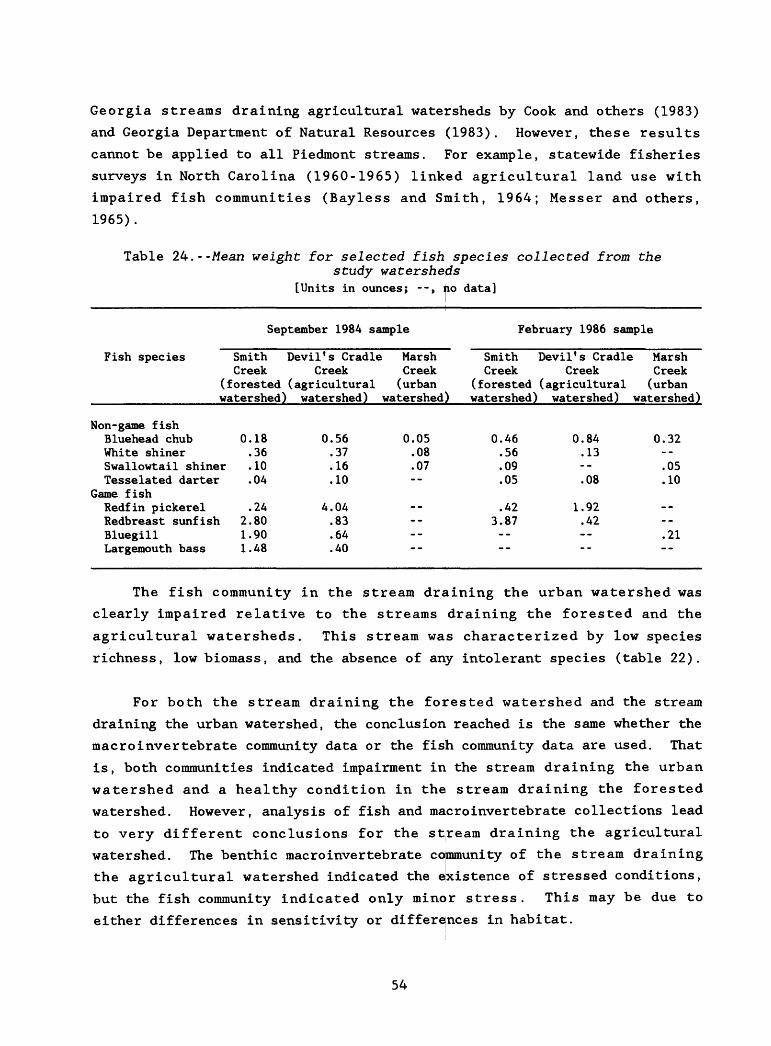
Georgia streams draining agricultural watersheds by Cook and others (1983)
and Georgia Department of Natural Resources (1983). However, these results
cannot be applied to all Piedmont streams. For example, statewide fisheries
surveys in North Carolina (1960-1965) linked agricultural land use with
impaired fish communities (Bayless and Smith, 1964; Messer and others,
1965).
Table 24.--Mean weight for selected fish species collected from thestudy watersheds
[Units in ounces; --, no data]
September 1984 sample February 1986 sample
Fish species Smith Devil's Cradle Marsh Smith Devil's Cradle MarshCreek Creek Creek Creek Creek Creek
(forested (agricultural (urban (forested (agricultural (urbanwatershed) watershed) watershed) watershed) watershed) watershed)
Non-game fishBluehead chubWhite shinerSwallowtail shinerTesselated darter
Game fishRedfin pickerelRedbreast sunfishBluegillLargemouth bass
0.18.36.10.04
.242.801.901.48
0.56.37.16.10
4.04.83.64.40
0.05.08.07--
------"" ""
0.46.56.09.05
.423.87--"" ""
0.84.13--.08
1.92.42--"
0.32--.05.10
----.21"" ""
The fish community in the stream draining the urban watershed was
clearly impaired relative to the streams draining the forested and the
agricultural watersheds. This stream was characterized by low species
richness, low biomass, and the absence of any intolerant species (table 22).
For both the stream draining the forested watershed and the stream
draining the urban watershed, the conclusion reached is the same whether the
macroinvertebrate community data or the fish community data are used. That
is, both communities indicated impairment in the stream draining the urban
watershed and a healthy condition in the stream draining the forested
watershed. However, analysis of fish and macroinvertebrate collections lead
to very different conclusions for the stream draining the agricultural
watershed. The benthic macroinvertebrate community of the stream draining
the agricultural watershed indicated the existence of stressed conditions,
but the fish community indicated only minor stress. This may be due to
either differences in sensitivity or differences in habitat.
54
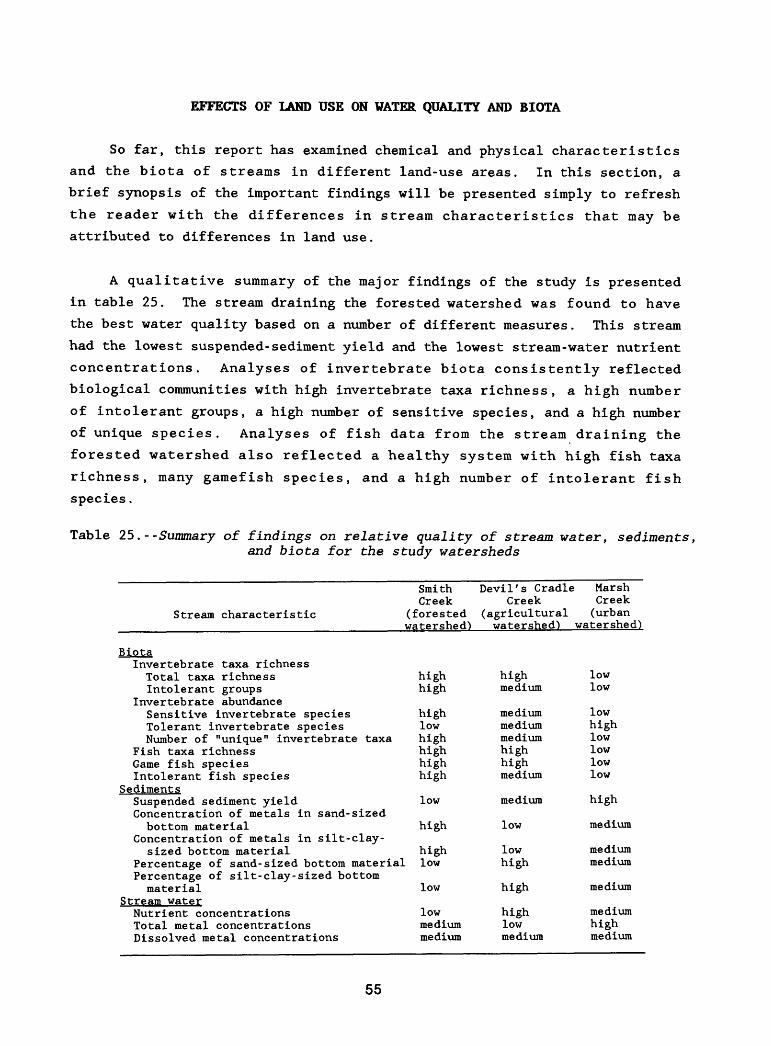
EFFECTS OF LAND USE ON WATER QUALITY AND BIOTA
So far, this report has examined chemical and physical characteristics
and the biota of streams in different land-use areas. In this section, a
brief synopsis of the important findings will be presented simply to refresh
the reader with the differences in stream characteristics that may be
attributed to differences in land use.
A qualitative summary of the major findings of the study is presented
in table 25. The stream draining the forested watershed was found to have
the best water quality based on a number of different measures. This stream
had the lowest suspended-sediment yield and the lowest stream-water nutrient
concentrations. Analyses of invertebrate biota consistently reflected
biological communities with high invertebrate taxa richness , a high number
of intolerant groups, a high number of sensitive species, and a high number
of unique species. Analyses of fish data from the stream draining the
forested watershed also reflected a healthy system with high fish taxa
richness, many gamefish species, and a high number of intolerant fish
species.
Table 25.- -Summary of findings on relative quality of stream water, sediments,and biota for the study watersheds
Stream characteristic
Smith Devil's Cradle Marsh Creek Creek Creek
(forested (agricultural (urban watershed) watershed)
BiotaInvertebrate taxa richnessTotal taxa richnessIntolerant groups
Invertebrate abundanceSensitive invertebrate speciesTolerant invertebrate speciesNumber of "unique" invertebrate taxa
Fish taxa richnessGame fish speciesIntolerant fish species
SedimentsSuspended sediment yieldConcentration of metals in sand- sizedbottom material
Concentration of metals in silt-clay-sized bottom material
Percentage of sand- sized bottom materialPercentage of silt-clay-sized bottommaterial
Stream waterNutrient concentrationsTotal metal concentrationsDissolved metal concentrations
highhigh
highlowhighhighhighhigh
low
high
highlow
low
lowmediummedium
highmedium
mediummediummediumhighhighmedium
medium
low
lowhigh
high
highlowmedium
lowlow
lowhighlowlowlowlow
high
medium
mediummedium
medium
mediumhighmedium
55
The stream draining the agricultural watershed had intermediate water
quality. Suspended-sediment yield was greater than in the stream draining
the forested watershed but less than that in the stream draining the urban
watershed. Total metal concentrations in bottom sediments and stream water
were low, but nutrients in stream water were higher than at either of the
other two streams. Biological data revealed some characteristics of a
healthy community, such as high invertebrate and fish taxa richness and a
large number of gamefish species. However, some of the sensitive
invertebrate species and intolerant fish species found in the stream
draining the forested watershed were not found in the stream draining the
agricultural watershed.
By almost all the measures examined, the stream draining the urban
watershed exhibited the most impaired water quality. Suspended-sediment
yield was the highest of any of the three streams. Stream-water nutrient
concentrations were intermediate, but total metal concentrations were
greatest, though not statistically significant, in this stream. The stream
draining the urban watershed consistently had biological assemblages with
the lowest invertebrate taxa richness, the lowest number of representatives
from intolerant invertebrate groups and sensitive species, and the lowest
number of unique taxa. The lowest fish taxa richness, the lowest number of
gamefish species, and the lowest number of intolerant fish species all were
found in the stream draining the urban watershed.
The observed differences in stream water quality and biota in the three
streams can be attributed to differences in land use because the three
streams were selected so that factors other than land use were similar among
watersheds. As might be expected, undisturbed, forested land-use practices
had the least effect on stream water quality and urban land use had the
greatest effect.
SUMMARY
Three streams in the Piedmont province of North Carolina with similar
watershed characteristics but having different land uses were studied to
compare the effects of land use on water-quality characteristics and aquatic
biota. The three streams, Smith Creek, bevil's Cradle Creek, and Marsh
Creek, were dominated by forested land, agricultural land, and urban land,
56
respectively. Sediment chemistry and quantity, water chemistry, and biota
were studied in each stream during the period from February 1984 through
January 1985.
Investigations of sediment characteristics revealed that suspended-
sediment yield was highest in the stream draining the urban watershed with
an annual yield of 0.59 tons per acre during the year of the study. This
was more than four times the 0.13 tons per acre yielded from the stream
draining the forested watershed and almost twice the 0.31 tons per acre
yielded from the stream draining the agricultural watershed.
Concentrations of metals associated with bottom material from all three
streams were generally higher in the silt-clay fraction than in the sand
fraction. Comparisons of total metal concentrations in bottom material
among streams showed some inconsistencies. For the silt-clay sized
fraction, chromium, iron, nickel, and zinc concentrations were highest in
the stream draining the forested watershed, whereas cadmium and manganese
concentrations were highest in the stream draining the urban watershed. For
the sand fraction, chromium, copper, and manganese were highest in the
stream draining the forested watershed, but iron was highest in the stream
draining the urban watershed. These results are unexpected because previous
research has found high concentrations of metals in water and sediment from
streams in urban areas. Perhaps the dominance of residential land use and
the lack of heavy industry and manufacturing in the selected urban watershed
can explain this finding.
Particle-size distributions for bottom material showed that the stream
draining the agricultural watershed had a higher percentage of sand-size and
silt-clay size particles than either the stream draining the forested
watershed or the stream draining the urban watershed. However, the bottom
material of all three streams was dominated by the sand fraction.
Water-quality investigations revealed no excessively low dissolved
oxygen, high water temperature, or extreme pH values at any of the three
streams that would pose stressful conditions for aquatic life. Mean
nutrient concentrations were highest in the stream draining the agricultural
watershed. Concentrations of the metals cadmium, chromium, copper, iron,
lead, nickel, and zinc were usually low enough that toxic conditions were
57
not encountered. However, individual samples of total copper, iron, and
lead from all three sites exceeded North Carolina water-quality standards
for all fresh waters, and samples of total zinc from both the stream
draining the forested watershed and the stream draining the urban watershed
exceeded the State standard. The existence of healthy biological
communities in streams where water-quality standards are exceeded may
reflect the use of total concentrations of metals for the standards rather
than available dissolved concentrations. Therefore, the use of total
concentrations of metals for standards may not be a reliable indicator of
the biologically available fraction. This also points out the need for
multiple measures of stream quality and punctuates the value of biological
sampling for evaluating stream health.
Benthic macroinvertebrate data (especially taxa richness) indicated the
least impaired water quality at the forested site, intermediate water
quality at the agricultural site, and the most impaired water quality at the
urban site. Both agricultural and urban latid-use sites showed water-quality
changes that affected stream biota, but biota in the stream draining the
urban watershed were clearly the most severely affected. The urban site was
characterized by low taxa richness and low density of most invertebrate
groups, indicating that sedimentation and witer-quality may be affecting the
invertebrate fauna.
The stream draining the agricultural watershed had low taxa richness
values for intolerant groups but high taxa richness for some
tolerant/facultative groups. This site also had the highest density of
benthic macroinvertebrates, reflecting some nutrient enrichment. Seasonal
changes in the biota indicated that benthic macroinvertebrates of this
stream rely more heavily on periphyton production rather than leaf detritus.
Community structure of the macroinvertebrates is also useful for
assessing stream quality. Because all three of the streams were of similar
size and were located in geologically similar areas, we would expect the
dominant species to be the same in each stream. However, lists of dominant
species at each site produced little overlap. Because land use is the major
feature that changes among the watersheds, this suggests that land use is of
overriding importance in controlling the^ composition of stream benthic
communities.
58
Both fish and macroinvertebrate community data indicated a healthy
environment in the forested stream and an impaired environment in the urban
stream. However, fish data from the agricultural stream indicated a healthy
environment, with increased numbers of individuals and increased biomass
compared to the forested and urban streams. On the other hand,
macroinvertebrate data for the agricultural stream suggested a moderately
impaired environment.
Differences in the dominant land use among the three watersheds are
probably responsible for the observed differences in water quality and biota
in the streams because these three streams were selected so that other
physical factors would be similar. As might be expected, the largely
undeveloped forested lands in the Smith Creek watershed have had little
effect on stream water quality and biota. Agricultural land use in the
Devil's Cradle Creek watershed appears to have contributed to the slightly
elevated sediment yield of the stream, the relatively high nutrient
concentrations in the stream, and the loss of some of the less tolerant
species of biota. Urban land use in the Marsh Creek watershed appears to
have had a pronounced effect on the water quality and on the biological
community in that stream. Urban land use is believed to have contributed to
the relatively high suspended-sediment yield of the stream, somewhat
elevated concentrations of nutrients and total metals, and the loss of many
species of invertebrates and fish from the stream. The impacts of these
land-use practices on water quality and biota were not unexpected and may be
typical of the effects of these land-use practices on other streams in the
area.
REFERENCES
American Public Health Association and others, 1976, Standard methods for
the examination of water and wastewater: American Public Health
Association, Washington, D.C., 1193 p.
Atkins, J.B., 1984, Agricultural nonpoint source control case studies in
North Carolina, IV. Wake County demonstration farm: North Carolina
Division of Environmental Management, 119 p.
Baker, J.L., 1983, Agricultural areas as nonpoint sources of pollution, in
Overcash, M.R., and Davidson, J.M., eds., Environmental impact of
nonpoint source pollution: Ann Arbor, Michigan, Ann Arbor Science
Publishers, Inc., p. 275-310.
59
Baker, J.L., and Johnson, H.P., 1983, Evaluating the effectiveness of BMP's
from field studies, in Bailey, G.W., and Schaller, F.W., eds. ,
Agricultural management and water quality: Ames, Iowa, Iowa State
University Press, p. 281-304.
Bayless, Jack, and Smith, W.B., 1964, The effects of channelization upon the
fish populations of lotic waters in eastern North Carolina: North
Carolina Wildlife Resources Commission, 14 p.
Benke, A.C., Willke, G.E., Parrish, F.K., and Stites, D.L., 1981, Effects of
urbanization on stream ecosystems: Georgia Institute of Technology,
ERG 07-81, 64 p.
Besch, A.C., Schreiber, I., and Herbst, D., 1977, Der Hydropsyche --
toxizitatstest, erprobt an Fenethcarb. Schweizerische Zeit:
Hydrologie, v. 39, p. 69-85.
Bratton, S.P. Mathews, R.C., Jr., and White, P.S., 1980, Agricultural area
impacts within a natural area: Cades Cove, a case history:
Environmental Management, v. 4, p. 433-448.
Brooks, N.C., 1983, Effects of agricultural land use on leaf litter
processing rates in a central Michigan stream: Central Michigan
University, M.S. thesis, 104 p.
Cawthorn, J.W., 1970, Soil survey of Wake County, North Carolina: U.S. Soil
Conservation Service, 118 p + 104 sheets.
Cole, R.H., Frederick, R.E., Healy, R.P., and Rolan, R.G., 1984, Preliminary
findings of the priority pollutant monitoring project of the Nationwide
Urban Runoff Program: Journal Water Pollution Control Federation, v.
56, no. 7, p. 898-908.
Cook, W.L., Parrish, Fred, Satterfield, J.D., Nolan, W.G., and Gafney, P.E.,
1983, Biological and chemical assessment of nonpoint source pollution
in Georgia: ridge-valley and sea island streams: Georgia State
University Department of Biology, 175 p.
Cooper, C.M., 1987, Benthos in Bear Creek, Mississippi: Effects of habitat
variation and agricultural sediments: Journal of Freshwater Ecology,
v. 4, p. 101-113.
Dance, K.W., and Hynes, H.B.N., 1980, Some effects of agricultural land use
on stream insect communities, Environmental Pollution Series A, v. 22,
p. 19-28.
Daniels, R.B., and others, 1984, Soil systems in North Carolina: North
Carolina Agricultural Research Service Bulletin 467, 77 p.
60
Demas, C.R., and Curwick, P.B., 1986, Chemicals associated with lower
Mississippi River sediments, in Proceedings of the Fourth Federal
Interagency Sedimentation Conference: Interagency Advisory Committee
on Water Data, Las Vegas, Nevada, 1986, p. 8-17 - 8-26.
Duda, A.M., Lenat, D.R. , and Penrose, D.L., 1982, Water quality in stream
draining the urban watersheds--what can we expect: Journal Water
Pollution Control Federation, v. 54, p. 1139-1147.
Fausch, K.D., Karr, J.R., and Yant, P.R., 1984, Regional application of an
index of biotic integrity based on stream fish communities:
Transactions American Fisheries Society, v. 113, p. 39-55.
Feltz, H.R., 1980, Significance of bottom material data in evaluating water
quality, in Baker, R.A., ed. , Contaminants and sediments--fate and
transport, case studies, modeling, toxicity: Ann Arbor Science, p.
271-287.
Fishman, Marvin, and Friedman, Linda, eds., 1985, Methods for determination
of inorganic substances in water and fluvial sediments: U.S. Geological
Survey Techniques of Water-Resources Investigations, Book 5, Chapter
Al, 709 p.
Frank, R., Braun, H.E., Holderinet, M.V.H., Sirons, G.J., andRipley, B.D.,
1982, Agriculture and water quality in the Canadian Great Lakes basin:
V. Pesticide use in 11 agricultural watersheds and presence in stream
water: Journal of Environmental Quality, v. 11, p. 497-505.
Freeman, M.C., and Wallace, J.B., 1984, Production of net-spinning
caddisflies (Hydropsyche) and black flies (Simuliidae) on rock outcrop
substrate in a small southeastern Piedmont stream: Hydrobiologia, v.
112, p. 3-15.
Garie, H.L., and Mclntosh, Alan, 1986, Distribution of benthic
macroinvertebrates in a stream exposed to urban runoff: Water
Resources Bulletin, v. 22, no. 3, p. 447-455.
Gaufin, A.R., 1958, The effects of pollution of a midwestern stream: Ohio
Journal of Science, v. 58, p. 197-208.
____1973, Use of aquatic invertebrates in the assessment of water quality,
in Cairns, John, and Dickson, K.L. , eds., Biological methods for the
assessment of water quality: Philadelphia, American Society for
Testing Materials, ASTM Special Technical Publication 528, p. 96-116.
Georgia Department of Natural Resources, 1983, Georgia nonpoint source
impact assessment study, Final report from CTA, Inc., 314 p.
61
Gilliom, R.J., and Helsel, D.R., 1986, Estimation of distributional
parameters for censored trace level water-quality data 1. Estimation
techniques: Water Resources Research, v. 22, no. 2, p. 135-146.
Gleason, H.A., 1922, On the relation between species and area: Ecology,
v. 3, p. 158-162.
Guy, H.P. , 1969, Laboratory theory and methods for sediment analysis: U.S.
Geological Survey Techniques of Water-Resources Investigations, Book 5,
Chapter Cl, 58 p.
Guy, H.P., and Norman, V.W., 1970, Field methods for measurement of fluvial
sediment: U.S. Geological Survey Techniques of Water-Resources
Investigations, Book 3, Chapter C2, 59 p.
Heckman, C.W., 1982, Pesticide effects on aquatic habitats: Environmental
Science and Technology, v. 16, p. 48A-57A.
Helsel, D.R., and Gilliom, R.J., 1986, Estimation of distributional
parameters for censored trace level water-quality data 2. Verification
and applications: Water Resources Research, v. 22, no. 2, p. 147-155.
Henson, E.B., 1965, A cage sampler for collecting aquatic fauna: Turtox
News, v. 43, no. 12, p. 298-299.
Hester, F.E., and Dendy, J.S., 1962, A multiple-plate sampler for aquatic
macroinvertebrates: Trans. Amer. Fish !3oc., v. 91, no. 4, p. 420-421.
Hirose, T. , and Kuramoto, N. , 1981, Variability of stream water quality in
some land management systems in the southern Kakioka basin, Japan:
Agro-Ecosysterns, v. 7, p. 47-61.
Hites, R.A. , and Lopez-Avila, Viorica, 1980, Sedimentary accumulation of
industrial organic compounds discharged into a river system, in Baker,
R.A., ed., Contaminants and sediments--fate and transport, case
studies, modeling, toxicity: Ann Arbor Science, p. 53-66.
Hornig, C.E., and Pollard, J.E., 1978, Macroinvertebrate sampling techniques
for streams in semi-arid regions: comparison of the Surber method and
unit-effort traveling kick method: U.S. Environmental Protection Agency
EPA 600/4-78-040, 21 p.
Horowitz, A.J., 1985, A primer on trace metal-sediment chemistry: U.S.
Geological Survey Water-Supply Paper 2277, 67 p.
Hynes, H.B.N., 1960, The biology of polluted waters: Cambridge, Liverpool
University Press, 202 p.'
International Hydrological Program, 1977, National handbook of recommended
methods for water-data acquisition: U.S. Geological Survey Office of
Water Data Coordination.
62
Karr, J.R., 1981, Assessment of biotic integrity using fish communities:
Fisheries, v. 6, p. 21-27.
Kelly, M.H., and Kite, R.L., 1984, Evaluation of Illinois stream sediment
data: 1974-1980: Illinois Environmental Protection Agency,
IEPA/WPC/84-004, 103 p.
Keup, L.E., Ingram, W.M. , and Mackenthum, K.M. , 1966, The role of bottom-
dwelling macrofauna in water pollution investigations: Public Health
Service, 23 p.
Klein, R.D. , 1979, Urbanization and stream quality impairment: Water
Resources Bulletin, v. 15, p. 948-963.
____1985, Effects of urbanization upon aquatic resources: Maryland
Department of Natural Resources report.
Lemly, A.D., 1985, Suppression of native fish species by green sunfish in
first-order streams of Piedmont North Carolina: Transactions American
Fisheries Society, v. 114, p. 705-712.
Lenat, D.R., 1984, Agriculture and stream water quality: a biological
evaluation of erosion control practices: Environmental Management,
v. 8, p. 333-344.
Lenat, David, and Eagleson, Kenneth, 1981, Ecological effects of urban
runoff on North Carolina streams: North Carolina Division of
Environmental Management Biological Series No. 104, 22 p.
Lenat, D.R., Penrose, D.L., and Eagleson, K.W., 1979, Biological evaluation
of non-point source pollutants in North Carolina streams and rivers:
North Carolina Division of Environmental Management Biological Series
No. 102, 168 p.
____1981, Variable effects of sediment addition on stream benthos:
Hydrobiologia, v. 79, p. 187-194.
Lietman, P.L. , Ward, J.R., and Behrendt, T.E., 1983, Effects of specific
land uses on nonpoint sources of suspended sediment, nutrients, and
herbicides--Pequea Creek basin, Pennsylvania 1979-80: U.S. Geological
Survey Water-Resources Investigations Report 83-4113, 88 p.
Loehr, R.C., 1974, Characteristics and comparative magnitude of nonpoint
sources: Journal Water Pollution Control Federation, v. 46, no. 8, p.
1849-1872.
____1979, Potential pollutants from agriculture--an assessment of the
problem and possible control approaches: Progress in Water Technology,
v. 11, no. 6, p. 169-193.
Malo, B.A., 1977, Partial extraction of metals from aquatic sediments:
Environmental Science and Technology, v. 11, no. 3, p. 277-282.
63
Mason, W.T., Jr., and Yevich, P.P., 1967, The use of phloxine B and rose
Bengal stains to facilitate sorting benthic samples: Transactions
American Microscopic Society, v. 86, no. 2, p. 221-223.
McCafferty, W.P., 1978, Pre-management assessment of macroinvertebrates in a
small, sedimentary drainage area of the Maumee and Lake Erie basin:
Great Lakes Entomology, v. 11, p. 37-43.
Medeiros, C., LeBlanc, R. , and Coler, R.A, , 1983, An in situ assessment of
the acute toxicity of urban runoff to benthic macroinvertebrates:
Environmental Toxicology and Chemistry, v. 2, p. 119-126.
Merritt, R.W., and Cummins, K.W., 1978, An introduction to the aquatic
invertebrates of North America: Dubuque, Iowa, Kendall/Hunt Publishing
Company, 441 p.
Messer, J.B., Davis, J.R., Crowell, T.E., and Carnes, W.C., 1965, Survey and
classification of the Broad River and tributaries, North Carolina:
North Carolina Wildlife Resources Commission, North Carolina Division
of Inland Fisheries, Final Report Federal Aid in Fish Restoration,
Project F-14-R, 20 p.
North Carolina Department of Natural Resources and Community Development,
1979, Water quality management plan--executive summary: Division of
Environmental Management, 27 p.
North Carolina Division of Environmental Management, 1982, Agriculture and
stream water quality, a biological evaluation of erosion control
practices: Biological Series No. 107.
___1983, Qualitative sampling of benthic macroinvertebrates: a reliable,
cost-effective, biomonitoring technique (revised, 1985): Biological
Monitoring Group Biological Series #108, 11 p.
____1987, Computerized data base of invertebrates: Biological Monitoring
Group, unpublished computerized data base.
North Carolina Environmental Management Commission, 1986, Classifications
and water quality standards applicable to surface waters of North
Carolina: North Carolina Administrative Code, Title 15, Chapter 2, p.
2B-1 - 2B-37.
Norusis, M.J., 1983, Introductory statistics guide SPSSX: New York, McGraw-
Hill, 276 p.
Omernik, J.M., 1977, Nonpoint source--stream nutrient level relationships:
A nationwide study: U.S. Environmental Protection Agency Ecological
Research Series report EPA-600/3-77-105, 151 p.
64
Ospina, Enrique, and Danielson, Leon, 1973, North Carolina land-use data:
Land use planning in North Carolina: The North Carolina Agricultural
Extension Service Miscellaneous Extension Publication No. 102, 35 p.
Patrick, Ruth, 1949, A proposed biological measure of stream conditions:
Verhandlungen der Internationalen Vereinigung fur Theoretische und
Angewandte Limnologie, v. 11, p. 299-307.
____1975, Stream communities, in Cody, M.S., and Diamond, J.M., eds. ,
Ecology and evaluation of communities: Harvard University, Belknup
Press, p. 245-259.
Penrose, D.L., and Lenat, D.R., 1982, Effects of apple orchard runoff on the
aquatic macrofauna of a mountain stream: Archives of Environmental
Contamination and Toxicology, v. 11, p. 383-388.
Penrose, D.L., Lenat, D.R., and Eagleson, K.W., 1980, Biological evaluation
of water quality in North Carolina streams and rivers: North Carolina
Division of Environmental Management Biological Series No. 103, 181 p.
Pitt, Robert, and Bozeman, Martin, 1980, Water quality and biological
degradation in an urban creek, in Yousef, Y.A., Wanielista, M.P.,
McLellon, W.M. , and Taylor J.S., eds., Urban stormwater and combined
sewer overflow impact on receiving water bodies: Environmental
Protection Agency, EPA 600/9-80-056, p. 371-403.
Porter, K.S. , 1980, An evaluation of sources of nitrogen as causes of
ground-water contamination in Nassau County, Long Island: Ground
Water, v. 18, no. 6, p. 617-625.
Pratt, J.M., Coler, R.A., and Godfrey, P.J., 1981, Ecological effects of
urban stormwater runoff on benthic invertebrates inhabiting the Green
River, Massachusetts: Hydrobiologia, v. 83, p. 29-42.
Ramande, F., Cosson, R., Echaubard, M., LeBras, S., Moreteau, J.C., and
Tbybaud, E., 1984, Detection de la pollution des eaux en milieu
agricole: Bulletin of Ecology, v. 15, p. 21-37.
Richardson, R.E., 1925, Illinois River bottom fauna in 1923: Illinois
Natural History Survey Bulletin, v. 15, p. 391-422.
Sartor, J.D., Boyd, G.B., and Agardy, F.J., 1974, Water pollution aspects of
street surface contaminants: Journal Water Pollution Control
Federation, v. 46, no. 3, p. 458-467.
Schlosser, I.J., and Karr, R.J., 1981, Water quality in agricultural
watersheds: impact of riparian vegetation during base flow: Water
Resources Bulletin, v. 17, p. 233-240.
65
Simmons, C.E., 1976, Sediment characteristics of streams in the eastern
Piedmont and western Coastal Plain regions of North Carolina: U.S.
Geological Survey Water-Supply Paper 1998-0, 32 p.
____1987, Sediment characteristics of North Carolina streams 1970-79: U.S.
Geological Survey Open-File Report 87-701.
Simon, N.S., Kennedy, M.M., and Massoni, C.J., 1985, Evaluation and use of a
dif fusion-controlled sampler for determining chemical and dissolved
oxygen gradients at the sediment-water interface: Hydrobiologia, v.
126, p. 135-141.
Simpson, K.W., and Bode, R.W., 1980, Common larvae of Chironomidae (Diptera)
from New York State streams and rivets, Bulletin of the New York State
Museum No. 439, p. 1-105.
Skougstad, M.W., Fishman, M.J., Friedman, L.C., Erdmann, D.E., and Duncan,
S.S., eds., 1979, Methods for determination of inorganic substances in
water and fluvial sediments: U.S. Geological Survey Techniques of
Water- Resources Investigations, Book 5, Chapter Al, 626 p.
Steel, R.G.D. , and Torrie, J.H. , 1980, Principles and procedures of
statistics: a biometrical approach (2d ed.): New York, McGraw-Hill,
633 p.
Streit, B., and Schwoerbel, J., 1976, Experimentelle untersuchungen uber die
akkumulation und wirkung von herbiziden bei benthischen
susswassertieren: Verhandlungen Gesellschaft Okol. Gottingen, p. 371-
383.
U.S. Department of Agriculture, 1971, General soil map Granville County,
North Carolina: Soil Conservation Service, scale 1:253,400, 20 p. + 1
sheet.
____1972, General soil map Franklin County, North Carolina: Soil
Conservation Service, scale 1:126,720, 1 sheet.
____1977, Erosion and sediment inventory for North Carolina: Soil
Conservation Service, 12 p., 11 tables, and 7 worksheets.
____1983, National engineering handbobk: Soil Conservation Service,
Section 3--Sedimentation, Chapter 3-- Erosion, 18 p.
U.S. Environmental Protection Agency, 1983a, Methods for chemical analyses
of water and wastes: Environmental Monitoring and Support Laboratory,
EPA-600/4-79-020.
____1983b, Results of the nationwide urban runoff program, volume 1, final
report: Water Planning Division, WH-554, 186 p.
66
U.S. Geological Survey, 1972, State of North Carolina: Map, 1:500,000
scale.
____1986 (annually), Water resources data report for North Carolina: U.S.
Geological Survey Water Data Report, 495 p.
U.S. Soil Conservation Service, 1983, Upper Neuse River erosion study: Tar-
Neuse River basin study, Raleigh, North Carolina, 54 p.
Wauchope, R.D., 1978, The pesticide content of surface water draining from
agricultural fields--a review: Journal of Environmental Quality, v. 7,
p. 459-472.
Welch, H.E., Symons, P.E.K., and Narver, D.W., 1977, Some effects of potato
farming and forest clearcutting on small New Brunswick streams:
Fisheries and Marine Service of Canada Technical Report No. 745, 13 p.
Welch, P.S., 1948, Limnological methods: Philadelphia, The Blakiston
Company, 381 p.
Whitney, P.H. , 1975, Relationship of manganese-iron oxides and associated
heavy metals to grain size in stream sediments: Journal of Geochemical
Exploration, v. 4, p. 251-263.
Wiederholm, Torgny, 1984, Responses of aquatic insects to environmental
pollution, in Resh, V.H., and Rosenberg, D.M. , eds., The ecology of
aquatic insects: New York, Praeger, p. 508-557.
Wilber, W.G. , and Hunter, J.V., 1977, Aquatic transport of heavy metals in
the urban environment: Water Resources Bulletin, v. 13, no. 4, p. 721-
734.
____1979, The impact of urbanization on the distribution of heavy metals in
sediments of the Saddle River: Water Resources Bulletin, v. 15, no. 3,
p. 790-800.
Winner, R.W., Boesel, M.W., and Farrell, M.P., 1980, Insect community
structure as an index of heavy metal pollution in lotic ecosystems:
Canadian Journal of Fisheries and Aquatic Sciences, v. 37, p. 647-655.
67
&U.S. GOVERNMENT PRINTING OFFICE: 1989-650-547/88091