by hsiaohua k. burke', peter tennyson · global background characterization in 4.2-4.4 p.m...
TRANSCRIPT

Global Background Characterization in 4.2-4.4 p.m MWIRby Using NOAA-12 Data
byHsiaohua K. Burke', Peter Tennyson
John Kerekes, Harry Finkle and Ed Wack
MIT Lincoln Laboratoiy244 Wood Street
Lexington, MA 02173
ABSTRACT
Background phenomenology databases and models are essential for the design andassessment ofelectro-optical sensing systems. The MWIR band has been proposed tosatisf' a number of specific requirements in the DoD space based mission areas.However, the phenomenology database in the MWIR to support the design andperformance evaluation is limited.
Currently the High Resolution Infrared Radiation Sounder (HIRS/2) onboard NOAA 12,an operational polar orbiting environmental and weather satellite, offers continual globalcoverage of several bands in the MWIR. In particular, Channel 1 7 operates in the heart ofthe 4.23 tm CO2 band. Though with coarse resolution (—.'20 kin), the vast database offersa good baseline understanding ofthe MWIR phenomenology related to space basedMWIR systems on (1) amplitude variation as function oflatitude, season, and solar angle,(2) correlation to relevant MW1R features such as high-altitude clouds, stratosphericwarming, aurora and other geomagnetic activities, (3) identification ofpotential lowspatial frequency atmospheric features, and (4) comparison with future dedicatedmeasurements.
Statistical analysis on selected multiple orbits over all seasons and geographical regionswas conducted. Global magnitude and variation in these bands were established. Theoverall spatial gradient on the 50 km scale was shown to be within sensor noise; thisestablished the upper bound of spatial frequency in the heart-of-the-C02-band. Resultsalso compared favorably with predictions from atmospheric background models such asthe Synthetic High Altitude Radiance Code (SHARC-3.)
Keywords: MWIR Remote Sensing, Downlooking Earth Background, Clutter Characterization,Background Phenomenology
324 ISPIE Vol. 2742 O-8194-2123-5/96/$6.OO

L Introduction
The wings ofthe CO2 MWIR band are being investigated for addressing DoDspace based mission requirements. However, the phenomenology database in the MWIRto support design and performance evaluation is insufficient. Currently the HighResolution Infrared Radiometer Sounder (HIRS/2) onboard NOAA 12, an operationalpolar orbiting environmental and weather satellite, offers continual global coverage ofseveral bands in the MWIP. (Figure 1). The 20-channel HIRS/2 sounder was designed toprovide global information on the vertical distribution ofatmospheric temperature,moisture and cloud presence. In particular, Channel 17 operates in the heart of the 4.23p.m CO2 band. Though with coarse resolution (2O km), the vast database offers a goodbaseline understanding of the MWIR phenomenology related to (1) amplitude variation asfunction of latitude, season, and solar angles, (2) correlation to relevant features such ashigh-altitude clouds, aurora and other geomagnetic activities, (3) identification of potentiallow spatial frequency atmospheric features, and (4) comparison with future dedicatedmeasurements.
In Section II, data processing and statistical analysis procedures are described.Section ifi presents the summary of the data, their means and variations, as well as thecomparison with atmospheric structure model predictions.
SPIE Vol. 2742 1325
Figure 1

II. Data Processing and Analysis Approach
Various sets ofHLRS/2 historical data were acquired through the NationalClimatic Data Center (NCDC). Thus far, four sets of 10-day global cumulative statisticswere obtained and processed. Each set consists of 142 consecutive orbits; the first tendays of February, May, August and November 1995. Calibration and initial data qualitycheck were conducted to ensure data applicability. For statistical analysis, data are limitedto look angles from nadir to within 20 degrees off nadir such that uneven atmosphericattenuation effects are minimal and pixel size is smaller than 20 km by 20 km. Data werethen binned to 1 deg by 1 deg in latitude and longitude grids.
Statistical analysis is then carried out which includes (1) the mean value ofthe ten-day samples; this establishes the global mean for each ofthe four seasons, (2) "temporal"standard deviation:
S.D.=I2-(I)2/N Nallsamples
which represents single cell analysis ofvariation ofbrightness at all locations over a ten-day period, and (3) "spatial" standard deviation:
s.d.='InI2-(EI)2/n n=9,and
S.D. = s.d. I N N all samples
which represents an average "in-scan" pixel-to-pixel variation within the 3 x 3 neighbors.
ifi. Highlights of Results
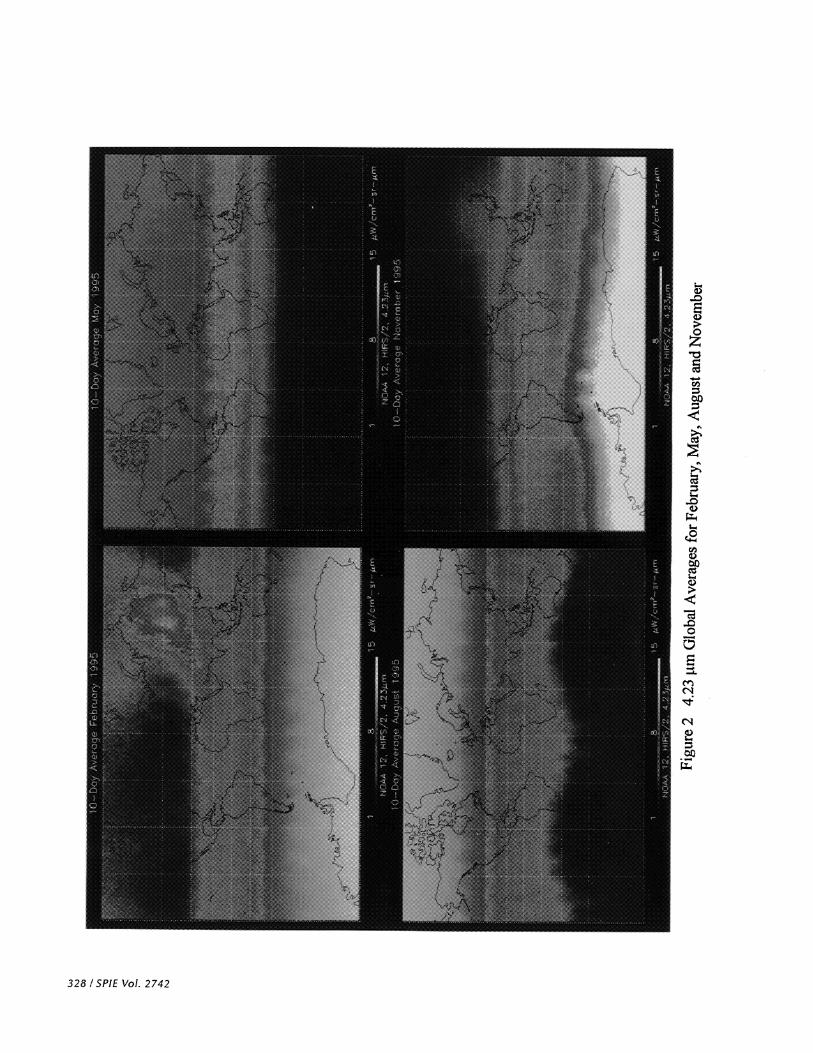
Some ofthe highlights ofthe statistical analysis results are presented here. Figure2 illustrates the amplitude ofH[RS/2 Channel 17 data for February, May, August andNovember. In both cases, the following can be concluded: (1) latitudinal variation is themost pronounced feature observed, (2) there is little longitudinal variation with respect toeither geographical coverage or land/sea variation, and (3) the amplitude variation isgenerally monotonic with respect to latitude corresponding to the upper stratosphericthermal conditions.
Additionally, some stratospheric warming effects are also observed. The mostevident is February in the >40 deg North Latitude and 70-13 5 deg East Longitude.Stratospheric warming is typically observed in January and February in the NorthernHemisphere at high latitude regions. Its persistent feature can last up to two weeks withtemperature increase up to 60 deg in altitude region of 40-50 km and up to 100 km.
The range of HIRS/2 Channel 17 data is 3-12 .tW/cm2-sr-tm for February, withthe highest value in the Antarctic and decreasing toward the Northern Hemisphere. In
326 ISPIE Vol. 2742

May the mean value ranges from 2 to 9 jtW/cm2srtm, with the highest value in theArctic region. Opposite geographical trends but with similar ranges as with February andMay are observed for August and November, respectively (with the exception ofNovember in the Antarctic where values greater than 1 5 W/cm2sr-jtm were present.)These are consistent with the stratospheric thermal effect, a direct result of heating due tothe absorption of solar ultraviolet radiation by ozone. A statistical representation of globalzonal mean temperature is illustrated in Figure 3 for comparison.
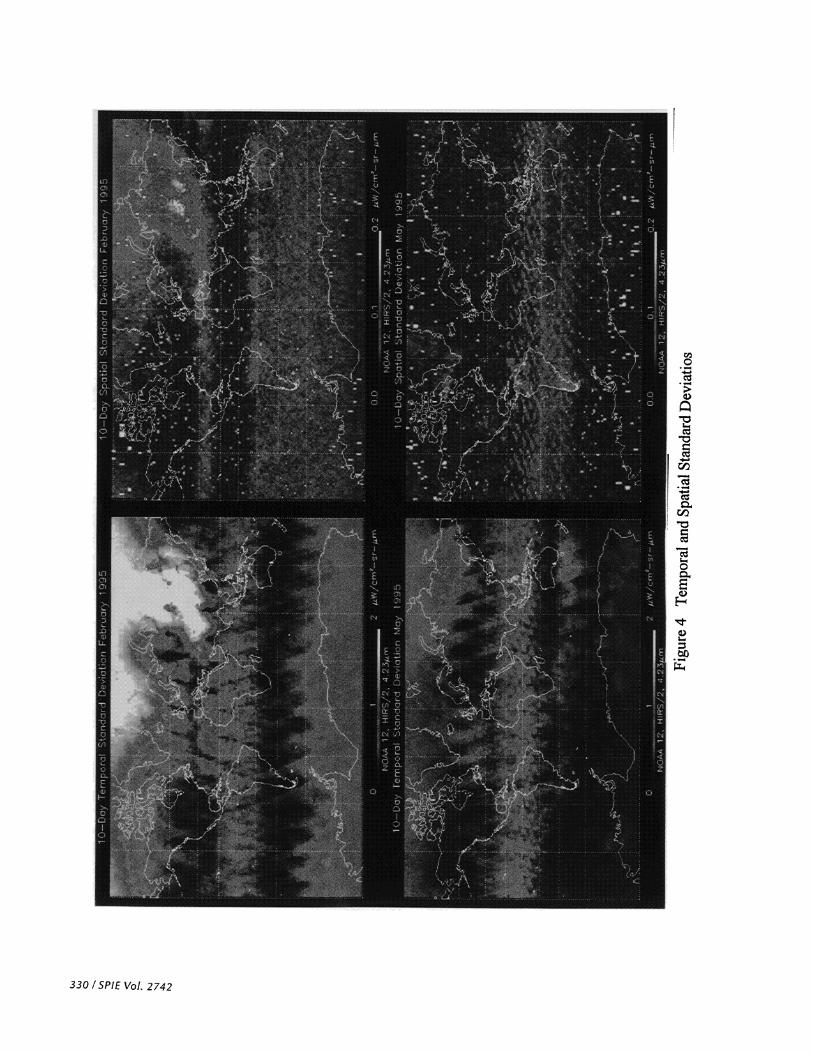
Sample temporal and spatial standard deviation results (February and May) areshown in Figure 4. Range oftemporal variation is typically < 1 W/cm2-srj.tm. Ingeneral, this represents the expected day-to-day variation. The spatial standard deviationresults are indicative ofthe spatial "gradient" in approximately 100 x 100 km areas.Typical values are O.O5 p,W/cm2-sr-p.m.
Also conducted was the comparison with model prediction. An example of theSynthetic High Altitude Radiance Code (SHARC 3) model runs based on the StandardAtmosphere Generator (SAG) is demonstrated in Figure 5. Both nadir look and 45deglook angle results for May are shown. The enhanced off-nadir values in the NorthernHemisphere are indicative ofthe non4ocal-thermal.-equilibrium effect due to the coherentsolar scattering. The agreement between data and model prediction is very good, within20%, which confirms the capability of SHARC to predict the below-the-horizon (BTH)latitudinal and diurnal variations ofthe 4.23 pmmean radiance.
Iv. Summary
A statistical analysis has been conducted ofglobal MWIR data in the 4.23 j.tmregion collected by an operational NOAA environmental and weather satellite. Initialeffort includes the investigation ofthe global mean amplitude and standard deviations,both spatial and temporal, for all representative seasons. Results also compare favorablywith model predictions. This work will be extended to analysis of other H[RS/2 bandsthat encompass the 4.2-4.4 mm spectral region. The data set is intended as part of thephenomenology database to aid in addressing various DoD space based system design andevaluation issues.
Acknowledgments
The authors wish to acknowledge the guidance ofCapt. David O'Donnell, ourprogram manager from the Air Force SMCIMT Office. We are grateful to Steve Niemanof the Space Science and Engineering Center, University of Wisconsin, for his assistancein calibration and navigation of the HIRS data. We are also indebted to Dr. Bill Blumbergof the Phillips Laboratory and Dr. James Duff of Spectral Sciences Inc. for the manyhelpful discussions and providing the model results from SHARC-3.
*Ref. Middle Atmosphere Dynamics, by D.G> Andrews, J.R. Holton and C.B. Levoy, Academic Press, 1987
SPIE Vol. 2742 / 327
(A)
03
N
Figu
re 2
4.
23 jt
m G
loba
l Ave
rage
s for
Feb
ruar
y, M
ay, A
ugus
t and
Nov
embe
r

GLO
BA
L Z
ON
AL
ME
AN
TE
MP
ER
AT
UR
E
NO
G)
Cl)
Cl) a. 0
lOS
70
S
105
505
40S
S
OS
lO
S JA
NU
AR
Y
JULY
Latit
ude
Fig
ure
3
0.0I
0. I 10
100
:/ _/
IC
. . .
2lO
/ 70
10
80
270
260_
__.._
___.
._...
S
o
—.-
——
---,
40
: 30
_J0
21 20
I0
1s
0 IO
N
2014
30
04
400
500
ION
70
04
lOW
AP
RIL
O
CT
OB
ER
•0
(I
rr
(J 0 rr
N
F'J
Figu
re 4
T
empo
ral a
nd S
patia
l Sta
ndar
d D
evia
tios

ri N
E
C%
1?
E I 0.
10
C,)
z LU
I- z
0.05
NO
AA
12
HIR
S/2
DA
TA
(4.2
3 pm
)
Figu
re 5
1 A
RC
TIC
E
QU
AT
OR
A
NT
AR
CT
IC
*SY
NT
HE
TIC
HIG
H A
LTIT
UD
E R
AD
IAN
CE
CO
DE
(SH
AR
C 3
)