by guest on june 5, 2018 ...circres.ahajournals.org/content/circresaha/35/2/204.full.pdfrelationship...
TRANSCRIPT

Relationship of the Functional Refractory Period to Conductionin the Atrioventricular Node
By Gregory R. Ferrier and Peter E. Dresel
ABSTRACTThe functional refractory period of atrioventricular (AV) transmission has been
accepted as a measure of AV nodal refractoriness and has been assumed to be determinedsolely by conduction of interpolated extrasystoles through the AV node when it is partiallyrefractory. In the present study, we found an important effect of the conduction time ofthe regular beats by measuring AV nodal conduction times of atrial extrasystoles from theHis bundle of isolated, blood-perfused dog hearts. We separated three independent com-ponents that determine AV nodal conductivity: (1) a "basal conduction time" measuredwith a "postmature" extrasystole at low heart rates (<120 /min), (2) a rate-dependentincrement in conduction time (previously called "fatigue") that affects both normal andpremature cycles equally and (3) an exponential change in conduction time that dependsentirely on the immediately preceding interval and, therefore, is not further affected byheart rate. The functional refractory period is one point defining this continuousexponential function. We showed that an important cause of the decrease in the functionalrefractory period that occurs when heart rate is increased is the change in the conductiontime of the regular beats.
KEY WORDSelectrophysiology
His bundleextrasystole
conductivitydog
heart rateepinephrine
• Krayer et al. (1) have defined the functionalrefractory period of the atrioventricular (AV) trans-mission system as the minimum interval betweentwo ventricular impulses propagated from theatria. They have also demonstrated that both thefunctional refractory period and the effective re-fractory period are decreased by administration ofepinephrine. This observation implies a relation-ship between the two refractory periods. Althoughthis relationship was not discussed by Krayer et al.(1), the functional refractory period has beeninterpreted as an estimate or an equivalent of theeffective refractory period (2, 3).
The effect of heart rate on AV nodal transmissionis not clear. The functional refractory period of theAV transmission system has been shown to de-crease when heart rate is increased (4-7). A de-crease in the functional refractory period impliesan increase in conductivity. However, Lewis andMaster (8) have reported that the P-R interval of
From the Department of Pharmacology and Therapeutics,Faculty of Medicine, University of Manitoba, Winnipeg, Mani-toba, Canada R3E OW3.
This study was supported by the Medical Research Council ofCanada.
Dr. Ferrier's present address is Masonic Medical ResearchLaboratory, Utica, New York 13501.
Received August 3, 1973. Accepted for publication April 18,1974.
204
early premature beats is decreased as heart rate isincreased. Rosenblueth (5) has also reported thatincreases in heart rate cause increases in conduc-tivity and decreases in the functional refractoryperiod of the AV transmission system. But, whenretrograde conduction is examined, no change inconductivity is observed (5). Both of these studiescan be criticized for neglecting the role of atrialconduction (9). However, the AV conduction timeof a premature response can be prolonged long afterthe expiration of the functional refractory period ofthe AV transmission system (1), and the AV nodaltissue can remain relatively refractory for a signifi-cant period after the termination of the actionpotential (10).
In the present study, we observed an apparentinconsistency between changes in the functionalrefractory period and changes in AV nodal conduc-tion times of premature responses in experimentsin which a single atrial premature response waselicited exactly halfway between two beats of agiven basic interval. Under such conditions, thefirst of the new series of basic beats can beconsidered to be the second of two equally spacedextrasystoles (11). Since the first extrasystoleshould have an abbreviated refractory period (4),the second extrasystole should be conductedthrough the AV node more rapidly than the first.
Circulation Research, Vol. 35. August 1974
by guest on July 15, 2018http://circres.ahajournals.org/
Dow
nloaded from

FUNCTIONAL REFRACTORY PERIOD AND CONDUCTION 205
However, we found that the second extrasystolewas conducted more slowly than the first in allhearts examined (5-40 msec in seven hearts).These results suggest that either the refractoryperiod does not decrease following a short preced-ing cycle or that conductivity is not directly relatedto the functional refractory period. The presentstudy tested these possibilities.
MethodsIsolated dog hearts were perfused with blood by the
method of Alanis et al. (12) as modified by Kirk andDresel (13). Blood was obtained from a large dog of eithersex that was anesthetized with sodium pentobarbital (30mg/kg, iv) and respired with air by a Palmer Idealrespiration pump. Blood from the femoral artery of onelimb was pumped through an external perfusion circuitand returned to the femoral vein of the same limb by adouble-headed Debakey roller pump. Heparin (400 IU/kg, iv) was administered to the donor dog prior tocannulation of the vessels. Hearts were obtained fromsmall dogs (5-11 kg) anesthetized with sodium pentobar-bital (35 mg/kg, iv). Each heart was placed in ice-cold,oxygenated Krebs-Henseleit solution, and the pericar-dium and other extraneous tissues were removed. Theheart was then perfused via the aorta at a pressuremaintained at 100 mm Hg by adjusting the speed of theroller pump. The temperature of the perfusing blood waskept at 37 ± 0.5 °C with a water-jacketed condensersituated immediately before the perfusion cannula in theexternal circuit.
The right atrium of the isolated heart was incised, andthe cut edges were retracted. The contacts of a flexiblebipolar probe were placed over the proximal His bundleto record the activity of that structure and surroundingtissues. An additional electrogram from either the rightatrial appendage or a site close to the coronary sinus wasrecorded with a pair of stainless steel clips.
In most experiments the sinoatrial (SA) node wasdestroyed by heat cautery or by ligation of the majorvessels supplying the region. Hearts were electricallypaced through bipolar stainless steel clips attached tothe right atrium near the SA node. Stimuli were 5-msecrectangular pulses, twice the threshold voltage, gener-ated by a Tektronix stimulator (type 162 and type 161)and passed through an isolation transformer. The outputof the stimulator was counted by a scale-of-ten counterwhich in turn triggered a second Tektronix stimulatorto introduce a test stimulus following every ten basicstimuli. The gate of the second wave-form generator wasused in some experiments to interrupt the basic stimula-tor and thus delay the next train of stimuli. Test stimulicould thus be delivered at intervals longer than the basicinterval. Basic and test stimuli were delivered throughthe same electrodes.
The recordings from the His bundle and right atriumwere displayed on a four-beam double-cathode oscillo-scope (Tektronix RM565 with 3A3 amplifiers) and photo-graphed with a 35-mm Shackman camera. The stimula-tor which generated the basic stimuli triggered one pairof beams. The remaining pair of beams was triggered bythe stimulator which generated the test stimuli. Photo-Circulation Research. Vol. 35. August 1974
graphs were taken in two ways: either the electrograms ofthe tenth basic cycle and the test cycle were photo-graphed for six to ten replicates or the shutter of thecamera was kept open to record the photographic meansof 100 basic and 10 test cycles. Records were projected ongraph paper (Dagmar Super model 35 microfilm viewer)for measurement of conduction intervals; 100-msec timemarkers were photographed and projected the same way.
ResultsLACK OF A RELATIONSHIP BETWEEN THE FUNCTIONAL REFRACTORY PERIOD OF THE AV NODE AND THE CONDUCTION TIMESTHROUGH THE NODE
The appearance of the electrogram obtained withextracellular electrodes placed over the His bundleis well known. We used the conventional notationsS, A, H, and V to represent the stimulus artifact,the electrical activity of the atrial tissue adjacentto the His bundle, the electrical activity of theproximal His bundle, and the electrical activity ofthe base of the interventricular septum near therecording site, respectively (9, 11-13). We took theA-H interval to be the conduction time through theAV node and denoted activity due to the inter-polated beat as S', A', and H'.
The functional refractory period of the AV nodewas determined by plotting the relationship of theH-H' interval to the A-A' interval (7). Thismethod excludes effects of atrial conduction time(9). The minimum H-H' interval was used as ameasure of the functional refractory period.
We confirmed in 11 preparations that the func-tional refractory period decreased when heart ratewas increased (Table 1). Data for a representativeexperiment are shown in Figure 1A. The functionalrefractory period decreased in response to a de-crease in the interval of the basic drive in 29 of 32cases. No change was seen in 3 cases, all of which
TABLE 1
Relationship of AV Nodal Functional Refractory Period andConduction Time to Changes in Basic Intervals
Number of observations
Functionalrefractory
period Conduction timeBasic
intervals(msec)
Long (800-500)Intermediate
(500-320)Short (320-250)TOTAL
De-crease
715
729
Nochange
21
03
De-crease
64
010
Nochange
39
012
In-crease
03
710
by guest on July 15, 2018http://circres.ahajournals.org/
Dow
nloaded from

206 FERRIER, DRESEL
H-H'msec
3 SO
300
250
200 -
ISO 200 250A-A'msec
300 350
A-Hmsec
160
140
120
100
•0
60
40
B
2O0 300 400 500A-A'msec
FIGURE 1
Lack of correlation between changes in the functional refractoryperiod and the AV nodal conduction times of prematureresponses. A: Functional refractory period decreased as theheart was driven at progressively shorter basic intervals. Solidcircles - 500 msec, squares - 320 msec, and open circles - 250msec. B: AV nodal conduction times (A'-H') of prematureresponses for same experiment as in A; symbols are the same asin panel A. Conduction times changed little when the basicinterval was decreased from 500 msec to 320 msec and increasedwhen the basic interval was decreased from 320 msec to 250msec.
occurred at relatively long basic intervals. Thisfinding confirmed the results of Mendez et al. (4).
The conduction times of the extrasystoles weredetermined in all of the experiments. Figure IBshows conduction time data from the same repre-sentative experiment considered in Figure 1A. Thecurve relating the A'-H' interval to the A-A'interval at the shorter basic interval would haveshifted to the left or downward if a decrease in con-duction time occurred. The experiment illustratedin Figure IB shows the opposite result. The resultsof these experiments are summarized in Table 1.Conduction time decreased in 10, remained con-
stant in 12, and increased in 10 observations. In allcases in which conduction time was decreased, thechange was small ( <1O msec). There appeared tobe a pattern in the changes in conduction time. Atlong basic intervals (800-500 msec) conductiontime most often decreased. At intermediate drivingintervals (500-320 msec) conduction time usuallydid not change, and at short basic intervals(320-250 msec) conduction time always increased.These observations clearly indicate that the de-creases in the functional refractory period whichoccurred in virtually all of the experiments werenot necessarily accompanied by decreases in theconduction times of extrasystoles. In fact, when ashort basic interval (320 msec) was further abbrevi-ated, the decrease in the functional refractoryperiod was always accompanied by an increase inconduction time.
The lack of correlation between changes in thefunctional refractory period and changes in con-ductivity raises the question of what property ofAV transmission determines the functional refrac-tory period. Figure 2A shows an example of theconventional curve used in determining the func-tional refractory period of the AV transmissionsystem. The functional refractory period is indi-cated as the minimum H-H' interval (in this case270 msec). The diagonal line indicates the contin-uum along which the H-H' interval is equal to theA-A' interval. This line describes the relationshipthat would exist between the H-H' interval and theA-A' interval if the extrasystoles were conductedwith the same conduction time as the basic cycle.The deviations of the actual curve from thisdiagonal base line must equal the delay in conduc-tion of the extrasystole compared with the conduc-tion of the basic cycle.
When the logarithms of the differences betweenthe actual curve and the diagonal line were plottedas a function of the atrial coupling interval, astraight line resulted over most of the range,indicating that the relationship was exponentialwithin limits (Fig. 2B). A change in slope at veryshort coupling intervals was observed in approxi-mately 50% of the preparations.
A similar derivation can be made from themeasured AV nodal conduction time (A'-H'). Fig-ure 2C shows the relationship between the A'-H'interval and the A-A' interval of the extrasystolefor this experiment. The conduction time of thebasic cycle (A-A = 500 msec) is indicated by an X.The horizontal broken line represents a base linecorresponding to the diagonal line in Figure 2A.
Circulation Research. Vol. 35. August 1974
by guest on July 15, 2018http://circres.ahajournals.org/
Dow
nloaded from

FUNCTIONAL REFRACTORY PERIOD AND CONDUCTION 207
H-H'msec
500
400
300FRP •
200
A-Hmsec
150
100
50
100
H-H'dev.msec
10
200
•
•
300
A-A'
FRP
\
\
400 500msec
B i
A Cms<
100
ec
10
200
r
300
A-A'
FRP
\
400
msec
\
500
D
200 300 400 5O0
A-A' msec200 300 400 500
A-A' msecFIGURE 2
Analysis of the relationship between the A V nodal conduction times of premature responses and thecurve relating His bundle intervals to atrial intervals. A: Relationship between His bundle intervalsand atrial intervals. B: Semilogarithmic plot of the deviations of the H-H' interval from the diagonalin A (H-H' dev.) as a function of the atrial interval. C: A V nodal conduction times for the sameexperiment. Broken line and X indicate the conduction time of the basic cycle (interval - 500 msec).D: Semilogarithmic plot of the differences between the conduction times of the premature responsesand the basic cycle (ACT.) as a function of the atrial interval. The functional refractory period (FRP)is indicated in each section.
This base line was subtracted from the curve forthe extrasystole for all coupling intervals tested.When these differences were plotted logarithmi-cally as a function of the A-A' interval, theresulting exponential function (Fig. 2D) was identi-cal to that derived from the curve relating the H-H'interval to the A-A' interval. Thus, the observedcurve relating the H - H ' interval to the increases inthe A-A' interval (Fig. 2A) is the sum of two func-tions, the decreasing exponential function (Fig.2B and D) and the increasing straight line function(Fig. 2A); the slope of the straight line is one. Thenegative slope of the exponential function changescontinuously from steeper than minus one to ap-proximately zero. At some intermediate point, theslope of the exponential function must equal minusone. Therefore, the sum of the slopes of the twofunctions at this point is zero. Thus, the curverelating changes in the H-H' interval to changes in
Circulation Research. Vol. 35, August 1974
the A-A' interval must reach a minimum pointwith a slope of zero. This point is the functionalrefractory period. The points corresponding to thefunctional refractory period are indicated in each ofthe graphs in Figure 2. The functional refractoryperiod represents an intermediate point on a con-tinuous function, i.e., a minimum interval gener-ated because of the exponential nature of therelationship between the coupling interval and thechange in conduction time.
Although this argument implies that the func-tional refractory period is not a true refractoryperiod, it suggests that the functional refractoryperiod should be a good index of conductivity sinceit corresponds to a specific point on the exponen-tial function. This supposition might be true whenthe effect of a specific variable, e.g., a drug, istested at constant heart rate, but additional com-plications can arise. Figure 3 shows the effect of
by guest on July 15, 2018http://circres.ahajournals.org/
Dow
nloaded from

2 0 8 FERRIER, DRESEL
H-H'msec
600
500
4 0 0
300
200 -i
ACT.msec
100
10
B
100 200 300 4 0 0 500 100 200 300 400 500
A-A' msec A-A' msecFIGURE 3
Effect of changing the basic interval on the exponential function relating the difference betweenconduction times of premature and basic cycles to atrial coupling intervals (ACT.). A: Decrease inthe functional refractory period caused by a decrease in the basic interval. Solid circles = 630 msec,crosses - 400 msec, and open circles •» 250 msec. B: Exponential functions for the experiment in A;symbols are the same as in A.
increased heart rate on the functional refractoryperiod and the exponential function. The heartused in this experiment was driven at basic inter-vals of 630, 400, and 250 msec. The functionalrefractory period decreased as the heart rate wasincreased (Fig. 3A). Figure 3B shows the corres-ponding exponential functions. The slope of thelines increased as the heart rate was increased.The line deviated toward the abscissa at theshortest basic interval, suggesting that the re-lationship might no longer be a simple exponen-tial function.
The exponential functions in Figures 2 and 3were derived by using the conduction time of thebasic cycle as a reference value. By definition, thedifference between the conduction time of theextrasystole and the conduction time of the basiccycle reaches zero when the coupling interval(A-A') equals the basic driving interval (A-A).Therefore, it is obvious that the exponential func-tions must deviate toward the abscissa as thecoupling interval approaches the basic interval.This deviation must occur earlier as the basicinterval is shortened, suggesting that the conduc-tion time of the basic cycle might not be the bestreference value to use in determining the exponen-tial function.
It appeared that a better reference value couldbe obtained in experiments in which coupling inter-vals longer than the basic intervals were tested.
Therefore, it was necessary to modify the experi-mental method. A long delay (600-1000 msec) wasintroduced between each tenth basic stimulus andthe beginning of the next train of ten basic pulsesto permit coupling intervals longer than the inter-vals of the basic drive (e.g., A-A' = 750 msec whenA-A = 320 msec) to be tested. An example of suchan experiment is shown in Figure 4. Figure 4Ashows the relationship between the A'-H' intervaland the A-A' interval for coupling intervals as longas 800 msec tested at basic intervals of 500, 320,and 250 msec. The conduction time at long inter-vals reached a minimum value at each heart rate.This minimum conduction time became signifi-cantly longer as the heart rate was increased. Asimilar phenomenon was described as "fatigue" byLewis and Master (8). This fatigue effect was foundin each of ten hearts in which very long couplingintervals were tested.
The exponential functions determined by sub-tracting the conduction times of basic cycles fromthe conduction times of the extrasystoles for eachof the three heart rates are illustrated in Figure 4B.As in Figure 3B, the slope of these lines changed asthe basic interval was decreased.
The AV nodal conduction time of regular beatsincreases as the basic interval is decreased (Fig.4C). Each of the conduction times of the basiccycles (plus signs [+ ] in Fig. 4A) fell on theappropriate curve describing the conduction times
Circulation Research. Vol. 35. August 1974
by guest on July 15, 2018http://circres.ahajournals.org/
Dow
nloaded from

FUNCTIONAL REFRACTORY PERIOD AND CONDUCTION 209
A-Hiraac
200 300 400A-A'msec
200 300 400 500BASIC iNntvAi msec
FIGURE 4
Role of increases in conduction time of basic cycles in changingthe exponential relationship between ACT and the atrialinterval. A: Conduction times of responses initiated at intervalsup to 800 msec. Conduction time of the basic cycles is indicatedby + . Symbols are the same as in Figure 1. B: Effect of changesin basic interval on the exponential relationship between thechange in conduction time and the A-A' interval for sameexperiment. C: Relationship between the conduction time ofbasic cycles and the change in basic interval.
of the extrasystoles. This coincidence was ob-served in each of ten hearts. Thus, the samerelationship between the conduction time and theatrial interval applies to conduction of both ex-trasystoles and basic cycles. At the slowest heartrate (basic interval = 500 msec) the point describ-ing the basic cycle fell on the asymptote of thecurve. At the two higher heart rates this point fellon the ascending limbs of the curves. Thus, differ-ent values for the conduction time of the basiccycle had been subtracted from the conductiontimes of the extrasystoles when each of the curvesin Figures 4B and 3B were calculated. This changein the base line caused the changes in the slopes ofthe exponential functions. Most important, asillustrated in Figure 2, these functions are identicalto those that determine the functional refractoryperiod. The plots used to determine the functional
Circulation Research. Vol. 35. August 1974
refractory period for the data in Figure 4 are shownin Figure 5. As the basic interval was decreased, thecurves shifted downward in parallel. This parallelshift was exactly equal to the change in conductiontime of the basic cycle. The functional refractoryperiod was also decreased by an amount equal tothe increase in the A-H interval for the basic cycle.In other words, when the basic interval was de-creased, the functional refractory period decreasedbecause the AV nodal conduction times of the basiccycles increased.
The curves in Figure 5 for basic intervals lessthan 500 msec crossed the diagonal line. The pointsthat fell below the line corresponded to couplingintervals longer than the basic intervals (320 or 250msec). The AV nodal conduction times of extrasys-toles delivered at these long intervals were shorterthan the conduction times of the basic intervals.Therefore, the resulting H-H' intervals were lessthan the A-A' intervals. The curves crossed thediagonal when the A-A' interval was equal to thebasic interval, i.e., they were not coincident withthe diagonal line at any other point. Thus, thecurves relating the H-H' interval to the A-A'interval at different heart rates did not have acommon base line and could not be compareddirectly.
Since the conduction time of the basic cycle isdifferent at each heart rate, the basic cycle does notprovide a logical reference from which changes in
H-H'msec
500
4 0 0
300
200
200A-A
300 400 500
FIGURE 6
Plots to determine the functional refractory period from thedata in Figure 4. Symbols are the same as in Figure 1.
by guest on July 15, 2018http://circres.ahajournals.org/
Dow
nloaded from

2 1 0 FERRIER. DRESEL
conduction times of the extrasystoles should bemeasured. The minimum conduction time provedto be a better reference. Although it changed withheart rate (Fig. 4), the minimum conduction timeprovided a natural division of conduction timesinto a minimum conduction time plus a slowingdue to the prematurity of a response. The mini-mum conduction time of each of the curves inFigure 4A was subtracted from the measuredconduction times, and the logarithms of the differ-ences were plotted as a function of the A-A'interval. Figure 6 shows that this relationship was asimple exponential function at all heart rates andthat the exponential functions were superimposa-ble, i.e., the relationship between prematurity andthe change in conduction time above the minimumconduction time was the same at all three heartrates. This relationship held true for a large rangeof basic intervals. Figure 7 shows the points ob-tained in one heart at basic intervals of 800, 630,500, 400, 320, and 275 msec. The results shown inFigures 6 and 7 were confirmed in all ten experi-ments.
FATIGUE EFFECT
The fatigue effect was examined by testing asingle coupling interval at a series of different heartrates. This procedure allowed a wide range of heartrates to be examined within a few minutes; fivehearts were tested. Figure 8 shows the results of one
100
ACT.msec
10
I2OO 300 400
A-A' msec500
FIGURE 6
Lack of effect of the basic interval on the exponential function(ACT.) if deviations from the minimal conduction limes (Fig.4A) are plotted instead of deviations from the conduction timesof basic cycles {Fig. 4B). Symbols are the same as in Figure 1.
100
ACT.msec
10
I200 300
A-A' msec400
FIGURE 7
Single exponential function (ACT.) relating the increase inconduction time of premature reponses above the respectiveminimum conduction times to the atrial coupling interval atbasic intervals of 800, 630, 500, 400, 320, and 275 msec.
experiment in which the test stimulus was deliv-ered with a coupling interval of 800 msec while thebasic interval was shortened in steps from 800msec to 250 msec. The conduction time increasedonly slightly (2 msec) as the basic interval wasdecreased from 800 msec to 500 msec. Furtherdecreases of the basic interval caused progressivelylarger increments in conduction time.
A-Hmsec
60
50
40
30 I I I200 800400 600
Basic Interval msecFIGURE 8
Effect of decreasing the basic interval on the conduction time ofa test response initiated at an atrial coupling interval of 800msec, i.e., the fatigue phenomenon.
Circulation Rneaixh. Vol. 35. August 1974
by guest on July 15, 2018http://circres.ahajournals.org/
Dow
nloaded from

FUNCTIONAL REFRACTORY PERIOD AND CONDUCTION 211
EFFECT OF DROMOTROPIC AGENTS ON THE CONDUCTIVITY OF THEAV NODE
AV nodal conduction time can be divided intothree components. The first component is "basalconduction time," which is the minimum conduc-tion time determined at very slow heart rates(e.g., 800-msec intervals) at which fatigue is negli-gible. The second component is the increment dueto fatigue. The third component is represented bythe exponential function that determines the in-crease in conduction time which will occur whenthe coupling interval is shortened (interval-relatedconductivity). Interval-related conductivity, fa-tigue factor, and basal conduction time togetherdetermine the conduction times of both basiccycles and extrasystoles, and study of the effects ofdromotropic agents on each component might helpto characterize their types of actions. Therefore, westudied the effects of infusions of epinephrine onthe conductivity of the AV node in four hearts.
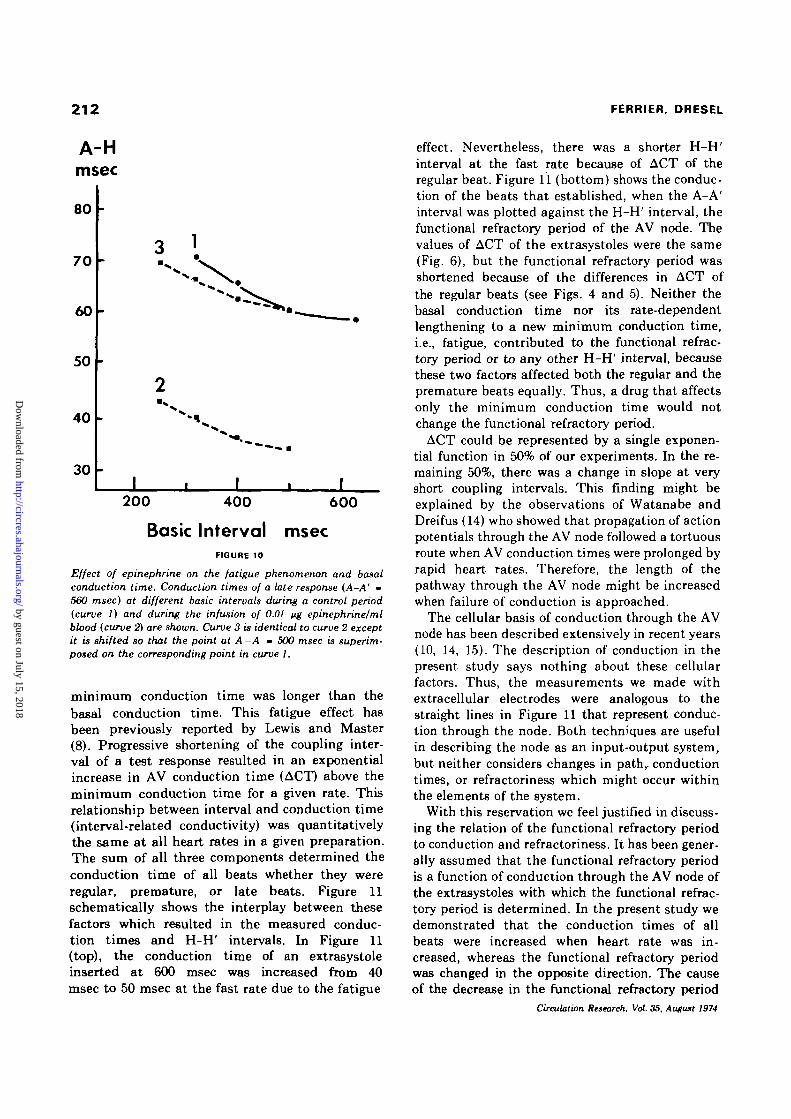
Figure 9A shows the effect of epinephrine (0.02/ig/ml blood) on conduction times through the AVnode for one experiment. The basic interval was250 msec. Conduction time was decreased at eachcoupling interval tested. The conduction time ofthe basic cycle was decreased more (22 msec) thanwas the minimum conduction time (13 msec).Figure 9B shows that epinephrine caused a parallelshift of the exponential curve; this effect of epi-nephrine was clearly different from the effect ofchanges in heart rate. The change in the minimumconduction time does not differentiate between achange in the basal conduction time and a decreasein the fatigue effect. The fatigue effect was studiedin three hearts, and a representative result is shownin Figure 10. This preparation showed some auto-maticity; therefore, the maximum basic cyclelengths that could be used were 630 msec for thecontrol period and 500 msec during infusion of thedrug. The maximum coupling interval that couldbe used for the extrasystole during infusion ofepinephrine was 560 msec. The control basal con-duction time estimated by the asymptote of curve 1was no less than 55 msec. The basal conductiontime during infusion of epinephrine estimated bythe asymptote of curve 2 was not greater than 33msec. The increment in conduction time of the late(560 msec) extrasystole for each decrease in thebasic interval was slightly less during the infusionof epinephrine, i.e., epinephrine decreased thefatigue effect. This process is more easily seen if thetwo curves are compared from a common base line(curve 3 in Fig. 10). The results of the remaining
Circulation Research, Vol. 35. August 1974
A-Hmsec
160
120
roo
to
60
A-A30O
msac
100
ACT.msec
10
r V
0 N
r
- I 1
B
200 300
A-A' msec4 0 0
FIGURE 9
A: Effect of epinephrine on the AV conduction times ofpremature and late cycles. Solid circles •= control and opencircles - epinephrine {0.02 iiglml blood). Conduction time ofa basic cycle is indicated by +. B: Effect of epinephrine on theexponential function determined from the minimum conductiontime.
two experiments agreed closely with those illus-trated in Figure 10. Thus, the minimum conduc-tion time was decreased by epinephrine by areduction in both the basal conduction time andthe fatigue effect.
DiscussionWe have identified three variables that deter-
mine AV conduction time. Basal conduction time,the shortest AV conduction time, was demon-strated by responses initiated 500-1000 msec fol-lowing trains of regular beats at low frequencies(basic interval 500-1000 msec). Increasing theheart rate caused slowing of conduction of allbeats, independent of the interval between them,so that even late responses were slowed and the
by guest on July 15, 2018http://circres.ahajournals.org/
Dow
nloaded from
212 FERRIER, DRESEL
A-Hmsec
80
70
60
50
40
30
200 400 600
Basic Interval msecFIGURE 10
Effect of epinephnne on the fatigue phenomenon and basalconduction time. Conduction times of a late response (A-A' -560 msec) at different basic intervals during a control period(curve 1) and during the infusion of 0.01 ng epinephrine/mlblood (curve 2) are shown. Curve 3 is identical to curve 2 exceptit is shifted so that the point at A -A - 500 msec is superim-posed on the corresponding point in curve 1.
minimum conduction time was longer than thebasal conduction time. This fatigue effect hasbeen previously reported by Lewis and Master(8). Progressive shortening of the coupling inter-val of a test response resulted in an exponentialincrease in AV conduction time (ACT) above theminimum conduction time for a given rate. Thisrelationship between interval and conduction time(interval-related conductivity) was quantitativelythe same at all heart rates in a given preparation.The sum of all three components determined theconduction time of all beats whether they wereregular, premature, or late beats. Figure 11schematically shows the interplay between thesefactors which resulted in the measured conduc-tion times and H-H' intervals. In Figure 11(top), the conduction time of an extrasystoleinserted at 600 msec was increased from 40msec to 50 msec at the fast rate due to the fatigue
effect. Nevertheless, there was a shorter H-H'interval at the fast rate because of ACT of theregular beat. Figure 11 (bottom) shows the conduc-tion of the beats that established, when the A-A'interval was plotted against the H-H' interval, thefunctional refractory period of the AV node. Thevalues of ACT of the extrasystoles were the same(Fig. 6), but the functional refractory period wasshortened because of the differences in ACT ofthe regular beats (see Figs. 4 and 5). Neither thebasal conduction time nor its rate-dependentlengthening to a new minimum conduction time,i.e., fatigue, contributed to the functional refrac-tory period or to any other H-H' interval, becausethese two factors affected both the regular and thepremature beats equally. Thus, a drug that affectsonly the minimum conduction time would notchange the functional refractory period.
ACT could be represented by a single exponen-tial function in 50% of our experiments. In the re-maining 50%, there was a change in slope at veryshort coupling intervals. This finding might beexplained by the observations of Watanabe andDreifus (14) who showed that propagation of actionpotentials through the AV node followed a tortuousroute when AV conduction times were prolonged byrapid heart rates. Therefore, the length of thepathway through the AV node might be increasedwhen failure of conduction is approached.
The cellular basis of conduction through the AVnode has been described extensively in recent years(10, 14, 15). The description of conduction in thepresent study says nothing about these cellularfactors. Thus, the measurements we made withextracellular electrodes were analogous to thestraight lines in Figure 11 that represent conduc-tion through the node. Both techniques are usefulin describing the node as an input-output system,but neither considers changes in path,, conductiontimes, or refractoriness which might occur withinthe elements of the system.
With this reservation we feel justified in discuss-ing the relation of the functional refractory periodto conduction and refractoriness. It has been gener-ally assumed that the functional refractory periodis a function of conduction through the AV node ofthe extrasystoles with which the functional refrac-tory period is determined. In the present study wedemonstrated that the conduction times of allbeats were increased when heart rate was in-creased, whereas the functional refractory periodwas changed in the opposite direction. The causeof the decrease in the functional refractory period
Circulation Research, Vol. 35, August 1974
by guest on July 15, 2018http://circres.ahajournals.org/
Dow
nloaded from

FUNCTIONAL REFRACTORY PERIOD AND CONDUCTION 213
Basic Interval 500600
Basic Interval 250600
H - H » 6 0 0 H-H'-580
I I40
40-BASAL-400 - FATIGUE - 0
0 - A C T - 0-180^
I I40
II70
40 -BASAL-4010-FATIGUE-10
20-ACT-O
II50
I I40
I I100
I I70
I110
40-BASAL-400-FATIGUE-0
O-ACT-60100
mSec
40-BASAL-4010-FATIGUE -10
2 0 - A C T - 6 0
FIQURE 11
Analysis of transmission through the A V node of a late extrasystole (top) and an extrasystole thatestablishes the functional refractory-period (bottom). The last driven beats are shown. Theconduction of each impulse is broken down into the three factors determining it immediately beloweach section of the diagram.
was traced to the characteristics of conduction ofthe regular beats. The fatigue effect, which slowsconduction through the node, does not affect thefunctional refractory period. These considerationsindicate that statements about the action of phys-iological or pharmacological influences on conduc-tion through the AV node that are based simply onchanges in the functional refractory period must beinterpreted with some caution. The functionalrefractory period has never been a classical refrac-tory period of the system; extrasystoles enteringthe system before the functional refractory periodare in fact conducted through the node. The onlydromotropic agent which we studied in detail,epinephrine, caused major changes in all threecomponents of conduction. It shortened the basalconduction time, decreased fatigue, and caused aparallel shift of the ACT exponential relationship.When the effects of epinephrine on the functionalrefractory period were plotted, the drug not onlydecreased the functional refractory period but alsodecreased the coupling interval (A-A') of theextrasystole which determined the functional re-fractory period. Therefore, it appeared that thisshift in the A-A' interval could be used to measure
Circulation Retearch. Vol. 35. August 1974
a parallel shift in the ACT curve. However, prelim-inary results indicate that some manipulations andsome agents not only shift the exponential functionbut also change its curvature, i.e., change the slopeof the semilogarithmic plot.
Therefore, the functional refractory period is aquestionable index of AV nodal conductivity. How-ever, the functional refractory period of the AVnode remains an important parameter of cardiacfunction. By definition the functional refractoryperiod of the AV node is the minimum ventricularinterval that can be propagated from the atria and,therefore, is one of the determinants of the ventric-ular response to rapid atrial rates. It is sometimesdesirable to determine how a drug might affect thefrequency of ventricular activation in, for example,supraventricular tachycardias or atrial flutter. Inthese situations the functional refractory period isobviously an important index of AV nodal function.In addition, our results do not discredit the func-tional refractory period as a measure of refractori-ness in atrial or ventricular tissues in which theconduction time of basic cycles changes little over awide range of physiological frequencies.
The relationship between conduction time and
by guest on July 15, 2018http://circres.ahajournals.org/
Dow
nloaded from

214 FERRIER, DRESEL
conductivity of the AV node which emerges fromour study is somewhat analogous to the relation-ship of contractile force to contractility. The latterhas become identified with the entire relationshipof contractile force or velocity to independentvariables such as length, resting tension, etc. Weconsider conductivity to be definable only by aseries of measurements of conduction times of bothextrasystoles and basic cycles at various basalrates. Without this technique, it is not possible todetermine which of the three determinants ofconduction time have been affected by the experi-mental parameter under investigation. Perhapsthis more detailed determination of changes in con-ductivity will lead to a better understanding of theprocess of AV nodal conduction.
References1. KRAYER O, MANDOKI JJ, MENDEZ C: Studies on veratrum
alkaloids: XVI. Action of epinephrine and of veratramineon the functional refractory period of the auriculo-ven-tricular transmission in the heart-lung preparation of thedog. J Pharmacol Exp Ther 103:412-419, 1951
2. PRESTON JB, MCFADDEN S, M O E G K : Atrioventricular trans-mission in young mammals. Am J Physiol 197:236-240,1959
3. MOE GK, PRESTON JB, BURLINGTON H: Physiologic evidencefor a dual A-V transmission system. Circ Res 4:257-275,1956
4. MENDEZ C, GRUHZIT CC, MOE GK: Influence of cycle length
upon refractory period of auricles, ventricles, and A-Vnode in the dog. Am J Physiol 184:287-295, 1956
5. ROSENBLUETH A: Functional refractory period of cardiactissues. Am J Physiol 194:171-183, 1958
6. KOHU JD, TUTTLE RR, DRESEL PE, INNES IR: Influence of
anesthetics and of arterial blood pressure on the func-tional refractory period of atrioventricular conduction. JPharmacol Exp Ther 153:505-510, 1966
7. HAN J, MOE GK: Cumulative effects of cycle length onrefractory periods of cardiac tissues. Am J Physiol217:106-109, 1969
8. LEWIS T, MASTER AM: Observations upon conduction in themammalian heart: A-V conduction. Heart 12:209-258,1925
9. FERRIER GR, DRESEL PE: Role of the atrium in determiningthe functional and effective refractory periods and theconductivity of the atrioventricular transmission system.Circ Res 33:375-385, 1973
10. MERIDETH J, MENDEZ C, MUELLER WJ, MOE GK: Electrical
excitability of atrioventricular nodal cells. Circ Res23:69-85, 1968
11. SASYNIUK BI, DRESEL PE: Effect of diphenylhydantoin onconduction in isolated, blood-perfused dog hearts. JPharmacol Exp Ther 161:191-196, 1968
12. ALANIS J, GONZALEZ H, LOPEZ E: Electrical activity of thebundle of His. J Physiol (Lond) 142:127-140, 1958
13. KIRK BW, DRESEL PE: Effects of amodiaquin and quinidineon cardiac conduction. Can J Physiol Pharmacol43:29-38, 1965
14. WATANABE Y, DREIFUS LS: Inhomogeneous conduction in theA-V node, a model for re-entry. Am Heart J 70:505-514,1965
15. MENDEZ C, MOE GK: Some characteristics of transmem-brane potentials of A-V nodal cells during propagation ofpremature beats. Circ Res 19:993-1010, 1966
Circulation Research. Vol. 35. August 1974
by guest on July 15, 2018http://circres.ahajournals.org/
Dow
nloaded from

GREGORY R. FERRIER and PETER E. DRESELNode
Relationship of the Functional Refractory Period to Conduction in the Atrioventricular
Print ISSN: 0009-7330. Online ISSN: 1524-4571 Copyright © 1974 American Heart Association, Inc. All rights reserved.is published by the American Heart Association, 7272 Greenville Avenue, Dallas, TX 75231Circulation Research
doi: 10.1161/01.RES.35.2.2041974;35:204-214Circ Res.
http://circres.ahajournals.org/content/35/2/204World Wide Web at:
The online version of this article, along with updated information and services, is located on the
http://circres.ahajournals.org//subscriptions/
is online at: Circulation Research Information about subscribing to Subscriptions:
http://www.lww.com/reprints Information about reprints can be found online at: Reprints:
document. Permissions and Rights Question and Answer about this process is available in the
located, click Request Permissions in the middle column of the Web page under Services. Further informationEditorial Office. Once the online version of the published article for which permission is being requested is
can be obtained via RightsLink, a service of the Copyright Clearance Center, not theCirculation Research Requests for permissions to reproduce figures, tables, or portions of articles originally published inPermissions:
by guest on July 15, 2018http://circres.ahajournals.org/
Dow
nloaded from