by dorothy a. otieno - erepo.usiu.ac.ke
TRANSCRIPT

FACTORS INFLUENCING CONSUMER CHOICE OF BEER BRAND
IN KENYA: A CASE OF EAST AFRICAN BREWERIES BEER
BRAND SELECTION
BY
DOROTHY A. OTIENO
UNITED STATES INTERNATIONAL UNIVERSITY - AFRICA
SUMMER 2018
i
FACTORS INFLUENCING CONSUMER CHOICE OF BEER BRAND
IN KENYA: A CASE OF EAST AFRICAN BREWERIES BEER
BRAND SELECTION
BY
DOROTHY A. OTIENO
A Research Project Report Submitted to the Chandaria School of Business in Partial
Fulfillment of the Requirement for the Degree of Masters in Business
Administration (MBA)
UNITED STATES INTERNATIONAL UNIVERSITY - AFRICA
SUMMER 2018
ii
STUDENT’S DECLARATION
I, the undersigned, declare that this is my original work and has not been submitted to any
other college, institution or university other than the United States International
University in Nairobi for academic credit.
Signed: ________________________ Date: _______________________
Dorothy Otieno (ID No: 638609)
This research project report has been presented for examination with my approval as the
appointed supervisor.
Signed: ________________________ Date: _______________________
Dr. Peter Kiriri
Signed: ________________________ Date: _______________________
Dean, Chandaria School of Business
iii
COPYRIGHT
Copyright © Dorothy Otieno, 2018
All rights reserved.
No part of this report may be photocopied, reproduced or otherwise recorded, stored in a
retrieval system or transmitted in any electronic or mechanical means without prior
permission of the copyright owner.
iv
ABSTRACT
The purpose of this study was to study the factors influencing consumer choice of beer
brand with a focus on EABL beers. The study was guided by the following research
questions. How does external influencers affect consumer choice, how does external
influencers affect consumer choice of beer, how does the marketing factors influence
consumer choice of beer.
The research design used for the study was both descriptive and inferential, the study
targeted beer consumers in Nairobi County. A population of 150,000 is EABL beer
consumers, according to beershara.co.ke, from which a sample size of 399 was selected
using the simple random sampling formula. The sampling technique used was clustering
and simple random sampling of beer consumers across Nairobi, the sampling frame in
this study involved the residents of Nairobi who are consumers of EABL beers. The data
collection method used was questionnaires which employed the 5 Linkert scale in rating
of various responses. Collected data was coded and analyzed using SPSS version 20 to
generate the results. Correlation and regression analysis to generate the finding, the
results were presented in tables and figures.
According to the findings of the study most of the respondents feel that internal factors
greatly influence the consumer choice. Factors such as cost of beer, availability of
cheaper alternatives, increase income, lifestyle and personality significantly affect their
choice of beer. The findings revealed that income had a negative, but significant
relationship with consumer choice of beer brand, and every increase in income results in a
decrease in consumer choice due to the inverse relationship.
The study also revealed that external influencers had a significant effect on consumer
choice, factors such as culture, religion, social class and family greatly influence
consumer choice. The study showed that (culture, social structure, family, and
demography) account for 57.7% of the consumer choice. According to the findings,
culture had a positive significant relationship with consumer choice of beer brand, and
every increase in culture results in an increase in consumer choice. Social structure had a
positive significant relationship with consumer choice of beer brand, and every increase
in social structure results in an increase in consumer choice.
v
Last but not least the study also revealed a significant relationship between marketing
factors and choice of beer brand therefore factors such as price, product features, and
promotion and distribution impact heavily in consumer choice of beer brand. The findings
revealed the product features had a positive significant relationship with consumer choice
of beer brand, and every increase in product results in an increase in consumer choice.
In light of the findings, the study concluded that there is a positive significant relationship
between internal factors and beer brand choice factors such as income, age and gender
showed a greater significance to beer choice, the study also concluded that there is a
positive significance relationship between the external factors and beer brand choice
however factors within external influencers such as religion showed that there is little or
no significance to beer brand choice. A look at the product factors the study showed that
packaging and alcoholic percentages showed a positive influence towards beer brand
choice, however product quality retained a low significance to beer brand choice,
products price range and availability of offers and discounts had a significant relationship
with choice of beer brand.
As regards cultural influencers it is recommended that EABL should allocate appropriate
influencers for their marketing campaigns as this affects greatly the perception of the beer
brand and therefore choice. The age, gender and lifestyle factors should be considered
while considering the appropriate influencer. It is also recommended that EABL should
focus on packaging aspects for its beers for different target markets as it affects beer
choice significantly. It is recommend that EABL prices its products appropriately as per
target age, gender and social class as this affects their choice country. Notably, the
findings from this study form the basis of further study on the same field in other
counties.

vi
ACKNOWLEDGEMENT
I would like to express my special gratitude to my supervisor (Prof. Peter Kiriri), for his
expert support and patience during the proposal and implementation of this project.
Without his academic support this project would not have met the threshold, thus his
support was vital to the success.
Secondly I would like to thank my research assistants who were of value for data
collection from Nairobi bars and restaurants. This would not have been possible without
them.
Finally and most importantly, I would like to thank God almighty for giving me the
patience, grit and determination to compete this project within the stipulated time frame.

vii
DEDICATION
I would like to dedicate this project to my lovely daughter Gabriella Imora. I hope that I
made you proud and inspired you to pursue and attain the highest academic accolade in a
field of your choice one day. Thank you for being a great source of joy and drive to
pursue this project to completion. May God bless you mightily dear daughter as you grow
and may you attain all that you set to achieve.

viii
TABLE OF CONTENTS
STUDENT’S DECLARATION ........................................................................................ ii
COPYRIGHT ....................................................................................................................iii
ABSTRACT ....................................................................................................................... iv
ACKNOWLEDGEMENT ................................................................................................ vi
DEDICATION.................................................................................................................. vii
LIST OF TABLES ............................................................................................................. x
LIST OF FIGURES .......................................................................................................... xi
LIST OF ACRONYMS ................................................................................................... xii
CHAPTER ONE ................................................................................................................ 1
1.0 INTRODUCTION........................................................................................................ 1
1.1 Background of the Study ............................................................................................... 1
1.2 Statement of the Problem ............................................................................................... 6
1.3 Purpose of the Study ...................................................................................................... 7
1.4 Research Questions ........................................................................................................ 8
1.5 Significance of the Study ............................................................................................... 8
1.6 Scope of the Study ......................................................................................................... 9
1.7 Definition of Terms........................................................................................................ 9
1.8 Chapter Summary ........................................................................................................ 10
CHAPTER TWO ............................................................................................................. 11
2.0 LITERATURE REVIEW ......................................................................................... 11
2.1 Introduction .................................................................................................................. 11
2.2 Effect of Internal Influencers on Consumer Choice .................................................... 11
2.3 Effect of External Influencers on Consumer Choice ................................................... 21
2.4 Effect of Marketing Mix Factors on Consumer Choice............................................... 25
2.5 Chapter Summary ........................................................................................................ 32
ix
CHAPTER THREE ......................................................................................................... 33
3.0 RESEARCH METHODOLOGY ............................................................................. 33
3.1 Introduction .................................................................................................................. 33
3.2 Research Design........................................................................................................... 33
3.3 Population Sampling Design........................................................................................ 33
3.4 Data Collection Methods ............................................................................................. 35
3.5 Research Procedures .................................................................................................... 35
3.6 Data Analysis Methods ................................................................................................ 36
3.7 Chapter Summary ........................................................................................................ 37
CHAPTER FOUR ............................................................................................................ 38
4.0 RESULTS AND FINDINGS ..................................................................................... 38
4.1 Introduction .................................................................................................................. 38
4.2 Background Information and Analysis ........................................................................ 38
4.3 Effect of Internal Influencers on Consumer Choice .................................................... 44
4.4 Effect of External Influencers on Consumer Choice ................................................... 47
4.5 Effect of Marketing Mix Factors on Consumer Choice............................................... 51
4.6 Chapter Summary ........................................................................................................ 56
CHAPTER FIVE ............................................................................................................. 57
5.0 DISCUSSION, CONCLUSIONS AND RECOMMENDATIONS ........................ 57
5.1 Introduction .................................................................................................................. 57
5.2 Summary ...................................................................................................................... 57
5.3 Discussions .................................................................................................................. 59
5.4 Conclusion ................................................................................................................... 69
5.5 Recommendations ........................................................................................................ 70
REFERENCES ................................................................................................................. 72
APPENDICES .................................................................................................................. 78
APPENDIX I: COVER LETTER ...................................................................................... 78
APPENDIX II: QUESTIONNAIRE .................................................................................. 79
x
LIST OF TABLES
Table 4.1: Brand Preference .............................................................................................. 43
Table 4.2: Rating of the Internal Influencers of Consumer Choice ................................... 45
Table 4.3: Correlation of the Internal Influencers of Consumer Choice ........................... 46
Table 4.4: Model Summary for Internal Influencers of Consumer Choice ....................... 46
Table 4.5: Regression Coefficients of the Internal Influencers of Consumer Choice ....... 47
Table 4.6: Rating of the External Influencers of Consumer Choice .................................. 49
Table 4.7: Correlation of the External Influencers of Consumer Choice .......................... 50
Table 4.8: Model Summary for External Influencers of Consumer Choice ...................... 50
Table 4.9: Regression Coefficients for External Influencers of Consumer Choice ........... 51
Table 4.10: Rating of the Marketing Mix Factors on Consumer Choice........................... 52
Table 4.11: Correlation of the Marketing Mix Factors on Consumer Choice ................... 53
Table 4.12: Model Summary for Marketing Mix Factors on Consumer Choice ............... 54
Table 4.13: Regression Coefficients for Marketing Mix Factors on Consumer Choice ... 54
Table 4.14: Correlations for Factors Influencing Consumer Choice ................................. 55
Table 4.15: Model Summary for Factors Influencing Consumer Choice .......................... 55
Table 4.16: Regression Coefficients for Factors Influencing Consumer Choice .............. 56

xi
LIST OF FIGURES
Figure 4.1: Gender ............................................................................................................. 38
Figure 4.2: Age .................................................................................................................. 39
Figure 4.3: Marital Status .................................................................................................. 40
Figure 4.4: Level of Education .......................................................................................... 40
Figure 4.5: Source of Income............................................................................................. 41
Figure 4.6: Basis of Income ............................................................................................... 41
Figure 4.7: Monthly Income .............................................................................................. 42
xii
LIST OF ACRONYMS
ATO: Alternative Trading Organization
CBD: Central Business District
CDs: Compact Discs
EABL: East African Breweries
HP: Hewlett-Packard Company
SRS: Simple Random Sampling
SWOT: Strength, Weakness, Opportunity and Threats Analysis
TV: Television
U.S: United States
LI: Least Important
I: Important
MI: Most Important
STD DEV: Standard Deviation
1
CHAPTER ONE
1.0 INTRODUCTION
1.1 Background of the Study
Kenya has a flourishing Beer industry producing high quality beer recognized
internationally. With the variety of product brands available in the market it’s necessary
to understand how marketing factors influences product and brand choice. According to
Kotler and Keller (2012), successful marketing requires that marketers gain a 360
understanding of their consumers while understanding their daily lives and the changes
that occur during their lifetime so that the right products are matched with the right
customers. In order to create this balance, it is prudent to ensure that any product fully
meets the needs and wants of the consumer group (Singh & Sarma, 2015).
LeMay (2017) establishes that a product is anything offered to the market to satisfy a
want or need. In planning its market offering, the marketer needs to address five product
levels each level adds more customer value, and the five constitute a customer-value
hierarchy. According to LeMay (2017), the concept of five-product level was coined by
Philip Kotler to explicitly state the different marketing strategies applicable in product
marketing. The fundamental level is the core benefit the service or benefit the customer is
really buying e.g. a housekeeper buys detergent to clean, the purchaser of a hair dryer is
buying to dry hair. Marketers must see themselves as benefit providers (Kotler & Keller,
2012).
At the second level, the marketer must turn the core benefit into a basic product. Thus a
hotel room includes a bed, bathroom, towels, desk, dresser, and closet. At the third level,
the marketer prepares an expected product, a set of attributes and conditions buyers
normally expect when they purchase this product. Hotel guests minimally expect a clean
bed, fresh towels, working lamps, and a relative degree of quiet. At the fourth level, the
marketer prepares an augmented product that exceeds customer expectations. In many
most cases brand positioning and competition take place at this level (Kotler & Keller,
2012).

2
At the fifth level stands the potential product, which encompasses all the possible
augmentations and transformations the product or offering might undergo in the future.
Here is where companies search for new ways to satisfy customers and distinguish their
offering (Kotler & Keller, 2012). Singh and Sarma (2015) further qualify the rationale of
product-customer satisfaction by justifying the importance of prioritizing products based
on both the revenue generated and the market demand affiliated to each product.
According to Jonathan (2008), product management and subsequent marketing
strategizing predicates substantially on the differentiation of products supported by Philip
Kotler’s five product level model. Notably, when differentiation arises, competition
increasingly occurs based on product augmentation which also leads the marketer to look
at the user’s total consumption system: the way the user performs the tasks of getting and
using products and related services. As postulated by Jonathan (2008), each augmentation
adds cost, however, augmented benefits soon become expected benefits and necessary
points-of parity in the category. If today’s hotel guests expect satellite television, high-
speed internet access, and a fully equipped fitness center, competitors must search for still
other features and benefits to differentiate themselves (Singh & Sarma, 2015).
According to Kotler, as some companies raise the price of their augmented product,
others offer a stripped-down version for less. Thus, alongside the growth of fine hotels
such as Kempinski and Raddison Blu, we see lower-cost hotels and motels emerge such
as Kenya Comfort Inn, catering to clients who want simply the basic product. Striving to
create an augmented product can be a key for success (Kotler & Keller, 2012).
Marketers must modify their price-setting logic when the product is part of a product mix.
In product mix pricing, the firm searches for a set of prices that maximizes profits on the
total mix. Pricing is difficult because the various products have demand and cost
interrelationships and are subject to different degrees of competition. We can distinguish
six situations calling for product mix. Product-line pricing is when companies develop
product lines rather than single products and introduce price steps.
3
A men’s clothing store might carry men’s suits at three price levels: $300, $600, and
$900, which customers associate with low-, average-, and high-quality. Singh and Sarma
(2015) theorize that in any normal structured market, the customer preference and
satisfaction reverted to a product depicts the measure of quality and brand potency. As
such, based on the theory of product differentiation, customer preference and product
performance, the seller’s task is to establish perceived quality differences that justify
price differences (Singh & Sarma, 2015).
Optional feature pricing is when companies offer optional products, features, and services
with their main product. A buyer of the 2010 Subaru Outback 2.5i can order four-way
power passenger seats, an All-Weather package, and a power moon roof as optional
features. Pricing options is a sticky problem, because companies must decide which to
include in the standard price and which to offer separately. Many restaurants price their
beverages high and their food low. The food revenue covers costs, and the beverages
especially liquor produce the profit. Captive product pricing is where some products
require the use of ancillary or captive products (Kotler & Keller, 2012).
Manufacturers of razors and cameras often price them low and set high markups on razor
blades and film. Safaricom may give a cellular phone free if the person commits to
buying their phone service. If the captive product is priced too high in the aftermarket,
however, counterfeiting and substitutions can erode sales. Consumers now can buy
cartridge refills for their printers from discount suppliers and save 20 percent to 30
percent off the manufacturer’s price. Product Bundling Pricing is where Sellers bundle
products and features. Pure bundling occurs when a firm offers its products only as a
bundle. A talent agency might insist that a “hot” actor can be signed to a film only if the
film company also accepts other talents the agency represented (directors, writers). This is
a form of tied-in sales (Singh & Sarma, 2015).
In mixed bundling, the seller offers goods both individually and in bundles, normally
charging less for the bundle than if the items were purchased separately. An auto
manufacturer might offer an option package at less than the cost of buying all the options
separately. A theater will price a season subscription lower than the cost of buying all the
4
performances separately. Customers may not have planned to buy all the components, so
savings on the price bundle must be enough to induce them to buy it.
Consumer behavior is the study of how individuals, groups, and organizations select, buy,
use, and dispose of goods, services, ideas, or experiences to satisfy their needs and
wants.2 Marketers must fully understand both the theory and reality of consumer
behavior profile of American consumers. A consumer’s buying behavior is influenced by
cultural, social, and personal factors. Of these, cultural factors exert the broadest and
deepest influence (Singh & Sarma, 2015).
According to Kotler (2012) Culture, subculture, and social class are particularly important
influences on consumer buying behavior. Culture is the fundamental determinant of a
person’s wants and behavior. Virtually all human societies exhibit social stratification,
most often in the form of social classes, relatively homogeneous and enduring divisions in
a society, hierarchically ordered and with members who share similar values, interests,
and behavior. One classic depiction of social classes in the United States defined seven
ascending levels: lower lowers, upper lowers, working-class, middle class, upper middles,
lower uppers, and upper uppers.
Social class members show distinct product and brand preferences in many areas,
including clothing, home furnishings, leisure activities, and automobiles. They also differ
in media preferences; upper-class consumers often prefer magazines and books, and
lower-class consumers often prefer television. Even within a category such as TV, upper-
class consumers may show greater preference for news and drama, whereas lower-class
consumers may lean toward reality shows and sports. There are also language differences
advertising copy and dialogue must ring true to the targeted social class (Kotler & Keller,
2012).
A person’s reference groups are all the groups that have a direct (face-to-face) or indirect
influence on their attitudes or behavior. Groups having a direct influence are called
membership groups. Some of these are primary groups with whom the person interacts
fairly continuously and informally, such as family, friends, neighbors, and coworkers.
People also belong to secondary groups, such as religious, professional, and trade-union
5
groups, which tend to be more formal and require less continuous interaction (Singh &
Sarma, 2015).
Where reference group influence is strong, marketers must determine how to reach and
influence the group’s opinion leaders. An opinion leader is the person who offers
informal advice or information about a specific product or product category, such as
which of several brands is best or how a particular product may be used. Opinion leaders
are often highly confident, socially active, and frequent users of the category. Marketers
try to reach them by identifying their demographic and psychographic characteristics,
identifying the media they read, and directing messages to them (LeMay, 2017: Singhand
Sarma, 2015).
Our taste in food, clothes, furniture, and recreation is often related to our age.
Consumption is also shaped by the family life cycle and the number, age, and gender of
people in the household at any point in time. In addition, psychological life-cycle stages
may matter. Adults experience certain “passages” or “transformations” as they go through
life. Their behavior as they go through these passages, such as becoming a parent, is not
necessarily fixed but changes with the times. Marketers should also consider critical life
events or transitions like marriage, childbirth, illness (Kotler & Keller, 2012).
Occupation also influences consumption patterns. Marketers try to identify the
occupational groups that have above-average interest in their products and services and
even tailor products for certain occupational groups: Computer software companies, for
example, design different products for brand managers, engineers, lawyers, and
physicians. As the recent recession clearly indicated, both product and brand choice are
greatly affected by economic circumstances spendable income (level, stability, and time
pattern), savings and assets (including the percentage that is liquid), debts, borrowing
power, and attitudes toward spending and saving. Luxury-goods makers such as Gucci,
Prada, and Burberry are vulnerable to an economic downturn (Singh & Sarma, 2015).
Each person has personality characteristics that influence his or her buying behavior. By
personality, we mean a set of distinguishing human psychological traits that lead to
relatively consistent and enduring responses to environmental stimuli (including buying
6
behavior). We often describe personality in terms of such traits as self-confidence,
dominance, autonomy, deference, sociability, defensiveness, and adaptability. Consumers
often choose and use brands with a brand personality consistent with their actual self-
concept (how we view ourselves) although the match may instead be based on the
consumer’s ideal self-concept (how we would like to view ourselves) or even on others’
self-concept how we think others see us (LeMay, 2017).
People from the same subculture, social class, and occupation may lead quite different
lifestyles. A lifestyle is a person’s pattern of living in the world as expressed in activities,
interests, and opinions. It portrays the “whole person” interacting with his or her
environment. Marketers search for relationships between their products and lifestyle
groups. A computer manufacturer might find that most computer buyers are achievement-
oriented and then aim the brand more clearly at the achiever lifestyle (LeMay, 2017:
Singhand & Sarma, 2015).
1.2 Statement of the Problem
Beer companies play a significant role in the country’s economic growth by generating
revenue to the government through taxes, creating employment to the locals in the
product manufacturing, packaging and distribution to the retail outlets. The number of
beer companies has significantly increased in Kenya to over nine major alcoholic
beverages companies to date.
The effect of this has been a reduction in market share, declining profitability and stiff
competition. As a result companies have been forced to craft strategies in order to sustain
or grow their market share, expand to new territories or markets, acquire new
technologies, develop brand or line extensions, reduce costs and risks (Oliver, 1995).
Alcoholic beverage companies in Kenya need to adopt distribution strategies that ensure
they reach their markets efficiently (Mwangulu, 2014).
This study was necessary to address the product management gap associated with
customer satisfaction that currently exists. Studies are required to help companies
understand in depth customer behavior and their influencers. These include consumer
ever changing lifestyles, demographics changes in the population over the years, product
7
lifecycles and the changing trends. Given the company strategies need to change every so
often due to micro and macro environments. This study intended to address the
opportunities, weaknesses and threats of EABL beer products.
According to the latest EABL SWOT Analysis report, the company faces weak customer
service challenges which in turn affect EABL’s reputation and brand the long term effects
of this affect the overall bottom line of the company. EABL also lacks a proper price
scaling method meaning the company cost per unit of output is very high. A solution is
required to increase volumes, while maintaining high quality (The Monitor, 2011).
EABL also suffers from a weak cost structure which therefore means the company costs
are high in comparison to their competitors, also as threat of intense competition can
lower EABL’s profit because competitors can entice consumers with superior products.
EABL suffers the threat of consumers changing tastes and hence the company depends on
understanding their customer’s wants and needs (Waweru & Mwendwa, 2012).
The opportunities that EABL look to explore are the potential acquisitions and synergies
it can make in the market, to expand its market share and also to introduce new products
since these are determined by consumer trends, which this study unveils. This study also
served to add on to the body of knowledge since the last study that was done on EABL in
Kenya was done in 2014 e.g. a study was done by Mwangulu (2014) which focused on
factors influencing marketing of alcoholic beverages in Kenya.
There has not been significant in depth study to understand consumer choice when it
comes to specifically EABL beers in Kenya, this study provided an updated report on the
current trends and preferences in beers.
1.3 Purpose of the Study
The purpose of this study was to determine the factors influencing consumer choice of
beer brand in Kenya with a special focus on East Africa Breweries Beer Brands Selection.
8
1.4 Research Questions
1.4.1 How does the external influencers affect consumer choice of beer brands?
1.4.2 How does the internal influencers affect the consumer choice of beer brands?
1.4.3 How does the marketing factors influence consumer choice of beer brand?
1.5 Significance of the Study
1.5.1 Benefits EABL
The research findings are of benefit to EABL, its managers may be able to articulate
informed marketing strategies aimed at winning and retaining their customers. The study
provides an in depth understanding of their consumer choices in beers this may help them
in identifying new market opportunities, improve on product offerings. EABL would
benefit from the findings of the study especially when benchmarking. This research is
important as it reveals the significance of including consumer-purchasing behavior when
designing effective and functional marketing strategies focused on mass and niche
markets. Marketing managers need the knowledge of consumer behavior in order to
develop, evaluate, and implement effective marketing strategies.
1.5.2 Research and Academics
The study added value to the existing body of knowledge in the area of marketing,
strategic responses companies should adopt in order to gain a competitive advantage. It
also set foundation for scholars and researchers who wish to further understand the
strategies that have been adopted by the different companies in Kenya or to improve on
the knowledge of this study.
1.5.3 Benefit EABL Distributors
This study helps the beer distributors to understand their markets better to know the
popular products e.g. which beers to sell to bars, wines and spirits shops and which
geographical locations to approach for which beers for effecting distribution for
maximum results.
9
1.5.4 Benefit Hotels and Restaurants
This study enables the hospitality industry to understand what to stock for their target
markets, it also helps them in pricing and forecasting for food and beverages. It also aids
in promotion of the beer brand at their properties.
1.5.5 Benefit other Marketing Organizations
This study enables marketing agencies/companies to gain insights about buyer behavior
and consumer choice when it comes to beers and may be better equipped to advise their
clients both existing and the prospecting companies that would like to set up a similar
business in Kenya.
1.6 Scope of the Study
This research was confined within Nairobi City with a population of 3.3 million
inhabitants and will limit the beer selection to EABL beers. The study sampled 5 major
locations in Nairobi namely Eastlands, Westlands, Southlands, CBD, Thika Road,
Nairobi West, Karen-Kilimani area. The respondents were people from varied ages
between 18-70 years of age and varied social class levels for gender both male and female
respondents were sampled. The data collection took approximately 2 months Feb 2018 to
April 2018 and another 2 months May 2018 to July 2018 for analysis and reporting. The
research was scheduled to take 5 months to complete. The respondents were at times not
motivated to fill in a hard copy questionnaire to the end, the solution to this lied in
developing an online interactive questionnaire also conducting interviews and filling in
the forms for the respondents.
1.7 Definition of Terms
1.7.1 Consumer Behavior
The study of how individuals, groups, and organizations select, buy, use and dispose of
goods, ideas or experiences to satisfy their needs and wants (Kotler, 2012).
1.7.2 Beer
An alcoholic drink made from yeast-fermented malt flavored with hops according to the
brewers Association 1992.
10
1.7.3 Marketing Mix
As set of marketing tools that the firm uses to pursue its marketing objectives, they are
classified into four groups product, price, place, promotion (McCarthy, 1999).
1.7.4 Socio-Economic Factors
These are lifestyles and values that characterize an individual social class and financial
status and their perception by the society (Gale, 2006).
1.7.5 Brand
This is a name, term, sign, symbol or design intended to identify the goods or services of
a company. A brand is a sellers promise to deliver to a specific set of features, benefits
and service consistently to the buyer (Kotler, 2001).
1.8 Chapter Summary
This chapter presents the background on the importance of studying consumer purchasing
behavior as an important factor to consider when designing marketing strategy for EABL
beers. It outlines the problem statement, objectives for this study, conceptual framework
and scope of the study.
Chapter two presents the literature review and provides insights into what other
researchers have done in the field of buyer behavior and consumer choice and influence
towards brand preference. Chapter three addresses the methodology used in conducting
the study and the established protocols adopted for this study. Chapter four discusses in
details the results and findings and the final chapter five concludes the study by providing
the study’s discussions, conclusions and recommendations.
11
CHAPTER TWO
2.0 LITERATURE REVIEW
2.1 Introduction
This chapter comprise of related literature on the study subject as per the specific
objectives. The specific objectives of this study are to determine the effect of external
influencers on consumer choice of beer brands, to examine the effect of internal
influencers on consumer choice of beer brands and to establish the effects of marketing
factors on consumer choice of beer brand.
2.2 Effect of Internal Influencers on Consumer Choice
The internal influences include both personal and psychological factors. The personal
factors include age, income, lifestyle and personality while the psychological factors
include motivation, perception, learning, beliefs and attitudes (Kotler & Keller, 2012).
2.2.1 Personal Factors (Age)
It is well established that the types of goods and services sought by individuals change as
they age and pass through the various lifecycle stages. Compared to their older
counterparts, younger individuals are less committed to definite patterns and are more
open to new perspectives and products (De Mooij, 2004). For example, younger people
pay more attention to expressive product aspects than older people (Henry, 2002).
Advancing age brings about changes in consumers’ needs and abilities, some of which are
beyond the control of the individual yet will impact on consumers’ food-related behavior
in terms of purchase, preparation and consumption. The elderly have been identified as
having marketplace needs which are different from other segments(Hillery et al., 1997)
and the ageing process is recognized to alter an individual’s approach to food (Saba et al.,
2008).
As a consumer becomes older their retail buying behavior changes, as does their food-
related behavior. Increasing age is associated with changes in lifestyle, purchasing
behavior and consumer perceptions. Retailers need to be aware of the way in which their
customers behave and by being able to better differentiate between age segments, they
12
can then appropriately tailor their products and services to meet specific needs and
demands. It is fair to say the physical consequences of ageing may not account
exclusively for the changes demonstrated in behavior (Menely et al., 2009).
However, lifestyle changes which result from the ageing process may also impact upon
how one behaves. These lifestyle changes are, however, age related and therefore the
combination of both causes alterations in consumers’ actions. For too long, older
consumers have been treated as one homogeneous group when in fact these findings show
that significant differences are apparent within the age segments of the older population
and they should be treated as a heterogeneous consumer group. Hence, age may be used
as a variable to segment consumer behavior although caution must be observed in relying
on it exclusively (Menely et al., 2009).
Older age consumers (more than 55 years) tend to make decisions that can be described
as preventative. The behavior of older age participants could be influenced by their
perceived vulnerability than their younger counter parts (Hardley, 2002). There is a
negative, but significant (0.05) relationship between the age of the respondents and
relative importance of the quality of beer that they usually drink. This is interesting, as the
research has already shown that consumers claim the quality of the beer to be a key
consideration, yet based on the above, it would appear that it is the younger consumers
who are generally more concerned about the quality of the beer they drink (Swift, 2010).
This may be because the older the consumer, the more likely they are to have started
drinking beer during the communist era, when they had little or no choice as to what they
bought. Respondents aged 18 or over in 1990, would today be in their late-30 s and
above, and as previously indicated, the group aged 41 and over, represents 34.2 per cent
of respondents – approximately one-third (Swift, 2010).
2.2.2 Personal Factor (Income)
According to Ates and Ceylan (2010) findings of their research on income and milk
consumption, the income level is an important factor influencing the form in which the
milk is consumed. As the income increases, the amount of pasteurized and long-shelf-life
milk increases. As the level of consumer education increases, so does the amount of
13
pasteurized milk consumption. This means that, in the rural areas, as the income and
education level decreases, the milk is consumed in its raw form. On the other hand, in the
urban areas, as the income and education levels increase milk is increasingly consumed in
pasteurized form.
According to Singh and Sarma (2015), Occupation also influences consumption patterns.
Marketers try to identify the occupational groups that have above-average interest in their
products and services and even tailor products for certain occupational groups: Computer
software companies, for example, design different products for brand managers,
engineers, lawyers, and physicians. As the recent recession clearly indicated, both product
and brand choice are greatly affected by economic circumstances: spendable income
level, stability, and time pattern, savings and assets including the percentage that is liquid,
debts, borrowing power, and attitudes toward spending and saving. Ideally, all these
factors define the dynamics of business, management and product-customer relationship
(Singh & Sarma, 2015).
Luxury-goods makers such as Gucci, Prada, and Burberry are vulnerable to an economic
downturn. If economic indicators point to a recession, marketers can take steps to
redesign, reposition, and reprice their products or introduce or increase the emphasis on
discount brands so they can continue to offer value to target customers. Some firms such
as Snap Fitness in the U.S are well-positioned to take advantage of good and bad
economic times to begin with (Kotler et al., 2012).
The economic situation of any country also strongly influences the buying behavior of
consumer. Mean the consumer choice strongly affect by economic circumstances. If the
living standard of the people is high then they also purchase good food, clothes and other
things. It also influence by the income level, political satiability, import and export and
currency value. Income also strongly affects product choice, as higher-income consumers
are better able to purchase expensive, status-enhancing items e.g. household appliances,
consumer electronics, and luxury products (De Mooij, 2004).
14
2.2.3 Personal Factor (Lifestyle and Personality)
The consumer behavior literature states that lifestyle, including attitude, behavior and
psychological profile, is an important influence on consumer consumption patterns, and
can indicate attitudinal differences between segments. Lifestyle is thus deemed the main
basis of segmentation. “Lifestyle segmentation” has been a useful tool for marketing
management decision making. In marketing, “lifestyle segmentation” describes the life-
like portrait of the consumer and classified potential consumers into segments with
specific and identifiable lifestyle patterns. The life-style is closely associated with the
economic level at which people live and how they spend their money. This study applies
the life-style segmentation approach to identify the characteristics of consumer groups
that typically favor high end beer brands and the middle level to lower end Brands.
People from the same subculture, social class, and occupation may lead quite different
lifestyles. A lifestyle is a person’s pattern of living in the world as expressed in activities,
interests, and opinions. It portrays the “whole person” interacting with his or her
environment. Marketers search for relationships between their products and lifestyle
groups. A computer manufacturer might find that most computer buyers are achievement-
oriented and then aim the brand more clearly at the achiever lifestyle. The influences of
brands on a demography or population depend on personal factors such as lifestyle,
consumer preferences and other demographic oriented factors (LeMay, 2017).
Lifestyles are shaped partly by whether consumers are money constrained or time
constrained. Companies aiming to serve money-constrained consumers will create lower-
cost products and services. By appealing to thrifty consumers, Walmart has become the
largest company in the world. Its “everyday low prices” have wrung tens of billions of
dollars out of the retail supply chain, passing the larger part of savings along to shoppers
in the form of rock-bottom bargain prices. Consumers who experience time famine are
prone to multi-tasking, doing two or more things sat the same time. They will also pay
others to perform tasks because time is more important to them than money. Companies
aiming to serve them will create convenient products and service for this group (Kotler &
Keller, 2012).

15
Each person has personality characteristics that influence his or her buying behavior. By
personality, we mean a set of distinguishing human psychological traits that lead to
relatively consistent and enduring responses to environmental stimuli (including buying
behavior). We often describe personality in terms of such traits as self-confidence,
dominance, autonomy deference, sociability, defensiveness, and adaptability (LeMay,
2017).
Personality can be a useful variable in analyzing consumer brand choices. Brands also
have personalities, and consumers are likely to choose brands whose personalities match
their own. We define brand personality as the specific mix of human traits that we can
attribute to a particular brand. Stanford’s Jennifer Aaker researched brand personalities
and identified the following traits Sincerity down-to-earth, honest, wholesome, and
cheerful, Excitement daring, spirited, imaginative, and up-to-date, Competence (reliable,
intelligent, and successful), Sophistication upper-class and charming, Ruggedness
outdoorsy and tough.
Consumers often choose and use brands with a brand personality consistent with their
actual self-concept (how we view ourselves), although the match may instead be based on
the consumer’s ideal self-concept (how we would like to view ourselves) or even on
others’ self-concept (how we think others see us). These effects may also be more
pronounced for publicly consume products than for privately consumed goods. On the
other hand, consumers who are high self-monitors that is, sensitive to how others see
them are more likely to choose brands whose personalities fit the consumption situation.
Finally, often consumers have multiple aspects of self (serious professional, caring family
member, active fun-lover) that may be evoked differently in different situations or around
different types of people. Some marketers carefully orchestrate brand experiences to
express brand personalities (Mariëlle, 2010).
2.2.4 Psychological Factors
Marketing and environmental stimuli enter the consumer’s consciousness, and a set of
psychological processes combine with certain consumer characteristics to result in
decision processes and purchase decisions. The marketer’s task is to understand what
happens in the Consumer’s consciousness between the arrival of the outside marketing
16
stimuli and the ultimate Purchase decisions. Four key psychological processes -
motivation, perception, learning, and memory fundamentally influence consumer
responses (Kotler & Keller, 2012).
2.2.5 Psychological Factor (Motivation)
Sigmund Freud assumed the psychological forces shaping people’s behavior are largely
unconscious, and that a person cannot fully understand his or her own motivations.
Someone who examines specific brands will react not only to their stated capabilities, but
also to other, less conscious cues such as shape, size, weight, material, color, and brand
name. A technique called laddering lets us trace a person’s motivations from the stated
instrumental ones to the more terminal ones. Then the marketer can decide at what level
to develop the message and appeal (LeMay, 2017).
Today, motivational researchers continue the tradition of Freudian interpretation. Jan
Callebaut Identifies different motives a product can satisfy. For example, whiskey can
meet the need for social relaxation, status, or fun. Different whiskey brands need to be
motivationally positioned in one of these three appeals. Another motivation researcher,
Clotaire Rapaille, works on breaking the “code” behind product behavior. Abraham
Maslow sought to explain why people are driven by particular needs at particular times.
His answer is that human needs are arranged in a hierarchy from most to least pressing
physiological needs, safety needs, social needs, esteem needs, and self-actualization
(LeMay, 2017).
People will try to satisfy their most important need first and then try to satisfy the next
most important. For example, a starving man will not take an interest in the latest
happenings in the art world , nor in how he is viewed by others, nor evening whether he is
breathing clean air but when he has enough food and water, the next most important need
will become salient (Kotler & Keller 2012).
The absence of dissatisfies is not enough to motivate a purchase; satisfiers must be
present. For example, a computer that does not come with a warranty would be a
dissatisfied. Yet the presence of product warranty would not act as a satisfier or motivator
of a purchase, because it is not a source of intrinsic satisfaction. Ease of use would be a
17
satisfier. Herzberg’s theory has two implications. First, sellers should do their best to
avoid dissatisfiers (for example, a poor training manual or a poor service policy).
Although these things will not sell a product, they might easily unsell it. Second, the
seller should identify the major satisfiers or motivators of purchase in the market and then
supply them (Mariëlle, 2010). Motivation is rarely homogenous (Lindenberg & Steg,
2007), and consumers frequently strive to maximize goal fulfillment, and resolve goal
conflict, by choosing means which satisfy multiple goals simultaneously (Kopetz, 2007)
(Barbopolous & Johannson 2016).
The gain goal entails a heightened sensitivity to changes impersonal resources
(Lindenberg & Steg, 2007). When the gain goal is active, consumers may be more
sensitive to variations in cost and perceived value, while concerns about emotional, social
or ethical consequences are of lesser importance. Indeed, strong economic motivations
have been shown to displace or weaken other motivations, such as personal responsibility
and moral obligations, a phenomenon referred to as “motivation crowding out” (Frey &
Jegen, 2001). According to Lindenberg and Steg (2007), the gain goal may be related to
sub-goals dealing with saving money, increasing one’s income and dealing with threats to
one’s financial security (Barbopolous & Johannson 2016).
The hedonic goal makes consumers more sensitive to changes in pleasure, mood and
energy levels, while economic utility and norms play a lesser role (Lindenberg & Steg,
2007). Consumers have, for example, been shown to be less price sensitive for hedonic
goods compared to utilitarian goods (Wakefield & Inman 2003). Emotions and affect
have been shown to be an important aspect of consumption in a wide variety of situations
(Babin et al., 1994; Childers et al., 2001;Pohjanheimo et al., 2010), including in highly
functional consumer decision contexts, such as the choice between public transport and
the car (Steg, 2005). The hedonic goal is assumed to be related to sub-goals dealing with
pleasure and excitement, as well as avoidance of effort and negative feelings (Lindenberg
& Steg, 2007) (Barbopolous & Johannson 2016).
The normative goal is associated with a heightened sensitivity how one “ought” to act,
according to personal norms, the opinions of others and the society as a whole
(Lindenberg & Steg, 2007). As such, this goal is closely related to pro-social and pro-
18
environmental consumption. Although norms are highly influential, they can be displaced
by other goals. Research has, for example, shown that, as costs of either resources or
effort increase, normative concerns become less influential, a phenomenon referred to as
the “low-cost hypothesis” (Diekmann & Preisendörfer, 2003). The normative goal is
thought to be linked to sub-goals dealing with appropriateness, moral obligations and
social norms (Dawes & Messick, 2000; Lindenberg & Steg, 2007; Barbopolous &
Johannson, 2016).
2.2.6 Psychological Factor (Perception)
A motivated person is ready to act, how is influenced by his or her perception of the
situation. In marketing, perceptions are more important than reality, because perceptions
affect consumers’ actual behavior. Perception is the process by which we select, organize,
and interpret information inputs to create a meaningful picture of the world. It depends
not only on physical stimuli, but also on the stimuli’s relationship to the surrounding
environment and on conditions within each of us. One person might perceive a fast-
talking salesperson as aggressive and insincere; another, as intelligent and helpful. Each
will respond to the salesperson differently. People emerge with different perceptions of
the same object because of three perceptual processes: selective attention, selective
distortion, and selective retention (Kotler & Keller 2012).
Attention is the allocation of processing capacity to some stimulus. Voluntary attention is
something purposeful; involuntary attention is grabbed by someone or something. It’s
estimated that the average person may be exposed to over 1,500 ads or brand
communications a day. Because we cannot possibly attend to all these, we screen most
stimuli out a process called selective attention. Selective attention means that marketers
must work hard to attract consumers’ notice. The real challenge is to explain which
stimuli people will notice. People are more likely to notice stimuli that relate to a current
need (Waweru & Mwendwa, 2012).
Even noticed stimuli don’t always come across in the way the senders intended. Selective
distortion is the tendency to interpret information in a way that fits our preconceptions.
Consumers will often distort information to be consistent with prior brand and product
beliefs and expectations. For a stark demonstration of the power of consumer brand

19
beliefs, consider that in “blind “taste tests, one group of consumers samples a product
without knowing which brand it is, while another group knows. Invariably, the groups
have different opinions, despite consuming exactly the same product (Singh & Sarma,
2015).
Most of us do not remember much of the information to which we’re exposed, but we do
retain information that supports our attitudes and beliefs. Because of selective retention,
we’re likely to remember good points about a product we like and forget good points
about competing products. Selective retention again works to the advantage of strong
brands.
It also explains why marketers need to use repetition - to make sure their message is not
overlooked. The selective perception mechanisms require consumers’ active engagement
and thought. A topic that has fascinated armchair marketers for ages is subliminal
perception. They argue that marketers embed covert, subliminal messages in ads or
packaging. Consumers are not consciously aware of them, yet they affect behavior.
Although it’s clear that mental processes include many subtle subconscious effects, no
evidence supports the notion that marketers can systematically control consumers at that
level, especially enough to change moderately important or strongly held beliefs (Kotler
& Keller, 2012).
2.2.7 Psychological Factor (Learning)
When we act, we learn. Learning induces changes in our behavior arising from
experience. Most human behavior is learned, although much learning is incidental.
Learning theorists believe learning is produced through the interplay of drives, stimuli,
cues, responses, and reinforcement. Two popular approaches to learning are classical
conditioning and operant (instrumental) conditioning (LeMay, 2017).
A drive is a strong internal stimulus impelling action. Cues are minor stimuli that
determine when, where, and how a person responds. Suppose you buy an HP computer. If
your experience is rewarding, your response to computers and HP will be positively
reinforced. Later, when you want to buy a printer, you may assume that because it makes
20
good computers, HP also makes good printers. In other words, you generalize your
response to similar stimuli (Kotler & Keller 2012).
A countertendency to generalization is discrimination. Discrimination means we have
learned to recognize differences insets of similar stimuli and can adjust our responses
accordingly. Learning theory teaches marketers that they can build demand for a product
by associating it with strong drives, using motivating cues, and providing positive
reinforcement. A new company can enter the market by appealing to the same drives
competitors use and by providing similar cues, because buyers are more likely to transfer
loyalty to similar brands (generalization); or the company might design its brand to
appeal to a different set of drives and offer strong cue inducements to switch
discrimination (Mariëlle, 2010).
Some researchers prefer more active, cognitive approaches when learning depends on the
inferences or interpretations consumers make about outcomes (was an unfavorable
consumer experience due to a bad product, or did the consumer fail to follow instructions
properly). The hedonic bias occurs when people have a general tendency to attribute
success to themselves and failure to external causes. Consumers are thus more likely to
blame a product than themselves, putting pressure on marketers to carefully explicate
product functions in well-designed packaging and labels, instructive ads and Web sites,
and so on (Kotler & Keller 2012) .
2.2.8 Psychological Factor (Beliefs and Attitude)
Through experience and learning, people acquire beliefs and attitudes. These in turn
influence buying behavior. A belief is a descriptive thought that a person holds about
something. Just as important are attitudes, a person’s enduring favorable or unfavorable
evaluations, emotional feelings, and action tendencies toward some object or idea. People
have attitudes toward almost everything: religion, politics, clothes, music, and food.
Attitudes put us into a frame of mind: liking or disliking an object, moving toward or
away from it (LeMay, 2017; Mariëlle, 2010).
21
They lead us to behave in a fairly consistent way toward similar objects. Because
attitudes economize on energy and thought, they can be very difficult to change. As a
general rule, a company is well advised to fit its product into existing attitudes rather than
try to change attitudes. If beliefs and attitudes become too negative, however, more
serious steps may be necessary. With a controversial ad campaign for its pizza, Domino’s
took drastic measures to try to change consumer attitudes (Kotler & Keller 2012).
2.3 Effect of External Influencers on Consumer Choice
The External influences include both Cultural and Social Factors. The Cultural factors
include culture, sub culture and Social Class while the Social factors include family
reference group, Role and Status (Mariëlle, 2010; LeMay, 2017).
2.3.1 Cultural Factors
Culture, subculture, and social class are particularly important influences on consumer
buying behavior. Culture is the fundamental determinant of a person’s wants and
behavior. Through family and other key institutions, a child growing up in the United
States is exposed to values such as achievement and success, activity, efficiency and
practicality, progress, material comfort, individualism, freedom, external comfort,
humanitarianism, and youthfulness(Kotler & Keller 2012).
Each culture consists of smaller subcultures that provide more specific identification and
socialization for their members. Subcultures include nationalities, religions, racial groups,
and geographic regions. When subcultures grow large and affluent enough, companies
often design. Specialized marketing programs to serve them. Virtually all human societies
exhibit social stratification, most often in the form of social classes, relatively
homogeneous and enduring divisions in a society, hierarchically ordered and with
members who share similar values, interests, and behavior (LeMay, 2017; Mariëlle, 2010)
One classic depiction of social classes in the United States defined seven ascending
levels: lower lowers, upper lowers, working class, middle class, upper middles, lower
uppers, and upper uppers. Social class members show distinct product and brand
preferences in many areas, including clothing, home furnishings, leisure activities, and
automobiles. They also differ in media preferences; upper-class consumers often prefer
22
magazines and books, and lower-class consumers often prefer television. Even within a
category such as TV, upper-class consumers may show greater preference for news and
drama, whereas lower-class consumers may lean toward reality shows and sports. There
are also language differences - advertising copy and dialogue must ring true to the
targeted social class (Kotler & Keller, 2012).
It is valid to appreciate that any target market is basically predicated upon a cultural
background. According to LeMay (2017), product advancement and reception in a
population is significantly affected and determined by the culture of a target population.
The stratification of a target population along cultural lines. Notably, the relevance of
cultural factors are pivotal considerations that need to be taken to account when dealing
with any marketing or business proposition. LeMay (2017) explicitly postulates that
having a cultural understanding of a target population supplies business management with
the relevant information that can be used to make viable business plans.
Past demographic studies that base on retrospective and prospective confirm the
importance and relevance of cultural consideration when advancing product marketing
prospects. It is prudent to affirm that cultural factors are part of the building blocks of any
demography. Notably, a culturally diverse population gives grounds for deviancy in
consumer preferences, product and brand acceptance and marketing strategies. According
to Kotler and Keller (2013), consumer habits and trends show close synergy and basis to
cultural factors. For instance, a consumer might prefer a certain product or disapprove it
purely based on his/her cultural affiliation and background.
2.3.2 Social Factors (Reference Groups)
A person’s reference groups are all the groups that have a direct (face to face) or indirect
influence on their attitudes or behavior. Groups having a direct influence are called
membership groups. Some of these are primary groups with whom the person interacts
fairly continuously and informally, such as family, friends, neighbors, and coworkers.
People also belong to secondary groups, such as religious, professional, and trade-union
groups, which tend to be more formal and require less continuous interaction (Singh &
Sarma, 2015).
23
Reference groups influence members in at least three ways. They expose an individual to
new behaviors and lifestyles, they influence attitudes and self-concept, and they create
pressures for conformity that may affect product and brand choices. People are also
influenced by groups to which they do not belong. Aspirational groups are those a person
hopes to join; dissociative groups are those whose values or behavior an individual
rejects. Where reference group influence is strong, marketers must determine how to
reach and influence the group’s opinion leaders. An opinion leader is the person who
offers informal advice or information about a specific product or product category, such
as which of several brands is best or how a particular product may be used. Opinion
leaders are often highly confident, socially active, and frequent users of the category.
Marketers try to reach them by identifying their demographic and psychographic
characteristics, identifying the media they read, and directing messages to them (Kotler &
Keller, 2012).
2.3.3 Social Factor (Family)
The family is the most important consumer buying organization in society, and family
members constitute the most influential primary reference group. There are two families
in the buyer’s life. The family of orientation consists of parents and siblings. From
parents a person acquires an orientation toward religion, politics, and economics and a
sense of personal ambition, self-worth, and love. Even if the buyer no longer interacts
very much with his or her parents, parental influence on behavior can be significant.
Almost 40 percent of families have auto insurance with the same company as the
husband’s parents (Singh & Sarma, 2015).
A more direct influence on everyday buying behavior is the family of procreation namely,
the person’s spouse and children. In the United States, husband–wife engagement in
purchases has traditionally varied widely by product category. The wife has usually acted
as the family’s main purchasing agent, especially for food, sundries, and staple clothing
items. Now traditional purchasing roles are changing, and marketers would be wise to see
both men and women as possible targets. For expensive products and services such as
cars, vacations, or housing, the vast majority of husbands and wives engage in joint
decision making (Howland, 2016).
24
Men and women may respond differently to marketing messages, however. Research has
shown that women value connections and relationships with family and friends and place
a higher priority on people than on companies. Men, on the other hand, relate more to
competition and place a high priority on action. Marketers are taking more direct aim at
women with new Another shift in buying patterns is an increase in the amount of dollars
spent and the direct and indirect influence wielded by children and teens. Direct influence
describes children’s hints, requests, and demands. Indirect influence means that parents
know the brands, product choices, and preferences of their children without hints or
outright requests (Kotler & Keller, 2012).
Research has shown that more than two-thirds of 13- to 21-year-olds make or influence
family. Right products, they watch what their friends say and do as much as what they see
or hear in an adore are told by a salesperson in a store. Television can be especially
powerful in reaching children, and marketers are using it to target them at younger ages
than ever before with product tie-ins for just about everything Disney character pajamas,
retro G.I. Joe toys and action figures, Harry Potter backpacks, and High School. By the
time children are around 2 years old, they can often recognize characters, logos, and
specific brands. They can distinguish between advertising and programming by about
ages six or seven. A year or so later, they can understand the concept of persuasive intent
on the part of advertisers. By nine or ten, they can perceive the discrepancies between
message and product (Howland, 2016).
Howland (2016) justifies the logic that within any target population, the basic social unit
of family affects market and product dynamisms. Ideally, the basic unit of a society is the
family. Marketing prospects and interventions need to influence the lowest social unit
(family) to ensure successful consumer influence and impact. The correlation between
marketing approaches, product-brand creation and business success is justified by the
affiliation to social factors.
2.3.4 Social Factors (Roles and Status)
We each participate in many groups’ family, clubs, and organizations. Groups often are
an important source of information and help to define norms for behavior. We can define
a person’s position in each group in terms of role and status. A role consists of the
25
activities a person is expected to perform. Each role in turn connotes a status. A senior
vice president of marketing may be seen as having more status than a sales manager, and
a sales manager may be seen as having more status than an office clerk. People choose
products that reflect and communicate their role and their actual or desired status in
society. Marketers must be aware of the status-symbol potential of products and brands
(Kotler & Keller 2012).
2.4 Effect of Marketing Mix Factors on Consumer Choice
The marketing mix is a set of controllable marketing tools that an institution uses to
produce the response it wants from its various target markets. It consists of everything
that the university can do to influence the demand for the services that it offers. Tangible
products have traditionally used a 4Ps model, the services sector on the other hand uses a
7P approach in order to satisfy the needs of the service provider’s customers: product,
price, place, promotion, people, physical facilities and processes (Ivy, 2008).
People reflect, in part, internal marketing and the fact that employees are critical to
marketing success. Marketing will only be as good as the people inside the organization.
It also reflects the fact that marketers must view consumers as people to understand their
lives more broadly and not just as they shop for and consumer products and services
(Kotler & Keller 2012).
Processes reflects all the creativity, discipline, and structure brought to marketing
management. Marketers must avoid ad hoc planning and decision making and ensure that
state-of-the-art marketing ideas and concepts play an appropriate role in all they do. Only
by instituting the right set of processes to guide activities and programs can a firm engage
in mutually beneficial long-term relationships. Another important set of processes guides
the firm in imaginatively generating insights and breakthrough products, services, and
marketing activities (Kotler & Keller 2012).
Programs reflects all the firm’s consumer-directed activities. It encompasses the old four
Ps as well as a range of other marketing activities that might not fit as neatly into the old
view of marketing. Regardless of whether they are online or offline, traditional or
nontraditional, these activities must be integrated such that their whole is greater than the
26
sum of their parts and they accomplish multiple objectives for the firm (Singh & Sarma,
2015).
2.4.1 Product
Numerous studies confer that quality is markedly associated with customer purchase
intentions. Earlier, Shawyer et al. (2002) concluded that the likelihood of a consumer
making a purchase decision increases with consumer perception of product quality.
Furthermore, perceived product quality affects consumer attitudes, faithfulness and repeat
purchase behavior. Studies have also shown that consumer perceptions of a product or
service as being of high quality directly or indirectly increase consumer purchase
intentions (Creusen, 2010).
The importance of certain product aspects in buying products differs with demographic
characteristics, such as gender, age, and social class (Henry, 2002; Holt, 1998; Williams,
2002). For example, younger people pay more attention to expressive product aspects
than older people (Henry, 2002). Insight into differences in product aspect importance
with demographic characteristics such as age, gender, education and income, will be of
practical utility to product managers. In addition, this knowledge is useful for attuning
marketing communication to specific target audiences (Creusen, 2010).
Concerning the influence of gender on the importance of certain product aspects, the
following findings are found in the literature. (Henry, 2002) found that males use more
functional purchase criteria than females. (Williams, 2002), who had respondents indicate
the importance of several evaluative criteria for nine types of products, found that
performance, durability and reliability (i.e. quality), and style/appearance were more
important to females. Research into object attachment shows that males more often
indicate functional items that are valued for their instrumental value as their favorite
possessions (Creusen, 2010).
Henry (2002) found that younger people use more expressive purchase criteria. In
addition, in research into object attachment, Wallendorf and Arnould (1988) found
younger people to focus more on hedonic pleasures in choosing their favorite objects.
Hsieh et al. (2004) found that older people are more sensitive to utilitarian brand image

27
aspects. However, Wallendorf and Arnould (1988) found older people less likely to
choose functional as opposed to display items as favorite possessions. This seems to
indicate an importance of symbolic value in buying products (Creusen, 2010).
However, these possessions have symbolic value for older people as they represent
something from their history (Csikszentmihalyi & Rochberg-Halton, 1981; Wallendorf &
Arnould, 1988), which is something different than buying a product because it portrays a
certain image to others.
One could expect older people to pay more attention to ease of use, as they may have
more problems dealing with complex operation. For in getting older, cognitive abilities
such as working memory capacity, symbol and language comprehension diminish
(Rousseau et al., 1998).Based on these findings we expect that younger people pay more
attention to aesthetic and symbolic product aspects than older people. We expect older
people to pay more attention to utilitarian aspects in buying durable products, and will
assess whether this applies to functionalities as well as quality and ease of use (Creusen,
2010).
Although somewhat surprising, studies suggest that income level does not correlate
highly with social class (Williams, 2002; Coleman, 1983). Therefore we look at income
level separately. There is little research about the relation of income to the importance of
various evaluative criteria (Williams, 2002). Williams found a negative correlation
between income and the importance of utilitarian purchase criteria, especially for less
socially relevant products. We therefore expect that higher income leads to less
importance of functional aspects and will assess whether this goes for functionalities as
well as quality and ease of use. (Williams, 2002) did not find a relation between income
and importance of expressive aspects (Creusen, 2010).
According to Creusen (2010) article, the package’s overall features can underline the
uniqueness and originality of the product. Quality judgments are largely influenced by
product characteristics reflected by packaging, and these play a role in the formation of
brand preferences. If the package communicates high quality, consumers frequently
assume that the product is of high quality. If the package symbolizes low quality,
28
consumers transfer this “low quality” perception to the product itself (Underwood et al.,
2001; Silayoi & Speece, 2004).
Ali, (2014) says consumers also learn color associations, which leads them to prefer
certain colors for certain product categories (Grossman & Wisenblit, 1999). Using color
as a cue on packaging can foster a potentially strong association, especially when it is
unique to a particular brand. However, people in different cultures are exposed to
different color associations and develop color preferences based on their own culture.
Marketers therefore must consider color as part of their strategies. Simply taking the
colors of a particular logo, package, or product design from one market to another should
only be done under a thorough understanding of how colors and the color combinations
are perceived in each location (Madden et al., 2000).
2.4.2 Pricing
Margins can be manipulated by price setting, variation (discounts), price changes, and
resale price control. The margin policy will determine what kinds of middlemen and how
many will be available for the channel design. Many good middlemen usually require a
higher margin policy.
Often well over half of the final consumer price is composed of middlemen’s margins.
Factors influencing middlemen’s margins include degree of competition, cost of functions
performed, desired profits, bargaining power, and resale price-control power. Channel
policies involving degree of directness, selectivity, choice of middleman type, and
number of channels will all interact with price. The multiple-channel approach is made
more profitable if some form of price segmentation can be utilized (Ali, 2014).
According to Ali (2014) alcoholic beverage companies view prices in terms of their
ability to generate profits, sales, and consumer traffic, as well as how they affect the
stores image. In setting retail prices, the alcoholic beverage company is guided by the
value chains set by the company, profits, sales or competitive objectives. Alcoholic
beverage firms use price adjustments as adaptive mechanisms to accommodate changing
market conditions and operating requirements. Both upward and downward adjustments
29
are needed from time to time to adapt to the dynamic retailing environment, (Lewinson &
Delozier, 1982).
Consumers are becoming more increasingly price sensitive, (Eaglesham, 1990). Pricing is
a major competitive tool. The economics of production only sets the bottom line limit and
the company then has a wide range of strategies to set the price. The commonly used
price strategies are: ‘Image’ pricing, the price here follows the image of the brand. Adidas
shoes or Nike are priced high because of the premium value attached to the brand name.
Price undercutting, some companies have used this strategy very successfully. For
undercutting to succeed, the company has to offer the minimum performance standard
(Ramanu, 1996).Aggressive or Penetration pricing, firms in this sector wishing to offer a
high level of benefits at an average price (Ali, 2014).
2.4.3 Promotion
Promotion involves both providing the consumer information regarding the alcoholic
beverages’ store and its product or service offering as well as influencing the consumer
perceptions, attitudes, and behavior towards the store and what it has to offer. It is both an
informative and persuasive communication process. Companies use newspaper ads,
posters, TV, internet that stress its good prices (persuasive communication) and but
instead of just listing the merchandise, the ads tell exactly why the manufacturer closed
out the goods. That way, customers would not suspect that the products are irregular,
damaged or counterfeit informative communication (Ali, 2014).
While assessing the target audience, companies look at the demographics and lifestyles,
life stages, usage levels, understanding and perception of services and the organization
and the buying process of the targets. While designing advertising messages,
manufacturers use emotional and moral appeal, there is also use of rational messages and
humor, one danger is that a wrongly chosen promotional strategy can bring negative
reaction (Ali, 2014).
Sponsorship contributes to the building of the brand/product and corporate image. Direct
marketing is an interactive system of marketing which use one or more advertising media
to affect a measurable response and / or transactions at any location, Betts and York
30
(1994), it aims to create and exploit the dialogue between the service provider and the
customer, and offer several potential benefits such as targeting precision, testing the
market, providing new distribution channels and support existing ones, it also leads to
cost effective advertising. There is a role for consumer promotions in the marketing of
even the strongest brand, a role which is mainly tactical and which needs to be carefully
planned. The alcoholic beverage distributors must be involved, since most promotions
necessarily require their cooperation, but it should be the manufacturer who decides on
the purpose of and budget for the schemes (Ali, 2014).
Trade promotions at the same time need negotiations with customers, but again the
decision must be designed by the manufacturers and have specific targets Randall (1991).
Personal selling is the direct face to face communication between a retail sales person and
a retail consumer. Store displays are direct, impersonal in-store presentations and
exhibitions of merchandise together with related information. Customers need and desire
constant flow of factual information to use as a basis of making need- satisfying purchase
decisions. They want to know stores hours, what specials are being run, what styles are in
fashion, product features, and a host of all other things (Ali, 2014).
According Ali (2014) since alcoholic beverages desire to influence their customers to take
desired course of action, retail communications must be well organized and designed so
that each message contains the appropriate balance of information and persuasion. Retail
advertising has two basic purposes: to get the customers into the store and to contribute to
the stores image or the company. The first purpose is immediate: today’s advertising
brings buyers into the store tomorrow; tomorrow’s advertising brings buyers into the store
the next day. To accomplish this, the store must give buyers some specific reason to come
to the store now Advertising can be of several kinds: product advertising, institutional and
cooperative advertising (Hasty & Reardon 1997).
2.4.4 Distribution
To reach a target market, the marketer uses three kinds of marketing channels.
Communication channels deliver and receive messages from target buyers and include
newspapers, magazines, radio, television, mail, telephone, billboards, posters, fliers, CDs,
audiotapes, and the Internet. Beyond these, firms communicate through the look of their
31
retail stores and Web sites and other media. Marketers are increasingly adding dialogue
channels such as e-mail, blogs, and toll-free numbers to familiar monologue channels
such as ads. The marketer uses distribution channels to display, sell, or deliver the
physical product or service(s) to the buyer or user (Kotler & Keller, 2012).
These channels may be direct via the Internet, mail, or mobile phone or telephone, or
indirect with distributors, wholesalers, retailers, and agents as intermediaries. To carry out
transactions with potential buyers, the marketer also uses service channels that include
warehouses, transportation companies, banks, and insurance companies. Marketers
clearly face a design challenge in choosing the best mix of communication, distribution,
and service channels for their offerings (Ali, 2014).
The supply chain is a longer channel stretching from raw materials to components to
finished products carried to final buyers. The supply chain for coffee may start with
Ethiopian farmers who plant, tend, and pick the coffee beans, selling their harvest to
wholesalers or perhaps a Fair Trade cooperative. If sold through the cooperative, the
coffee is washed, dried, and packaged for shipment by an Alternative Trading
Organization (ATO) that pays a minimum of $1.26 a pound. The ATO transports the
coffee to the developing world where it can sell it directly or via retail channels. Each
company captures only a certain percentage of the total value generated by the supply
chain’s value delivery system. When a company acquires competitors or expands
upstream or downstream, its aim is to capture a higher percentage of supply chain value
(LeMay, 2017).
The marketing environment consists of the task environment and the broad environment.
The task environment includes the actors engaged in producing, distributing, and
promoting the offering. These are the company, suppliers, distributors, dealers, and target
customers. In the supplier group are material suppliers and service suppliers, such as
marketing research agencies, advertising agencies, banking and insurance companies,
transportation companies, and telecommunications companies. Distributors and dealers
include agents, brokers, manufacturer representatives, and others who facilitate finding
and selling to customers (Kotler & Keller, 2012).
32
The broad environment consists of six components: demographic environment, economic
environment, social-cultural environment, natural environment, technological
environment, and political-legal environment. Marketers must pay close attention to the
trends and developments in these and adjust their marketing strategies as needed. New
opportunities are constantly emerging that await the right marketing savvy and ingenuity
(Singh & Sarma, 2015).
2.5 Chapter Summary
This chapter presents the literature review on previous studies done around consumer
choice and buyer behavior. It outlines the in detail the internal and external influencers as
well as Marketing mix factors towards brand choice. Chapter three presents the research
methodology and covers the research design, target population, sampling procedure, data
analysis techniques.
33
CHAPTER THREE
3.0 RESEARCH METHODOLOGY
3.1 Introduction
This chapter has various sections that cover the research design, target population,
sampling procedure, data collection techniques and data analysis techniques.
3.2 Research Design
A research design is an integral aspect and factor to consider in any study. According to
Bryman and Bell (2003), a research design is the applied strategy chosen to collectively
integrate components of a study while addressing a research problem. This study used a
descriptive survey design to analyze the factors affecting consumer choice of beer brand
in Kenya. A descriptive survey design is a research approach and framework that seeks to
explain and describe a certain trend, phenomenon or case interest. The rationale
supporting descriptive research designs is that it measures variables using data collected
from a representative sample and then to examine relationships among the variables
(Bryman and Bell, 2003). In most instances, descriptive surveys attempt to capture
attitude or patterns of past behavior (Hagan, 2000).
The research design identified was deemed necessary in conducting this research since it
provided the latitude to explicitly analyze the factors affecting consumer choice of beer
brand in Kenya using established variables. Moreover, using a descriptive research
design, the relationship between the variables and outcomes of this study are able to be
correlated and explained. The specific research technique chosen is the survey method.
Survey research involves use of relevant data collection instruments/tools to collect data
from sample that has been selected to represent a population to which the findings of the
data can be generalized. The dependent variable is consumer choice while the
independent variable is the beer brands.
3.3 Population Sampling Design
3.3.1 Population
According to Bryanand Bell (2003), a population is defined as a group of members within
a given area. The population of study comprised of the Beer drinking population in
34
Kenya. Howland (2016) describes the beer drinking population in Kenya to be undefined
but estimated to be over the 1 million mark. Ideally, Kenya is termed as an actively
drinking nation together with the likes of Germany, Russia and Scotland. The lack of an
exact quantification of the drinking population in Kenya is due to the sporadic trends of
new entrants and exits made (Howland, 2016). The source of my population comprised of
all beer-drinking persons in Nairobi County distributed among Westands, CBD,
Eastlands, Thika Road, Nairobi West, Karen-Kilimani.
3.3.2 Sampling Design
3.3.2.1 Sampling Frame
The sampling frame is a fundamental aspect of any research. Bryman and Bell (2003)
explicitly enumerate a sampling frame as the set of information, material or device from
which a sample is derived. The sampling frame for this study included subjects of Nairobi
residents who Consumer EABL beer. All the subjects will be from ages 18 and over and
will include both men and women.
3.3.2.2 Sampling Technique
For purposes of this study, a combination of clustered random sampling and simple
random sampling (SRS) were employed and effectively used to address the objectives of
the study. Slinky and Singh (2016) explain that simple random sampling offers
appropriate aspects of research when sampling an undefined or indefinite population such
as the one in the case of this study. Justifiably, simple random sampling is designed in
such a way as to ensure that every member of the population has an equal chance of being
chosen and that every combination of 𝑁 members has an equal chance of being chosen.
Simple random sampling will be used to collect information from the sample size
identified in an unbiased and random manner. The study used random sampling of beer
customers in bars and otherwise within Nairobi business Area, then systematic sampling
of 5 bars from every street/ area.
3.3.2.3 Sample Size
In order to arrive at an appropriate sample size in any empirical research study, it is
recommended that an ideal sample size (n) be used to represent the population under
study. This study allowed the error of sampling of 0.05. Notably, a predetermined target
35
population of 150,000 which is according www.beershara.co.ke was used to represent the
population size of EABL beer drinkers in Nairobi. Using Yamane (1973) sample size
formula to calculate, a sample size of 399 participants is derived as the sample size.
The sample size determination method applicable for this study borrows from the SRS
formula shown:
n = 150,000
1 + 150,000*0.05²
n = 399
Where:
n = Sample size
N = Population size
e = Error of sampling
3.4 Data Collection Methods
The research utilized primary data was obtained from questionnaires adopted for the
study. For primary data sources, the data collection tools used a close-ended questionnaire
that was administered to the participants of the study.
Questionnaires were used to obtain the primary data required for the project which are to
be self-administered in the field. Questionnaires are best suited for surveys (Saunders et
al., 2007). This research employed a 5 Likert scale in rating the various responses. The
respondents were required to read, understand and tick an appropriate choice. The
questionnaire offers a credible source of gaining first-hand information from the
participants hence enabling the description and explanation of the research objectives.
3.5 Research Procedures
First, prior to conducting the main study, a pilot study was done to provide and act as a
baseline for the final study. During the pilot study, 10 beer drinkers were randomly
selected from within the identified sample areas of Karen, Wetlands and CBD. Test-re-
test method was applied to appraise for issues of reliability and validity of the tools. The
instruments were administered and re-administered to respondents after a period of two
weeks.
36
Questionnaires offered a cheap way of deriving information from a large population. As a
reliability check for the tools, a pre-test or pilot study was conducted prior to the main
study. During this pilot study, all arising issues and concerns were identified and
addressed to ensure that they are well mitigated and avoided during the main study.
According to Panton (2000) validity is the quality attributed to proposition or measures of
the degree to which they conform to establish the truth. For this study, validity was
achieved through a pilot test. The research employed the use of questionnaires. The
purpose of construct validity is to show that the items measure and are correlated with
what they purport to measure, and that the items do not correlate with other constructs.
Cronbach’s alpha will be used to determine reliability, where Cronbach's coefficient,
having a value of more than 0.5 is considered adequate for such exploratory work
(Nunally, 1978).
Ideally, this approach is in line with the logic of Solanki and Singh (2016) who support
the need to administer data collection tools at least twice and correlation between the two
sets computed. Notably, the best approach for this is by using the Pearson’s Product-
Moment correlation coefficient Formula.
After review, the final the questionnaires were administered to the customers by a
research assistant to obtain more information and also obtain clarity of information
obtained from the respondents. As a credibility check and final tool administration, the
researcher contacted the respondent and give each a questionnaire they fill and data
collected simultaneously.
3.6 Data Analysis Methods
Before processing the responses, the completed questionnaires were edited for
completeness, consistency of answering questions and clarity. The data was then coded to
enable the responses to be grouped into various categories. This research employed
quantitative methods of analyzing data. In analysis, ratio scale was used in data
measurement and both inferential and descriptive statistics will be used to analyze the
data.

37
In descriptive statistics the research employed descriptive statistical tools frequencies,
percentage, mean and standard deviation and use of tables and figures present data.
Multiple linear regression, correlation and regression analysis in the form of inferential
statistics analysis was used in determining the relationship between the dependent and
independent variables. These models samples expressed below: Regression Y = β0 +
β1X1 + β2X2 + β3X3 + ɛ. This was achieved via SPSS. The descriptive statistics was
computed and the study findings presented using percentiles, tables and figures. From the
findings, relevant interpretations were made.
3.7 Chapter Summary
This chapter presents the research methodology and has covered the research design,
target population, sampling procedure, data analysis techniques. The questionnaire is also
included in appendix two. The next chapter presents the findings of the research after data
collection and analysis.

38
CHAPTER FOUR
4.0 RESULTS AND FINDINGS
4.1 Introduction
This chapter presents the results and findings from the data collection and analysis done
described in the previous chapter. In this research, out of 399 questionnaires administered
to the respondents a total of 387 questionnaires were returned. This represent 97%
response rate that is deemed as satisfactory to make conclusions for the study. According
to Rogers, Miller and Judge (2009) a response rate of 50% is acceptable for a descriptive
study. According to Mugenda and Mugenda (1999) a response rate of 70% and above is
rated very good. Fincham (2008) further asserts that response rates approximating 60%
should be the goal of researchers for most research. Based on this assertion a response
rate of 97% is therefore very good.
4.2 Background Information and Analysis
4.2.1 Gender
Figure 4.1 the respondents were asked about their gender the findings revealed that most
of the respondents were male who represented 60% of the respondents and female were
40%. This indicates that most beer drinkers are male, which could be explained by the
cultural belief in Kenya.
Male, 233, 60%
Female, 154, 40%
Respondent Gender
Male Female
Figure 4.1: Gender
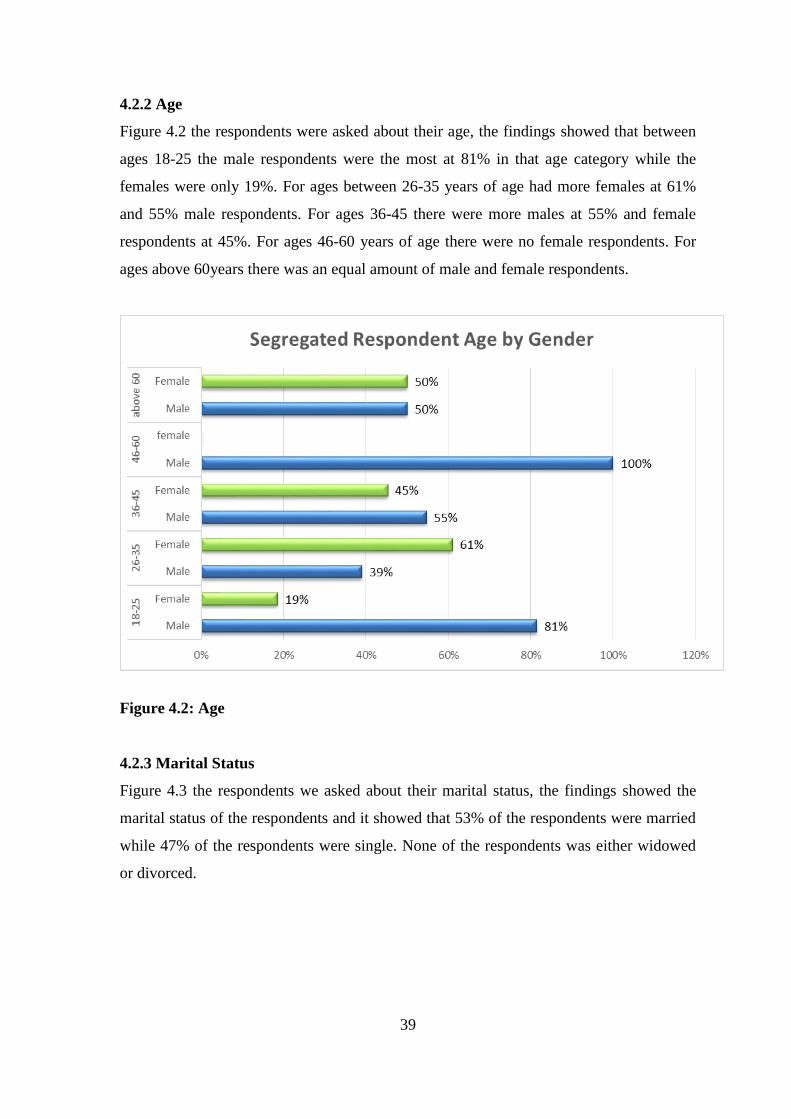
39
4.2.2 Age
Figure 4.2 the respondents were asked about their age, the findings showed that between
ages 18-25 the male respondents were the most at 81% in that age category while the
females were only 19%. For ages between 26-35 years of age had more females at 61%
and 55% male respondents. For ages 36-45 there were more males at 55% and female
respondents at 45%. For ages 46-60 years of age there were no female respondents. For
ages above 60years there was an equal amount of male and female respondents.
Figure 4.2: Age
4.2.3 Marital Status
Figure 4.3 the respondents we asked about their marital status, the findings showed the
marital status of the respondents and it showed that 53% of the respondents were married
while 47% of the respondents were single. None of the respondents was either widowed
or divorced.
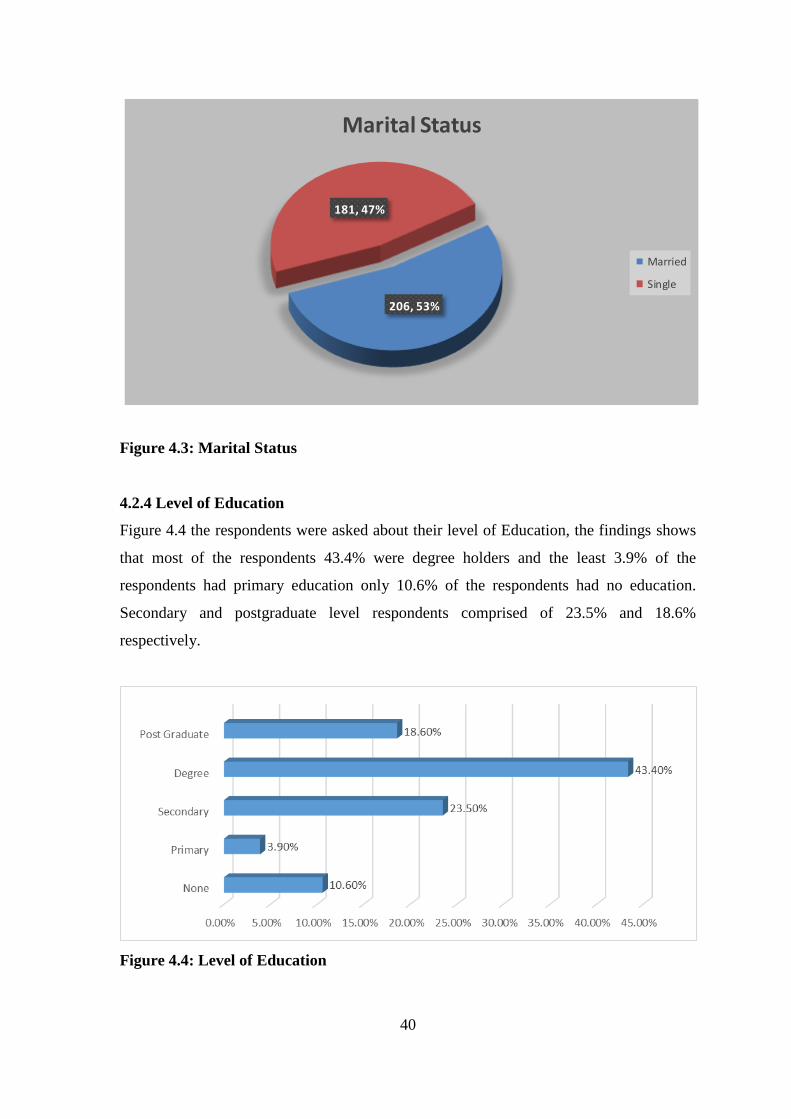
40
206, 53%
181, 47%
Marital Status
Married
Single
Figure 4.3: Marital Status
4.2.4 Level of Education
Figure 4.4 the respondents were asked about their level of Education, the findings shows
that most of the respondents 43.4% were degree holders and the least 3.9% of the
respondents had primary education only 10.6% of the respondents had no education.
Secondary and postgraduate level respondents comprised of 23.5% and 18.6%
respectively.
Figure 4.4: Level of Education
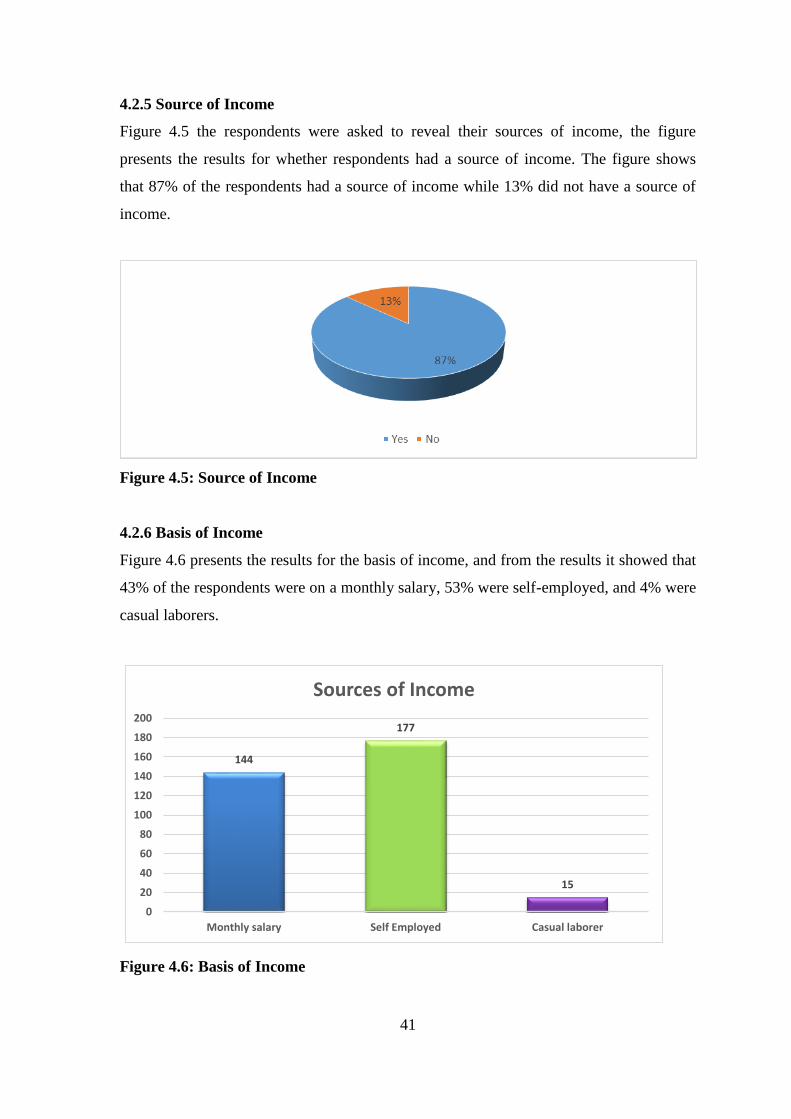
41
4.2.5 Source of Income
Figure 4.5 the respondents were asked to reveal their sources of income, the figure
presents the results for whether respondents had a source of income. The figure shows
that 87% of the respondents had a source of income while 13% did not have a source of
income.
Figure 4.5: Source of Income
4.2.6 Basis of Income
Figure 4.6 presents the results for the basis of income, and from the results it showed that
43% of the respondents were on a monthly salary, 53% were self-employed, and 4% were
casual laborers.
144
177
15
0
20
40
60
80
100
120
140
160
180
200
Monthly salary Self Employed Casual laborer
Sources of Income
Figure 4.6: Basis of Income
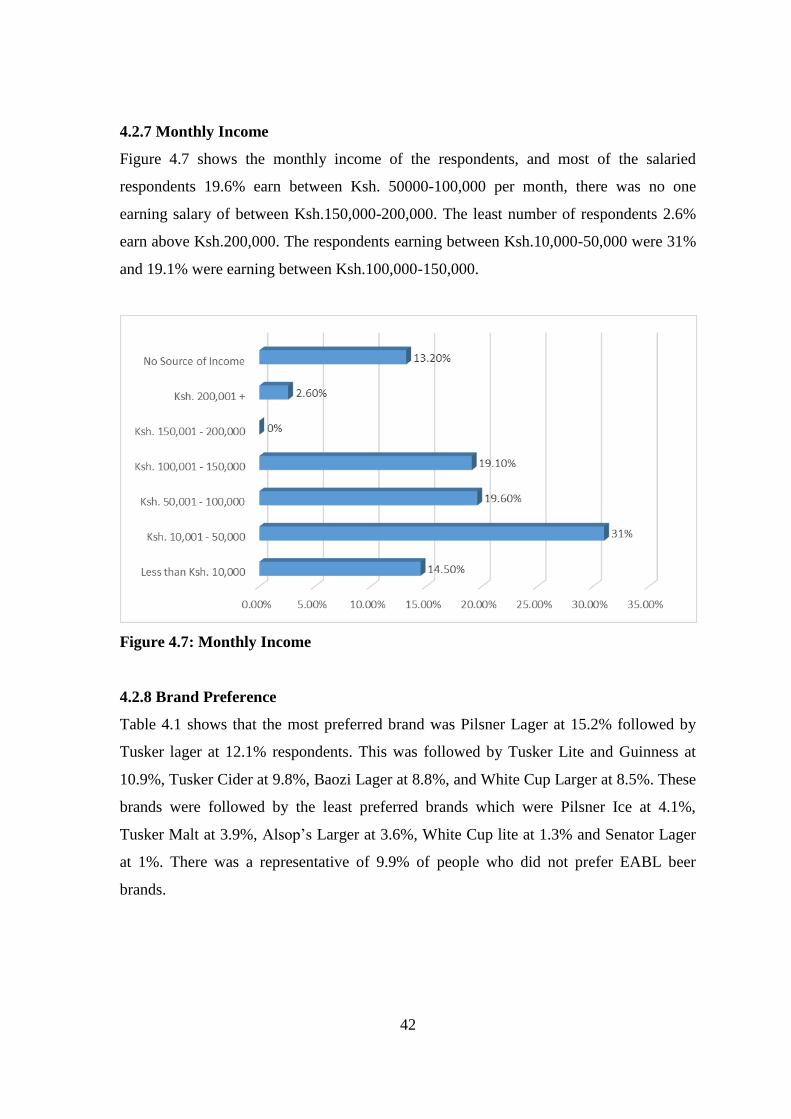
42
4.2.7 Monthly Income
Figure 4.7 shows the monthly income of the respondents, and most of the salaried
respondents 19.6% earn between Ksh. 50000-100,000 per month, there was no one
earning salary of between Ksh.150,000-200,000. The least number of respondents 2.6%
earn above Ksh.200,000. The respondents earning between Ksh.10,000-50,000 were 31%
and 19.1% were earning between Ksh.100,000-150,000.
Figure 4.7: Monthly Income
4.2.8 Brand Preference
Table 4.1 shows that the most preferred brand was Pilsner Lager at 15.2% followed by
Tusker lager at 12.1% respondents. This was followed by Tusker Lite and Guinness at
10.9%, Tusker Cider at 9.8%, Baozi Lager at 8.8%, and White Cup Larger at 8.5%. These
brands were followed by the least preferred brands which were Pilsner Ice at 4.1%,
Tusker Malt at 3.9%, Alsop’s Larger at 3.6%, White Cup lite at 1.3% and Senator Lager
at 1%. There was a representative of 9.9% of people who did not prefer EABL beer
brands.
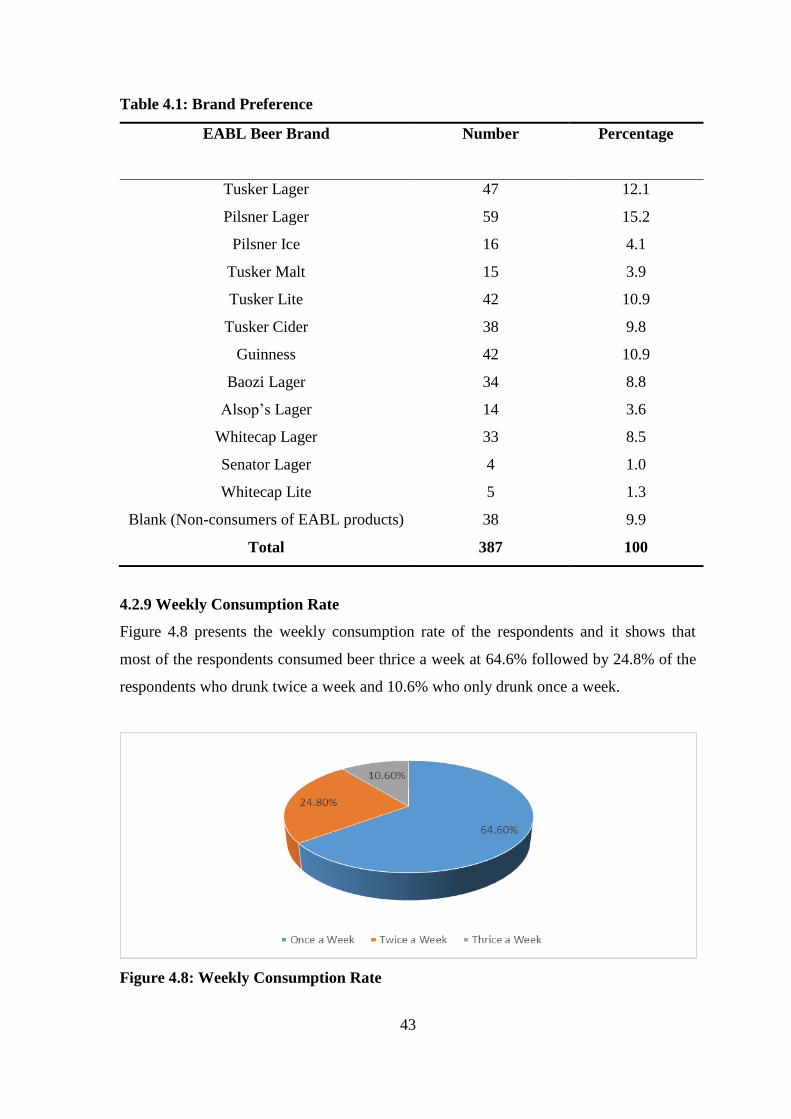
43
Table 4.1: Brand Preference
EABL Beer Brand Number Percentage
Tusker Lager
Pilsner Lager
Pilsner Ice
Tusker Malt
Tusker Lite
Tusker Cider
Guinness
Baozi Lager
Alsop’s Lager
Whitecap Lager
Senator Lager
Whitecap Lite
Blank (Non-consumers of EABL products)
47
59
16
15
42
38
42
34
14
33
4
5
38
12.1
15.2
4.1
3.9
10.9
9.8
10.9
8.8
3.6
8.5
1.0
1.3
9.9
Total 387 100
4.2.9 Weekly Consumption Rate
Figure 4.8 presents the weekly consumption rate of the respondents and it shows that
most of the respondents consumed beer thrice a week at 64.6% followed by 24.8% of the
respondents who drunk twice a week and 10.6% who only drunk once a week.
Figure 4.8: Weekly Consumption Rate
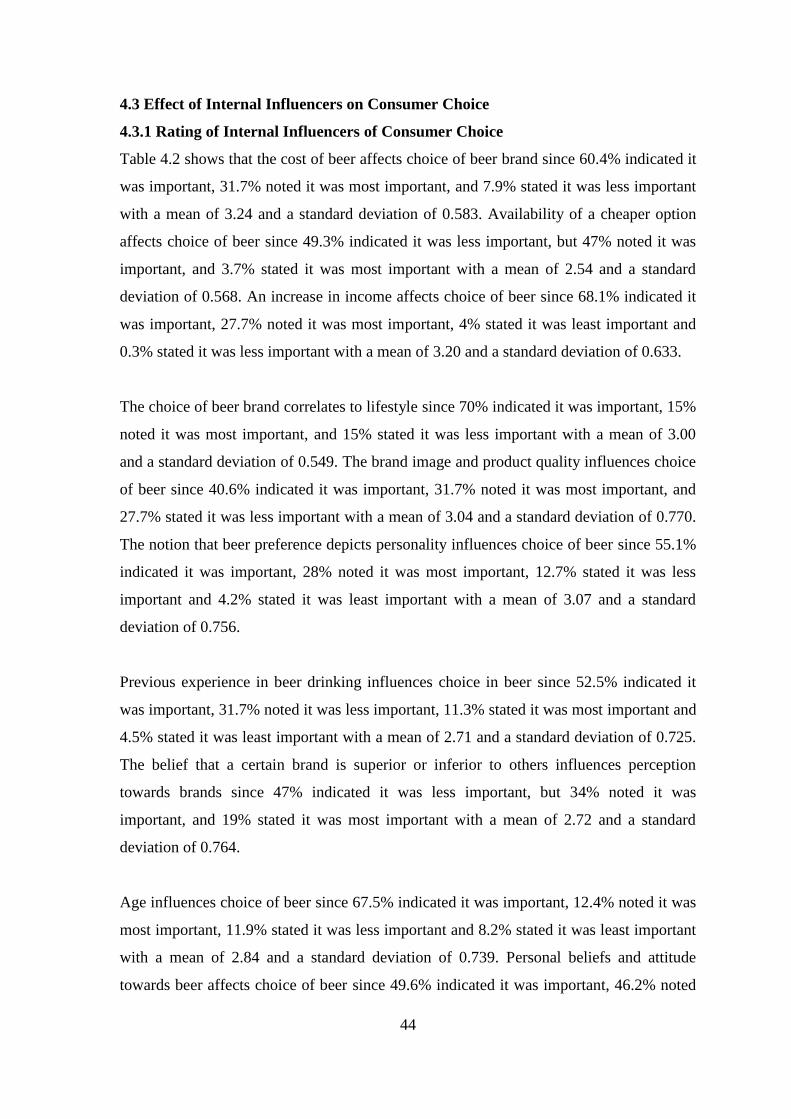
44
4.3 Effect of Internal Influencers on Consumer Choice
4.3.1 Rating of Internal Influencers of Consumer Choice
Table 4.2 shows that the cost of beer affects choice of beer brand since 60.4% indicated it
was important, 31.7% noted it was most important, and 7.9% stated it was less important
with a mean of 3.24 and a standard deviation of 0.583. Availability of a cheaper option
affects choice of beer since 49.3% indicated it was less important, but 47% noted it was
important, and 3.7% stated it was most important with a mean of 2.54 and a standard
deviation of 0.568. An increase in income affects choice of beer since 68.1% indicated it
was important, 27.7% noted it was most important, 4% stated it was least important and
0.3% stated it was less important with a mean of 3.20 and a standard deviation of 0.633.
The choice of beer brand correlates to lifestyle since 70% indicated it was important, 15%
noted it was most important, and 15% stated it was less important with a mean of 3.00
and a standard deviation of 0.549. The brand image and product quality influences choice
of beer since 40.6% indicated it was important, 31.7% noted it was most important, and
27.7% stated it was less important with a mean of 3.04 and a standard deviation of 0.770.
The notion that beer preference depicts personality influences choice of beer since 55.1%
indicated it was important, 28% noted it was most important, 12.7% stated it was less
important and 4.2% stated it was least important with a mean of 3.07 and a standard
deviation of 0.756.
Previous experience in beer drinking influences choice in beer since 52.5% indicated it
was important, 31.7% noted it was less important, 11.3% stated it was most important and
4.5% stated it was least important with a mean of 2.71 and a standard deviation of 0.725.
The belief that a certain brand is superior or inferior to others influences perception
towards brands since 47% indicated it was less important, but 34% noted it was
important, and 19% stated it was most important with a mean of 2.72 and a standard
deviation of 0.764.
Age influences choice of beer since 67.5% indicated it was important, 12.4% noted it was
most important, 11.9% stated it was less important and 8.2% stated it was least important
with a mean of 2.84 and a standard deviation of 0.739. Personal beliefs and attitude
towards beer affects choice of beer since 49.6% indicated it was important, 46.2% noted

45
it was less important, and 4.2% stated it was most important with a mean of 2.58 and a
standard deviation of 0.573.
Table 4.2: Rating of the Internal Influencers of Consumer Choice
Internal Influencers LstI LI I MI Mean Std
Dev
The cost of beer affects your choice of beer
brand
0 7.9 60.4 31.7 3.24 .583
Availability of a cheaper option affects your
choice of beer
0 49.3 47 3.7 2.54 .568
An increase in income affects your choice of
beer
4 0.3 68.1 27.7 3.20 .633
Your choice of beer brand correlates to your
lifestyle
0 15 70 15 3.00 .549
The brand image and product quality
influences your choice of beer
0 27.7 40.6 31.7 3.04 .770
The notion that your beer preference depicts
your personality influences your choice of
beer
4.2 12.7 55.1 28 3.07 .756
Previous experience in beer drinking
influences your choice in beer
4.5 31.7 52.5 11.3 2.71 .725
The belief that a certain brand is superior or
inferior to others influences your perception
towards brands
0 47 34 19 2.72 .764
Your age influences your choice of beer 8.2 11.9 67.5 12.4 2.84 .739
Your personal beliefs and attitude towards
beer affects your choice of beer
0 46.2 49.6 4.2 2.58 .573
4.3.2 Correlation of the Internal Influencers of Consumer Choice
Table 4.3 presents the correlation for internal influencers of consumer choice for beer
brands. The table shows that income was significant to consumer choice for beer brands
(r=0.148, p<0.01). Lifestyle was significant to consumer choice for beer brands (r=0.471,
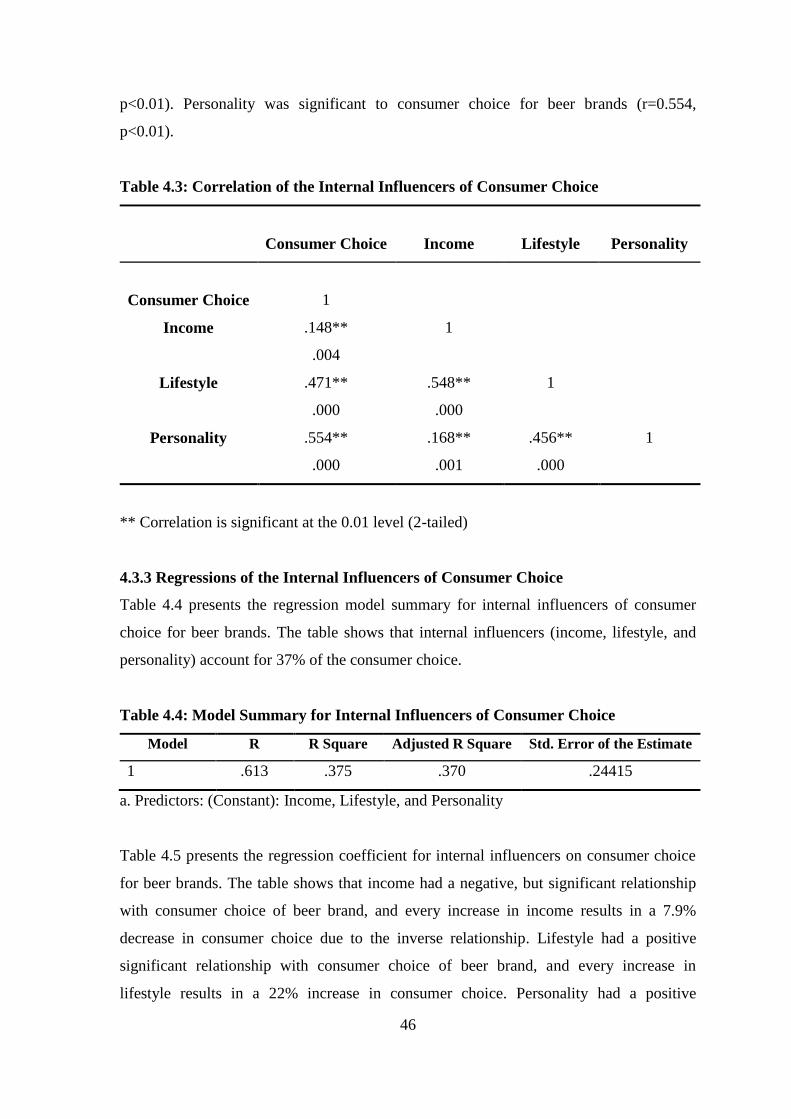
46
p<0.01). Personality was significant to consumer choice for beer brands (r=0.554,
p<0.01).
Table 4.3: Correlation of the Internal Influencers of Consumer Choice
Consumer Choice Income Lifestyle Personality
Consumer Choice 1
Income .148**
.004
1
Lifestyle .471**
.000
.548**
.000
1
Personality .554**
.000
.168**
.001
.456**
.000
1
** Correlation is significant at the 0.01 level (2-tailed)
4.3.3 Regressions of the Internal Influencers of Consumer Choice
Table 4.4 presents the regression model summary for internal influencers of consumer
choice for beer brands. The table shows that internal influencers (income, lifestyle, and
personality) account for 37% of the consumer choice.
Table 4.4: Model Summary for Internal Influencers of Consumer Choice
Model R R Square Adjusted R Square Std. Error of the Estimate
1 .613 .375 .370 .24415
a. Predictors: (Constant): Income, Lifestyle, and Personality
Table 4.5 presents the regression coefficient for internal influencers on consumer choice
for beer brands. The table shows that income had a negative, but significant relationship
with consumer choice of beer brand, and every increase in income results in a 7.9%
decrease in consumer choice due to the inverse relationship. Lifestyle had a positive
significant relationship with consumer choice of beer brand, and every increase in
lifestyle results in a 22% increase in consumer choice. Personality had a positive
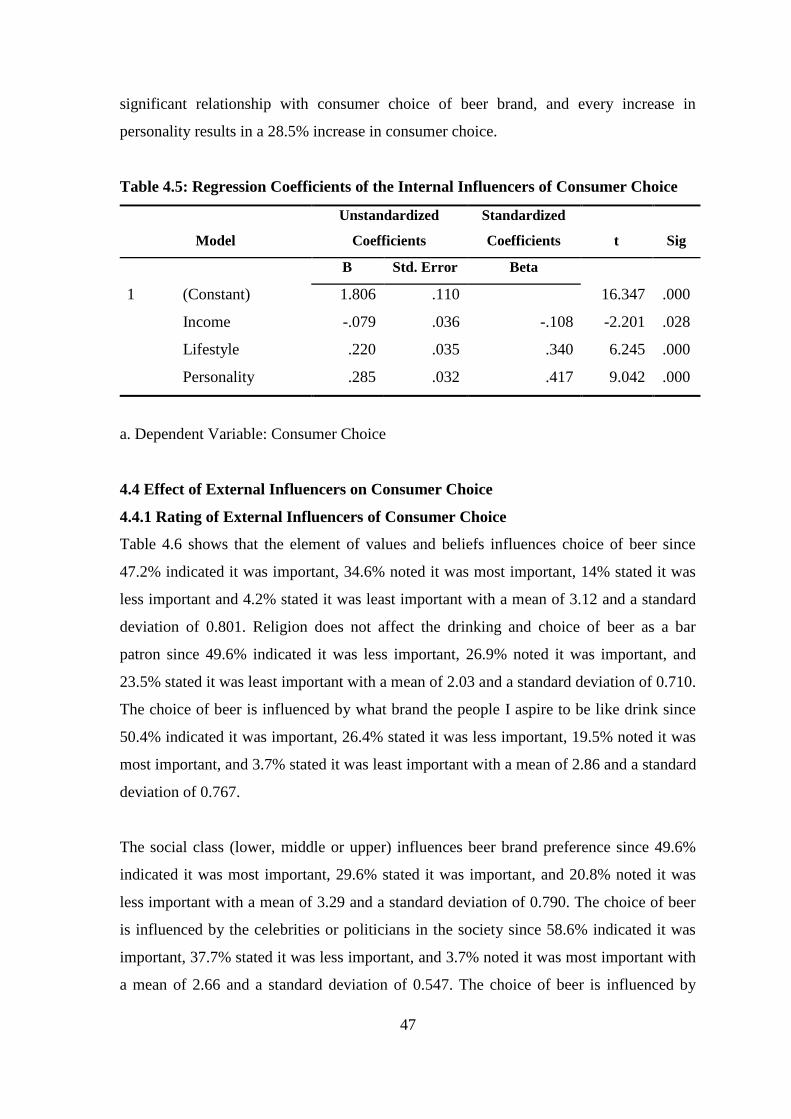
47
significant relationship with consumer choice of beer brand, and every increase in
personality results in a 28.5% increase in consumer choice.
Table 4.5: Regression Coefficients of the Internal Influencers of Consumer Choice
Model
Unstandardized
Coefficients
Standardized
Coefficients
t
Sig
B Std. Error Beta
1 (Constant)
Income
Lifestyle
Personality
1.806
-.079
.220
.285
.110
.036
.035
.032
-.108
.340
.417
16.347
-2.201
6.245
9.042
.000
.028
.000
.000
a. Dependent Variable: Consumer Choice
4.4 Effect of External Influencers on Consumer Choice
4.4.1 Rating of External Influencers of Consumer Choice
Table 4.6 shows that the element of values and beliefs influences choice of beer since
47.2% indicated it was important, 34.6% noted it was most important, 14% stated it was
less important and 4.2% stated it was least important with a mean of 3.12 and a standard
deviation of 0.801. Religion does not affect the drinking and choice of beer as a bar
patron since 49.6% indicated it was less important, 26.9% noted it was important, and
23.5% stated it was least important with a mean of 2.03 and a standard deviation of 0.710.
The choice of beer is influenced by what brand the people I aspire to be like drink since
50.4% indicated it was important, 26.4% stated it was less important, 19.5% noted it was
most important, and 3.7% stated it was least important with a mean of 2.86 and a standard
deviation of 0.767.
The social class (lower, middle or upper) influences beer brand preference since 49.6%
indicated it was most important, 29.6% stated it was important, and 20.8% noted it was
less important with a mean of 3.29 and a standard deviation of 0.790. The choice of beer
is influenced by the celebrities or politicians in the society since 58.6% indicated it was
important, 37.7% stated it was less important, and 3.7% noted it was most important with
a mean of 2.66 and a standard deviation of 0.547. The choice of beer is influenced by
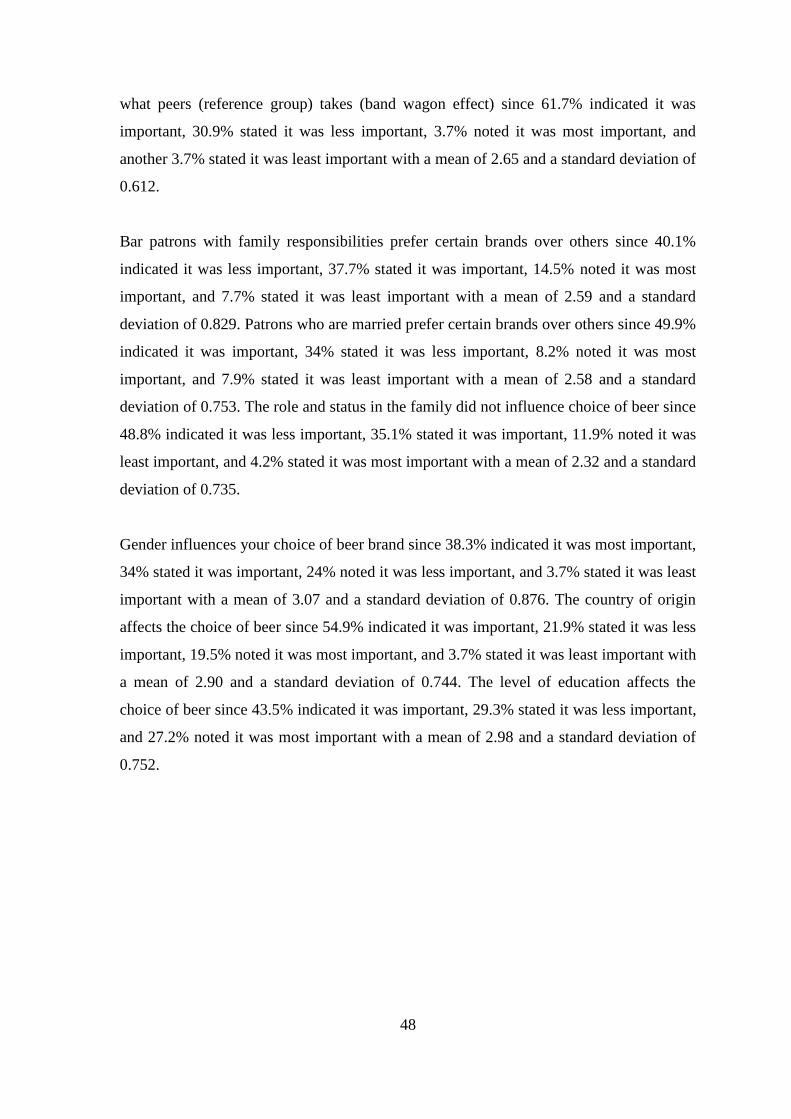
48
what peers (reference group) takes (band wagon effect) since 61.7% indicated it was
important, 30.9% stated it was less important, 3.7% noted it was most important, and
another 3.7% stated it was least important with a mean of 2.65 and a standard deviation of
0.612.
Bar patrons with family responsibilities prefer certain brands over others since 40.1%
indicated it was less important, 37.7% stated it was important, 14.5% noted it was most
important, and 7.7% stated it was least important with a mean of 2.59 and a standard
deviation of 0.829. Patrons who are married prefer certain brands over others since 49.9%
indicated it was important, 34% stated it was less important, 8.2% noted it was most
important, and 7.9% stated it was least important with a mean of 2.58 and a standard
deviation of 0.753. The role and status in the family did not influence choice of beer since
48.8% indicated it was less important, 35.1% stated it was important, 11.9% noted it was
least important, and 4.2% stated it was most important with a mean of 2.32 and a standard
deviation of 0.735.
Gender influences your choice of beer brand since 38.3% indicated it was most important,
34% stated it was important, 24% noted it was less important, and 3.7% stated it was least
important with a mean of 3.07 and a standard deviation of 0.876. The country of origin
affects the choice of beer since 54.9% indicated it was important, 21.9% stated it was less
important, 19.5% noted it was most important, and 3.7% stated it was least important with
a mean of 2.90 and a standard deviation of 0.744. The level of education affects the
choice of beer since 43.5% indicated it was important, 29.3% stated it was less important,
and 27.2% noted it was most important with a mean of 2.98 and a standard deviation of
0.752.
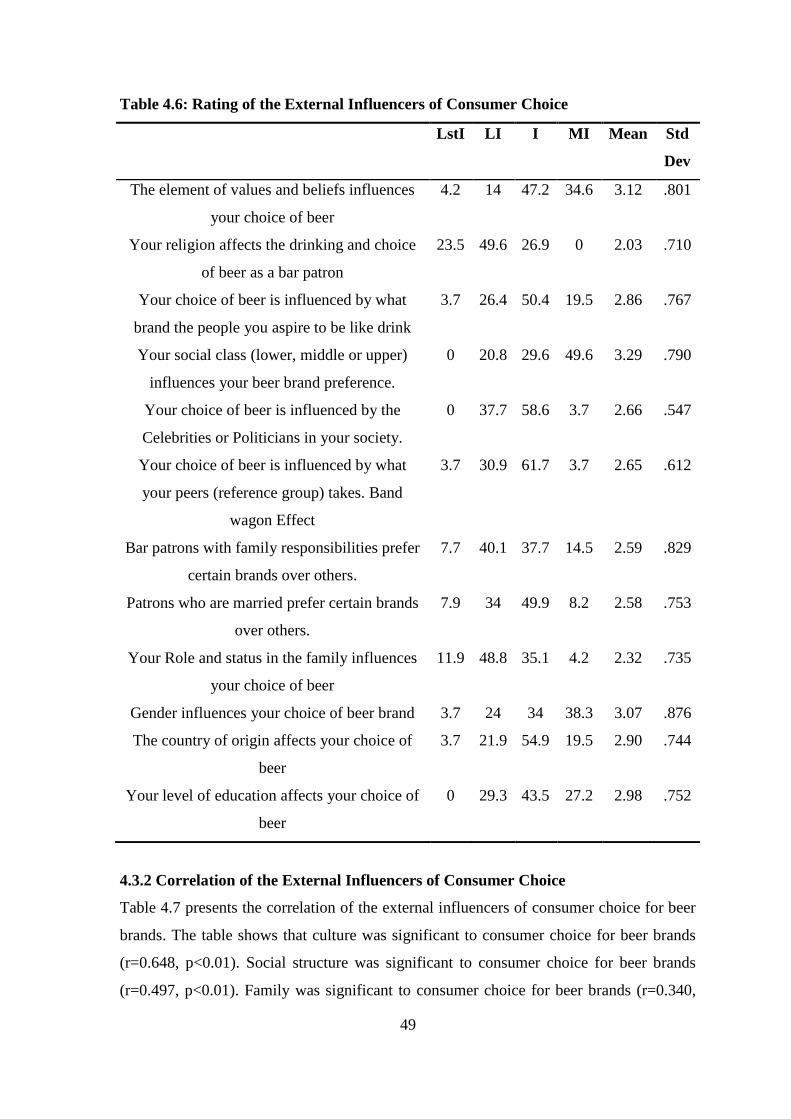
49
Table 4.6: Rating of the External Influencers of Consumer Choice
LstI LI I MI Mean Std
Dev
The element of values and beliefs influences
your choice of beer
4.2 14 47.2 34.6 3.12 .801
Your religion affects the drinking and choice
of beer as a bar patron
23.5 49.6 26.9 0 2.03 .710
Your choice of beer is influenced by what
brand the people you aspire to be like drink
3.7 26.4 50.4 19.5 2.86 .767
Your social class (lower, middle or upper)
influences your beer brand preference.
0 20.8 29.6 49.6 3.29 .790
Your choice of beer is influenced by the
Celebrities or Politicians in your society.
0 37.7 58.6 3.7 2.66 .547
Your choice of beer is influenced by what
your peers (reference group) takes. Band
wagon Effect
3.7 30.9 61.7 3.7 2.65 .612
Bar patrons with family responsibilities prefer
certain brands over others.
7.7 40.1 37.7 14.5 2.59 .829
Patrons who are married prefer certain brands
over others.
7.9 34 49.9 8.2 2.58 .753
Your Role and status in the family influences
your choice of beer
11.9 48.8 35.1 4.2 2.32 .735
Gender influences your choice of beer brand 3.7 24 34 38.3 3.07 .876
The country of origin affects your choice of
beer
3.7 21.9 54.9 19.5 2.90 .744
Your level of education affects your choice of
beer
0 29.3 43.5 27.2 2.98 .752
4.3.2 Correlation of the External Influencers of Consumer Choice
Table 4.7 presents the correlation of the external influencers of consumer choice for beer
brands. The table shows that culture was significant to consumer choice for beer brands
(r=0.648, p<0.01). Social structure was significant to consumer choice for beer brands
(r=0.497, p<0.01). Family was significant to consumer choice for beer brands (r=0.340,

50
p<0.01). Demography was significant to consumer choice for beer brands (r=0.540,
p<0.01).
Table 4.7: Correlation of the External Influencers of Consumer Choice
Consumer
Choice
Culture
Social
Structure
Family
Demography
Consumer Choice 1
Culture .648**
.000
1
Social Structure .497**
.000
.408**
.000
1
Family .340**
.000
.094
.068
.158**
.002
1
Demography .540**
.000
.491**
.000
.333**
.000
.164**
.001
1
** Correlation is significant at the 0.01 level (2-tailed).
4.3.3 Regression of the External Influencers of Consumer Choice
Table 4.8 presents the regression model summary for external influencers of consumer
choice for beer brands. The table shows that external influencers (culture, social structure,
family, and demography) account for 57.7% of the consumer choice.
Table 4.8: Model Summary for External Influencers of Consumer Choice
Model R R Square Adjusted R Square Std. Error of the Estimate
1 .763 .582 .577 .20004
a. Predictors: (Constant): Culture, Social Structure, Family, and Demography
Table 4.9 presents the regression coefficient for external influencers on consumer choice
for beer brands. The table shows that culture had a positive significant relationship with
consumer choice of beer brand, and every increase in culture results in a 23.9% increase
in consumer choice. Social structure had a positive significant relationship with consumer
choice of beer brand, and every increase in social structure results in a 12.7% increase in
consumer choice. Family had a positive significant relationship with consumer choice of
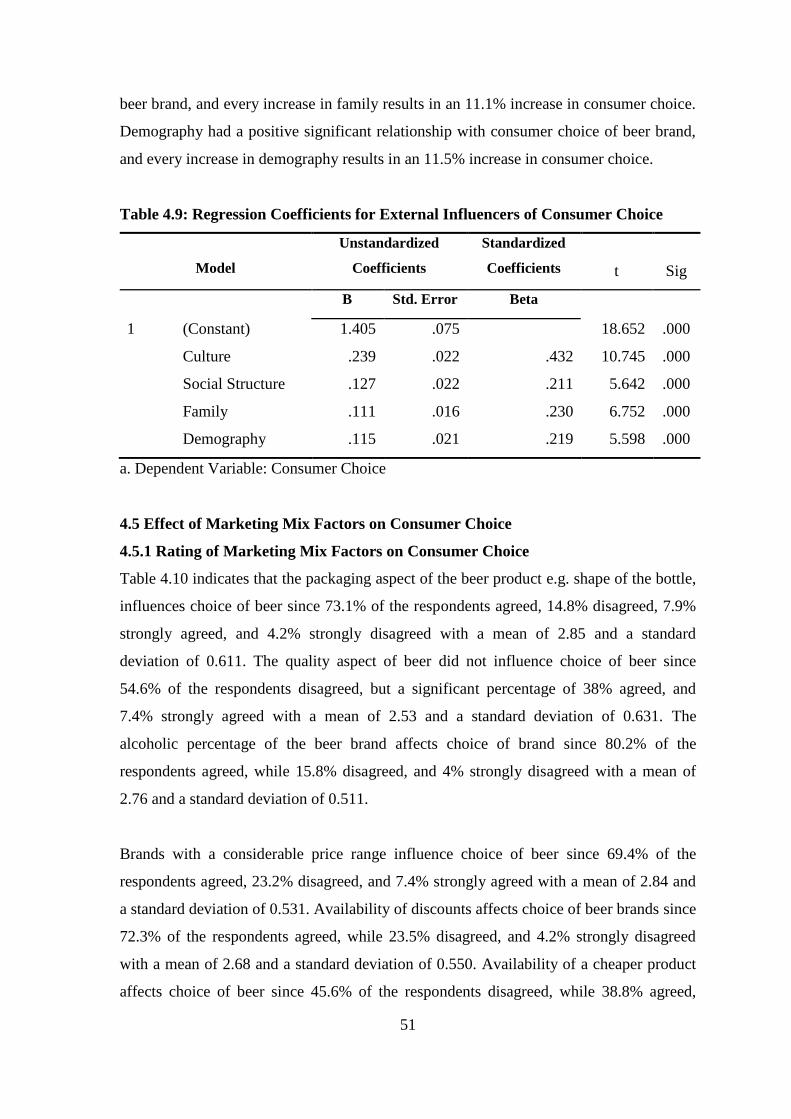
51
beer brand, and every increase in family results in an 11.1% increase in consumer choice.
Demography had a positive significant relationship with consumer choice of beer brand,
and every increase in demography results in an 11.5% increase in consumer choice.
Table 4.9: Regression Coefficients for External Influencers of Consumer Choice
Model
Unstandardized
Coefficients
Standardized
Coefficients
t
Sig
B Std. Error Beta
1 (Constant)
Culture
Social Structure
Family
Demography
1.405
.239
.127
.111
.115
.075
.022
.022
.016
.021
.432
.211
.230
.219
18.652
10.745
5.642
6.752
5.598
.000
.000
.000
.000
.000
a. Dependent Variable: Consumer Choice
4.5 Effect of Marketing Mix Factors on Consumer Choice
4.5.1 Rating of Marketing Mix Factors on Consumer Choice
Table 4.10 indicates that the packaging aspect of the beer product e.g. shape of the bottle,
influences choice of beer since 73.1% of the respondents agreed, 14.8% disagreed, 7.9%
strongly agreed, and 4.2% strongly disagreed with a mean of 2.85 and a standard
deviation of 0.611. The quality aspect of beer did not influence choice of beer since
54.6% of the respondents disagreed, but a significant percentage of 38% agreed, and
7.4% strongly agreed with a mean of 2.53 and a standard deviation of 0.631. The
alcoholic percentage of the beer brand affects choice of brand since 80.2% of the
respondents agreed, while 15.8% disagreed, and 4% strongly disagreed with a mean of
2.76 and a standard deviation of 0.511.
Brands with a considerable price range influence choice of beer since 69.4% of the
respondents agreed, 23.2% disagreed, and 7.4% strongly agreed with a mean of 2.84 and
a standard deviation of 0.531. Availability of discounts affects choice of beer brands since
72.3% of the respondents agreed, while 23.5% disagreed, and 4.2% strongly disagreed
with a mean of 2.68 and a standard deviation of 0.550. Availability of a cheaper product
affects choice of beer since 45.6% of the respondents disagreed, while 38.8% agreed,
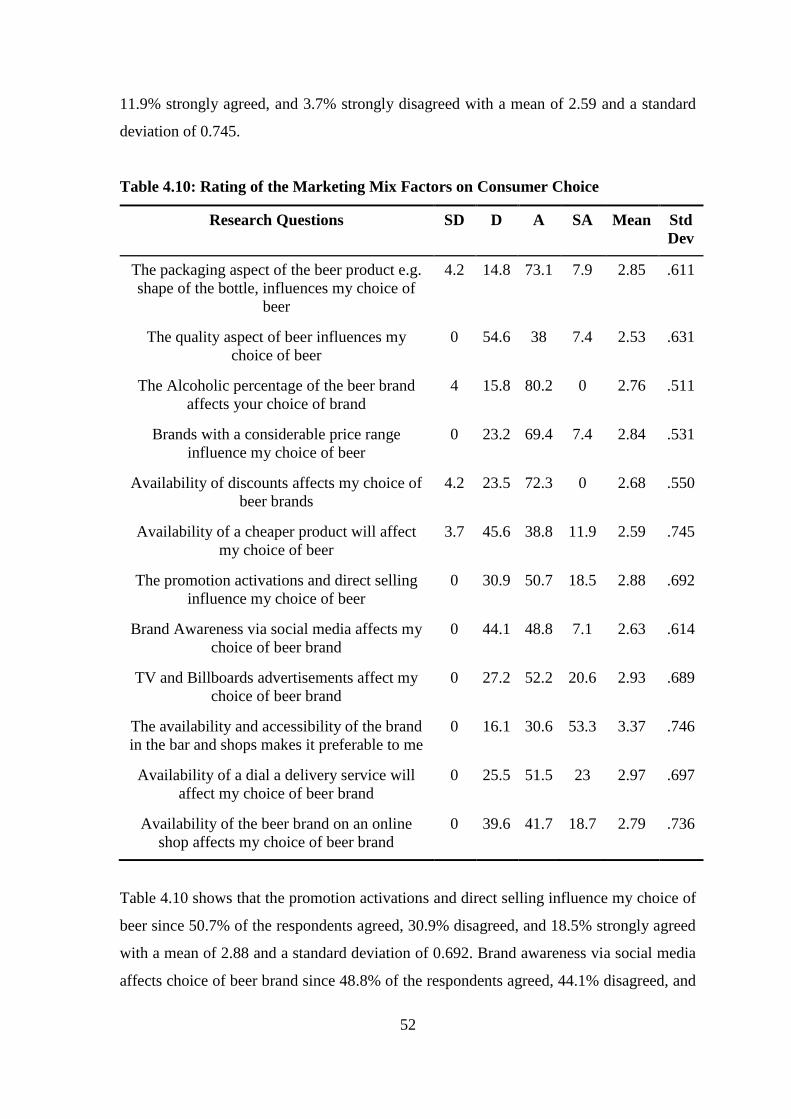
52
11.9% strongly agreed, and 3.7% strongly disagreed with a mean of 2.59 and a standard
deviation of 0.745.
Table 4.10: Rating of the Marketing Mix Factors on Consumer Choice
Research Questions SD D A SA Mean Std
Dev
The packaging aspect of the beer product e.g.
shape of the bottle, influences my choice of
beer
4.2 14.8 73.1 7.9 2.85 .611
The quality aspect of beer influences my
choice of beer
0 54.6 38 7.4 2.53 .631
The Alcoholic percentage of the beer brand
affects your choice of brand
4 15.8 80.2 0 2.76 .511
Brands with a considerable price range
influence my choice of beer
0 23.2 69.4 7.4 2.84 .531
Availability of discounts affects my choice of
beer brands
4.2 23.5 72.3 0 2.68 .550
Availability of a cheaper product will affect
my choice of beer
3.7 45.6 38.8 11.9 2.59 .745
The promotion activations and direct selling
influence my choice of beer
0 30.9 50.7 18.5 2.88 .692
Brand Awareness via social media affects my
choice of beer brand
0 44.1 48.8 7.1 2.63 .614
TV and Billboards advertisements affect my
choice of beer brand
0 27.2 52.2 20.6 2.93 .689
The availability and accessibility of the brand
in the bar and shops makes it preferable to me
0 16.1 30.6 53.3 3.37 .746
Availability of a dial a delivery service will
affect my choice of beer brand
0 25.5 51.5 23 2.97 .697
Availability of the beer brand on an online
shop affects my choice of beer brand
0 39.6 41.7 18.7 2.79 .736
Table 4.10 shows that the promotion activations and direct selling influence my choice of
beer since 50.7% of the respondents agreed, 30.9% disagreed, and 18.5% strongly agreed
with a mean of 2.88 and a standard deviation of 0.692. Brand awareness via social media
affects choice of beer brand since 48.8% of the respondents agreed, 44.1% disagreed, and
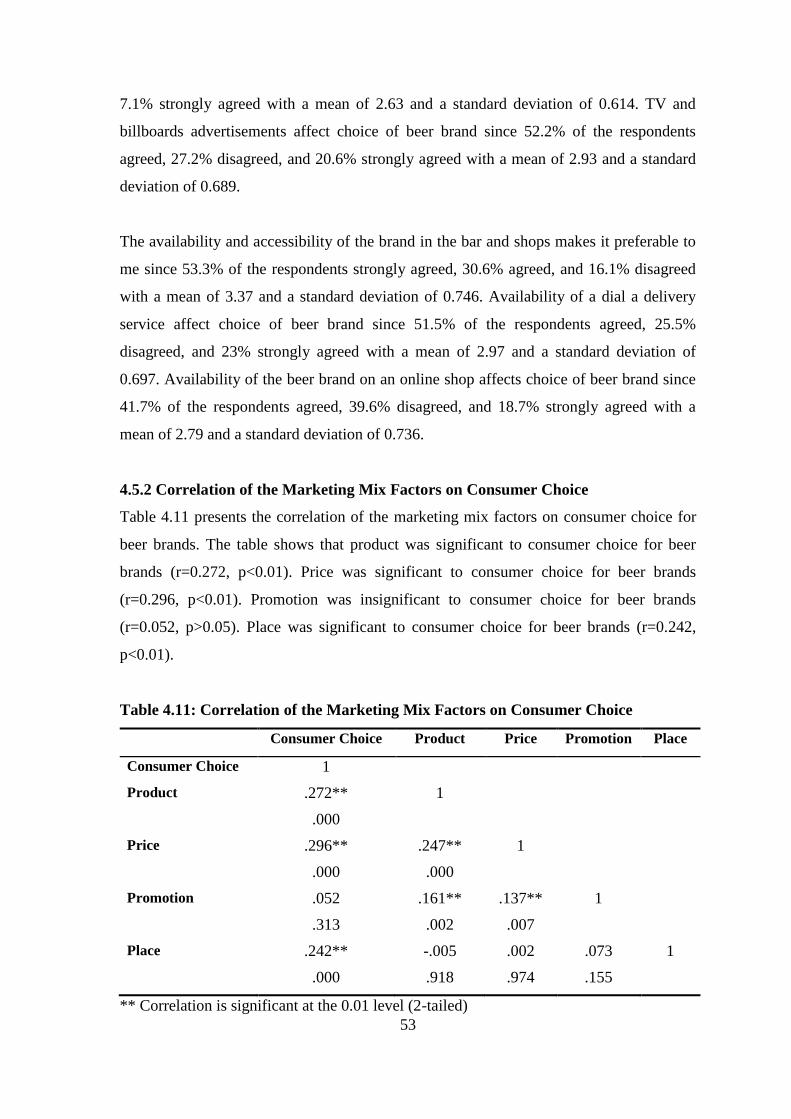
53
7.1% strongly agreed with a mean of 2.63 and a standard deviation of 0.614. TV and
billboards advertisements affect choice of beer brand since 52.2% of the respondents
agreed, 27.2% disagreed, and 20.6% strongly agreed with a mean of 2.93 and a standard
deviation of 0.689.
The availability and accessibility of the brand in the bar and shops makes it preferable to
me since 53.3% of the respondents strongly agreed, 30.6% agreed, and 16.1% disagreed
with a mean of 3.37 and a standard deviation of 0.746. Availability of a dial a delivery
service affect choice of beer brand since 51.5% of the respondents agreed, 25.5%
disagreed, and 23% strongly agreed with a mean of 2.97 and a standard deviation of
0.697. Availability of the beer brand on an online shop affects choice of beer brand since
41.7% of the respondents agreed, 39.6% disagreed, and 18.7% strongly agreed with a
mean of 2.79 and a standard deviation of 0.736.
4.5.2 Correlation of the Marketing Mix Factors on Consumer Choice
Table 4.11 presents the correlation of the marketing mix factors on consumer choice for
beer brands. The table shows that product was significant to consumer choice for beer
brands (r=0.272, p<0.01). Price was significant to consumer choice for beer brands
(r=0.296, p<0.01). Promotion was insignificant to consumer choice for beer brands
(r=0.052, p>0.05). Place was significant to consumer choice for beer brands (r=0.242,
p<0.01).
Table 4.11: Correlation of the Marketing Mix Factors on Consumer Choice
Consumer Choice Product Price Promotion Place
Consumer Choice 1
Product .272**
.000
1
Price .296**
.000
.247**
.000
1
Promotion .052
.313
.161**
.002
.137**
.007
1
Place .242**
.000
-.005
.918
.002
.974
.073
.155
1
** Correlation is significant at the 0.01 level (2-tailed)

54
4.5.3 Regression of the Marketing Mix Factors on Consumer Choice
Table 4.12 presents the regression model summary for marketing mix factors on
consumer choice for beer brands. The table shows that 3 marketing mix factors (product,
price and place) account for 18.2% of the consumer choice.
Table 4.12: Model Summary for Marketing Mix Factors on Consumer Choice
Model R R Square Adjusted R Square Std. Error of the Estimate
1 .435 .189 .182 .27820
a. Predictors: (Constant): Product, Price and Place
Table 4.13 presents the regression coefficient for marketing mix factors on consumer
choice for beer brands. The table shows that product had a positive significant
relationship with consumer choice of beer brand, and every increase in product results in
a 21.6% increase in consumer choice. Price had a positive significant relationship with
consumer choice of beer brand, and every increase in price results in a 19.8% increase in
consumer choice. Place had a positive significant relationship with consumer choice of
beer brand, and every increase in place results in a 13.1% increase in consumer choice.
Table 4.13: Regression Coefficients for Marketing Mix Factors on Consumer Choice
Model
Unstandardized
Coefficients
Standardized
Coefficients
t
Sig
B Std. Error Beta
1 (Constant)
Product
Price
Place
1.507
.216
.198
.131
.167
.049
.039
.025
.214
.243
.243
9.041
4.451
5.057
5.224
.000
.000
.000
.000
a. Dependent Variable: Consumer Choice
4.5.4 Correlations for Factors Influencing Consumer Choice
Table 4.14 presents the correlations for factors influencing consumer choice for beer
brands. The table shows that internal influencers were significant to consumer choice for
beer brands (r=0.584, p<0.01). External influencers were significant to consumer choice
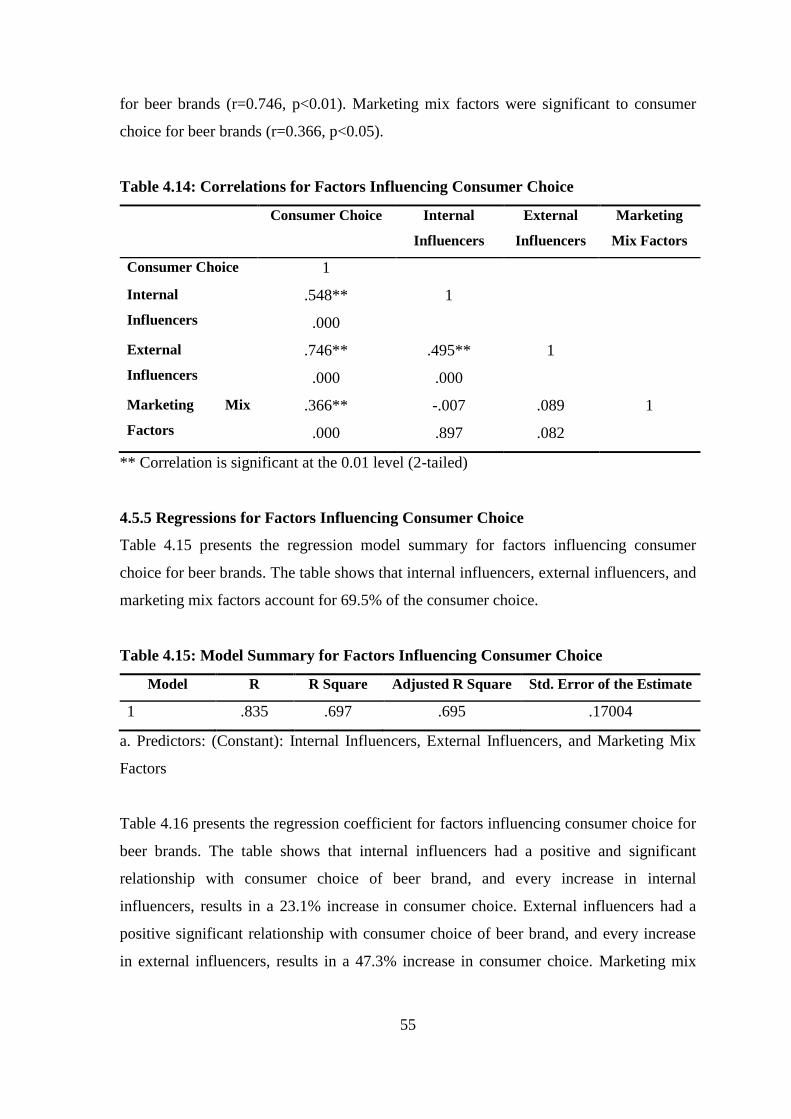
55
for beer brands (r=0.746, p<0.01). Marketing mix factors were significant to consumer
choice for beer brands (r=0.366, p<0.05).
Table 4.14: Correlations for Factors Influencing Consumer Choice
Consumer Choice Internal
Influencers
External
Influencers
Marketing
Mix Factors
Consumer Choice 1
Internal
Influencers
.548**
.000
1
External
Influencers
.746**
.000
.495**
.000
1
Marketing Mix
Factors
.366**
.000
-.007
.897
.089
.082
1
** Correlation is significant at the 0.01 level (2-tailed)
4.5.5 Regressions for Factors Influencing Consumer Choice
Table 4.15 presents the regression model summary for factors influencing consumer
choice for beer brands. The table shows that internal influencers, external influencers, and
marketing mix factors account for 69.5% of the consumer choice.
Table 4.15: Model Summary for Factors Influencing Consumer Choice
Model R R Square Adjusted R Square Std. Error of the Estimate
1 .835 .697 .695 .17004
a. Predictors: (Constant): Internal Influencers, External Influencers, and Marketing Mix
Factors
Table 4.16 presents the regression coefficient for factors influencing consumer choice for
beer brands. The table shows that internal influencers had a positive and significant
relationship with consumer choice of beer brand, and every increase in internal
influencers, results in a 23.1% increase in consumer choice. External influencers had a
positive significant relationship with consumer choice of beer brand, and every increase
in external influencers, results in a 47.3% increase in consumer choice. Marketing mix

56
factors had a positive significant relationship with consumer choice of beer brand, and
every increase in marketing mix factors, results in a 39.8% increase in consumer choice.
Table 4.16: Regression Coefficients for Factors Influencing Consumer Choice
Model
Unstandardized
Coefficients
Standardized
Coefficients
t
Sig
B Std. Error Beta
1 (Constant)
Internal Influencers
External Influencers
Marketing Mix Factors
-.062
.231
.473
.398
.127
.029
.026
.036
.258
.591
.314
-.483
7.858
17.953
10.999
.629
.000
.000
.000
a. Dependent Variable: Consumer Choice
4.6 Chapter Summary
In this chapter the findings and results of the study have been presented. The first section
covered the general information about the respondents regarding gender, salary scale and
level of education. The second section covers how the internal influencers affect the beer
brand choice namely personal factors, psychological factors. The third section covers how
the external influencers affect beer choice namely cultural factors and social factors. The
fourth section presented how a marketing mix factor affects beer brand choice. The next
chapter presents the summary, discussions, conclusions and recommendations for the
study based on the findings and results of the study.
57
CHAPTER FIVE
5.0 DISCUSSION, CONCLUSIONS AND RECOMMENDATIONS
5.1 Introduction
This chapter covers four sections, summary, discussions, conclusion and
recommendations in that order. The first section covers the summary of the major
elements of the study these includes the study objectives, methodology and findings. The
second section covers the discussion of the major areas with respect to the research
objectives. The third section presents the conclusions based on the findings and results
presented in the previous chapter and the fourth section provides recommendations for
further study of the subject.
5.2 Summary
The purpose of this study was to establish the factors that affect choice of beer brands
with a focus on EABL beers. The study was guided by the following objectives, to
determine how the internal influencers affect choice of beer brand, how the external
influencers affect the choice of beer brand and how the market mix factors affect choice
of beer brands.
The study targeted beer consumers in Nairobi County. EABL beer consumers comprise of
about 150,000, according to beershara.co.ke. This was the population from which a
sample size of 399 was selected using the simple random sampling formula. The
sampling technique used was clustering and simple random sampling of beer consumers
across Nairobi, the sampling frame in this study involved the residents of Nairobi who are
consumers of EABL beers. The data collection method used was questionnaires which
employed the 5 Linkert scale in rating of various responses. Collected data was coded and
analyzed using SPSS version 20 to generate the results. Descriptive and inferential
analysis was used the results were presented in tables and figures.
According to the findings of the study most of the respondents feel that internal factors
greatly influence the consumer choice. Most of the respondents think that factors such as
cost of beer, availability of cheaper alternatives, increase income, lifestyle and personality
significantly affect their choice of beer. The findings revealed that income had a negative,
58
but significant relationship with consumer choice of beer brand, and every increase in
income results in a 7.9% decrease in consumer choice due to the inverse relationship.
Lifestyle had a positive significant relationship with consumer choice of beer brand, and
every increase in lifestyle results in a 22% increase in consumer choice. Personality had a
positive significant relationship with consumer choice of beer brand, and every increase
in personality results in a 28.5% increase in consumer choice.
The study also revealed that external influencers had a significant effect on consumer
choice, factors such as culture, religion, social class and family greatly influence
consumer choice. The regression model summary for external influencers of consumer
choice for beer brands showed that (culture, social structure, family, and demography)
account for 57.7% of the consumer choice which is substantial to influencing brand
choice.
According to the findings, culture had a positive significant relationship with consumer
choice of beer brand, and every increase in culture results in a 23.9% increase in
consumer choice. Social structure had a positive significant relationship with consumer
choice of beer brand, and every increase in social structure results in a 12.7% increase in
consumer choice. Family had a positive significant relationship with consumer choice of
beer brand, and every increase in family results in an 11.1% increase in consumer choice.
Demography had a positive significant relationship with consumer choice of beer brand,
and every increase in demography results in an 11.5% increase in consumer choice.
Finally the study also revealed a significant relationship between marketing factors and
choice of beer brand therefore factors such as price, product features, and promotion and
distribution impact heavily in consumer choice of beer brand. The findings revealed the
product features had a positive significant relationship with consumer choice of beer
brand, and every increase in product results in a 21.6% increase in consumer choice. Price
had a positive significant relationship with consumer choice of beer brand, and every
increase in price results in a 19.8% increase in consumer choice. Place had a positive
significant relationship with consumer choice of beer brand, and every increase in place
results in a 13.1% increase in consumer choice.

59
5.3 Discussions
5.3.1 Effects of Internal Influencers on Consumer Choice
The study looked at the following factors when studying internal influencers Age, gender,
income, education level, lifestyle, personality and Learning. The study revealed that there
was a significant relationship between internal influencers and choice of beer brand and
internal factors greatly influenced the choice of beer brand. According to Fernandes and
Solimun (2018), internal consumer influencers hold more potency in terms of affecting
consumerism behavior and trends; the reason for this prospect is that internal consumer
factors resonate more ‘on’ and ‘by’ the consumer as opposed to ‘with’ the consumer or
‘for’ the consumer. As such, it has become widely documented and advanced that internal
consumerism influencers are endo-personal and intra personal. Basically, internal
consumer influencers provide significant premises to elaborate and depict consumer
behavior (Ide & Kazama, 2017).
When age as a factor was evaluated and examined, most of the respondents between ages
26-35 and 36-45 agreed that it was of significantly high importance when it comes to beer
brand choice. For instance, different age groups will prefer different brands and from our
findings as elaborated and shown in figure 4.1, we see the beer brand preference by age
we also see from the results that age is a highly significant variable in this study.
Consumer choice of beer brand and consumption predicates on a dichotomy of some sort;
consumers of advanced age (45+ years) exhibit a lower consumer frequency in terms of
beer taking while consumers of lower age (35 years and below) show higher consumer
frequency. Linehan (2013) appreciates the logic that age is both a retrospective and
prospective consumer behavior influencer. Ideally, consumers of lower ages are more
easily lured and attracted to prospects of consumerisms opposed to elderly consumers.
Kim, Kim, Lee, and Youn (2014) corroborate the position advanced by Linehan (2013) in
that product and consumer preferences stem significantly from age as a consumer
influencer factor.
When we examined gender, our respondents were 60% Male and 40% female as per
random sampling the findings showed that most of the respondents agreed that gender is
of the greatest importance in beer brand selection this is to say that males and females
will select their beer brands according to their gender, refer to figure 4.1, shows the beer
60
preference as per gender. We also note from the results that gender is a highly significant
variable in this study. According to Haleh Keshavarz and Gholamreza (2017), gender
driven consumer trends and behaviors are characteristic in any typical market niche.
Validly, the way female view or draw preference for a product is different from that of
males. Justifiably, based on the study, it is clear that female patrons had different
consumer preferences and behaviors from their male counterparts. Linehan (2013) terms
the disparity in consumerism trends and behaviors based on gender as a ‘dichotomized
continuum’; where on one extreme end of the continuum lies female oriented consumer
preferences and on the other lies male oriented consumer preferences. The difference in
nature of gender oriented consumer preferences explains the disparity between female
and male consumer beer choices or preferences.
We examined education factors we looked at the level of education of our respondents.
Most of our respondents 62% had tertiary education. According to the findings most of
the respondents felt that education level was of moderately high importance in beer brand
selection however according to our analysis level of education had a low perception level
when it comes to beer brand choice. According to Chaudhary and Bisai (2018), consumer
preferences and choices rely substantially on the level of education or knowledge present
to each consumer. Validly, consumers with higher level of education or knowledge tend
to relate to products based on a more elaborate nature; aspects such a brand, quality and
distribution among other consumer influencer factors bear more relevance than otherwise.
Nonetheless, the level of education does not directly translate to consumer choices and
preference of products (Maity, 2010). This explains the low perception level relative to
level of education derived from the study; respondents felt that education level was of
moderately high importance in beer brand selection but low perception level when it
comes to beer brand choice. The denoted logic justifies the position of Rajagopal (2010);
education level does not translate and extrapolate consumerism behaviors or choices but
influences perception of product qualities and prospects.
We examined income most of our respondents were of the income bracket of between
Ksh.10,000 and Ksh.50,000 this variable as found to be highly significant to the study.
We examined the following factors, cost of beer, availability of a cheaper alternative, and
61
increase in income in beer choice. Analysis of cost of beer showed that most of the
respondents agree that cost of beer is of importance to choice of beer brand. This is to say
that the price of the beer will affect customer choice therefore price is an important
attribute to consider. According to Rajagopal (2010), income margins of consumers
denotes their financial potential and capabilities. Relevantly, a critical aspect correlating
to income of consumers is price (Kim, Lee, & Youn, 2014). Consumerism behaviors
exponentially relates with income-price relationships; as the income level of a consumer
increase, he/she prefers products of higher price range up to a certain level where income
does not relate with consumer choice (Ide & Kazama, 2017)..
When we examined availability of cheaper alternative, we found that availability of a
cheaper alternative will affect choice of beer brand, therefore availability of cheaper
substitute products especially of a competing brand may greatly affect the brand. Kim et
al. (2014) confirm that product alternatives or subsidies of a product affect the consumer
choice or behavior. When a subsidy or cheaper alternative of a product exists, consumers
of lower class, lower income and lower age tend to be persuaded to prefer it to expensive
products.
This explains the reason why respondents validated that the availability of a cheaper beer
brand would affect their choice of brand (Pantano, 2011). Logically, this explains why
most of the respondents felt that income change is of a moderately low importance to beer
brand. However, a significant number of respondents also felt that it’s of moderately high
importance and greatest importance choice this is to say that an increase in income may
influence change of brand and also a good number of customers will maintain their brand.
We examined the lifestyle correlation to beer brand choice, most of the respondents agree
that lifestyle has a moderately high importance in beer brand choice, this is to say that
people that carry certain lifestyles high or low my prefer certain brands over others.
According to Siva Kumar and Gunasekaran (2017), lifestyle trends affects consumer
behavior as it avails the prospect of consumer preference of certain products over others.
A consumer from a high lifestyle will tend to prefer beer brands that reflect and exhibit
their lifestyles; this therefore motivates them to consume beer brands associated to their
lifestyle sense and vice versa (Xu, Lin & Shao, 2010).
62
On matters brand image and product quality perception to beer brand choice, most of the
respondents agreed that it’s of moderately high importance. This is to say that quality of
the product affects choice. Figure 1-8 examines the quality perception of the various beer
brands. According to the findings we see that lifestyle and brand image and product
quality are of significance towards choice of beer brands. Markedly, it is well-
documented that brand image and product quality are prime consumer behavior drivers
(Linehan, 2013; Xu et al, 2010; Rajagopal, 2010).
Products associated with a powerful brand image and high quality tend to attract elite
consumers or favor more consumer preferences over products of low quality and weak
brand image. As such, beer patrons will value and prefer beers brands that are of good
and above quality and bear potent brand images over other brands of beer. Albeit the
relevance of brand image and quality prospects, not all consumer groups are affected by
these factors. According to Maity (2010), consumers belonging to low income groups or
classes are not necessarily swayed by aspects of brand image and quality but rather
service provision attained from the product in meeting their needs and wants. Critically,
this aspect explains why other respondents did not view brand image and product quality
as factors that influence their choice of beer.
As a focus of this study, the personality depiction influence towards beer brand choice
was analyzed and evaluated. According to the results, most of the respondents felt that it’s
of moderately high importance which is to say that customers select their beer brands
based on the perceived brand personality and how it resonates with their personality.
According to Maity (2010), consumers associate their preferences and choices to their
personality. As explained in the preceding segments of this discussion, perception of
product relative to personal prospects affects the choice of consumerism habit and
behavior (Pantano, 2011). As such, consumers tend to prefer product brands that they can
relate to on a personality basis; a product that answers the questions, what does this
product say about me? What does this product portray about me? Affects the consumer
choice and preference range (Ide & Kazama, 2017).
We looked at prior drinking experience influence towards beer brand choice. According
to the findings, most of the respondents felt that its of moderately high importance which
63
is to say that customers select their beer brands based on the previous interactions with
the product will determine whether they maintain the brand or not. Linehan (2013)
elaborates that consumer previous experiences with a product has a direct influence on
the preference and choice. As such, if a beer patron had a bad experience with a certain
beer brand, he/she will tend to avoid this brand and choice others over it. Suto et al
(2005) explains the relationship between consumer past experiences and consumerism
behaviors as dependent of each other where the former affects the latter. Evidently, from
the findings, it can be understood and appreciated why respondents validated the
relevance and significance of past experiences as an influencer of beer brand choice.
The study looked at belief in brand superiority influence towards beer brand choice. The
findings justify that brand superiority is of moderately low importance which is to say
that most consumers do not consider brand superiority as much when they select their
beer brands. Brand superiority is a contextual aspect of quality and brand power;
SivaKumar and Gunasekaran (2017) justify that brand superiority is an appeal to
competitors within a market niche but not necessarily an appeal to consumers. Validly,
this explains the reason why respondents rated brand superiority as a consumer behavior
influencer with low importance.
5.3.2 Effects of External Influencers on Consumer Choice
The study revealed that external factors had a bearing in choice of beer brands. The
external factors studied in this case included the following religion, role model influence,
values and beliefs it was evident that values and beliefs had a moderately high importance
towards choice of beer brand, while most of the respondents were in agreement, role
model influence had a more importance towards beer brand choice. Most of the
respondents were in agreement that religion has a moderately low importance to beer
brand choice. Overall, according to the findings under cultural influencers, values and
beliefs had the greatest perception level compared to religion and role model influence.
According to Linehan (2013), external factors are a vital consideration of premises
affecting consumer behavior. Logically, any brand manufacturer or entrepreneur purposes
to advance products that convergent meet the needs, wants and demands of the target
market. Pantano (2011) corroborates the rationale posited by Linehan (2013) in that
64
socio-cultural factors are direct influencers of consumer behavior. Notably, the culture,
religion, values and beliefs oriented to a consumer will in turn have an influence on their
behavior consumerism actions. Typical in most contemporary societies, external factors
of consumer behavior relevance have a close knit tie to the demographics within a
population. Extrapolating the results derived from the study it is possible to find a
seemingly correlated trend between external factors or influencers and consumer behavior
trends (Linehan, 2013; Pantano, 2011; Maity, 2010).
Chaudhary and Bisai (2018) theorize that external factors affecting consumer behavior in
a typical market scope predicate on the socio-cultural foundations present. Relevantly,
this explains the disparity and differences in consumerism behavior relative to external
factor influence. Individuals orient to values, beliefs and cultural prospects differently or
convergent. Those persons sharing a convergent orientation of values, beliefs and cultural
norms tend to exhibit close to similar if not entirely same consumer behavior. Keshavarz
and Gholamreza (2017) postulate and confirm the connection between consumer habits
and behavior to cultural, religious and principle orientation; the influence of these
external factors on consumers is evident in the choices they make. Rationally, some
values, beliefs and socio-cultural prospects tend to constrict the freedom and willingness
of a consumer to purchase a product or brand (Ide & Kazama, 2017).
Another cultural attribute that was studied is social structure the study revealed that social
structure greatly influences beer brand choice the attributes that were studied include
social class influence, celebrity/politician influence, peer influence. The study revealed
that most of the respondents agree that social class has the greatest influence in beer
brand choice. As such, most respondents consider their class level when selecting the
brand of beer, the study also analyzed the peer influence in beer brand selection, the study
revealed that most of the respondents agreed that peer influence is of moderately high
importance towards beer brand selection. According to Kumar and Gunasekaran (2017),
social structure segmentation is an aspect that propagates and influences consumer
behavior. Consumers who belong to the high social class will tend to favor brands or
products that elevate their status or correlates to their status.
65
Basing on the position of Kumar and Gunasekaran (2017) it is possible to understand and
enumerate the consumer behavior trend exhibited by the study population. Rajagopal
(2010) reiterates and shares the same position as the former; social class and structure is a
market and product driver in any typical target population or market niche. Social class
consumerism behaviors correlate to aspects of pricing, quality and brand potency or
power. A Product that has the allure of high quality, brand power and integrally meets the
needs and wants of the target market will tend to be consumed by persons from the high
class society; the opposite of this situation explicitly applies to the lower and middle class
levels.
It is therefore justified and warranted to confirm that consumers from high-class societies
will favor beer brands that are of high quality and have brand potency regardless of the
price tag placed on them. Consumers from lower or middle class levels are restricted to
their fiscal potential and do not necessarily explore brands based on quality and brand
name as their counterparts from high class levels (Suto, Clare, Holland, & Watson, 2005).
The mean and standard deviation of social influencers reveal that social class influences
has the greatest perception level, followed by celebrity influence that had a normal
perception level then followed by peers influence that has high influence. Confirmedly,
social class as an external factor has a significant influence on consumer behavior. Xu,
Lin, and Shao (2010) elaborate that social class stratification depicts the consumerism
behavior and trends of a target market.
Family as an attribute of external influencer was studied and the factors that were studied
include patrons with family responsibilities in beer brand selection, analysis of married
bar patrons in beer brand choice, analysis of respondent family role in beer brand choice.
The study revealed that patrons with family responsibilities had a moderately low
importance in beer brand selection, this is to say family responsibility doesn’t affect
choice of beer significantly, the also study revealed that married bar patrons is of
moderately low importance in beer brand selection this is to say that marital status bears
little or no significance when it comes to beer brand selection.
66
On the part of family role in beer brand choice the study revealed that most of the
respondents felt that its of moderately low importance this is to say that family roles e.g.
bread winner etc does not affect the beer brand choice. According to the findings, all the
mentioned family factors have a low significance to beer brand selection.
D'amico, Di vita, Chinnici, Pappalardo, and Pecorino (2014) explains the insignificance
of family-personal prospects as a consumerism behavior motivator. Ideally, D’amico et al
(2014) appreciates that the family unit is a significant social entity but not a paramount
external influencer of consumer behavior. The findings from the study correlate and
confirm this position; family responsibility does not affect choice of beer significantly,
married bar patrons is of moderately low importance in beer brand selection-this is to say
that marital status bears little or no significance when it comes to beer brand selection.
Drawing from this justification it is clear that while there are several external factors
affecting consumer behavior and choice of consumerism, not all external prospects are of
significant influence.
5.3.3 Effects of Marketing Mix Factors on Consumer Choice
During analysis of product features we examined the following features, packaging,
quality and alcoholic percentage of the beer. According to the findings most of the
respondents agree that packaging aspects influences their choice of beer. Kim, Kim, Lee,
and Youn (2014), posit that marketing strategies used and reverted to different product
brands has a direct influence on the consumer preference and choice. The marketing mix
adopted and applied in the value chain of any product depicts the level of consumer
approval and appreciation associated to a brand (Fernandes & Solimun, 2018). Therefore,
product attributes like colors, shape of the bottle contribute to beer brand choice. During
analysis of quality aspects the findings show that most of the respondents disagree that
quality aspects influences their choice of beer. Therefore product quality doesn’t affect
choice of beer brand greatly for most of the respondents. According to Fernandes and
Solimun (2018), marketing considerations taken into perspective by consumers do not
necessarily align with those of the manufacturers. As such, whereas to the manufacturer
or brand, aspects like quality and attributes might make more relevance, consumer
preferences and behaviors do not predicate on these prospects.

67
When examining alcoholic percentage the findings show that most of the respondents
agree that alcoholic percentage influences their choice of beer. We saw from the
respondents that they preferred beers with higher alcoholic content. Maity (2010)
acknowledges that consumerism behavior correlates to how a product meets the needs
and wants of a consumer. In particular, beer patrons are in search of a product that will
meet their alcohol urge; this explains why respondents validated alcohol percentage as a
factor that influences tier brand choice (Rajagopal, 2010).
We studied pricing factors we examined the following features, price range, availability
of discounts offers and availability of a cheaper product. According to the findings most
of the respondents agree that the product price range influences their choice of beer.
Therefore product attributes like the price of the product is considered during beer brand
choice. During analysis of availability of discounts the findings show that most of the
respondents agree that discounts and offers influences their choice of beer. Therefore,
discounts can shift preference of brand affect choice of beer brand greatly for most of the
respondents (Fernandes & Solimun, 2018).
When examining availability of a cheaper product the findings show that most of the
respondents disagree that availability of a cheaper product influences their choice of beer.
Therefore a cheaper beer range doesn’t greatly affect beer brand choice. When a subsidy
or cheaper alternative of a product exists, consumers of lower class, lower income and
lower age tend to be persuaded to prefer it to expensive products. This explains the reason
why respondents validated that the availability of a cheaper beer brand would affect their
choice of brand (Pantano, 2011). Logically, this explains why most of the respondents felt
that income change is of a moderately low importance to beer brand. However, a
significant number of respondents also felt that it’s of moderately high importance and
greatest importance choice this is to say that an increase in income may influence change
of brand and also a good number of customers will maintain their brand.
We studied promotion factors we examined the following features, activations, brand
awareness via social media and TV and billboards advertisement. According to the
findings most of the respondents agree that the promotion and direct selling influences
their choice of beer. Therefore promotional effort and direct selling affects beer brand
68
choice. During analysis of social media awareness, the findings show that most of the
respondents agree that it influences their choice of beer. Therefore constant awareness
effort directly or via social media keeps that brand top of mind.
According to Maity (2010), creating brand awareness through promotion prospects as
marketing strategies helps lure consumers; consumer choices are therefore dependent on
the level of awareness and promotion associated to a brand or product. When examining
the findings of the study, based on TV and Billboards advertisements, most of the
respondents agree that above the line promotion influences their choice of beer.
Therefore, brand awareness affects decisions when it comes to beer brand choice.
We studied distribution factors we examined the following features, accessibility of the
brand, availability of dial a delivery service and availability of the beer brand on an online
shop. According to the findings most of the respondents strongly agree that availability
and accessibility of the beer brand influences their choice of beer. Therefore product
accessibility is considered during beer brand choice decision. During analysis of
availability of dial and delivery service that most of the respondents agree that it
influences their choice of beer. Therefore a delivery service can shift preference of brand
affect choice of beer brand greatly for most of the respondents (Fernandes & Solimun,
2018; Maity, 2010).
When examining availability of the beer brand on an online shop, the findings show that
most of the respondents agree that it influences their choice of beer. This is to say that
online presence is important for brand influence and choice. According to Siva Kumar
and Gunasekaran (2017), creation of an online market platform is a way of increasing and
diversifying distribution and availability of products. As such, beer brands with an online
shop are practicing a marketing strategy that increases availability and distribution of the
beer brand; the increase in availability and distribution of a product influences consumer
preference and choice.
69
5.4 Conclusion
5.4.1 Effects of Internal Influencers on Consumer Choice
The study concluded that there is a positive significant relationship between internal
factors and beer brand choice factors such as income, age and gender showed a greater
significance to beer choice, personality, learning, lifestyle and perception showed a
positive significance to influencing beer choice, however a certain element of perception
regarding brand superiority that had a low significance to influencing beer brand choice,
also country of origin carried a great significance to choice of beer, level of education
showed a low significance to beer choice.
5.4.2 Effects of External Influencers on Consumer Choice
The purpose of this study was to assess factors affecting beer brand choice, the following
at the conclusions made based on the findings and discussions. The study concluded that
there is a positive significance relationship between the external factors and beer brand
choice however factors within external influencers such as religion showed that there is
little or no significance to beer brand choice, factors such as beliefs and values and role
model influence have a greater significance on beer choice. Social factors such as social
class, celebrity influence and peer influence, the study has shown to have a significant
relationship to beer brand choice. A look at family factors the study shows that there is
little or low significance to beer brand choice therefore marital status or family roles have
little or no bearing in the choice of beer brand.
5.4.3 Effects of Marketing Mix Factors on Consumer Choice
A look at the product factors the study showed that packaging and alcoholic percentages
showed a positive influence towards beer brand choice, however product quality retained
a low significance to beer brand choice. A look at the findings of pricing factors products
price range and availability of offers and discounts had a significant relationship with
choice of beer brand. While availability of a cheaper product did not affect the choice of
beer significantly. A look at promotion the elements such as direct selling, social media
and above the line promotions show a significant positive relationship to beer brand
choice. A closer look at distribution reveals that accessing the product physically bears

70
the greatest significance to choice of beer. Availability of a dial and delivery service and
an online shop also have a bearing on beer choice.
5.5 Recommendations
5.5.1 Recommendations for Improvement
5.5.1.1 Effects of Internal Influencers on Consumer Choice
Cultural Influencers in light of the findings we recommend that EABL should allocate
appropriate influencers for their marketing campaigns as this affects greatly the
perception of the beer brand and therefore choice. The age, gender and lifestyle factors
should be considered while considering the appropriate influencer, these factors also
come handy when selecting the product aspects such a color and shape of packaging as
well as promotional messaging and platforms.
5.5.1.2 Effects of External Influencers on Consumer Choice
EABL should focus on packaging aspects for its beers for different target markets as it
affects beer choice. Alcoholic percentage should be considered while targeting different
market segments. As regards brand superiority, it is recommend that EABL highlight the
unique attributes of each individual beer brand rather than superiority as in light of the
findings brand superiority has little or no effect on choice of beer.
5.5.1.3 Effects of Marketing Mix Factors on Consumer Choice
It is recommended that EABL prices its products appropriately as per its target market as
this affects their choice. In light of the findings, they should also watch out for cheaper
alternatives within their beer brand collection and also competing brands as this may
cannibalize their own products or lose out to competitions products that bear the same
attributes but are cheaper in price.
71
5.5.2 Recommendations for Further Studies
This study was conducted in Nairobi and focused on internal and external influencers as
well as the marketing mix factors. The study therefore recommends that for more
visibility of promotional activities for the target market that significantly influence choice
of beer brand in Kenya be carried out in Nairobi as well as around the country. Notably,
the findings from this study form the basis of further study on the same field. It is
reasonable to validate and justify the advanced recommendations.
72
REFERENCES
Ali, M. J. (2014). Factors Influencing Marketing of Alcoholic Beverages in Kenya: A
Case Study of East African Breweries. European Journal of Business and Social
Sciences, 3(2), 122-153.
Ates, H. C. & Ceylan, M. (2010). Effects of socio-economic factors on the consumption
of milk, yoghurt, and cheese: Insights from Turkey. British Food Journal,
112(3), 234-250.
Babin, B. J., Darden, W. R. & Griffin, M. (1994). Work and/or fun: Measuring hedonic
and utilitarian shopping value. Journal of Consumer Research, 20 (3), 644-654.
Barbopoulos, I. & Johansson, L. O. (2016). A multi-dimensional approach to consumer
motivation: exploring economic, hedonic, and normative consumption goals.
Journal of Consumer Marketing, 33 (1), 75-84.
Betts, E. J. & York, P. J. (1994). Consumer Behavior and the Retail Sales – Modelling the
Development of an Attitude Problem. European Journal of Marketing, 30(8), 40-
58.
Brewers Association. (1992). Consumer Choice and Preference. [Online] Available
online: www.brewersassociation.org (Accessed, 04/04/2018).
Bryman, A. & Bell, E. (2003). Business Research Methods. Oxford, OX: Oxford
University Press.
Chaudhary, R. & Bisai, S. (2018). Factors influencing green purchase behavior of
millennials in India. Sourced from http://www.emeraldinsight.com (Accessed
12/05/2018).
Childersa, T. L., Carrb, C. L., Peck, J. & Carson, S. (2001). Hedonic and utilitarian
motivations for online retail shopping behavior. Journal of Retailing, 77, 511-535.
Coleman, R. P. (1983). The Continuing Significance of Social Class to Marketing.
Journal of Consumer Research, 10(3), 265-280.
Creusen, E. H. (2010). The importance of product aspects in choice: the influence of
demographic characteristics. Journal of Consumer Marketing, 27, 26-34.
Csikszentmihalyi, M. & Rochberg-Halton, E. (1981). The Meaning of Things: Domestic
Symbols and the Self. Cambridge, UK: Cambridge University Press.
73
D'amico, M. & Pecorino, B. (2014). Private vs Collective Wine Reputation. Italian
Journal of Food Science, 26(3), 329-334.
Dawes, R. B. & Messick, D. M. (2000). Social Dilemmas. International Journal of
Psychology, 35(2), 111-116.
De Mooij, M. (2004). Consumer Behavior and Culture. California, CA: Thousand Oaks.
Diekmann, A. & Preisendörfer, P. (2003). Green and Greenback: The Behavioral Effects
of Environmental Attitudes in Low-Cost and High-Cost Situations. Rationality
and Society, 15(4), 441-472.
Eaglesham, C. (1990). Consumer Preferences for Food Irradiation: How Favorable and
Unfavorable Descriptions Affect Preferences. Journal of Risk and Uncertainty,
24(1), 75-95.
Earlier, S., Shawyer, P., Gebhardt, G. F., Carpenter, G. S. & Sherry, J. F. (2002). Creating
a Market Orientation: A Longitudinal, Multi-firm, Grounded Analysis of Cultural
Transformation. Journal of Marketing, 70(4), 37-55.
Fernandes, A. R. & Solimun, S. (2018). Journal of Management Development, 37(1),
76-87.
Frey, B. S. & Jegen, R. (2001). Motivation Crowding Theory. Journal of Economic
Surveys, 15(5), 489-611.
Gale, B. T. (1996). Managing Customer Value: Creating Quality and Service that
Customers Can See. New York, NY: The Free Press.
Grossman, R. P. & Wisenblit J. Z. (1999). What we know about consumers’ color
choices. Journal of Marketing Practice, 5(3), 78-90.
Hagan, F.E. (2000). Research methods in criminal justice and criminology. (5th Ed.).
London, UK: Boston Allyn and Bacon.
Haleh, K. A. & Gholamreza, S. (2017). Identifying and prioritizing factors affecting the
Customers' willingness to buy Goods product inside than the outside. Independent
Journal of Management & Production, 1147-1164.
Hardley, F. (2002). Buyer beliefs, attitudes and behavior foods with therapeutic claims.
Journal of Consumer Marketing, 19(7), 591-606.
Hasty, R. & Reardon, J. (1997). Retail management. New York, NY: McGraw-Hill
Company Inc.
74
Henry, S. (2002). Customer Satisfaction and Its Importance for Long-Term Relationships
with Service Provider: The Case of Odontology Services. Engineering of
Economics, 5(55), 59-67.
Hillery, P., Alcauter, S., Jakpar, S., Na, A. G., Cervantes, J. & Barrios, F. (1997). Better
branding. Journal of Product & Brand Management, 22(4), 300-308.
Holt, S. M. (1998). Factors Affecting Customer Satisfaction. International Journal of
Advanced Research in Computer Science and Software Engineering, 3(5), 28-42.
Howland, O. F. (2016). Drinking, despair and the state and ethnography of a brewing
subculture in rural Kenya. Sourced from https://researchonline.ljmu.ac.uk.
(Accessed 12/05/2018).
Hsieh, A., Ide, Y., Fornell, C., Rust, R. T. & Kazama, K. (2004). Effect of Brands on
Consumer's Buying Behaviors of Clothes: Some factors affecting the reason why
working women want the famous brand of bags. Journal research association for
textile end uses, 3(4), 16-23.
Ide, Y. & Kazama, K. (2017). Effect of Brands on Consumer's Buying Behaviors of
Clothes (Part 2): Some factors affecting the reason why working women want the
famous brand of bags. Journal-Japan research association for textile end uses,
3(4), 16-23.
Ivy, J. (2008). A new higher education marketing mix: the 7Ps for MBA marketing.
International Journal of Educational Management, 22(4), 288-299.
Jonathan, H. A. (2008). Identifying and prioritizing factors affecting the customers'
willingness to buy goods product inside than on the outside. Independent Journal of
Management & Production, 8(3), 1147-1164.
Kim, K., Kim, Y., Lee, M. & Youn, M. (2014).The effects of co-brand marketing mix
strategies on customer satisfaction, trust and loyalty for medium and small traders
and manufacturers. Journal of Management, 140-152.
Kopetz, S. A. (2007). An Empirical Study on the Factors Affecting Online Shopping
Behavior of Millennial Consumers. Journal of Internet Commerce, 219-227.
Kotler, P. & Keller, K. (2012). Marketing Management. Upper Saddle River, NJ: Prentice
Hall.
Kotler, P. & Keller, K. (2013). Marketing for hospitality and tourism. Upper Saddle
River, NJ: Pearson Education.
Kotler, P. (2001). Principles of Marketing. Upper Saddle River, NJ: Pearson Education.
75
Kotler, P. (2012). Marketing Management. (11th Ed.). Upper Saddle River, NJ: Pearson
Education.
LeMay, M. (2017). Product Management in Practice: A Real-World Guide to the Key
Connective Role of the 21st Century. Beijing, CH: O'Reilly Media.
Lewison, D. M. & DeLozier, M. W. (1982). Retailing. (2nd Ed.). Princeton, NC: Merrill
Publishing Company.
Lindenberg, S. & Steg, L. (2007). Normative, Gain and Hedonic Goal Frames Guiding
Environmental Behavior. Journal of Social Issues, 63(1), 117-137.
Linehan, M. (2013). Consumer Behavior Irish Patterns and Perspective. Park West,
DUB: Gill Books.
Madden, T. J., Hewett K. & Roth, M. S. (2000). Managing Images in Different Cultures:
A Cross-National Study of Color Meanings and Preferences. Journal of
International Marketing, 8(4), 90-107.
Maity, M. (2010). ). Critical Factors of Consumer Decision-Making on M-Commerce: A
Qualitative Study in the United States. International Journal of Mobile Marketing,
87-101.
Mariëlle, C. M. (2010). The different roles of product appearance in consumer choice.
Journal of Product Innovation Management, 22, 63‐81.
McCarthy, J. (1999). Pre-identification of first buyers of a new food product. British
Food Journal, 101(11), 842-856.
Menely, A., Malone, T. & Lusk, J. L. (2009). Studying Consumption Behavior through
Multiple Lenses: An Overview of Consumer Culture Theory. Anthropologica,
46(2), 165-173.
Mwangulu, J. A. (2014). Factors influencing marketing of alcoholic beverages in Kenya:
A case of East African Breweries EABL. European Journal of Business and
Social Sciences, 122-153.
Nunnally, J. C. (1978). Psychometric theory. (2nd Ed.). New York, NY: McGraw-Hill.
Oliver, S. (1995). Marketing: The Bright Side of Gray Markets. Harvard Business
Review, 76(5), 19-22.
Pantano, E. (2011). Cultural factors affecting consumer behavior: a new perception
model. Euromed journal of business, 117-125.

76
Panton, T. (2000). Does methodology matter in eyewitness identification research: the
effect of live versus video exposure on eyewitness identification accuracy?
International Journal of Law and Psychiatry, 31(5), 430-447.
Pohjanheimo, T., Piha, S., Anu, L. & Otterbring, T. (2010). The effects of consumer
knowledge on the willingness to buy beer: An exploratory cross-regional study in
Northern and Central Europe. Food Quality and Preference, 4(1), 68-81.
Rajagopal, S. (2010). Consumer Behavior Global Shifts and Local Effects. New York,
NY: Nova Science Publishers, Inc.
Ramanu, P. S. (1996). Optimum stimulation level: Its relationship to personality,
demographics, and exploratory behavior. Journal of Consumer Research, 7(3),
272-282.
Randall, D. (1991). The link between involvement, use innovativeness and product usage.
Advances in Consumer Research, 16, 160-166.
Saba, T., Levy, S., Quester, P. G. & Smart, J. (2008). The influence of consumption
situation and product involvement over consumers’ use of product attributes.
Journal of Consumer Marketing, 15(3), 220-238.
Saunders, M., Lewis, P. & Thornhill, A. (2007). Research Methods for Business Students.
(4th Ed.). Edinburgh Gate, UK: Financial Times Prentice Hall.
Silayoi, P. & Speece, M. (2004). Packaging and purchase decisions: An exploratory study
on the impact of involvement level and time pressure. British Food Journal,
106(8), 607-628.
Singh, S. & Sarma, S. (2015). Cases on Branding Strategies and Product Development:
Successes and Pitfalls. Hershey, PA: Business Science Reference.
Siva K. A. & Gunasekaran, A. (2017). An Empirical Study on the Factors Affecting
Online Shopping Behavior of Millennial Consumers. Journal of Internet
Commerce, 2(3), 219-241.
Slinky, A. & Singh, P. (2016). Research Methodology: A Step-by-Step Guide for
Beginners. (3rd Ed.). SAGE Publications Ltd.
Solanki, R. S. & Singh, H. P. (2016). Some Classes of Estimators for Median Estimation
in Survey Sampling. Communications in Statistics theory & Methods, 2056-2070.
Steg, R.L. (2005). Predictors of beer advertising awareness among eighth graders.
Addiction, 98, 1297-1306.
77
Suto, W. I., Clare, I. H., Holland, A. J. & Watson, P. C. (2005). The relationships among
three factors affecting the financial decision-making abilities of adults with mild
intellectual disabilities. Journal of Intellectual Disability Research, 210-217.
Suzi, E. F., Rosilene, M. S., Vinicius, M. & Giuliana, I. (2014). Effects of Strategies
Marketing of Collective Buying about Impulsive Behavior. Remark. Revista
Brasileira De Marketing, 138-151.
Swift, C. T. (2010). Importance-performance analysis and the measurement of service
quality. European Journal of Marketing, 27(2), 59-70.
The Monitor. (2011). Trends in initiation of alcohol use in the United States 2005 to
2010. Alcoholism: Clinical and Experimental Research, 30(6), 1011-1022.
Underwood, S., Green, C. A., Perrin, N. A. & Polen, M. R. (2001). Gender differences in
the relationships between multiple measures of alcohol consumption and physical
and mental health. Alcoholism: Clinical and Experimental Research, 28, 754-764.
Wallendorf, R. E. & Arnould, M. (1988). Alcohol outcome expectancies, attitudes toward
drinking and the theory of planned behavior. Journal of Studies on Alcohol, 59(4),
409-419.
Waweru, N. M. & Mwendwa, J. (2012). Stock splits and their effect on share prices: a
study of firms listed on the Nairobi stock exchange (NSE). Academy Of
Accounting & Financial Studies Journal, 77-96.
Williams, V. J. (2002). A diary approach to analyzing young adults’ drinking events and
motivations. Australian Drug and Alcohol Review, 5, 3-7.
Yamane, T. (1973). Statistics: An Introductory Analysis. (3rd Ed.). New York, NY:
Harper and Row.

78
APPENDICES
APPENDIX I: COVER LETTER
United States International University – Africa,
P. O. Box 14634 – 00800,
Nairobi – Kenya.
Dear Respondent,
REF: REQUEST TO PARTICIPATE IN THE RESEARCH STUDY.
I am a student at the above mentioned institution, and I am pursing a Master’s Degree. As
part of my requirement to graduate, I am supposed to carry out a study on the factors
influencing consumer choice of beer brand in Kenya. My case study is patrons of East
African Breweries.
As observed, you have been selected as a case study and I will appreciate if you divulge
the required information that will assist me to complete the study. The attached
questionnaire has been created to facilitate my ability to collect data on the same.
The responses that you give will be used for academic purposes only and confidentiality
will be assured. Thank you in advance.
Regards,
Dorothy A. Otieno.
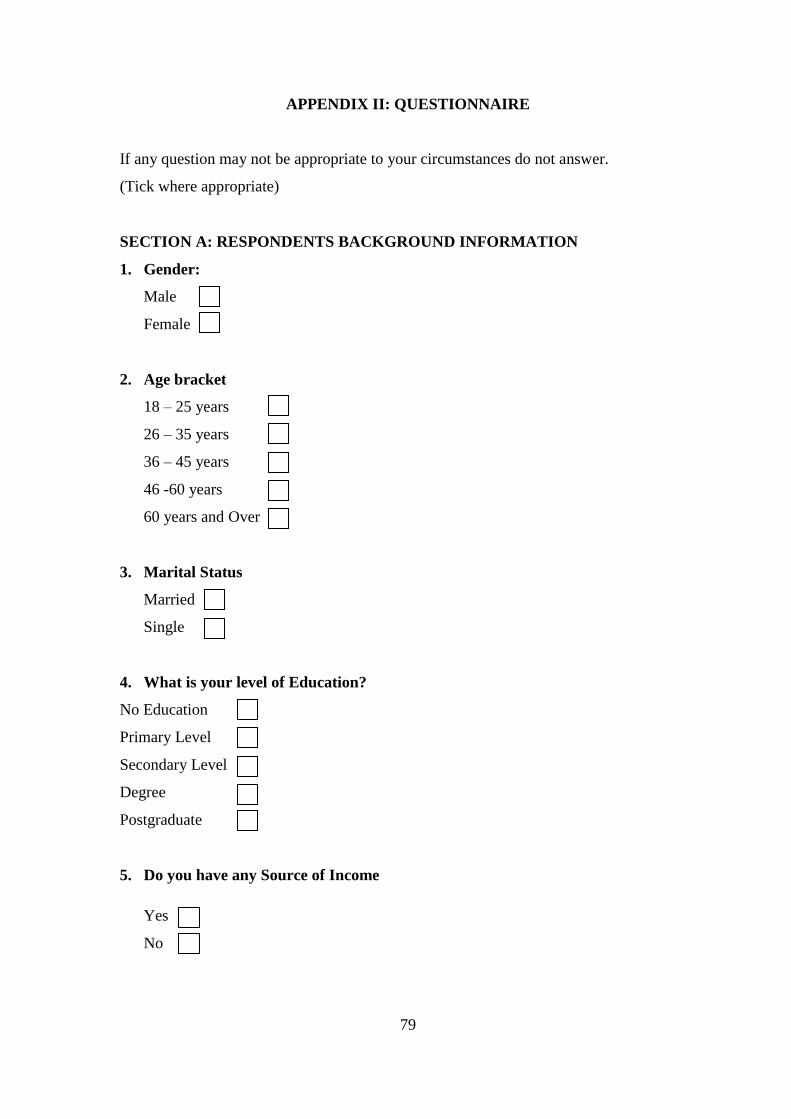
79
APPENDIX II: QUESTIONNAIRE
If any question may not be appropriate to your circumstances do not answer.
(Tick where appropriate)
SECTION A: RESPONDENTS BACKGROUND INFORMATION
1. Gender:
Male
Female
2. Age bracket
18 – 25 years
26 – 35 years
36 – 45 years
46 -60 years
60 years and Over
3. Marital Status
Married
Single
4. What is your level of Education?
No Education
Primary Level
Secondary Level
Degree
Postgraduate
5. Do you have any Source of Income
Yes
No
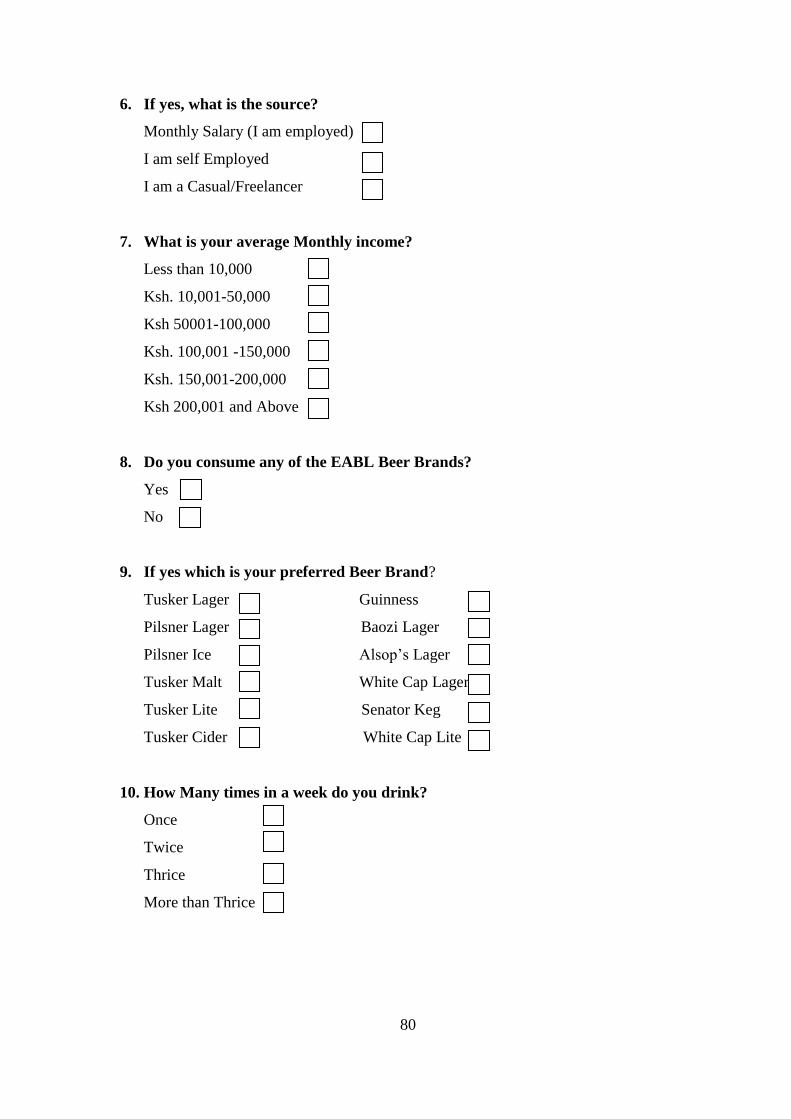
80
6. If yes, what is the source?
Monthly Salary (I am employed)
I am self Employed
I am a Casual/Freelancer
7. What is your average Monthly income?
Less than 10,000
Ksh. 10,001-50,000
Ksh 50001-100,000
Ksh. 100,001 -150,000
Ksh. 150,001-200,000
Ksh 200,001 and Above
8. Do you consume any of the EABL Beer Brands?
Yes
No
9. If yes which is your preferred Beer Brand?
Tusker Lager Guinness
Pilsner Lager Baozi Lager
Pilsner Ice Alsop’s Lager
Tusker Malt White Cap Lager
Tusker Lite Senator Keg
Tusker Cider White Cap Lite
10. How Many times in a week do you drink?
Once
Twice
Thrice
More than Thrice
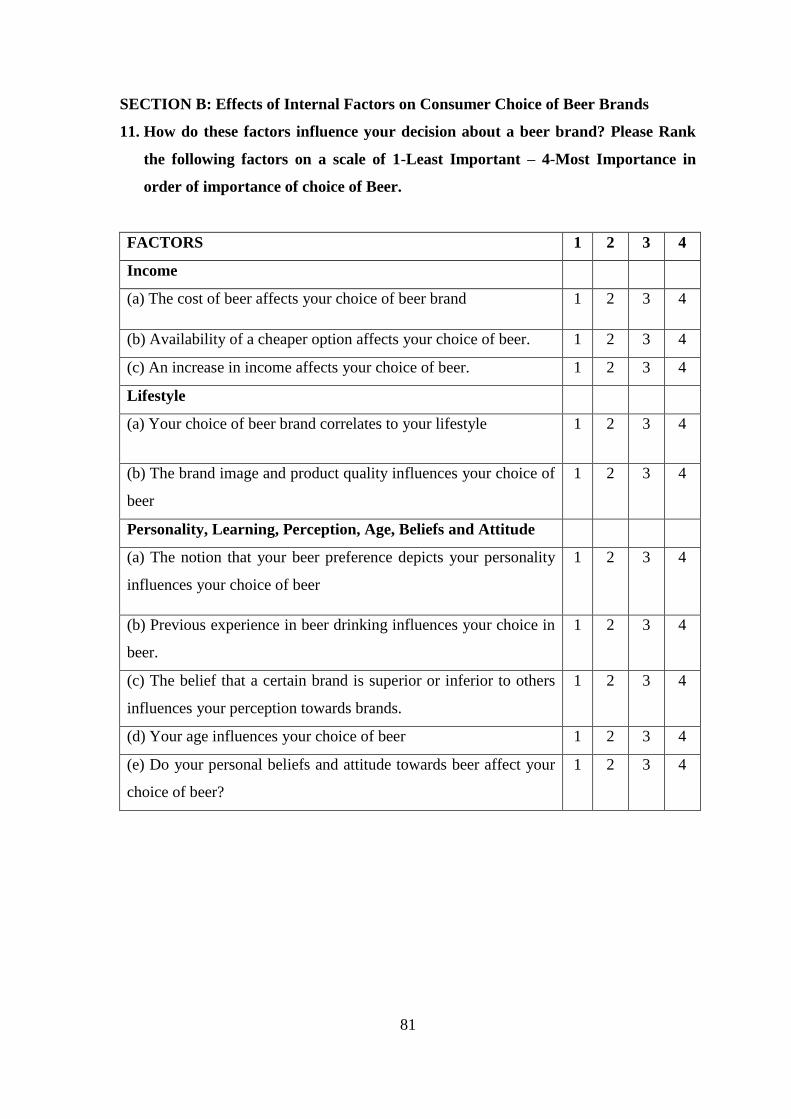
81
SECTION B: Effects of Internal Factors on Consumer Choice of Beer Brands
11. How do these factors influence your decision about a beer brand? Please Rank
the following factors on a scale of 1-Least Important – 4-Most Importance in
order of importance of choice of Beer.
FACTORS 1 2 3 4
Income
(a) The cost of beer affects your choice of beer brand 1 2 3 4
(b) Availability of a cheaper option affects your choice of beer. 1 2 3 4
(c) An increase in income affects your choice of beer. 1 2 3 4
Lifestyle
(a) Your choice of beer brand correlates to your lifestyle 1 2 3 4
(b) The brand image and product quality influences your choice of
beer
1 2 3 4
Personality, Learning, Perception, Age, Beliefs and Attitude
(a) The notion that your beer preference depicts your personality
influences your choice of beer
1 2 3 4
(b) Previous experience in beer drinking influences your choice in
beer.
1 2 3 4
(c) The belief that a certain brand is superior or inferior to others
influences your perception towards brands.
1 2 3 4
(d) Your age influences your choice of beer 1 2 3 4
(e) Do your personal beliefs and attitude towards beer affect your
choice of beer?
1 2 3 4
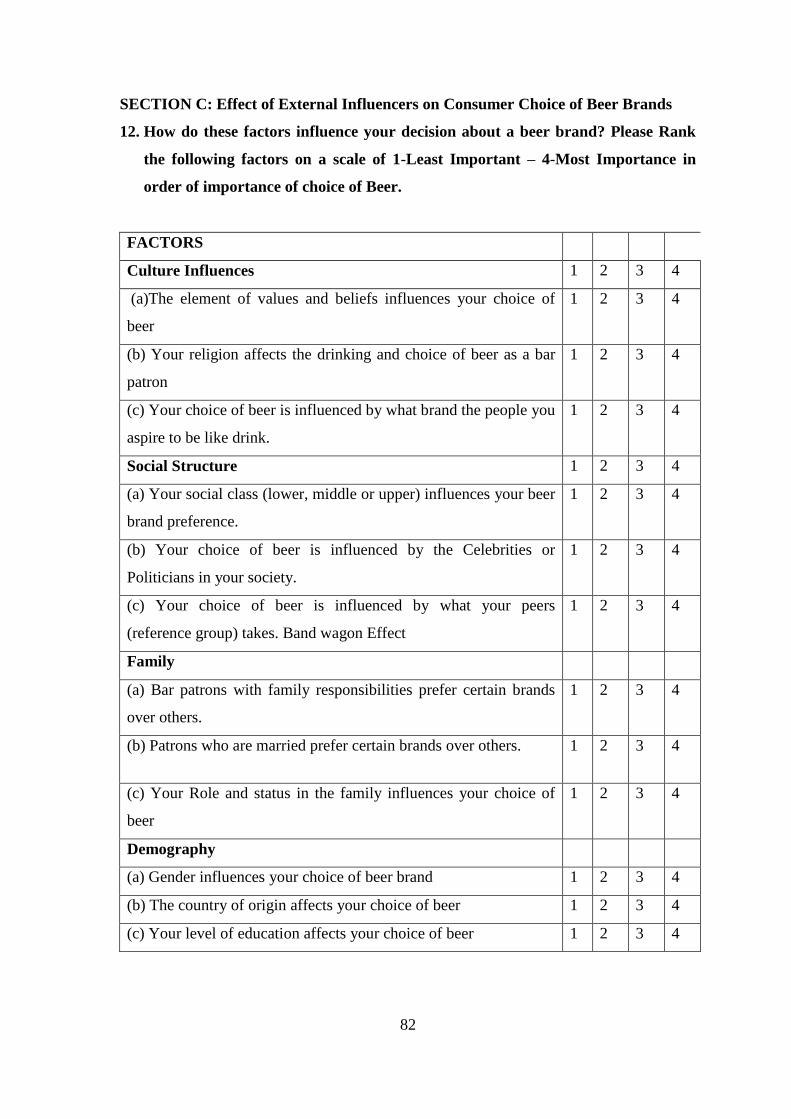
82
SECTION C: Effect of External Influencers on Consumer Choice of Beer Brands
12. How do these factors influence your decision about a beer brand? Please Rank
the following factors on a scale of 1-Least Important – 4-Most Importance in
order of importance of choice of Beer.
FACTORS
Culture Influences 1 2 3 4
(a)The element of values and beliefs influences your choice of
beer
1 2 3 4
(b) Your religion affects the drinking and choice of beer as a bar
patron
1 2 3 4
(c) Your choice of beer is influenced by what brand the people you
aspire to be like drink.
1 2 3 4
Social Structure 1 2 3 4
(a) Your social class (lower, middle or upper) influences your beer
brand preference.
1 2 3 4
(b) Your choice of beer is influenced by the Celebrities or
Politicians in your society.
1 2 3 4
(c) Your choice of beer is influenced by what your peers
(reference group) takes. Band wagon Effect
1 2 3 4
Family
(a) Bar patrons with family responsibilities prefer certain brands
over others.
1 2 3 4
(b) Patrons who are married prefer certain brands over others. 1 2 3 4
(c) Your Role and status in the family influences your choice of
beer
1 2 3 4
Demography
(a) Gender influences your choice of beer brand 1 2 3 4
(b) The country of origin affects your choice of beer 1 2 3 4
(c) Your level of education affects your choice of beer 1 2 3 4
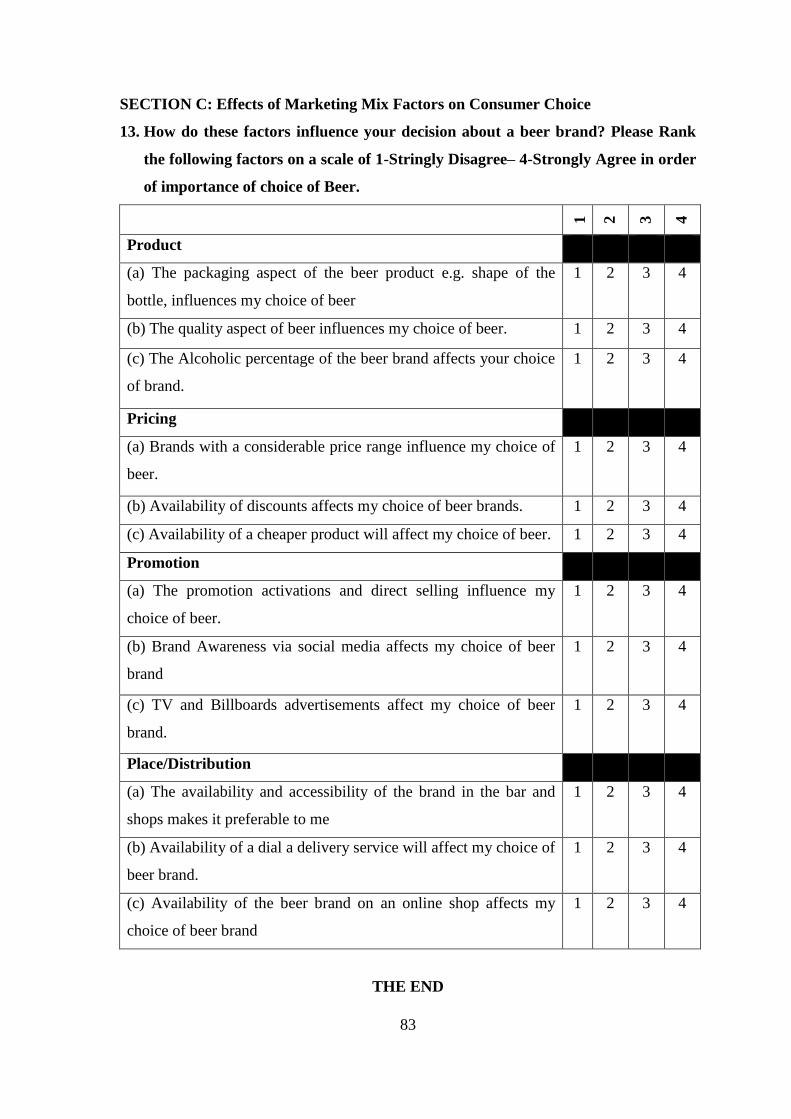
83
SECTION C: Effects of Marketing Mix Factors on Consumer Choice
13. How do these factors influence your decision about a beer brand? Please Rank
the following factors on a scale of 1-Stringly Disagree– 4-Strongly Agree in order
of importance of choice of Beer.
1
2
3
4
Product
(a) The packaging aspect of the beer product e.g. shape of the
bottle, influences my choice of beer
1 2 3 4
(b) The quality aspect of beer influences my choice of beer. 1 2 3 4
(c) The Alcoholic percentage of the beer brand affects your choice
of brand.
1 2 3 4
Pricing
(a) Brands with a considerable price range influence my choice of
beer.
1 2 3 4
(b) Availability of discounts affects my choice of beer brands. 1 2 3 4
(c) Availability of a cheaper product will affect my choice of beer. 1 2 3 4
Promotion
(a) The promotion activations and direct selling influence my
choice of beer.
1 2 3 4
(b) Brand Awareness via social media affects my choice of beer
brand
1 2 3 4
(c) TV and Billboards advertisements affect my choice of beer
brand.
1 2 3 4
Place/Distribution
(a) The availability and accessibility of the brand in the bar and
shops makes it preferable to me
1 2 3 4
(b) Availability of a dial a delivery service will affect my choice of
beer brand.
1 2 3 4
(c) Availability of the beer brand on an online shop affects my
choice of beer brand
1 2 3 4
THE END