by derek headey & shenggen fan - international food policy
TRANSCRIPT

By Derek Headey & Shenggen Fan
Reflections on the
Global Food Crisis
How has it hurt?
How did it happen?
And how can we prevent the next one?

About IFPRIThe International Food Policy Research Institute (IFPRI®) was established in 1975 to identify and analyze alternative national and international strategies and policies for meeting food needs of the developing world on a sustainable basis, with particular emphasis on low-income countries and on the poorer groups in those countries. While the research effort is geared to the precise objective of contributing to the reduction of hunger and malnutrition, the factors involved are many and wide-ranging, requiring analysis of underlying processes and extending beyond a narrowly defined food sector. The Insti-tute’s research program reflects worldwide collaboration with governments and private and public institutions interested in increasing food produc-tion and improving the equity of its distribution. Research results are dis-seminated to policymakers, opinion formers, administrators, policy analysts, researchers, and others concerned with national and international food and agricultural policy.
About IFPRI Research MonographsIFPRI Research Monographs are well-focused, policy-relevant monographs based on original and innovative research conducted at IFPRI. All manuscripts submitted for publication as IFPRI Research Monographs undergo extensive external and internal reviews. Prior to submission to the Publications Review Committee, each manuscript is circulated informally among the author’s colleagues. Upon submission to the Committee, the manuscript is reviewed by an IFPRI reviewer and presented in a formal seminar. Three additional reviewers—at least two external to IFPRI and one from the Committee—are selected to review the manuscript. Reviewers are chosen for their familiarity with the country setting. The Committee provides the author its reaction to the reviewers’ comments. After revising as necessary, the author resubmits the manuscript to the Committee with a written response to the reviewers’ and Committee’s comments. The Committee then makes its recommenda-tions on publication of the manuscript to the Director General of IFPRI. With the Director General’s approval, the manuscript becomes part of the IFPRI Research Monograph series. The publication series, under the original name ofIFPRI Research Reports, began in 1977.


Reflections on the Global Food CrisisHow Did It Happen? How Has It Hurt? And How Can We Prevent the Next One?
Derek Headey and Shenggen Fan
RESEARCHMONOGRAPH 165

Copyright © 2010 International Food Policy Research Institute. All rights reserved. Sections of this material may be reproduced for personal and not-for-profit use without the express written permission of but with acknowledgment to IFPRI. To reproduce material contained herein for profit or commercial use requires express written permission. To obtain permission, contact the Communications Division at [email protected].
International Food Policy Research Institute2033 K Street, NWWashington, D.C. 20006-1002, U.S.A.Telephone +1-202-862-5600www.ifpri.org
DOI: 10.2499/9780896291782RM165
Library of Congress Cataloging-in-Publication Data
Headey, Derek.Reflections on the global food crisis : how did it happen? how has it hurt? and how can we prevent the next one? / Derek Headey, Shenggen Fan. p. cm. — (IFPRI research monograph ; 165) Includes bibliographical references and index. ISBN 978-0-89629-178-2 (alk. paper) 1. Food supply. 2. Food security. 3. Food prices. I. Fan, Shenggen. II. International Food Policy Research Institute. III. Title. IV. Series: IFPRI research monograph ; 165.HD9000.5.H385 2010363.8—dc22 2010032022

Contents
List of Tables vi
List of Figures vii
Acknowledgments ix
Preface x
Acronyms and Abbreviations xi
Summary xii
1. Introduction 1
2. Causes of the Crisis 4
3. Consequences of the Crisis 54
4. Learning from the Past: Comparisons to the 1972–74 Food Crisis 81
5. Lessons for the Future: Does the Global Food System Need Fixing? 92
Appendix: Additional Data 102
References 108
About the Authors 116
Index 117
v

Tables
2.1 Changes in international prices across commodity groups, the 1972–74 crisis and today (percentage change of prices measured in real 2000 U.S. dollars) 10
2.2 Growth rates in cereal production per capita, 1980s–2000s 24
2.3 Estimated impact of fuel-related costs on U.S. farming costs, 2001–07 27
2.4 Trends in stocks relative to domestic consumption plus exports among major exporters and consumers, 1990–2000 and 2005–08 34
3.1 Number of countries severely affected by food and oil price increases, 2007–08 58
3.2 Dependence on U.S. imports, appreciation against the U.S. dollar, and reserve status 61
3.3 Descriptive statistics for average monthly price changes by major commodity, 2008 65
3.4 Patterns of price changes across time, commodities, and regions 65
3.5 Summary of three cross-country studies on the effects of rising food prices 74
3.6 Positive supply response to rising world food prices in the 2008/09 season 78
4.1 Comparing causes of the current crisis with the 1972–74 crisis 89
A.1 Energy and oil intensity by sector for selected countries, 2005 103
A.2 U.S. maize, soybean, and wheat production profits per planted acre, excluding government payments, 2004–09 105
A.3 Price changes in leading staples by country, 2008 105
A.4 Comparing urban poverty impacts across three microsimulation studies 107
vi

Figures
2.1 The complicated nature of commodity price formation 5
2.2 Trends in real international prices of key cereals, 1960 to mid-2008 9
2.3 Trends in nominal prices of cereals and oil, January 2003–November 2009 12
2.4 Timeline of events contributing to the food crisis 15
2.5 Contributions to changes in primary oil demand, 1980–2000, 2000–06, and 2006–30 16
2.6 Chinese crude oil imports and international oil prices, September 2005–December 2009 16
2.7 Chinese imports of soybeans and soybean oil, 1990–2008 18
2.8 Trends in yields, production, and input use across regions and decades 22
2.9 Explaining Europe’s declining cereal production, 1985–2006 24
2.10 Intensity of energy and oil use in production: Some macroeconomic measures 26
2.11 Global trends in stocks relative to consumption, 1960–2008 32
2.12 Trends in stocks, prices, and biofuel production: U.S maize 35
2.13 Global trends in wheat stocks-to-use ratios 36
2.14 Monthly maize prices relative to U.S. maize stocks, April 1996–December 2008 37
2.15 Effects of export restrictions on rice prices 45
2.16 Decomposing annual changes in rice exports before and after the crisis 46
2.17 Decomposing annual changes in rice imports before and after the crisis 47
2.18 Wheat exports: Droughts, export restrictions, price increases, and import surges 48
2.19 Surges in demand for U.S. maize exports precede maize price surges 50
vii

2.20 Summary model of the principal causes of the crisis: A near-perfect storm 52
3.1 Transmission from international markets to households and individual welfare 56
3.2 Histograms of exchange rate appreciations against the U.S. dollar, Q1 2002–Q2 2008 59
3.3 Comparing real and nominal CPI trends to real staples prices in Nigeria 64
3.4 Some cautious estimates of price changes in staple foods during 2008 67
4.1 Timeline of events for the 1972–74 food crisis 83
4.2 Changing patterns in the grain trade, 1930s–1970s 84
4.3 Comparing changes in rice export prices versus changes in retail prices, 1970–74 86
5.1 Does the global food system need fixing? 94
A.1 Response of import quantity to rising international food prices 102
viii FIGURES

Acknowledgments
A paper written on such a topical issue as this required the expertise of many people who generously offered their insights across a wide range of issues. The authors especially thank Phil Abbott, Marc Cohen,
Xinshen Diao, Ashok Gulati, Nurul Islam, Nic Minot, David Orden, John Pender, Dennis Petrie, James Thurlow, Ronald Trostle, Joachim von Braun, and sev-eral participants at a seminar given at IFPRI’s Washington, D.C., headquarters in August 2008, as well as many colleagues within and outside IFPRI. Valuable research assistance was also provided by Alice Chiu, Joseph Green, Sangeetha Malaiyandi, and Sharon Raszap Skorbiansky.
ix

Preface
Cheap food has been taken for granted for almost 30 years. From their peak in the 1970s crisis, real food prices steadily declined in the 1980s and 1990s and eventually reached an all-time low in the early 2000s.
Rich and poor governments alike therefore saw little need to invest in agri-cultural production, and reliance on food imports appeared to be a relatively safe and efficient means of achieving national food security. However, as the international prices of major food cereals surged upward from 2006 to 2008 these perceptions quickly collapsed. Furthermore, although food prices are now lower than their 2008 peak, real prices have remained significantly higher in 2009 and 2010 than they were prior to the crisis, and various simu-lation models predict that real food prices will remain high until at least the end of the next decade. Needless to say, the stability and effectiveness of the world food system are no longer taken for granted. For researchers and policymakers alike, the food price crisis presented nothing but puzzles. Many possible causes have been identified, but their relative importance is uncertain. A number of stud-ies estimated the impacts of rising food prices, but these simulations often generated unconvincing results, and most were limited by the absence of gen-eral equilibrium effects, country-specific price changes, and other relevant shocks, such as rising fuel prices. Moreover, while the recent crisis closely resembled the 1974 crisis, international policymakers still failed to prevent history from repeating itself. In this research monograph the authors explore these puzzles through a review of the existing literature and fresh analysis. While hardly the last word on the subject, this timely and unusually compre-hensive assessment of the crisis will be a valuable resource both for research-ers trying to make sense of current problems and for policymakers deciding how to prevent future crises.
x

Acronyms and Abbreviations
CARD Center for Agricultural Research and Development
CBOT Chicago Board of Trade
CPI consumer price index
E.U. European Union
FAO Food and Agriculture Organization of the United Nations
FAPRI Food and Agricultural Policy Research Institute
FEWSNET Famine Early Warning Systems Network
GDP gross domestic product
GIEWS Global Information and Early Warning System
IEA International Energy Agency
IFPRI International Food Policy Research Institute
IMF International Monetary Fund
LDC least-developed country
MENA Middle Eastern and North African
OECD Organization for Economic Cooperation and Development
OPEC Organization of Petroleum Exporting Countries
R&D research and development
TFP total factor productivity
USAID U.S. Agency for International Development
USDA U.S. Department of Agriculture
WFP World Food Programme
WTO World Trade Organization
xi

Summary
From 2005 to May 2008, the international prices of major food cereals surged upward, in many cases more than doubling in the space of a few years, and in some cases—such as rice—more than doubling in the space
of just a few months.1 Although food commodities are not unique in under-going such rapid price rises (energy and mineral prices have also surged), a sharp escalation in the price of basic foods is of special concern to the world’s poor. All poor people spend large portions of their household budgets on food, and most impoverished people depend on food production for their livelihoods but have very limited capacity to adjust quickly to sharp changes in relative prices. Consequently, surging food prices have caused panic and protest in developing countries and have presented the policymaking commu-nity with a challenge at least as severe as the 1972–74 global food crisis. This review of the 2007–08 food crisis attempts to provide a balanced and comprehensive assessment of the causes and consequences of the crisis for researchers and policymakers alike. This study was finalized in early 2010, about 18 months after international cereal prices peaked and then plum-meted, before rising again in 2009. It is therefore an appropriate point in time to reflect on the events of 2008 and the preceding years, reassess our understanding of the crisis (especially in light of the sharp drop in prices), and update the evidence on the impacts of the crisis with new data and fresh analysis. It is also an opportunity to emphasize to policymakers that food prices remain high by historical standards in both international and local markets, and that if higher prices in 2007 and 2008 were at least partly the result of fundamental pressures on international cereal markets, then it is reasonable to expect prices to remain high in the years to come (especially as economies recover from the financial crisis). Indeed, without actions to repair some significant flaws in the global food system, the food crises of 1972–74 and 2008 could be repeated, perhaps sooner rather than later. Regarding the causes of the 2007–08 crisis, this report aims to review the latest evidence in the literature, given that we have the luxury of more time
xii
1 Much of this document builds on Headey and Fan (2008), although several sections are derived from additional work for the U.S. Agency for International Development (USAID), including Headey and Raszap Skorbiansky (2008) and Headey (2010). Moreover, the analysis presented in Headey and Fan (2008) is updated and extended in several important dimensions.

(two years since the peak of food prices in April–May 2008). Many academic reviews link problems that existed before the food crisis to the rise in prices, without providing compelling evidence of causal linkages. Many are also gen-erally based on preliminary evidence only or often use piecemeal approaches rather than comprehensive ones. Indeed, the more one assesses this crisis, the more one concludes that it is the result of a complex set of interacting factors rather than any single factor. Despite this complexity, the assessment presented here suggests that some explanations still hold up much better than others. This set of inter-connected factors includes rising energy prices, the depreciation of the U.S. dollar, low interest rates, and investment portfolio adjustments in favor of commodities. All these factors are related to a range of underlying global macroeconomic phenomena that affected both food and nonfood commodi-ties. As for agriculture, specifically, energy prices are a significant supply cost in cereal production, but rising energy revenues also fueled increased cereal demand from energy-exporting nations. However, a major effect of rising energy prices was the consequent surge in demand for biofuels. Demand for biofuels had a stronger effect on maize than on other biofuel crops (such as oilseeds), although knock-on effects for other food items may have been sub-stantial (especially for soybeans). Interestingly, we also find that the surge in U.S. maize production for biofuels was of an order-of-magnitude equivalent to the primary explanation of the 1972–74 crisis—the surge in U.S. wheat exports to the Soviet bloc. The surge in rice prices stands apart as being almost entirely a bubble phe-nomenon. The late and rapid rise in rice prices, almost all of which took place in the first few months of 2008, was closely related to the export restrictions of several major international producers and to large precautionary imports from major international consumers. These shocks compounded the existing volatility in rice prices that arises from the relatively thin international trade in rice. Export restrictions were also important for wheat markets, although these were partly triggered by weather shocks to wheat production, espe-cially in the case of Ukraine. The Australian drought was also a significant short-term factor, especially as southern hemisphere exporters like Australia and Argentina (who restricted wheat exports) provide counterseasonal wheat supplies to northern hemisphere countries. In contrast to other assessments, we do not attribute much of a role to other factors cited in the literature, by politicians, or by the popular press. Many people cite surging demand from China and India, including the shift in their diets toward more meat consumption, and hence greater demand for feed cereals. This research theme was prominent prior to, and independent of, the 2008 food crisis, and it was brought up again as the crisis unfolded,
SUMMARY xiii

albeit as an untested hypothesis. However, surging demand from China and India turns out not to present any compelling linkages to the crisis. At the national level both countries are largely food secure, so they rarely rely on substantial food imports, except some oilseeds. It is true that both countries, especially China, have experienced greatly increased demand for energy and other minerals, but their demand is by no means the only cause of rising oil prices and is perhaps not even the main cause. Chinese demand for soybeans has also grown dramatically, but since 1995 rather than very recently. More-over, this longer term increase in demand was accommodated mostly by area expansion in Brazil and Argentina, so the effects on other commodities would appear to be quite limited. China and India might also have influenced international food prices by depleting their stocks of major cereals, but there is no direct evidence that declines in their stock influenced expecta-tions elsewhere. In China’s case, estimated stock levels in the 1990s were excessively high, and still are, so China shows little or no sign of being unable to feed itself in the foreseeable future. India’s stocks also declined from excessive levels and were briefly too low during the crisis, which may have led to the hasty decision by India to ban rice exports in November 2007—an action that undoubtedly had a large adverse effect on international rice prices. But these are all quite indirect linkages to the crisis, and in fact we find that growth in cereal imports was much stronger among other sets of countries, including Mexico, the European Union (E.U.), and a range of Middle Eastern and North African (MENA) countries. Another perennial research literature that was prominent before the food crisis was declining yield growth in cereal production and related trends, such as low levels of agricultural research and development (R&D) and land degra-dation. These problems are certainly significant in some parts of the world, but the real linkage to international prices must come from global supply and demand, which is best examined by looking at global cereal production per capita and trade statistics. It turns out that production per capita has indeed declined, but about three-quarters of that decline is explained by fall-ing production in the former USSR and Eastern Europe. However, that trend did not affect international trade, because the former Soviet bloc countries actually increased cereal exports to the rest of the world over this period. Hence much of the decline in global grain production simply relates to struc-tural change in transition countries, which does not appear to have adversely affected international prices. The remainder of the decline comes from Sub-Saharan Africa, where cereal production has struggled to keep up with rapid population growth. Here the factors cited above probably are pertinent—low R&D, soil degradation, climate change—but Africa is a very small player in international cereal trade, so the linkage is tenuous at best.
xiv SUMMARY

Stock declines in other countries, especially the United States and other major cereal importers, are also a compelling explanation for the price crisis. However, there are two problems with this explanation. First, global stock declines are much less impressive once policy-driven reductions of the exces-sive stocks in China and the former USSR are excluded. Second, because stocks are a residual, stock declines in other countries primarily reflect deeper causes, such as rising demand or insufficient supply. Indeed, in the case of wheat markets we find that trade shocks reduced U.S. wheat stocks, so that low stocks can hardly be a cause of the crisis. Similar results are true of biofuels demand and U.S. maize stocks. Hence we do not believe low stocks were an important cause of the crisis. Another contentious factor relates to speculation in futures markets. Futures markets are normally thought of as an instrument for price discovery, but the entry of noncommercial participants has raised fears that speculators may be artificially driving up prices. Our view is ultimately agnostic, because we believe it is impossible to discern causality in the context of futures markets, even from time series econometrics, as futures-market variables represent expectations of the future. Thus the usual Granger-causality tests are potentially irrelevant, because expectations of price rises at time t might be noncausally associated with higher prices at time t + 1. However, whether or not futures market activities were a cause of the crisis, we find it unlikely that they were a driving force, if only because we have substantial confidence in several of the more tangible explanations of the crisis discussed above: oil prices, biofuels demand, a depreciating U.S. dollar, and various trade shocks, in particular. The remainder of this monograph assesses the consequences of the crisis. Here, too, considerable academic work has been done, much of it impressively quickly. However, the broader weakness of this research is a large disconnectbetween macro- and microeconomic assessments of the consequences of rising food prices. For example, macroeconomic studies look at the effects on import bills, foreign exchange reserves, and fiscal deficits, but there are generally no linkages down to the household level. Other macroeconomic stud-ies look at price transmission, but that is certainly not the same as impact. A country might have low rates of transmission but only because it has decreased food taxes or increased subsidies, actions that place the burden of rising international prices on the fiscal deficit (or back on to international prices, in the case of export bans), rather than on to consumer prices. More-over, what is typically called “transmission” sometimes also reflects country-specific factors, such as agricultural output shocks or loose monetary policies. Microeconomic studies, in contrast, often lack good data on actual price changes at the country level; they must therefore assume that international
SUMMARY xv

price changes are partially transmitted to domestic markets, or they must simulate the effects of arbitrary price changes, such as 10 percent food infla-tion. And of course, most microanalyses have the usual limitations of simula-tion techniques, especially somewhat simple assumptions regarding consumer and producer responses. A further weakness of much of the microeconomic work is that it solely focuses on food prices, even though it is quite pos-sible that rising oil prices could have similarly large effects on poverty and national welfare. It is true that poor people generally spend much more of their income on food than on fuel. However, least-developed country (LDC) oil imports are 2.5 times larger than LDC food imports, and rising oil prices raise the prices and restrict the output of other goods. These facts indicate that the overall effects of rising oil prices could certainly be on par with the impacts of rising food prices in many cases and could thus further worsen the food crisis. Despite these qualifiers, our review of local price trends in developing countries does show that real prices in 2008 were substantially higher than prices in 2007, often double, especially around the middle of 2008. The good news is that prices generally did start to decline in late 2008 as international prices fell. Had higher prices persisted, the crisis could have turned espe-cially severe. The bad news is that price rises were surprisingly high in a large number of countries. In Africa, prices rose especially high, particularly for imported products principally consumed by urban populations, but also for some local commodities that are not widely traded (indeed, commodities forwhich international prices are not even reported). In this monograph we can only speculate on why African prices rose so substantially, and ultimately the answer remains a matter for future research. With the worst of the food crisis over, this monograph provides a timely discussion of how the 2008 food crisis compares to the previous food crisis of 1972–74. In many ways the two crises had similar causes, including rising energy prices, similarly sized shocks to U.S. cereal demand (from the Soviet bloc in the 1970s and from the biofuels industry today), low interests rates, and the devaluation of the dollar, as well as declining stocks and some adverse weather shocks. The most daunting aspect of the existing global food system is not only the strong possibility that food crises are an inherent aspect of the global food system—which is pervaded by various distortions of production, trade, and agricultural investment and suffers from a huge regional imbalance in cereal production—but also that this system may well be hit hard by several shocks in the future. These include adverse weather shocks and declining productivity related to climate change, and a recurrence of oil price shocks and surging biofuels demand. The real concern is that the precipitous fall in food prices over the second half of 2008 will once again lead to the wide-
xvi SUMMARY

spread apathy toward the agricultural sector that has prevailed among policy-makers in both developed and developing countries. Indeed, a long history of neglecting agricultural investments has made it difficult for many developing countries and their donors to quickly scale up agricultural investments in the wake of the crisis. Despite these obstacles, sustained and smart investments in developing-country agriculture will be essential if the world food system is to finally deliver what it ought to: greater food security and real income gains for the world’s poorest people.
SUMMARY xvii


CHAPTER 1
Introduction
Beginning in 2003, international prices of a wide range of commodities surged upward in dramatic fashion, in many cases more than doubling in a few years and, in some cases, in a few months. Yet unlike other
commodities, surging food prices are of special concern to the world’s poor. Many impoverished people depend on food production for their livelihoods, and all poor people spend large portions of their household budgets on food. Sharply rising prices offer few means of substitution and adjustment, espe-cially for the urban poor, so there are justifiable concerns that millions of people may be plunged into poverty by this crisis, and that those who are already poor may suffer further through increased hunger and malnutrition. Equally grave concerns have been felt with respect to the impacts that rising food and fuel prices may have had on macroeconomic stability and economic growth. And although the food and fuel crises have largely abated since mid-2008 and have taken a back seat to the ongoing global financial crisis, food prices have remained high by historical standards and are predicted to stay high in the years to come. Prior to the financial crisis, high food prices certainly received a great deal of attention from policymakers, the media, and the academic commu-nity. Active and often heated debate has arisen regarding what may have caused the food crisis, what impact it will have on the poor, and—on the basis of the debate—what needs to be done to resolve the crisis. Much of the nonacademic commentary on these issues was not based on evidence backed by research. Much of the academic research was also necessarily “quick and dirty,” in response to the pressing needs of policymakers. However, some of this research was insightful, resourceful, and impressively rigorous, given the sudden demand for such work. For the most part, this monograph constitutes a review of existing research on the food crisis, synthesizing the best results and pointing out the knowledge gaps we still have. In doing so we follow in the footsteps of several capable and rigorous assessments of the crisis. These include the work of Abbott, Hurt, and Tyner (2008, 2009) and Mitchell (2008) on the causes of the crisis, and Abbott (2009) on its consequences. We draw
1

on these works quite extensively, and sometimes revisit and revise them empirically. However, in addition to reviewing and revising this evidence, we regularly augment it where necessary (and feasible) with fresh research. Indeed, the present research provides several important new pieces of evi-dence on both the causes and consequences of the crisis. A second group of papers inadequately addresses some specific questions on the consequences of the crisis. Although often technically adept, this body of research is of limited use for a robust assessment of the likely impacts of the crisis. Several papers follow Ivanic and Martin (2008) in using micro-economic data to simulate the impacts of rising food prices on household poverty. Other papers in this group look at macroeconomic effects, such as the strength of transmission from international to domestic prices (Dawe 2008) or the impact of rising food prices on import bills (IMF 2008a). Ideally, a full assessment of the short-term impacts of the crisis on poverty requires consideration of both macroeconomic impacts and transmissions, as well as household and intrahousehold effects, for both food and fuel price increases. Some country studies admirably adopt a more comprehensive line (Arndt et al. 2008; Cudjoe, Breisinger, and Diao 2008), but cross-country analyses of this kind are notably absent. To partially bridge this gap, we collect and ana-lyze a new and impressively large Global Information and Early Warning Sys-tem (GIEWS 2009) dataset on food prices in developing countries. Such data can be used to broadly infer where consumers have been severely effected, although the impacts on farmers remain unclear. A final objective of this monograph is to look beyond the events of the past few years. We show that the current crisis bears some remarkable similarities to—as well as some equally important differences from—the first food crisis of 1974 (Headey and Raszap Skorbiansky 2008). The similarities between the two crises lend credence to the hypothesis that the causes of these crises relate to some deeper failings of the global food system. In Chap-ter 4 we compare the two crises and consider this hypothesis. As we discuss in the concluding chapter (Chapter 5), some of these failings were addressed after the 1972–74 crisis, but with only limited success, and some were not addressed at all. Particularly important is the large regional imbalance in cereal production. Africa’s poor track record in agricultural pro-duction may not have been a significant cause of the crisis, but it undoubt-edly makes the region highly vulnerable to the vagaries of international mar-kets. Reversing a long-term decline in agricultural investment in Africa and other lagging regions is an immense and difficult step but almost certainly a necessary one. The good news is that donor commitments to agricultural development were indeed scaled up drastically in 2008. The concern is that
2 CHAPTER 1

the global financial crisis will mean that many of those commitments will not be honored or sustained into the future. A system of global reserves was also never set up in the wake of the 1972–74 crisis despite much research and a number of international meetings. Suggested solutions to the current crisis once again include an international system of grain reserves, as well as a system of virtual reserves to address speculation in futures markets. However, our assessment concludes that low stocks and speculation were, at best, indirect causes of the crisis. Further-more, international grain reserves also have their problems, and a great deal of further research would be required before effective real or virtual reserve systems could be put in place. Freer trade may also be a more viable means of stabilizing cereal prices, although the political barriers are undoubtedly daunting. Whatever the solutions, they must be sought and sought collectively, because the global food system does indeed face global challenges in the years ahead. Factors that were not important causes of the crisis—such as changing diets, climate change, and a greater incidence of natural disasters—may yet impose significant pressure on international food markets in the near future, as may many factors that were important in this crisis, such as higher energy prices and biofuel production. We hope the evidence presented in this monograph will encourage researchers and policymakers to take the food crisis of 2008 seriously. Some of the price rise was indeed a passing bubble, but much of it was also related to real supply and demand pressures on international food markets. Worse still, the price changes and consumption losses witnessed in developing countries were all too real and all too costly.
INTRODUCTION 3

CHAPTER 2
Causes of the Crisis
Broad-based research studies have attempted to identify the factors that might have caused the recent surge in food prices, but only a few have attempted to add explicit (albeit approximate) orders of magnitude to
each factor. In this chapter we review, reassess, and extend the evidence on this issue. A significant constraint on all assessments of the crisis, including ours, comes about because it is a global phenomenon and one regarded by many as a distinct event. Thus some of the usual tools favored by economists for uncovering causality, such as regression analysis or simulation models, have quite limited application in this context. Instead, some less formal “detective work” is needed, involving a mix of economic theory, economic history, and more rudimentary statistical analysis. The review begins with a reassessment of the basic facts of the crisis. Bearing these facts in mind, each individual explanation of the crisis is assessed in terms of how well it holds up against both the general facts and the more specific evidence.
Commodity Price Formation: A Conceptual FrameworkImplicit in all discussions of the causes of rising food prices is some model of commodity price formation. That said, there seems to be little agreement as to how international commodity prices are formed. As we discuss below, some writers emphasize traditional agronomic determinants of commodity prices (such as the role of stocks and the interactions between stocks and various supply and demand movements), some see macroeconomic phenomenon as critical, and still others emphasize the role of futures markets in influencing spot prices. Less frequently discussed is whether international price increases are predominantly driven by price changes in U.S. markets—because the United States is the largest exporter of maize and wheat, and the third largest exporter of soybeans—or whether other markets are also price makers. To address the price-formation question more explicitly, Figure 2.1 sets out a comprehensive model of price formation in major international (exporter) grain markets. The model is centered around the complex interactions among supply, demand, actual prices, and price expectations. Buyers and sellers of
4

CAUSES OF THE CRISIS 5
Actu
alpr
ices
Pric
eex
pect
atio
ns
Dom
esti
cD
omes
tic
Fore
ign
Feed
, se
ed
Bio
fuel
,in
dust
rial
Hum
an u
se
Begi
nnin
gst
ocks
Har
vest
are
a
Wea
ther
Yiel
ds
Exch
ange
rate
s
Fore
ign
Gra
inre
port
s
Expo
rtre
stri
ctio
ns
Futu
res
mar
kets
Endi
ngst
ocks
Econ
omic
and
popu
lati
on g
row
th
Oil
pric
es,
ener
gy p
olic
y
R&D
Cost
s:oi
l, f
erti
lizer
Prec
auti
onar
ypu
rcha
ses
Supp
lyD
eman
d
Addi
tion
al f
acto
rs
• O
wn
pric
eel
asti
citi
es•
Inco
me
elas
tici
ties
• Cr
oss-
pric
eel
asti
citi
es•
Inte
ract
ion
effe
cts
(for
exa
mpl
e, b
etw
een
stoc
ks a
nd s
hock
s)•
Shor
t ru
n ve
rsus
long
run
(for
exa
mpl
e, R
&D
)•
Feed
back
loop
s•
Para
met
er in
stab
ility
(for
exa
mpl
e,el
asti
citi
es m
aych
ange
dur
ing
the
cris
is)
Figu
re 2
.1
The
com
plic
ated
nat
ure
of c
omm
odit
y pr
ice
form
atio
n
Sour
ce:
Cons
truc
ted
by t
he a
utho
rs.
Not
e:
R&D
, re
sear
ch a
nd d
evel
opm
ent.

grain reach price arrangements based on a host of supply and demand condi-tions but also on expectations of future prices, especially as grains are storable commodities. Price expectations themselves are influenced by current prices and supply conditions (such as area planted, levels of stocks, and weather forecasts) but also by grain reports (which transmit explicit information on supply and demand conditions) and futures markets (which transmit more implicit information about where market actors think prices may be heading over various time horizons). The remainder of the model sets out some of the hypothesized determinants of price movements in the current crises—such as the interplay among weather, export restrictions, and precautionary (or panic) purchases —and such factors as exchange rate movements, economic and popu-lation growth, R&D, and the nexus between oil prices and biofuels. The model’s transmission mechanisms and outcomes are conditioned by a range of parameters and relationships (listed as “additional factors” in the box on the right side of Figure 2.1), including supply and demand elastici-ties, interaction effects among factors, feedback loops, and various dynamic nuances relating long- versus short-term price adjustments. These complexi-ties have some important implications for how well any analysis can identify the causes of the crisis, particularly more formal analytical techniques, such as simulation models or time series econometrics. To give just one example, Headey (2010) argues that two of the most important causes of the food crisis were government interventions on both the supply side (for example, export restrictions) and the demand side (such as government-to-government import deals). In effect, these policies meant that supply and demand elas-ticities changed during the crisis in quite perverse ways; that is, high prices led to supply restrictions and demand surges. Hence simulation models or time series regressions that use or derive pre-crisis parameters could well be incorrectly specified. So instead of adopting these more formal but more restrictive techniques, we opt to treat the crisis as a distinct event—albeit one with similarities to previous crises—best investigated with what we can only describe as economic detective work. To push that analogy further, we acknowledge upfront that most of the evidence that we and others bring to bear on this case is circumstantial at best.
Some Basic Facts of International Grain MarketsIn addition to the general model in Figure 2.1, it is also important to consider how the four major international markets for staple foods—maize, rice, soy-beans, and wheat—vary with respect to price formation.1 Some of the major facts of these grain markets are as follows:
6 CHAPTER 2
1 The following paragraphs draw heavily from Schepf (2006).

1. Dominance of the U.S. grain markets. The United States heavily dominates global exports of maize (60 percent) and wheat (25 percent), and although U.S. soybean exports have been overtaken by those of Argentina and Bra-zil in recent decades, the United States is still the world’s third largest soybean exporter. Only in rice markets is the United States not a leading exporter. Hence U.S. grain prices are typically quoted as international prices for all grains except rice, where Thai prices are typically quoted.
2. Importance of U.S.-specific factors. Given Fact 1, events in the U.S. economy or in U.S.-dominated grain markets can be thought of as possiblesuspects in the recent food crisis. Such events include the advent of bio-fuels, the depreciation of the U.S. dollar and the build-up of dollar reserves in other countries, and movements in commodity futures markets. That said, trade shocks in the U.S. market are also important. Schepf states that “Since the market events of 1972 [in which the Soviet Union made unexpected purchases of large amounts of U.S. grain] most market observ-ers consider exports to be the great uncertainty underlying commodity supply, demand, and price forecasts” (2006, 17).
3. Degree of competition and market efficiency in the United States. These three U.S. grain markets are highly commercialized and, despite the impor-tance of some large players (for example, Cargill), these markets are highly competitive. They have a sophisticated market infrastructure, including the information services of the U.S. Department of Agriculture (USDA) and the price-discovery functions afforded by futures markets.
4. Seasonality and inelastic supply and demand functions. Because most grains are limited to a single annual harvest, new supply flows to market in response to a postharvest price change must come from either domestic stocks or international sources. Hence, supply elasticities tend to be highly inelastic in grain markets, making them very vulnerable to relatively small shocks, especially when stocks are low. Similarly, demand elasticities tend to be low, because the farm cost of basic grains generally amounts to a small share of the retail cost of consumer food products in developed countries.2 In poor countries demand can be inelastic for the opposite reason: poor people are so close to subsistence that higher prices of their staple grain force them to concentrate their consumption on this essential item.3
CAUSES OF THE CRISIS 7
2 In other words, changes in grain prices generally have little impact on retail food prices and therefore little impact on farm-level demand. For example, a 20 percent rise in wheat prices would translate into only about a 1 percent rise in the price of a loaf of bread.3 Indeed, higher prices could even induce the very poor to consume more of the grain (Jensen and Miller 2008).

5. Variations among wheat, maize, and soybean markets. Despite being generally inelastic goods, Schepf (2006) notes important variations among these grain markets. He argues that U.S. wheat prices are generally more stable than maize prices because (i) there are two crops annually for U.S. wheat; (ii) there are two counterseasonal southern hemisphere grain exporters (Australia and Argentina); (iii) there are price-stabilizing U.S. government policies for wheat; and (iv) feed demand can act as a price buffer for wheat. Soybean prices might also be less volatile because of more elastic demand (soybeans are mostly used as feed, for which there are substitutes), the rarity of trade restrictions on soybeans, and the existence of important counter-seasonal southern hemisphere producers (Brazil and Argentina). But soybean prices could be sensitive to demand shocks, because China and the European Union (E.U.) account for almost two-thirds of global imports. In contrast to wheat and soybeans, maize exports are heavily dominated by the United States (two-thirds of the global share), making the maize market very sensitive to events in the United States.
6. Peculiarities of the rice market. As Timmer (2009) discusses, rice markets are very distinctive in that (i) only about 6 percent of global rice produc-tion is exported; (ii) exports are dominated by Asian countries, such as Thailand, India, and Vietnam; (iii) most exporters and many importers of rice impose substantial barriers to trade; (iv) rice is extensively produced and traded by smallholders and small traders; and (v) demand for rice is highly inelastic, as it is the major food staple for millions of people in Asia in particular. Hence, international rice prices are generally more volatile than those of other grains, although domestic prices in Asia are much more stable.
Facts of the Crisis ItselfThe basic price-formation framework illustrated in Figure 2.1 and the facts listed in the previous section provide us with a useful platform for inves-tigating the causes of the crisis, although they make no specific mention of the events leading up to it. Hence in this section we focus on the facts pertaining to the crisis itself. Figure 2.2 presents long-term data on export prices from 1960 to mid-2008 for four major staples—maize, rice, soybeans, and wheat—as measured in key markets in the United States and, in the case of rice, key markets in Thailand. All measures are deflated using the U.S. Bureau of Economic Analysis gross domestic product (GDP) deflator. Some of the same data are also used to more narrowly examine the growth rates of real prices over particular periods of interest (Table 2.1). In addition, price changes are included for a wider range of commodities categorized into
8 CHAPTER 2

various groups of interest (Table 2.1). Figure 2.3 focuses more on nominal short-term price data to more clearly delve into the timing of price changes in the current crisis. These three sets of data give rise to the basic facts outlined below. Consistent with the above arguments, the first observation is that long-term trends may be relevant to an understanding of the current crisis. The price levels in mid-2008—when food prices peaked—are about as high as they were in the late 1970s or early 1980s in real terms (Figure 2.2). However, the nature of this crisis is not how expensive prices are relative to their historical trend, but how quickly they have risen, together with the related problem of behavioral adjustments by consumers and producers. Thus the first, and rather trivial, fact is that food export prices have risen very quickly. The rise in prices in the recent crisis is similarly sharp in percentage terms to the price shocks of 1972–74 crisis (Figure 2.2 and Table 2.1). In both crises, rice prices shot up the most (about 220 percent), but wheat prices rose steeply in 1974 (180 percent), and maize and soybeans both exhibited rapid price increases on the
CAUSES OF THE CRISIS 9
Price (U.S. dollars/metric ton)
0
800
1964
1960
1972
1980
1988
1992
1996
2000
2004
2008
1968
1976
1984
1,000
1,600
600
400
200
1,200
1,400
RiceSoybeansWheatMaize
Figure 2.2 Trends in real international prices of key cereals, 1960 to mid-2008
Source: IMF (2009a).Notes: Data are deflated using the U.S. Bureau of Economic Analysis gross domestic product
deflator. The 2008 data are for July.

10 CHAPTER 2
Tabl
e 2.
1 C
hang
es i
n in
tern
atio
nal
pric
es a
cros
s co
mm
odit
y gr
oups
, th
e 19
72–7
4 cr
isis
and
tod
ay (
perc
enta
ge
chan
ge o
f pr
ices
mea
sure
d in
rea
l 20
00 U
.S.
dolla
rs)
Ja
nuar
y 20
04–
May
200
8–Co
mm
odit
y 19
70–7
4 19
74–7
8 M
ay 2
008
Mar
ch 2
009
Not
able
fea
ture
s
Food
St
aple
s 13
6.6
–41.
2 12
4.8
–34.
7 Su
bjec
t to
dec
linin
g st
ocks
; in
elas
tic
dem
and;
co
mpe
titi
on f
or b
iofu
els
W
heat
18
2.0
–53.
8 10
7.9
–27.
6 Su
bjec
t to
pro
duct
ion
shoc
ks a
nd d
iver
sion
to
biof
uel
crop
s in
Eur
ope
M
aize
80
.4
–42.
2 88
.5
–30.
4 O
f 20
07 U
.S.
prod
ucti
on,
30 p
erce
nt d
iver
ted
to
biof
uels
So
ybea
ns
88.0
–2
7.6
52.9
–2
9.6
Subj
ect
to l
arge
dem
and
from
dev
elop
ing
Asia
Ri
ce
225.
3 –4
8.1
223.
6 –3
6.2
Subj
ect
to e
xpor
t ba
ns b
y m
ajor
pro
duce
rs;
very
di
stin
ctiv
e m
arke
t
Non
stap
les
159.
3 –4
0.4
62.4
–3
0.9
M
eat
24.5
10
.1
50.7
–2
1.8
Be
ef (
Braz
il)
n.a.
n.
a.
40.2
21
.7
Seaf
ood
42.8
7.
2 41
.7
–15.
7O
ther
agr
icul
tura
l
co
mm
odit
ies
Te
xtile
s 11
5.3
–14.
3 18
.1
–25.
0

CAUSES OF THE CRISIS 11
W
ood
40.4
–7
.3
7.1
–8.3
Ca
sh c
rops
49
.4
35.0
61
.2
–9.6
Fert
ilize
rs
299.
4 –4
4.6
369.
8 –3
6.5
Mar
ket
rela
tive
ly c
once
ntra
ted
and
clos
ely
linke
d
to
ene
rgy
pric
es
DAP
28
0.8
–58.
3 67
6.1
–55.
9
Pota
sh
475.
3 –7
5.8
381.
8 –7
0.7
Met
als
82.1
–5
.9
121.
1 –3
2.6
Ener
gy
All
ener
gy
327.
8 –3
.0
136.
4 –5
0.7
Pe
trol
eum
41
0.2
–15.
7 18
1.4
65.6
In
bot
h cr
ises
, pe
trol
pri
ces
have
ris
en m
ore
than
ot
her
ener
gy p
rice
s
Coal
36
0.1
–16.
2 13
9.8
–41.
9
Nat
ural
gas
n.
a.
n.a.
16
2.7
–56.
7G
ener
al p
rice
s
U.S
. In
flat
ion
26.0
31
.7
15.5
–2
.9
Poun
d 1.
9 15
.4
–1.7
39
.3
Yen
–15.
9 –3
5.3
0.0
–5.7
Eu
ro
n.a.
n.
a.
–12.
4 19
.3
Sign
ific
ant
depr
ecia
tion
aga
inst
a n
umbe
r of
cu
rren
cies
Sour
ce:
IMF
(200
9b).
Not
es:
All
com
mod
ity
pric
es a
re d
efla
ted
usin
g th
e U
.S.
Bure
au o
f Ec
onom
ic A
naly
sis
gros
s do
mes
tic
prod
uct
defl
ator
so
as t
o be
exp
ress
ed i
n te
rms
of c
onst
ant
2000
U.S
. do
llars
. D
AP,
di-a
mm
oniu
m p
hosp
hate
; n.
a.,
data
not
ava
ilabl
e.

order of 50–90 percent. Although seemingly trivial, this speed component of the crisis is important, because it might focus suspicion on explanations that involve short-term factors rather than long-term changes.4
A second fact that may hold some significance is that prior to the cur-rent price rise the real prices of staple foods were at an all-time low after declining for the best part of 30 years. Whether these long-run trends andthe similarities to the 1972–74 crisis are truly integral components of the current crisis remains to be seen, but—as is explored below—there are good grounds for the argument that they are. A third fact that has yet to receive much attention is that the prices ofa wide range of commodities increased sharply. The surge in the price of oilis well known, of course, as is its being a leading factor in the 1974 food crisis, but all energy prices have risen by 80–120 percent (so have the prices
12 CHAPTER 2
Price index (January 2003 � 1)
0.5
3.5
May 20
03
Jan 2
003
Jan 2
004
Sep
2004
May 20
05
Sep
2005
Jan 2
006
May 20
06
Sep
2006
Jan 2
007
May 20
07
Sep
2007
Jan 2
008
May 20
08
Sep
2008
Jan 2
009
May 20
09
Sep
2009
Sep
2003
May 20
04
Jan 2
005
4.0
5.5
3.0
2.5
2.0
1.5
1.0
4.5
5.0RiceSoybeansWheatMaizePetroleum
Figure 2.3 Trends in nominal prices of cereals and oil, January 2003–November 2009
Source: Calculations by the authors using data from IMF (2009a).
4 Of course, as will be shown, this is not necessarily the case. Long-term factors could have depleted stocks, which ultimately would have contributed to price increases.

of metals and minerals), and fertilizer prices roughly quadrupled during both crises. Other agricultural commodities (for example, cash crops) have not risen anywhere near as quickly, however (Table 2.1). This observation begs the question of whether food-specific factors are driving the surge in food prices or whether other factors that have common effects across these com-modity groups—such as the importance of energy costs in production, global macroeconomic factors (including growing commodity demand from China and India), or low interest rates and their effects on investment decisions—are the dominant cause of recent price trends. A fourth fact is that the timing of price rises is somewhat different across commodities, and even across staple foods. The fourth column of Table 2.1 shows percentage price changes from 2004 to the first five months of 2008 only, and Figure 2.3 shows graphically which commodity prices rose first. Fig-ure 2.3 shows that maize prices rose first, then wheat, and then rice. Table 2.1 confirms that most of the price rise in wheat and maize occurred prior to 2008, but that three-quarters of the increase in the price of rice occurred in 2008—almost certainly because of adverse policy responses, such as export bans from some major exporters. Nevertheless, increases in rice prices from 2004 to 2007, which were on the order of 60 percent, were actually higher than the contemporaneous price increases of the other three staple crops considered (57 percent for wheat, 44 percent for maize, and 28 percent for soybeans). This fact has mostly been overlooked, although it is worth not-ing that rice is a thinly traded commodity (90 percent of all rice output is consumed domestically), and rice prices are generally more volatile than the prices of other staple crops. Hence rice is distinctive both in terms of the timing of the price rises and the nature of its international trade. A fifth fact is that the U.S. dollar has depreciated against a wide range of currencies. Against the other special drawing-rights currencies (the U.K. pound, euro, and Japanese yen), the U.S. dollar has depreciated some 30 percent since the beginning of 2002. All commodities listed in Table 2.1 are expressed in U.S. dollars; thus the price increases would be much less sharp if measured, for example, in euros. The increase in nominal prices of key staples is about 25 percent less when measured in euros, somewhat less than that when measured against the USDA’s trade-weighted agricultural exchange index, and roughly the same when measured in pounds or yen. Some authors also consider U.S. dollar depreciation to be a causal factor in the crisis, an issue that is revisited below. A sixth fact is that in both the 1974 and 2008 crises, commodity prices quickly plummeted from their peaks. From 1974 to 1978 the prices of staple grains (and several other commodities) fell by about 50 percent (Table 2.1), with most of this decline occurring in 1975 and 1976. In the recent crisis,
CAUSES OF THE CRISIS 13

prices peaked in May 2008, but by March 2009 prices of staple grains had fallen by 30 percent from that peak, while energy prices fell by about 50 percent. Figure 2.3 shows that nominal prices have rebounded somewhat since the second half of 2008, with 2009 price still significantly higher than they were in 2005 or 2006. Nevertheless, the rapid rise and fall of commodity prices suggests a commodity bubble, with peak prices reflecting some kind of overshooting effect. Whether this effect is related to oil prices, dollar movements, export restrictions, or demand surges is ultimately an empirical question we shed light on in the next section.
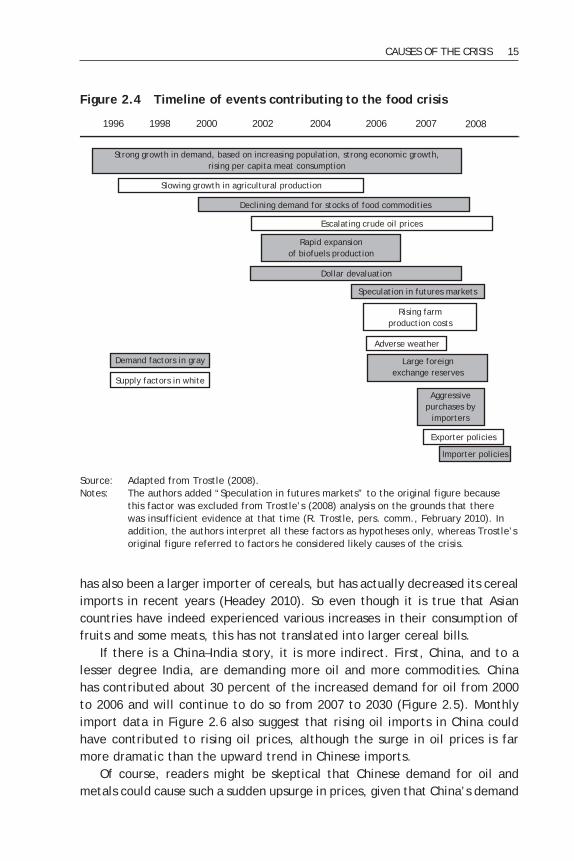
Assessing Existing Explanations of the CrisisAs for the factors that are hypothesized to have caused the crisis, Trostle (2008) provides a very useful timeline of events, which we present in Figure 2.4. The timeline distinguishes between supply- and demand-side factors, and also distinguishes between long-term factors (such as strong growth in demand and slowing agricultural production), medium-term factors (for example, dollar devaluation, rising oil prices, biofuels production, and the build-up of foreign exchange reserves); and short-term factors (such as adverse weather and various trade shocks). Following the taxonomy in Figure 2.4, the following discussion is structured around this chronology of events.
Strong Growth in Demand, Especially from China and IndiaMany studies, policy briefs, and media publications have attributed rising food prices to strong economic growth, especially the rapid growth in China and India. It is an explanation that has some intuitive appeal in that two countries with a combined population well in excess of 2 billion people, many of whom are indeed experiencing rapid income growth, have enormous potential to augment global demand for food and other resources. Such popu-lar books as Who Will Feed China? have documented this possibility (Brown 1995). Many observers writing on the crisis have referred to changing con-sumption patterns in China and India, particularly the rapid growth in meat and vegetable consumption. In our reckoning the Asian-diet hypothesis is not corroborated by avail-able data. Although it is true that diets in countries like China and India are changing, it is not at all obvious that these countries are becoming more dependent on cereal imports (except in the case of Chinese soybean imports, discussed separately below). For example, cereal import trends around the world indicate that Spain and Mexico stand out as the two countries that have most increased their cereal imports in the 2000s. No Asian country figures in the top 10 of that list, and China actually imported fewer cereals in the 2000s than in the 1990s (although the composition of imports changed). Indonesia
14 CHAPTER 2
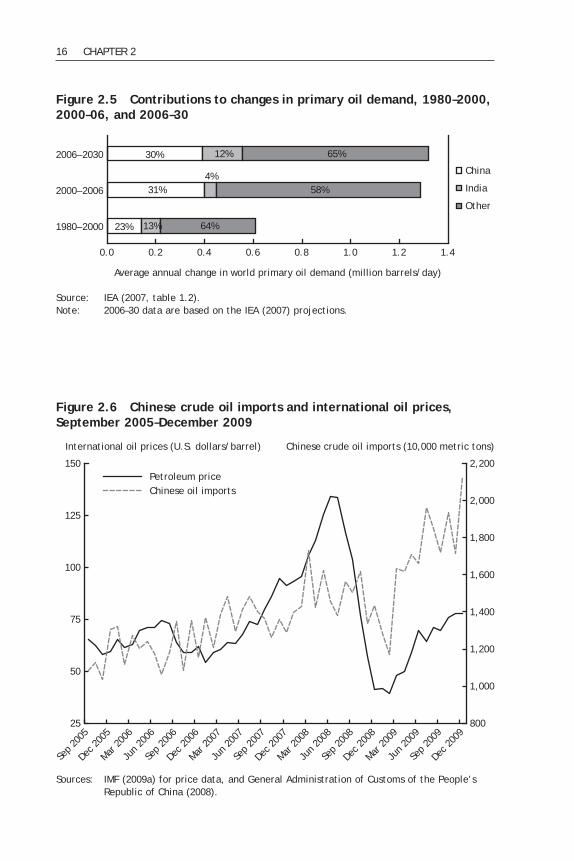
has also been a larger importer of cereals, but has actually decreased its cereal imports in recent years (Headey 2010). So even though it is true that Asian countries have indeed experienced various increases in their consumption of fruits and some meats, this has not translated into larger cereal bills. If there is a China–India story, it is more indirect. First, China, and to a lesser degree India, are demanding more oil and more commodities. China has contributed about 30 percent of the increased demand for oil from 2000 to 2006 and will continue to do so from 2007 to 2030 (Figure 2.5). Monthly import data in Figure 2.6 also suggest that rising oil imports in China could have contributed to rising oil prices, although the surge in oil prices is far more dramatic than the upward trend in Chinese imports. Of course, readers might be skeptical that Chinese demand for oil and metals could cause such a sudden upsurge in prices, given that China’s demand
CAUSES OF THE CRISIS 15
1996
Strong growth in demand, based on increasing population, strong economic growth,rising per capita meat consumption
Slowing growth in agricultural production
Declining demand for stocks of food commodities
Escalating crude oil prices
Rapid expansionof biofuels production
Dollar devaluation
Speculation in futures markets
Rising farmproduction costs
Adverse weather
Large foreignexchange reserves
Aggressivepurchases by
importers
Exporter policies
Importer policies
Demand factors in gray
Supply factors in white
1998 2000 2002 2004 2006 2007 2008
Figure 2.4 Timeline of events contributing to the food crisis
Source: Adapted from Trostle (2008).Notes: The authors added “Speculation in futures markets” to the original figure because
this factor was excluded from Trostle’s (2008) analysis on the grounds that there was insufficient evidence at that time (R. Trostle, pers. comm., February 2010). In addition, the authors interpret all these factors as hypotheses only, whereas Trostle’s original figure referred to factors he considered likely causes of the crisis.
16 CHAPTER 2
23%
31%
30%
13%
4%
12%
64%
58%
65%
0.0 0.2 0.4 0.6 0.8 1.0 1.2 1.4
1980–2000
2000–2006
2006–2030
Average annual change in world primary oil demand (million barrels/day)
China
India
Other
Figure 2.5 Contributions to changes in primary oil demand, 1980–2000, 2000–06, and 2006–30
Source: IEA (2007, table 1.2). Note: 2006–30 data are based on the IEA (2007) projections.
International oil prices (U.S. dollars/barrel) Chinese crude oil imports (10,000 metric tons)
25
50
Sep
2005
Dec 2
005
Mar 20
06
Jun 2
006
Sep
2006
Dec 2
006
Mar 20
07
Jun 2
007
Sep
2007
Dec 2
007
Mar 20
08
Jun 2
008
Sep
2008
Dec 2
008
Mar 20
09
Jun 2
009
Sep
2009
Dec 2
009
75
150
100
125
800
1,400
1,200
1,000
1,600
2,200
1,800
2,000
Petroleum priceChinese oil imports
Figure 2.6 Chinese crude oil imports and international oil prices, September 2005–December 2009
Sources: IMF (2009a) for price data, and General Administration of Customs of the People’s Republic of China (2008).
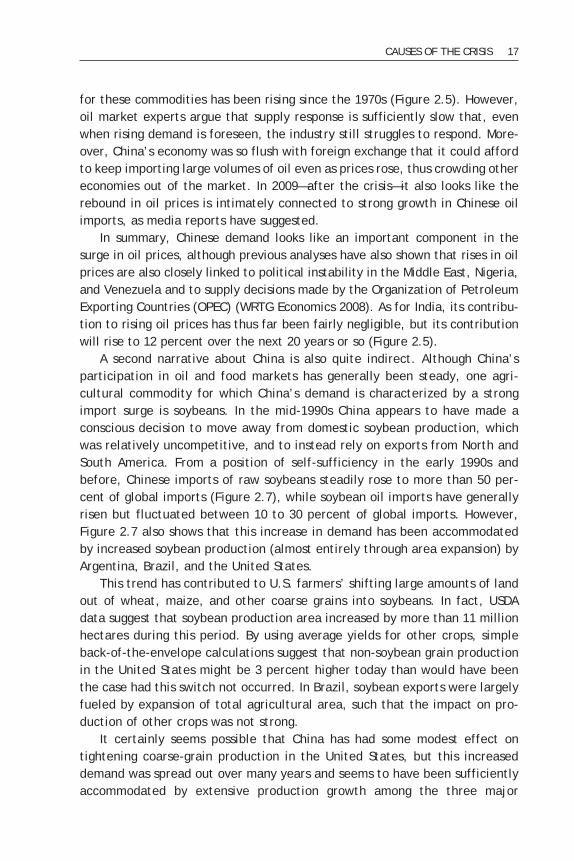
for these commodities has been rising since the 1970s (Figure 2.5). However, oil market experts argue that supply response is sufficiently slow that, even when rising demand is foreseen, the industry still struggles to respond. More-over, China’s economy was so flush with foreign exchange that it could afford to keep importing large volumes of oil even as prices rose, thus crowding other economies out of the market. In 2009—after the crisis—it also looks like the rebound in oil prices is intimately connected to strong growth in Chinese oil imports, as media reports have suggested. In summary, Chinese demand looks like an important component in the surge in oil prices, although previous analyses have also shown that rises in oil prices are also closely linked to political instability in the Middle East, Nigeria, and Venezuela and to supply decisions made by the Organization of Petroleum Exporting Countries (OPEC) (WRTG Economics 2008). As for India, its contribu-tion to rising oil prices has thus far been fairly negligible, but its contribution will rise to 12 percent over the next 20 years or so (Figure 2.5). A second narrative about China is also quite indirect. Although China’s participation in oil and food markets has generally been steady, one agri-cultural commodity for which China’s demand is characterized by a strong import surge is soybeans. In the mid-1990s China appears to have made a conscious decision to move away from domestic soybean production, which was relatively uncompetitive, and to instead rely on exports from North and South America. From a position of self-sufficiency in the early 1990s and before, Chinese imports of raw soybeans steadily rose to more than 50 per-cent of global imports (Figure 2.7), while soybean oil imports have generally risen but fluctuated between 10 to 30 percent of global imports. However, Figure 2.7 also shows that this increase in demand has been accommodated by increased soybean production (almost entirely through area expansion) by Argentina, Brazil, and the United States. This trend has contributed to U.S. farmers’ shifting large amounts of land out of wheat, maize, and other coarse grains into soybeans. In fact, USDA data suggest that soybean production area increased by more than 11 million hectares during this period. By using average yields for other crops, simple back-of-the-envelope calculations suggest that non-soybean grain production in the United States might be 3 percent higher today than would have been the case had this switch not occurred. In Brazil, soybean exports were largely fueled by expansion of total agricultural area, such that the impact on pro-duction of other crops was not strong. It certainly seems possible that China has had some modest effect on tightening coarse-grain production in the United States, but this increased demand was spread out over many years and seems to have been sufficiently accommodated by extensive production growth among the three major
CAUSES OF THE CRISIS 17

exporters. However, one factor we have to consider is interaction effects. A plausible hypothesis is that increasing soybean demand from China from 1995 onward reduced a great deal of the slack in U.S. soybean and maize markets (the two crops compete for land) such that when the biofuels surge occurred, the competition for land between maize and soybeans became much tighter. Consistent with this hypothesis, Figure 2.3 suggests that U.S. maize and soy-bean prices have tracked each other closely during 2005–09. China and India may have had a third indirect effect on food prices by means of depletion of stocks. Largely because of increased demand for meat, grain consumption has risen rapidly in China from 1991 to the present, and it has often outpaced production growth. For example, maize consumption in China increased by 88 percent, but production increased by only 55 percent. Because China hardly imports any maize (it is generally one of the larger net exporters of maize), most of this excess demand was satisfied through the depletion of stocks. Of course, China may have contributed in some small way to the crisis through the depletion of stocks, but this seems fairly unlikely. For one thing,
18 CHAPTER 2
Soybean exports or imports (thousand metric tons)
0
1990
1991
1992
1993
1994
1995
1996
1997
1998
1999
2000
2001
2002
2003
2004
2005
2006
2007
2008
20,000
80,000
40,000
60,000
Chinese importsGlobal imports excluding ChinaExports from United States,Brazil, Argentina
Figure 2.7 Chinese imports of soybeans and soybean oil, 1990–2008
Source: Constructed by the authors using data from USDA (2008c).Note: Global imports also equal global exports.

China is not a major exporter of maize, and China’s stock levels were exces-sively high prior to the recent surge and—at 22 percent of consumption—are still robustly above so-called optimal levels of 17–18 percent. And as for other cereals, China has long held excessively large stocks of wheat and rice. These stocks have declined somewhat in recent years, but relative to cur-rent consumption they are still extremely high. Indeed, Slayton and Timmer (2008) have suggested that China could largely solve the rice-price problem simply by releasing these stocks. So if China’s declining levels of stocks have had an effect on prices, it may be through some indirect effects on market psychology. But because China is not a major exporter of these commodities and looks unlikely to become a major importer any time soon, such a strong sensitivity to Chinese stock estimates among non-Chinese markets would seem somewhat irrational. As for Indian stocks of major cereals, these have been quite low in recent years (see below), and agricultural output growth in India has been volatile, but sluggish on average. However, India is not a major importer of cereals. In fact, it is typically the world’s second largest rice exporter and is also a moderately large exporter of wheat. However, a poor wheat harvest in 2006/07 led to pressure on India’s wheat stocks and India’s Public Distribution Scheme, which keeps stocks of both wheat and rice (Gulati and Dutta 2009). In 2006/07, government stocks of wheat fell short of buffer-stock norms, and about 6 million metric tons5 of wheat were imported. And although rice was in surplus and India exported more than 4.5 million tons of rice that year, the fear of a food shortage influenced policymakers, who faced impending national elections. Hence India’s decision to ban exports was not the result of rising economic growth or the end of India’s self-sufficiency in grain pro-duction but rather the interplay of bad weather, government policies, and national politics. All in all, then, we believe that the China–India hypothesis can largely be dismissed as a direct explanation for the price surge. However, this is not to say that economic growth in general was not a factor contributing to the crisis. As we argue below, monthly trade data suggest that several demand surges in recent years seem to be closely linked with international price movements. But these demand surges came from a diverse array of countries that do not include China or India. In addition, China’s contribution to the rising prices of oil and other nonfood commodities was indeed a significant, albeit not the sole, factor involved.
CAUSES OF THE CRISIS 19
5 Throughout this monograph the term “tons” refers to metric tons.

Productivity Decline and Falling R&DSeveral press articles and policy briefs have cited declining productivity growth and declining stocks as the principal causes of the supply–demand imbalance (for a review, see Abbott, Hurt, and Tyner 2008). In many of these documents, slowing productivity growth is chiefly attributed to lower rates of investment in agricultural research. Declining yields are used as evidence for reduced growth, including a widely cited figure from the World Bank’s (2008c) World Development Report that shows declining growth rates in yields of rice, maize, and wheat (especially in the 1990s). Other studies also cite land degradation as a cause of the productivity slowdown (see Pender 2009). However, Fuglie (2008) argues that total factor productivity (TFP) measures are preferable and finds that TFP growth did not decline on aver-age, but actually increased. Nevertheless, Fuglie did find that agricultural investment had slowed down, which potentially accounts for why TFP accel-erated even as partial productivity growth measures decelerated. In our view, however, several arguments suggest that the productivity-based explanation of the food crisis should be seriously questioned. Most importantly, it is highly questionable whether yield growth or TFP growth is directly relevant in this context. Logically, a global supply–demand imbalance relates to total production per capita and its impacts (if any) on global trade; yields and other productivity measures are only determinants of production. For a broader perspective, Figure 2.8 shows trends in yields, production, irri-gation, and input use across regions and from the 1960s to today. The most pertinent measure is production per capita, and it is indeed true that global cereal production per capita was about 6 percent lower in the 2000s than it was in the 1980s. In other words, cereal production did not keep up with population growth. The most important question is “What caused this decline?” The answer is complicated, but one simple means of addressing the question is to calcu-late global cereal production per capita after excluding individual regions, to supply at least superficial regional explanations of the decline in cereal production (Table 2.2). It turns out the oft-cited decline in Asian yield growth looks irrelevant (production growth would have been much lower if Asia were excluded from global production), confirming our earlier assessment of the China–India hypothesis. And although it is true that yield growth slowed in Asia, the slowdown came on the back of unsustainably high rates in the 1980s that resulted from the Green Revolution (a revolution cannot be sustained indefinitely). As shown below, poor performance in Australia is also not much of a long-term explanation, even though one could argue that climate change and unsustainable farming methods are affecting long-term growth.
20 CHAPTER 2

Africa’s experience is more relevant, because its population grew rapidly during this period, so Africa’s sluggish growth remains a reasonably strong explanation of the global decline in per capita agricultural production. But if one excludes Africa’s population and cereal production from the global calculations, the –6 percent reduction in global cereal production per capita increases to just –4.75 percent. So Africa’s poor performance only explains around one-quarter of the global decline. And for that one could certainly cite low R&D in Africa as an explanation, but only one of many. Other factors could include land degradation, the increasing exploitation of marginal lands, and some adverse outcomes of economic liberalization, which had negative impacts on both input and output markets (Kherallah et al. 2002). In any event, the remaining three-quarters of the decline in global food production is explained by poor performance in Europe (Figure 2.8), especially the former USSR and several Eastern European countries, which together account for virtually all the decline in European cereal production during 1985–2006 (Figure 2.9). The explanation of this decline does not con-cern yields, which grew fairly quickly. The real story is instead about inputs: land allocated to cereals in Europe declined by 30 percent during 1985–2006, the population working in agricul-ture fell by 50 percent, farming land equipped for irrigation declined by 26 percent, and fertilizer use declined by 62 percent. In other words, one novel explanation of the food crisis is the fall of the Berlin Wall and the ensuing policy and institutional failures (Liefert and Swinnen 2002; Rozelle and Swin-nen 2004). But international prices are primarily determined by trade, so for the decline in cereal production from East European and former Soviet regions to result in a rise in international prices, we need net exports from these countries to have also declined. However, USDA trade estimates sug-gest that net exports from this region actually increased. Indeed, it is other regions that experienced a decline in net cereal exports over the 1990s and 2000s: North America, South America, Sub-Saharan Africa, and the MENA region. The data also confirm that South Asia and East Asia (including India and China, respectively) are basically self-sufficient in cereals. Thus we find no substantial evidence that links a productivity decline to increased pressure in international cereal markets, except perhaps in Sub-Saharan Africa.
Rising Oil PricesInternational fuel and food prices are closely linked historically. Rising oil prices were closely associated with the 1972–74 crisis and indeed were arguably the dominant factor, so there is clearly some precedent here (see Table 2.1 and Figure 2.1). More systematic econometric evidence also con-
CAUSES OF THE CRISIS 21

22 CHAPTER 2
1960
1970
1980
1990
2000
020406080100
120
140
160
180
200
Area
equ
ippe
d fo
r ir
riga
tion
(m
illio
n he
ctar
es)
Afri
ca
Amer
icas
Asia
Euro
pe
Oce
ania
Afri
ca
Amer
icas
Asia
Euro
pe
Oce
ania
05101520253035404550
Cere
al y
ield
s (h
ecto
gram
s/he
ctar
e of
mill
ed r
ice
equi
vale
nt)
1960
1970
1980
1990
2000
Figu
re 2
.8
Tren
ds i
n yi
elds
, pr
oduc
tion
, an
d in
put
use
acro
ss r
egio
ns a
nd d
ecad
es

CAUSES OF THE CRISIS 23
Sour
ce:
Calc
ulat
ions
by
the
auth
ors
usin
g da
ta f
rom
FAO
(20
09).
1960
1970
1980
1990
2000
Afri
caAm
eric
asAs
iaEu
rope
Wor
ldAf
rica
Amer
icas
Asia
Euro
pe
020406080100
120
140
160
Fert
ilize
r us
e (k
ilogr
ams/
hect
are)
1960
1970
1980
1990
2000
0
100
200
300
400
500
600
700
800
Cere
al p
rodu
ctio
n pe
r ca
pita
(m
etri
c to
ns o
f m
illed
ric
e eq
uiva
lent
)

24 CHAPTER 2
Table 2.2 Growth rates in cereal production per capita, 1980s–2000s
Growth rateRegion (percent) Implication
World (total) –6.1World minus Africa –4.8 Africa accounts for almost one-quarter of global shortfallWorld minus Americas –5.8World minus Asia –9.6 Asian growth was much stronger than global growthWorld minus Europe –2.8 Eastern Europe accounts for almost half of global shortfallWorld minus Oceania/Australia –6.3
Source: Calculations by the authors using data from FAO (2009).Notes: Growth rates are calculated as the percentage difference between average annual
cereal production per capita during 2000–06 and average annual production in the 1980s. Cereal production is measured as milled rice equivalent.
Others4%
Yugoslavia3%
Czechoslovakia4%
Hungary6%
Romania11%
USSR72%
Figure 2.9 Explaining Europe’s declining cereal production, 1985–2006
Source: Calculations by the authors using data from FAO (2009).

firms this link. Using data from 35 internationally traded primary commodi-ties for 1960–2005, Baffes (2007) finds that the pass-through of crude oil price changes to the overall non-energy commodity index is 0.16, whereas the fertilizer index had the highest pass-through (0.33), followed by agriculture (0.17) and metals (0.11). What explains this strong link? Oil can affect food prices through various channels, including both the supply and demand sides. Here we focus on two: supply-side costs of agricultural production and biofuels (which are discussed separately below).6
On the supply side, oil and oil-related costs constitute a substantial com-ponent of the production of most commodities, so rising oil prices provide a strong explanation of commodity-price escalation across a wide range of food and nonfood commodities. Moreover, unlike noncommodity sectors, agriculture is more reliant on fuel-related inputs than on other types of energy. Figure 2.10 compares International Energy Agency (IEA) data, which disaggregate energy usage by economic sector and by energy source. Total energy usage at the national level is then compared with total output mea-sured in current U.S. dollars. Figure 2.10a shows that, relative to its output, agriculture does not use a large amount of energy in production. Clearly these calculations depend on the prices of different types of energy, however. For that reason Figure 2.10b shows the proportion of all energy usage in a sector that is accounted for by oil-related energy. Agriculture is second only to transport in the oil intensity of its energy usage, suggesting marginal costs in agricultural production could be quite sensitive to oil prices, although cross-country evidence listed in Appendix Table A.1 suggests that substantial variations exist across countries. U.S. agri-cultural production in particular, though, is almost solely dependent on oil for its energy use. And to rising fuel costs we also need to add the enormous surge in fertilizer prices, most of which are made from energy products, such as natural gas. Indeed, energy costs can constitute up to 90 percent of the costs of fertilizer production (for example, nitrogen fertilizers), which helps explain why fertilizer prices rose by double the amount of cereal prices from 2005 to 2008. Moreover, the bulky nature of grains means that agricultural prices are strongly influenced by transport costs. But just how substantial are energy costs in food production and trade? Mitchell (2008) provides the best appraisal of the effect of energy costs on
CAUSES OF THE CRISIS 25
6 One might add some kind of general inflationary effect, but our focus is on changes in food prices relative to other prices. Rising oil prices also positively affected the economic growth of energy-exporting economies, many of which are major importers of food staples. This effect is discussed separately below.

rising export prices, although some of his calculations are rather sensitive to the methodology he adopts. First, Mitchell (2008) finds that the contribu-tion of the energy-intensive components of total production costs (fertilizer, chemicals, fuel, lubricants, and electricity) in U.S. production were 13.4 per-cent for maize, 6.7 percent for soybeans, and 9.4 percent for wheat. Mitchell uses these data to calculate that the production-weighted average increase in the cost of production due to these energy-intensive inputs for these crops was 11.5 percent between 2002 and 2007. Transport costs also increased because of higher fuel costs, and the margin between domestic and export prices reflects this increase. Mitchell (2008) calculates that the margin for maize between central Illinois and the Gulf ports increased from US$0.36 to US$0.72 per bushel, whereas the margin for wheat between Kansas City and the Gulf ports registered hardly any increase at all. An export-weighted aver-age of these prices suggests that transport costs could have added as much as 10.2 percent to the export prices of maize and wheat (comparable data were not available for soybeans). Hence Mitchell (2008) estimates that the combined increase in production and transport costs for the major U.S. food commodities—maize, soybeans, and wheat—was at most 21.7 percent during 2002–07.
26 CHAPTER 2
Energy use per million U.S. dollars of output(thousand metric tons of oil equivalent)
0.00
1.20
1.00
0.80
0.60
0.40
0.20
Tran
spor
t
Share of oil in total energy use (percent)
0
100
90
80
70
60
50
10
20
30
40
All o
ther
Indus
try
Agric
ultur
e
Tran
spor
t
Agric
ultur
e
Indus
try
All o
ther
Oil
Non-oil
More developed
Less developed
a b
Figure 2.10 Intensity of energy and oil use in production: Some macroeconomic measures
Sources: Calculations by the authors using data from IEA energy balance sheets on energy use by source of energy and sector (IEA 2008), and United Nations (2008) national accounts data on value-added in U.S. dollars by sector.
Note: Sample includes a set of more-developed countries (excluding one significant outlier, Australia) and less-developed countries.

However, in recalculating production costs ourselves, we found that Mitchell’s (2008) estimates are somewhat sensitive to his assumptions, and that energy-related production costs were probably higher than the 11.5 percent increase that Mitchell derived. For one thing, total production costs include several nonexplicit (imputed) costs associated with the management side of farm production that are more-or-less fixed costs. In terms of more variable operating costs (which exclude management-related items), we calculate that fuel-related costs are about 80 percent of the total. Second, Mitchell deflates his cost measures by yield differences between 2007 and 2002 (to calculate per bushel energy costs), but yields were unusually low in 2002 for wheat and maize. Using 2001 data actually makes some difference. Third, the energy component of rising production costs is probably best cal-culated by asking what production costs would be in 2007 if fuel-related costs had only increased by the same margin as prices in the broader economy (that is, by the GDP deflator), which was about 20 percent during 2002–07. In thatcase it would appear that production costs were 30–40 percent higher in 2007 than they would have been without oil-related cost increases during 2001–07 (Table 2.3). Hence, at least for U.S. production costs, we find that rising energy costs are a strong factor. We also note that the rise in energy
CAUSES OF THE CRISIS 27
Table 2.3 Estimated impact of fuel-related costs on U.S. farming costs, 2001–07
Rownumber Indicator Maize Soybeans Wheat
1 Yield gap (ratio of 2001 to 2007 yields) 0.9 0.9 12 Total costs in 2007 with 2001 cost levelsa 325.1 225.6 180.1 (U.S. dollars) 3 Actual total costs in 2007 (U.S. dollars) 453.5 295.4 235.74 Difference (row 3 – row 2) (U.S. dollars) 39.5 30.9 30.95 Difference deflated by yield growth 35.5 27.8 27.8 (row 4 x row 1) (U.S. dollars) 6 Change in prices received by farmers (percent) 132.6 99 101.77 Oil-related cost increase as a percentage of 8 11 20.3 the total price increase paid to farmers (row 5 ÷ row 6)
Source: Calculations by the authors using data from USDA (2008b).Notes: The percentage change in prices uses actual prices received by farmers for 2000/2001
and actual prices received by farmers in 2006 multiplied by the percentage change in U.S. export prices, because actual prices received by farmers in 2007 were not avail-able at the time of writing. If farmers received less than the full U.S. export price change from 2006 to 2007, then the last indicator (oil-related cost increase as a per-centage of the total price increase paid to farmers) is underestimated.
aExtrapolated to 2007 using the U.S. Bureau of Economic Analysis gross domestic product deflator.

prices predates that in food prices, which at least suggests the possibility that rising energy prices caused food prices to increase, rather than the reverse. However, we also attribute a large role to demand-side factors that would have interacted with supply-side factors affecting production costs. If the supply curve alone had shifted upward because of rising fuel prices, the profits of farmers and food wholesalers would not normally be expected to rise much unless demand was very inelastic. Because U.S. farmers (and major firms, such as Cargill) experienced sharply rising profits in 2006, 2007, and 2008 (see Appendix Table A.2), it can safely be inferred that demand factors are also important contributors to rising food prices. Indeed, we argue below that biofuels and import surges are two highly significant sources of demand growth.
BiofuelsThe third and newest link between oil prices and food prices is biofuels. Once oil prices exceed US$60 a barrel, biofuels become more competitive, and grains may be diverted to biofuel production (Schmidhuber 2006), especially if high oil prices are expected to persist. Most of the more rigorous analyses to date conclude that the diversion of the U.S. maize crop from food to biofuel uses constitutes the largest source of international biofuel demand and the largest source of demand-induced price pressure (Abbott, Hurt, and Tyner 2008; Mitch-ell 2008; Schepf 2008; von Braun 2008a). The reasons are as follows:1. The use of maize for ethanol grew especially rapidly from 2004 to 2007,
and ethanol production used 70 percent of the increase in global maize production.
2. The United States is the largest producer of ethanol from maize and is expected to use about 81 million tons for ethanol in the 2007/08 crop year (USDA 2008a).
3. The United States accounts for about one-third of global maize produc-tion and two-thirds of global exports, so impacts on U.S. production easily affect international prices (Mitchell 2008).
4. European biofuel production is concentrated on biodiesels and uses about 7 percent of global vegetable oil supplies (amounting to about one-third of the increase in vegetable oil consumption from 2004 to 2007).
5. Biofuel production in other parts of the world is either relatively small or uses different crops (for example, sugarcane in Brazil), which have not experienced price surges.
Biofuels constitute a major new source of demand in maize and vegetable oil markets, so biofuels are an especially strong candidate to explain price rises in these markets. But the knock-on effects for other foods are also sig-
28 CHAPTER 2
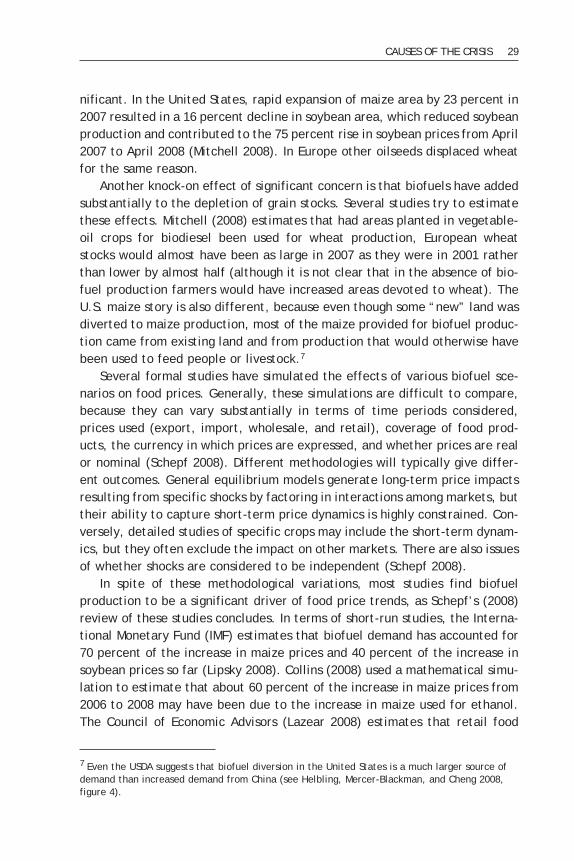
nificant. In the United States, rapid expansion of maize area by 23 percent in 2007 resulted in a 16 percent decline in soybean area, which reduced soybean production and contributed to the 75 percent rise in soybean prices from April 2007 to April 2008 (Mitchell 2008). In Europe other oilseeds displaced wheat for the same reason. Another knock-on effect of significant concern is that biofuels have added substantially to the depletion of grain stocks. Several studies try to estimate these effects. Mitchell (2008) estimates that had areas planted in vegetable-oil crops for biodiesel been used for wheat production, European wheat stocks would almost have been as large in 2007 as they were in 2001 rather than lower by almost half (although it is not clear that in the absence of bio-fuel production farmers would have increased areas devoted to wheat). The U.S. maize story is also different, because even though some “new” land was diverted to maize production, most of the maize provided for biofuel produc-tion came from existing land and from production that would otherwise have been used to feed people or livestock.7
Several formal studies have simulated the effects of various biofuel sce-narios on food prices. Generally, these simulations are difficult to compare, because they can vary substantially in terms of time periods considered, prices used (export, import, wholesale, and retail), coverage of food prod-ucts, the currency in which prices are expressed, and whether prices are real or nominal (Schepf 2008). Different methodologies will typically give differ-ent outcomes. General equilibrium models generate long-term price impacts resulting from specific shocks by factoring in interactions among markets, but their ability to capture short-term price dynamics is highly constrained. Con-versely, detailed studies of specific crops may include the short-term dynam-ics, but they often exclude the impact on other markets. There are also issues of whether shocks are considered to be independent (Schepf 2008). In spite of these methodological variations, most studies find biofuel production to be a significant driver of food price trends, as Schepf’s (2008) review of these studies concludes. In terms of short-run studies, the Interna-tional Monetary Fund (IMF) estimates that biofuel demand has accounted for 70 percent of the increase in maize prices and 40 percent of the increase in soybean prices so far (Lipsky 2008). Collins (2008) used a mathematical simu-lation to estimate that about 60 percent of the increase in maize prices from 2006 to 2008 may have been due to the increase in maize used for ethanol. The Council of Economic Advisors (Lazear 2008) estimates that retail food
CAUSES OF THE CRISIS 29
7 Even the USDA suggests that biofuel diversion in the United States is a much larger source of demand than increased demand from China (see Helbling, Mercer-Blackman, and Cheng 2008, figure 4).

prices increased only about 3 percent during 2008 due to biofuel production, but this low value is largely because they only considered the impact of maize prices on retail food prices, for which raw maize only constitutes a small por-tion of the total value-added. Rosegrant et al. (2008) use a partial equilibrium model to calculate the long-term impact on weighted cereal prices of the acceleration of bio-fuel production from 2000 to 2007 to be 30 percent in real terms. Maize, wheat, and rice prices were simulated to increase 47, 26, and 25 percent, respectively (applying Schepf’s conversion to the real-price estimates of the model), which is similar in order of magnitude to values calculated using the World Bank’s linkages model (World Bank 2008a). In terms of the effects of U.S. biofuel policies, a study by the Food and Agricultural Policy Research Institute (FAPRI) attempts to measure the pure and joint price effects of the U.S. biofuel subsidies and tax credits. FAPRI’s study (Meyers and Meyer 2008) suggests that implementation of subsidies (in the absence of the tax credit) will raise maize prices by about 19 percent once the new long-run equilibrium has been established. The FAPRI study also estimates that the ethanol tax credit of US$0.51 per gallon supports maize prices by a slightly smaller amount—11 percent. Because of interac-tions between the two subsidies, it is estimated that joint implementation of both the Renewable Fuels Standard and tax credit supports maize prices by about 20 percent. Strong effects were also observed by FAPRI for other commodities because of competition for land: the wholesale price of soybean oil is projected to increase 73 percent under the joint subsidy + tax-credit scenario. A similar study by the Center for Agricultural Research and Develop-ment (CARD) found that the subsidy + tax-credit program supported the price of maize by 16 percent (McPhail and Babcock 2008). Both studies found the results to be highly dependent on the price of petroleum (or gasoline), which substitutes for government incentives and diminishes the relative impact of such incentives on maize prices. Schepf (2008) notes that neither study evalu-ates the effect of the U.S. import tariff of US$0.54 per gallon on imported ethanol from Brazil, although the CARD study points out that the maize price impacts would be greater if the tariff on Brazilian ethanol were eliminated. In addition, neither study includes the effects of the various grants and sub-sidized loans that have been made available to the U.S. biofuel sector for research and infrastructure development. Abbott, Hurt, and Tyner (2008) are also critical of some of the studies discussed above, insofar as they incorpo-rate substitution effects that are stronger than those observed in the real world. Biofuel lobby groups have also pointed out that ethanol only uses thestarch in maize, preserving the maize oil and protein, so that about one-third
30 CHAPTER 2

of the maize made into ethanol goes back into the animal-feed system. Hence the diversion from food uses is generally overestimated. Despite these qualifications, there is little doubt that biofuel demand in the United States is having a major impact on maize prices and probably on soybeans as well, while E.U. and European agricultural trends toward increased oilseed production have increasingly affected wheat markets. Moreover, the unwillingness of these governments to move away from biofuel subsidies will probably keep agricultural markets significant tighter for years to come. Helb-ling, Mercer-Blackman, and Cheng (2008) also note an asymmetry: biofuel industries have large effects on agricultural prices and very small effects on oil prices. So for the moment at least, biofuels are not substantially lessen-ing the impact that rising oil prices are having on agricultural production and trade.
Declining Stocks and ReservesThe total supply of agricultural goods depends not only on current production but also on available stocks. Moreover, stocks are probably the most direct indicator of security for both food self-sufficient countries and major food importers who monitor the stocks of their largest suppliers. For such com-modities as rice, which is dominated by consumers who depend on rice as their staple food, demand is highly inelastic. It is only when demand for stocks is added to demand for current consumption that total demand becomes more elastic (because a decrease in production can be compensated for by release of stocks). Conversely, relatively small changes in supply at low levels of stocks can result in rapid price changes (Wright 2009). Food scientists and economists have generally argued that countries need to keep stocks of around 17–18 per-cent of total consumption or use levels (FAO 1983), although a clear distinc-tion should be made between countries that predominantly consume staples and those that predominantly export them. Exporters of staples usually have little interest in keeping any reserves in excess of those needed to ensure a steady supply of staples to their export destinations, although hoarding is pos-sible if suppliers are confident that a price rise is on the horizon. Stocks certainly seem to be highly relevant to the current crisis, if only because there has been much more action in the trends of stocks for major staples than in production tends. Indeed, stocks have declined markedly in recent years. Figure 2.11 presents a highly aggregated picture of trends in the global stocks of wheat, maize, and rice relative to the global consumption of each staple, along with the average real international dollar price of all three staples. Agricultural economists rightly emphasize that when stocks are high, prices are generally low and stable. This high-stock/stable-price regime char-
CAUSES OF THE CRISIS 31

acterized the 1950–60s, and the 1980–90s, but not the 1970s or the current decade. Indeed, declining stocks preceded the 1974 food crisis, when wheat stocks declined from 30–35 percent of consumption in the 1960s to just more than 20 percent in the early 1970s, and maize stocks declined from more than 20 percent in the 1960s to just 12 percent during the 1972–74 crisis (Rojko 1975). Rice stocks—which are primarily produced and consumed in developing Asia—were just being built up in the 1960s as the Green Revolution began, so they are less relevant in explaining the 1972–74 crisis. Likewise, in the recent crisis the stocks of all three staples declined at about the same time, 2000–2003, before the price surge. Maize stocks in particular have shrunk to well below the 17–18 percent benchmark, and rice and wheat stocks are now roughly at that benchmark. The facts support the conclusion that stock declines present a potentially powerful explanation for the price increases, because stocks declined across all three major staples, and these declines occurred well before the current crisis (and well before the 1972–74 crisis). Our view, however, is that stock declines only offer a superficial expla-nation for the price surge, and that the relevant factors determine what is behind the decline in stocks. We suggest three possible explanations of why
32 CHAPTER 2
Estimated end-of-year stocks(percentage of consumption)
Average real price index(1960 � 1)
0
1960
1963
1966
1969
1972
1975
1978
1981
1984
1987
1990
1993
1996
1999
2002
2005
2008
50
45
40
35
30
25
20
15
10
5
0.0
0.5
1.0
2.5
1.5
2.0
WheatRiceCornAverage price
Figure 2.11 Global trends in stocks relative to consumption, 1960–2008
Source: Calculations by the authors using data from USDA (2008c).

stocks have declined. First, declining stocks might simply reflect increased demand or reduced production levels, which would then push the burden of explanation back to other factors, such as weather shocks or biofuels. Sec-ond, stock levels could have declined because of exogenous policy decisions, such as the view that stocks were too high or involved too much wastage. This observation seems particularly pertinent to China as well as some of the former Soviet bloc countries. And third, prices could affect stock decisions, so that very low food prices up until 2003 may have decreased the apparent need to hold stock, especially given the advent of just-in-time inventory systems. All these explanations have some merit, but they are very difficult to observe empirically. The most important means of delving further into the stocks story is to set aside China. China is estimated to have had immensely high stock-to-use ratios for all major cereals in the 1990s—on the order of 70–90 percent—and markedly reducing these stocks was a justified policyaction for China. Table 2.4 presents stocks of major consuming and export-ing countries and recalculates global trends with and without China for 1990–2000 and 2005–08. Netting out China turns out to be very important.8 World stocks for maize, for example, declined from 26 percent of consump-tion during 1990–2000 to just 14 percent during 2005–08, but excluding China from the global figures suggests that world stocks remained the same over the two periods, at just 12 percent. However, because the United States heavily dominates maize exports, U.S. stock trends—which declined from 16 to 12 percent over the two periods—still offer a promising explanation of maize price trends. The USDA has argued that biofuel production has already contributed to the depletion of U.S. maize stocks and will continue to do so in the next decade (USDA 2008a), and maize prices, biofuel demand, and maize stocks all appear to have changed at about the same time (Figure 2.12).9 It is also possible that surges in foreign demand in 2006 and 2007 also contributed somewhat to these stock declines, as we show below. The story for wheat is complicated. Without China, world wheat stocks declined from above the recommend 17–18 percent threshold in the 1990s (19 percent) to several points below the threshold in 2005–08 (14 percent). Stocks declined in Canada, Europe, India, Kazakhstan, Pakistan, Russia (to just 7 percent of use), Ukraine, and the United States (bizarrely, stocks increased significantly in drought-affected Australia). What explains this almost perva-sive decline in stocks? There appear to be two factors: one is long term and the other short. The long-term story is that, globally, per capita production
CAUSES OF THE CRISIS 33
8 One caveat here is that the USDA only projects stock levels in China, so we cannot claim that data errors do not significantly alter our inferences from these data.9 See Dawe (2009) for similar arguments.

34 CHAPTER 2
Table 2.4 Trends in stocks relative to domestic consumption plus exports among major exporters and consumers, 1990–2000 and 2005–08
Level ofCommodity Country or region exports 1990–2000 2005–08 Stock outcome
Maize Argentina Major 6 7 Up but low China Minor 93 24 Well down but still high India Major 3 7 Up but low EU-15 Minor 8 14 Up United States Major 16 12 Well down World — 26 14 Well down World (excluding China) 12 12 UnchangedRice China Moderate 70 29 Well down EU-15 Minor 22 37 Up India Major 18 13 Down Pakistan Major 19 8 Well down Thailand Major 7 13 Up United States Major 15 14 Unchanged Vietnam Major 2 7 Up but low World — 33 17 Well down World (excluding China) — 14 13 Largely unchanged but lowWheat Argentina Major 4 3 Always low Australia Major 20 35 Up Canada Major 32 24 Down but still high EU-15 Major 16 11 Down and below optimum India Major 13 6 Down and below optimum Kazakhstan Major 23 14 Down Pakistan Minor 17 11 Down and below optimum Russia Major 16 7 Down and below optimum Ukraine Major 23 11 Down United States Major 27 21 Down but still high China Minor 71 38 Well down but still very high World — 27 18 Down but still adequate World (excluding China) 19 14 Down and below optimum
Source: Calculations by the authors using data from USDA (2008c).Notes: EU-15 includes Austria, Belgium, Denmark, Finland, France, Germany, Greece, Ireland,
Italy, Luxembourg, Netherlands, Portugal, Spain, Sweden, and the United Kingdom; —, not applicable.
Stocks / (consumption + exports)

of wheat grew rapidly in the 1960s and 1970s but stagnated in the 1980s and declined in the 1990s. The long-term decline in production is, again, almost entirely due to the structural changes taking place in the former USSR coun-tries. Hence, when the former USSR and China are excluded from the global estimates of wheat stocks/use ratios (Figure 2.13), the recent crisis is marked by fairly moderate declines in wheat stocks, in contrast to the 1970–74 crisis, when stocks in the United States were severely depleted by exports to the USSR and China (that is, the Communist countries kept their stock-to-use ratios constant at the expense of stocks-to-use ratios in the Western coun-tries). The short-term wheat story appears to be a combination of some poor harvests (2002, 2003, and 2006) and increasing international demand: average annual production growth was 1.7 percent during 2000–08, whereas average annual export growth was 2.3 percent despite rising prices. In the case of wheat we show below that surges in foreign demand entirely explain the sharp decline in U.S. stocks in 2007. For rice, the exclusion of China suggests that there has been virtually no change in the global stock-to-use ratio. China is estimated to have had
CAUSES OF THE CRISIS 35
0.0
1.2
1992
1991
1994
1996
1998
1999
2000
2001
2002
2003
2004
2005
2006
2007
2008
1993
1995
1997
1.4
2.0
1.0
0.8
0.6
0.4
0.2
1.6
1.8Stock/use ratioCorn bushels used for biofuelsCorn price
Figure 2.12 Trends in stocks, prices, and biofuel production: U.S. maize
Sources: Data on stocks, usage, and biofuels were calculated by the authors using data from USDA (2008c); data on maize prices were calculated by the authors using data from IMF (2008b).
Note: 2005 = 1 for all series.

extremely high stock levels (70 percent of use in the 1990s) and has quite rationally reduced them. Indian and Pakistani stocks have also decreased to what may seem like perilously low levels, although there are caveats in these cases as well. Pakistan (unlike India) tends to export a large proportion of its rice production (chiefly the Basmati variety), whereas in India stocks came down from inefficiently high levels and were still well above the long-term norm during the recent food crisis (Gulati and Dutta 2009). Wheat stock declines in India reflect poor harvests that resulted in that country engaging in unusually large imports in 2006 (6 million tons). Indeed, it was actually its recent experience with wheat shortages that prompted the Indian govern-ment to restrict non-Basmati rice exports in November 2007, as well as a surge in demand for Indian rice exports, possibly because of substitution effects from the ensuing crisis in international wheat markets (Headey 2010). In other major exporting countries the stocks story is even less compel-ling. Stocks have actually almost doubled in the world’s largest rice-exporting country (Thailand) and have been rising quickly in another leading exporting country (Vietnam). Thus stocks do not look like an important factor in deter-mining rice prices, except insofar as they contributed to India’s rice export ban, which did have a big impact on surging prices beginning in late 2007.
36 CHAPTER 2
Stocks to production ratio (percent)
1970–74: large stock declinesin rest of world because of U.S.export to USSR and China
2004–08: moremoderate stockdeclines in rest
of the world
0
20
25
40
15
10
5
30
35
WorldWorld excluding China and USSR
1972
1970
1974
1976
1978
1980
1982
1984
1986
1988
1990
1992
1994
1996
1998
2000
2002
2004
2006
2008
Figure 2.13 Global trends in wheat stocks-to-use ratios
Source: Calculations by the authors using data from USDA (2008c).

Instead, export bans, panic buying, and a justifiable fear that more such actions would follow seem to be the principal causes of the rice crisis. In this regard our assessment partly contradicts that of Wright (2009). Are stock declines, then, a powerful story when it comes to explaining the price surge? Stock declines played only an indirect role for rice, biofuel demand seems to account quite well for maize stock declines, and trade and production shocks seem to explain some of the decline in wheat stocks. These factors suggest that declining stocks were largely caused by other factors rather than acting as a primary cause, although low stocks probably did exacerbate the price rise after the initial impetus, especially as market actors closely monitor stocks. Recent evidence collated by Abbott, Hurt, and Tyner (2009) also suggests that U.S. maize stocks in 2007 and 2008 were much higher than would have been predicted by the prices prevailing at the time (Figure 2.14). In conjunction with the evidence shown in Figure 2.13, it would appear that this crisis was not precipitated by stock declines. So in some contrast to Wiggins (2008) and other observers, our doubts regarding causation and the efficacy of stocks in managing the global food sys-
CAUSES OF THE CRISIS 37
Corn price index
0.00
3.50
0.50
1.00
1.50
2.00
2.50
3.00
0.00 0.05 0.10 0.15
U.S. stocks-to-use
May 96
Jul 96 Jun 96Apr 96
Aug 96
Dec 08Sep 07 Oct 07
Nov 07Dec 07
Nov 08
Oct 08Jan 08Feb 08
Mar 08 Aug 08, Sep 08May 08
Apr 08 Jul 08
Jun 08
0.20 0.25 0.30
Figure 2.14 Monthly maize prices relative to U.S. maize stocks, April 1996–December 2008
Source: Calculations by Abbott, Hurt, and Tyner (2009).
tem make us skeptical that declining stocks are a principal cause of the crisis. There are also legitimate reasons to think that larger stocks are not an impor-tant part of the solution. Maintaining high levels of stocks is costly, multi-lateral grain reserves suffer from weak incentives for participation, and trade liberalization is potentially a viable alternative to large international reserve systems. However, we leave this complex issue for future research.10
Decline of the U.S. DollarSome analyses have at least made passing mention of the weakening of the U.S. dollar over the past 6 years and have even analyzed the simple arith-metical implications of depreciation for transmission of international prices into domestic prices. However, only one or two papers have also assessed the extent to which the depreciation of the dollar has had a causal impact on food prices, and, as noted above, the rise in commodity prices is much less when converted to euros. Why the U.S. dollar has depreciated as it has does not particularly concern us here, although the most obvious cause of the general decline is the large U.S. trade deficit and low real interest rates in the United States. Of more interest is how the depreciating dollar might have caused changes in food prices and in a broader range of commodity prices. Abbott, Hurt, and Tyner (2008) make note of three crucial facts regarding these relationships. First, the patterns of commodity price changes and nominal exchange-rate movements have been similar since 1970: when the dollar is weak, com-modity prices are generally high, and when the dollar is strong, commodity prices decline (this pattern is also shown by the decline in food prices and the strengthening of the dollar since mid-2008). In the case of oil, the rela-tionship has often been quite direct. A weakening U.S. dollar was one of the primary motivations for OPEC’s decision in 1974 to raise oil prices. In the current crisis the divergence between the dollar and many (but not all) other currencies is quite stark compared to previous increases in nominal dollar-denominated food prices (such as during 1995–96). Second, the variations in commodity prices have always been greater than changes in exchange rates, which is especially true for the recent dollar depreciation. This phenomenon is perhaps due to the dampening effects of capital flows. And third, changes in agricultural commodity prices also appear to have lagged other commodity price changes, especially since 2002, so that recent high agricultural com-modity prices are just now catching up with price increases for oil and metals
38 CHAPTER 2
10 See Headey and Raszap Skorbianksy (2008) for a review, as well as Williams and Wright (1991) and <http://www.bufferstock.org/biblio.htm#trade>.

that began earlier. This lag may be because the initial surge in demand for cereals was partly met through depletion of stocks, thus delaying the price change but perhaps making it sharper than would otherwise have been the case. In addition, there is the more important role of Chinese demand in price formation for nonfood commodities. As for the effects of the depreciation of the U.S. dollar, conversion to euros, for example, would cut off 20–30 percent of the nominal increase in U.S. dollar–denominated food prices (inflation rates in Europe and the United States have not diverged much, so conversion to real prices matters little). But is there also a causal effect? As Abbott, Hurt, and Tyner (2008) discuss, when the dollar weakens, agricultural exports—and particularly grain and oilseed exports—grow. Using USDA’s agricultural trade-weighted index of real foreign currency per unit of deflated dollars, they find that from 2002 to 2007 the U.S. dollar depreciated 22 percent, and the value of agricultural exports increased 54 percent. Assuming that the United States is a large country in international agricultural markets—which it certainly is for maize, soybeans, and wheat—depreciation of the exchange rate should lead to higher prices in the United States but lower prices in the rest of the world, all else being equal. Previous research has indicated that a depreciation of the U.S. dol-lar increases dollar commodity prices with an elasticity between 0.5 and 1.0 (Gilbert 1989), and Mitchell (2008) calculates that the depreciation of the dollar has increased food prices by about 20 percent, assuming an elasticity of 0.75.
Low Real Interest RatesAnother theory that has been advanced in some quarters is that low real interest rates (Frankel, 2008a, 2008b, 2008c), especially in the United States, have caused a general price increase in a wide range of commodities (for a discussion of the theory, see Lustig 2008). The decision on whether to hold a commodity for the next period (in stocks or in the ground) or to sell it at the current price, invest the proceeds, and earn interest will depend on the interest rate and expectations about prices in the future. When interest rates are low, money flows out of interest-bearing instruments and into for-eign currencies, emerging market stocks, other securities, and commodities, including food commodities. This portfolio shift drives the prices of these assets higher and higher until they reach a level where people perceive that they lie above their future long-term equilibrium level. Monetary policy therefore causes real commodity prices to rise more than other prices, because other prices are “sticky” (in other words, they rise at a lower rate). Because of the different rates of price adjustments and arbitrage conditions regarding price expectations and interest rates, commodity prices and other
CAUSES OF THE CRISIS 39

asset prices overshoot in real (and often in monetary) terms. Frankel (2006) provides econometric evidence in support of the inverse relationship between commodity prices and real interest rates in the United States dating back to the 1950s, and Frankel argues that more recent data points—before and after the commodity price peak in mid-2008—are consistent with historical evidence and the overshooting hypothesis. How consistent this theory is with the evidence is still questionable, how-ever. Some commentators claim that a major inconsistency is that inventories are not high, but low. How true this observation is for metals and minerals is debatable, because part of the “inventory” of these commodities is in the ground, so that stocks for some of these commodities are not especially low (for example, oil). But agricultural stocks are low by historical standards. Of course, the data on stocks could be wrong or biased, because it is difficult to measure private stocks and because public reserves are influenced by policy decisions that may not be consistent with profit motives. Another caveat is that the diversion of assets from treasury bills and the like to commodities may have influenced agricultural futures prices, but as noted above, the jury is still out on the issue of whether futures prices affect spot prices. It is also difficult to distinguish between this channel of impact resulting from low interest rates and the effects of interest rates on exchange rates.
Speculation in Financial MarketsVarious commentaries have suggested that commodity futures markets may have triggered the oil and food crises, and speculators have been denounced in the popular media and in high-level political circles. In fact, many of these discussions are themselves speculative, based on little theoretical reasoning or robust empirical evidence. The background to the speculation debate is that futures markets are relatively new to agriculture. For nearly a century, food markets have been organized around forward contracts between producers and buyers that reduce producers’ risks by providing a guaranteed future price. Over time, the forward contract market developed into a futures contract market consisting of forward contracts that can be traded as separate financial prod-ucts on exchanges, the most important of which is the Chicago Board of Trade (CBOT) Futures Exchange. The reputed benefit of food securitization is that it facilitates hedging against risk and price discovery, because it allows buyers and sellers of agricultural commodities to indicate their expectations of price move-ments. Futures prices therefore provide a benchmark for spot prices. Despite these benefits, there may be risks (CBC 2008). One area of concern is that, unlike forward contracts, futures contracts allow a variety of non-commercial participants to partake in trade (that is, those who are not directly engaged in agricultural production, distribution, and delivery to markets).
40 CHAPTER 2

Because the U.S. Commodity Futures Trading Commission gradually loosened the rules over who may trade in agricultural futures markets such that by 2008, index funds’ participation in futures markets has grown by leaps and bounds: they accounted for about 40 percent of the futures contract trading in wheat, with smaller shares in maize (27.4 percent) and soybeans (20.8 per-cent). The potential significance of this trend is that nontraditional partici-pants can now speculate on food price trends, because the value of a futures contract varies in relationship to the commodity prices in the current spot market, much as bond prices vary in response to changing interest rates. This variation affords speculators an opportunity to bet on futures contracts as a separate asset class quite apart from the spot prices of agricultural commodi-ties in today’s market. So a short futures position (involving contracts that function up to 6 months) protects against price decreases, whereas a long futures position (involving contracts of longer than 6 months) enables the holder to benefit from price increases in the longer term. Most commercial agricultural traders play in the short futures market, because it is critical to the fundamentals of agriculture and decisions on agricultural production and delivery. Most noncommercial players (that is, financial intermediaries) play in the long-term market of contract price expectations. Hence, measures of speculative activity typically focus on long positions, or the share of long positions taken by index funds. Proponents of the speculation hypothesis must establish theoretical and empirical linkages between speculation and futures prices, and between futures prices and spot prices. This is no easy task. Sanders and Irwin (2010) review theory and evidence. They suggest three logical inconsistencies in the arguments made by bubble proponents as well as five instances where the bubble story is not consistent with observed facts. The first problem is that money flows are not the same as demand. With equally informed market participants, there is no limit to the number of futures contracts that can be created at a given price level. These contracts are essentially just bets on future prices, so why should a bet affect an actual price outcome? Second, although theoretical models show that uninformed/noise traders can drive a wedge between market prices and fundamental values, index fund buying is very transparent, so it seems highly unlikely that other large rational traders would hesitate to trade against an index fund if they were driving prices away from fundamental values. Third, speculation is not excessive when correctly compared to hedging demands. Fourth, index investors do not participate in the futures delivery process or in the cash market; nor do they engage in the purchase or hoarding of thecash commodity (Headey and Fan 2008). However, Gilbert (2010) argues that increased long futures positions could be viewed as a positive shock to inven-
CAUSES OF THE CRISIS 41

tory demand, because long positions would suggest to cash-market partici-pants that prices will rise. This last linkage is perhaps the most important, but it is also contentious, because stocks have been declining during 2005–08. Gilbert (2010) suggests that in the short term stocks are largely a postharvest residual rather than a conscious decision. If stocks are therefore fixed in the short term, suppliers may raise prices rather than hoard. Although this assumption may be somewhat extreme (stocks may be neither fixed nor fully adjustable), it makes the question largely an empirical one. However, in the next subsection we show that U.S. wheat stocks were depleted by foreign demand, which would seem to constitute a real shock rather than one related to futures market activities. Fifth, if index fund buying drove commodity prices higher, then markets without index funds should not have seen prices advance. Headey and Fan (2008) caution against directly comparing commodity markets selected for futures contracts—because they may have characteristics that exacerbate volatility, such as relatively inelastic supply and demand—to those commodi-ties without futures markets. But with that caveat in mind, Headey and Fan (2008) cite the rapid increases in the prices for nonsecuritized commodities (such as rubber, onions, and iron ore) as evidence that rapid inflation occurred in commodities without futures markets. Similarly, Sanders and Irwin (2010) show that the size of index fund investments in different markets does not predict market returns. For example, futures markets with the highest con-centration of index fund positions (livestock markets) showed little or no increase, whereas those markets with the smallest index fund participation (grains and oilseeds) saw the largest price increases. More generic tests, however, do find an econometric linkage between futures market activities and spot market prices. Robles and Cooke (2009) use monthly CBOT data to test whether lagged proxies for speculative activity in the CBOT (for example, various ratios of noncommercial activities relative to total activities) predict changes in spot prices. They conduct 23 tests based on four commodities and six proxies for speculative activity. They find evidence of Granger causality in 6 of the 23 tests. Gilbert (2010) also tests the impacts of futures market activity on spot prices, although he uses different depen-dent and independent variables. His dependent variable is the IMF’s index of agricultural food prices, whereas the independent variables measured with monthly data from March 2006 to June 2009 are oil prices, an exchange rate index, and an index of futures positions on 12 major U.S. agricultural futures markets constructed from the data in the U.S. Commodity Futures Trading Commission’s Supplementary Commitments of Traders Reports. Gilbert (2010) tests both contemporaneous and lagged variables and treats oil prices and futures positions as endogenous, chiefly being determined by deeper factors,
42 CHAPTER 2

such as Chinese growth rates and exchange rates (because investors could use commodity prices to expose themselves to Chinese growth and to hedge against exchange rate movements). He finds that futures positions have a large effect on food prices. Although this descriptive and econometric evidence seems superficially compelling, it is quite difficult to construe causality from it. Part of the recent comovement between rising spot prices and rising futures prices comes about because financial speculation through securitization is most profitable when there is substantial volatility in the underlying markets. When markets are flat, futures contracts tend merely to reflect the discounted future value at today’s prices. But when markets are in turmoil, expectations of future prices may vary considerably (CBC 2008). Thus speculation may be more a symptom than a cause of underlying volatility. And because expectations play a role in futures markets (by definition), Granger-causality tests based on time lags (as in Robles and Cooke 2009) may not be indicative of causation, especially in the absence of a full set of other control variables. Indeed, this “Christmas cards Granger-cause Christmas” problem is a well-known fallacy in time series econometric work (Atukeren 2008). Gilbert’s (2010) results, however, are only as good as his instruments. Of particular concern is that such instruments as Chinese economic growth and stock market performance may not be validly excluded from the equation explaining agricultural prices. Of course, by the same token these caveats on the evidence do not mean that the evidence is wrong, only that the jury is still out.
Trade Shocks: Export Restrictions, Import Surges, and DroughtsExport restrictions and import surges are widely regarded as an especially potent explanation for the sharp increase in rice prices, although Headey (2010) finds evidence of important trade shocks in wheat and maize markets as well. Even so, there are several reasons why rice markets are vulnerable to shocks. Rice itself is unusual in having relatively weak substitution effects with other cereals, being mostly produced by smallholders, constituting a large proportion of the diets of millions of people, and being very thinly traded (IRRI 2008; Timmer 2009). Hence, for political reasons, very few Asian governments are willing to tolerate significant increases in rice prices, and many countries have permanent trade distortions applying to rice. Indeed, the notoriously thin trade in rice, with global imports constituting less than 10 percent of all rice consumption, partly explains why international rice prices have always been more volatile than other prices and much more vola-tile than domestic rice prices. Rice is therefore quite clearly a special case relative to other grains. Indeed, from August 2005 until November 2007 rice prices increased steadily
CAUSES OF THE CRISIS 43

by about 50 percent above an all-time trough, so that it was widely felt that rice markets were avoiding the price surge being witnessed in other cereal markets. But from November 2007 to May 2008 they increased by a further 140 percent (Figure 2.15). This rise was despite production reaching an all-time high in 2007 and fairly stable rice stocks (with the exception of China, which held excessive stocks prior to their reduction and is not a major trader of rice). What appeared to prompt this remarkable surge in international prices is the export restrictions imposed on the Indian and Vietnamese rice markets in October and November 2007. According to USDA,11 Vietnam placed a partial ban on new sales because it had oversold in the global market and the govern-ment was concerned about rising domestic food prices. Headey (2010) shows that there was also increasing demand for Indian rice exports, which he ties to the run-up in wheat prices, because many major rice importers are also major wheat importers. To make matters worse, a poor wheat harvest put pressure on India’s Public Distribution Scheme, which relies on both wheat and rice stocks. Although the action prompted protest by rice producers and the academic community (Gulati and Gupta 2007), the Indian government initially argued that its responsibility was to its own poor rather than to its neighbors. However, the worst direct impacts of this decision—rice shortages in India’s largest export market, Bangladesh—were eventually averted in April 2008, when India decided to make concessions to Bangladesh by selling their smaller neighbor 500,000 tons of rice at prices less than half of those prevail-ing in international markets at the time. The concessionary act probably averted a humanitarian disaster in Ban-gladesh, but it did not undo the panic that ensued in international markets, especially as India is often the world’s second largest rice exporter. In early 2008 further export restrictions were imposed by Vietnam, Cambodia, and Egypt. Panic buying, or precautionary demand, was also important. The Philippines, one of the largest net importers of rice, engaged in panic buy-ing, importing 1.3 million tons of rice in just the first 4 months of 2008—an amount that exceeded its entire import bill for 2007. These actions exac-erbated the crisis, and the price surge continued until May. In May Slayton and Timmer (2008) proposed that China, Japan, and Thailand could solve the crisis by releasing excess rice stocks. In Japan most of this excess rice has accumulated because of World Trade Organization (WTO) rules requiring Japan to import rice from overseas. But most of this imported rice is used as feed grain. In late May 2008 Japan promised to release 300,000 tons of rice
44 CHAPTER 2
11 See <http://www.ers.usda.gov/news/ricecoverage.htm>.

to the Philippines, although it was later reported that Japanese rice stocks were never actually released to developing Asian markets (Nakamoto and Landingin 2008).12 Whether this information had an effect is difficult to tell —at the same time oil prices also plummeted, as did other commodity prices, while the U.S. dollar also strengthened. In any event the rice bubble burst in June 2008, and rice prices fell precipitously. The size of these trade shocks can be discerned by comparing annual changes in exports and imports from leading market actors in the rice mar-ket. Figures 2.16 and 2.17 show that 2007/08 saw major reductions in Indian and Vietnamese exports and surges in imports from Bangladesh, Philippines, and energy-exporting countries flush with foreign reserves. Incorporating these shocks into some back-of-the-envelope calculations based on short-run supply and demand elasticities, Headey (2010) calculates that export restric-
CAUSES OF THE CRISIS 45
100
500
600
900
400
300
200
700
800
Nominal rice price (U.S. dollars/metric ton)
Jan 2
007
Mar 20
07
May 20
07
Jul 2
007
Jan 2
008
Mar 20
08
May 20
08
Jul 2
008
Jan 2
009
Mar 20
09
May 20
09
Drought causes Iran to order0.8 million metric tons of Thai rice
Japan allowed to re-export rice stocks,dollar strengthens, oil and other crop prices fall
Vietnam and India place partialrestrictions on exports
India, Vietnam, and Cambodiaplace full bans on exports and new Thaigovernment discusses possibility of ban
Nigeria scraps 100% tariffsand imports 0.5 million metric
tons of Thai rice
India lifts exportban on some higherquality varieties
Jan-Mar: Saudi imports fromThailand rise by nearly 90%
after India’s ban
Strong demand from energyexporters keeps rice prices25–30% above 2007 levels
Jan-Apr: Philippinesbuys normal annual quotain just 4 months, includinggovernment-to-government
deal with Vietnam
Cambodia removes ban
Egypt announcesre-export of rice from Sep
Egypt restrictsexports
Figure 2.15 Effects of export restrictions on rice prices
Source: Headey (2010), based on the collation of various media articles and USDA Foreign Agricultural Service reports.
Note: Price is for Thailand A1 variety.
12 This information is anecdotal, but certainly USDA data do not indicate any increase in Japa-nese rice exports.

Annual change in rice exports (thousand metric tons)
0
3,500
�500
�1,000
�1,500
�2,000
�2,500
�3,000
500
1,000
1,500
2,000
2,500
3,000
Thailand
Vietnam
Others
Egypt
India
2006/07 2007/08 2008/09
Figure 2.16 Decomposing annual changes in rice exports before and after the crisis
Source: Headey (2010).
46 CHAPTER 2
tions and demand surges accounted for virtually all of the increase in rice prices; Mitra and Josling (2009) reach fairly similar conclusions regarding the effect of India’s export restrictions. Export restrictions and panic buying were probably less important for other major staples because the export markets of most of these staples are heavily dominated by countries that have not imposed restrictions (Australia, Canada, the E.U., and the United States). Nevertheless, Headey (2010) shows that there were major demand surges and supply-side shocks in wheat mar-kets, and even in maize markets, for which the biofuel explanation tends to dominate. The case of wheat is striking because of the important interplay between weather shocks and trade restrictions. Most spectacularly, Australian wheat production was 50–60 percent below trend growth rates in two successive years (2005–06). As a counterseasonal southern hemisphere exporter, it is quite possible that the Australian drought had a particularly sharp effect on prices, especially given that the United States also experienced a poor harvest (some 14 percent lower than the previous year), and more modest declines

also characterized Russian and Ukrainian production. Dollive (2008) regards Ukraine’s export ban (later modified to an export restriction) as the most critical of these bans. He shows that Ukrainian grain exports in 2007 were 77 percent lower than in 2006. Dollive (2008) also reports that many of Ukraine’s largest grain clients switched entirely to other grain markets, such as those of Argentina, Australia, France, North America, Kazakhstan, and Russia. The last two countries are particularly relevant, because Ukraine’s export ban increased demand for Russian and Kazakh grain exports, which resulted in greater price pressure in these markets, including the halving of stocks-to-use ratios. By early 2008, Russia and Kazakhstan had both implemented export restraints to protect prices in their domestic markets. Hence, as with rice, there was a clear contagion effect. Argentina also began to indirectly restrict exports by closing its exports registry in March 2007, although this action only slowed exports later in the year as existing registrations began to expire (Dol-live 2008). However, in November 2007, the Argentine government raised its export taxes on wheat (to 28 percent), before reopening and then reclosing the exports registry in January and February.
CAUSES OF THE CRISIS 47
Change in rice imports (thousand metric tons)
0
3,500
�500
�1,000
�1,500
�2,000
�2,500
�3,000
500
1,000
1,500
2,000
2,500
3,000
2006/07 2007/08 2008/09
Philippines
Energy exporters
Others
Bangladesh
Indonesia
Figure 2.17 Decomposing annual changes in rice imports before and after the crisis
Source: Headey (2010).
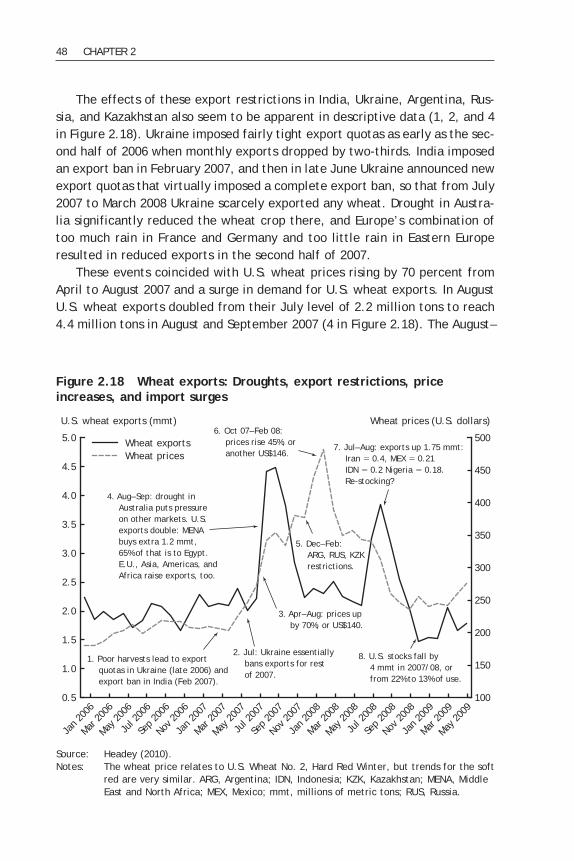
The effects of these export restrictions in India, Ukraine, Argentina, Rus-sia, and Kazakhstan also seem to be apparent in descriptive data (1, 2, and 4 in Figure 2.18). Ukraine imposed fairly tight export quotas as early as the sec-ond half of 2006 when monthly exports dropped by two-thirds. India imposed an export ban in February 2007, and then in late June Ukraine announced new export quotas that virtually imposed a complete export ban, so that from July 2007 to March 2008 Ukraine scarcely exported any wheat. Drought in Austra-lia significantly reduced the wheat crop there, and Europe’s combination of too much rain in France and Germany and too little rain in Eastern Europe resulted in reduced exports in the second half of 2007. These events coincided with U.S. wheat prices rising by 70 percent from April to August 2007 and a surge in demand for U.S. wheat exports. In August U.S. wheat exports doubled from their July level of 2.2 million tons to reach 4.4 million tons in August and September 2007 (4 in Figure 2.18). The August–
48 CHAPTER 2
U.S. wheat exports (mmt) Wheat prices (U.S. dollars)
0.5
1.0
Jan 2
006
Mar 20
06
May 20
06
Jul 2
006
Sep
2006
Nov 2
006
Jan 2
007
Mar 20
07
May 20
07
Jul 2
007
Sep
2007
Nov 2
007
Jan 2
008
Mar 20
08
May 20
08
Jul 2
008
Sep
2008
Nov 2
008
Jan 2
009
Mar 20
09
May 20
09
2.0
5.0
3.0
4.0
1.5
2.5
3.5
4.5
100
300
250
200
150
350
500
400
450
Wheat exportsWheat prices
7. Jul–Aug: exports up 1.75 mmt:Iran � 0.4, MEX � 0.21IDN � 0.2 Nigeria � 0.18.Re-stocking?
4. Aug–Sep: drought inAustralia puts pressureon other markets. U.S.exports double: MENAbuys extra 1.2 mmt,65% of that is to Egypt.E.U., Asia, Americas, andAfrica raise exports, too.
8. U.S. stocks fall by4 mmt in 2007/08, orfrom 22% to 13% of use.
2. Jul: Ukraine essentiallybans exports for restof 2007.
5. Dec–Feb:ARG, RUS, KZKrestrictions.
1. Poor harvests lead to exportquotas in Ukraine (late 2006) andexport ban in India (Feb 2007).
3. Apr–Aug: prices upby 70%, or US$140.
6. Oct 07–Feb 08:prices rise 45%, oranother US$146.
Figure 2.18 Wheat exports: Droughts, export restrictions, price increases, and import surges
Source: Headey (2010).Notes: The wheat price relates to U.S. Wheat No. 2, Hard Red Winter, but trends for the soft
red are very similar. ARG, Argentina; IDN, Indonesia; KZK, Kazakhstan; MENA, Middle East and North Africa; MEX, Mexico; mmt, millions of metric tons; RUS, Russia.

September surge was principally fueled by an increase of 1.2 million tons of exports to the MENA region (55 percent of the total surge); two-thirds of this 1.2 million tons went to Egypt alone. Other regions (South Asia, East Asia, South America, Africa, the E.U.) each increased their demand for U.S. wheat exports by about 0.15–0.22 million tons each. Overall, wheat prices increased by 72 percent from trough to peak, and Headey (2010) suggests a ballpark estimate that trade shocks increased prices by about 44 percent. He sug-gests that about half (48 percent) of this increase was due to the Australian drought, roughly one-third was due to Ukraine’s export restrictions, and 19 percent to the E.U.’s poor harvests and subsequent drop in wheat exports. Trade shocks have scarcely been discussed in the context of maize markets, where biofuel-based explanations dominate. Nevertheless, Dol-live (2008) documents how China—typically the world’s third largest maize exporter—began to indirectly restrict exports in the second half of 2007.13 As a result, Chinese maize exports declined significantly, and China stopped exporting grain to its largest client, South Korea, as well as to other impor-tant customers (such as Japan, Malaysia, and Indonesia). These countries had to turn to other international markets for maize, principally the United States. The shift to U.S. maize was not inconsequential. South Korea alone accounted for 6.9 percent of U.S. maize exports in the first five months of 2007, but this number rose to 15.5 percent in 2008. Although the effect of China’s restriction on maize exports is still low compared to the surge in demand for biofuels from within the United States, China’s actions certainly exacerbated an already tight market. However, Headey (2010) shows that there were demand pressures on U.S. maize markets even in 2006 and 2007. Figure 2.19 reports monthly maize export and price data for the U.S. market. The figure shows that not only did U.S. maize exports surge twice in recent years—from March to May 2006 and from August to November 2007—but that these two import surges preceded two large price surges. The first export surge involved a 2 million ton (or 54 percent) increase, which was followed by a 59 percent price increase. The second (3 million ton or 65 percent) export surge from August to November 2007 preceded a 75 percent increase in prices that took place from Septem-ber 2007 to May 2008. So as with rice and wheat markets, Headey (2010) again finds large export surges preceding price surges. However, it remains puzzling as to why these surges took place, espe-cially as trade-diversion effects are not so obvious. Even though South Korea
CAUSES OF THE CRISIS 49
13 Specifically, China stopped issuing new export quotas for maize in the second half of 2007. In December 2007 China also removed the rebate on value-added taxes for major grain exports and imposed export taxes on grains and grain powders (typically 10 percent).

and Japan played some role in these surges, Mexico and the MENA coun-tries played much larger roles. Hence China’s export restrictions, and their impact on Japanese and South Korean trade, seem to be only a small part of the story. The other countries involved are something of a puzzle. Mexico basically imports U.S. maize for feed use, but given the important of domes-tic maize in the Mexican diet, future research should look at substitution effects more closely. As for the MENA region, there is no particular evidence of panic, although poor weather seems to have characterized some of the region. Another factor to consider is the large foreign exchange reserves of many importing countries, which would suggest that imports were simply unconstrained. In summary, the evidence reported in Headey (2010) and Dollive (2008) suggests that various trade shocks—export restrictions, demand surges, and bad weather—were more important short-term factors than previous analyses had suggested. Trade shocks seem to account almost entirely for the surge
50 CHAPTER 2
U.S. maize exports (mmt) U.S. maize price (current U.S. dollars)
2
Jan 2
004
Apr 2
004
Jul 2
004
Oct 20
04
Jan 2
005
Apr 2
005
Jul 2
005
Oct 20
05
Jan 2
006
Apr 2
006
Jul 2
006
Oct 20
06
Jan 2
007
Apr 2
007
Jul 2
007
Oct 20
07
Jan 2
008
Apr 2
008
Jul 2
008
Oct 20
08
Jan 2
009
Apr 2
009
3
9
5
7
4
6
8
50
150
100
200
350
250
300
Maize exportsMaize price
March and May:Surge of �1 mmt is
led by KOR, MEX, IDN,and N. Africa.
Aug–Nov 07:total is up 3 mmt:MENA � 1 mmt;
MEX � 0.5 mmt, andJapan � 0.5 mmt.
Mid-2007: Chinastops issuing exportlicenses. Late 2007:China and ARG raise
export tax on grains.
U.S. maize pricesnearly double.
Figure 2.19 Surges in demand for U.S. maize exports precede maize price surges
Source: Headey (2010).Notes: The maize price relates to U.S. Maize No. 2, Yellow. ARG, Argentina; IDN, Indonesia;
KOR, South Korea; MENA, Middle East and North Africa; MEX, Mexico; mmt, millions of metric tons; SSA, Sub-Saharan Africa.

in rice prices (along with deeper spillovers from other commodities, such as wheat and oil markets) and could perhaps account for as much as half of the increase in wheat prices. They may even have played an important role in maize markets.
Summary of the Causes and a Model of a “Near-Perfect Storm”Only two studies to date have considered all factors with sufficient rigor: the studies by Abbott, Hurt, and Tyner (2008) and by Mitchell (2008). Mitchell alone was bold enough to give some rough estimates of the contribution of each cause to the overall rise in food prices. An encouraging feature of both these analyses is that they are in broad agreement, although Abbott, Hurt, and Tyner (2008) stress the importance of the weakened dollar somewhat more than does Mitchell (2008). Although we extend the evidence in several regards, our own appraisal also offers similar conclusions and supporting evi-dence. These points of consensus are as follows. First, all three studies emphasize growing demand, but they attribute it mostly to demand from the biofuels industry for maize and, to a lesser extent, for oilseeds. None of the three studies could find any substantial increase in demand from China and India, except in the case of soybeans (although this trend started many years ago), and in the case of demand for fuel (although China’s and India’s increasing demands are not necessarily the dominant explanation for rising oil prices). However, unlike the other two studies, we emphasize short-term demand surges from an array of countries as a signifi-cant determinant of tighter international cereal markets. Second, all three studies emphasize higher energy prices, but Abbott, Hurt, and Tyner (2008) emphasize that the main effect of rising energy prices was to make biofuels more profitable, rather than agricultural production more expensive (that is, it was a demand-side effect). Mitchell (2008) estimates that oil prices had a supply-side effect that accounts for about 15–20 percent of the food price increase, but we find that (1) agriculture is much more oil-intensive than is production in other sectors, which generally rely on other forms of energy, and (2) oil-related production costs on U.S. farms have risen by almost 40 percent of revenues. How much of these increased production costs are passed on to prices is difficult to say, but we suggest that Mitchell’s (2008) estimate is probably too low. We also emphasize that rising oil prices, the weaker dollar, and the influx of foreign exchange reserves for energy-exporting countries significantly strengthened their demand for U.S. cereals. Third, the studies by Mitchell (2008) and Abbott, Hurt, and Tyner (2008) go further than other analysts in emphasizing the effects of dollar deprecia-tion. Mitchell (2008) suggests this effect accounts for another 20 percent of the rise in food prices by sustaining international demand even as nominal
CAUSES OF THE CRISIS 51

prices continued to increase. Abbott, Hurt, and Tyner (2008) show that the main difference between the current price surge and the 1995–96 price surge —which did not constitute a crisis—is the marked depreciation of the dollar this time around. The strengthening of the dollar since mid-2008 and the commensurate fall in food prices seem to support this association. Finally, all three analyses emphasize that rice is almost certainly a special case, given the sensitivity of rice prices to export restrictions, and all empha-size that a series of poor wheat harvests at least made matters worse. One area of ongoing contention is the role of stocks: some authors cite lower stocks as a potentially driving factor, while others view low stocks as a symptom of the crisis more than a cause. Causality undoubtedly runs both ways with stocks. We have shown that excluding China and the former USSR coun-tries leads to much more modest declines in grain stocks that occur fairly late in the game, which suggests that stocks were driven down by surging demand and some poor harvests. However, low stocks can certainly make matters worse, as market actors use stocks ratios to form their price expectations. Our own basic model of the food crisis is summarized in Figure 2.20. In this figure we also note those factors that we regard as key drivers of surging
52 CHAPTER 2
Figure 2.20 Summary model of the principal causes of the crisis: A near-perfect storm
Source: Constructed by the authors.Notes: Boxes in gray denote less significant, crop-specific causes. The decline of the U.S.
dollar and the rise in oil prices are shown together because they are universal factors that may be causally related.

food prices. First, there is no consistent evidence to date that speculation has contributed to the crisis, and what evidence there is does not show that it was a primary cause of the crisis. Second, we have omitted stocks from the main model. As with speculation, we find it very difficult to view stock declines as a primary cause of the crisis rather than merely a symptom of rising demand (for maize and soybeans) and weak production (of wheat). Instead the dominant factors consist of a set of interlinked cross-commodity factors—a weakening U.S. dollar, rising oil prices, and the consequent surge in biofuel demand—as well as two or three commodity-specific explanations. In general the complexity of this model supports the description advanced by the director of the World Food Programme (WFP) that the current crisis constitutes a perfect storm. Finally, it is worth emphasizing the dynamic processes that have led to this crisis. In general, economists point to the efficacy of markets in smooth-ing out price volatility. Increasing demand should lead to increasing prices, which should result in a supply response, which should then lead to lower prices. Conversely, decreasing supply should lead to higher prices, which should prompt consumers to switch to substitutes. The remarkable surge in prices in 2007 and 2008 begs the question of why markets were not self-correcting, or more specifically, why they did not self-correct until mid-2008. Our review points to some interesting explanations of why prices kept rising before eventually being checked by external events (the global financial crisis) and the inherently unsustainable nature of the price bubble. We par-ticularly emphasize why the markets did not self-correct. That is, why did not demand decrease more and supply increase more as prices started to rise? Several factors explain this anomaly. On the supply side, production is seasonal and may only respond to price rises with some lag. Bad luck was also an issue, with 2006–07 witnessing some weather shocks, which in turn contributed to export restrictions, which rippled across other markets as con-suming nations switched to less restricted markets. On the demand side, the biofuels sector sustained maize demand because of ongoing high oil prices. Strong economic growth and large foreign reserves also made importing nations less sensitive to the initial price rises. In addition, in some instances importing countries seemed to panic. The peculiar nature of the rice market made precautionary purchases and hoarding a high priority for households, producers, and traders. For these reasons high prices were not immediately countered by reduced demand or increased supply, with both market and government failures contributing to these outcomes.
CAUSES OF THE CRISIS 53

CHAPTER 3
Consequences of the Crisis
Several factors suggest that the recent surge in food prices had—and may still be having—a severe impact on the poorer populations of the world. The large number of food riots in diverse locations around the
developing world, beggar-thy-neighbor policies that not only increase prices but also restrict physical access to food, increased dependence of many poor countries on food imports, and expectations that both food and oil prices will stay high for many years to come are all factors that seem to justify the utmost concern for the food security and broader well-being of the poor. Moreover, the evidence of large household surveys since the 1970s generally indicates that food prices will have a negative impact on the welfare of not just urban areas, because many rural poor in developing countries are also net food consumers (World Bank 2008b). These facts have prompted some development agencies to suggest that rising food prices plunge millions more into poverty and deepen poverty still further for those already struggling (World Bank 2008a). However, all these assumptions and predictions require much closer exami-nation and often significant qualification. The group most vulnerable to rising food prices is still the urban poor, but this group is also the most vociferous (Bezemer and Headey 2008). Thus protests may be evidence of suffering, but not of “net suffering”: price changes always create winners and losers. More-over, judging who is negatively affected requires accurate data and careful analysis of food dependency, poverty/vulnerability, and price changes at both the micro and macro levels. A great deal of progress has already been made in these endeavors, especially in microsimulation work, but a large gap still exists between micro- and macroassessments of the consequences of the crisis. A further distinction must also be made between the short and long terms. In the short term the adjustment costs of responding to rapid price changes may be prohibitively high and painfully slow. But even in the long term the ability of the poor to make adjustments depends on their access to productive assets and on national and international policies aimed at raising agricultural output or successfully pursuing other strategies to increase food
54

security. This chapter does not remotely attempt to fill in all the gaps, but it does provide some conceptual analysis and a review of existing findings and key data.
From International Markets to Household Welfare: An Analytical FrameworkThe effect of rising international food prices on the welfare of individuals is complex and highly heterogeneous across both household types and countries. Figure 3.1 depicts eight steps through which international prices influence household welfare. Pertinent policy questions are listed outside each box.Although surprisingly complex, Figure 3.1 is still a simplification of the pro-cess by which rising international prices affect individual welfare. Our aim is to flesh out some of the additional complications in the discussion below. In the figure boxes 1–4 largely refer to macroeconomic effects, whereas boxes 5–8 mostly refer to microeconomic responses that depend on the endow-ments and behavior of individual producers and consumers. Most macro-economic studies focus on the areas listed in boxes 1–4 (a few focus on the substitution effects of box 5), and most microeconomic studies focus on boxes 6–8. This dichotomy is unfortunate, because it is by no means clear that countries that are vulnerable in a microeconomic sense (that is, those with high rates of poverty and hunger) are automatically vulnerable in a macroeconomic sense (having high import bills, low reserves, and high rates of transmission) and vice versa. Identifying the most vulnerable countries, which we do later in this chapter, necessitates an examination of both the micro and macro sides of the food-security equation.
Macroeconomic ImpactsMany recent impact studies refer solely to food prices, but any comprehen-sive assessment of current poverty trends needs to incorporate changes in a range of prices, including fuel costs and fertilizers. Oil prices in particular will have a pervasive effect on a country’s vulnerability to the current crisis through their effect on exchange rates, foreign reserves, transport costs, and domestic inflation. For these reasons the most relevant macroeconomic assessments of the crisis incorporate the effects of rising oil prices. Particu-larly useful in this regard is a recent IMF (2008a) assessment of oil and food price increases.
Import BillsThe first question to ask is how changes in all commodity prices will affect a country’s macroeconomy. We therefore need to distinguish each country’s position vis-à-vis their net import position with respect to food, oil, and other
CONSEQUENCES OF THE CRISIS 55

commodities. The Food and Agriculture Organization of the United Nations (FAO) classifies 82 developing countries as low-income, food-deficit countries based on four criteria. The two main criteria are (1) the country must be a low- or middle-income country according to the World Bank’s classification and (2) the country must have an aggregate calorie-based food deficit in the sense that national food demand exceeds its production. It would appear that many developing countries are dependent on food imports and that the impacts of rising food prices will indeed be almost pervasively severe. More-over it has been widely noted that dependency on imports appears to have increased in recent decades. Yet the conclusion that poor countries have become heavily dependent on food imports needs significant qualification. For example, Gürkan, Balcombe,and Prakash (2003) calculate food-import bills from 1970 to 2001 for net food-importing developing countries and for LDCs. On average, they find thatdeveloping countries have become more dependent on food imports for con-
56 CHAPTER 3
5. Substitutioneffects on local
food prices
6. Pattern offood
consumption
7. Distributionof net food buyers
and sellers
8. Levels ofincome and
nutrition
Are import pricesdriving up domestic
food prices?
Are diets diverse?Are there domesticsubstitutes to whichpeople can switch?
Is the countryhighly urbanized?Do the rural poor
have access to landand other inputs?
Are manyhouseholds
vulnerable? Isthere social
protection? Whois most vulnerable
in households?
4. Trade andmarketingpolicies
3. Foreignexchangereserves
2. Exchangerate
movements
1. Size offood and fuelimport bills
Does the country havescope to mitigate
price effects throughpolicy reforms?
Does the countryhave adequate
export earnings?
Have U.S.dollars become
cheaper?
Are fuel,fertilizer, andtransport costsalso a burden?
Figure 3.1 Transmission from international markets to households and individual welfare
Source: Constructed by the authors.
sumption (although prior to 2001, at least, the ability to pay for these imports had increased among the net food-importing developing countries but declined among the LDCs). However, Aksoy and Ng (2008) give a more nuanced picture. They recal-culate both food and general agricultural net import bills for low-, middle-, and high-income countries, but they disaggregate within each category by oil exporters, conflict states, small islanders, and “normal” countries. The key findings of their study are as follows. First, once the three special groups are omitted, the average low- or middle-income country has gone from being a net food importer in 1980/81 to being a net food exporter in 2004/05. How-ever, Africa still contains a large number of oil exporters and conflict states, as well as other exceptions, meaning that most African countries (35 of 47) are still net importers of food, even though most are also net exporters of all agricultural goods (32 of 47). Third, only six low-income countries have food deficits that are more than 10 percent of their imports, so most net food-importing developing countries are marginal net food importers. Finally, Aksoy and Ng (2008) also identify countries with considerable potential to switch from being net exporters of nonfood agricultural products to net exporters of food. Of course, this switch is much less relevant to the short-term impacts of the crisis, because switching from cash crops to food production takes a considerable amount of time and may be prohibitively costly. So the basic message from Aksoy and Ng (2008) is that the severity of food dependence is often overstated. For these reasons one might regard the rise in oil prices as a more serious threat to macroeconomic stability in develop-ing countries. Indeed, oil import costs are 2.5 times larger than food imports for low-income countries and twice as large for middle-income countries. Consistent with this observation, IMF (2008a) simulations confirm that in the absence of policy responses, the impacts of oil prices are considerably larger than those of increases in food prices. The study estimates that for 33 netfood-importing countries with available data, the adverse balance-of-payments impact of the increase in food prices from January 2007 to April 2008 is 0.5 percent of 2007 annual GDP (US$2.3 billion, or 0.2 months of 2008 imports of goods and services). During the same period, the impact of the increase in oil prices in 59 net oil-importing countries is estimated to be 2.2 percent of GDP (US$35.8 billion, or 0.7 months of 2008 imports of goods and services). Moreover, IMF (2008a) also finds that further oil price increases in 2008 and 2009 would have had much larger adverse effects on foreign reserves than would equal rises in food prices (see Table 3.1). As it turns out, both oil and food prices have declined since mid-2008. Finally, although we have no data on overall terms-of-trade movements that factor into other commodities, we know that many net exporters of
CONSEQUENCES OF THE CRISIS 57

other minerals have also benefited from rising commodity prices to some extent (for example, Zambia), as have countries that are net exporters of labor to oil-producing countries (South Asian countries and Philippines; see Rosen and Shapouri 2008). Indeed, the estimates of terms-of-trade trends from the IMF (2009a) show that African economies have done well overall as a result of the commodities boom, so much so that the end of the commodi-ties boom (that is, the 2009 financial crisis) will likely hurt their balance of payments more than the food crisis did. From this perspective it appears that the food crisis was not a macroeconomic crisis in the majority of countries. Of course, the story at the household level is likely to be quite different.
Exchange Rate MovementsAs noted in Chapter 2, several currencies have appreciated against the U.S. dollar, the currency in which food and oil exports prices are usually denomi-nated. The distribution of both nominal and real measures are presented in Figure 3.2 for the percentage change in exchange rates from the first quarter of 2002 to the second quarter of 2008, a period that covers the major move-ments of the U.S. dollar as well as the rise in oil and food prices. The distri-bution of nominal movements is centered around a median of a little more than 20 percent, but the distribution is also highly bimodal because of three
58 CHAPTER 3
Table 3.1 Number of countries severely affected by food and oil price increases, 2007–08
Number of Number of low-income countries middle-income countries Type of shocka severely affected severely affected
Severe negative shocks Oil price shock 48 33 Food price shock 13 3 Combined shocks 42 30Positive shocks Oil price shock 11 23 Food price shock 30 28 Combined shocks 23 23Less-than-adequate reserves Before the combined shocks 30 18 After the oil price increase 37 26 After the food price increase 27 19 After the combined shocks 37 25 Total countries 74 71
Source: IMF (2008a).aSevere negative shocks are defined as those that induce drops in reserves of more than 0.5 months of imports. Positive shocks are those that result in increased reserves.

currency unions. The euro area and the West African franc zone (which is pegged to the euro) have appreciated against the U.S. dollar by some 80 per-cent during this period. Thus the adverse effects of rising commodity imports for many West African countries should, all else being equal, be limited from a macroeconomic perspective. In contrast, the Central American and Carib-bean area, which consists of currencies largely pegged to the U.S. dollar, and quite a large number of other countries around the world have experienced a stable rate of exchange with the dollar, while a few countries have experi-enced depreciation. Real exchange rate movements are still centered around a positive mean, but the distribution is slightly less bimodal, with only the euro area still standing out as a clear group, as variation in inflation rates across euro countries is quite limited. In either case it is clear that although most countries have appreciated against the dollar, considerable variation remains in terms of countries’ vulnerability to rising dollar-denominated food and oil prices. Of course, countries do not need to buy food imports in U.S. dollars. A country can buy food imports from other regions or, in principle, convert to euros, for example. One way to judge how much cheaper it would be to import from non–U.S. suppliers of food staples is to examine trends in the USDA commodity-specific, trade-weighted U.S.–dollar exchange rate, which shows movements of the U.S. dollar against U.S. agricultural competitors.
CONSEQUENCES OF THE CRISIS 59
Nominal appreciation
0
�60
28
24
20
16
12
8
4
�40
�20 0 20 40 60 80 10
012
0
Real appreciation
Percentage change Percentage change
0
�20
28
24
20
16
12
8
4
�10 0 10 20 30 40 50 60 70 80 90
a b
Figure 3.2 Histograms of exchange rate appreciations against the U.S. dollar, Q1 2002–Q2 2008
Sources: Calculations by the authors using data from IMF (2008b) for Figure 3.2a (covering 124 countries) and from USDA (2008c) for Figure 3.2b (covering 95 countries).
Note: Q1 and Q2 are the first and second quarters of the year, respectively.

This index indicates that export prices denominated in the currencies of other exporters of maize, wheat, and rice have declined by about 15–17 percent (relative to dollar-denominated prices) from 2002 to 2008. In many instances, however, there is relatively little opportunity for coun-tries to switch suppliers. First, countries that peg their currency to the U.S. dollar will generally have experienced the same depreciation that the dollar experienced. Second, variations in transport costs are still a significant cost of trade. Third, variations in trade patterns determine the composition of foreign exchange reserves for countries, so limited trade with other countries also limits foreign exchange capacity. A country might earn foreign reserves in euros, for example, but might want to purchase cereals from the United States in dollars. This limited room for maneuver vis-à-vis food supplies sug-gests that we should investigate the relationship between dependency on U.S. food imports and exchange rate movements, because countries that are both dependent on the United States and have not benefited from appreciation against the dollar may be particularly vulnerable in a macroeconomic sense. Table 3.2 reports data for the two largest U.S. cereal exports, wheat and maize, as well as real exchange rate movements and foreign reserves, for regions and selected countries. Unsurprisingly, the regions that are most dependent on the United States as a source of food imports are Central America, the Caribbean, and some of the more northern countries of South America. A few other countries and regions are fairly dependent on the United States for food imports, but there are strong mitigating circumstances in most cases. First, many of these countries are either wealthy or only major consumers of U.S. wheat, whereas Central America, the Caribbean, and some South American countries consume both U.S. wheat and U.S. maize. The second mitigating factor is currency appreciation. In Africa the only country seriously dependent on U.S. food imports is Nigeria, but its currency appreci-ated by 42 percent in real terms against the U.S. dollar, and of course it is benefiting substantially from increased oil revenues. As for foreign exchange reserves, the IMF has calculated months of imports as of the first quarter of 2008. Disconcertingly, the Caribbean and Central American countries appear to be highly vulnerable in this dimension as well. (In Africa some discrepancy exists between oil and non-oil export-ers, but there is variation in both groups, suggesting that mineral exporting capacity alone does not wholly explain the status of reserves—policies mat-ter more.) This evidence therefore suggests that, so far, it is the Central American and Caribbean countries that have been most vulnerable to rising U.S. dollar–denominated export prices because of their dependence on U.S. exports and their lack of any major compensating currency movements.
60 CHAPTER 3

CONSEQUENCES OF THE CRISIS 61
Table 3.2 Dependence on U.S. imports, appreciation against the U.S. dollar, and reserve status
Real appreciation U.S. wheat U.S. maize against Foreign imports imports U.S. dollar, reserves, 2008 (percent (percent 2002–08 (months ofCountry or region consumption) consumption) (percent change) imports)
Middle East and 2 15 20 15.0 North Africa Caribbean 28 36 15 3.5Dominican Republic 46 49 12 2.6Haiti 26 n.a. 5a 3.0Trinidad and Tobago 48 95 18 n.a.Jamaica 26 100 15 4.1Central America 45 24 10 3.5Costa Rica 55 47 10 n.a.El Salvador 31 21 8 3.2Guatemala 46 20 26 4.1Honduras 45 21 12 3.5Mexico 20 13 –2 3.7Nicaragua 46 9 4 1.7Panama 44 80 0 4.1South America 4 1 25 8.7Colombia 23 31 41 6.3Ecuador 9 23 8 2.5Peru 9 6 20 15.5Venezuela 27 22 –12 n.a.Sub-Saharan Africa 10 0 40 7.0Non–oil-producing 5.0 countries Ghana 10 0 35 2.2Nigeria 42 0 42 20.6East Asia 2 7 1 n.a.Hong Kong 1 49 –21 n.a.Japan 26 90 2 n.a.Republic of Korea 16 28 15 n.a.South Asia 0.3 0.4 22 5.6 (4.0)b
Southeast Asia 12 1 25 6.0Thailand 19 0 30 7.1Philippines 32 0 29 6.3
Sources: Calculations by the authors using data from USDA (2008c) for imports and from IMF (2008b) for exchange rates.
Note: n.a., data not available.aOnly the nominal exchange rate is reported for Haiti because of a lack of inflation data.bAverage excludes India.

Another admittedly indirect indicator that countries are suffering as a result of rising prices is the change in cereal imports in 2007 and 2008. USDA data suggest that most developing regions experienced declines of 10–20 per-cent in 2007 or 2008 (Appendix Figure A.1). The main exceptions are wheat imports in the MENA region, as discussed above.
Food Price Trends in Developing Countries (Transmission)The transmission of rising international prices into domestic markets is quite complex. Analytically speaking, “transmission” refers to several steps. The first step is the conversion of dollar-denominated international prices into local currency prices, as discussed above. The second refers to domestic policies that alter the local price of foods through tariffs, subsidies, export bans, reserve systems, price controls, and so on. However, the effects of these factors are generally bundled together as a residual. This residual also reflects a range of other factors, including substitutability between imported and domestic foods; supply and demand responses to price changes; and, more problematically, domestic factors that may have nothing to do with rising international food prices, such as exogenous supply shocks related to weather, the rising cost of oil, or nonfood inflationary factors (for example, monetary policies). Thus it may be possible that the change in domestic prices is very high, even though, strictly speaking, there is little transmission of international prices. Bearing these important caveats in mind, how strongly might international prices be transmitted to domestic markets? Both commodity-specific prices and consumer price indexes can be used to assess this issue. Each approach has different strengths. Commodity-specific approaches are useful for assess-ing transmission proper, including the impacts of exchange rate movements. In principle, the food consumer price index (CPI) is more comprehensive and should be a better indicator of welfare costs, especially when it is deflated by the nonfood CPI to look at the terms of trade for food, or real food-price trends. A potential weakness of this type of measure is that if oil prices or domestic policies are also driving up nonfood inflation, then the terms of trade for food may change very little, but domestic consumers might still suf-fer, because even general inflation appears to have a strong adverse effect on poverty (Easterly and Fischer 2001). Another potential weakness is thatthe CPI may not reflect the consumption bundle of the poor, or of certain groups of the poor.1 An additional problem for the present analysis is that CPI
62 CHAPTER 3
1 Conversely, in some countries (for example, Mali) governments use the price of one commodity (such as rice) as a proxy for a broader food basket.

data have not been updated to a large set of countries and mostly pertain to 2007. Hence we do not report it here (see Headey and Fan 2008). Nevertheless, to demonstrate the importance of the distinction between nominal and real prices, and between food CPI trends and individual com-modity trends, we look at the very instructive case of Nigeria. In that country the nominal food CPI increased by 50 percent from January 2005 to the end of 2008. However, inflation in the rest of the economy (the nonfood CPI) was sufficiently high to minimize real price changes. Indeed, the real food-price index was lower in 2008 than it was in mid-2005. When we compare this index to the average of four staples, also in real prices, we see only a broadly similar story with one critical difference. The broad similarity is that real prices for the four-staple average in 2008 were indeed lower than they were in 2005. The critical difference is that staple prices doubled between September 2007 and late 2008, which the food CPI barely registered. The Nigerian example is pertinent because it shows that price changes may be rapid, but not large relative to historical norms or to inflation in the broader economy. Figure 3.3 demonstrates three things: (1) it is vital to look at real prices; (2) it may be important to focus on the key staples that make up a large por-tion of a poor person’s consumption rather considering the broader CPI; and (3) it may be important to look at food price changes in 2008 because of the speed of price changes. An assessment of individual commodity trends across countries was initially quite difficult in the current crisis because of the pau-city of data on both wholesale and retail prices in developing countries (Headeyand Fan 2008). However, the crisis prompted a significant scaling up of localfood-price collection and dissemination by such bodies as USAID/FamineEarly Warning Systems Network (FEWSNET), the WFP, and the GIEWS, among others. For the commodity-level analysis below we use the new GIEWS (2009) dataset, which reports real food price trends for more than 50 countries and a wide range of commodities. Although impressive in scope, the GIEWS dataset is unbalanced in that different commodities are reported across countries, some-times in wholesale prices and sometimes retail, and variously as processed (for example, bread) or semi-processed (for example, flour). So Table 3.3 reports some broad price trends by commodity, whereas Table 3.4 explores the heterogeneity in price movements by making use of cross-country and cross-commodity regressions. The descriptive statistics in Table 3.3 relate to the average real price change for each commodity between a given month in 2008 and the corresponding month in 2007, thereby taking account of seasonality. The statistics show that the real monthly prices of commodities were significantly higher in 2008 than they were in the corresponding months of 2007. Prices were highest for potatoes (only five
CONSEQUENCES OF THE CRISIS 63

observations, mostly from Latin America), followed by sorghum (27 percent, only nine observations), maize and rice (about 25 percent), and millet (20 percent, but only nine observations). Wheat prices rose by about 10 percent, perhaps because wheat prices rose earlier than those of some other com-modities. An important feature of Table 3.3 is that in all cases there was wide variation in price changes. Table 3.4 explores this variation with a cross-country regression. The dependent variable is the change in the price of any given month over the corresponding month in 2007, so we again control for seasonality effects. Moreover, we can look at when prices were highest in 2008 relative to 2007. Unsurprisingly, price peaks occurred when international prices were signifi-cantly higher, albeit with some lag. Specifically, the seasonal price differencewas highest in May, June, and July 2008. Prices continued to be significantly higher in August and September.
64 CHAPTER 3
0.2
0.8
1.0
1.6
0.6
0.4
1.2
1.4
Index
Jan 2
005
Mar 20
05
May 20
05
Jul 2
005
Jan 2
006
Mar 20
06
May 20
06
Jul 2
006
Jan 2
007
Mar 20
07
May 20
07
Jul 2
007
Jan 2
008
Mar 20
08
May 20
08
Jul 2
008
Jan 2
009
TOT-food (real index)CPI-food (nominal index)Four-staples (real index)
Figure 3.3 Comparing real and nominal CPI trends to real staples prices in Nigeria
Sources: CPI data are from the Nigerian Bureau of Statistics. Staple prices are from GIEWS (2009).
Notes: Staple prices include those for cowpeas, maize, millet, and sorghum, which were used to calculate an average price index with each commodity weighted by the staple’s share in dietary energy. CPI, Consumer Price Index; TOT, terms of trade.
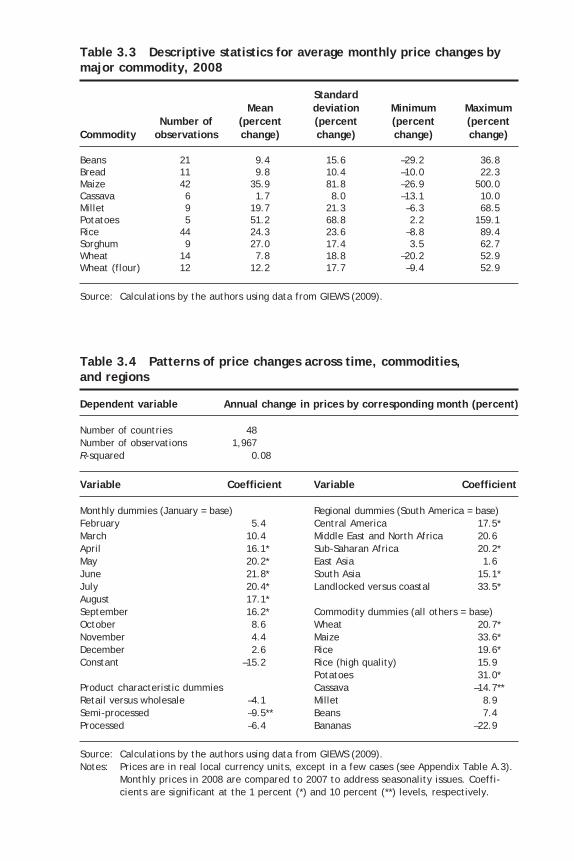
Table 3.3 Descriptive statistics for average monthly price changes by major commodity, 2008
Standard Mean deviation Minimum Maximum Number of (percent (percent (percent (percentCommodity observations change) change) change) change)
Beans 21 9.4 15.6 –29.2 36.8Bread 11 9.8 10.4 –10.0 22.3Maize 42 35.9 81.8 –26.9 500.0Cassava 6 1.7 8.0 –13.1 10.0Millet 9 19.7 21.3 –6.3 68.5Potatoes 5 51.2 68.8 2.2 159.1Rice 44 24.3 23.6 –8.8 89.4Sorghum 9 27.0 17.4 3.5 62.7Wheat 14 7.8 18.8 –20.2 52.9Wheat (flour) 12 12.2 17.7 –9.4 52.9
Source: Calculations by the authors using data from GIEWS (2009).
Table 3.4 Patterns of price changes across time, commodities, and regions
Dependent variable Annual change in prices by corresponding month (percent)
Number of countries 48Number of observations 1,967R-squared 0.08
Variable Coefficient Variable Coefficient
Monthly dummies (January = base) Regional dummies (South America = base)February 5.4 Central America 17.5*March 10.4 Middle East and North Africa 20.6April 16.1* Sub-Saharan Africa 20.2*May 20.2* East Asia 1.6June 21.8* South Asia 15.1*July 20.4* Landlocked versus coastal 33.5*August 17.1*September 16.2* Commodity dummies (all others = base)October 8.6 Wheat 20.7*November 4.4 Maize 33.6*December 2.6 Rice 19.6*Constant –15.2 Rice (high quality) 15.9 Potatoes 31.0*Product characteristic dummies Cassava –14.7**Retail versus wholesale –4.1 Millet 8.9Semi-processed –9.5** Beans 7.4Processed –6.4 Bananas –22.9
Source: Calculations by the authors using data from GIEWS (2009).Notes: Prices are in real local currency units, except in a few cases (see Appendix Table A.3).
Monthly prices in 2008 are compared to 2007 to address seasonality issues. Coeffi-cients are significant at the 1 percent (*) and 10 percent (**) levels, respectively.

We now look at the characteristics of each commodity. We would expect retail price changes to be lower than wholesale price changes, which is what we find on average, although the effect is not significant. Only marginally lower price changes occurred for processed and semi-processed goods. Each of these dummies predicts price changes that are 5–10 percentage points lower than the base (wholesale or unprocessed). Turning next to regional effects, we find that relative to the base conti-nent, South America, price changes were low in East Asia but high in Central America, South Asia (except India) and Sub-Saharan Africa. The large price risein Africa is somewhat surprising, as is the 33.5 percentage points extra rise in prices in landlocked countries relative to coastal countries. With the excep-tion of Afghanistan, all landlocked countries in our sample are in Africa, so we also ran a regression excluding the landlocked dummy variable. This regression shows that the average difference between price changes in Africa and South America is 33 percent. Thus there is something of an African price puzzle, which future research would do well to explore further. Finally, we look at individual commodities. Unlike that in Table 3.3, the regression model used in Table 3.4 nets out the effects of retail versus wholesale, processed versus unprocessed, and regional effects. Relative to a base consisting of such goods as barley, lentils, meats and seafoods, sorghum, teff, and other less common food types, price changes were highest in maize, potatoes, rice, and wheat; lower in beans and millet; and much lower in bananas and cassava. Price increases that are highest in those commodities characterizing the global food crisis again suggest high rates of transmission. However, future work could use other variables to explain cross-country pat-terns in price changes, such as monetary policies or trade and exchange rate policies. Finally, we look at food-price impacts at the country level using GIEWS (2009). This is challenging, given the incomplete and unbalanced coverage of the data, but essentially we try to construct a food price index using several steps designed to make the data more comparable. First, a cross-country andcross-commodity regression (similar to the one used in Table 3.4) was used to determine price change differences between wholesale and retail commodi-ties and between unprocessed, semi-processed, and fully processed products. Wholesale, semi-processed, and fully processed items were then adjusted to give an unprocessed retail price equivalent. Next we again netted out sea-sonality effects by taking the average of differences between prices in each month of 2008 over corresponding months of 2007. Finally, we aggregated multiple commodities into a single price index using dietary energy shares asweights. Note, however, that in a few cases total energy shares of all com-modities for a country were quite low (in some cases a little less than 30 per-
66 CHAPTER 3

cent; this result may be because of diverse diets, such as in Uganda [Benson 2008]), whereas in other cases only one food item was reported, but this item constituted 50–60 percent of dietary energy (for example, rice in Asia). Also, some countries did not report data for all of 2008, although we ensured that at least nine months of data were available, or we used the rise in prices over the first half of 2008 to proxy to garner an estimate. Countries with these caveats attached to them are listed in the notes to Figure 3.4. The figure groups countries by their level of real price change. Figure 3.4 demonstrates some basic spatial patterns. Most Asian countries for which we have data witnessed moderate price changes, although Vietnam and Thailand—two large rice exporters—witnessed big price changes in rice. India and Bangladesh actually witnessed lower prices in 2008, partly because prices in 2007 were quite high. Price changes were significant in Afghanistan and Pakistan, and very high in Sri Lanka. In Latin America, price changes were modest and sometimes even negative in South America, but several Central American countries experienced large changes in food prices, consistent with
CONSEQUENCES OF THE CRISIS 67
Average change in pricesNo dataNegative (�0%)No change (0–5%)Moderate change (5–15%)Large change (15–30%)Very large change (�30%)
Figure 3.4 Some cautious estimates of price changes in staple foods during 2008
Source: Calculations by the authors using data from GIEWS (2009).Notes: Prices are in real local currency units, except in a few cases (see Appendix Table
A.3). The price series is an estimate of retail prices for unprocessed staple foods. Countries with limited data include Cameroon, Chile, China, Costa Rica, Ecuador, Honduras, Namibia, Nigeria, Pakistan, Rwanda, Uganda, and Zambia. In these cases, either monthly data for 2008 were incomplete or the commodities in question made up less than 30 percent of dietary energy share.

our above analysis, which emphasized the lack of any counteracting effect from favorable exchange rate movements with the U.S. dollar. In Africa the story is complex. A few countries witnessed declining real prices, such as Cameroon, Madagascar, South Africa, and Zambia (whose strong currency might have affected the cost of imports). However, many countries experienced steep price changes in 2008, including some of the most populous countries, such as Ethiopia, Ghana, Kenya, Mozambique, Nige-ria, Senegal, and Sudan. In some cases, domestic factors were undoubtedly important (for example, monetary factors in Ethiopia or conflict in Kenya and Sudan). In some instances these factors spilled over into tighter food markets in neighboring countries, such as Uganda. The results in Figure 3.4 should be treated with caution, but they do seem to be broadly consistent with other evidence.2 In a study of seven Asian economies, Dawe (2008) found that transmission rates of rice and wheat prices were generally low in Asia. In India, Philippines, and Vietnam the pass-through was just 6–11 percent, but in the remaining countries it was 41–65 percent. However, as our data suggest, several South Asian countries seem to have been more affected than were East Asian countries and India. Dawe (2008) finds that Bangladeshi international wheat prices were fully transmit-ted into Bangladesh (albeit mostly in 2007). Ul Haq, Nazli, and Meilke (2008) find that Pakistan’s food CPI increased by 14.4 percent from 2006/07 to 2007/08, which is more than twice that of the nonfood CPI. For Latin America there is not much data updated beyond early or mid-2008. The International Development Bank (see Cuesta and Jaramillo 2009) reports food price inflation for Latin America countries from January 2006 to March 2008. These data suggest large nominal increases (greater than 25 per-cent) in Bolivia, Costa Rica, Guatemala, Guyana, Haiti, Honduras, Jamaica, Nicaragua, Paraguay, Trinidad and Tobago, Uruguay, and Venezuela. For Mexico during a similar period, Valero-Gil and Valero (2008) find larger nomi-nal food-price changes than would be suggested by Mexico’s food price index (which rose by 13 percent of 2006 to March 2008): most food prices increased by about 15–30 percent, such as those for beans (26 percent), chicken (32 percent), and tortillas (20 percent), but larger increases were observed for eggs (63 percent) and vegetables (80 percent), and much lower increases (lessthan 10 percent) for beef, milk, sugar, and tomatoes. For Africa, other evidence is mixed. Data for Uganda (Benson et al. 2008),Ghana (Cudjoe et al. 2008), and Mozambique (Arndt et al. 2008) are quite consistent in finding moderate, large, and very large changes, respectively.
68 CHAPTER 3
2 Demeke, Pangrazio, and Maetz (2009) provide an overview of price increases across developing regions based on the same GIEWS data.

But FEWSNET data report price changes that appear to be lower than those reported in Appendix Table A.3, although the raw data were not made avail-able for cross-checking.3 However, Abbott (2009) reviews evidence from FAO and WFP researchers that identifies similarly large increases in prices, despite the initial delay in transmission. This delay is not surprising. Our ear-lier appraisals of World Bank (2008a) food and nonfood CPI data for 2007 and early 2008 showed a low degree of food inflation in most African countries (see Headey and Fan 2008). But it would appear that at that stage interna-tional prices had not yet peaked and had not worked their way into African markets. Moreover, the spread of the financial crisis outside of the United States to Europe led to a strengthening U.S. dollar, so that although interna-tional prices were declining in U.S. dollars, they were declining much less in euros. Indeed, in our earlier appraisal we had cautioned against putting too much weight on data from early 2008 for this very reason: exchange rates can reverse quickly. Evidence cited in Abbott (2009), for example, confirms that West African cereal prices, especially in the euro-pegged West African franc zone, remained relatively high in the second half of 2008 and in early 2009. In light of the updated facts, we put forth several factors that could explain why African countries appear to have experienced surprisingly rapid inflation:1. Greater dependence on cereal imports in large parts of Africa (Ng and
Aksoy 2008)2. Relative to Asia, much weaker policy mechanisms for stabilizing food prices
(Dawe 2008)3. Increasing transport costs stemming from the rise in fuel prices4. An increased prevalence of climatic shocks (as in Niger or Uganda), politi-
cal instability (as in Kenya, Somalia, or Sudan), strong regional spillovers into neighboring markets (such as Kenya’s impact on Uganda; Benson et al. 2008), and relatively loose monetary or fiscal policies (as in Ethiopia or Malawi)4
5. High rates of substitution between international cereals and domestic staples (such as for beans, cassava, millet, and sorghum)
On this final point, however, we can offer relatively little evidence. In addi-tion, historical evidence on elasticities of substitution may provide limited guidance because of rapid urbanization and because demand elasticities dur-ing crises may differ from those that prevail in normal times.
CONSEQUENCES OF THE CRISIS 69
3 FEWSNET data are available at <http://www.fews.net/Pages/markettrade.aspx>.4 These factors contribute to price rises independently of international transmission but could also reinforce transmission.
Future research would do well to explore this question further, especially what appears to be the somewhat puzzling rise in food prices in Africa, even in several landlocked countries typically thought to be shielded from interna-tional price movements.
Microeconomic Simulations of the Effects of Rising Food Prices on PovertyThis section reviews three papers that provide cross-country simulations of the impacts of rising prices on household poverty: Ivanic and Martin’s (2008)study of 9 countries across several continents; the study by Wodon et al. (2008) of 12 West African countries; and the study by Dessus, Herrera, and Hoyos (2008) of the urban sector of 73 developing countries.5 These papers have been selected because they cover a range of countries and use quite similar methodologies despite their different sample sizes and scopes. The basic approach in these papers follows Deaton (1989) in estimating the change in food welfare (ΔWFood) as the product of the food net-benefit ratio (NBRFood) and the change in food prices (ΔPFood):
ΔWFood = ΔPFood × NBRFood = ΔPFood × (YFood/YTotal – CFood/CTotal),
where YFood/YTotal is the ratio of food sales and own-production to total house-hold monetary income, and CFood/CTotal is the ratio of food expenditure and own-consumption to total household expenditure. Notice that, by definition, own-production equals own-consumption, and because each enters into YFood/YTotal and CFood/CTotal, respectively, the consumption of food produced by the household is netted out of NBRFood. Hence the main issues with microeconomic assessments of the poverty impacts concern the size of price changes, the numbers of net buyers and sellers, and the choice of poverty line. The most important point to note about these papers is that none of them assesses the most likely impact on poverty for the following reasons:1. Data sources. All three studies simulate results from admittedly quite
recent macroeconomic surveys, although this problem is not serious, as the key parameters derived from these surveys will not have changed sig-nificantly in recent years.
70 CHAPTER 3
5 See also the study by Zezza et al. (2008) of the welfare impacts of 13 LDCs. That study is omitted from the present discussion because it does not calculate the effects of rising prices on poverty headcounts. ADB (2008) also makes estimates, but for only two countries. The Economic Commission for Latin America and the Inter-American Development Bank are also reported to have made estimates, but these were not publicly available, and they appeared to have used different and rather simplistic methods (see Lustig 2008).

2. Price changes. All three studies assume domestic food price changes for lack of actual data. Thus the results of these studies should be treated as experimental answers to the research question “What would happen to poverty rates if prices increased by x percent?” In one simulation by Ivanic and Martin (2008), the authors do use real international prices, but they assume a common 60 percent transmission rate to domestic prices. In general, however, the three studies simulate real price changes rang-ing from 10 to 30 percent. Whether these guesses are too high or too low is still not clear. So far we have very limited data on how much overall food prices are changing. Also, what data we do have tend to be urban prices (often wholesale prices). Food prices in rural areas will often be very different, and price rises will probably be smaller in rural areas because of higher transaction costs. Recent studies show that African markets in the same country may not be equally well integrated with international markets (Cudjoe, Breisinger, and Diao 2008; Ulimwengu, Workne, and Paulos 2009), which has strong implications for the spatial impacts of the crisis.
3. Behavioral responses. The three studies assume a limited range of be-havioral responses by consumers and producers. All acknowledge this, and Martin and Ivanic’s (2008) study provides a slightly more sophisti-cated model that also incorporates wage effects based on the Stolper–Samuelson matrix relating net factor incomes to changes in the domes-tic prices of trade goods. But there could be other responses, even in the short term. Many households have diversified income sources that are also flexible, and in Africa most rural people have access to land. When food prices are low, households may chiefly allocate their labor to the nonfarm sector and only farm their own land to supplement their disposable income. Rising food prices, however, could result in fairly quick and reasonably sizable shifts back into on-farm production (much of which would not show up in national production data). Likewise, many countries have diversified diets and may be able to switch to locally produced alternatives. This behavior would, of course, induce prices rises in locally produced goods, but overall food inflation may be contained.
4. Net buyers and net sellers. Many of the countries in the study samples of Ivanic and Martin (2008) and Wodon et al. (2008) experience significant increases in poverty. Similar methods applied to individual country studies find equally strong results, including poverty increases in Ghana (Cudjoe,Breisinger, and Diao 2008), Mexico (Valero-Gil and Valero 2008), and Paki-stan (ul Haq, Nazli, and Meilke 2008). Even a net rice exporter like Thai-land appears to experience an increase in national poverty because of
CONSEQUENCES OF THE CRISIS 71

higher food prices (Warr 2008). Moreover, changes in rural poverty are some-times larger than those in urban poverty, especially in Africa. In Zambia, for example, Ivanic and Martin (2008) estimate that the incidence of rural poverty increases three times as much as urban poverty, which is surprising. Is it possible that these surveys overestimate net food consumers? Aksoy and Isik-Dikmelik (2008) also analyze household surveys (including some of the surveys analyzed by Ivanic and Martin [2008]) and conclude that (i) although most poor households are net food buyers, almost 50 percent are marginal net buyers and (ii) net buyers typically have higher average incomes than net food sellers in eight of the nine countries surveyed, so that a rise in food prices would generally have progressive effects on income distribu-tion. Another explanation for the high impacts on rural poverty found in Ivanic and Martin (2008) may be related to measurement error. Household surveys may generally underestimate the degree to which rural households are net sellers of food, because the consumption side of household accounts is generally better measured than the production side (Cudjoe, Breisinger, and Diao 2008).6 For similar reasons, household income in rural regions may not be as well measured as it is in urban regions. Hence, the Ivanic and Martin (2008) and Wodon et al. (2008) studies may overestimate the impact of price rises on rural poverty.
5. Excluding oil prices. None of these papers considers rising oil prices (or fer-tilizer prices) as a simultaneous shock to income and revenue streams. This omission is significant, because oil prices have increased more than food prices, oil prices have larger and more pervasive impacts on exports, and oil prices affect prices of a number of other goods. The study of Mozambiqueby Arndt et al. (2008), for example, finds that rising fuel prices induce muchlarger increases in poverty than do rising food prices. Passa Orio and Wodon (2008) estimate the longer term impact of specific commodity price spikes on the price of other commodities by using a social accounting matrix multiplier. They find that indirect effects are significantly larger for oil than they are for food in three of eight countries sampled.
6. Excluding broader economic growth. None of these studies factor in strong economic growth, which characterizes several developing countries that have been benefiting from strong commodity prices.
7. Poverty lines. Finally, there is the choice of poverty lines; specifically, whether to use a national or an international measure (for example, US$1
72 CHAPTER 3
6 We thank Xinshen Diao for this astute comment. The specific argument is that microsurveys are more regularly updated on the consumption side; production—being largely seasonal—is only measured at distant intervals. It is sometimes argued that household income is also under-estimated in these surveys.

a day). The international measure is quite imperfect, although the Inter-national Comparison Program will soon be releasing internationally com-parable poverty-specific cost-of-living indexes. In the absence of better measures, all these studies use international poverty lines, but this choice can potentially make a considerable difference to the results.7
In addition to these general limitations, the individual studies have some specific limitations (Table 3.5). Wodon et al. (2008) consider different food items for different countries, which generally constitute dissimilar shares of total consumption, casting some doubt on whether their results are highly comparable. Dessus, Herrera, and Hoyos (2008) only examine the effects ofaggregate food consumption on urban poverty, assuming constant shares of food expenditures and fixed food/nonfood elasticities across countries. Moreover, their estimates often contradict findings from the other two stud-ies (Appendix Table A.4), suggesting measurement error may be a problem in their results. Appendix Table A.4 compares urban poverty estimates in the handful of countries analyzed in at least two of the three studies. The com-parisons indicate that in at least five of the countries listed the results differ greatly across two of the three studies. In Cambodia, Nigeria, and Ghana,the Dessus, Herrera, and Hoyos (2008) estimates of urban poverty changes are several percentage points higher than those of Ivanic and Martin (2008) and Wodon et al. (2008) for total poverty changes. For Senegal and Guinea, the Dessus, Herrera, and Hoyos estimates are considerably smaller than those from Wodon et al. In most other cases the differences are negligible. On this basis—and with significant doubts about the magnitude of price transmission within countries—we conclude that these cross-country micro-economic studies point to the possibility of marked increases in hunger, but they do not provide reliable indications of the actual effects of rising food prices on poor and vulnerable people.
Global Estimates of the Impacts of Rising Food Prices on Poverty and MalnutritionWhen a global crisis emerges there is an understandable demand for global estimates of just how serious the crisis is. From the average impacts of their
CONSEQUENCES OF THE CRISIS 73
7 Ivanic and Martin (2008) provide some robustness tests, indicating that the sign of their effects are indeed quite robust. ADB (2008) gauges poverty effects in Pakistan and Philippines using national poverty lines, but in Pakistan’s case this line is much higher than the US$1 per day line, hence the Asian Development Bank’s estimates of the impact on poverty are many times larger than those estimated by Ivanic and Martin (2008). Ivanic and Martin also find that the results for Pakistan are sensitive to changes in the price shock being simulated, with rural poverty declin-ing slightly for a 10 percent shock but increasing slightly for a 20 percent shock.

74 CHAPTER 3
Tabl
e 3.
5 S
umm
ary
of t
hree
cro
ss-c
ount
ry s
tudi
es o
n th
e ef
fect
s of
ris
ing
food
pri
ces
Pric
e sh
ock
scen
ario
Pric
e
sh
ock
Scen
ario
(p
erce
ntag
e Im
pact
s of
20–
25St
udy
Sam
ple
size
Sc
ope
num
ber
incr
ease
) pe
rcen
t pr
ice
shoc
ks
Lim
itat
ions
Ivan
ic a
nd M
arti
n N
ine
LDCs
in
seve
ral
Ru
ral
and
1
10
Pove
rty
decl
ines
in
two
St
udy
does
not
mod
el
(2
008)
regi
ons
ur
ban
area
s 2
20 (
robu
stne
ss
LD
Cs a
nd i
ncre
ases
in
dem
and
elas
tici
ties
,
3
chec
k)
se
ven,
inc
ludi
ng a
ll th
ree
su
bsti
tuti
on e
ffec
ts,
or
Re
al w
orld
Afri
can
coun
trie
s
supp
ly r
espo
nses
pr
ice
shoc
ks,
(a
ltho
ugh
seco
nd-o
rder
2005
–07
wag
e ef
fect
s ar
e es
tim
ated
as
a ro
bust
ness
tes
t)W
odon
et
al.
Twel
ve W
est
Afri
can
Cons
umer
s an
d
1 25
Po
vert
y in
crea
ses
in a
ll
As a
bove
, bu
t a
mor
e
(200
8)
LD
Cs
pr
oduc
ers
2 50
case
s, b
ut v
arie
s
lim
ited
num
ber
of f
ood
cons
ider
ably
item
s ar
e co
nsid
ered
Des
sus,
Her
rera
,
Seve
nty-
thre
e LD
Cs
Urb
an a
reas
1
10
20 c
ount
ries
are
fou
nd t
o
As
abov
e, b
ut t
his
stud
y
and
Hoy
os (
2008
)
2
20
be
vul
nera
ble,
wit
h an
only
exa
min
es a
ggre
gate
3
30
av
erag
e in
crea
se i
n
fo
od p
rice
s ra
ther
tha
n
po
vert
y of
4.5
per
cent
spec
ific
foo
d it
ems;
it
only
exa
min
es u
rban
po
vert
y, a
nd i
t as
sum
es
that
foo
d ex
pend
itur
e sh
ares
and
foo
d/no
nfoo
d pr
ice
elas
tici
ties
are
the
sa
me
in a
ll co
untr
ies
Not
e:
LDC,
lea
st-d
evel
oped
cou
ntry
.

nine-country study, Ivanic and Martin (2008) estimate that 105 million people could be thrown into dollar-a-day poverty. Clearly this estimate is extremely tenuous, given the diversity of country circumstances (for example, net buyers/net sellers and degrees of transmission) and that many of the largest poor countries (China, India, and Indonesia) were scarcely affected at all. In its 2008 state of food insecurity publication, FAO (2008) estimates that the number of chronically hungry people in 2007 increased by 75 mil-lion over its estimate of 848 million undernourished in 2003–05, with much of the increase attributed to high food prices. These estimates are also very provisional but are at least more comprehensive. The estimation technique is as follows. First, trends in dietary energy supply are derived from detailed “supply utilization accounts” and more recent data covering cereals, oils, and meats available for human consumption (accounting for about 80 percent of dietary energy supply). Next, the more recent data were used to extrapolate the core database to 2007. Finally, the 2007 estimates were used to capture the impact of food prices on hunger at the global and regional levels only. These estimates suggest that Asia accounts for 41 million of the extra 75 mil-lion undernourished, Africa for 24 million, and Latin America and the MENA region for the remaining 10 million. FAO (2008) argues that its figures may underestimate the increase in hunger because it is assumed that the distribu-tion of dietary energy intake stays the same when prices rise, whereas micro-economic work suggests otherwise (Zezza et al. 2008). Rosen and Shapouri (2008) of the USDA estimate an increase of 133 million extra malnourished people in some 70 countries. Their estimate is significantly higher, because they choose a required caloric intake of 2,200 calories that is not adjusted for age and gender, factors which can reduce the required intake to as low as 1,600 calories. Despite the usual caveats, estimates of malnutrition incidence have the benefit of not having to rely on assumptions about price transmis-sion. The downside is that not all of the increase in malnutrition can be attributed to rising food prices, although rising prices are justifiably a prime suspect.
Distribution of Poverty Impacts across Socioeconomic Groups and Individuals
The diversity of microeconomic vulnerability across socioeconomic groups within countries is also a major issue. Clearly there are a range of factors that influence the vulnerability of households to rising food prices within and across countries. Zezza et al. (2008) go further than the three simulation studies examined at the start of this section by disaggregating vulnerability across groups and explaining vulnerability measures with ordinary least squares regressions. Across 13 developing countries from different parts of the devel-
CONSEQUENCES OF THE CRISIS 75

oping world, they find that the most vulnerable households are urban or rural nonfarm, larger, less educated, more dependent on female labor, less well served by infrastructure, and in the rural sector, those with limited access to land and modern agricultural inputs. All these findings are fairly intui-tive, but it is still useful to see microeconomic evidence confirming these intuitions and offering orders of magnitude as to which household attributes matter most. An omission from all these studies is the intrahousehold allocation of food. Anecdotal evidence during the crisis pointed to the greatest consumption losses falling on women and girls (for example, Sullivan 2008). Food allocation is widely studied, and yet an earlier review of the intrahousehold literature by Haddad et al. (1996) found that, outside of northern India and Bangla-desh, evidence of pro-male biases in food consumption is scarce. Of course, in times of scarcity or in food insecure regions (for example, the Sahel), this behavior may change. It has been noted that women often act as shock absorbers of household food security by reducing their own consumption to leave more food for other household members, notably children (Dercon and Krishnan 2000; Quisumbing, Meinzen-Dick, and Bassett 2008). FAO (2008) summarizes a range of recent historical evidence in support of this observa-tion, including drought-induced stunting in Zambia in 2001 and increased maternal undernutrition and anemia in Indonesia following the 1997 financial crisis. So far, however, we have not seen any recent studies of this issue in the context of the world food crisis, but it is sure to be a fruitful research area in the future.
Impacts on Producers: Supply Response and Welfare ImplicationsEarly in the crisis it was widely assumed that prices would remain high because of production constraints, and that higher prices would hurt the rural poor for the same reason. With the benefit of new estimates of production in 2008/09, it is now possible to at least assess supply response at the national, regional, and global levels. Excluding such outliers as Argentina (troubled by a series of poor policy decisions and farmer protests), Australia (still troubled by drought), and Kenya (troubled by conflict), most major cereal producers—including both major consumer nations and major exporter nations—responded very positively. Table 3.6 reports USDA (2009) production data on the percentage change between 2007/08 and 2008/09. The table separates producers into those primarily producing for domestic consumption (especially consumer countries with large populations) and those in which a significant portion of production (more than 10 percent) is for export. The major consuming nations increased
76 CHAPTER 3

production during this period by 16.8 percent for maize, 12.4 percent for rice, and 8.5 percent for wheat. Particularly strong was the supply response in China and India, both of which increased their public agricultural spending by about 20–30 percent in 2008. As might be expected, the response from major exporting nations was even stronger, especially for maize and wheat production, which increased by 25–30 percent. Production increases in rice were more limited, which is consistent with the hypothesis that smallholders (who dominate rice production) have less scope to respond. However, other factors could account for the sometimes sluggish response of rice. First, the increase in rice prices arrived late in the crisis and the bubble burst quickly. Rice producers may have rationally identified the rice spike as a short-term bubble that would soon collapse. Second, as discussed above, export restrictions were highly prevalent in rice-producing countries, and most Asian countries insulate domestic markets from international price movements. Thus in most rice-producing countries the incentives to increase production were limited by government policies and not necessarily by lack of responsiveness from smallholders. Third, Asian rice producers are much more dependent on fertilizers than smallholders from other regions. In coun-tries where fertilizers are highly subsidized and/or their export is restricted so that fertilizer prices do not rise much (such as in China and India), supply response in rice production was quite high (about 10 percent for both coun-tries) despite the modest increase in the price of rice. In other countries with fertilizer subsidies, supply response was also significant. In Malawi, maize production increased by 50 percent. In Nigeria maize and rice production increased by 17.9 percent and 30.7 percent, respectively. Ethiopia, where food inflation has been high for several years, is also estimated to have expe-rienced rapid growth in maize production in 2008/09 (52.7 percent). Of course, with rising fertilizer prices on international markets, domestic subsidies have become very expensive. Gulati and Dutta (2009) report that India’s fertilizer subsidies have almost doubled from 2000–01 to 2006–07 and willmost likely double again in 2008–09. In Malawi direct program costs to govern-ment and donors were just less than US$91 million before the food crisis, total government expenditure was 25 percent over budget, and subsidies comprised40 percent of the Ministry of Agriculture budget and more than 5 percent of thenational budget (Dorward et al. 2009). With the rise in fertilizer prices, fer-tilizer subsidies constitute a significant threat to the fiscal balances of the government. In Nigeria fertilizer subsidies made up 50–70 percent of federal government expenditure during 2000–05, so rising costs were once again a sig-nificant drain on the public coffers (Mogues et al. 2008), although Nigeria is of course much better off fiscally because of the oil boom.
CONSEQUENCES OF THE CRISIS 77

78 CHAPTER 3
Tabl
e 3.
6 P
osit
ive
supp
ly r
espo
nse
to r
isin
g w
orld
foo
d pr
ices
in
the
2008
/09
seas
on
O
utpu
t
Out
put
O
utpu
tM
aize
(p
erce
nt c
hang
e)
Rice
(p
erce
nt c
hang
e)
Whe
at
(per
cent
cha
nge)
Maj
or c
onsu
mer
s
Cent
ral
Amer
ica
12.2
Ea
st A
sia
9.2
Nor
th A
fric
a –1
3.2
EU-2
7 7.
2 Ce
ntra
l Am
eric
a 0.
6 Ea
st A
sia
17.4
Sub-
Saha
ran
Afri
ca
18.6
Su
b-Sa
hara
n Af
rica
20
.2
Sout
h As
ia
9.7
Sout
heas
t As
ia
18.5
M
iddl
e Ea
st
–13.
9 Su
b-Sa
hara
n Af
rica
25
.8N
orth
Afr
ica
4.9
Sout
h As
ia
10.4
M
iddl
e Ea
st
–22.
1Ea
st A
sia
22.9
In
done
sia
3.5
Bang
lade
sh
–7.1
Mex
ico
16.7
Ch
ina
10.0
Et
hiop
ia
41.6
Peru
16
.0
Braz
il 2.
2 Eg
ypt
4.8
Tanz
ania
17
.8
Indi
a 10
.9
Chin
a 17
.6D
emoc
rati
c Re
publ
ic o
f Co
ngo
–1.1
Ba
ngla
desh
8.
5 Pa
kist
an
5.4
Mal
awi
47.9
D
emoc
rati
c Re
publ
ic o
f Co
ngo
0.0
Indi
a 14
.2So
uth
Asia
12
.7
Gha
na
–3.7
U
zbek
ista
n 7.
6N
iger
ia
17.9
M
adag
asca
r 12
.7Et
hiop
ia
52.7
M
alaw
i 69
.8

CONSEQUENCES OF THE CRISIS 79
Gha
na
1.9
Nig
eria
30
.7Ch
ina
23.3
Ph
ilipp
ines
10
.9Ke
nya
–20.
2 Ta
nzan
ia
29.2
Av
erag
e (e
xclu
ding
Ken
ya)
16.8
Aver
age
12.4
Aver
age
8.5
Maj
or e
xpor
ters
Thai
land
4.
3 So
uth
Amer
ica
4.1
Braz
il 27
.6Br
azil
19.0
So
uthe
ast
Asia
5.
4 EU
-27
16.8
Sout
h Af
rica
34
.6
Viet
nam
5.
1 So
uth
Afri
ca
10.9
Form
er S
ovie
t U
nion
60
.4
Egyp
t 6.
1 Fo
rmer
Sov
iet
Uni
on
43.8
Nor
th A
mer
ica
11.7
Au
stra
lia
–81.
3 U
krai
ne
92.6
Uni
ted
Stat
es
11.2
Th
aila
nd
8.0
Kaza
khst
an
10.0
Ukr
aine
56
.2
Uni
ted
Stat
es
–4.4
N
orth
Am
eric
a 18
.7Ar
gent
ina
–26.
8 Pa
kist
an
20.7
Ar
gent
ina
–44.
9
Au
stra
lia
2.3
Av
erag
e (e
xclu
ding
Arg
enti
na)
25.3
Aver
age
(exc
ludi
ng A
ustr
alia
) 5.
1
Aver
age
(exc
ludi
ng A
rgen
tina
and
Aust
ralia
) 31
.5
Sour
ce:
USD
A (2
009)
.N
otes
: M
ajor
con
sum
ing
(exp
orti
ng)
nati
ons
are
thos
e w
ith
expo
rt–c
onsu
mpt
ion
rati
os o
f le
ss t
han
(gre
ater
tha
n) 1
0 pe
rcen
t.

80 CHAPTER 3
Despite positive signs at the national, regional, and global levels, it is still difficult to say that small farmers in developing countries are significantly better off than they were before the crisis. In addition to rising input costs, transport costs have increased because of rising fuel prices, and these too may eat into farmers’ profits. Moreover, there is so far no systematic data on farmgate prices, so it is unclear to what extent higher retail prices in devel-oping countries are being translated into higher farmgate prices. We strongly suggest that this issue is both an important policy question and a longer term research question.

CHAPTER 4
Learning from the Past: Comparisons to the 1972–74 Food Crisis
The recent surge in food prices has been commonly termed a crisis, andnot without justification. But such a crisis is not new. The world experi-enced a remarkably similar event in the early to mid-1970s. In this chapter
we ask whether there are common causes of these crises. In the next chapter weask whether these events point to systemic problems in the global food system.
Food Crises Past and PresentAs discussed in Chapter 2, the 1972–74 crisis was of a similar scale and scope to the current food crisis (see Table 2.1 and Figure 2.1). In constant dollar terms, wheat and soybean price increases have been slightly smaller in the current crisis (in the case of wheat, increasing 180 percent during 1970–74 versus 110 percent from 2005 to May 2008), but the maize price increasehas been slightly larger (80 percent in 1972–74 versus 90 percent during thecurrent crisis). The increase in rice prices has been roughly the same (alittle more than 225 percent in both cases). Changes in fertilizer prices havebeen about the same, although percentage changes in oil prices were much larger in the 1970s. Finally, the sudden decline in international food prices from June 2008 to March 2009—contrary to the predictions of lead-ing organizations and prominent experts—also closely follows the decline in food prices after mid-1974.1 By our calculations, real prices of staple grains dropped by a little more than 40 percent from 1974 to 1978, and from June 2008 to March 2009 staples have dropped by 35 percent on average. Hence the intertemporal and intercommodity profiles of price changes across the two crises are remarkably similar.
81
1 Gulati and Dutta (2009) nicely summarize the inflated predictions regarding food prices by such eminent writers as Jagdish Bhagwati, Jeffrey Sachs, and Paul Krugman, as well as high-level officials in prominent agricultural and development institutions, such as IFPRI, the FAO, and the World Bank.

Causes of the 1972–74 CrisisIf the profiles of the two crises are similar, is it also possible that the crises had common causes? To answer this question we need to revisit the 1972–74 food crisis. Figure 4.1 depicts a timeline of events leading up to and follow-ing this event, and the following discussion explores these factors in more detail. As with the current crisis, the causes seem to fall into three categories: rising oil prices, a variety of market shocks on both the supply and demand sides, and longer term pressures on international food commodity markets. Like today, many of the causes of the 1972–74 crisis relate to U.S. produc-tion and trade conditions, especially with respect to wheat and other coarse grains. In the 1930s North America exported a mere 5 million tons of grain, and of all the other regions of the world, only Europe was a net importer (Figure 4.2). By 1966, however, North American grain exports had increased twelvefold to reach nearly 60 million tons, the Communist countries went from a 5 million ton surplus to a 4 million ton deficit, and Asia moved from a 2 million ton surplus to a deficit of 34 million tons. North America had become the global epicenter of the grains trade, meaning that changes in North American trade and production had the potential to significantly impact international prices and global food security. This is still true today. In this regard, the earliest contributing factor to the crisis was probably U.S. policies regarding wheat production (Johnson 1975; Destler 1978). The market condition saw chronic surpluses and depressed prices, and the “farm problem” was seen to be overproduction. By the 1960s the U.S. Commodity Credit Corporation had already accumulated large amounts of grain stocks as a result of policies that supported prices well above market-clearing levels. In effect the United States was the world’s residual supplier of grains, through both cheap exports and food aid. Domestically, however, these large grain stocks raised political concerns over the high costs of storing the grain, which could not be disposed of at the prevailing support levels. Therefore, the U.S. government—as well as the Australian and Canadian governments, who also stored large stocks of wheat—took steps to drastically reduce the production of wheat by one-third from mid-1970 to mid-1972, reducing their global share of world grain production from 15 percent to about 10 percent (Johnson 1975). Even after this huge decrease in wheat production the three major grain exporters continued to further reduce their stocks (Johnson 1975). These policies contributed to a radically different international wheat market in the 1970s (Johnson 1975; Destler 1978). The existence of large grain reserves during the 1950s and 1960s had meant that major fluctuations in production only prompted minor changes in prices, because the United States, Canada, and Australia could use their large reserves to buffer price
82 CHAPTER 4

LEARNING FROM THE PAST 83
Aver
age
pric
e of
ric
e, w
heat
, an
d ce
real
s (c
urre
nt U
.S.
dolla
rs)
0
150
Q3 196
5
Q1 196
5
Q3 196
6Q3 1
967
Q3 196
8 Q1 196
9 Q3 196
9 Q1 197
0 Q3 197
0 Q1 197
1 Q3 197
1 Q1 197
2 Q3 197
2 Q1 197
3 Q3 197
3 Q1 197
4 Q3 197
4 Q1 197
5
Q1 196
6Q1 1
967
Q1 196
8
Q1 197
6
Q3 197
5
Q1 197
7Q1 1
978
Q1 197
9 Q3 197
9 Q1 198
0 Q3 198
0 Q1 198
1 Q3 198
1 Q1 198
2 Q3 198
2 Q1 198
3 Q3 198
3 Q1 198
4 Q3 198
4 Q1 198
5 Q3 198
5
Q3 197
6Q3 1
977
Q3 197
8
200
350
100 50250
300
Jul 1
972:
Rus
sia
purc
hase
s ha
lfof
U.S
. gr
ain
surp
lus,
or
one-
quar
ter
of 1
972'
s gr
ain
outp
ut.
1974
: G
reen
Rev
olut
ion
farm
ers
suf
fer
heav
y lo
sses
from
hig
h fe
rtili
zer
pric
es.
1974
–84:
Aid
com
mit
men
ts t
oag
ricu
ltur
al d
evel
opm
ent
incr
ease
subs
tant
ially
, in
clud
ing
food
aid
.N
ew in
stit
utio
ns a
re b
uilt
for
agri
cult
ural
R&
D a
nd in
crea
sed
mon
itor
ing
of f
ood
secu
rity
.
1974
–75:
Ric
h na
tion
sim
plic
itly
res
tric
tfe
rtili
zer
expo
rts.
1950
s an
d 19
60s:
U.S
.be
com
es w
orld
'sre
sidu
al s
uppl
ier
of g
rain
s,bu
t U
.S.
govt
. tr
ies
tocu
rb o
verp
rodu
ctio
n,le
adin
g to
dec
linin
gre
serv
es in
196
0s.
1973
: U
.S.
agri
cult
ural
polic
ies
slow
to
adju
stto
incr
easi
ng g
rain
pri
ces.
Oct
197
6: U
SSR
and
U.S
. si
gn n
ewbi
late
ral a
gree
men
ton
gra
in e
xpor
ts.
Nov
197
4: W
orld
Foo
dCo
nfer
ence
is h
eld
in R
ome.
Rich
nat
ions
com
mit
to
19 n
ewfo
od s
ecui
rty
mea
sure
s an
din
crea
sed
fore
ign
aid.
1971
: U
.S.
dolla
ris
dev
alua
ted.
1973
–74:
U.S
. fo
odai
d pr
ogra
m s
hrin
ksto
all-
tim
e lo
w.
1974
–84:
Wor
ld f
ood
prod
ucti
on in
crea
ses,
but
high
ly u
neve
nly:
Asi
a's
Gre
en R
evol
utio
n is
succ
essf
ul in
incr
easi
ng f
ood
secu
rity
, bu
t Af
rica
is h
eavi
lyhi
t by
dro
ught
and
fam
ine.
Afri
ca b
ecom
esin
crea
sing
ly d
epen
dent
on
cere
al im
port
s an
d fo
od a
id.
1972
–74:
Poo
r ha
rves
tsin
U.S
., U
SSR,
Can
ada,
Aust
ralia
, Pe
ru,
and
muc
h of
Asi
a.
June
197
1: N
ixon
liber
aliz
es g
rain
exp
orts
to
Chin
a an
d Ea
ster
n Eu
rope
.
1973
–74:
OPE
Cna
tion
s qu
adru
ple
pric
e of
pet
role
um.
Figu
re 4
.1
Tim
elin
e of
eve
nts
for
the
1972
–74
food
cri
sis
Sour
ce:
Cons
truc
ted
by t
he a
utho
rs.
Not
es:
Qn
indi
cate
s th
e nt
h qu
arte
r fo
r th
e ye
ar.
OPE
C, O
rgan
izat
ion
of P
etro
leum
Exp
orti
ng C
ount
ries
; R&
D,
rese
arch
and
dev
elop
men
t.

shifts. For the crop years 1960–71 wheat prices were held within a range of US$59–65 per ton in 11 of the 12 years, and maize prices were similarly stable. But by the 1970s these reserves had been depleted, largely as a delib-erate policy, so that even relatively mild shocks to demand and supply could cause extreme fluctuations in prices (Hopkins and Puchala 1978). In fact, a high degree of price stability was achieved during the 1960s even though the absolute shortfall of world grain production below trend during 1961/62–1965/66 was greater than during 1971/72–1974/75 (72 million tons compared to 36 million tons). Despite this significant change in grain markets, only India responded to the shift by increasing its own stocks as an offset to the declines of North American and Australian stocks. During this increasingly fragile grains trade regime, several reasonably significant shocks ensued in the early 1970s. The most important of these, however, was effectively a demand rather than a supply shock.2 In June 1971 the Nixon administration liberalized exports to the China, Eastern Europe,
84 CHAPTER 4
2 Although Communist countries’ demand for U.S. wheat was itself precipitated by production shocks (especially in the USSR) and poor agricultural policies, the sudden entry of the Commu-nist bloc into world grains trade amounted to a demand shock.
Net exports of grains (million metric tons)
0
100
75
50
25
�50
�25
1936
Africa
Asia
Australia and New Zealand
North America
Latin America
Western Europe
Eastern Europe and USSR
1950 1960 1966 1973
Figure 4.2 Changing patterns in the grain trade, 1930s–1970s
Source: USDA as cited in Ward (1974).

and the USSR after receiving predictions of normal demands for grains for the rest of the world (Johnson 1975; Schuh 1983).3 The amount purchased by the USSR was about half of U.S. carryover stocks of July 1, 1972, and more than one-quarter of 1972 production. It would be shipped before the 1973 crop was in. The USSR also made significant wheat purchases from Canada, further depleting North American wheat stocks. By August 1972, the wheat export price jumped from US$1.68 per bushel in July to US$2.40 in early August. U.S. policies were slow to adjust. Stagnant wheat markets for many years had convinced the United States that high prices were not sustainable, so the government held the net export price target at about US$1.63, even though this target drove up U.S. prices and increased the costs of U.S. farm subsi-dies from an estimated US$67 million up to an actual cost of US$300 million for 1973 (Destler 1978). Pricing policies that had worked reasonably well for more than a decade became simply inappropriate. Without the export sub-sidy, market prices would have much more promptly reflected the impact of the enormous grain exports contracted to the Communist countries in 1972, and a more gradual price rise would probably have ensued, allowing for more timely supply responses. In addition to the demand shock from the Communist countries, several supply shocks affected global grains production (Destler 1978). Harsh winters, droughts, or tropical cyclones affected some major producers, including Argen-tina, Australia, India, Peru (a major producer of animal feed), Philippines, and the USSR, leading to a 3 percent decline in world grain production in 1972, and 1974 also produced poor grain harvests, especially in Canada and the United States. This conflagration of output shocks in a relatively short time certainly exacerbated some of the deeper troubles in global food mar-kets, but it is unlikely that they were a driving factor, if only because similar shocks have occurred in other years (for instance in the early 1960s) with relatively little repercussion on international prices. The rapid rise in rice prices is more puzzling, however, as most of the aforementioned shocks related to wheat production in more developed coun-tries (even the 1974 weather shocks in India mostly affected wheat produc-tion). The volatility in rice export prices came about precisely because of the thinness of the international rice trade and the special characteristics of the rice market (Timmer 2009; Chapter 2). But as in the current crisis (Dawe 2008), the percentage change in nominal retail prices for rice during 1970–74 were generally a fraction of the international price change, with Bangladesh
LEARNING FROM THE PAST 85
3 On June 10, 1971, Nixon terminated the need for companies to obtain clearance from the U.S. Department of Commerce to export wheat, flour, and other grains to China, Eastern Europe, and the USSR, and the requirement that 50 percent of grain sold must be carried in U.S. ships was suspended.

again being the exception (Figure 4.3; see Chapter 3), although in the early 1970s the food crisis in Bangladesh had significant domestic causes. Other factors contributing to rising cereal prices were not shocks, but rather long-term factors that fostered tighter international food markets. Atthe time, a great deal was made of rapid population growth, but the fortu-nate emergence of a Green Revolution in Asia just prior to the 1972–74 crisis
86 CHAPTER 4
Senegal-Dakar retail
0
Mali-Bamako retail
Madagascar-Antananarivo retail
Côte d’Ivoire retail
Cameroon-Yaounde retail
Taiwan retail
Sri Lanka retail
Philippines retail
Nepal retail
Malaysia retail
South Korea retail
Japan retail
Indonesia retail
Bangladesh retail
China retail
Pakistan retail
Myanmar retail
Thailand retail
Pakistan (Basmati) private exports
Myanmar government exports
Thai white (10%) government exports
Thai white (35%) government exports
Thai white (25%) government exports
China (35%) government exports
50 100 150 200 250
Change in prices, 1970–1974 (percent)
300 350 400 450
Figure 4.3 Comparing changes in rice export prices versus changes in retail prices, 1970–74
Source: Calculations by the authors using data collected by the International Rice Research Institute.

mitigated the worst impacts in Asia. Rapid population growth was a bigger problem in both Sub-Saharan Africa and North Africa (Egypt, Algeria, and Morocco), where cereal imports were becoming an increasing portion of total food demand. However, from the 1930s to the 1970s it was estimated that about one-third of total growth in cereal demand was from more affluent diets, mostly from wealthier countries (Ward 1974). Indeed, as with the 2008 crisis, the 1972–74 crisis was preceded by more than a decade of strong global economic growth. And discussed in Chapter 2, a surge in cereal exports to oil-exporting countries accounted for more than one-third of cereal export growth in 1974. Indeed, the OPEC oil crisis was the other critical factor in raising cereal prices. The deeper causes of the crisis were both political and economic. On August 15, 1971, the United States pulled out of the Bretton Woods Accord, taking the United States off the Gold Exchange Standard (whereby only the value of the U.S. dollar had been pegged to the price of gold and all other currencies were pegged to the U.S. dollar), allowing the dollar to float. The result was a depreciation of the value of the U.S. dollar, which had two effects. First, such devaluations may have increased the dollar price of grain by as much as 15 percent (Johnson 1975). The second and more important effect was that the devaluation triggered a chain of events in oil markets. Because oil was priced in dollars, oil producers were receiving less real income for the same price after the devaluation. The OPEC cartel responded to this problem by issuing a joint communiqué stating that OPEC would forth-with price a barrel of oil against gold. However, in the years after 1971, OPEC was slow to readjust prices to reflect this depreciation.4 Then on October 17, 1973, OPEC announced, as a result of the ongoing Yom Kippur War, that they would no longer ship oil to nations that had supported Israel in its conflict with Syria and Egypt (namely, the United States, its allies in Western Europe, and Japan). Although the embargo did not persist for long, the resultant price shock was enough to push both developed and developing countries into an inflation contagion. The direct effects on agricultural production were severe, because the major food production systems in the world were by that time already highly energy intensive. Rising oil prices were therefore directly transmitted to rising food prices in the United States and other major producers, and these elevated prices were then transmitted to other markets because of North America’s vital role in the grains trade.
LEARNING FROM THE PAST 87
4 From 1947 to 1967 the price of oil in U.S. dollars had risen by less than 2 percent per year. Until the oil shock, the price remained fairly stable against other currencies and commodities, but suddenly became extremely volatile thereafter. OPEC ministers therefore had had no reason to develop the institutional mechanisms required for updating prices rapidly enough to keep up with changing market conditions, so their real incomes lagged for several years.

For non-oil exporting developing countries, the effects were especially severe. Foreign reserves were increasingly eaten up by oil, food, and fertil-izer imports, with the depreciation of the U.S. dollar providing only a limited buffer. Rising imports costs were also exacerbated by Organization for Eco-nomic Cooperation and Development (OECD) policies. Real volumes of food aid—especially U.S. aid—had declined markedly, because rising grain prices meant that the cost of procuring a given volume of food aid had essentially doubled. In 1974 U.S. food aid was less than 40 percent of the average vol-ume provided in the late 1960s and early 1970s (Grant 1975). Rising fertilizer prices were also exacerbated by implicit export bans in OECD countries (Ward 1974; Grant 1975) and by large nonfarm usage of fertilizers. Even well after the 1975 World Food Conference—which tried to convince wealthy countries to divert fertilizer exports to developing countries—fertilizer sellers still dis-criminated toward selling to American buyers, and the U.S. and other OECD governments did not attempt to reduce nonessential uses of food and fertil-izers. Small farmers in developing countries that had adopted Green Revolu-tion strategies suffered especially severely, because their strategies centered on the production of fertilizer-intensive wheat and rice varieties and they were dependent on small retail outlets at the very end of the fertilizer supply-distribution chain. Shortages of fertilizer and oil were arguably the primary cause of the poor 1974 winter wheat harvest in India, which only totaled 23 million tons in contrast to a projected yield of 30 million tons (Grant 1975).
Similarities between the 1972–74 and 2008 CrisesTable 4.1 compares the principal causes of each crisis. The three most impor-tant factors in both cases were rising oil prices, the associated decline of the U.S. dollar, and large demand shocks. As noted above, the oil shock was actu-ally larger in the early 1970s, although oil prices were increasing from a low base. Abbott, Hurt, and Tyner (2008) find that real rest-of-the-world prices changed about three-quarters as much as nominal U.S. dollar prices in 1972–74, which is less than in the current crisis but still significant. As for demand shocks, which fall more in the purview of agricultural policies than of price movements of oil and U.S. dollars, these were from different sources in each crisis, but the shocks in question were of remarkably similar magnitudes. In 1972–74 the demand shock came from the USSR, which, following its own crop failure that year, purchased more than one-quarter of U.S. wheat production in 1972. In 2005–08 the primary demand shock came from the U.S. biofuels industry, which also absorbed one-quarter of U.S. production in 2007, this time in maize. Consistent with this story is that the 1972–74 crisis was char-acterized by large price increases in wheat rather than in maize, whereas the reverse was true of the 2008 crisis.
88 CHAPTER 4

LEARNING FROM THE PAST 89
Tabl
e 4.
1 C
ompa
ring
cau
ses
of t
he c
urre
nt c
risi
s w
ith
the
1972
–74
cris
is
Fact
or
Impo
rtan
ce i
n 19
72–7
4 cr
isis
Im
port
ance
in
curr
ent
cris
is
Less
ons
to b
e le
arne
d
Risi
ng o
il pr
ices
Th
e oi
l cr
isis
was
a s
igni
fica
nt c
atal
yst
Al
thou
gh t
he r
ecen
t oi
l pr
ice
surg
e
Oil
pric
e tr
ends
nee
d to
be
care
fully
th
roug
h di
rect
and
ind
irec
t ef
fect
s
w
as n
ot a
s su
dden
as
the
1974
as
sess
ed w
hen
mon
itor
ing
food
on t
he c
osts
of
prod
ucti
on (
for
surg
e, r
isin
g oi
l pr
ices
aga
in r
aise
d
se
curi
ty.
exam
ple,
fer
tiliz
ers)
and
als
o on
prod
ucti
on c
osts
and
fue
led
dem
and
cere
als
dem
and.
from
oil
expo
rter
s. B
iofu
els
are
a
new
lin
kage
.D
eman
d sh
ocks
So
viet
im
port
s ac
coun
ted
for
80 p
erce
nt
Biof
uel
dem
and
is a
sim
ilarl
y si
zed
U
.S.
polic
ymak
ers
need
to
be m
uch
of t
he v
aria
tion
in
wor
ld e
xpor
ts a
nd
de
man
d sh
ock
in m
aize
.
mor
e aw
are
of h
ow t
he e
ffec
ts o
f
w
ere
a m
ajor
dem
and
shoc
k.
U.S
. ag
ricu
ltur
e, t
rade
, an
d en
ergy
po
licie
s af
fect
glo
bal
food
sec
urit
y.D
eclin
e of
the
U.S
. do
llar
The
dolla
r de
clin
ed s
igni
fica
ntly
aga
inst
Th
e do
llar
agai
n de
clin
ed h
eavi
ly a
gain
st
Mov
emen
ts i
n th
e U
.S.
dolla
r ne
ed t
o
m
any
curr
enci
es,
bols
teri
ng U
.S.
man
y ot
her
curr
enci
es,
espe
cial
ly
be
ass
esse
d w
hen
mon
itor
ing
food
ce
real
exp
orts
but
als
o tr
igge
ring
the
thos
e of
the
eur
o re
gion
, ag
ain
secu
rity
.
re
valu
atio
n of
oil
pric
es b
y O
PEC.
bols
teri
ng U
.S.
cere
al e
xpor
ts.
Wea
ther
sho
cks
and
M
ajor
sho
cks
incl
uded
poo
r ha
rves
ts i
n
Dur
ing
2004
–06,
whe
at p
rodu
ctio
n fe
ll It
is
not
clea
r th
at o
utpu
t sh
ocks
wer
e
othe
r ou
tput
sho
cks
th
e U
SSR
and
poor
har
vest
s in
Ind
ia.
in
Aus
tral
ia (
–52
perc
ent)
, th
e E.
U.
a
sign
ific
ant
dire
ct c
ause
of
eith
er
(–14
per
cent
), a
nd t
he U
nite
d St
ates
cris
is;
outp
ut a
mon
g m
ajor
pro
duce
rs
(–16
per
cent
), a
s di
d co
arse
gra
ins.
is a
lrea
dy a
dequ
atel
y m
onit
ored
.
(con
tinu
ed)

90 CHAPTER 4
Tabl
e 4.
1 C
onti
nued
Fact
or
Impo
rtan
ce i
n 19
72–7
4 cr
isis
Im
port
ance
in
curr
ent
cris
is
Less
ons
to b
e le
arne
d
Long
-ter
m d
eman
d
The
cris
is w
as p
rece
ded
by t
wo
Th
e cr
isis
has
bee
n pr
eced
ed b
y ra
pid
Im
prov
ed i
nter
nati
onal
mon
itor
ing
of
pr
essu
res
in c
omm
odit
y
de
cade
s of
rap
id e
cono
mic
and
ec
onom
ic g
row
th i
n Ch
ina,
Ind
ia,
and
in
tern
atio
nal
dem
and
is n
eede
d,
m
arke
ts
po
pula
tion
gro
wth
.
othe
r la
rge
deve
lopi
ng e
cono
mie
s.
bu
t m
ore
impo
rtan
tly,
pre
empt
ive
inve
stm
ents
in
agri
cult
ural
pr
oduc
tion
are
vit
al.
Long
er t
erm
sup
ply
U
.S.
grai
n re
serv
es d
eclin
ed m
arke
dly
Be
fore
the
cri
sis,
U.S
. an
d ot
her
maj
or
Incr
ease
d pu
blic
inv
estm
ents
in
and
pr
essu
res
in
the
dec
ade
prec
edin
g th
e cr
isis
,
gr
ain
rese
rves
dec
lined
and
fore
ign
aid
to a
gric
ultu
re,
espe
cial
ly
al
thou
gh i
nves
tmen
t in
foo
d
in
vest
men
ts i
n ag
ricu
ltur
e de
clin
ed
ag
ricu
ltur
al R
&D
in
Afri
ca,
are
prod
ucti
on i
ncre
ased
thr
ough
out
in m
ost
of t
he d
evel
opin
g w
orld
, bu
t
ne
eded
. In
crea
sed
inve
stm
ents
for
mos
t of
Sou
th a
nd S
outh
east
Asi
a,
pr
oduc
tion
gro
wth
slo
wed
slig
htly
,
ag
ricu
ltur
al d
evel
opm
ent,
suc
h as
but
not
in A
fric
a.
su
gges
ting
tha
t th
ese
decl
ines
wer
e
tr
ansp
ort
infr
astr
uctu
re i
n Af
rica
,
not
prin
cipa
l fa
ctor
s in
the
cri
sis.
are
need
ed.
Spec
ulat
ion,
hoa
rdin
g,
Fear
s of
a w
heat
exp
ort
emba
rgo
wer
e Fi
nanc
ial
mar
ket
spec
ulat
ion
is a
new
It
is
diff
icul
t to
say
bec
ause
of
lack
and
expo
rt b
ans
w
idel
y ci
ted
as a
cau
se o
f ri
sing
risk
, bu
t th
ere
is n
ot m
uch
evid
ence
of c
oncl
usiv
e ev
iden
ce t
hat
whe
at a
nd s
oybe
an p
rice
s. S
ever
al
ye
t th
at i
t m
ade
mat
ters
wor
se.
spec
ulat
ion
is a
n im
port
ant
fact
or,
co
untr
ies
impo
sed
expo
rt r
estr
icti
ons,
Like
wis
e, t
here
has
bee
n so
me
but
com
mod
ity
mar
kets
cer
tain
ly
and
Wes
tern
cou
ntri
es w
ere
repu
ted
disc
ussi
on o
f in
tere
st r
ates
and
the
war
rant
clo
ser
mon
itor
ing.
to h
ave
impl
icit
ly r
estr
icte
d fe
rtili
zer
hous
ing
mar
ket
bubb
le d
rivi
ng l
oose
ex
port
s.
m
oney
int
o co
mm
odit
ies.
Sour
ce:
Hea
dey
and
Rasz
ap S
korb
ians
ky (
2008
).N
otes
: O
PEC,
Org
aniz
atio
n of
the
Pet
role
um E
xpor
ting
Cou
ntri
es;
R&D
, re
sear
ch a
nd d
evel
opm
ent.

Other factors are also common across both crises—long-run supply con-straints, growing demand stemming from sustained economic growth, weather shocks, export bans, and hoarding—but these residual factors played rela-tively minor roles, although such factors either triggered additional problems (for instance, the U.S.-Soviet grain deal) or exacerbated each crisis once the wheels were set in motion. These similarities between the two crises suggest that there is scope for contemporary policymakers to learn from the suc-cesses and failures of the 1972–74 crisis.
LEARNING FROM THE PAST 91

CHAPTER 5
Lessons for the Future: Does the Global Food System Need Fixing?
Although adverse by definition, food crises do present opportunities for positive change. Not only does a higher price regime provide incentives for farmers to scale up production, but it can also render
the weaknesses of existing policies transparent to a broader policymaking audience. Indeed, the 1972–74 food crisis produced and bolstered a number of new institutions to fill the perceived failures of the global food system: for food aid (WFP), financing (International Fund for Agricultural Develop-ment), research (IFPRI and the Consultative Group on International Agricul-tural Research), and early warning systems (GIEWS). But at the same time international policymakers failed to address many of the most fundamental deficiencies of the global food system, a fact that was acknowledged at the time. In 1981, for example, Valdes and Siamwalla came to the following conclusion:
International prices of cereals have fallen in real terms, grain stocks have been rebuilt, and the crisis atmosphere has abated. World food security has ceased to be a major concern for the press and for the general public. Yet, the underlying causes of food crises such as the one in 1972–74 have not disappeared . . . on the international scene only limited progress has been made to help them in these efforts. (1981, 1)
The deficiency of previous efforts to improve global food security is borne out not only by the recurrence of a global food crisis, but also by the persis-tence of year-to-year food insecurity in a range of developing countries, per-sistently high rates of rural poverty, and stagnating agricultural productivity growth. These are all complex problems requiring different sorts of solutions. Some problems are international in nature (for example, trade barriers, aid modalities, and the reserve systems of major exporters), whereas others are
92

more national in nature (for example, agricultural policies, social protection, infrastructure investment, and political stability).1 However, rather than trying to comprehensively review the policy responses of developed and developing countries, or even of the UN-coordinated response to the crisis,2 this conclud-ing chapter focuses specifically on the lessons derived from our own analyses of the 2008 food crisis and our reflections on the 1972–74 food crisis. As for what constitutes food security, the basic notion used in most of the literature is that food-deficit countries, regions, or households should be able to meet target consumption levels on a year-to-year basis (Valdes and Siam-walla 1981). “Target levels” generally refer to normal consumption levels, although a more stringent definition would refer to adequate levels in a nutri-tional sense. A second, more instrumental, aspect of this definition is that attaining food security involves several different dimensions:1. Producing enough food at the global level, at a minimum2. Ensuring country-level access to food imports at affordable and relatively
stable international prices3. Ensuring household-level access to food purchases at affordable and rela-
tively stable domestic prices
Several points are of note regarding these characteristics. First, some defi-nitions of food security restrict themselves to affordability. However, pre-dictability is also important. The nature of a food crisis, after all, is not so much absolute prices changes but the speed of price changes and the degree to which they take consumers, producers, and governments by surprise. Second, the degree to which these various aspects of food security per-tain to national and international food systems is somewhat fuzzy. Clearly global production (1) and international trade (2) are largely dimensions of the international food system, although access to imports also depends on domestic factors (such as sufficient export earnings to meet import require-ments), whereas dependence on food imports is largely the result of low levels of domestic food production. Likewise, access to food within countries (3) is more a national-level dimension of food security, except insofar as for-eign assistance influences these outcomes through food aid, agricultural aid,infrastructure aid, the influence of technical assistance and conditional loanson food and input subsidies, and so on.
LESSONS FOR THE FUTURE 93
1 In this section we largely restrict our analysis to the markets, policies, and regulations that constitute the global food system. However, the interdependencies between international and national food systems require the discussion to be quite flexible in this regard.2 These responses are ably summarized by Abbott and de Battisti (2009), among others.

Figure 5.1 breaks down the global food system into three components: food production, food markets and trade, and the foreign aid system as it relates to food policies. It is important to point out that these three compo-nents are intimately interlinked. At a global level food production and trade are primarily private-sector activities, but they are heavily influenced by national and international policies. Foreign aid is just one component of the broader policy environment, but it merits being treated as a separate com-ponent of the global food system, because food aid is a large component of food imports in many developing countries and donor efforts to improve food production in developing countries constitute an international flow of resources rather than a purely national policy. Near each component of the global food system, Figure 5.1 lists the mostsignificant questions facing the global food system. Figure 5.1 illustrates a long-term perspective rather than the narrower view of those problems that directly relate to the world food crisis. That said, both the 2008 and 1972–74 food crises have revealed weaknesses in the global food system, so the remaining discussion focuses more narrowly on these issues.
Predicting the Next CrisisWhether either food crisis could easily have been predicted is debatable, given that it took most observers by surprise, even most experts (although
94 CHAPTER 5
Are affluent dietsa threat to staplefood production?
Are farmers equippedto address resource
degradation andclimate change?
Will biofuels keepfood prices too high
for too long?
Are donors helpingto improve trade
and food production?
Is the distribution ofglobal food productionsufficiently balanced?
Are donorsproviding foodaid effectively?
Are donors improvinginformation flows andearly warning systems?
Global foodsystem
Do international inputmarkets (for example, fertilizers)
function efficiently? Do trade policiesensure adequateaccess to food?
Are grain reservessufficiently high and
well distributed?
Foodproduction
Marketsand trade
Foreignaid
Figure 5.1 Does the global food system need fixing?
Source: Constructed by the authors.

LESSONS FOR THE FUTURE 95
3 Von Braun et al. (2005) raised concerns about rising food prices because of supply constraints, and other experts voiced concerns about declining stocks, but for the most part nobody expected the sharp surge in prices that ensued.
there were concerns about declining stocks among some agricultural experts).3 Nevertheless, the fact that the 1972–74 crisis prompted policy interest in predict-ing and preventing future crises suggests that the failure to give early warning signals for the current crisis is rooted in methodological or institutional failings, or both. Essentially our conclusion is that food security organizations and agri-cultural researchers were caught between two extremes: tracking recent price developments on the one hand and predicting long-term swings on the other. GIEWS, for example, was set up in response to the lack of any forewarning to the 1972–74 crisis, so it might have been expected to have offered some early warning of the current crisis. However, Headey and Raszap Skorbiansky (2008) review GIEWS’s Food Outlook—a quarterly publication that deals with global food security issues—during 2005–07, yet find no evidence that GIEWS gave any early warning of an impending food crisis. This is partly because GIEWS has a strong mandate to focus on year-to-year food crises in individual countries and partly because publications like Food Outlook are not monitor-ing all necessary variables, such as oil prices, cereal futures prices, and U.S. dollar movements (the good news on this front is that such organizations as GIEWS, WFP, and FEWSNET have scaled up their efforts to collect and dis-seminate data on food prices). Interestingly, FAO (2008, 21) seems aware of this deficiency, and GIEWS has beefed up its monitoring of domestic food prices in the wake of the crisis. The other extreme is represented by sophisti-cated modeling exercises carried out by other sections of the FAO, IFPRI, and various other research institutions (see the review by McCalla and Revoredo 2001). What is needed is an intermediate approach that combines some of the rigor of a formal model with shorter term predictors of international prices, such as oil prices, exchange rates, futures market indexes, harvest informa-tion, and demand shocks (imports or biofuels).
Improving the Functioning of Markets and TradeThe international price increases can partly be explained by factors outside the food system (such as oil prices and U.S. dollar movements), but it is also likely that several key features of the global food system made the impacts of these exogenous factors all the more severe. First, the world currently relies on the grain reserves of just a few exporting countries to stabilize prices and ensure stable food supply. However, this arrangement has been informal since the failure of negotiations on food reserves after the 1972–74

crisis, and it has largely broken down due to rising prices and new just-in-time inventory methods. Nevertheless it is not clear that pushing for more formal reserve arrangements among major producers is the right way to proceed. Reserves are costly—especially in mostly humid developing countries—and generally incompatible with the incentives of private agricultural producers in developed countries. Another option might be to use virtual reserves to smooth out futures prices (Robles, Torero, and von Braun 2009; von Braun and Torero 2009). Although innovative, more research is needed to prove causal linkages between futures prices and spot prices. Other policies might also help to ensure short-run access to international food imports. These include the World Bank’s US$1.2 billion rapid financing facility, the Global Food Response Program, or a proposed international grain reserve managed by the WFP (von Braun and Torero 2009).4 In the wake of the 1972–74 crisis, a wave of research tried to assess all of these ideas, but so far such research has not been triggered by the recent crisis. An alternative instrument for reducing price volatility in international markets is to promote freer trade in agricultural commodities. This idea is consistent with our assessment: export restrictions played a dominant role in turning a critical situation into a full-blown crisis, especially in the case of rice. Moreover, analyses conducted after the 1972–74 crisis also demonstrated that free-trade regimes were a potentially viable alternative to large interna-tional grain reserves (see Walker and Sharples 1976; Johnson 1981; Reutlinger and Bigman 1981),5 although more recent research has not yet revisited this question. Another practical issue is how to obtain a more liberal but also more secure international trade regime for agriculture. In the current crisis inter-national markets failed because WTO statutes did not prevent countries from imposing export restrictions that induced so much unnecessary volatility. It has also been recognized that reforms proposed in the July 2008 Framework Agreement did not include provisions to discipline export taxes or bans, nor would special safeguard mechanisms in the agreement have approximated a free-trade arrangement (Abbott 2009). New arrangements need to take into
96 CHAPTER 5
4 The international grain-reserve proposal in question involves a modest emergency reserve of about 300,000–500,000 tons of basic grains—about 5 percent of the current food aid of 6.7 million wheat-equivalent tons—that would be supplied by the main grain-producing countries and funded by a group of countries participating in the scheme (the G8+5 plus some other major grain-exporting countries). This decentralized reserve would be located at strategic points near or in major devel-oping-country regions, using existing national storage facilities. A range of measures would ensure financial sustainability of the reserve. See von Braun and Torero (2009) for details.5 Much of the debate on trade liberalization has focused on its growth and poverty impacts, although the size of these costs is disputed (see the comprehensive review by Bouët 2008). Here we point out that trade liberalization also has an impact on food security.

account the clear preference of developing countries for domestic market stabilization. Another potentially important implication of our research on both the 1972–74 and 2008 crises is that it is the actions of major grain traders (exporters and importers) that has the greatest impact on international mar-kets. As a result, binding agreements between a smaller set of large producers and importers may be sufficient to stabilize international markets.
Addressing Long-Term Threats to Global Food ProductionThe global system largely satisfies the objective of producing sufficient food to feed the world’s population. Moreover, as noted above, the short-term supply response to the most recent crisis was surprisingly strong. But despite these encouraging signs that the production side of the global food system did address the food crisis adequately, several prevailing trends threaten the long-term security of global food production. The challenge most relevant to the food crisis is clearly the diversion of crops from food or feed to biofuels. As noted in Chapter 2, a growing number of studies are finding that biofuels production has a large positive impact on food prices, but virtually no negative impact on energy prices. In the foreseeable future, biofuels production does not look good for global food security, unless ways can be found to minimize the diversion from food production or involve poor farmers in biofuels produc-tion. But technologies and investments that would achieve these outcomes seem a long way off. A second major challenge to longer term food production is climate change and resource degradation. We found that there is no real evidence that envi-ronmental factors were a major cause of the crisis—the only potential link is Australia’s unusually severe drought—but some studies find that climate change and resource degradation could severely impact food production in much of the developing world (Lobell et al. 2008; Slater et al. 2008). We also found no link between the food crisis and the “affluent diets” hypothesis. Moreover, in the past increasingly affluent diets seem to be asso-ciated with a decline in real prices (after all, U.S. cereal prices have declined with only a few interruptions since the 19th century). Nevertheless, policy-makers and researchers should not ignore the potential impacts—positive or negative—that increasingly affluent diets and climate change may have on food security in the future.
Improving Social ProtectionIn response to rising international prices governments and aid agencies have used a wide range of tools to directly or indirectly protect consumers from rising food prices (World Bank 2008a; Demeke, Pangrazio, and Maetz 2009). These include:
LESSONS FOR THE FUTURE 97

• Restricting exports• Liberalizing imports• Removing sales taxes• Releasing stocks• Inducing supply response by scaling up fertilizer subsidies and other quick
impact agricultural programs• Scaling up existing safety net programs
Only the last of these items is conventionally thought of as social protection, although in the absence of existing social protection programs and the high costs and long delay in setting up new ones, it is understandable that devel-oping country governments resort to the more indirect means of protecting consumers. However, some of these alternative means of protecting consumers are less desirable than others. Export restrictions were a major cause of the rice price crisis, and a fairly significant cause of the rise in wheat prices. In light of this problem some authors have proposed that social safety net programs should be scaled up. The rationale here may be threefold. First, if social protection programs are in place, then governments need not resort to costly export restrictions. This argument is feasible, but the first country to impose significant export restrictions on rice was India, and India has many large social safety net programs, such as the National Rural Employment Guarantee Scheme, the Food for Work Scheme, and the Public Distribution Scheme for food grains. None of these schemes stopped the Indian govern-ment from imposing an export ban, and the Public Distribution Scheme perhaps contributed to sluggish growth in the production of wheat and rice in India. A second rationale for such programs is that they contribute to produc-tive capacity by building up human capital and assets. Productive safety nets therefore seem to hit two targets with one instrument (Alderman and Hod-dinott 2006). Over the long run there is good evidence that productive safety nets could indeed achieve some growth in productivity, but the productivity impacts are likely to be small relative to strictly agricultural investments. And as a means of responding to the current crisis they are largely irrelevant. Instead their main benefit is in making poor people less vulnerable to future crises. Finally, social safety nets are argued to be more poverty efficient than the indirect alternatives suggested above. Wodon et al. (2008) note that the targeting efficiency of social protection policies in Sub-Saharan Africa is much better than that of other economywide policies (such as tax cuts, tariff reduc-tions, and subsidies). Bhaskar, Ahmed, and Shariff (2009) also review social protection programs in response to the food crisis and compare programs in four Asian countries.
98 CHAPTER 5

Addressing the Regional Imbalance in Food ProductionIn contrast to those who list declining agricultural productivity of major cereals as a significant threat to global food production, we argue that it is the longer term regional imbalance in cereal production that is the most significant problem facing global food security. Essentially, large parts of the developing world, especially Sub-Saharan Africa and the Middle East, are heavily dependent on cereal imports from the rest of the world, especially Argentina, Australia, Brazil, Europe, North America, and a few Asian rice exporters. This imbalance emerged before the 1972–74 crisis, but Africa’s rapid population growth combined with its weak growth in food production have made the imbalance starker. Of course, insufficient production growth may not be a problem if net cereal importers have adequate access to foreign exchange, but with the exception of mineral exporters, net cereal import-ers often rely heavily on foreign aid for bolstering their exchange reserves or directly accessing food aid. And although this problem existed before and after the two world food crises, both events were exacerbated by this exces-sive reliance on cereal imports. Yet addressing this issue is arguably more important than ever, especially in the face of longer term threats to food production (such as climate change and resource degradation) and changes in international trade in cereals (for example, the growth in biofuels). However, it is also clear that the solutions to this imbalance need to be country specific and that not every country in the world need be, or could be, totally self-sufficient in food production. Thus the question is essentially how to properly balance domestic food pro-duction and reliance on imports. In many food-deficit countries the binding constraint is that food production is currently vastly lower than its potential because of a history of distortionary policies and inadequate or inappropriate investments in agricultural R&D, extension, and rural infrastructure (Bezemer and Headey 2008). In some of these countries, agriculture has traditionally been underemphasized in national development strategies because of ambi-tious industrialization goals or easy access to mineral earnings. However, even in countries with considerable nonfarm growth potential (such as Cameroon, Democratic Republic of Congo, Ghana, and Nigeria), the equally impressive potential of agriculture means that such countries can play a vital role in improving food security both domestically and regionally. In contrast, many landlocked African countries lack nonagricultural prospects but also suffer from severe and worsening agroclimatic constraints (particu-larly the Sahelian countries). Thus, unfortunately, they will never be regional breadbaskets. So although raising food production might still be important in these more agriculturally challenged and food-insecure countries, supporting agricultural production growth in areas of real biophysical potential is prob-
LESSONS FOR THE FUTURE 99

ably the more critical step. Indeed, Asia’s own Green Revolution was not pervasive but generally restricted to the region’s traditional breadbaskets, such as the Punjab in India and Pakistan.
What Can Donors and Major Grain Producers Do to Improve Global Food Security?Bilateral donors and the international institutions they support play a critical role in several aspects of the world food system, including public invest-ments in developing countries; funding of agricultural R&D; and provision of early warning systems, food aid, and humanitarian assistance. Many Western countries and other emerging donors (such as Brazil and China) are also major grain producers. Together these countries have enormous potential to improve the global food system through international resource flows, including knowl-edge dissemination. Given the evidence cited in this monograph on the causes and consequences of the crisis, what major actions should these countries take to improve the global food system? Perhaps the least controversial goal should be to refocus foreign aid on agriculture. This shift back to agriculture was already taking place before the recent crisis, as donors became increasingly cognizant of the neglect of agri-culture in developing countries and in aid institutions themselves (Bezemer and Headey 2008; World Bank 2008b). Although many donors were already in the process of ramping up agricultural aid, the food crisis undoubtedly re-emphasized the critical and multidimensional role that food production and food prices play in human development, especially in organizations that were debating a withdrawal from agricultural investments (for example, the Asian Development Bank). So the good news is that there is now a wider consensus on the importance of agriculture, backed up by an impressive list of donor commitments to agricultural development (see von Braun 2008b; Abbott and Borot de Battisti 2009; Demeke, Pangrazio, and Maetz 2009). The potentially bad news is that with the financial crisis looming as the next big threat to both donor countries and their recipients, there is a very real concern that the more than US$12 billion in aid commitments to food security and agricul-ture that were made in 2008 will not be kept. Moreover, donors cannot solve the global imbalance by throwing money at the problem. Aid effectiveness is undoubtedly conditional on the proactive policy efforts of aid recipients. But developing countries vary substantially in how much they emphasize agricultural development and how well they can implement agricultural projects. Even where the political will is strong, weak technical capacity is a real issue because of a history of underinvest-ment and the hasty adoption of structural adjustment programs in the 1980s and 1990s that often left an institutional vacuum in the agricultural sector.
100 CHAPTER 5

Figuring out how to rapidly scale up public investment—or crowd in private investment—in this institutional vacuum is going to be a key policy challenge in the years to come. It is perhaps understandable that many developing countries have opted for the quick fix of subsidizing fertilizers, but there are understandable doubts about how financially sustainable these programs are (Poulton, Kydd, and Dorward 2006; Dorward et al. 2009) and what the implicit costs are of neglecting other R&D and infrastructure. Indeed, those with a longer perspective recall that the 1972–74 crisis produced some extremely costly subsidy programs that are politically difficult to dismantle. Scaling up agricultural development projects in an efficient and sustainable way is the critical policy challenge in the years to come.
Concluding RemarksWith the benefit of hindsight, the causes of the current food crisis are increas-ingly clear, even if there are still some doubts about the precise magnitude of each factor and certain misperceptions still persist in the public arena. It is also clear that many poor countries have been hard hit by the sharp rise in food prices over recent years. Taking action to limit the vulnerability of poor populations to increasing food prices is essential in the short run, but it is also vital in the longer run. After all, millions of poor people face their own food crises on year-to-year, season-to-season, and day-to-day bases. Their prob-lems are enduring and indicative of deeper deficiencies in both national and international food systems that are hardly new. Reflecting on these issues in the wake of the 1972–74 crisis, Gale Johnson wrote:
The primary reason we have failed to achieve the degree of interna-tional food security that is now possible is not nature but man. And the aspect of man that is responsible for our failure is not man as a farmer or scientist or extension worker or grain marketer or food retailer but man as a politician. (1981, 257)
These remarks are just as pertinent today as they were three decades ago. Given the right incentives and the right opportunities, farmers, traders, scien-tists, and others can engage in activities that improve both their own welfare and also lift millions of others permanently out of poverty and hunger. Yet the catalyst for these activities will be farsighted and deeply committed policy actions that address the most fundamental problems facing both international and national food systems.
LESSONS FOR THE FUTURE 101

APPENDIX
Additional Data
102
Maize i
n Car
ibbea
n
Maize i
n Eas
t Asia
Maize i
n Midd
le Ea
st
Maize i
n Nor
th Af
rica
Maize i
n Sou
th Am
erica
Maize i
n Sub
-Saha
ran A
frica
Whe
at in
Car
ibbea
n
Whe
at in
Cen
tral A
merica
Whe
at in
East
Asia
Whe
at in
Midd
le Ea
st
Whe
at in
Nor
th Af
rica
Whe
at in
Sout
h Amer
ica
Whe
at in
Sout
h Asia
Whe
at in
Sout
heas
t Asia
Whe
at in
Sub-
Saha
ran A
frica
Change in the quantity of imports (percent)
0
100
80
60
40
20
�20
2007–08
2008–09
Figure A.1 Response of import quantity to rising international food prices
Source: Calculations by the authors using data from USDA (2008c).

Tabl
e A
.1
Ener
gy a
nd o
il in
tens
ity
by s
ecto
r fo
r se
lect
ed c
ount
ries
, 20
05
Le
ss-d
evel
oped
cou
ntri
es
Mor
e-de
velo
ped
coun
trie
s
En
ergy
O
il O
il sh
are
En
ergy
O
il O
il sh
are
Coun
try/
sect
or
inte
nsit
ya in
tens
ity
(pe
rcen
t)
Coun
try/
sect
or
inte
nsit
y in
tens
ity
(per
cent
)
Arge
ntin
a
Aust
ralia
G
DP
0.28
0.
11
40
G
DP
3.98
0.
30
8
Indu
stry
0.
23
0.02
7
In
dust
ry
2.73
0.
19
7
Tran
spor
t 0.
95
0.71
75
Tran
spor
t 3.
31
1.96
59
Ag
ricu
ltur
e 0.
22
0.21
97
Agri
cult
ure
1.31
0.
13
10
All
othe
r 0.
16
0.01
9
Al
l ot
her
5.36
0.
06
1Br
azil
Ca
nada
G
DP
0.24
0.
11
46
G
DP
0.19
0.
09
46
Indu
stry
0.
30
0.05
16
Indu
stry
0.
20
0.02
12
Tr
ansp
ort
1.51
1.
27
84
Tr
ansp
ort
0.76
0.
69
91
Agri
cult
ure
0.14
0.
08
58
Ag
ricu
ltur
e 0.
16
0.10
64
Al
l ot
her
0.07
0.
02
22
Al
l ot
her
0.09
0.
02
18Ch
ina
Fr
ance
G
DP
0.50
0.
12
25
G
DP
0.09
0.
05
50
Indu
stry
0.
51
0.04
8
In
dust
ry
0.12
0.
02
19
Tran
spor
t 0.
94
0.90
95
Tran
spor
t 0.
42
0.41
97
Ag
ricu
ltur
e 0.
15
0.08
52
Agri
cult
ure
0.08
0.
07
81
All
othe
r 0.
44
0.05
10
All
othe
r 0.
05
0.01
21
(con
tinu
ed)
ADDITIONAL DATA 103

104 APPENDIXTa
ble
A.1
Co
ntin
ued
Le
ss-d
evel
oped
cou
ntri
es
Mor
e-de
velo
ped
coun
trie
s
En
ergy
O
il O
il sh
are
En
ergy
O
il O
il sh
are
Coun
try/
sect
or
inte
nsit
ya in
tens
ity
(pe
rcen
t)
Coun
try/
sect
or
inte
nsit
y in
tens
ity
(per
cent
)
Gha
na
G
erm
any
G
DP
0.79
0.
23
29
G
DP
0.10
0.
04
43
Indu
stry
0.
72
0.18
24
Indu
stry
0.
09
0.01
7
Tr
ansp
ort
2.77
2.
77
100
Tr
ansp
ort
0.43
0.
41
95
Agri
cult
ure
0.06
0.
06
100
Ag
ricu
ltur
e 0.
10
0.07
63
Al
l ot
her
1.25
0.
04
4
All
othe
r 0.
07
0.01
21
Indi
a
Russ
ia
GD
P 0.
48
0.14
30
GD
P 0.
63
0.14
23
In
dust
ry
0.65
0.
12
19
In
dust
ry
0.58
0.
05
8
Tran
spor
t 0.
57
0.55
96
Tran
spor
t 1.
41
0.80
57
Ag
ricu
ltur
e 0.
11
0.04
42
Agri
cult
ure
0.29
0.
13
46
All
othe
r 0.
45
0.06
12
All
othe
r 0.
45
0.05
10
Keny
a
Uni
ted
King
dom
G
DP
0.65
0.
14
22
G
DP
0.08
0.
04
48
Indu
stry
0.
27
0.13
49
Indu
stry
0.
09
0.02
21
Tr
ansp
ort
0.80
0.
80
100
Tr
ansp
ort
0.38
0.
37
99
Agri
cult
ure
0.02
0.
02
96
Ag
ricu
ltur
e 0.
05
0.02
37
Al
l ot
her
1.07
0.
04
4
All
othe
r 0.
04
0.00
7
Thai
land
Uni
ted
Stat
es
GD
P 0.
38
0.21
55
GD
P 0.
13
0.07
54
In
dust
ry
0.31
0.
06
18
In
dust
ry
0.14
0.
02
12
Tran
spor
t 1.
70
1.69
10
0
Tran
spor
t 0.
87
0.84
96
Ag
ricu
ltur
e 0.
18
0.18
99
Agri
cult
ure
0.14
0.
13
96
All
othe
r 0.
18
0.03
15
All
othe
r 0.
05
0.00
9
Sour
ces:
Cal
cula
tion
s by
the
aut
hors
usi
ng I
EA e
nerg
y ba
lanc
e sh
eets
(IE
A 20
08)
and
UN
nat
iona
l ac
coun
ts d
ata
(Uni
ted
Nat
ions
200
8).
Not
e:
GD
P, g
ross
dom
esti
c pr
oduc
t.a E
nerg
y in
tens
ity
is d
efin
ed a
s en
ergy
/oil
use
per
mill
ion
U.S
. do
llars
of
outp
ut (
thou
sand
met
ric
tons
of
oil
equi
vale
nt).

Table A.2 U.S. maize, soybean, and wheat production profits per planted acre, excluding government payments, 2004–09 (U.S. dollars)
Crop 2004 2005 2006 2007 2008 2009
Value of production less all costs
Maize n.a. –126.5 –57.9 25.0 100.0 14.6Soybeans n.a. n.a. –23.3 58.3 110.3 79.1Wheat –48.1 –74.8 –72.8 –27.9 56.4 –62.6
Value of production less operating costs
Maize n.a. 74.1 145.9 240.0 333.7 264.2Soybeans n.a. n.a. 161.4 252.1 318.7 308.3Wheat 71.7 53.2 59.0 111.1 208.1 n.a.
Source: Data are from USDA (2008d).Notes: Values for the two most recent months are revised or preliminary. Values are U.S. aver-
ages; n.a., data not available.
Table A.3 Price changes in leading staples by country, 2008
Change in prices (percent)
Average increase January– July– M-07 June December Country Commodity Market to M-08a 2008 2008
Exporting countries United States Maize Export 35.4 24.5 –36.9 Thailand Rice Export 111.1 80.3 –27.3 United States Sorghum Export 20.1 4.5 –34.5 United States Wheat Export 32.9 –21.9 –25.2Central America Costa Ricab Rice (second quality) Retail 26.6 –10.2 43.0 Dominican Republic Rice Wholesale 7.7 10.8 16.0 El Salvadorb Maize Retail 4.7 13.6 –12.0 Guatemala Maize (white) Wholesale –4.4 14.6 3.4 Haiti Rice (imported) Retail 27.4 –5.6 –30.9 Honduras Maize (white) Wholesale –6.6 39.0 4.6 Mexico Maize (white) Wholesale 3.5 13.1 –4.0 Nicaragua Rice Retail 37.8 23.3 3.3 Panama Rice Retail 7.2 20.6 0.0South America Argentina Maize (yellow) Wholesale 6.0 –1.2 –14.4 Bolivia Wheat Wholesale 40.5 33.1 –7.1 Brazil Rice (first quality) Wholesale 37.7 34.2 –15.4 Chile Rice Retail 46.3 67.6 n.a. Colombia Rice Wholesale 39.2 52.0 12.1 Peru Rice Retail 7.6 –4.3 –5.8 Uruguay Wheat (flour) Wholesale 33.2 30.9 –16.2
(continued)

106 APPENDIX
Table A.3 Continued
Change in prices (percent)
Average increase January– July– M-07 June December Country Commodity Market to M-08a 2008 2008
East Asia China Rice (Indica) Wholesale 6.3 8.1 0.3 Philippines Regular milled rice Wholesale 20.5 38.6 –9.4 Thailand Rice Wholesale 75.3 44.5 –6.8 Vietnam Rice Retail 25.7 44.0 –17.2South Asia Afghanistan Wheat Retail 71.4 24.2 n.a. Bangladesh Rice (coarse) Wholesale 31.1 2.4 –24.1 India Rice Wholesale 15.7 2.2 4.6 Pakistan Wheat Retail 36.4 –0.3 4.1 Sri Lanka Rice Retail 39.2 –8.8 n.a.Eastern Africa Djibouti Rice (belem) Retail 63.7 9.5 n.a. Egypt Rice Retail 25.9 11.8 n.a. Ethiopia Maize Wholesale 114.7 119.2 –45.0 Kenyab Maize Wholesale 60.1 41.7 0.6 Ugandab Maize Wholesale 108.6 27.6 –1.2 Sudan Millet Wholesale 59.7 68.5 n.a.Southern Africa Burundi Maize Retail 21.8 154.8 –28.0 Democratic Republic Cassava Retail 56.7 59.3 n.a. of Congob,c Madagascar Rice (local) Retail –8.1 –6.2 –0.6 Malawi Maize Retail 116.3 52.9 3.3 Mozambique Maize (white) Retail 42.3 5.7 10.4 Namibia Millet Retail 10.9 31.2 1.7 Rwandab Beans Wholesale 18.1 –9.1 –31.9 South Africa Maize (white) Wholesale –4.8 5.5 –3.1 Tanzaniab Maize Wholesale 73.1 –26.9 32.6 Zambia Maize (white) Retail 25.6 –9.9 40.7West Africa Burkina Faso Millet (local) Wholesale 14.2 25.9 –12.8 Cameroon Maize Retail 8.4 5.5 23.6 Ghana Maize (white) Retail 39.1 84.6 0.0 Mali Millet (local) Wholesale 8.4 14.3 –17.4 Mauritania Wheat (flour) Retail 12.8 –0.4 –4.6 Niger Sorghum Wholesale 26.4 16.0 3.3 Nigeria Millet Wholesale 113.9 11.0 –21.3d
Senegal Millet Retail 7.0 8.3 –5.1 Senegal Rice (imported) Retail 51.5 58.9 –3.3 Togo Maize Retail 38.9 62.3 –14.6
Source: Calculations by the authors using data from GIEWS (2009).Notes: n.a., data not available.aAverage percentage difference between the change in price from a given month in 2007 to the corre-sponding month in 2008. In this way seasonal fluctuations can be accounted for.bData for these countries are available in U.S. dollars only. They should be regarded with caution, as they may not be appropriately deflated.cData for these countries are sparse and should be regarded with caution.dThis figure applies from June to October rather than from June to December.

ADDITIONAL DATA 107
Table A.4 Comparing urban poverty impacts across three microsimulation studies
Change in poverty headcount (percentage points)
IM: DHH: WEA: Suggested explanationCountry Total poverty Urban poverty Total poverty of discrepancy
Nigeria — 6.1 0.56 WEA results may be too low because urban poverty is high in Nigeria and foods covered in their report represent just 11.5 percent of consumption.Cambodia 1 5.8 — DHH results are probably too
high, given that IM employ more sophisticated methodology and most Cambodians are rural.
Senegal — 0.4 4 DHH results may be too low, given Senegal’s dependence
on imports.Ghana — 3.1 0.6 DHH results may be too high,
given low urban poverty and the diversified Ghanaian diet. WEA results are also similar to Cudjoe, Breisinger, and Diao (2008).
Guinea — 1.3 2.5Pakistan 2.56 1.8 —Nicaragua 4.3 3.7 —Madagascar 3.6 4 —Malawi — 1 0.6Gabon — 1.1 1.4Bolivia 1 1.2 —Zambia 1 1.2 —Vietnam 0.2 0.1 —Mali — 2.3 2.3
Sources: Constructed by the authors from Dessus, Herrera, and Hoyos (2008), Ivanic and Martin (2008), and Wodon et al. (2008).
Notes: The table reports specific results from the three studies that maximize the basis for compari-son: poverty is measured as changes in US$1 per day poverty headcount levels; price shocks are 20 percent; and only urban poverty results are reported, because the DHH results are the only ones common to other studies. In the case of WEA results, data have been adjusted in a linear fashion from their 25 percent price increase (that is, their results have been multiplied by 20 and then divided by 25). Variations in results reflect differences in surveys and simula-tion methods. —, the study did not include the country in question; DHH, Dessus, Herrera, and Hoyos (2008); IM, Ivanic and Martin (2008); WEA, Wodon et al. (2008).

References
Abbott, P. C. 2009. Development dimensions of high food prices. OECD Food, Agricul-ture and Fisheries Working Paper 18. Paris: OECD Publishing.
Abbott, P. C., and A. Borot de Battisti. 2009. Recent global food price shocks: Causes, consequences and lessons for African governments and donors. Paper presented at “AERC Plenary Session on Global Food Price Shocks: Causes, Consequences and Policy Options in Africa,” May 30, Mombasa, Kenya.
Abbott, P. C., C. Hurt, and W. E. Tyner. 2008. What’s driving food prices? Issue Report. Oak Brook, Ill. U.S.A.: Farm Foundation.
———. 2009. What’s driving food prices? March 2009 update. Issue Report. Oak Brook, Ill. U.S.A.: Farm Foundation.
ADB (Asian Development Bank). 2008. Food prices and inflation in developing Asia: Is poverty reduction coming to an end? Manila, Philippines.
Aksoy, M. A., and A. Isik-Dikmelik. 2008. Are low food prices pro-poor? Net food buyers and sellers in low-income countries. Policy Research Working Paper 4642. Washing-ton, D.C.: World Bank.
Aksoy, M. A., and F. Ng. 2008. Who are the net food importing countries? Policy Research Working Paper 4457. Washington, D.C.: World Bank.
Alderman, H., and J. Hoddinott. 2006. Growth-promoting social safety nets. 2020 Focus Brief on the World’s Poor and Hungry People. Washington, D.C.: International Food Policy Research Institute.
Arndt, C., R. Benfica, A. Nucifora, and J. Thurlow. 2008. Higher fuel and food prices: Impacts and responses for Mozambique. Development Economics Research Group, University of Copenhagen, Copenhagen, Denmark. Photocopy.
Atukeren, E. 2008. Christmas cards, Easter bunnies, and Granger-causality. Quality and Quantity 42 (6): 835–844.
Baffes, J. 2007. Oil spills over into other commodities. Washington, D.C.: World Bank.
Benson, T. 2008. An assessment of the likely impact on Ugandan households of rising global food prices: A secondary data analysis. Agricultural Economics 39 (2008 supplement): 513–524.
Benson, T., N. Minot, J. Pender, M. Robles, and J. von Braun. 2008. Global food crises: Monitoring and assessing impact to inform policy responses. Food Policy Report 19. Washington, D.C.: International Food Policy Research Institute.
Bezemer, D., and D. Headey. 2008. Agriculture, development and urban bias. World Development 36 (8): 1342–1364.
Bhaskar, A., A. U. Ahmed, and A. Shariff. 2009. Causes and consequences of the recent food price inflation and the role of social protection in mitigating the impact: A literature review. Report prepared for the Asian Development Bank. Washington, D.C.: International Food Policy Research Institute.
108

Bouët, A. 2008. The expected benefits of trade liberalization for world income and development: Opening the “black box” of global trade modeling. Food Policy Review 8. Washington, D.C.: International Food Policy Research Institute.
Brown, L. C. 1995. Who will feed China? Wake-up call for a small planet. New York: W. W. Norton and Company.
CBC (Conference Board of Canada). 2008. Is food commodity securitization worsening the world’s food problem? Policy Brief. Ottawa, Ontario.
Collins, K. 2008. The role of biofuels and other factors in increasing farm and food prices: A review of recent development with a focus on feed grain markets and market prospects. Supporting material for a review conducted by Kraft Foods Global, Chicago. Photocopy.
Cudjoe, G., C. Breisinger, and X. Diao. 2008. Local impacts of a global crisis: Food price transmission and poverty impacts in Ghana. Discussion Paper 842. Washing-ton, D.C.: International Food Policy Research Institute.
Cuesta, J., and F. Jaramillo. 2009. Taxonomy of causes, impacts and policy responses to the food price crisis in the Andean Region. Research Department Working Paper 674. Washington, D.C.: Inter-American Development Bank.
Dawe, D. 2008. Have recent increases in international cereal prices been transmitted to domestic economies? The experience in seven large Asian countries. ESA Work-ing Paper 08-03. Rome: Agricultural Development Economics Division, Food and Agriculture Organization of the United Nations.
———. 2009. The unimportance of “low” world grain stocks for recent world price increases. ESA Working Paper 09-0. Rome: Agricultural Development Economics Division, Food and Agriculture Organization of the United Nations.
Deaton, A. 1989. Rice prices and income distribution in Thailand: A non-parametric analysis. Economic Journal 99 (conference proceedings): 1–37.
Demeke, M., G. Pangrazio, and M. Maetz. 2009. Country responses to the food secu-rity crisis: Nature and preliminary implications of the policies pursued. Initiative on Soaring Food Prices. Rome: Food and Agriculture Organization of the United Nations.
Dercon, S., and P. Krishnan. 2000. In sickness and in health: Risk sharing within house-holds in rural Ethiopia. Journal of Political Economy 108 (4): 688–727.
Dessus, S., S. Herrera, and R. de Hoyos. 2008. The impact of food inflation on urban poverty and its monetary cost: Some back-of-the-envelope calculations. Agricul-tural Economics 39 (supplement): 417–429.
Destler, I. M. 1978. United States food policy 1972–1976: Reconciling domestic and international objectives. International Organization 32 (3): 617–653.
Dollive, K. 2008. The impact of export restraints on rising grain prices. Office of Economics Working Paper 2008-08-A. Washington, D.C.: U.S. International Trade Commission.
Dorward, A., E. Chirwa, D. Boughton, E. Crawford, T. Jayne, R. Slater, V. Kelly, and M. Tsoka. 2009. Towards “smart” subsidies in agriculture? Lessons from recent experience in Malawi. Natural Resource Perspectives 116. London: Overseas Devel-opment Institute.
Easterly, W. H., and S. Fischer. 2001. Inflation and the poor. Journal of Money, Credit and Banking 33: 160–178.
REFERENCES 109

FAO (Food and Agriculture Organization of the United Nations). 1983. Approaches to world food security. Economic and Social Development Paper 32. Rome.
———. 2008. The state of food insecurity in the World 2008. Rome.
———. 2009. FAOSTAT database on food security indicators. <http://www.fao.org/faostat/foodsecurity/index_en.htm>. Accessed August 22, 2009.
Frankel, J. 2006. The effect of monetary policy on real commodity prices. Working Paper 12713. Cambridge, Mass., U.S.A.: National Bureau of Economic Research.
———. 2008a. Fed modesty regarding its role in high commodity prices. Jeff Frankel’s weblog, May 21. <http://content.ksg.harvard.edu/blog/jeff_frankels_weblog/category/commodities/>. Accessed August 22, 2008.
———. 2008b. An explanation for soaring commodity prices. VOX, March 25. <http://www.voxeu.org/index.php?q=node/1002>. Accessed August 22, 2008.
———. 2008c. Monetary policy and commodity prices. VOX, March 29. <http://www.voxeu.org/index.php?q=node/1178>. Accessed August 22, 2008.
Fuglie, K. 2008. Is a slowdown in agricultural productivity growth contributing to the rise in commodity prices? Agricultural Economics 39 (2008 supplement): 431–441.
General Administration of Customs of the People’s Republic of China. 2008. Oil import data. <http://english.customs.gov.cn/publish/portal191/>. Accessed April 22, 2008.
GIEWS (Global Information and Early Warning System). 2009. National basic food prices—Data and analysis tool. <http://www.fao.org/giews/pricetool/>. Accessed March 22, 2009.
Gilbert, C. 1989. The impact of exchange rate changes and developing country debt on commodity prices. Economic Journal 99 (1989): 773–784.
———. 2010. How to understand high food prices. Journal of Agricultural Economics (April 2010): 1–28. Preliminary online version.
Grant, J. P. 1975. Food, fertilizer, and the new global politics of resource scarcity. Annals of the American Academy 420: 11–30.
Gulati, A., and M. Dutta. 2009. Rice policies in India in the context of global rice price spike. Paper presented at the Food and Agriculture Organization of the United Nations workshop “Rice Policies in Asia—What Have We Learned from the Rice Price Crisis and Can We Avoid Another One?” February 10–12, Chiang Mai, Thailand.
Gulati, A., and K. Gupta. 2007. Restrictions on rice exports: An offshoot of an archaic policy mindset. Economic Times, October 26, 7.
Gürkan, A. A., K. Balcombe, and A. Prakash. 2003. Food import bills: Experiences, factors underpinning changes and policy implications for food security of least developed and net food-importing developing countries. Commodity Market Review 2003–2004. Commodities and Trade Division. Rome: Food and Agriculture Organization of the United Nations.
Haddad, L., C. Peña, C. Nishida, A. Quisumbing, and A. Slack. 1996. Food security and nutrition implications of intrahousehold bias: A review of the literature. Discus-sion Paper 19. Washington, D.C.: International Food Policy Research Institute.
Headey, D. 2010. Rethinking the global food crisis: The role of trade shocks. Discus-sion Paper 00958. Washington, D.C.: International Food Policy Research Institute.
110 REFERENCES
<http://www.ifpri.cgiar.org/sites/default/files/publications/ifpridp00958.pdf>. Accessed April 22, 2010.
Headey, D., and S. Fan. 2008. Anatomy of a crisis: The causes and consequences of surging food prices. Agricultural Economics 39 (supplement): 375–391.
Headey, D., and S. Raszap Skorbiansky. 2008. International food crises, past and pres-ent: A comparison of causes and consequences. International Food Policy Research Institute, Washington, D.C. Photocopy.
Helbling, T., V. Mercer-Blackman, and K. Cheng. 2008. Commodities boom: Riding a wave. Finance and Development 45 (1): 10–15.
Hopkins, R. F., and D. Puchala. 1978. Perspectives on the international relations of food. International Organization 32 (3): 581–616.
IEA (International Energy Agency). 2007. World energy outlook 2007: China and India insights. Paris: Organisation for Economic Co-operation and Development and IEA.
———. 2008. IEA statistics. <http://www.iea.org/Textbase/stats/index.asp>. Accessed July 22, 2008.
IMF (International Monetary Fund). 2008a. Food and fuel prices: Recent developments, macroeconomic impact, and policy responses. Fiscal Affairs, Policy Development and Review, and Research Departments Special Report. Washington, D.C.
———. 2008b. International financial statistics. Washington, D.C.
———. 2009a. World economic outlook, April 2009: Crisis and recovery. Washington, D.C.
———. 2009b. International financial statistics. <http://www.imfstatistics.org/imf/>. Accessed April 22, 2009.
IRRI (International Rice Research Institute). 2008. The rice crisis: What needs to be done? Background paper. <http://solutions.irri.org/images/the_rice_crisis.pdf>. Accessed July 22, 2008.
Ivanic, M., and W. Martin. 2008. Implications of higher global food prices for poverty in low-income countries. Agricultural Economics 39 (supplement): 405–416.
Jensen, R., and N. Miller. 2008. Giffen behavior and subsistence consumption. Ameri-can Economic Review 97: 1553–1577.
Johnson, D. G. 1975. World agriculture, commodity policy, and price variability. American Journal of Agricultural Economics 57: 823–828.
———. 1981. Grain insurance, reserves, and trade: Contributions to food security for LDCs. In Food security for developing countries, ed. A. Valdes. Boulder, Colo., U.S.A.: Westview Press.
Kherallah, M., C. Delgado, E. Gabre-Madhin, N. Minot, and M. Johnson. 2002. Reform-ing agricultural markets in Africa. Baltimore: Johns Hopkins University Press.
Lazear, E. 2008. White House disputes role of biofuels in food prices. Associated Press, May 15.
Liefert, W., and J. Swinnen. 2002. Changes in agricultural markets in transition economies. Agricultural Economics Report 33945. Washington, D.C.: United States Department of Agriculture Economic Research Service.
Lipsky, J. 2008. Commodity prices and global inflation. Remarks by the first deputy managing director of the International Monetary Fund at the Council on For-
REFERENCES 111

eign Relations. <http://www.imf.org/external/np/speeches/2008/050808.htm>. Accessed September 22, 2008.
Lobell, D. B., M. B. Burke, C. Tebaldi, M. D. Mastrandrea, W. P. Falcon, and R. L. Nay-lor. 2008. Prioritizing climate change adaptation needs for food security in 2030. Science 319: 607–610.
Lustig, N. 2008. Thought for food: The challenge of coping with soaring food prices. Working Paper 155. Washington, D.C.: Center for Global Development.
McCalla, A. F., and C. Revoredo. 2001. Prospects for global food security: A critical appraisal of past projections and predictions. 2020 Vision Initiative for Food, Agri-culture, and the Environment Discussion Paper 35. Washington, D.C.: International Food Policy Research Institute.
McPhail, L. L., and B. A. Babcock. 2008. Ethanol, mandates, and drought: Insights from a stochastic equilibrium model of the U.S. corn market. Working Paper 08-WP 464. Ames, Iowa, U.S.A.: Center for Agricultural and Rural Development, Iowa State University.
Meyers, W. H., and S. Meyer. 2008. Causes and implications of the food price surge. Food and Agricultural Policy Research Institute. Columbia, Mo., U.S.A.: University of Missouri.
Mitchell, D. 2008. A note on rising food prices. Policy Research Working Paper 4682. Washington, D.C.: World Bank.
Mitra, S., and T. Josling. 2009. Agricultural export restrictions: Welfare implications and trade disciplines. Rome: International Food and Agricultural Trade Policy Council.
Mogues, T., M. Morris, L. Freinkman, A. Adubi, and S. Ehui, with C. Nwoko, O. Taiwo, C. Nege, P. Okonji, and L. Chete. 2008. Agricultural public spending in Nigeria. Dis-cussion Paper 789. Washington, D.C.: International Food Policy Research Institute.
Nakamoto, M., and R. Landingin. 2008. Japan’s promised rice aid fails to emerge. Finan-cial Times, August 25, 9.
Passa Orio, J. C., and Q. Wodon. 2008. Impact of higher food prices on cost of living: Assessing multiplier effects using social accounting matrices. Washington, D.C.: World Bank.
Pender, J. 2009. The world food crisis, land degradation and sustainable land manage-ment: Linkages, opportunities and constraints. International Food Policy Research Institute, Washington, D.C. Photocopy.
Poulton, C., J. Kydd, and A. Dorward. 2006. Increasing fertilizer use in Africa: What have we learned? Agriculture and Rural Development Discussion Paper 25. Wash-ington, D.C.: World Bank.
Quisumbing, A., R. Meinzen-Dick, and L. Bassett. 2008. Helping women respond to the global food price crisis. IFPRI Policy Brief 7. Washington, D.C.: International Food Policy Research Institute.
Reutlinger, S., and D. Bigman. 1981. Feasibility, effectiveness, and costs of food secu-rity alternatives in developing countries. In Food security for developing countries, ed. A. Valdes. Boulder, Colo., U.S.A.: Westview Press.
Robles, M., and B. Cooke. 2009. Recent food prices movements: A time series analy-sis. Discussion Paper 942. Washington, D.C.: International Food Policy Research Institute.
112 REFERENCES

Robles, M., M. Torero, and J. von Braun. 2009. When speculation matters. Issue Brief 57. Washington, D.C.: International Food Policy Research Institute.
Rojko, A. S. 1975. The economics of food reserve systems. American Journal of Agri-cultural Economics 57: 866–872.
Rosegrant, M. W., T. Zhu, S. Msangi, and T. Sulser. 2008. The impact of biofuel production on world cereal prices. International Food Policy Research Institute, Washington, D.C. Electronic file.
Rosen, S., and S. Shapouri. 2008. Rising food prices intensify food insecurity in devel-oping countries. Amber Waves 6 (1).
Rozelle, S., and J. Swinnen. 2004. Success and failure of reform: Insights from the transition of agriculture. Journal of Economic Literature 42: 404–456.
Sanders, D. R., and S. H. Irwin. 2010. A speculative bubble in commodity futures prices? Cross-sectional evidence. Agricultural Economics 41 (1): 25–32.
Schepf, R. 2006. Price determination in agricultural commodity markets: A primer. Washington, D.C.: Congressional Research Service.
———. 2008. High agricultural commodity prices: What are the issues? Report for Con-gress. Washington, D.C.: Congressional Reporting Service.
Schmidhuber, J. 2006. Impact of an increased biomass use on agricultural markets, prices and food security: A longer-term perspective. Paper presented at the Inter-national Symposium of Northern Europe, November 27–29, Paris.
Schuh, G. E. 1983. The world food situation: Changing trends in world food production and trade. AEA Papers and Proceedings 73 (2): 235–238.
Slater, R., L. Peskett, E. Ludi, and D. Brown. 2008. Climate change, agricultural policy and poverty reduction—How much do we know? Natural Resource Perspectives 109. London: Overseas Development Institute.
Slayton, T., and C. P. Timmer. 2008. Japan, China and Thailand can solve the rice cri-sis: But U.S. leadership is needed. Center for Global Development Notes. <http://www.cgdev.org/content/publications/detail/16028>. Accessed August 22, 2008.
Sullivan, K., 2008. Africa’s last and least: Cultural expectations ensure women are hit hardest by burgeoning food crisis. Washington Post, September 12, 16–17.
Timmer, C. P. 2009. Did speculation affect world rice prices? ESA Working Paper 09-07. Rome: Agricultural Development Economics Division, Food and Agriculture Organization of the United Nations.
Trostle, R. 2008. Global agricultural supply and demand: Factors contributing to the recent increase in food commodity prices. Washington, D.C.: United States Department of Agriculture.
Ulimwengu, J., S. Workne, and Z. Paulos. 2009. Impact of soaring food price in Ethio-pia: Does location matter? Discussion Paper 846. Washington, D.C.: International Food Policy Research Institute.
ul Haq, Z., H. Nazli, and K. Meilke. 2008. Implications of high food prices for poverty in Pakistan. Agricultural Economics 39 (supplement): 477–484.
United Nations. 2008. National accounts main aggregates database. Geneva. <http://unstats.un.org/unsd/snaama>. Accessed July 22, 2008.
REFERENCES 113

USDA (United States Department of Agriculture). 2008a. Agricultural projections to 2017. <http://www.ers.usda.gov/Publications/OCE081/OCE20081.pdf>. Accessed July 31, 2008.
———. 2008b. Cost-of-production forecasts. Datasets. <http://www.ers.usda.gov/Data/CostsAndReturns/>. Accessed July 31, 2008.
———. 2008c. PS&D online database. <http://www.fas.usda.gov/psdonline/psdQuery.aspx>. Accessed July 22, 2008.
———. 2008d. Agricultural prices, National Agricultural Statistics Service. <http://usda.mannlib.cornell.edu/MannUsda/viewDocumentInfo.do?documentID=1002>. Accessed July 22, 2008.
———. 2009. PS&D online database. <http://www.fas.usda.gov/psdonline/psdQuery.aspx>. Accessed July 22, 2008.
Valdes, A., and A. Siamwalla. 1981. Introduction. In Food security for developing countries, ed. A. Valdes. Boulder, Colo., U.S.A.: Westview Press.
Valero-Gil, J. N., and M. Valero. 2008. The effects of rising food prices on poverty in Mexico. Agricultural Economics 39 (supplement): 485–496.
von Braun, J. 2008a. High and rising food prices: Why are they rising, who is affected, how are they affected, and what should be done? Paper presented at the USAID conference “Addressing the Challenges of a Changing World Food Situation: Pre-venting Crisis and Leveraging Opportunity,” April 11, Washington, D.C. <http://www.ifpri.org/presentations/20080411jvbfoodprices.pdf>. Accessed July 22, 2008.
———. 2008b. Food and financial crises: Implications for agriculture and the poor. Food Policy Report 20. Washington, D.C.: International Food Policy Research Institute.
von Braun, J., and M. Torero. 2009. Exploring the price spike. Choices 24 (1): 16–21.
von Braun, J., M. W. Rosegrant, R. Pandya-Lorch, M. J. Cohen, S. A. Cline, M. Ashby Brown, and M. Soledad Bos. 2005. New risks and opportunities for food security: Scenario analyses for 2015 and 2050. 2020 Discussion Paper 39. Washington, D.C.: International Food Policy Research Institute.
Walker, R. L., and J. A. Sharples. 1976. Stabilising the international wheat market with a U.S. buffer stock. Food Policy 1: 382–389.
Ward, B. 1974. The fat years and the lean: A special report on the UN World Food Conference. Economist, November 2, 19.
Warr, P. 2008. World food prices and poverty incidence in a food exporting country: A multihousehold general equilibrium analysis for Thailand. Agricultural Economics 39 (supplement): 525–537.
Wiggins, S. 2008. Is the global food system broken? Opinion Brief 113. London: Over-seas Development Institute.
Williams, J. C., and B. D. Wright. 1991. Storage and commodity markets. Cambridge, U.K., and New York: Cambridge University Press.
Wodon, Q., C., P. Tsimpo, G. Backiny-Yetna, F. Adoho Joseph, and H. Coulombe. 2008. Measuring the potential impact of higher food prices on poverty: Summary evidence from West and Central Africa. World Bank, Washington, D.C. Electronic file.
World Bank. 2008a. Addressing the food crisis: The need for rapid and coordinated action. Background paper for the Group of Eight Meeting of Finance Ministers, June
114 REFERENCES

13–14, Osaka, Japan. <http://www.worldbank.org/html/extdr/foodprices/pdf/G8_food%20price%20paper.pdf>. Accessed July 22, 2008.
———. 2008b. World development report 2008: Agriculture for development. Washington, D.C.: World Bank.
———. 2008c. World development report 2008: Agriculture for development. Washington, D.C.
Wright, B. 2009. Speculators, storage, and the price of rice. Giannini Foundation of Agricultural Economics Working Paper. Berkeley, Davis, and Riverside, Calif., U.S.A.: University of California.
WRTG Economics. 2008. Oil price history and analysis. <http://www.wtrg.com/prices.htm>. Accessed July 22, 2008.
Zezza, A., B. Davis, C. Azzarri, K. Covarrubias, L. Tasciotti, and G. Anriquez. 2008. The impact of rising food prices on the poor. ESA Working Paper 08-07. Rome: Agricultural and Development Economics Division, Food and Agriculture Organiza-tion of the United Nations.
REFERENCES 115
About the Authors
Shenggen Fan is the director general of the International Food Policy Research Institute, Washington, D.C.
Derek Headey is a research fellow in the Development Strategy and Gover-nance Division of the International Food Policy Research Institute, Washing-ton, D.C.
116

Index
117
Page numbers for entries occurring in figures are suffixed by f and those for entries in tables by t.
Abbott, P. C., 1, 37, 39, 51, 52, 69, 88Africa: agriculture in, 2–3, 21, 77, 99–100;
commodities boom in, 58; food imports from United States, 60; food markets in, 71; food prices in, xvi, 63, 66, 68–70, 71, 73; grain imports of, 87; grain production in, xiv; landlocked countries in, 66, 70, 99; malnutrition in, 75, 76; net food-importing countries in, 57, 69; population growth in, 21, 87, 99; social protection in, 98; trans-port costs in, 69; West African franc zone, 59. See also Nigeria
Agricultural development, 2–3, 93, 100–101Agricultural production: in Africa, 2–3, 21,
77, 99–100; challenges, 97; in China, 17, 18; energy use by, 25–27, 26f, 51; Green Revolution, 20, 32, 86–87, 100; impact of food price increases on, 76–77, 78–79t; irrigation, 21, 22f
Agricultural productivity, 20–21, 22fAhmed, A. U., 98Aid. See Foreign aidAksoy, M. A., 57, 72Argentina: export restrictions of, 47, 48;
soybean production of, 8, 17–18; wheat production of, xiii
Arndt, C., 72Asia: food price increases in, 66, 67, 75;
Green Revolution in, 20, 32, 86–87, 100; malnutrition in, 75; rice export restrictions in, 36, 77; rice exports in, 8; rice exports of, 36, 45; self-sufficiency in cereals, 21. See also individual countries
Australia: drought in, xiii, 46, 49, 97; wheat production of, 46, 82; wheat stocks of, 33, 82
Baffes, J., 25Balcombe, K., 56–57Bangladesh: food prices in, 67, 68; rice
imports of, 44, 45, 47f; rice prices in, 85–86
Bhaskar, A., 98Biofuels: demand for, xiii, 28–31, 33, 51;
maize price increases and, xiii, 29, 30, 31,
51, 97; maize production for, 18, 28, 29, 35f; subsidies for, 30; vegetable oil pro-duced for, 28, 29, 31
Brazil: biofuel production in, 28, 30; soybean production in, 8, 17–18
Bubbles, 13, 45, 77
Cambodia: effects of food price increases on poverty in, 73; export restrictions of, 44
Canada, wheat production and stocks of, 33, 82, 85
CARD. See Center for Agricultural Research and Development
Caribbean area. See Central American and Caribbean area
CBOT. See Chicago Board of TradeCenter for Agricultural Research and Develop-
ment (CARD), 30Central American and Caribbean area: cur-
rencies in, 59; food imports from United States, 60; food prices in, 67–68
Cereals. See Grain prices; Maize; Rice; WheatCheng, K., 31Chicago Board of Trade (CBOT), 40, 42Children, food allocation in households and,
76China: demand for food in, xiii–xiv, 14–19;
dietary changes in, xiii–xiv, 14, 18; eco-nomic growth of, 14; export restrictions of, 49, 50; grain imports of, 14; grain produc-tion of, 17, 18; grain stocks of, xiv, 18–19, 33, 35–36, 44; maize exports of, 49; oil imports of, 15, 16f, 17; soybean demand in, xiv, 17–18; soybean imports of, 8, 17–18, 18f
Climate change, 20, 97Collins, K., 29Commodity Credit Corporation, U.S., 82Commodity futures. See Futures marketsCommodity Futures Trading Commission, U.S.,
41, 42Commodity prices: beneficiaries of increases
in, 57–58; bubbles, 13, 45, 77; concep-tual framework of formation of, 4–6, 5f; declines from peaks of, 13–14, 81; effects
Commodity prices (continued) of increases on poverty, 72; exchange rate
movements and, 38–39; interest rates and, 39–40; macroeconomic impacts of increases in, 55–70, 58t; trends in, 10–11t, 13, 63–66, 65t, 82; volatility of, 42. See also Energy price increases; Food prices; Grain prices; Oil prices
Consumer price index (CPI), 62–63, 64f, 68, 69
Consumption: dietary changes, xiii–xiv, 14, 18, 97; intrahousehold food allocation, 76; target levels of, 93
Cooke, B., 42Corn. See MaizeCouncil of Economic Advisors, 29–30CPI. See Consumer price indexCurrencies. See Exchange rate movements;
U.S. dollar
Dawe, D., 68Demand inelasticity, of grain markets, 7, 8, 31Dessus, S., 70, 73Developing countries: agricultural develop-
ment, 2–3, 93, 100–101; food insecurity in, 92; food prices in, 2, 62–70, 80; net food-importing, 56–57, 69, 99; safety net programs in, 97–98
Dietary changes, xiii–xiv, 14, 18, 97Dollar. See U.S. dollarDollive, K., 47, 49, 50Domestic prices: consumer price index, 62–63,
68, 69; transmission of international prices to, 62–70, 80. See also Food prices
Donors. See Foreign aidDutta, K., 77
Egypt, export restrictions of, 44Elasticities of demand, 7, 8, 31Elasticities of substitution, in grain markets,
69Elasticities of supply, 7Energy: usage by economic sector, 25, 26f,
103–4t; use in agriculture, 25, 26f. See also Biofuels; Oil
Energy price increases: production costs and, 27, 27t; role in food crises, xiii, 12–13, 21, 25–28, 51; transport costs and, 26, 80. See also Oil price increases
Ethanol, 28, 30. See also BiofuelsEthiopia, agriculture in, 77Euro area, 59Europe: biofuel production in, 28, 29, 31; for-
mer Soviet bloc countries, 21, 24f, 33, 35; grain exports of, 21; grain production in,
21, 24f, 49; soybean imports of, 8; wheat stocks of, 29, 33
Exchange rate movements, 38–39, 58–62. See also U.S. dollar
Export restrictions: as cause of food crisis, 6, 96, 98; of India, 19, 36, 44, 46, 48, 98; on rice, xiii, 36, 43–46, 45f, 77; of Vietnam, 44; on wheat, xiii, 46–49, 48f
Exports, fertilizer, 88. See also Grain exports
Famine Early Warning Systems Network (FEWSNET), 63, 69, 95
Fan, S., 42FAO. See Food and Agriculture OrganizationFAPRI. See Food and Agricultural Policy
Research InstituteFertilizers: exports of, 88; prices of, 11t, 13,
25, 72, 77, 81, 88; production costs of, 25; subsidies for, 77, 101; use of, 21, 23f
FEWSNET. See Famine Early Warning Systems Network
Financial crisis (2008), 69, 100Financial markets. See Futures marketsFood: dietary changes, xiii–xiv, 14, 18, 97;
global system of, 93, 94, 94f, 95–97, 100; intrahousehold allocation of, 76. See also Food crises; Food prices; Grain prices
Food aid, 88, 93, 94, 99Food and Agricultural Policy Research Institute
(FAPRI), 30Food and Agriculture Organization (FAO), 56,
75, 76, 95Food crises: potential for future, xvi–xvii, 3;
predicting, 94–95; preventing, 95–97; social protection and, 97–98. See also Food price increases
Food crisis (1972-74): causes of, 82–88, 89–90t, 91; comparison to 2007-08 crisis, xvi, 81, 88, 89–90t, 91; predictability of, 94–95; price trends in, 9, 10–11t, 13, 81; responses to, 92, 95, 96, 101; timeline of events in, 83f
Food crisis (2007-08): comparison to 1972-74 crisis, xvi, 81, 88, 89–90t, 91; consequences of, xv–xvi, 1, 54–55; effects on poor, xii; predictability of, 94–95; price decreases after, 13–14, 81; price trends in, xii, xvi, 8–9, 10–11t; suggested solutions for, 2–3; timeline of events in, 14, 15f
Food crisis (2007-08), causes of: academic literature on, xiii–xv, 1–2; agricultural productivity decline as, 20–21; biofuels demand as, xiii, 28–31, 33, 51; comparison to 1972-74 crisis, 88, 89–90t, 91; debates on, 1; demand growth in China and India
118 INDEX

as, xiii–xiv, 14–19; on demand side, 6, 14, 19, 28, 51, 53, 88; dietary changes as, xiii–xiv, 14, 97; dynamic processes, 53; export restrictions as, 6, 96, 98; futures market speculation as, 40–43, 53; govern-ment intervention as, 6; indirect, 15–19; interconnected factors, xiii, 51–53, 52f; interest rates as, 39–40; as “near-perfect storm,” 51–53; oil price increases as, xiii, 21, 25–28, 51; stock depletion as, 31–38, 52; summary model of, 52–53, 52f; on supply side, 6, 14, 53; timeline of events, 14, 15f; trade shocks as, 43–51; U.S. dollar depreciation as, 13, 38–39, 51–52; U.S.-specific factors, 7
Food-deficit countries, 56Food imports: Chinese, 8, 14, 17–18; depen-
dence on, 56–57, 60, 61t, 69, 93, 99; food aid, 94, 99; net food-importing countries, 56–57, 69, 99; recent changes in, 62, 102f; from United States, 7, 50, 60, 61t, 82, 84–85
Food price increases: behavioral responses to, 71; biofuels demand and, 29–30; country-level impacts of, 66–69; distributional effects of, 72, 75–76; effects on hunger and malnutrition, 75; effects on poor, xii, 1, 54, 55; explanations of, 53; global estimates of impacts of, 73–75; macroeconomic impacts of, 55–70, 58t; microeconomic simulations of effects on poverty, 70–77, 74t, 107t; peaks in, 64; producer responses to, 76–77, 78–79t; protests of, 54; real and nominal prices, 63, 64f; regional variations in, 66, 67–69, 105–6t; speed of, 9, 12; supply responses to, 76–77, 78–79t; transmission into domestic markets, 62–70, 80; trends in, 8–9, 10t; in United States, 87. See also Food crises
Food prices: consumer price index, 62–63, 68, 69; by country, 66–69, 67f, 105–6t; data collection, 2, 63, 95; declines in, 13–14, 81, 92; in developing countries, 2, 62–70, 80; oil prices and, 21, 25; real and nominal, 63, 64f; rural-urban differences in, 71; seasonality of, 7, 64; trends in, 63–66, 65t. See also Commodity prices; Grain prices
Food security: challenges, 92–93; criteria, 93; improving, 100–101
Foreign aid, 2–3, 88, 93, 94, 99, 100Foreign exchange reserves, 60, 61t, 88Frankel, J., 40Fuels. See Biofuels; Energy; OilFuglie, K., 20
Futures markets: hedging in, 40–41; informa-tion transmission function of, 6; prices in, 96; speculation in, xv, 3, 40–43, 53
Ghana, effects of food price increases on poverty in, 71, 73
GIEWS (Global Information and Early Warning System) dataset, 2, 63, 66, 92, 95
Gilbert, C., 41–43Global Food Response Program, 96Global Information and Early Warning System.
See GIEWSGrain exports: of Europe, 21; maize, 7, 8, 28,
49, 50, 50f, 60, 61t; rice, 8, 19, 36, 44, 45, 46f; of United States, 7, 60, 61t, 82, 84–85; wheat, 19, 35, 48–49, 60, 61t, 85
Grain markets: basic facts of, 6–8; demand inelasticity of, 7, 31; elasticities of sub-stitution in, 69; export trends in, 82, 84f; improving functioning of, 95–97; inter-national, 6–8; long-term price trends in, 8–9, 9f, 10–11t; in 1970s, 82–84; seasonal-ity of, 7, 64; supply inelasticity of, 7; U.S. dominance of, 7
Grain prices: declines in, 92; increases in, xii, 12f, 13, 86–87; trends in, 9, 10t, 12, 12f. See also Maize prices; Rice prices; Soybean prices; Wheat prices
Grain production: in China, 17, 18; declining yield growth in, xiv; in Europe, 21, 24f, 49; global per capita, xiv; growth rates in, 20, 24t; in 1970s, 82, 85; per capita, 20, 23f, 24t; regional variations in, 99–100
Grain stocks: Australian, 33, 82; Canadian, 33, 82; Chinese, xiv, 18–19, 33, 35–36, 44; costs of, 38; declines in, xv, 32, 33, 37–38; depletion of as cause of food crisis, 31–38, 52; depletion of for biofuel production, 29, 33; European, 29, 33; Indian, xiv, 19, 33, 36, 84; maize, 31, 32, 32f, 33, 34t, 35f, 37, 37f; relationship of levels and prices, 31–32, 36–37; reserves, 3, 95–96, 96n; rice, 31, 32, 32f, 34t, 35–37, 44–45; trends in, 31, 32f, 33, 34t; of United States, xv, 33, 35, 35f, 37, 37f, 82; wheat, xv, 29, 31, 32, 32f, 33–35, 34t, 36f, 37, 82
Green Revolution, 20, 32, 86–87, 100Gulati, A., 77Gürkan, A. A., 56–57
Haddad, L., 76Headey, D., 6, 42, 43, 44, 45–46, 49, 50, 95Helbling, T., 31Herrera, S., 70, 73Household allocation of food, 76
INDEX 119

Household welfare, effects of food price increases, 55, 56f, 70–77
Hoyos, R. de, 70, 73Hunger, impact of food price increases on, 75.
See also Food securityHurt, C., 1, 37, 39, 51, 52, 88
IFPRI. See International Food Policy Research Institute
IMF. See International Monetary FundImports: effects of commodity price increases,
55–58; ethanol, 30; oil, 57; rice, 44, 45, 47f. See also Food imports
Income distribution, effects of food price increases on, 72
India: agricultural production in, 19; demand for food in, xiii–xiv, 14–19; dietary changes in, xiii–xiv, 14; economic growth of, 14; export restrictions of, 19, 36, 44, 46, 48, 98; fertilizer subsidies in, 77; food prices in, 67, 68; grain stocks of, xiv, 19, 33, 36, 84; oil imports of, 15, 16f, 17; Public Dis-tribution Scheme, 19, 44, 98; rice exports of, 19, 36, 44, 45, 46f; rice prices in, 44; safety net programs in, 98; wheat exports of, 19; wheat prices in, 44; wheat produc-tion of, 36, 44, 88
Indonesia: grain imports of, 14–15; malnutrition in, 76
Inflation. See Consumer price index; Energy price increases; Food price increases
Interest rates, 38, 39–40International Development Bank, 68International Food Policy Research Institute
(IFPRI), 92, 95International Monetary Fund (IMF), 29, 55, 57,
58, 60International trade. See Exports; Imports;
Trade shocksIrrigation, 21, 22fIrwin, S. H., 41, 42Isik-Dikmelik, A., 72Ivanic, M., 2, 70, 71, 72, 75
Japan, rice stocks of, 44–45Johnson, Gale, 101Josling, T., 46
Kazakhstan: export restrictions of, 47, 48; grain exports of, 47; wheat stocks of, 33
Land degradation, 20, 21, 97Latin America: food prices in, 67, 68; mal-
nutrition in, 75. See also Argentina; Brazil; Central American and Caribbean area
Least-developed countries (LDCs), food imports of, 56–57. See also Developing countries
Low-income, food-deficit countries, 56
Macroeconomic impacts: of commodity price increases, xv, 55–70; exchange rate movements and, 58–62; transmission into domestic markets, xv, 62–70
Maize exports: of China, 49; of United States, 7, 8, 28, 49, 50, 50f, 60, 61t
Maize prices: biofuels demand and, xiii, 29, 30, 31, 51, 97; increases in, 9, 12, 13, 29, 81; supply responses to increases in, 77, 78–79t; trade shocks and, 49–50; trends in, 8, 9f, 12f, 84; in United States, 8, 18, 37, 37f, 49, 50f
Maize production: in Africa, 77; for biofuels, 18, 28, 29, 35f; of China, 18; responses to price increases, 77, 78–79t; transport costs of, 26; in United States, 18, 28, 29; yields in, 20
Maize stocks, 31, 32, 32f, 33, 34t, 35f, 37, 37f
Malawi, agriculture in, 77Malnutrition, 75, 76. See also Food securityMarkets. See Futures markets; Grain marketsMartin, W., 2, 70, 71, 72, 75Meat consumption, xiii–xiv, 14, 18Meilke, K., 68Men, food consumption by, 76MENA. See Middle Eastern and North African
countriesMercer-Blackman, V., 31Mexico: effects of food price increases on
poverty in, 71; maize imports of, 50Microeconomic simulations of food price
increase effects on poverty, 70–77, 74t, 107t
Microeconomic studies, xv–xviMiddle Eastern and North African (MENA)
countries: maize imports of, 50; malnutrition in, 75; wheat imports of, 49
Mitchell, D., 1, 25–27, 29, 39, 51–52Mitra, S., 46Mozambique, effects of fuel price increases on
poverty in, 72
Nazli, H., 68Ng, F., 57Nigeria: agricultural production in, 77; effects
of food price increases on poverty in, 73; fertilizer subsidies in, 77; food imports of, 60; inflation in, 63, 64f
Nixon administration, 84–85, 87
120 INDEX

Oil: Chinese and Indian imports of, 15, 16f, 17; demand in Asia, 15, 16f; import costs of, 57; use in agriculture, 25, 26f, 51. See also Energy
Oil price increases: causes of, 15, 17; effects on poverty, 72; exchange rate movements and, 38; macroeconomic impacts of, 55, 57, 58t; in 1970s, 38, 82, 87; role in food crises, 12, 21, 25–28, 51, 82, 87. See also Energy price increases
Oil prices: biofuel production and, 31; exchange rate movements and, 38; food prices and, 21, 25; trends in, 11t, 12f, 16f, 17
Organization of Petroleum Exporting Countries (OPEC), 38, 87
Pakistan: food prices in, 67, 68, 71; grain stocks of, 33, 36; poverty in, 71; rice exports of, 36
Passa Orio, J. C., 72Philippines: food prices in, 68; rice imports
of, 44, 45, 47fPoor, effects of food price increases, xii,
1; adjustment costs of, 54–55; analyti-cal framework, 55, 56f; global impact of, 73–75; microeconomic simulations of, 70–77, 74t, 107t; protests, 54; on rural poor, 54; social protection for, 97–98; on urban poor, 54, 72, 73, 107t
Poverty: measurement of, 72–73; rural, 72, 92; urban, 54, 71, 72, 73, 107t
Prakash, A., 56–57Prices. See Commodity prices; Food pricesProducers, impact of food price increases
on, 76–77, 78–79t. See also Agricultural production
Public Distribution Scheme, India, 19, 44, 98
Raszap Skorbiansky, S., 95Reserves. See Foreign exchange reserves;
Grain stocksRice exports: from Asian countries, 8, 36, 45,
46f; of India, 19, 36, 44, 45, 46f; restric-tions on, xiii, 36, 43–46, 45f, 77
Rice markets: demand inelasticity of, 8, 31; distinctiveness of, 8, 13, 43–44, 52; imports, 44, 45, 47f; trade shocks in, 43–46
Rice price increases: bubbles, 45, 77; causes of, xiii, 43–46; compared to other grains, 13; in 1970s, 81, 85–86, 86f; speed of, 9; supply responses to, 77, 78–79t; timing of, 13; transmission into domestic markets, 68
Rice prices: effects of export restrictions on, 44, 45f; stock levels and, 36–37; trends in, 8, 9f, 12f; volatility of, 8, 13, 85
Rice production: in Africa, 77; responses to price increases, 77, 78–79t; by smallholders, 8, 43, 77; yields in, 20
Rice stocks, 31, 32, 32f, 34t, 35–37, 44–45Robles, M., 42Rosegrant, M. D., 30Rosen, S., 75Rural areas: food prices in, 71; poverty in, 54,
72, 92Russia: export restrictions of, 47, 48; wheat
production and stocks of, 33, 47. See also Soviet Union
Safety net programs, 97–98Sanders, D. R., 41, 42Schepf, R., 8, 29, 30Shapouri, S., 75Shariff, A., 98Siamwalla, A., 92Slayton, T., 19, 44Social protection, 97–98Socioeconomic groups, distribution of food
price increase impacts, 75–76South Korea, maize imports of, 49–50Soviet bloc countries, 21, 24f, 33, 35Soviet Union, 85. See also RussiaSoybean prices: increases in, 9, 12, 29, 30,
31, 81; in international markets, 8; trends in, 8, 9f, 12f; in United States, 8, 18
Soybeans: imports of, 8, 17–18, 18f; produc-tion of, 17–18, 29; transport costs of, 26
Stocks. See Grain stocksSub-Saharan Africa. See AfricaSupply inelasticity, of grain markets, 7
TFP. See Total factor productivityThailand: effects of food price increases on
poverty in, 71–72; rice exports of, 46f; rice prices in, 8, 67; rice stocks of, 36, 44
Timmer, C. P., 8, 19, 44Total factor productivity (TFP), 20Trade shocks: as cause of food crisis, 43–51;
in maize markets, 49–50; in 1970s, 84–85; in rice markets, 43–46; in wheat markets, 46–49. See also Export restrictions
Transport costs, 26, 60, 69, 80Trostle, R., 14Tyner, W. E., 1, 37, 39, 51, 52, 88
Ukraine: export restrictions of, 47, 48, 49; wheat production and stocks of, xiii, 33, 47
Ul Haq, Z., 68United States: agricultural subsidies of, 85;
biofuels policies of, 30–31; biofuels produc-tion in, 28, 31, 33, 35f; energy costs in,
INDEX 121

United States (continued) 26–27, 27t; farm profits in, 28, 105t; food
crisis role of, 7; food prices in, 87; foreign aid of, 88; fuels used in agriculture, 25; grain exports of, 7, 60, 61t, 82, 84–85; grain markets of, 7; grain stocks of, xv, 33, 35, 35f, 37, 37f, 82; interest rates in, 38; maize exports of, 7, 8, 28, 49, 50, 50f, 60, 61t; maize prices in, 8, 18, 37, 37f, 49, 50f; maize production in, 18, 28, 29; soybean prices in, 8, 18; soybean produc-tion in, 17–18, 29; trade deficits of, 38; transport costs in, 26; wheat exports of, 35, 48–49, 60, 61t; wheat prices in, 8, 48; wheat production of, 46, 82; wheat stocks of, xv, 33
U.S. Agency for International Development (USAID), 63
U.S. Department of Agriculture (USDA), 7, 21, 33, 44, 62, 76
U.S. dollar: floating rates, 87; strengthening of, 69
U.S. dollar depreciation: distribution of movements, 58–59, 59f; food imports from United States and, 60, 61t; food price increases and, 13, 38–39, 51–52, 59–60; in 1970s, 87
Urban poor: effects of food price increases on, 54, 72, 73, 107t; food prices for, 71. See also Poverty
USAID. See U.S. Agency for International Development
USDA. See U.S. Department of Agriculture
Valdes, A., 92Valero, M., 68Valero-Gil, J. N., 68
Vegetable oil, 28, 29, 31. See also BiofuelsVietnam: export restrictions of, 44; food
prices in, 68; rice exports of, 45, 46f; rice prices in, 67; rice stocks of, 36
Virtual reserves, 3, 96
Welfare. See Household welfare; PovertyWest African franc zone, 59WFP. See World Food ProgrammeWheat exports: of Canada, 85; of India, 19;
restrictions on, xiii, 46–49, 48f; of United States, 35, 48–49, 60, 61t
Wheat prices: increases in, 9, 13, 48, 49, 64, 81, 85; in India, 44; supply responses to increases in, 77, 78–79t; transmission into domestic markets, 68; trends in, 8, 9f, 12f, 48f, 84; in United States, 8, 48
Wheat production: of Australia, 46, 82; of Canada, 82; of India, 36, 44, 88; poor harvests, 46, 85, 88; responses to price increases, 77, 78–79t; transport costs of, 26; trends in, 35; of United States, 46, 82; yields in, 20
Wheat stocks: of Canada, 33, 82; declines in, xv, 29, 31, 32, 37; European, 29, 33; trends in, 32f, 33–35, 34t, 36f; of United States, xv, 33
Wodon, Q., 70, 71, 72, 73, 98Women, food allocation in households and,
76World Bank, 20, 56, 69, 96World Food Programme (WFP), 53, 63, 92,
95, 96World Trade Organization (WTO), 44, 96Wright, B., 37
Zezza, A., 75–76
122 INDEX

Derek Headey is a research fellow in the Development Strategy and Governance Division of the International Food Policy Research Institute, Washington, D.C., and is based in Addis Ababa, Ethiopia.
ISBN 9 7 8-0 -8 9 6 2 9-1 7 8-2
9 7 8 0 8 9 6 2 9 1 7 8 2
The dramatic surge in food prices from 2005 to 2008 seriously threatened the world’s poor, who struggle to buy food even under normal circum-stances, and led to protests and riots in the developing world. The crisis eventually receded, but such surges could recur unless steps are taken to prevent them. Using up-to-date informa-tion, the authors of Re�ections on the Global Food Crisis identify the key causes of the food price surge, its consequences for global poverty, and the challenges involved in preventing another crisis.
Breaking from many earlier interpretations, the authors conclude that the crisis was not primarily fostered by increased demand for meat products in rising economies such as China and India, or by declines in agricultural yields or food stocks, or by futures market speculation. Instead, they attribute the rising food prices to a combination of rising energy prices; growing demand for biofuels; the U.S. dollar depreciation; and various trade shocks related to export restrictions, panic purchases, and unfavorable weather. As part of their analysis, the authors also provide the �rst comprehensive review of both the macroeconomic and microeconomic consequences of the crisis, as well as a detailed comparison of the current crisis with the food price crisis of 1974.
To prevent another crisis, the authors conclude that the global food system should be reformed through several key steps: make trade in agricultural commodities more free yet more secure; address long-term threats to agricultural productivity, such as climate change and resource degradation; scale up social protection in potentially food-insecure countries; and encourage agricultural production in at least some of the countries now heavily depen-dent on food imports. Re�ections on the Global Food Crisis will be a valuable resource for policymakers, development specialists, and others concerned with the world’s poorest people.
Shenggen Fan is the director general of the International Food Policy Research Institute, Washington, D.C.
Cover Illustration adapted from photography by © Giacomo Pirozzi / PanosCover Design by Julia Vivalo