by arturo vega, ph.d. st. mary’s university julian samora ... ·...
TRANSCRIPT

Latino Scoreboard on Texas Higher Education:Just Who’s “Closing the Gaps”?
by Arturo Vega, Ph.D.St. Mary’s University
Rubén O. Martinez, Ph.D.Julian Samora Research Institute
Research Report No. 39May 2008

Latino Scoreboard on Texas Higher Education: Just Who’s “Closing the Gaps”?
by Arturo Vega, Ph.D.St. Mary’s University
Rubén O. Martinez, Ph.D.Julian Samora Research Institute
Research Report No. 39May 2008
ABSTRACT
This paper assesses the effectiveness of the Closing the Gaps Higher Education Plan approved andimplemented by the Texas Higher Education Coordinating Board in 2000 to improve the quality of highereducation and address educational gaps prevalent among the state’s diverse populations. The plan targets thefour areas for improvement: 1) student participation, 2) success, 3) excellence, and 4) research. This paperfocuses only on the first and second goals. In addition to providing an overview of Closing the Gaps, a LatinoScorecard is presented for 34 of Texas’ public universities based on eight institutional measures includingresources, enrollments, graduation rates, student/faculty ratios, affordability, student diversity, facultyrepresentativeness, and local population figures. The overall scorecard is produced by adding the z-scores forthe eight measures for each institution. Negative values are assigned to two z-scores, one a measure ofstudent/faculty equity and the other a measure of affordability. The negative values provide counterweights tothe effects of Latino majority enrollments at South Texas institutions (a correlated variable) and to therelatively higher tuition costs at some institutions (another correlated variable).Statistical analyses show that Latino students are concentrated at institutions at the lower end of the State’s
higher education stratification system, which are located in South Texas where this population is concentrated.They also show that these institutions received fewer resources than those institutions at the top of the system.Consequently, while the scorecard ranks the institutions in terms of how well they do by Latinos, the statisticalanalyses shows that geographic location is related to Latino enrollments and institutional resources are relatedto Latino graduation rates.
ABOUT THE AUTHORS
Arturo Vega is the Director of the Public Administrative Graduate Program and an Associate Professor of PoliticalScience at St. Mary’s University in San Antonio. He received his doctoral degree in political science from the Universityof Oklahoma-Norman in 1990, where he served as a fellow at Carl Albert Congressional Research Center. At St. Mary’sUniversity he teaches courses in American government, including the Legislative Process, the American Presidency, andLatino Politics. Since the early 1990’s, Dr. Vega’s research focuses on urban public policies, municipal structures, andpublic health disparities. He has participated in over a dozen community research projects, evaluations and communityneeds assessments. Over the last two years, Dr. Vega has conducted program evaluations for St. Philip’s ProyectoAlimento and Baptist Child and Family Services “Decisions for Life” program — an in- and after-school, youthleadership program.
Rubén O. Martinez is the Director of the Julian Samora Research Institute at Michigan State University. He is anationally known scholar with expertise in the areas of higher education, race and ethnic relations, and diversityleadership. His areas of specialization include leadership and institutional change, education and ethnic minorities, youthdevelopment, and environmental justice. He was formerly Professor of Public Administration at the University of Texas-San Antonio, where he also served as Director of the Center for Policy Studies.

SUGGESTED CITATION
Vega, Arturo (Ph.D.) and Rubén O. Martinez (Ph.D.) “Latino Scoreboard on Texas HigherEducation Institutions: Just Who’s ‘Closing the Gaps’?” JSRI Research Report #39, The JulianSamora Research Institute, Michigan State University, East Lansing, Michigan, 2008.
c
The Julian Samora Research Institute is committed to the generation, transmission, andapplication of knowledge to serve the needs of Latino communities in the Midwest. To this end,it has organized a number of publication initiatives to facilitate the timely dissemination of currentresearch and information relevant to Latinos.
• Research Reports: JSRI’s flagship publications for scholars who want a quality publication with more detailthan usually allowed in mainstream journals. These are produced in-house. Research Reports are selected fortheir significant contribution to the knowledge base of Latinos.
• Working Papers: for scholars who want to share their preliminary findings and obtain feedback from othersin Latino studies.
• Statistical Briefs/CIFRAS: for the Institute’s dissemination of “facts and figures” on Latino issues andconditions. Also designed to address policy questions and to highlight important topics.
• Occasional Papers: for the dissemination of speeches, papers, and practices of value to the Latinocommunity which are not necessarily based on a research project. Examples include historical accounts ofpeople or events, “oral histories,” motivational talks, poetry, speeches, technical reports, and relatedpresentations.
Julian Samora Research InstituteDr. Rubén O. Martinez, Director
Danny Layne, Layout Editor
MMIICCHHIIGGAANN SSTTAATTEE UUNNIIVVEERRSSIITTYYEast Lansing, Michigan

Latino Scoreboard on Texas Higher Education Institutions:Just Who’s “Closing the Gaps”?
TABLE OF CONTENTS
Analysis ................................................................................................................1
Closing the Gaps Initiative ..................................................................................2
Context: Why Does it Matter and What are Implications for Latinos? ........3
Methods for a Latino Scoreboard ......................................................................4
Findings ..................................................................................................................8
Conclusions ..........................................................................................................15
Endnotes ..............................................................................................................17
References ............................................................................................................18
This paper was originally presented at the 20th Annual Conference of theHispanic Association of Colleges and Universities, Oct. 28-31, 2006, at SanAntonio, Texas and at the 32nd Annual Conference of the Texas Association ofChicanos in Higher Education, Feb. 1-3, 2007, in Dallas, Texas.
Analysis
“Beauty-queens” or “Not so Beautiful,” agents ofchange or just agents, what should we make ofpublic institutions of higher education in Texas interms of their efforts and capacities to “close thegaps” among various race and ethnic groups,specifically Latinos, in the state. Are someinstitutions “better” for Latinos than others?Equally, are some institutions “doing worse” thanothers relative to Latino students? And, just whichinstitutions of higher education are “closing thegaps” and which are just “free riders”?
This paper provides an overview of the status ofLatino students in Texas public colleges anduniversities by summarizing official annualprogress reports pertaining to the Closing the Gapsinitiative in Texas and by creating a LatinoScorecard of institutions of higher education in theState. By focusing exclusively on public 4-yearinstitutions and using annual reported data, thispaper assesses Texas universities relative to their‘success’ measured in terms of eight indicatorsrelative to Latino students. Finally, analysis ofvariance and multiple regression techniques areused to examine the impact of the indicators onenrollments and graduation rates.
Why do this? There are two good reasons. One isthat Texas ranks second in the nation, afterCalifornia, in the number of Latinos in itspopulation. The second is that the examination ofhow well Texas institutions of higher educationaddress Latino student needs is an important issueof accountability and provides information to makeinformed choices for education policymakers tryingto understand how well institutions are performing.
Like many states, the State of Texas maintains ade facto stratified system of higher education notonly across the levels of community colleges anduniversities but within each of the levels as well.Indeed, with the concentration of Latinos at thelower end of the higher education stratificationsystem one might go as far as to say that an
“apartheid-like” system exists — with the lowerresourced institutions struggling to meet theeducational needs of Latinos in the state. Forinstance, in 2005, 60% of Latinos enrolled in public4-year institutions were at nine universities locatedin South Texas.
Moreover the National Center for Public Policyand Higher Education recently warned that “Texas’underperformance in educating its youngpopulation could limit the state’s access to acompetitive workforce and weaken its economyover time” (2006: p3). The National Center furtheradded: “Texas does not perform well in collegecompletion rates. Internationally, Texas not onlyranks very low in the number of certificates anddegrees it produces, it is outpaced by such low-performing nations as the Czech Republic andHungary” (ibid).
Other facts and figures from The National Centerfor Public Policy and Higher Education provide anunwelcoming higher education portrait:
• In Texas, 53% of students are enrolled in communitycolleges and 36% in public 4-year college anduniversities;
• Only a fair percentage (49%) of first-year students incommunity colleges return for their second year;
• Only a fair percentage (51%) of first-time collegestudents complete a bachelor’s degree within six yearsof entering college;
• The State’s population is projected to grow by 26%from 2005 to 2020, far faster than the national rate of14%;
• About 22% of the adult population has less than ahigh school diploma or its equivalent, compared to14% of adults nationwide;
• In Texas, 2,885 more students are leaving the statethan are entering to attend college. About 9% of TexasHigh school graduates who go to college attendcollege out of state;
• Low and middle-income families in Texas earn onaverage $18,152 per year and for students at public4-year colleges and universities, net college costsrepresent about 45% of their annual family income.1
Latino Scoreboard on Texas Higher Education Institutions:Just Who’s “Closing the Gaps”?

These findings are exactly what the State of Texasis seeking to address through its Closing the Gapsinitiative. This paper will shed some light on Texas’efforts to make improvements in the education of itspeople.
Closing the Gaps Initiative
The Texas Higher Education Coordinating Board(THECB) adopted the Closing the Gaps HigherEducation Plan in September, 2000. The Planfocuses on four challenges in higher education seenas the most critical for the future of the state and itseconomy. The four challenges are: 1) closing thegaps in participation, 2) closing the gaps in success,3) closing the gaps in excellence, and 4) closing thegaps in research. The Plan set forth specific goalsfor each of the challenges. For example, the Planset forth the goal of enrolling 5.7% of Latino,African American, and White populations incolleges and universities by 2015 to “ensure thatTexas educates more of its people” (THECB, 2005,p. i). This would require an additional 500,000students based on 2000 enrollment rates. WithLatinos having a participation rate of 3.7% (relativeto their overall population) in 2000, the Plan set 5-year target rates of 4.4% for 2005 (requiring101,600 additional students), 5.1% for 2010(120,000) and 5.7% for 2015 (120,000). The targetof 500,000 additional students attending publiccolleges and universities in 2015, according to theTHECB, will be met by — among other things —increasing the Latino student enrollments from212,123 in 2000 to 553,723 in 2015, a net increaseof 341,600 students with Latinos comprising 68.3%of the additional students.1
The Plan specifies strategies to close each of thegaps, including institutional goals. The Boardclearly recognized that achievement of the goalswould require financial resources and institutionalinitiative and included incentive strategies formoving public colleges and universities to action. Italso required the development and implementationof a performance system that would monitorprogress on each major element in the Plan. Eachof the state’s public institutions, including 35universities,2 50 community college districts (some
with multiple campuses), nine health-relatedinstitutions, and four technical state colleges, hasbeen impacted by the implementation of the“Closing the Gaps Plan,” with each feeling thepressures of the Coordinating Board and itsaccountability requirements.
All the while that the Plan has been in effect,Texas has experienced major demographic changesin its population, and its institutions of highereducation continue to struggle with the growth ofstudent populations. For example, studentenrollments at public institutions increased from875,231 in the fall of 2000 to 1,066,606 in the fallof 2005, reflecting an increase of approximately21.9%. Determining how much of this growth isdue to the Closing the Gaps initiative and howmuch is due to demographic processes is difficultto do. Certainly, both processes have had theirrespective impacts.
An initial assessment of the respective influencescan be made, however, by comparing the growthrate of Latinos in general to their enrollmentgrowth rate in institutions of higher education from2000 to 2005. Census 2000 set the populationfigures for Texas at 20,851,820, with Latinopopulation figures set at 6,669,666, or 32% of thestate’s population. Estimates from the StateDemographer’s Office assuming zero net migration(a conservative assumption) projected the state’spopulation for 2005 at 22,556,027 and the Latinopopulation at 7,820,842.
The growth rate for each of these populationcategories is 8.2% and 17.3%, respectively.3 TheTHECB, in a Participation Forecast report datedJanuary 2005, estimated the state’s population at23,002,555, and the Latino population at 8,144,538.The respective growth rate for each of thesepopulation categories using the Board’s figures is10.3% and 22.1%, respectively.4 Latino enrollmentsin public institutions increased from 212,123 in2000 to 291,504 in 2005.5 This reflects a growthrate of 37.4% between the years 2000 and 2005,and shows that the growth of Latino enrollmentsexceeds the group’s overall population growth byapproximately 15%.
2

Still, based on annual enrollment figures, theTHECB held in January 2005 that Latinos were noton track to reach the statewide targets by 2005.6Indeed, actual figures for the fall of 2005 show thatthe target of 340,000 was not met, falling short by30,272 students.7 To make the target, Latino studentenrollments would have needed to increase by43.2%. Thus, for the Initiative’s targets for Latinosfor 2010 and 2015 to be met, their growth ratesmust exceed those initially set by the Plan to makeup the goal shortfall evident in 2005.
Given changes in the growth rates among thedifferent groups, the State revised its intermediategoals by increasing the 2010 targets for AfricanAmericans (from 5.4% to 5.6%) and Whites (5.4%to 5.7%) and reducing the 2010 target for Latinos(from 5.3% to 4.8%), which experienced higherthan expected general population growth. The totalparticipation rate goal would increase from 5.5% to5.6% in 2010. The targets of 5.7% for 2015 weremaintained for each of the groups. These changesin the intermediate targets would require 630,000,rather than 500,000, additional students enrolled inpublic universities in 2015. The overall targetwould require an additional 438,706 Latinosstudents, who would comprise 69.6% of theadditional students. It is doubtful, however, that thegrowth rates can be increased to make up thedeficits unless some dramatic improvements aremade by the state’s institutions. To meet the targets,the numbers of Latino students in publicuniversities would have to be dramaticallyincreased.
For example, 60.9% of Latino students in 2000were enrolled in the state’s community andtechnical (2-year) colleges. In 2005, this figure hadincreased slightly to 61.9%. Thus, the distributionof Latino students across the levels of institutionsremained much the same during this period. Whileincreases in community college-going rates amongLatinos create a larger pool from which theuniversities can draw transfer students, it isimportant that universities not only increase Latinotransfer admissions, but they must also increasetheir rates for Latino freshmen. Otherwise, theconcentration of Latinos in 2-year institutions willincrease and further exacerbate the inequities thatalready characterize higher education.
Context: Why Does It Matter andWhat are Implications for Latinos?
Few things in academia evoke as intense andpassionate debate and discussion as the ranking ofhigher education institutions, whether they be basedon academic performance or reputation (Carey andDuffy, 1999). Most of the controversy centers onthe appropriateness of the indicators that are usedand the methods of analyses, although fears aboundamong institutional leaders that rankings mayreflect negatively on their institution.
For nearly two decades, several popularperiodicals have created cottage industries byranking and providing selection guides toinstitutions of higher education across the country(US News and World Report; Business WeekAmerica’s Best Colleges, Time magazine, thePrinceton Review, Money Magazine; even theNational Science Foundation). Business Week, forexample, provides business school rankings. ThePrinceton Review ranks programs and institutionsby using student surveys. Popular rankings includethe “Best Dollar Value” and the “Biggest PartySchool.”
Few, if any, rankings exist with Latinos in mind.The Hispanic Outlook, for example, has recognizedsome Hispanic Serving Institutions as leaders ineducating Latinos by using enrollment andgraduation figures. The Texas Association ofChicanos in Higher Education (TACHE), andprincipally Ed Apodoca from the University ofHouston-Downtown, has intermittently providedboth formal and informal “overviews” of Texasinstitutions with varied successes. TACHE nolonger rates institutions for fear of offendinginstitutional members and lack of agreement as towhich indicators to use.
Why the angst? In short, institutional reputationand status matter. Sharp (1995) writes: “On onelevel or another, people continually evaluate andmake judgments about an institution on the basis ofvarious types of information—some accurate andsome not” (p. 2). Reputations and status matter toinstitutions in their abilities to recruit and retainstudents to their institutions. Ask the University of
3

Texas-Austin, for example, what winning thenational collegiate football championship means inregard to recruitment and retention of students.Reputations and status matter also for therecruitment of faculty and ultimately the caliber offaculty in terms of research funds generated andpublications.
On the other hand, from a socio-economicperspective, and more importantly for Latinoconsumers (parents and students), institutions ofhigher education remain one of the principal andseemingly readily available mechanisms of “socialopportunity” for overcoming social and economicinequalities. At the same time, however, institutionsof higher education can reify those inequalities.Carey (2004) writes:
Once, those who tried and failed to get acollege degree still had the opportunity tofind a solid middle-management job andmove up a career ladder... The world haschanged. The rapidly globalizing 21stCentury economy is putting relentlesspressure on lower-skill manufacturing jobsthat once allowed people without postsecondary education to stay comfortablywithin the middle class.
For Latinos, being able to assess the quality ofpublic institutions of education can translate intoeconomic and social mobility. According to Censusdata, for example, the average earnings for Latinoswere $25,824 compared to a nationwide average of$36,308; the average was $37,376 for Whites, and$28,179 for African Americans (Stoops, 2004, p7).In contrast, the average earnings for individualswith bachelor’s degrees were $51,194; $52,479 forWhites, $42,285 for African Americans, and$40,949 for Latinos. With higher education degreesimpacting income in this way, it is important tounderstand how well institutions are doing ineducating Latino students.
Controversies over rankings are largelymethodological. Questions of validity andreliability as well as procedural concerns relative toweighting are typical (see Crissey, 1997; Selingo,1997). The dilemma rests not only with theranks/ratings and who is making them but themeasures that are used and even the levels ofmeasurement to use (ordinal versus interval versusratio). In addition, there is little consensus on whatindicators should be used when comparing differenttypes of institutions (teaching versus research) oreven what means of classifying institutions to use(Carnegie versus state classifications).
But what are the issues relative to Latino parentsand students? Admission and graduation areindicators of institutional access and success.Affordability is a measure of present and futurefinancial stress for Latino parents, students andeven families, given the seemingly unendingdouble-digit increases in college tuition andcontinual decreases in federal aid programs. Issuesof diversity, equity, and the use of resources arealso important considerations.
Methods for a Latino Scoreboard
The Latino Scorecard developed in this workfocuses only on 34 public universities in Texas.8 Itdoes not include the community and technicalcolleges, nor does it include the health-relatedinstitutions (at this time). In addition, rather thanusing previous scores or ranks, this work developsand examines indicators using the latest availableofficial data (2005). Our aim is to use theseindicators as benchmark data in the development oftrend analyses over the next several years.
Given the historical track records of institutionsof higher education in Texas, we hypothesize thatmeasures of equity or parity will vary byinstitutional type and that Texas institutions ofhigher education are stratified by both proximity toLatino communities and institutional resources. Weexpect that institutions with readily available Latinopopulations, for example, will have the lion’s shareof Latino student enrollments and graduations and
4

rank well on other measures of effectiveness relativeto Latinos. Equally, we expect that the premierresearch institutions of the State (Texas A&M and,perhaps, Texas Tech), given their resources andstate-wide appeal to high performing Latinostudents, will also fare better than the less resourcedinstitutions of higher education in the state.
Table 1 summarizes the eight measuresincorporated for the scorecard. Ratio levelmeasurements are derived to compare institutionalmeasures to relevant statewide measures and tocompare institutional performance measures forLatino students relative to their White studentcounterparts. Ultimately, focusing on ratios ofLatino students to White students at each institutionusing a variety of measures creates assessments ofequity relative to the challenge of “closing the gaps”between the two groups. Institutions thatapproximate parity among the indicators will havehigh cumulative scores or ranks under this process.Standardizing and summing the eight indicatorsprovides the cumulative score of each institution. Ingeneral, the lower the standardized score, the lesswell the institution performed relative to themeasures used. Conversely, the higher thestandardized score, the better the institutionperformed.
Resources, for example, are measured as a ratio ofinstructional costs (2005) per full time equivalentstudent to the state average instructional costs perstudent of $5,715 (RinstrcostpstTOstave). Thestate average was derived by summing all theinstructional costs and dividing by the 34institutions used in this study. The THECB definesinstructional costs as “funds used for all activitiesthat are a part of an institution’s instructionalprogram to include faculty salaries, academicdepartmental operating expenses, and support staffsalaries” (2006, 5). A ratio of 1.0 indicates that theinstitution has instructional costs equal to the stateaverage. Similarly, a ratio greater than 1.0 meansthat an institution exceeds the state average and,conversely, less than 1.0 indicates that instructionalcosts are below the state average.
Two indicators of effectiveness are also used inthis analysis. First, a criterion (RLsixgrtoWsixgr) isdeveloped by comparing the institutions’ graduationrates for Latinos and White students. Using thereported 6-year graduation rates for undergraduatesfor Fall 1999 Latino and White student cohorts and,by comparing these rates as a ratio, a measure of aninstitution’s effective graduation rate for Latinosrelative to White students is derived.9 A ratio of 1.0indicates that there is no disparity in graduationrates. Greater than 1.0 indicates that Latinos have ahigher 6-year graduation rate; while a ratio less than
VARIABLE VARIABLE NAME MEASURE
RESOURCES RinstrcostpstTOstave Ratio instructional cost (2005) per student FTE (Fall 2005) to state average
instructional cost per student ($5715)
EFFECTIVENESS RLsixgrtoWsixgr RATIO Latino student 6-year graduation rate to White student
6-year graduation rate
EFFECTIVENESS DgradratetoNATLrate (sixyr) Difference of the National 6-year graduation average rate to institution
6-year graduation rate
DIVERSITY RLfactoWfac RATIO #Latino faculty to #White faculty
DIVERSITY RLenrolltoWenroll Ratio Latino enrollment to White enrollment (2005)
EQUITY RLstudfactoWstudfac * - 1 RATIO Latino student/Latino faculty to White student/White faculty
AFFORDABILITY RaveTRUtoLFammedinc *-1 RATIO average cost of residential undergraduate tuition to state
median income Latino family ($32,011)
ACCESS RpctLenrolltopctL1 825 Ratio Latino enrollment to Latinos age 18-25 in service area (county/state)
Table 1. Criteria Used to Develop Scorecard

1.0 indicates that White students have a higher 6-year graduation rate. In addition, effectiveness ismeasured by comparing the institution’s overallgraduation rate to the national 6-year graduationaverage rate (.52) for all types of universities(DgradratetoNATLrate [sixyr]) as derived by theNational Center for Education Statistics (2006).This measure is the difference of an institution’s 6-year graduation average to the national average. Apositive value indicates that an institution is doingfairly well; while scores below suggest theopposite.
Institutional diversity is measured for thepurposes of this paper in two ways: first, as theratio of the number of Latino faculty to the numberof White faculty (RLfactoWfac). This measurebenchmarks the level of all Latino facultyrepresentation (Full, Associate, and AssistantProfessors, Instructors and “Other” Faculty asreported by THECB accountability system) on eachcampus. One of the critical graduation factors forracial, ethnic minorities and female students is thepresence of faculty of color and women (Reed,1986). The number and presence of racial, ethnicminority and women faculty signals to prospectivestudents of the same backgrounds that theuniversity environment is a relatively welcomingone, where members of their own ethnicity or sexare also present and viable. Because many Latinofaculty members are employed at the rank ofinstructor or “other,” rather than using tenure or atenure track number, the larger more inclusive“faculty” category was used here for both Latinoand White faculty. Here a ratio of 1.0 indicates thatthe number of Latino faculty equals the number ofWhite faculty.10
The second indicator of diversity is the ratio ofLatino enrollments to White enrollments for 2005(RLenrolltoWenroll). Again, using the THECBaccountability system, these data were used tocreate a ratio, where 1.0 indicates that Latinoenrollments equaled that of White students; a ratiogreater than 1.0 indicates that Latino enrollmentsare greater and a ratio of less than 1.0 indicates thatWhite enrollments are greater.
Equity is measured by a student to faculty ratio(RLstudfactoWstudfac). Here, however, equity ismeasured as the ratio of Latino students to LatinoFaculty compared to the ratio of White students toWhite faculty on each campus. A ratio of 1.0, forexample, indicates that the Latino student-facultyratio is equal to the White student-faculty ratio —an equitable distribution of faculty resources givensalient demographic groups. Again, a ratio greaterthan 1.0 indicates there are more Latino studentsper Latino faculty member and a figure less than1.0 indicates there are more White students perWhite faculty member.
To measure the institution’s affordability forLatino families, a ratio of the average cost ofresidential undergraduate tuition to the state medianincome ($32,011) for Latino families (2000 Censusdata) was constructed (RaveTRUtoLFammedinc).Average cost of residential undergraduate tuitionwas created by summing all the reported averageundergraduate tuition and fees for 30 semestercredit hours for FY2005 (THECB accountabilitysystem) and dividing by 34 institutions. Here, a 1.0ratio value indicates that the average tuition andfees costs equaled the median family income forLatino families in Texas. The state average oftuition and fees in 2005 was 15% of the Latinomedian family income in the state.11
Finally, the last criterion used was a measure foraccess. Here a ratio was created comparing thepercent of Latinos enrolled at an institution to thepercent of Latinos ages 18-25 in the institution’sservice area (represented here as county census datafor all institutions except Texas Tech, Texas A&M,and the University of Texas-Austin)(RpctLenrolltopctL1825).
Given the state-wide stature of Texas Tech, TexasA&M, and the University of Texas-Austin, thestatewide percent of Latinos ages 18-25 was usedas measure of these institution’s service area. Whilemany institutions define much larger service areasrelative to student age, this measure is just oneindicator of university access available to Latinostudents. Here a ratio of 1.0 indicates perfectinstitutional access relative to Latinos aged 18-25in the service area.
6

Finally, to develop an overall score for eachinstitution, the value for each criterion wasstandardized into z-scores and scaled as an index(see Table 2). Because as the old saying goes, “youcan’t compare apples and oranges,” the use ofstandardization converts measures into scores (herez-scores) that can then be compared. All z-scoreshave a mean of zero and a standard deviation ofone, thus allowing comparisons.
In addition to z-scores, we employ t-test andanalysis of variance difference in means tests aswell as correlation analyses and two ordinary leastsquares (OLS) regressions to identify patternsacross institutions. These additional analytic toolshelp us contextualize the kinds of institutions thatare “closing the gaps.”
RATIO LATINO RATIO RATIO LATINO DIFFERENCE
STUDENT TO RATIO RATIO INSTRUCTIONAL STUDENT 6-YR NATIONAL
RATIO RATIO LATINO FACULTY AVERAGE LATINO COSTS PER GRAD RATE TO AVE. 6-YR
LATINO # LATINO TO WHITE TUITION TO ENROLLMENT TO FTE TO STATE TO WHITE GRAD RATE
RAW ENROLLMENT TO FACULTY TO # STUDENT TO LATINO MEDIAN LATINOS 18-25 AVE. COST STUDENT 6-YR (.52) TO INST.
SCORE WHITE ENROLL. WHITE FACULTY WHITE FACULTY FAMILY INCOME SERVICE AREA PER FTE [$5,715] GRAD RATE GRAD RATE
INSTITUTION TOTAL (DIVERSITY) (DIVERSITY) (EQUITY) (AFFORDABILITY) (ACCESS) (INST. COST) (GRAD RATES) (GRAD RATES)
Angelo State University 7.72 0.32 0.06 5.04 0.17 0.58 0.93 0.69 -0.07
Lamar University 6.27 0.1 0.03 3.79 0.13 0.36 0.81 1.19 -0.14
Midwestern State University 6.66 0.12 0.03 4.43 0.2 0.47 0.74 0.83 -0.16
Prairie View A&M University 8.1 0.63 0.11 5.8 0.13 0.17 0.73 0.85 -0.32
Sam Houston State University 5.51 0.15 0.05 3.2 0.1 0.72 0.55 0.78 -0.04
Stephen F. Austin State University 5.63 0.1 0.03 3.34 0.12 0.57 0.76 0.74 -0.03
Sul Ross University 13.3 1.03 0.11 9.39 0.15 0.93 0.9 1.03 -0.24
Tarleton State University 4.64 0.09 0.04 2.34 0.14 0.5 0.69 0.85 -0.01
Texas A&M International University 64.63 29.08 0.93 31.36 0.19 0.93 1.01 1.22 -0.09
Texas A&M University Commerce 10.17 0.1 0.01 7.74 0.16 0.5 0.77 0.98 -0.09
Texas A&M University Corpus Christi 6.93 0.69 0.19 3.56 0.15 0.57 0.82 0.96 -0.01
Texas A&M University Kingsville 14.39 2.44 0.27 8.96 0.21 0.89 0.96 0.85 -0.19
Texas A&M University 0.04 0.02 2.13 0.13 0.53 1.09
Texarkana
Texas A&M University 5.64 0.14 0.06 2.26 0.16 0.24 1.52 0.96 0.3
Texas A&M Galveston 4.94 0.12 0.05 2.32 0.13 0.37 1.03 0.89 0.03
Texas Southern University 13.7 1.88 0.18 10.32 0.15 0.1 0.79 0.63 -0.35
Texas State University San Marcos 5.89 0.28 0.09 3 0.15 0.71 0.71 0.86 0.09
Texas Tech University 4.69 0.14 0.07 2.09 0.23 0.26 0.99 0.78 0.13
Texas Woman’s University 6.36 0.19 0.05 4.05 0.16 0.26 0.91 0.78 -0.04
UT Pan Am 36.95 14.89 0.81 18.45 0.13 0.92 0.75 1.17 -0.17
UT Arlington 7.06 0.25 0.06 4.36 0.14 0.43 0.82 1.04 -0.04
UT Austin 7.18 0.25 0.07 3.49 0.2 0.34 1.66 0.9 0.27
UT Brownsville 8.93 0.84 10.69 0.13 0.94 2.27
UT Dallas 4.88 0.15 0.07 2.12 0.15 0.31 1.17 0.79 0.12
UT El Paso 22.91 6.12 0.45 13.59 0.13 0.87 0.88 1.07 -0.2
UT San Antonio 8.53 1.14 0.24 4.67 0.14 0.72 0.73 1.03 -0.14
UT Tyler 5.39 0.07 0.03 2.65 0.16 0.26 0.84 1.18 0.2
UT Permian Basin 7.85 0.59 0.12 4.85 0.18 0.84 0.68 0.64 -0.05
UH Clear Lake 0.22 0.06 4.01 0.13 0.3 0.9
UH Downtown 18.26 1.6 0.11 14.21 0.15 0.78 0.59 1.17 -0.35
UH Victoria 0.28 0.11 2.57 0.11 0.34 1.02
University of Houston 9.09 0.48 0.08 5.94 0.14 0.39 0.95 1.15 -0.04
University of North Texas 5.43 0.15 0.05 3.12 0.13 0.23 0.87 0.87 0.01
West Texas A&M University 17.47 0.19 0.01 14.99 0.11 0.97 0.72 0.58 -0.1
Table 2. Texas Institutions of Higher Education by Latino Scorecard Criteria*
*Raw Scores

Findings
An examination of the ratio of instructional costs(2005) to the state average instructional cost perstudent ($5,715) as an indicator of Resourcesreveals statistically significant differences (F-Test=3.55; prob.=.013) by institutional type (seeTable 3). Not overly surprising, Carnegieinstitutions classified as “Research Very High”have the largest average instructional costs perstudent, while “bachelor/diverse” and “masterslarge” had the smallest.
Instructional costs ranged by institution as well.Instructional costs per student ranged between$3,131 at Sam Houston State to $12,962 at theUniversity of Texas-Brownsville.12 Overall, slightlyless than one-third (31.2%) of the institutionsexamined here had instructional costs ratios thatexceeded the state average instructional costs. UT-Brownsville, for example, had the highestinstructional cost ratio at 2.27, which means thatthis institution has two and one-quarter times moreinstructional costs than the state average. TexasSouthern and UT-Permian Basin, on the other hand,had the lowest ratios at .63 and .64, respectively.This means that they have less than two-thirds theaverage instructional costs of the state average.
Examining the effectiveness indicators—ratio of6-year graduation rates for Latino and Whiteundergraduates student cohorts for 1999(RLsixgrtoWsixgr) and the difference between aninstitution’s average 6-year graduation rate and thenational average [DgradratetoNATLrate (sixyr)]— reveals wide disparities in graduation ratesamong Texas universities. Overall, the average
Latino to White student 6-year graduation rate was.92— approaching parity. But examining individualinstitutions shows disparities. Texas A&MInternational (Laredo), for example, had the highesteffectiveness ratio with a score of 1.22, whichmeans that at Laredo, Latino students graduate at arate that is more than 20% higher than that forWhite students. In contrast, West Texas A&MUniversity (Canyon) had the lowest Latino toWhite 6-year graduation ratio at .58, indicating thatLatino students at West Texas graduate at 58percent the rate of their White counterparts.
Of interest, the ratio of Latino 6-year graduationrates to White 6-year graduate rates(RLsixgrtoWsixgr) is moderately correlated withthe ratio of Latino student enrollment to Whitestudent enrollment (RLenrolltoWenroll) (Pearsoncorrelation=.44; prob.=.01) and the ratio of Latinoenrollment to Latinos 18-25 in the service area(RpctLenrolltopctL 1825) (Pearson correlation=.47; prob.=.005). These associations suggest thatinstitutions that have high 6-year graduation ratesfor Latino students relative to their White studentcounterparts are institutions with high Latinoenrollments relative to White student enrollmentsand relative to Latinos between the ages of 18 and25 in service area. These data indicate that thoseinstitutions situated in areas with “high” Latinopopulations are the ones leading the way in“closing the gaps” relative to the Latino population.
8
Table 3. Instructional Expenses 2005 Per Student Enroll Sources and UsesN MEAN STD. DEVIATION MINIMUM MAXIMUM
Bac/Diverse 2 $4,627.50 1785.44 3365 5890
Masters Medium 7 $6,139.71 3126.41 3861 12962
Master’s Large 14 $4,457.29 647.01 3131 5820
Doctoral/Research University 3 $5,017.00 569.53 4377 5468
Research High 6 $5,412.67 706.79 4681 6680
Research Very High 2 $9,091.00 545.89 8705 9477
Total 34 $5,304.24 1871.34 3131 12962
F=3.551; prob.=.013

In terms of graduation rates relative to thenational average—our second indicator ofeffectiveness [DgradratetoNATLrate (sixyr)] —of the 30 institutions reporting data, the averagedifference was -.06., with slightly over a quarter(26.6%) of these institutions exceeding the national6-year graduation average. Among the institutionsexamined here, the University of Texas-Austin hada 6-year graduation rate of .79, which exceeds thenational average by 27 percentage points. Incontrast, the University of Houston (Downtown andTexas Southern) report 6-year graduation rates (.17)that were 35 points below the national average.Perhaps not too surprisingly, the difference ininstitutional 6-year graduation rates relative to thenational average is positive and strongly associated(Pearson correlation=.68; prob.=.000) with the ratioinstructional cost per student FTE to state averageinstructional cost per student in 2005 ($5,715). Thisstrong association suggests that an institution’s 6-year graduation rate increases as institutionalinstructional costs per FTE student also increasesand vice versa. Generally, it is the researchinstitutions which tend to have the higherinstructional costs per student FTE, and the oneswhich recruit the highest performing students.
Institutional diversity criteria measures, again,included the ratio of the number of Latino faculty(broadly defined) compared to the number of Whitefaculty (also broadly defined) (RLfactoWfac) andthe ratio of Latino enrollment to White enrollmentfor 2005 (RLenrolltoWenroll). In terms of Latinofaculty diversity, the institutions examined here hadan average ratio of .16, which means that there isone Latino faculty member for every six Whitefaculty members. A ratio of 1.0 or somethingapproximating 1.0 would indicate parity. Only 9%— or three of the institutions examined here — hada Latino faculty to White faculty ratio thatexceeded .50: these were Texas A&M International(Laredo) at .93, UT-Pan Am (.8 1) and UT-Brownsville (.84). In contrast, nearly three-quarters(73.5%) of the institutions examined here had a .11ratio or less of Latino faculty to White faculty; inother words, one Latino faculty member for everynine or more White faculty.
Examining the ratio of Latino student enrollmentto White student enrollment (RLenrolltoWenroll),the second indictor of diversity, finds an averageratio of 2.15. At face value, this ratio indicates thaton average more Latinos are enrolled than Whitestudents. But here the ratio average is being drivenby three outliers — Texas A&M International (withan average ratio of 29.1), UT-Pan Am (14.9average), and UT-Brownsville (8.9 average).Indeed, only nine institutions in Texas had a ratioof 1.0 or greater and all these institutions weregeographically found in South Texas (drawing aline from El Paso through San Antonio and endingin Houston and south). In contrast, Texas A&M(Texarkana) had the lowest ratio of Latino studentenrollments to White student enrollments (.04).Clearly, Latino students in Texas are heavilyconcentrated at a handful of institutions.
Again, perhaps not overly surprising, theassociation between the ratio of Latino faculty toWhite faculty and the ratio of Latino enrollment andWhite student enrollment is very strong (Pearsoncorrelation =.90; prob.=.000). In other words, themore Latino students are enrolled, the more Latinofaculty one is likely to find at an institution and viceversa. Also moderately associated is the correlationbetween the ratio of Latino student enrollment andWhite student enrollment and the ratio of Latinoenrollment to Latinos ages 18 to 25 in the servicearea (Pearson correlation=.47; prob.=.005). Yet, incontrast, 2005 institutional instructional costs perstudent (raw value, not ratio) is not significantlycorrelated with Latino student enrollments for thesame year (Pearson correlation=.08; prob.=.655).Again, these findings suggest that institutionslocated in “high” Latino population areas are theones contributing substantially to “closing thegaps?”
Equity is measured as ratio of students to facultymembers. Here, however, it is measured as the ratioof Latino students to Latino Faculty to the ratio ofWhite students to White faculty on each campus(RLstudfactoWstudfac). A ratio of 1.0, forexample, indicates that the Latino student-facultyratio is equal to the White student-faculty ratio —an equitable distribution of faculty resources given
9

salient demographic groups (Latino and White,here). The overall state average was 6.6, whichindicates that there are nearly seven more Latinostudents per Latino faculty than there are Whitestudents to White faculty. Given the under-representation of Latinos in colleges anduniversities, this means that Latino faculty are evenmore underrepresented. For example, Texas TechUniversity had the smallest ratio at 2.07 amongTexas universities examined, meaning that there are2 times as many Latino students to Latino facultythan White students to White faculty. While thisfigure is closest to equity, overall the numbers ofLatino students and Latino faculty members aresmall at Texas Tech. In contrast, Texas A&MInternational University (TAMIU) had the largestratio at 31.4. This ratio indicates that there are 31times as many Latino students to the number ofLatino faculty than there are White students toWhite faculty. Since TAMIU is high on both Latinostudents and faculty, the fact remains that Latinofaculty are underrepresented relative to Latinostudents. Of interest, the Latino 6-year graduationrate at Texas universities is negatively associated(Pearson correlation=-.384; prob=.04) with the ratioof Latino student to Latino faculty ratios at theseinstitutions. More on this point is stated in theconclusion.
In terms of Texas universities’ affordability forLatino families, a ratio of the average cost ofresidential undergraduate tuition to the state medianincome ($32,011) for Latino families (2000 censusdata) (RaveTRUtoLFammedinc) was constructed.Texas Tech (ratio .23), Texas A&M-Kingsville (.21), and the University of Texas-Austin (.20) had the“highest” affordability ratios and were the leastaffordable for Latino families. In contrast, SamHouston State had the lowest affordability ratio(.10) and was the most affordable for Latinofamilies.
Finally, in terms of access, measured as a ratio ofthe percent Latinos enrolled in an institution to thepercent of Latinos ages 18-25 in the institution’sservice area [represented here as county census datafor all institutions except Texas Tech, Texas A&M,and the University of Texas-Austin, which weregiven the statewide percent of Latinos ages 18-25(.43)]. Here a ratio of 1.0 indicates perfectinstitutional access (or parity) relative to Latinosages 18-25 in the service area. Overall, Texasuniversities had .54 average accessibility scoresrelative to Latinos ages 18-25 in their service areas.West Texas A&M had the highest ratio of .97,while Texas Southern University — a traditionalAfrican American-serving institution — has thelowest ratio (.10), indicating that while Latinosreside in the service area they do not attend thisinstitution in sizable numbers.
So how do the institutions fare relative to anoverall cumulative score? To create an overall scorefor each institution, raw scores were converted intoz-scores and scaled as an index. Again,standardization allows for a comparison of “applesand oranges” — the comparison of differentindicators measured in different measurement units(dollars, students, faculty) — and converting theminto “fruit” or standard scores, all with the samemean (0) and standard deviation (1). Scaling the z-score provides for a performance indicator alongthe eight indicators for each institution.
But simply using an additive score mayexaggerate the overall rankings. To offset this issue,we assign a negative value to the equity(RLstudfactoWstudfac) and affordability(RaveTRUtoLFammedinc) indicators. Assigningthe negative value to these indicators provides aweight that reflects the cultural and financialchallenges faced by Latinos relative to theseindicators at these institutions. So the higher thenegative ratio of Latino student to Latino facultyrelative to the ratio of White students to Whitefaculty, the lower an institution’s score on thisindicator. The same negative weight assigned to theratio of average tuition to Latino family medianincome also reflects the detriment of high tuitionrelative to Latino family median income at eachinstitution.
10

Table 4 reveals the overall cumulative scores foreach institution sorted by descending order. Figure1 is a histogram of the scores. Because of missingdata issues, the overall scores for four institutionscould not be derived. Nonetheless, both tables andgraph demonstrate a distribution of scores thatapproximates a normal distribution. Overall, Texasuniversities had -.33 average z-score, indicating aslight negative mean, and a median value of .09.Figure 1 demonstrates that the vast majority ofTexas universities scored in the middle range of thedistribution. Another way to cut the scores is topoint out that 77% of all Texas universitiesexamined here had a cumulative z-score of .83 or
less. Only seven Texas institutions (Texas A&MInternational University, UT-Pan Am, Texas A&MUniversity, UT-El Paso, UT-Austin, UT-Tyler, andUT-San Antonio) had a cumulative z-score of 1.0 orlarger.
An analysis of variance (ANOVA) test providesan additional perspective of the institution’s overallscore. Table 5, for example, reveals the overallscores for each institution sorted by Carnegieclassification type and by descending order. Overallthere were no statistically significant differences bytype of institutions (ANOVA F-value 1.07;prob.=.40; table not presented here). Universitiesclassified by the Carnegie Foundation as very highresearch institutions averaged a 2.2 performance z-score while, in contrast, doctoral/researchuniversities had a negative 2.1 performance z-score.The majority of the Master’s large institutions hadpositive scores, while the majority of Master’smedium institutions had negative scores.
Examining the Latino 6-year graduation rates byCarnegie type institution, however, reveals thatthere are statistically significant differences inmeans across institutional types in the State(F=3.586; prob=.015; see Tables 6 and 7).“Research very high” institutions (Texas A&M andUT), for example, have average Latino 6-yeargraduation rates that exceed the state average by 34points (average of all the state institutions). Noother Carnegie classification institution type
11
Table 4. Z-Scores by InstitutionTOTAL
INSTITUTION Z-SCORE
Texas A&M International University 6.17UT Pan Am 5.54Texas A&M University 2.93UT El Paso 2.61UT Austin 1.55UT Tyler 1.27UT San Antonio 1.00Texas A&M University Corpus Christi 0.83University of Houston 0.66Texas A&M Galveston 0.62Texas State University San Marcos 0.55UT Dallas 0.25Sam Houston State University 0.21Lamar University 0.11UT Arlington 0.11Sul Russ University 0.08Stephen F. Austin State University -0.53University of North Texas -0.82Tarleton State University -0.93Texas A&M University Kingsville -1.67West Texas A&M University -2.08UH Downtown -2.10Texas A&M University Commerce -2.12Angelo State University -2.29UT Permian Basin -2.36Texas Woman’s University -2.57Texas Tech University -3.16Prairie View A&M University -3.73Midwestern State University -4.13Texas Southern University -5.94Texas A&M University Texarkana NAUH Clear Lake NAUH Victoria NAUT Brownsville NA
Figure 1. Z-Score Distribution

Table 5. Institution’s Z-Scores by Carnegie Classification TypeTYPE — CARNEGIE 2004 INSTITUTION TOTAL Z-SCORE
BAC/DIVERSE TEXAS A&M GALVESTON 0.62BAC/DIVERSE UH DOWNTOWN -2.1
MASTER’S MEDIUM TEXAS A&M INTERNATIONAL UNIVERSITY 6.17MASTER’S MEDIUM ANGELO STATE UNIVERSITY -2.29MASTER’S MEDIUM UT PERMIAN BASIN -2.36MASTER’S MEDIUM MIDWESTERN STATE UNIVERSITY -4.13MASTER’S MEDIUM TEXAS SOUTHERN UNIVERSITY -5.94MASTER’S MEDIUM TEXAS A&M UNIVERSITY TEXARKANA NAMASTER’S MEDIUM UT BROWNSVILLE NA
MASTER’S LARGE UT PAN AM 5.54MASTER’S LARGE UT TYLER 1.27MASTER’S LARGE UT SAN ANTONIO 1.00MASTER’S LARGE TEXAS A&M UNIVERSITY CORPUS CHRISTI 0.83MASTER’S LARGE TEXAS STATE UNIVERSITY SAN MARCOS 0.55MASTER’S LARGE SAM HOUSTON STATE UNIVERSITY 0.21MASTER’S LARGE LAMAR UNIVERSITY 0.11MASTER’S LARGE SUL ROSS UNIVERSITY 0.08MASTER’S LARGE STEPHEN F. AUSTIN STATE UNIVERSITY -0.53MASTER’S LARGE TARLETON STATE UNIVERSITY -0.93MASTER’S LARGE WEST TEXAS A&M UNIVERSITY -2.08MASTER’S LARGE PRAIRIE VIEW A&M UNIVERSITY -3.73MASTER’S LARGE UH CLEAR LAKE NAMASTER’S LARGE UH VICTORIA NA
RESEARCH HIGH UT EL PASO 2.61RESEARCH HIGH UNIVERSITY OF HOUSTON 0.66RESEARCH HIGH UT DALLAS 0.25RESEARCH HIGH UT ARLINGTON 0.11RESEARCH HIGH UNIVERSITY OF NORTH TEXAS -0.82RESEARCH HIGH TEXAS TECH UNIVERSITY -3.16
DOCTORAL RESEARCH TEXAS A&M UNIVERSITY KINGSVILLE -1.67DOCTORAL RESEARCH TEXAS A&M UNIVERSITY COMMERCE -2.12DOCTORAL RESEARCH TEXAS WOMAN’S UNIVERSITY -2.57
RESEARCH VERY HIGH TEXAS A&M UNIVERSITY 2.93RESEARCH VERY HIGH UT AUSTIN 1.55
Table 6. Latino 6-Year Graduation Rates by Institution TypeN MEAN STD. DEVIATION MINIMUM MAXIMUM
BAC/DIVERSE 2 .32 .254 .14 .50MASTERS MEDIUM 7 .36 .053 .30 .44MASTER’S LARGE 14 .44 .153 .26 .86DOCTORAL/RESEARCH UNIVERSITY 3 .39 .051 .33 .43RESEARCH HIGH 6 .47 .081 .31 .53RESEARCH VERY HIGH 2 .76 .056 .72 .80TOTAL 30 .44 .150 3131 12962F=3.586; prob.=.015

exceeded a 50% 6-year graduation rate for Latinos.Table 7 demonstrates the same point this time usingthe national average 6-year graduation rate. Here,“research very high institutions” (A&M and UT)exceed the national average graduation rate by 29points. No other Texas Carnegie classificationinstitution exceeds the national graduation rate.
On the other hand, while the differences are notstatistically significant, Latino participation isinversely related to Carnegie classification types.“Baccalaureate/Diverse” and “Master’s Medium”institutions in Texas, Carnegie’s lowestclassification institutional types, for example, hadthe highest average ratios of Latino enrollment toLatinos 18-25 in their service area (ave.=.58 and.63, respectively (see Table 8)). In contrast,“research very high” had the lowest ratio of Latinoenrollment to Latinos 18-25 in the service area(ave.=.41). In short, the higher an institution islocated in the stratification system, the less is therepresentation of Latino students (and Latinofaculty).
Table 9 reports difference in means t-tests byregion for Latino 6-year graduation rates,institutional difference in 6-year graduation ratesfrom the national average, Latino enrollmentcompared to Latinos 18-25 in service area, andinstructional costs per student enrolled.Unfortunately, all institutions of higher education inTexas south of an imaginary line from El Pasothrough San Antonio and Houston collectively werestatistically different and performed lower thantheir northern counterparts in all areas exceptLatino graduation rates and instructional costs (seeTable 9). For example, in the difference in overallgraduation rates from the national average, SouthTexas institutions were, on average, 15 percentagepoints below the national average, while NorthTexas institutions were 1% over the average (notmuch to boast about here). In terms of Latinoenrollment compared to service area (Latinos 18-25), South Texas institutions had an average ratioof .64 and North Texas institutions an average of.46. Finally, only in instructional costs did SouthTexas institutions exceed North Texas institutionsin average ($5,536 v. $5,121).13
Table 7. Diff. Average 6-Year National Grad Rate Minus Instit. Grad Rate (.52)N MEAN STD. DEVIATION MINIMUM MAXIMUM
BAC/DIVERSE 2 -.16 .27 -.35 .03MASTERS MEDIUM 7 -.14 .12 -.35 -.05MASTER’S LARGE 14 -.08 .14 -.32 .20DOCTORAL/RESEARCH UNIVERSITY 3 -.11 .08 -.019 -.04RESEARCH HIGH 6 .00 .12 -.20 .13RESEARCH VERY HIGH 2 .29 .02 .27 .30TOTAL 30 -.06 .16 -.35 .30F=3.521; prob.=.016
Table 8. Ratio Latino Enrollment to Latinos 18-25 in Service Area (County)N MEAN STD. DEVIATION MINIMUM MAXIMUM
Bac/Diverse 2 0.58 0.29 0.37 0.78Masters Medium 7 0.63 0.30 0.10 0.94Master’s Large 14 0.57 0.26 0.17 0.97Doctoral/Research University 3 0.55 0.32 0.26 0.89Research High 6 0.41 0.23 0.23 0.87Research Very High 2 0.29 0.07 0.24 0.34Total 34 0.54 0.27 0.10 0.97F=.826; prob.=.542
13

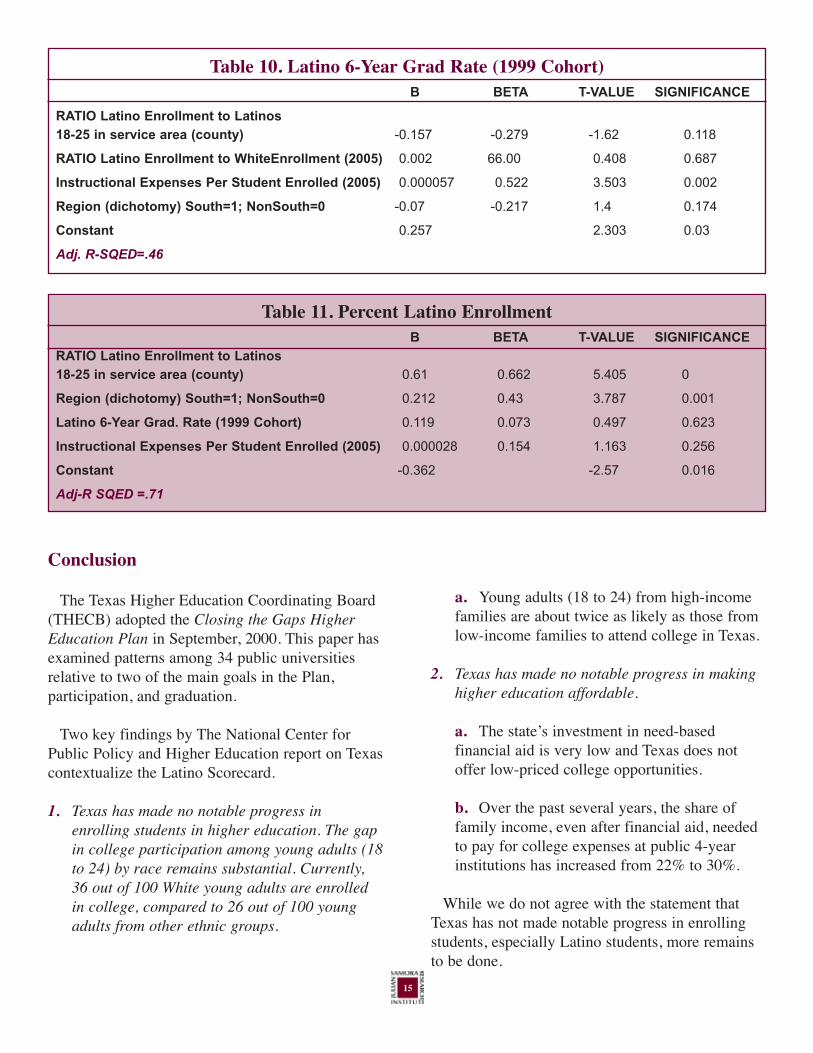
Two ordinary least squares linear regressionequations were conducted using Latino 6-yeargraduation rates and percent Latino enrollment asdependent variables. In the first model, Latino 6-year graduation rates, 46% of the variation in thesegraduation rates can be explained (see Table 10).Of four variables examined, only instructional costis statistically significant. In this model, if all theother variables were one (ratio of Latino enrollmentto service area was perfect, the ratio of Latinoenrollment to white enrollment was equal, we werelooking at south Texas institutions of highereducation and institutional per capita instructionalcost was $10,000, the predicted institutional Latino6-year graduation would be 60%. With theexception of instructional costs, the above scenarioapproximates many South Texas institutions ofhigher education.
Similarly, when examining percent Latinoenrollment, two variables — ratio of Latinoenrollment to Latinos 18-25 in service area andregion (south= 1) are statistically significant inexplaining 71% of the variance in percent Latinoenrollments (see Table 11). Here, if the ratio of thepercent of Latinos enrolled is equal to the numberof Latinos 18-25 in service (1.0), the averageLatino 6-year graduation rate is assigned thenational 6-year graduation rate of 52%, the regionis North Texas, and the institutional instructionalcosts are the state average ($5,403), and theaverage the predicted Latino enrollment is 46%.Under the same scenario but this time with SouthTexas institutions of higher education in the model,the predicted Latino enrollment rate increases by22% to 67%.
14
Table 9. T-Tests by RegionN MEAN STD. DEVIATION MINIMUM MAXIMUM
LATBAC + AT SAME/OTHER INSTITUTION (1999 COHORT)
NORTH 18 0.48 0.16 0.26 0.86SOUTH 12 0.38 0.11 0.14 0.53Total 30 0.44 0.15 0.14 0.86
N/S
DIFF AVE 6-YR NATIONAL GRAD RATE MINUS INSTIT GRAD RATE (.52)
NORTH 18 0.01 0.16 -0.32 0.30SOUTH 12 -0.15 0.12 -0.35 0.03TOTAL 30 -0.06 0.16 -0.35 0.30
Prob=.007
RATIO LATINO ENROLLMENT TO LATINOS 18-25 IN SERVICE AREA (COUNTY)
NORTH 19 0.46 0.23 0.17 0.97SOUTH 15 0.64 0.28 0.10 0.94TOTAL 34 0.54 0.27 0.10 0.97
Prob.=.04
INSTRUCTIONAL EXPENSES 2005 PER STUDENT ENROLL SOURCES AND USESNORTH 19 $5121.32 1636.78 3131.00 9477.00SOUTH 15 $5535.93 2169.58 3365.00 12962.00TOTAL 34 $5304.24 1871.34 3131.00 12962.00
N/S
PCTLATENROLL
NORTH 19 0.11 0.07 0.03 0.34SOUTH 15 0.43 0.30 0.05 0.89TOTAL 34 0.25 0.26 0.03 0.89
Prob.=.000
Conclusion
The Texas Higher Education Coordinating Board(THECB) adopted the Closing the Gaps HigherEducation Plan in September, 2000. This paper hasexamined patterns among 34 public universitiesrelative to two of the main goals in the Plan,participation, and graduation.
Two key findings by The National Center forPublic Policy and Higher Education report on Texascontextualize the Latino Scorecard.
1. Texas has made no notable progress inenrolling students in higher education. The gapin college participation among young adults (18to 24) by race remains substantial. Currently,36 out of 100 White young adults are enrolledin college, compared to 26 out of 100 youngadults from other ethnic groups.
a. Young adults (18 to 24) from high-incomefamilies are about twice as likely as those fromlow-income families to attend college in Texas.
2. Texas has made no notable progress in makinghigher education affordable.
a. The state’s investment in need-basedfinancial aid is very low and Texas does notoffer low-priced college opportunities.
b. Over the past several years, the share offamily income, even after financial aid, neededto pay for college expenses at public 4-yearinstitutions has increased from 22% to 30%.
While we do not agree with the statement thatTexas has not made notable progress in enrollingstudents, especially Latino students, more remainsto be done.
15
Table 10. Latino 6-Year Grad Rate (1999 Cohort)B BETA T-VALUE SIGNIFICANCE
RATIO Latino Enrollment to Latinos 18-25 in service area (county) -0.157 -0.279 -1.62 0.118
RATIO Latino Enrollment to WhiteEnrollment (2005) 0.002 66.00 0.408 0.687
Instructional Expenses Per Student Enrolled (2005) 0.000057 0.522 3.503 0.002
Region (dichotomy) South=1; NonSouth=0 -0.07 -0.217 1.4 0.174
Constant 0.257 2.303 0.03
Adj. R-SQED=.46
Table 11. Percent Latino EnrollmentB BETA T-VALUE SIGNIFICANCE
RATIO Latino Enrollment to Latinos18-25 in service area (county) 0.61 0.662 5.405 0
Region (dichotomy) South=1; NonSouth=0 0.212 0.43 3.787 0.001
Latino 6-Year Grad. Rate (1999 Cohort) 0.119 0.073 0.497 0.623
Instructional Expenses Per Student Enrolled (2005) 0.000028 0.154 1.163 0.256
Constant -0.362 -2.57 0.016
Adj-R SQED =.71

So who’s leading the pack in terms of Latinoenrollment and graduation rates in Texas? Theanalyses presented suggests that regional andresourced institutions are leading the way in“closing the gaps” but in very different ways. Well-resourced institutions, principally the “flagshipinstitutions,” which are the Carnegie “very highresearch” classified schools of Texas A&M and UT-Austin, are doing relatively well overall among theeight measures of the Latino scorecard in relationto all the other institutions in the state. Texas A&Mand UT do well in instructional costs ratios, Latinograduation rates and overall graduation ratesrelative to the national average. One should keep inmind, however, the “creaming” practices of theseinstitutions — given the “10%” rule14 and highadmission standards, for example, UT and A&Mtake the most talented students, and it is the mosttalented students who are most likely to besuccessful. The translation here is that if one is ayoung Latino/a, and one can get accepted(academically) into these two institutions, and canafford to attend (tuition, fee, boarding, etc.), onewill most likely do well to go to A&M or UT. Ofcourse, one will not see many Latinos relative tothe number of White students, certainly not like atA&M (Laredo), and one will not see many Latinofaculty members relative to White faculty, but onewill do well academically.
On the other hand, higher education institutionslike UT-Pan Am, UT-Laredo, UT-El Paso, UT-Tyler, and UT-San Antonio are above averageamong Latino scorecard indicators. Here, largeLatino enrollments, large ratios of Latino to Whitefaculty and, in some cases, high instructional costsper capita offset low 6-year Latino graduation ratesand low overall graduation rates.
But analysis of variance and the regressionanalyses also indicate that the heavy lifting ofLatino enrollment is coming principally from SouthTexas institutions and high Latino service areas.Ultimately, two-thirds of Texas institutions ofhigher education are only average or (worse) belowaverage on addressing Latino criteria used for thisscorecard. Again, the translation here is that ifLatinos are considering entering a Texas institutionof higher education and cannot get in to Texas orA&M, they should choose carefully relative tograduation rates, instructional costs, affordability,diversity, and access. Their experiences andprobability for success will most certainly beimpacted by these factors.
For Texas to make significant gains in the highereducation of Latinos, it will have to address theinequities in instructional costs across institutions,especially those located in South Texas, and expandopportunities for higher education at the highestlevels in South Texas given that Latinos are proneto stay close to their communities in the pursuit ofhigher education degrees. Finally, Texas must findways by which to promote greater engagement ofpredominantly white institutions in the education ofLatinos, including their transformation into diverseorganizations. This will be especially important asthe Latino population outside of South Texascontinues to grow.
16

Endnotes
1 These figures are based on enrollments atpublic colleges and universities only. TheTHECB uses figures that include independentinstitutions, which are different. The Board,however, initially required only the publicinstitutions to set targets for each of the Plan’sgoals. In 2002, it required independentinstitutions receiving Tuition EqualizationGrants to begin reporting enrollments.
2 Although there are 35 state public universitiesour scorecard is based on data for 34 of themdue to the difficulty in obtaining all the relevantfigures for one of them.
3 The Pew Hispanic Center estimates the percentchange to be 20.7% using the figures of6,530,459 for the year 2000 and 7,882,254 for2005. Thus, we have chosen to use the moreconservative estimate to capture the changes inpopulation.
4 The Participation Forecast report used the StateDemographer’s projection figures from 2004which were based on a cohort-componenttechnique that assumed that migration rateswould be the same as those for the 2000 to2003 period.
5 These figures are from a Special Reportproduced on Sept. 26, 2006 by THECB for oneof the authors. They differ slightly from thosereported in the 2006 Progress Report by theTHECB.
6 See THECB, Participation Forecast, 2005.
7 Based on a Special Report produced on Sept.26, 2006 by THECB. These figures are slightlydifferent from those presented in the July 2006Progress Report.
8 The 35th is not included due to insufficientavailable data.
9 These graduation rates include a combination ofthe percent of First Time EnteringUndergraduates in the Fall 1999 — both Whiteand Latino students — who received at least abaccalaureate at the same institution or atanother institution.
10 We recognize that this broad inclusion of allfaculty categories hides structured inequalitiesevident when examining tenure-track ranks.
11 Note that because the median income figuresused were from 2000, this ratio is quite likely tobe greater than the actual ratio in 2005 were themedian income figures readily available for2005.
12 This figure seems unusually high and mayreflect the sum of instructional costs at UT-Brownsville (an upper division institution) andTexas Southmost College (a 2-year institution).This figure, however, is what is reported inofficial reports found at the THECB website.
13 Readers should keep in mind the upwardinfluence of UT-Brownsville. If the figure forBrownsville is inaccurate, then we can expectthis figure to go down substantially.
14 Under the “10%” rule, UT-Austin, for example,accepts all high school students in the State ofTexas for admission regardless of theapplicant’s race or ethnicity.
17

References
Astin, Alexander W. 1993. What Matters inCollege? — Four Critical Years Revisited. SanFrancisco: Josey-Bass Publishers.
Carey, Kevin. 2004. “A Matter of Degrees:Improving Graduation Rates in Four-yearColleges and Universities.” Education Trust,Washington, D.C. Available online:http://www.edtrust.org.
Crissey, Michael. 1997. “Changes in AnnualCollege Guides Fail to Quell Criticisms onTheir Validity.” Chronicle of Higher Education(Sept. 5). Available online:http://chronicle.com/free/v44/i02/02a06701.htm
Duffy, Brian and Peter Cary. 1999. “Dissension InThe Rankings — U.S. NEWS Responds ToSlate‘s “Best Colleges” Story.” Availableonline: http://slate.msn.com/id/34278/.
Gottlieb, Bruce. 1999. “Cooking the School Books:How US News cheats in picking its bestAmerican colleges. Slate. Available online:http://slate.msn.com/id/334027/.
National Center for Education Statistics. 2006.“Enrollment in Postsecondary Institutions, Fall2004: Graduation rates, 1998 & 2001 Cohorts;and Financial Statistics, Fiscal Year, 2004.”U.S. Department of Education. Institute ofEducation Sciences. NCES 2006-155.
National Center for Public Policy and HigherEducation. 2006. “Measuring Up 2006 — TheState Report Card on Higher Education, Texas.”San Jose, Calif. www.highereducation.org
Planning and Accountability Educational DataCenter. 2006. “Baccalaureate Graduation Rates- First Time Entering Undergraduates, Fall1999.” Available online:www.thecb.state.tx.us/reports/pdf/1248.pdf
Reed, Rodney J. 1986. “Faculty Diversity: Aneducational and moral imperative in search ofinstitutional commitment.” Journal ofEducational Equity and Leadership. 6(4): 274-294.
Selingo, Jefferey. 1997. “A Self-Published GuideGoes Big-Time, and Educators Cry Foul.”Chronicle of Higher Education (Nov. 7).Available online:http://chronicle.com/free/v44/i11/11a00101.htm
Sharp, William. 1995. “Building Reputations: howthe game is played.” Available online:www.columbia.edu/cu/21stC/issue-1.1/vying.htm
Stoops, Nicole. 2004. “Educational Attainment inthe United States: 2003” U.S. Census Bureau,Washington, D.C.
Texas Higher Education Coordinating Board. 2005.Participation Forecast, 2005-2015. TexasInstitutions of Higher Education. Austin, TX:THECB.
Texas Higher Education Coordinating Board. 2006.“Ethnic Enrollments, Statewide Comparisons.”Excel Workbook provided to authors. Austin,TX: THECB
Texas Higher Education Coordinating Board.2006a. “Closing the Gaps by 2015: 2006Progress Report.” Austin, TX: THECB
Texas Higher Education Coordinating Board.2006b. “Universities and Health-relatedInstitutions — Sources and Uses of Funds.”Austin, Texas: THECB.
Texas Higher Education Coordinating Board.2006c. Higher Education AccountabilitySystem. Data obtained using the THECBdatabase. Available online:www.txhighereddata.org/Interactive/Accountability/Matrix2.cfm
18