by anthony m. santomero 96-16d1c25a6gwz7q5e.cloudfront.net/papers/236.pdf · anthony m. santomero...
TRANSCRIPT
FinancialInstitutionsCenter
Risk Management by Insurers:An Analysis of the Process
byDavid F. BabbelAnthony M. Santomero
96-16

THE WHARTON FINANCIAL INSTITUTIONS CENTER
The Wharton Financial Institutions Center provides a multi-disciplinary research approach tothe problems and opportunities facing the financial services industry in its search forcompetitive excellence. The Center's research focuses on the issues related to managing riskat the firm level as well as ways to improve productivity and performance.
The Center fosters the development of a community of faculty, visiting scholars and Ph.D.candidates whose research interests complement and support the mission of the Center. TheCenter works closely with industry executives and practitioners to ensure that its research isinformed by the operating realities and competitive demands facing industry participants asthey pursue competitive excellence.
Copies of the working papers summarized here are available from the Center. If you wouldlike to learn more about the Center or become a member of our research community, pleaselet us know of your interest.
Anthony M. SantomeroDirector
The Working Paper Series is made possible by a generousgrant from the Alfred P. Sloan Foundation

David F. Babbel is Associate Professor of Insurance and Finance at the Wharton School of the University ofPennsylvania. Anthony M. Santomero is the Richard K. Mellon Professor of Finance at the Wharton School of theUniversity of Pennsylvania.
Risk Management by Insurers:An Analysis of the Process 1
May 1996
Abstract : Through the past year, on-site visits to financial service firms were conducted bya team of researchers from the Wharton Financial Institutions Center to review andevaluate their risk management systems. In the insurance sector, this evaluation covered anumber of prominent life/health and property/casualty insurers, both in the U.S. andabroad. The information obtained on the philosophy and practice of financial riskmanagement comes primarily through intensive interviews and analysis of the reports andprocedures that are in place at these insurance firms. The purpose of this paper is tooutline the results of this investigation. It reports the state of risk management techniquesin the industry, questions asked, questions answered and questions left unaddressed byrespondents. It reports the standard of practice and evaluates how and why it is conductedin the particular way chosen.
But, even the best practice employed within the industry is not good enough in some areas. Accordingly, critiques are offered where appropriate. The paper concludes with a list ofquestions that are currently unanswered, or answered rather unsatisfactorily in the currentpractice employed by this group of relatively sophisticated insurers.
Here, we discuss the problems which the industry finds most difficult to address,shortcomings of the current methodology used to analyze risk, and the elements that aremissing in the current procedures of risk management.
1
I. Introduction
The past decade has seen a dramatic rise in the number of insolvent insurers. Theostensible causes of these insolvencies were myriad. Some of the insolvencies were precipitatedby rapidly rising or declining interest rates. Others resulted from losses on assets such as junkbonds, commercial mortgages, CMOs, real estate and derivatives. Mispricing of insurancepolicies, natural catastrophes, and changes in legal interpretations of liability and the limits ofcoverage hurt still others. The “churning” of policies by unscrupulous sales agents, insolvenciesamong the reinsurers backing the policies issued, noncompliance with insurance regulation, andmalfeasance on the part of officers and directors of the insurance companies affected some aswell. But despite the numerous and disparate apparent causes of these insolvencies, theunderlying factor in all of them was the same: inadequate risk management practices. Inresponse to this, insurers almost universally have embarked upon an upgrading of their financialrisk management and control systems to reduce their exposure to risk and better manage theamount they accept. In short, the industry has turned to financial risk management techniques asa way to improve performance.
Coincidental to this activity, and, in part, because of our recognition of the industry’svulnerability to financial risk, the Wharton Financial Institutions Center, with the support of theSloan Foundation, has been involved in an analysis of financial risk management processes inthe financial sector. Through the past academic year, on-site visits were conducted to reviewand evaluate the risk management systems and the process of risk evaluation that is in place.
In the insurance sector, system evaluation was conducted covering a number ofprominent life/health and property/casualty insurers, both in the U.S. and abroad. The in-formation obtained on the philosophy and practice of financial risk management comes primarilythrough intensive interviews of these insurance firms, conducted by a team of researchers fromthe Wharton Financial Institutions Center.1 Measured in terms of admitted assets, these firmsrange in size from $7 billion to well over $100 billion. They are organized as stock, reciprocal,or mutual insurers. Some firms restrict their activities to life insurance and pensions; the othersare multi-line insurers, selling the full range of property/casualty and life/health products. Thesevisits were augmented by interviews conducted with additional large insurance firms domiciledin Japan and Europe as well as North America. As was the case above, these firms include lifecompanies, property/casualty companies, and a multi-line company.
Our information was then supplemented by five recently published surveys. Three ofthese were the 1994, 1995, and 1996 “Insurer CIO Surveys,” conducted by Goldman, Sachs &Co.2 These surveys were based on responses from 58-79 companies, depending on the survey,with approximately two-thirds from the life lines and one-third from the property/casualty lines.The response rate in these surveys was roughly 40%. Over 90% of the responding companieshad assets in excess of $1 billion. Another pair of surveys was conducted by Joan Lamm-Tennant.3 Her surveys were of a much more extensive set of insurers, ranging in assets from $75million to over $100 billion. There were 119 and 144 respondents to her 1995 and 1996surveys, respectively, representing a response rate between 11 and 20% of the firms surveyed.The business mix of these firms was split about equally between life/health andproperty/casualty insurance.

2
The purpose of this paper is to outline the results of this investigation. It reports the stateof risk management techniques in the industry — questions asked, questions answered andquestions left unaddressed by respondents. This report cannot recite a litany of the approachesused within the industry, nor can it offer an evaluation of each and every approach. Rather, itreports the standard of practice and evaluates how and why it is conducted in the particular waychosen. But even the best practice employed within the industry is not good enough in someareas. Accordingly, critiques will also be offered where appropriate. The paper concludes witha list of questions that are currently unanswered, or answered rather unsatisfactorily in thecurrent practice employed by this group of relatively sophisticated insurers. Here, we discussthe problems which the industry finds most difficult to address, shortcomings of the currentmethodology used to analyze risk, and the elements that are missing in the current procedures ofrisk management.
II. Why Manage Risk — Some Generic Answers
It seems appropriate to begin our analysis of risk management techniques with a reviewof the reasons given for firm level concern over the volatility of financial performance. Thefinance literature on why firms manage risk at all is usually traced back to 1984. In that yearStulz [1984] first suggested a viable reason for objective function concavity, and his contributionis widely cited as the starting point of this burgeoning literature. Doherty [1985] provides thefirst comprehensive treatment of this topic in a finance framework. Since that time a number ofalternative theories and explanations have been offered. Recently, Santamero [1995A] presenteda useful review of these explanations upon which we shall draw here.
The goal, as noted above, is to offer viable economic reasons for firm managers, who arepresumed to be working on behalf of firm owners, to concern themselves with both expectedprofit and the distribution of firm returns around their expected value. The rationales for riskaversion can usefully be segmented into four categories:
a) Managerial Self Interestb) The Non-Linearity of Taxesc) The Cost of Financial Distressd) The Existence of Capital Market Imperfections
In each case, the economic decision maker is shown to face a non-linear optimization because ofthe reason offered, and this leads the decision maker to be concerned with the variability ofreturns. In the first case the objective function itself is concave, while in the others the effect ofsome feature of the economic environment is to lead firm managers to behave in a risk aversemanner. We begin with an explanation of each theory.
A. Managerial Self Interest
As mentioned above, this rationale is generally attributed to the work of Stulz [1984].There, it was argued that firm managers have limited ability to diversify their own personalwealth position, associated with stock holdings and the capitalization of their career earningsassociated with their own employment position. Therefore, they prefer stability to volatility

3
because, other things equal, such stability improves their own utility, at little or no expense toother stakeholders. In truth, this argument can be traced back to the literature on the theory ofagency. In this area, the relationship between firm performance and managerial remuneration isclearly developed in such works as Ross [1973] and Ross [1977].
Objections have been offered, however, to this line of reasoning. Some find the theoryunconvincing, because it offers no reason for the manager to hedge his/her risk within the firm,rather than directly in the market. According to this view, managers with highly non-linearemployment contracts could enter the financial market to offset the effect of such agencyagreements on their own wealth position. By taking a short position in the firm’s stock, thestocks of competitors, or the market, managers could obtain any level of concentration in firm-specific profitability.
However, this argument misses at least three important features of the employmentrelationship. First, it is illegal for senior management to take a short position in the firm’s stockand problematic for them to be seen divesting themselves or systematically diversifying theinvestments that are correlated with firm performance. Yet, such a public divestiture would berequired to properly hedge management’s personal investment profile. Moreover, in the case ofmutual insurers, it is even more difficult to offset a long position in firm-specific performancerisk. Second, to the extent that some outcomes, defined as financial distress, lead to terminationof the contract, it may be in the best interest of managers to constrain firm-level outcome, if onlynot to lose the future value of the employment earnings. More will be said about this underSection C below. Third, arguments in favor of expected value managerial decisions neglect thefact that managerial ability itself is not directly observable. Therefore, as Breeden andViswanathan [1990] and DeMarzo and Duffie [1992] argue, observed outcomes may influenceowner perception of managerial talent. This would, in turn, favor reduced volatility, or at leastthe protection of firm specific market value from large negative outcomes that may be foundwithin the distribution of possible returns. For all, or any one of these reasons, therefore, thereappears to be ample justification for the assumption that managers will behave in a mannerconsistent with a concave objective function.
B. The Non-Linearity of Taxes
Beyond managerial motives, firm level performance and market value may be directlyassociated with volatility for a number of other reasons. The first is the nature of the tax code,which both historically and internationally is highly non-linear. This point was brought to ourattention by Smith and Stulz [1985] and Gennotte and Pyle [1991]. It has recently beenemphasized in Smith and Smithson [1990] and Fite and Pfleiderer [1995] as a key rationale ofrisk reduction. In each case, the authors indicate that, with a non-proportional tax structure,income smoothing reduces the effective tax rate and, therefore, the tax burden shouldered by thefirm. By reducing the effective long term average tax rate, activities which reduce the volatilityin reported earnings will enhance shareholder value.
However, two points are worth mentioning in this context. First, with the advent of moreproportional tax schedules, particularly in the U.S., the arguments here are somewhat mitigated.In fact, one should observe, ceteris paribus, a decline in the interest in risk management byAmerican firms over the last decade because of the reduced progressivity of U.S. tax schedules.
4
No one, however, has suggested that such is the case. Second, the tax argument rests onreported income, not true economic profit. To the extent that accounting principles permit taxplanning, this argument may favor tax motivated reporting, and more careful management of thedifference between book and market value of profits. For example, in the financial sector thereis a long literature on tax planning that speaks to this distinction between reported and operatingprofit. Greenawalt and Sinkey [1988] document the existence of substantial income smoothingthrough the use of the loan loss provision expense item, while Scholes, Wilson and Wolfson[1990] present evidence of portfolio selection which accomplishes the same end. However, theargument here is that real economic decisions are affected by the tax code, not just theirreporting. To the extent that significant discretion exists in tax reporting, tax consideration maynot motivate actual decision making nearly as much as this theory suggests. Evidence on thesepoints for the insurance industry is provided by Cummins and Grace [1994] and Lamm-Tennantand Rollins [1994].
C. The Cost of Financial Distress
Firms may also be concerned about volatility of earnings because of the consequences ofseverely negative deviations from expected value and their implications for corporate viability.It is known that corporate debt creates a fixed cost that can be used as a competitive weapon ingaming models. (See Brander and Lewis [1986] and Maksimovic [1988], for example.) In suchmodels, severely negative outcomes cause disruption and bankruptcy. To the extent that thebankruptcy state — or any set of specific states — is associated with a discrete increase in costs,the firm will be forced to recognize this fact in its choice calculus. In such cases, the firmbehaves as if it had a concave objective function, because its payoff structure is non-linear acrossstates.
The literature is filled with such stories. The classic paper by Warner [1977] was thefirst to present empirical evidence of this cost, but more recent studies, such as Weiss [1990]continue to reinforce its importance. As a result, standard corporate finance textbooks makeclear reference to the cost of bankruptcy in their analysis of the investment decision. Smith andStulz [1985] use this same argument to justify a desire for reduced volatility.
The cost is, perhaps, more important in regulated industries, however. In these cases,large losses may be associated with license or charter withdrawal and the loss of a monopolyposition. For example, in the banking literature, Marcus [1984] makes this same argument forfinancial firms subject to charter review by regulatory agencies, and Santomero [1989B] andHerring and Santomero [1990] used this story to justify corporate separation for financialservices firms. Staking and Babbel [1995] provide empirical support for its application to theinsurance industry. In all cases, however, the cost of financial distress must be non-linear, aslinear cost functions do not lead to the required behavior.
Yet, the authors are on firm ground here, as there is ample evidence that financial distressleads to substantially increased costs associated with bankruptcy proceedings, legal costs, andperhaps most importantly the diversion of management attention from creating real economicvalue. Interested readers are referred to Smith, Smithson and Wilford [1990] for an extendeddiscussion of these costs.

5
D. Capital Market Imperfections
Recently the above argument has been extended in the work of Froot, Scharfstein andStein [1993, 1994]. The theoretical core of their contribution is in the 1993 paper. Here, theyaccept the basic paradigm of the financial distress model above, but rationalize the cost of badoutcomes by reference to Myers’ [1977] debt overhang argument. In their model, externalfinancing is more costly than internally generated funds due to any number of capital marketimperfections. These may include discrete transaction costs to obtain external financing,imperfect information as to the riskiness of the investment opportunities present in the firm, orthe high cost of the potential future bankruptcy state. In the case of mutual insurers, who havelittle access to the capital market, this line of argument is particularly compelling.
At the same time, the firm has an investment opportunity set which can be ordered interms of net present value. The existence of the cost imperfections results in underinvestment insome states, where internally generated funds fall short of the amount of new investment thatwould be profitable in the absence of these capital market imperfections. Stated another way,the volatility of profitability causes the firm to seek external finance to exploit investmentopportunities when profits are low. The cost of such external finance is higher than the internalfunds due to the market’s higher cost structure associated with the factors enumerated above.This, in turn, reduces optimal investment in low profit states.
The cost of volatility in such a model is the forgone investment in each period that thefirm is forced to seek external funds. Recognizing this outcome, the firm embarks uponvolatility reducing strategies, which have the effect of reducing the variability of earnings.Hence, risk management is optimal in that it allows the firm to obtain the highest expectedshareholder value.
The authors can support their theory with reference to evidence offered by Fazzari,Hubbard and Peterson [1988] and Hoshi, Kashyap and Scharfstein [1991], who present evidencethat internal cash flow is, in fact, correlated to corporate investment. In addition, Smith,Smithson and Wilford [1990] regale us with anecdotes that further support this contention.
E. Summary of Rationales
Together, the stories work fairly well. Firm managers are interested both in expectedprofitability and the risk, or variability, or reported earnings or market value. The latter can berationalized by the existence of non-linear costs across the range of profit states associated withany given expected value. The non-linearity is associated with managerial incentive effects, thetax structure, the costs of crisis, and/or forgone investment opportunities. In any or all of thesecases, the firm is led to treat the variability of earnings as a choice variable that it selects, subjectto the usual constraints of optimization. How it proceeds to manage the risk position of itsactivity is the area to which we now turn.
III. Risk as a Central Ingredient in the Industry’s Franchise
A. The Role of Insurers in the Financial Sector

6
Insurers are in the risk business. In the process of providing insurance and otherfinancial services, they assume various kinds of actuarial and financial risks. Over the lastdecade much has been written of the role of insurers within the financial sector.4 This literaturewill not be reviewed in detail here. Suffice it to say that market participants seek the services ofinsurers because of their ability to provide actuarial risk pooling through their major productlines of life, property/casualty and health insurance, pension products, annuities, and otherfinancial instruments. At the same time, they are major providers of funds to the capital market— particularly to the fixed income sectors. In performing these roles they generally act as aprincipal in the transaction. As such, they use their own balance sheet to facilitate thetransactions and to absorb the risks associated with them. Therefore, it is here that thediscussion of risk management and the necessary procedures for risk control has centered.Accordingly, it is in this area that our review of risk management procedures will concentrate.
B. What Risks Are Being Managed?
The risks contained in the insurer’s product sales, i.e., those embedded in the productsoffered to customers to protect against actuarial risk, are not all borne directly by the insureritself. In many instances the institution will eliminate or mitigate the actuarial and financial riskassociated with a transaction by proper business practices; in others it will shift the risk to otherparties through a combination of reinsurance, pricing and product design. Only those risks thatare not eliminated or transferred to others are left to be managed by the firm for its own account.This is the case because the insurance industry recognizes that it should not engage in business ina manner that unnecessarily imposes risk upon it, nor should it absorb risks that can beefficiently transferred to other participants. Rather, it should only manage risks at the firm levelthat are more efficiently managed there than by the market itself or their owners in their ownportfolios. In short, it should accept only those risks that are uniquely a part of the insurer’sarray of services.
Elsewhere it has been argued that risks facing all financial institutions can be segmentedinto three separable types from a management perspective.5 These are:
a) risks that can be eliminated or avoided by standard business practices;b) risks that can be transferred to other participants, andc) risks that must be actively managed at the firm level.
In the first of these cases, the practice of risk avoidance involves actions to reduce thechances of idiosyncratic losses from standard insurance activity by eliminating risks that aresuperfluous to the institution’s business purpose. Common risk avoidance practices include atleast three types of actions. The standardization of process, insurance policies, contracts andprocedures to prevent inefficient or incorrect financial decisions is the first of these. Another isthe construction of portfolios on both sides of the balance sheet that benefit from diversificationand the application of the Law of Large Numbers and Central Limit Theorem, which reduce theeffects of any one loss experience. Finally, the implementation of incentive compatiblecontracts with the institution’s management to require that employees be held accountable is thethird. In each case, the goal is to rid the firm of risks that are not essential to the financialservice provided, or to absorb only an optimal quantity of a particular kind of risk.

7
There are also some risks that can be eliminated, or at least substantially reduced throughthe technique of risk transfer. Markets exist for many of the risks borne by the insurance firm.Actuarial risk can be transferred to reinsurers. Catastrophe risk can be offset somewhat byundertaking a position in catastrophe futures and perhaps even in catastrophe bonds. Interestrate risk can be hedged or transferred through interest rate products such as swaps, caps, floors,futures, or other derivative products. Insurance policies and lending documents can be altered toeffect a change in their duration and convexity. Equity market risk can be reduced with anappropriate futures position in equities. In addition, they can offer products which absorb somefinancial risks, while transferring some of these risks to the purchaser. Defined contributionpension plans and variable universal life policies are clear examples of this approach. Finally,the insurer can buy or sell financial claims and reinsurance to diversify or concentrate the riskthat results from servicing its client base. To the extent that the actuarial and financial risks ofthe insurance policies underwritten by the firm are understood by the market, they can be sold inpart or in whole at their fair value. Unless the institution has a comparative advantage inmanaging the attendant risk and/or a desire for the embedded risk they contain, there is noreason for the insurer to absorb such risks, rather than transfer them.
However, there are two classes of activities where the risk inherent in the activity mustand should be absorbed at the insurance firm level. In these cases, risk management must beaggressive and good reasons exist for using firm resources to manage insurance-level risk. Thefirst of these includes actuarial exposures where the nature of the embedded risk may becomplex and difficult to communicate and transfer to third parties. For example, ProgressiveInsurance Co. has a definite niche in the high risk auto insurance business owing to itsconcentration of underwriting activities, and Lutheran Brotherhood has a natural advantage forwriting life insurance to its clientele. A similar situation may arise on the asset side of thebusiness where the insurer holds private placements and other complex, proprietary assets thathave thin, or even non-existent, secondary markets. Communication in such cases may be moredifficult or expensive than hedging the underlying risk. Moreover, revealing information aboutthe customer may give competitors an undue advantage. The second case includes risk positionsthat are central to the insurer’s business purpose and are absorbed because they are the raisond’être of the firm. Actuarial risk inherent in the key insurance lines where the insurer may enjoya competitive advantage or a market niche is a clear case in point. In all such circumstances, riskis absorbed and needs to be monitored and managed efficiently by the institution. Only then willthe firm systematically achieve its financial performance goal.
C. How Are These Risks Managed?
In light of the above, what are the necessary procedures that must be in place to carry outadequate risk management for those risks that are essential ingredients to the insurer’s franchise?What techniques are employed to both limit and manage the different types of risk, and how arethey implemented in each area of risk management? It is to these questions that we now turn.
In general, the management of an insurance firm relies on a variety of techniques in theirrisk management systems. However, it appears that common practice has evolved such that fourelements have become key steps to implementing a broad based risk management system. Theseinclude:

8
a) standards and reportsb) underwriting authority and limitsc) investment guidelines or strategies, andd) incentive contracts and compensation
These tools are established to measure risk exposure, define procedures to manage theseexposures, limit exposures to acceptable levels, and encourage decision makers to manage risk ina manner that is consistent with the firm's goals and objectives. To see these four parts of basicrisk management achieve these ends, we elaborate on each part of the process below. Section Villustrates how these techniques are applied to control each of the specific risks facing theinsurance community.
Standards and Reports
The first of these control techniques involves two different conceptual activities, i.e.,standard setting and financial reporting. They are listed together because they are the sine quanon of any risk management system. Underwriting standards, risk classification, and standardsof review are all traditional tools of risk control. Consistent evaluation and rating of exposuresof various types are essential for management to understand the risks on both sides of thebalance sheet, and the extent to which these risks must be mitigated or absorbed.
The standardization of financial reporting is the next ingredient. Obviously, outsideaudits, regulatory reports, and ratings agency evaluations are essential for investors to gaugeasset quality and firm level risk. But the types of information collected and the manner in whichit is assembled and presented in statutory accounting reports are inadequate for the purposes ofmanaging an insurance company. For instance, it is difficult to discern the magnitude andimport of options insurers have effectively written on both sides of the balance sheet, e.g., calland prepayment options and loan commitments on the asset side, lapse, loan and surrenderoptions on the liability side, by relying merely on statutory accounting reports. It is also difficultto estimate interest rate risk and default risk from the information provided there.
The statutory accounting reports have long been standardized, for better or worse.However, the need here goes beyond public reports and audited statements to the need formanagement information on actuarial risk, asset quality and overall risk posture. Such internalreports need similar standardization but much more frequent reporting intervals, with daily,weekly and monthly reports substituting for the quarterly statutory accounting periodicity. Thus,the collection and presentation of sufficient data to adequately manage the risk exposure of acompany is a starting point.
Underwriting Authority and Limits
A second technique for internal control of active management is the use of positionlimits, and/or minimum standards for participation. In terms of the latter, the domain of risktaking is restricted to only those customers or assets that pass some prespecified quality standard.Then, even for those that are eligible, limits are imposed to cover exposures to counterparties,credits, and overall position concentrations relative to various types of risks. In general, eachperson who can commit capital, whether on the asset or liability side of the ledger, will have a

9
well-defined limit. This applies to underwriters, portfolio managers, lenders, and traders.Summary reports show limits, as well as current exposure by business unit on a periodic basis.In large organizations, with thousands of positions maintained, accurate and timely reporting isdifficult, but even more essential.
Investment Guidelines or Strategies
Investment guidelines and recommended positions for the immediate future are the thirdtechnique that is commonly in use. Here, strategies are outlined in terms of concentration andcommitments to particular areas of the market, the extent of desired asset/liability mismatchingor exposure to interest rate risk, and the need to hedge against systematic risks of a particulartype. These limits lead to passive risk avoidance and/or diversification, because managersgenerally operate within position limits and prescribed rules. Beyond this, guidelines offer firmlevel advice as to the appropriate level of active management, given the state of the market andthe willingness of senior management to absorb the risks implied by the aggregate portfolio.Such guidelines extend to firm level hedging and asset/liability matching. In addition,securitization and even derivative activity are rapidly growing techniques of positionmanagement open to participants looking to reduce their exposure to be in line withmanagement’s guidelines.
Similar guidelines are required on the liability side of the balance sheet. Underwritingstandards and strategies are needed to ensure that the risks accepted conform to the parametersthat the insurer is capable and willing to accept. They also foster better pricing of products, andprevent any one underwriter from compromising the future solvency of the firm.
Incentive Schemes
To the extent that the firm can enter incentive compatible contracts with senior man-agement, line managers, and sales agents and make compensation related to the risks borne bythese individuals, then the need for elaborate and costly controls is lessened. However, suchincentive contracts must be consistent with the insurers’ financial goals and require properinternal control systems. Such tools, which include underwriting risk and loss analysis,investment risk analysis, the allocation of costs, and the setting of required returns to variousparts of the organization is not trivial. Notwithstanding the difficulty, well designed systemsalign the goals of managers with other stakeholders in a most desirable way. In fact, mostfinancial debacles can be traced to the absence of incentive compatibility. For instance, thelinkage of compensation to sales can lead to reckless and dangerous growth and poorunderwriting or mispricing of risks. The linkage of managerial compensation to book earningscan lead to the acquisition of investments with negative convexity, duration mismatch risk,liquidity risk and credit risk, whose book yields are higher than their expected returns.
IV. Risks in Providing Insurance Services
How are these techniques of risk management employed by the insurance sector? Toexplain this, we must begin by enumerating the risks which the insurance industry has chosen tomanage, and illustrate how the four step procedures outlined are applied to risk control in eacharea.
10
A. The Actuarial View of Risks
As a starting point, most of the insurers interviewed classified their risks by adapting aframework which was proposed years ago by the Society of Actuaries’ Committee on Valuationand Related Problems. Even though the Society of Actuaries is focused on life insurance andpensions, the property/casualty insurers interviewed also had adapted the same risk classificationparadigm. The various categories of risks are dubbed C-1, C-2, C-3, and C-4, deriving thesenames from the Committee assigned to make recommendations on these issues.6 We begin ourreview of the perceived risks with an explanation of the industry’s own definitions.
C-1 risks are asset risks, which arise from the possibility that borrowers of insurer fundsmay default on their obligations to the company, or that the market value of an insurer’sinvestment assets may decline. They include interest rate risk, credit risk, market risk, andcurrency risk.
C-2 risk is pricing risk, which stems from uncertainty about future operating resultsrelating to items such as investment income, mortality and morbidity, frequency and severity ofclaims and losses, administrative expenses, sales and lapses. If an insurer’s pricing is based onassumptions that prove inadequate, it may not be able to meet its obligations to policy owners.
C-3 risk is asset/liability matching risk, which springs from the impact of fluctuatinginterest and inflation rates on the values of assets and liabilities. If the impact of fluctuatingrates is different on assets than on liabilities, the values of assets and liabilities will change bydifferent amounts, and could expose the insurer to insolvency.
C-4 risks are miscellaneous risks, generally thought to be beyond the ability of insurersto predict and manage, but they nevertheless represent real risk to the company. These risksinclude tax and regulatory changes, product obsolescence, poor training of employees and salesagents, and malfeasance, malversation, or misconduct of managers or other employees. Alsoincluded is the risk that laws or legal interpretations will change in a way that will alter thefirm’s obligations ex post. Another manifestation of C-4 risk is that there will be an unforeseendowngrade of acquisitions that could lead to a “run” on the assets of the insurance company.One firm referred to C-4 risk as “stupidity risk” — failure to employ and retain good people.
Two firms wryly referred to a new category of risk, dubbed C-5 risk, which is the havocthat arises when a person who has strong political ambitions or is running for higher politicaloffice is appointed to be state insurance commissioner.
The use of the Society of Actuaries’ risk classification taxonomy was viewed merely auseful point of departure by some of the insurance firms we interviewed, while others viewed itas satisfactory for their purposes. In our view, none of the risk classification schemas we sawwas completely satisfactory. However, most of the conceivable risks that would impact insurerswere included somewhere on the lists that we saw. In most cases, however, the industry wasstraining to define the inherent financial risks as part of the C1 through C4 paradigm that hadbeen developed years ago. In addition, it appeared that most schemas had undue focus on risksin isolation, rather than on their contribution to overall firm risk.
11
B. The Financial View of Risks
As an alternative to the actuarial decomposition of risk which is unique to the insuranceindustry, standard financial risk definitions are increasingly being proposed in the industry. Forthe sector as a whole, these risks can be broken into six generic types: actuarial, systematic,credit, liquidity, operational and legal risks. Briefly, we will discuss each of these risks facingthe insurance institution; in Section V we indicate how they are managed. Our focus will be onthe financial risks, which include the first four of the risks listed below. Of course the risksassociated with the provision of insurance services differ by the type of service rendered.
Actuarial risk is the risk that arises from raising funds via the issuance of insurancepolicies and other liabilities. It is the risk that the firm is paying too much for the funds itreceives, or alternatively, the risk that the firm has received too little for the risks it has agreed toabsorb. If an insurer invests its funds in efficiently traded securities, it should expect to have, onaverage, a zero net economic profit. If the insurer pays too much for these funds it cannotexpect to earn a satisfactory profit in the long run. Another aspect of actuarial risk is that duringany given time period, the underwriting losses will be in excess of those projected. This couldhappen for two reasons. First, the expectations themselves may be based on an inadequateknowledge of the loss distribution. Second, the losses may exceed their expectations in thenormal course of business simply because losses fluctuate around their mean. The degree towhich they deviate from the mean will depend, of course, on the characteristics of the lossdistribution, which depend on the nature of the risks insured.
Systematic risk is the risk of asset and liability value changes associated with systematicfactors. It is sometimes referred to as market risk. As such, it can be hedged but cannot bediversified completely away. In fact, systematic risk can be thought of as undiversifiable risk.All investors assume this type of risk whenever assets owned or claims issued can change invalue as a result of broad economic factors. Systematic risk comes in many different forms. Forthe insurance sector, however, three are of greatest concern, viz., variations in the general levelof interest rates, basis risk, and (especially for property/casualty insurers) inflation.
Because of the insurers’ dependence on these systematic factors, most try to estimate theimpact of these particular systematic risks on performance, attempt to hedge against them, andthus limit the sensitivity of their financial performance to variation in these undiversifiablefactors. To do so, most will both track and manage each of the major systematic risksindividually. The first of these is undoubtedly interest rate risk. Here, they measure andmanage the firm’s vulnerability to interest rate variation, even though they cannot do soperfectly. At the same time, insurers with large corporate bond, mortgage and common stockholdings closely monitor their basis risk. Here the concern is that yields on instruments ofvarying credit quality, liquidity, and maturity do not move together, exposing the insurer tomarket value variation that is independent of liability values. In this case too, they try tomanage, as well as limit, their exposure to it. Finally, to the extent that the frequency andseverity of claims are influenced by inflation risk, expected losses will also be affected. This isparticularly the case where insurance policies are written on a replacement cost basis. Theinflation of concern can be general inflation, affecting repair costs, medical costs, and the like,or specific and localized inflation, like the quadrupling of certain building materials costs in

12
southern Florida shortly after hurricane Andrew. All three of these systematic risks will berecognized as sources of performance variation.
Credit risk is the risk that a borrower will not perform in accordance with its obligations.Credit risk may arise from either an inability or an unwillingness on the part of the borrower toperform in the pre-committed contracted manner. This can affect the investor holding the bondor lender of a loan contract, as well as other investors and lenders to the creditor. Therefore, thefinancial condition of the borrower, as well as the current value of any underlying collateral is ofconsiderable interest to an insurer who has invested in the bonds or participated in a direct loan.
The real risk from credit is the deviation of portfolio performance from its expectedvalue. Accordingly, credit risk is diversifiable but difficult to eliminate completely, as generaldefault rates themselves exhibit much fluctuation. This is because a portion of the default riskmay, in fact, result from the systematic risk outlined above. In addition, the idiosyncratic natureof some portion of these losses remains a problem for creditors in spite of the beneficial effect ofdiversification on total uncertainty. This is particularly true for insurers that take on highlyilliquid assets. In such cases, the credit risk is not easily transferred, and accurate estimates ofloss are difficult to estimate.
Liquidity risk can best be described as the risk of a funding crisis. While some wouldinclude the need to plan for growth, the risk here is more correctly seen as the potential for afunding crisis. Such a situation would inevitably be associated with an unexpected event, suchas a large claim or a write down of assets, a loss of confidence or a legal crisis. Because insurersoperate in markets where they may receive clustered claims due to natural catastrophes, ormassive requests for policy withdrawals and surrenders due to changing interest rates, theirliabilities can be said to be somewhat liquid. Their assets, however, are sometimes less liquid,particularly where they invest in private placements and real estate. Given this situation, it isimportant for an insurer to maintain sufficient liquidity to easily handle any demands for cash.Otherwise, an insurer that would be solvent without a sudden demand for cash may have to selloff illiquid assets at concessionary prices, leading to large losses, further demands for cash, andpotential insolvency.
Operational risk is associated with the problems of accurately processing claims, andaccurately processing, settling, and taking or making delivery on trades in exchange for cash. Italso arises in record keeping, processing system failures and compliance with variousregulations. As such, individual operating problems are small probability events for well-runorganizations but they expose a firm to outcomes that may be quite costly.
Legal risks are endemic in financial contracting and are separate from the legal ram-ifications of credit and operational risks. New statutes, court opinions and regulations can putformerly well established transactions into contention even when all parties have previouslyperformed adequately and are fully able to perform in the future. For example, changes in theapplication of statutes of limitations for filing suits have affected the losses arising fromproperty/liability policies. Similarly, the change to joint and several liability rules has alsoaltered the distribution of risks that may be covered by insurance policies.7
13
Another type of legal risk arises from the activities of an institution’s management,employees and agents. Fraud, violations of regulations or laws, and other actions can lead tocatastrophic loss. Even a situation where the insurer legally fulfills all of its contract obligationscan result in massive litigation if some policy owners had different expectations orunderstandings about the performance of their policies than what was specified in the contracts.
Every insurer faces a different exposure to each of these risks, depending on its businessmix. In all its activities, an insurer must decide how much business to originate, how much tofinance, how much to reinsure, and how much to contract to agents. In so doing, it must weighboth the return and the risk embedded in the asset and liability portfolios. Management mustmeasure the expected profit and evaluate the prudence of the various risks enumerated above tobe sure that the result achieves the stated goal of maximizing shareholder value, in the case of astock insurer, or maximizing ownership interests, in the case of a mutual or reciprocal insurer. Ifthe product’s expected profit warrants the risk, then the activity is added to the insurer’s balancesheet, and the risk must be managed. This risk management is achieved through the four stepprocess outlined above. How this is implemented for each of the key financial risks enumeratedabove is the focus of our next section.
V. Insurance Risk Management Systems
A. Actuarial Risk
The risk of paying too high a price to raise funds is an important risk, particularly in lightof the fact that insurers raise few funds in the competitive capital market. Most of their debt israised in the form of issuing insurance policies. Policies are written today in exchange for lumpsum or periodic premiums, but the amounts and timing of the repayment of these funds are oftenunknown and may occur within a month or more than 80 years later. Because the pricing of thepolicies reflects not only expected losses but also the yields an insurer can earn on the fundsbetween the inception of a policy and its termination or the payment of benefits, the interestassumption used in developing insurance prices is of critical importance. Two things complicatethis process. Forward interest rates cannot be synthesized to lock in a spread, for the insurer hasno way of knowing if future periodic premium payments will be forthcoming. Also, the lossdistributions can undergo substantial evolution over time, as more information is revealed and asthe economic environment changes.
Insurers are typically quite skilled in managing actuarial risk. The manner in which thisis done is described in insurance and actuarial textbooks.8 Therefore, here we will focus on whatdevelopments have occurred during the past decade that improve an insurer’s ability to price andmanage this risk.
Until recently, life insurance prices were developed using conservative static assumptionsregarding loss distributions and interest rates. While this approach was satisfactory for much ofthe past century, it was ill-equipped to accommodate the interest rate volatility that began duringthe late 1970s. Life insurance policies are replete with options — settlement options, policy loanoptions, over-depositing privileges, and surrender or renewal privileges, on the part of theinsured, and discretionary dividend and crediting rate options on the part of the insurer. Indeed,some have even viewed a life insurance policy as little more than a package of options.9 In

14
stable interest rate environments, policy owner utilization of these options is often predicated onindividual or family circumstances. Hence, in the aggregate, utilization rates are fairly steadyand amenable to forecasting.
However, when interest rates are volatile, the options gain in value and their utilizationrates can fluctuate wildly. Traditional actuarial methods, which depended upon stability, wereincapable of correctly valuing these options; hence, many policies were woefully underpriced.10
Today the standard valuation methods that have been adopted by most of the sophisticated lifeinsurers explicitly value these embedded options. Thus, insurers now can estimate the cost ofthe various option-like provisions of all kinds of life insurance policies. Most life insurers weinterviewed were using the PTS software of Chalke, Inc. (now SS&C, Inc.). This software, andcompeting software offered by Tillinghast and others, use modern stochastic valuationtechniques, familiar in the pricing of fixed income and mortgage-backed securities, to estimatethe values of insurance policies in a manner consistent with that used to value the assets.Needless to say, this represents a big advance in the tools with which insurers can practice riskmanagement.
Lest our enthusiasm for this advance be misconstrued as euphoria, we hasten to add thatall is not well here. First, the stochastic valuation methodology most commonly used relies on asingle stochastic factor. Most fixed income and mortgage-backed security valuation models arebased on at least two stochastic factors. Without two factors, one tends to produce model valuesthat are too highly correlated, and whose movements in value are perfectly correlated. Also, thespeed of the software is sufficiently slow that it is difficult to implement more than a handful ofpath simulations in arriving at “option-adjusted” values. Moreover, it is unrealistic to attempt tomodel a prepayment feature or a call feature, which may be triggered by changes in long-termyields, while using the short-term rate paths to value the instrument. The second drawback isperhaps even more serious. Most insurers have inadequate data collected and assembled withwhich to reliably model the interest sensitivity of policy option utilization. Accordingly, thevaluation models really allow an insurer only to better quantify the impact of its guesses aboutwhat those utilization functions might look like. We encountered much frustration amonginsurers that even though the valuation software had taken a long time to develop, the datarequirements of the valuation software have still not been met.
Nonetheless, the availability of valuation software that is consistent with modernvaluation principles is an important step forward, and software that is currently under de-velopment will remedy the shortcomings of being based on a single stochastic factor andproducing value estimates, dare we say, at a relaxed pace. With this software, actuaries producepricing estimates based on a dozen or so scenarios. However, they typically also test their pricesusing hundreds and thousands of additional scenarios, albeit not in an option-adjustedframework.
In the property/casualty sector, there is no counterpart to the modern valuation softwarefor pricing liabilities. However, option-adjusted arbitrage-free valuation tools may be overlypowerful given the imprecision associated with many of the risks that are insured. There are fewoptions that compare with those available in life policies, and nominal values are often notguaranteed; guarantees are sometimes in terms of covering repair costs, replacement costs,

15
medical costs, and so forth. Even when there are nominal maximum amounts of coverage, thelosses below the maximum are subject to additional uncertainty because of inflation.
The use of reports and standards for underwriting life/health and property/casualty risksis routine. It is common to have dozens, and sometimes over a hundred “cells” in which toclassify the risks. Base rates can be related to a number of factors, such as age, gender,occupation, schooling, health status and history, property characteristics, nature of business, andso forth. These base rates are then adjusted to reflect experience factors (e.g., past claims,driving behavior). While the fair premiums will be a function of interest rates, in practice thepremiums charged will not adjust to reflect current interest rates very often. This is probablybecause it is administratively cumbersome to alter insurance premium schedules every time theinterest rates change.
Underwriting limits are commonly established. Authority is limited to a certain amount.While insurance agents may have temporary binding authority, it is a common practice to have aparty who is not involved in the policy sale to review the underwriting and make a determinationwhether the risk will ultimately be accepted and insured. Insurers are typically better at keepingtrack of sales commissions than in tracking losses to a particular sales agent or underwriter.However, many of the leading life/health and property/casualty insurers are carefully trackingthe experience of their sales and underwriting personnel. If the experience falls outside thenorm, it is common to place restrictions on further sales or more severe limitations onunderwriting; alternatively, the activities of these sales agents and underwriters could be subjectto greater oversight.
Perhaps the area of greatest concern in the area of actuarial risk is the misalignment ofincentives between owners of the insurance firm and its sales and marketing staff. Much can bedone to improve it. The typical arrangement is to pay commissions for sales of new policies,with the commissions on a multiperiod contract heavily front-loaded, particularly for life/healthproducts. This creates a tremendous incentive for agents to sell as much business as possible,whether it is profitable for the company or not. It also creates strong incentives to replaceexisting policies, whose commission rates have dwindled to the low single digit percentagerange, with new policies that pay commissions ranging from 20 to 100% of first year premiums.Sales managers and marketing personnel are also often rewarded based on volume of sales.Even senior management may sometimes have their compensation tied to sales growth.
Experience has shown that rapid growth is one of the factors most commonly associatedwith insolvency. It is useful to remember here that what is growing most rapidly is theaccumulation of liabilities, not assets. One way to foster rapid growth is to underprice liabilities.Employees and agents whose compensation is tied to sales growth are therefore strongproponents of more “competitively-priced” insurance policies. Senior management often comesfrom a sales background, and is sympathetic with the notion that what is good for the insuranceagents is good for the company. Pricing actuaries, who are supposed to be the watchmen andgate keepers in this area, are often placed under tremendous pressure to alter their assumptionsso that the company’s products can be priced more competitively. Of course, over time it willbecome apparent if the insurance policies are mispriced, but that is weighed against theimmediate benefits of higher commission earnings and growth.
16
The sales side has one powerful club in this battle for determining policy prices. Salesagents often work for a number of insurers and can shift new business toward them. Worse, theycan take existing business away from the firm, before it breaks even from heavy initial policycosts, and direct it elsewhere if they can demonstrate satisfactorily that policy illustrations orprices appear to be more favorable elsewhere. Many firms in the insurance industry are wellaware of this misalignment of interests, yet feel thwarted by regulations about commissionschedules.
In the long run, of course, insurers offering non-economic policies will go bankrupt. Butthe long run can take a long time to arrive; hence, the insurer who is trying to rationally price itspolicies faces a quandary. Does it succumb to the uneconomic pricing temporarily and hope tosurvive beyond the irrational players, and then restore sensible pricing, or does it choose to writevery little current business and lose its distribution force? Neither choice is an attractivealternative.
B. Systematic Risk
Systematic Risk of Liabilities
No area in financial risk management of insurance has evolved as much as the analysis ofsystematic risk of liabilities during the past decade. This is, in large measure, due to the fact thatinsurers feel an increased sense of urgency in applying the tools of asset/liability management tomeasure and manage interest rate risk. We note that the two most recent Goldman Sachs surveysof life insurance Chief Investment Officers ranked asset/liability management (ALM) at the topof the list of their concerns, whereas the topic did not surface in the top four rankings in theirearlier surveys. Property/liability companies are also giving greater attention to the area.
The increased importance given to ALM was echoed in the 1995 and 1996 surveys ofLamm-Tennant, who found it near the top of the factors that influence investment policy. Herfindings are notable because they combine the results of both life/health and property/casualtyinsurers, and cover companies that are much smaller than those in the Goldman Sachs surveys.When contrasted with the earlier surveys of Babbel and Lamm-Tennant [1987], Babbel andKlock [1988], Lamm-Tennant [1989], and Bouyoucos and Siegel [1992], the increasedimportance of interest rate risk and ALM during the past few years is remarkable. All of thelife/health and property/liability insurers we interviewed perceived this source of risk to becrucial to understand, measure and manage. However, the insurers we interviewed ran thegamut from naive to very sophisticated when it came to measuring interest rate risk.
On the liability side of the balance sheet, most of the life insurers were using PTSsoftware developed by Chalke, Inc. to measure the effective duration and convexity of theirliabilities.11 The others were using TAS from Tillinghast, or some internally developedsoftware. Most of the life insurers who were using the commercially available softwarepackages had implemented some of their own customized enhancements to meet better theirneeds, capabilities, focus and concerns.
The use of effective duration and convexity measures represents a quantum leap fromwhat the practice was only a few years earlier. Prior to 1992, virtually none of the insurers had

17
access to a commercially available software package that could compute measures of effectiveduration and convexity for their liabilities. Even the PTS, TAS (formerly CALMS) andMilliman and Robertson software packages available at that time would not produce measures ofeffective duration and convexity. Rather, the duration numbers, in those cases where they wereproduced, were simple modified or Macaulay measures, which assume that all cash flows arefixed. Yet, liabilities are virtually all interest sensitive to some degree. They produce errors solarge as to lead to reckless investment decisions, while imbuing such decisions with a veneer ofanalytical and quantitative credibility.12 Back then, insurers who were concerned about interestrate risk relied heavily upon simulations. Indeed, duration estimations were considered soprimitive that they were generally eschewed in favor of simulations, and rightfully so in ouropinion. This is because many of the duration estimates that we saw then did not fullyincorporate the interest rate sensitivity of cash flows for either assets or liabilities.
Today, convexity measures are also produced by the PTS software that is mostcommonly used. We found that insurers placed less confidence in the convexity numbersproduced than in the duration numbers. This is because convexity numbers are much moresensitive to lapse assumptions than are duration numbers; while a misspecification of the interestrate sensitivity of lapses and other options can cause a large error in effective duration estimates,it will cause an even greater error in the estimates of convexity. Most insurers feel that they donot have enough reliable data on which to specify the relation of lapses and policy surrenders tointerest rate movements. The lack of confidence they have in this crucial input to convexityestimates translates into a lack of confidence in the convexity estimates themselves. However,most companies did pay some attention to convexity estimates, but placed wide ranges aroundthose estimates. The most common way to grasp the impact of convexity was in toggling thelapse/surrender sensitivity parameters in numerous simulations. The standard among thecompanies we interviewed was to perform simulations of between 500 and 10,000 paths tocapture the impact of changing interest rate levels on policy lapses/surrenders.
While life insurers have more interest than confidence in the convexity estimates, theyhave progressed a long way over the past few years. Prior to 1992, the commercially availablesoftware did not even produce convexity estimates for life insurance liabilities. Instead, firmsrelied almost entirely on simulations. Many firms used only the seven highly artificial scenariosrequired of New York’s Regulation 126. Prior to its passage, some insurers did not use thesimulation method at all. Rather, they relied simply on their “best point estimates” and staticlapse assumptions. Even today, there are insurers who use nothing more than the sevenscenarios required under Regulation 126 to assess their exposure to interest rate risk.
The property/casualty insurers with whom we spoke had less concern about interest raterisk than their life/health counterparts. Nonetheless, they manifested greater understanding ofthe problem than a few years earlier. All of them were well aware of the importance ofmeasuring duration of assets, producing in-house estimates of duration, or acquiring them fromoutside vendors, for most of their fixed income assets. More problematic was the estimation ofduration for their real estate and equity portfolios. However, an analysis of the duration of theirliabilities was generally missing. They had a notion that the duration was relatively short —perhaps a couple of years or so — but no more specific information.13 Convexity was even lessof a concern for these property/casualty insurers. Nonetheless, there appears to be at least some

18
interest rate sensitivity in the payments made to satisfy property/casualty claims. For example, itis well known that workers’ compensation claims tend to increase during periods ofunemployment, as fraudulent claims seem to be filed with greater frequency. Similarly, firesand arson tend to occur with greater frequency when insured values exceed market values. Tothe extent that these and other situations are linked to interest rate levels, it can be supposed thatsome property/ casualty liabilities are interest sensitive. Available evidence on this front isscant, however.14 Where the sensitivity is measurable, it tends to be more closely linked toinflation than to nominal interest rates. Therefore, the influence of inflation on their liabilitieswas deemed more important.
It would be fair to say that most property/casualty insurers paid little attention to theduration of their liabilities. It is generally thought that interest rate risk accounts for only a smallportion of the change in the value of liabilities over time, and that other risks, such as actuarialrisk, price regulation, legal risk, underwriting risk, inflation risk, and event or catastrophe riskswamp the influence of interest rate movements on the pricing and valuation of property andcasualty insurance liabilities.
Systematic Risk of Assets
Insurers are concerned with interest rate risk more than other systematic risk factors, andrightly so. Over the past two decades, it has been the source of much of the fluctuation in thevalue of fixed income assets, which constitute the majority of their assets. However, while it isthe crucial systematic risk on the life insurance liability side,15 and of some importance forproperty/casualty liabilities as well, it is prominent but less dominating on the asset side of thebalance sheet. This is because asset values are perceived to be affected not only by generalinterest rate levels, but also by basis risk, default risk, liquidity risk, call risk, prepayment risk,extension risk, sinking fund options, convertibility, real estate and equity risk. Yet, several ofthese risks are simply different manifestations of interest rate risk, making accurate measurementof paramount importance.
The measurement of interest rate risk on the asset side of the balance sheet is generallywell done, although some insurers have a long way to go. Many insurers use the actuarialsoftware mentioned earlier to estimate the durations and convexities of their investments. Someuse software and pricing services like GAT and Bloomberg that are oriented strictly toward theasset side of the balance sheet. Several have developed their own, more sophisticated in-houseprograms for estimating values of both sides of the balance sheet. We noted that it was commonto use more than a single source to assess the duration and convexity of assets. One statedreason for this was the divergence of opinion between the various programs and pricing services.
We did not encounter any property/casualty insurers who carefully measured the interestrate risk of both sides of their balance sheet. What was more common was for the focus to be onthe interest rate risk of only the assets. Here the tools of duration and convexity measurementwere applied, and insurers took steps to manage the overall exposure of their assets to interestrate risk and keep it within some targeted range. It was common for property/casualty insurersto use interest rate futures, swaps, and options to moderate this risk to acceptable levels. Optionsand futures were also used to hedge equity market risks, where the insurer maintained a large
19
position in common stocks. The hedges were put in place, and then removed, as marketconditions changed and the insurers’ appetites for equity risk waxed and waned.
Asset/Liability Management
Asset/liability management typically did not go far beyond an assessment of the impactof interest rate movements on the value of the firm. Other systematic risks were usually dealtwith in a more piecemeal fashion. The standard practice is to produce estimates of liabilitydurations and convexities for each line of business, as well as for each asset class. Theseestimates are then weighted by the fair value of liabilities, or market value of assets, to arrive atoverall asset and liability duration and convexity estimates. After factoring in leverage, theinsurers are able to obtain measures of surplus duration and convexity. Examples of productlevel and firm level analyses are given in Exhibits 1 and 2.
The frequency for providing analysis of interest rate risk varies widely. Some firmsprovided weekly summaries of their asset durations and convexities, and monthly or quarterlysummaries of their liabilities. In the case of interest rate futures and options, reports were morefrequent, owing to their tremendous impact on overall interest rate risk. Some firms assessedtheir liability interest rate risks only on an annual basis, and among the property/casualtycompanies, liability durations were often not measured at all, nor was the interest rate sensitivitytaken into account in liability simulations.
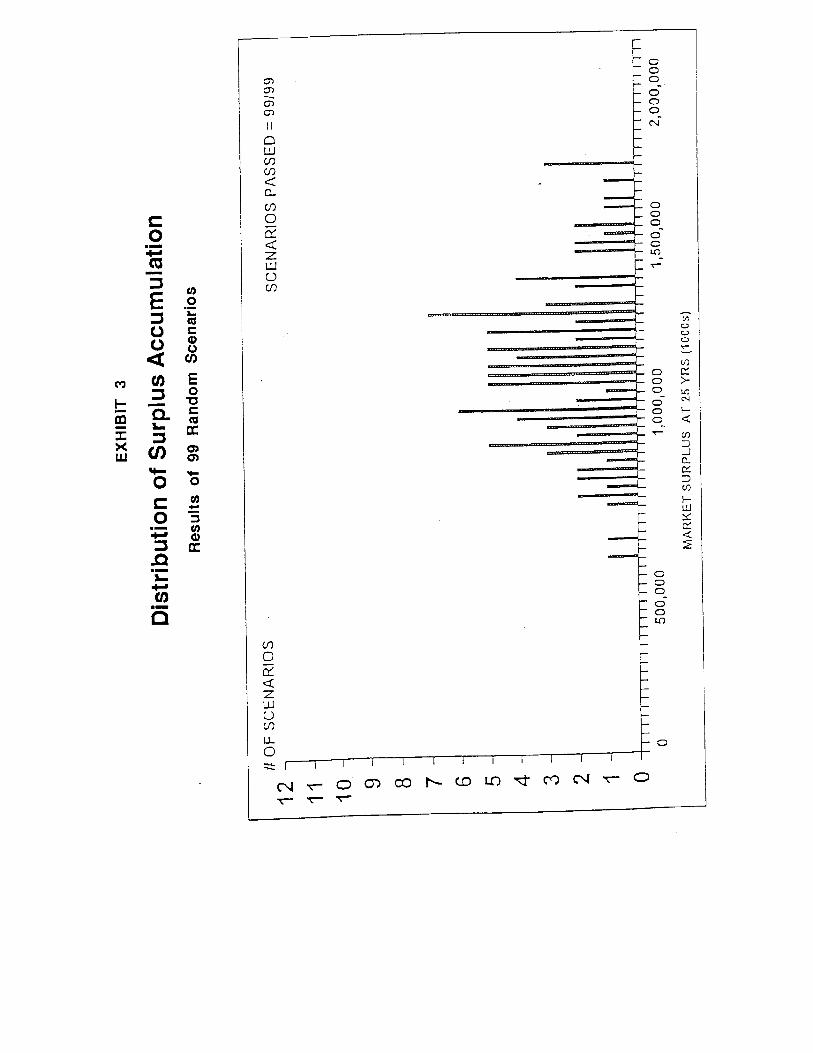
Many companies coupled this kind of analysis with one that shows the distribution of thefuture market value, or more typically, book value of surplus, based on hundreds of scenarios.An example is provided in Exhibit 3. This approach is conceptually fine, although we cautionthat when looking at distant future values of surplus, the values produced are extremely sensitiveto slight variations in assumed yield spreads, which can get compounded for 30 years, and oftenare overly optimistic. Rarely are these approaches implemented with sufficient skill to accountfor the various correlations and patterns that can be observed in practice.
Although many firms use the same general frameworks for analysis, when it comes toimplementation we begin to see divergence in the quality of inputs and practice. By relying on anumber of outside sources to provide the estimates of interest rate sensitivity for assets andliabilities, a number of insurers have injected another risk into the mix: divergent technologiesand assumptions. We believe that for the purposes of asset/liability management, it is amisdirected effort to obtain the most credible measures of interest sensitivity of certain assets orliabilities. It is far more important to get measures of interest rate sensitivity that are calibratedsimilarly. After all, the absolute values are of less importance here than their relative values andthe implication these have for the volatility of equity.
We saw a number of practices that invite problems. One prominent insurer used ef-fective duration and convexity estimates for the liability side of the balance sheet, and ModifiedMacaulay duration measures for the asset side. Another insurer did exactly the opposite. Someinsurers base their aggregate duration and convexity numbers on book value weights, rather thanmarket value weights. More than one insurer was frustrated that their actuarial departmentsrelied entirely on simulations and provided no duration or convexity measures whatsoever. Theactuarial scenarios run were based on completely random interest rate paths, inconsistent with

EXHIBIT 1
OPTION ADJUSTED DURATION / CONVEXITYLife Product XX
ASSETS LIABILITIES SURPLUSInt. Rate
Shift (b.p.)
Option-Adjusted
ValueEffective Duration Convexity
Option-Adjusted
ValueEffective Duration Convexity
Option-Adjusted
ValueEffective Duration Convexity
-200 1,600 2.9 N/A 1,545 4.1 N/A 55 -30.8 N/A-150 1,500 3.0 -66 1,405 2.9 60 95 4.5 -3,000-100 1,400 3.1 -85 1,330 2.1 450 70 22.1 -25-50 1,300 3.3 -176 1,243 1.8 700 57 36.0 -125
0 1,200 3.5 -190 1,151 1.5 680 49 50.5 -10,00050 1,100 3.8 -121 1,061 1.4 390 39 69.1 -8,555
100 1,000 4.2 -50 975 1.2 85 25 121.2 -6,000150 900 5.0 0 901 1.1 20 -1 -3,508.9 100200 800 5.9 N/A 845 1.0 N/A -45 -86.1 N/A
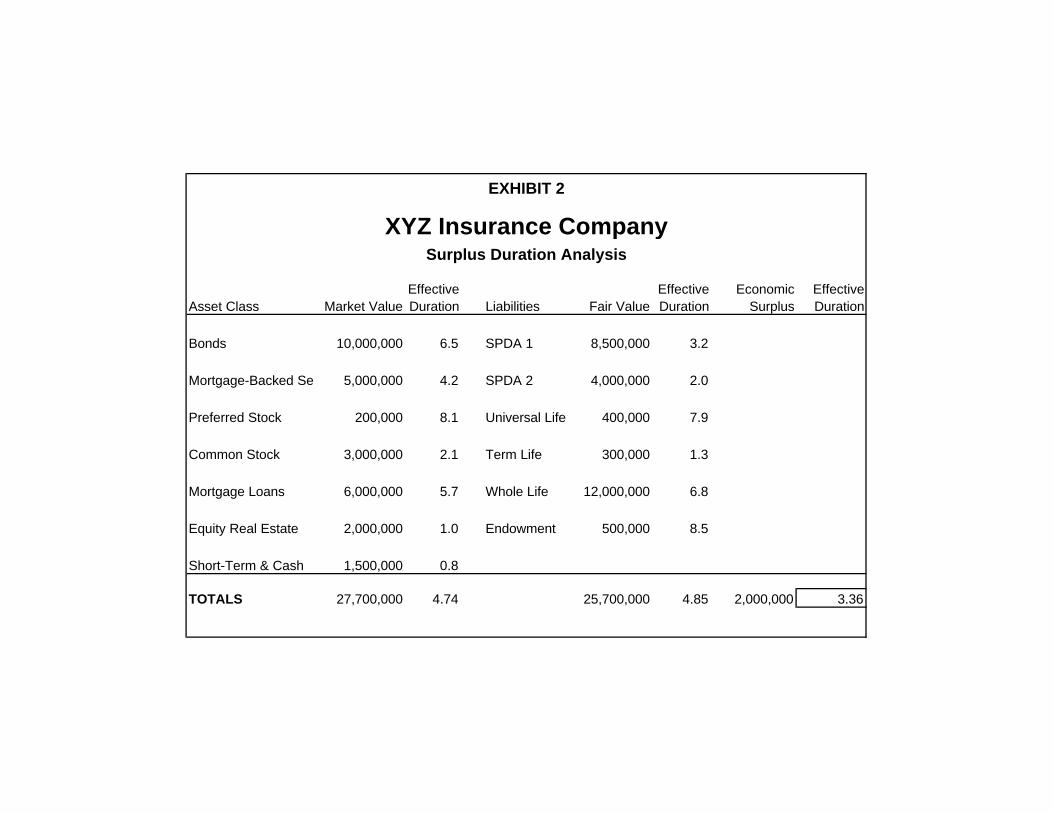
EXHIBIT 2
XYZ Insurance CompanySurplus Duration Analysis
Asset Class Market ValueEffective Duration Liabilities Fair Value
Effective Duration
Economic Surplus
Effective Duration
Bonds 10,000,000 6.5 SPDA 1 8,500,000 3.2
Mortgage-Backed Se 5,000,000 4.2 SPDA 2 4,000,000 2.0
Preferred Stock 200,000 8.1 Universal Life 400,000 7.9
Common Stock 3,000,000 2.1 Term Life 300,000 1.3
Mortgage Loans 6,000,000 5.7 Whole Life 12,000,000 6.8
Equity Real Estate 2,000,000 1.0 Endowment 500,000 8.5
Short-Term & Cash 1,500,000 0.8
TOTALS 27,700,000 4.74 25,700,000 4.85 2,000,000 3.36

20
any financial theory or history of interest rates. Several insurers relied on liability durationestimates based on only one interest rate factor, but on asset duration estimates based on twofactors. Some insurers used duration measures for corporate bonds and mortgage-backedsecurities supplied by Wall Street that were based on different volatility parameters andprocesses than those used for other asset and liability categories. Some estimates were based onlattice models, while others were based on simulation models, or simulating through lattices.Only one insurer we know of is attempting to correct the duration measures on corporate bondsfor the basis risk between corporate and government bonds.16 Some insurers took the basis riskbetween movements in long-term vs. short-term interest rates into account, but many did not.Some took into account all kinds of potential twists in the yield curve, while others allowed onlyfor parallel shifts.
In setting limits on the amount of systematic risk the company desires to retain, acommon approach is the one used by a leading multi-line insurer. The company places limits onits desired portfolio structure to reflect the variety of risks to which it is exposed. Limits are seton individual asset holdings, on industry concentration, and on asset type including mortgage-backed securities and collateralized mortgage obligations, all in a risk-based capital context.However, nowhere did we observe a methodology to derive such limits, or even a standardizedapproach across business lines.
For the balance sheet as a whole, limits are employed in two different ways. Oneapproach is to impose a limit on the amount of duration mismatch allowed, either for particularproduct lines or for aggregating across all assets and liabilities. For instance, one companyapplies these restrictions on a product segmentation basis, allowing up to a year durationmismatch on participating whole life products, but only 1/10 of a year on GICs. Anothercompany does not place restrictions on duration mismatches on a product by product basis, buton an aggregate portfolio basis. In our view, although most companies we interviewed usedsome sort of product segmentation approach, it is not necessary to do so. The advantage of asegmentation approach is the discipline it imposes on the pricing process, so that long termyields do not get used for pricing short term liabilities, and so forth. However, if this samediscipline can be achieved in the pricing of insurance policies without a segmentation of assetsinto various product groupings, it seems that advantage would disappear. On the other hand,valuable resources would not be consumed in notionally dividing up the general account into thevarious segments, and it could be managed on an aggregate basis. This would avoid the costlyduplication of efforts, where one product manager is selling an asset and another is buying thesame or a similar asset, incurring transaction costs. Some firms simply transfer the assetsbetween portfolio segments and use some sort of internal transfer pricing mechanism. Assets areacquired by the firm and then allocated to each product group according to perceived needs.This is done to foster a better sense of accountability and used in performance evaluation. But toreward a product group for producing net profits between liability costs and rates of return onassets which they had no responsibility in acquiring or divesting seems to be rewarding them forrisks over which they had no control. While we appreciate the need for pricing discipline andcontrol, we feel this could be achieved more simply and that the asset portfolios can be managedbetter on an aggregate basis.

21
The other limit is a restriction on the amount of scenarios that are allowed to reveallosses due to asset/liability mismatches. These limits are typically placed not only on thedistribution of final simulated results, but also on the evolution of solvency over time associatedwith the simulations. One firm has almost no tolerance for scenarios showing negativeprofitability due to interest rate risk exposure. Because it is persuaded that interest rates arevirtually impossible to forecast, and over which it has no control, it has decided to avoid interestrate risk of any kind, to the extent possible.
At the firm that decided to avoid as completely as possible interest rate risk, portfoliomanagers are not rewarded in any way for taking interest rate risk and trying to “time” themarket. Indeed, their job could be lost if they stray outside narrow boundaries. Some firmspurport to eschew interest rate risk, yet reward their investment department personnel if theyachieve investment income or total rates of return above some benchmark level. By measuringonly periodically the interest rate risk of assets, this invites the portfolio managers to “game” thesystem and attempt to improve their returns by incurring interest rate risk for brief periods oftime. Some firms have duration targets but ignore convexity, leading portfolio managers to trybarbell, ladder, or bullet maturity approaches to achieve higher investment income, dependingon the shape of the term structure.
But by in large, the major difference between investment practices that we saw duringthis study, compared to what was occurring less than a decade ago, was that there was far lessemphasis on yield and more on total rate of return. As recently as five years ago a survey of theAmerican Council of Life Insurance revealed that two-thirds of chief investment officers did noteven consider total rate of return as an investment objective. Yield was the primary focus. Thiswas an impediment to effective asset/liability management but is beginning to dwindle.Nonetheless, we observed more concern with book yield than we feel is appropriate, given itslack of importance to the true economic performance of the firm.
C. Credit Risk
In addition to the credit risk that reveals itself as basis risk in the systematic risk factorslisted above, there is also the risk of default on significant firm investments. While it may beidiosyncratic risk to the market as a whole, it is not idiosyncratic risk to the insurer maintaining asignificant position in an asset that goes into default.
Insurance firms are generally very focused on credit risk, as are rating agencies andregulatory authorities. They produce weekly and monthly reports that monitor the credit risk oftheir assets. They rely on outside rating agencies, such as Moody’s, Standard and Poor’s, Duffand Phelps, and Dunn and Bradstreet. In addition, virtually all of their investments are assignedcredit ratings by the Securities Valuation Office of the National Association of InsuranceCommissioners, which are used for statutory reporting purposes. These ratings are not alwaysviewed as sufficient measures of credit risk for those insurers who feel that absorbing credit riskis an important part of their franchise. Many insurers have their own due diligence requirementsto meet before they will take on an investment that has credit risk. They undertake internalcredit risk ratings, in some ways quite similar to those of Moody’s or Standard and Poor’s,although with different weightings on the risk factors. Moreover, they are prone to update their
22
internal credit risk ratings promptly as important information bearing on the creditworthiness ofa major investment position is revealed.
Insurers produce “Watch Lists” of firms they feel are in financial jeopardy, likely to bedowngraded or become insolvent. They often have a dual track credit risk assessment, one forthe asset itself, and another for the underlying collateral. They place limits on the portfolioexposure by industry, by geographic region, by business (e.g., real estate prohibited), and bycompany. They also have lists of approved counterparties for brokerage, settlement and swaps.
In Exhibits 4 and 5 we provide an example of one set of investment guidelines, withgeneral and specific authorizations and limits that we feel are representative of the industry.However, there is substantial variation in the practices that we have seen. Perhaps the poorestapproach we saw was a firm that used Moody’s ratings, and assigned numerical values to eachrating class. For instance, 1.0 was assigned to a rating of Aaa, 2.0 was assigned to Aa, 3.0 to A,4.0 to Baa, 5.0 to Ba, 6.0 to B, 7.0 to Caa, 8.0 to Ca, 9.0 to C, and 10 to D. Adjustments aremade to accommodate the modifiers of 1, 2, and 3 that Moody’s often uses to designate relativequality within a ranking class. The company then has a target number of 3.0 to achieve in itsoverall credit risk plan. One problem with this approach, which they recognize, is that defaultrates and volatility of default rates do not grow linearly as rating is decreased step by step.Coupled with an incentive structure that rewards portfolio managers for the investment yieldsthey book, this system leads to a credit barbell approach, as shown in Exhibit 6, because theportfolio manager can achieve superior yields by doing so.
The best approach we saw included a more refined ranking of credit risk, not by letterbut by default probability coupled with standard deviation of defaults for each ranking.Covariance of asset returns was also taken into account, and the entire credit risk problem wascast in a surplus oriented mean-variance model. Diversification guidelines were incorporatedthrough constraints on the optimization. Liquidity risk was reflected by reducing the expectedreturns by a number of basis points that was deemed appropriate from historical experience.
D. Liquidity Risk
Although insurance companies are faced with liquidity risk, most of the insurers weinterviewed had little concern for it. Only one was concerned about having too little liquidity,and one was concerned about having too much liquidity. The others did not seem to beconcerned, believing their situation to be well managed.
Liquidity is not as big a concern with many insurance firms as it is in other financialinstitutions for one good reason: most of their policies are less liquid than their assets. Lifeinsurance companies issue policies that commonly feature high surrender charges. Thesecharges are either explicitly stated, or implicit in the schedule of cash build-up. For example, asingle premium deferred annuity, with annual crediting rate reset and a seven year maturity, mayfeature surrender charges beginning at 7-10% during the first year, and declining in steps towardzero at maturity. Similarly, universal life and whole life products often have very low surrendervalues during the first year or two of a policy, and begin building up rapidly after that point.Other policies, such as variable universal life, have surrender provisions that act much like amutual fund, where the amount received depends on the value of the underlying fund.

Exhibit 4, Page 1 of 3
EXHIBIT 4
Investment GuidelinesGeneral Authorizations
These general authorizations are to remain in effect until January 1997 unless modified or canceled.
The total investment in any one credit (total of bonds, preferred stock, convertible securities and commonstock) is limited to 1% of net admitted assets, with the exception of direct U.S. Treasury and full faith andcredit obligations and U.S. government-sponsored enterprise obligations, as further specified below.
The following authorizations specify which transactions the Investment Officers of the Company are authorized toconduct that their discretion.
Fixed Income Securities - Non Convertible1
A. Purchase U.S. Treasury and full faith and credit obligations in unlimited amounts.
B. Purchase U.S. Government sponsored enterprise obligations. Such purchases to be limited to 3% of netadmitted assets per enterprise, and an aggregate limitation of 10% .
C. Purchase corporate , municipal , or foreign bonds denominated in U.S. dollars which are rated in the Baacategory or better; purchase private placement issues rated in the Baa category or better, or its equivalent.
D. Purchase mortgage-backed securities and collateralized mortgage obligations consistent with InvestmentCommittee limitations and the Specific Authorizations.
E. Purchase asset-backed securities consistent with Investment Committee limitations and SpecificAuthorizations.
F. Purchase preferred stocks of companies whose bonds or preferred stocks are rated in the Baa category orbetter, or its equivalent.
Short Term Fixed Income
H. Purchase commercial paper (with maturities not exceeding 270 days), certificates of deposit or bankersacceptances which are rated wither A-1 or better by Standard & Poor’s or P-1 by Moody’s.
Such purchases to be limited to 1% of net admitted assets per credit.
Repurchase Agreements
I. Repurchase agreements may be purchased with banks or security dealers as designated in the SpecificAuthorizations with the following characteristics: at least 102% collateralized by U.S. Treasury or Agencyobligations; for periods not exceeding 60 days.
Total amount outstanding limited overall to 5% of net admitted assets and with any one counter party to 2%.
Reverse Repurchase Agreements
J. Reverse repurchase agreements may be transacted with banks or security dealers by Specific Authorization.
Total amount outstanding to be limited to 5% of net admitted assets and per counter party to 2%.
1“Baa category” should be interpreted to mean having a rating no lower than either Baa3 (by Moody’s) or BBB- (by Standard & Poor’s).

Exhibit 4, Page 2 of 3
Dollar Rolls
K. Enter into dollar roll transactions with banks or security dealers designated in the Specific Authorizations.Total amount outstanding to be limited to 5% of net admitted assets and per counter party to 2%.
Other
L. Enter into CMO residual commitments as specified in the Specific Authorizations.
M. Use financial futures contracts and interest rate options (exchange traded and over-the-counter) to reduceinterest rate risk exposure.
N. Sell securities held in the portfolio. Any purchaser or transfer agent of such a security need not inquire into theauthority for such sale upon the Secretary’s certification that it is made under this subdivision “N”.
Convertible Securities2
O. Under the limits specified for non convertible bonds, purchase convertible bonds of companies with issuesrated in the Baa category or better, or of companies with lower or non rated issues according to the followingschedule:
Moody’s (or S&P) Rating Authorized Limit per Issuer as Percentage of the Convertible Portfolio Ba1 (BB+) to Ba3 (BB-) 2.0% B1 (B+) to B3 (B-) 1.0% No Rating 1.0% Caa (CCC+) to C (D) 0.5%
Purchases must not cause the aggregate statement value of convertible debt rated less than 2 by the NAIC toexceed the following percentages of the convertible debt portfolio:
NAIC Rating Restrictions 3 3Z 6 6Z 60.0%4 4Z 6 6Z 40.0%5 5Z 6 6Z 7.5%6 6Z 2.5%
P. Purchase of medium or lower grade bonds must not cause the aggregate statement value of bonds, includingconvertible debt, rated less than 2 by the NAIC to exceed the following percentages of net admitted assets:
NAIC Rating Restrictions 3 3Z 6 6Z 10.0%4 4Z 6 6Z 5.0%5 5Z 6 6Z 3.0%6 6Z 1.0%
Q. No more than 25% of the portfolio’s bonds rated less than 2 by the NAIC can be companies within a singleindustry nor should these issues in aggregate conduct business within one narrow geographic region. Theduration of these issues as a group should be viewed in the context of the total bond portfolio.
R. Purchase convertible preferred stocks under the limits specified for non convertible with issues rated Baa orbetter, or of companies with lower or non rated issues according to the following schedule:
2At market value: includes debentures and preferreds.

Exhibit 4, Page 3 of 3
Moody’s (or S&P) Rating Authorized Limit per Issuer as Percentage of the Convertible Portfolio Ba1 (BB+) to Ba3 (BB-) 2.0% B1 (B+) to B3 (B-) 1.0% No Rating 1.0% Caa (CCC+) to C (D) 0.5%
Common Stock
S. The Investment Officers are authorized to purchase common stocks of any United States or Canadiancorporation or any foreign corporation whose shares are included in the S&P Common Stock Index in amountsconsistent with the Investment Policy Statements as approved by the Committee subject to these additionalrestrictions. Specifically, the Investment Officers may not:
1. Invest in the equity securities of closed end funds, investment companies, limited partnerships or realestate investment trusts without specific authorizations
2. Make any purchase of common stock which would result in more than 5% of the value of the commonstock portfolio being invested in the securities of one issuer
3. Purchase a common stock if as a result thereof more than 25% of the assets of the common stockportfolio will be invested in a particular industry
4. Purchase a common stock if as a result more than the authorized limit of the assets of the common stockportfolio will be invested in common stock of that particular issuer. The authorized limit per issuer will be afunction of the issuer’s common stock market capitalization in accordance with the following schedule:
Market Capitalization of Authorized Limit per Issuer as % of Issuer of Common Stock the overall Common Stock Portfolio $0 - $25 million 0% $26 - $50 million 0.25% $51 - $100 million 0.50% $101 - $200 million 1.00% $201 - $500 million 2.00% $501 - $1,000 million 3.00% $1,001 - $2,000 million 4.00% more than $2,000 million 5.00%
Furthermore, the Investment Officers will make a quarterly presentation to the Investment Committee on theperformance of the common stock portfolio and its risk characteristics in relation to appropriate benchmarks.
T. The Investment Officers are authorized to use stock index futures and options contracts (exchange traded andover-the-counter) to reduce stock market risk exposure.
Real Estate / Commercial Mortgages
U. The Investment Officers are authorized to:
1. Commercial Mortgages and Real Estate EquityConsummate transactions for the purchase, sale, exchange and disposition of real estate loans or equities, upto $2.5 million with the approval of any three of the following officers of the Company:
Chairman of the Board, President, Chief Investment Officer and Senior Real Estate Investment Officer.
All transactions completed under this authority will be reported to the Real Estate Subcommittee of theInvestment Committee of the Board of Directors

1
EXHIBIT 5
Investment GuidelinesSpecific Authorizations
The following specific authorizations for the purchase of securities to be executed at the discretion of the Officers of the Companywere renewed by the Committee:
1. Bonds, Short-Term Investments, Convertibles Subordinated DebenturesNone
2. Common Stocks
a. DomesticNone
Authorizationb. Foreign Companies Percent
DeBeers Consolidated Mines (ADR) 1.0%Sea Containers Ltd. 1.0%
3. Convertible Preferred StockSea Containers Ltd. 1.0%
4. Repurchase Agreements, Reverse Repurchase Agreements and Dollar Roll TransactionsThere is a list of banks and security dealers authorized for repurchase agreements and reverse repurchase agreements anddollar roll transactions.
5. Hedging Transactions
A. The following officers of the Investment Department are hereby authorized to execute hedging transactions inaccordance with the guidelines:
Executive Vice President & Chief Investment OfficerSenior Vice President, Vice President, and Second Vice President, Equity SecuritiesSenior Vice President, Vice President, and Second Vice President, Fixed IncomeAssistant Vice President, Equity Trader
B. There is a list of banks and brokerage firms approved for the establishment of futures trading accounts.
C. Maximum amount which may be hedged is 5% of admitted assets.
6. Residual Commitments
The maximum amount of CMO Residual commitments is limited to $100 million.
7. Mortgage-Backed Securities CommitmentsIn the aggregate, the maximum amount of FHLMC, FNMA, and whole loan commitments is limited to $750 million at bookvalue.
8. Asset-Backed SecuritiesIn the aggregate, the maximum amount of ABS is limited to $250 million at book value.
9. Short Term BorrowingUp to a maximum amount of $100 million, such maximum amount not to exceed $50 million with any one bank or financialinstitution
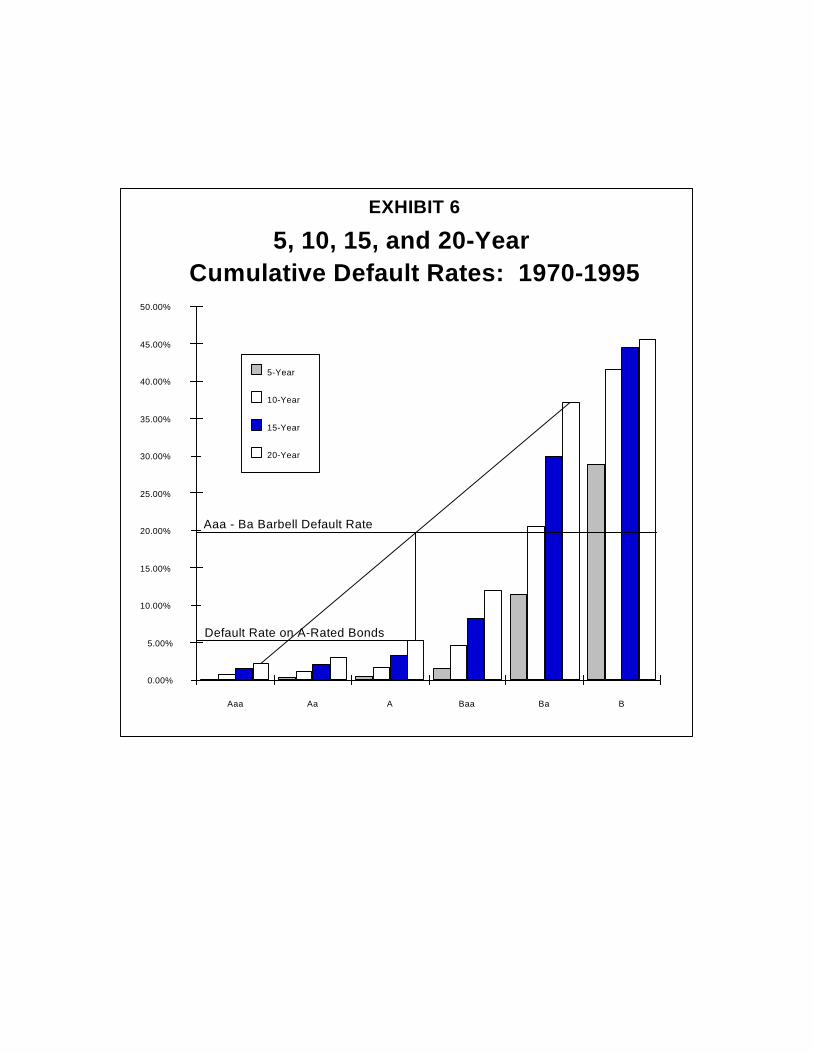
5, 10, 15, and 20-Year Cumulative Default Rates: 1970-1995
0.00%
5.00%
10.00%
15.00%
20.00%
25.00%
30.00%
35.00%
40.00%
45.00%
50.00%
Aaa Aa A Baa Ba B
5-Year
10-Year
15-Year
20-Year
Aaa - Ba Barbell Default Rate
Default Rate on A-Rated Bonds
EXHIBIT 6

23
A decade or so ago, the problem of illiquidity was more pronounced. Policy surrendersfor some companies approached a 60% rate, and massive amounts of policy loans werewithdrawn. The industry has managed this problem in two ways. First, much of the newbusiness written is sensitive to market rates of interest, so that there is not as wide a divergencebetween crediting rates on life policies and annuities vs. market rates of interest. Thus, theincentive to surrender a policy is lessened. Second, policy loans are now mostly offered atvariable rates that track market rates of interest, rather than the fixed policy loan rates of yore.An alternative to the variable rates charged on loans is a process known as “direct recognition,”whereby the schedule of cash value build-up is altered if policy loans are incurred. The taxenvironment has also changed, and interest paid on policy loans is now no longer a deductibleexpense for tax purposes. Thus, the interest rate arbitrage incentive has virtually disappeared.
Not long ago, however, several well known life insurance companies, such as FirstCapital Life, Fidelity Bankers Life, Executive Life of California, Executive Life of New York,and Mutual Benefit experienced severe liquidity problems. But in each of these cases, therewere other factors that precipitated a “run on the bank” phenomenon. The run in each case wascaused, in part, by well publicized investment performance problems. In the case of the firstfour of the above mentioned companies, there were vast sums of policies in force with minimal,and even zero surrender charges. Some of the policies had been marketed through Wall Streetbrokerages, and were therefore of the “hot money” variety. Although the first four of thesecompanies had large amounts of liquid assets, the withdrawal rates were so high that even theseliquid resources were strained. Generally, however, life insurers are managed in such a way asto avoid these runs on the bank, either through policy design, sales channel, investment policy,or level of surplus.
Another problem that was more prevalent a decade ago was that all bonds were es-sentially reported at amortized book values. If a bond was sold prior to maturity, any capitalgain or loss would need to be recognized. Many insurers, particularly during the early 1980s,could not afford to have the large capital losses appear on their books and impact their surplus.Today, however, a large portion of fixed income holdings are placed in accounts available forsale or trading, and are therefore already marked to market. Therefore, whether they are sold ornot does not impact the reported values or the surplus as much.
On the property/casualty side of the business, the liquidity risk comes mostly from eventrisk or catastrophe risk. Most policies do not feature cash values that are easily accessiblethrough surrender, although some policies will allow insureds to cancel prior to maturity andreceive a portion of their premium. Moreover, the policies are typically very short term,renewable annually. With the relatively large surplus positions of most property/casualtyinsurers, most policyholders are willing to ride out a storm, knowing that renewal time willapproach in just a few months.
In terms of the accounting policies of property/casualty companies, they tend to mark-to-market a larger portion of their fixed income securities than life companies, and also tend to holdmore liquid, shorter term securities on average. Thus, their liquidity concerns almost alwaysstem from event risk or catastrophe risk. They can avoid some of these risks by reinsuringportions of their books of business, and by broadly diversifying their risk portfoliosgeographically, by industry, and by type of risk. Alternatively, they can hold large amounts of

24
liquid surplus assets. One leading property/casualty company attempts to keep enough surpluson hand to accommodate a “once in 500 years” event.
We provide some tables that are representative of the practice of liquidity risk mea-surement and management. The company defines liquidity risk as the risk of having inadequatenet cash flows to meet expenses, benefits, withdrawals, and loan payments. It views productliquidity risk as the fluctuations in cash flows outside of the ranges that are expected. It firstranks assets by relative liquidity. It then projects its cash flows over a multiple year horizon onboth sides of the balance sheet using a form like Exhibit 7. For those firms that maintainsegmented accounts by product line, these liquidity reports are generated by product, as in thecase of Exhibit 8.
A company’s asset/liability committee is typically responsible for measuring andmanaging liquidity risk. Despite the lack of concern regarding this risk, there is still a largeamount of analysis that is done to guard against illiquidity. In this regard, liquidity riskdecisions are part of the analytics and scenario testing used by the company. In its investmentplan, management of liquidity risk is two-fold. First, the company uses corporate andRegulation 126 modeling to measure net cash flow under various interest rate scenarios.Second, control is achieved by imposing constraints on investment. One such constraintincludes ensuring that over 50% of the assets are held in “marketable securities.”
Many companies use PTS for most of their analysis and stress testing. The scenariotesting includes about 50-100 scenarios which shift the yield curve, both parallel and slopechanges. For each path created by the scenario, net cash flows must be positive. Solvency ofthe company is also determined along each path. Reports are used for each product, and cashflows are projected out for about 30 years under each of the scenarios. By aggregating acrossproducts for each scenario, the company has an idea of the distribution of liquidity at the firmlevel.
After all the scenario tests, the results have little impact on immediate decisions. Forinstance, if net cash flows were negative for a large portion of the stress tests, this would notimply that asset composition would change immediately. Suggestions would of course be made,but there is no guarantee that the portfolio would change immediately. Similarly, concentrationsare not altered unless there are modifications to limits which would only occur quarterly or an-nually.
In addition to running these scenario tests, there is also a “worst case scenario.” Thisincludes cash outflows of over 300% over a 2-3 year period and a lapse rate of 45%. Forcomparison, the highest lapse rate the company has ever experienced is 18% when it decided todecrease significantly dividends after a long history of either increasing or maintaining dividendpayments.
There are no managers at the companies studied whose performance is based on themanagement of liquidity risk. Although it would be difficult to base everyday compensation onunlikely events, the company may benefit in the future from having a clearer line ofresponsibility with regard to liquidity management. The general procedure is that any ongoingproblems with liquidity would be brought to the attention of the Chief Financial Officer. Any

EXHIBIT 7
Liquidity Report
Life Product XXX Projected Cash Flows
PERIOD ASSET CASH FLOW LIABILITY CASH FLOW NETCASH FLOW
1996
1997
1998
1999
2000
2001
2002
2003
2004
2005
2006
2007
2008
2009
2010
2011
2012
2013
2014
2015

EXHIBIT 8
Relative Liquidity of Assets and Liabilities
Life Product XXX
LIABILITIES*
Current Quarter Prior Quarter -1 Prior Quarter -2 Prior Quarter -3
Level 1 Liquidity
Level 2 Liquidity
Level 3 Liquidity
Level 4 Liquidity
(Levels 1+2)÷Total*Liabilities are net of Policy Loans
ASSETS
Current Quarter Prior Quarter -1 Prior Quarter -2 Prior Quarter -3
Level 1 Liquidity
Level 2 Liquidity
Level 3 Liquidity
Level 4 Liquidity
(Levels 1+2)÷Total
SUMMARY
Current Quarter Prior Quarter -1 Prior Quarter -2 Prior Quarter -3Level 1 (Assets) ÷Level 1 (Liabilities) Level 1 -2 (Assets) ÷Level 1-2 (Liabilities)
Guideline Level 1 -3 (Assets) ÷Level 1-3 (Liabilities)
NOTE: Level 1 Level 2 Level 3 Level 4Liabilities Book Int Grnty Expires Market; Now Allowed Surrender is at: SChg<2% + Scheduled Market & SChg;
Ann Paymts, Book,Next 12 months SChg>2%
Assets Cash, STI Mtg amort Inv Grade Bonds Mtg.; BelowInv Grade Bonds NII over with aggregate Inv Gradewith aggregate Nest 12 months market loss in Bonds;market loss < IMR; excess of IMR Affil; VC:Other Other

25
changes to the company’s credit ratings which could potentially affect liquidity demands arevery much a concern of the auditing group.
E. Other Risks Considered But Not Modeled
Beyond the basic four financial risks, viz., actuarial, systematic, credit and liquidity,insurers have a host of other concerns, as was indicated above. Some of these, like operatingrisk, are a natural outgrowth of their business and insurers employ standard risk avoidancetechniques to mitigate them. Standard business judgment is used in this area to measure thecosts and benefits of both risk reduction expenditures and system designs, as well as operationalredundancy. While generally referred to as risk management, this activity is substantiallydifferent than the management of financial risk addressed here.
Yet there are still other risks, somewhat more amorphous, but no less important. In thislatter category are legal, regulatory, reputational and environmental risk. In each of these riskareas substantial time and resources are devoted to protecting the firm’s franchise value fromerosion. As these risks are less amenable to a priori financial measurement, they are generallynot addressed in any formal, structured way. However, they are not ignored at the seniormanagement level of the insurance firm.
In passing from this topic it is worthwhile and timely to pause to consider one of thelegal risks now encroaching upon the life industry. During the course of our interviews, anumber of firms had been sued in the area of misrepresentation of insurance products byinsurance agents. At the time of this writing, 44 class action lawsuits had been filed againstfirms for their so-called “vanishing premium” policies whose premiums did not vanish, asillustrated, owing to a prolonged decline in market interest rate levels. New class action lawsuitswere being filed at the rate of one every three days. The damages claimed are staggering forsome of the companies.
The manner in which insurers are responding to these lawsuits ranges from attempts togain a quick and comprehensive settlement to attempts to have the arguments heard in court.Some insurers are merely biding their time to see how other firms fare in the struggle. But moreinteresting is how insurers are acting to avoid future problems stemming from alleged agentmisrepresentation. One of the larger firms has established a department of compliance to trainand monitor the behavior of its sales agents. All of its sales and promotional literature isundergoing careful scrutiny by the legal department.
Another firm has created an auditing division to oversee compliance from a centrallocation, computerizing each transaction. Management is concerned with five components ofcompliance: customer satisfaction, new products, stable earnings, expansion capabilities, andcorporate miscellaneous. They are building controls into the centralized computer system.Should an agent exceed the allotted number of address changes, disbursements, lapses, or sales,the computer will not process the policy until the auditing department has had a chance toinvestigate further. These stop measures are not announced to either the customer or the salesagent. The director of auditing indicated that the system is intended to prevent problems ratherthan react to them.
26
A compliance division has been introduced to complement the role of the internal auditgroup. This division is responsible for insuring the field force and also providing training tosales agents so they will better be able to represent the company’s products. This division iscurrently sending out surveys to its customers to find out if they really understand the productsthey now hold. It is hoped that these measures will mitigate any class action suits in the future.
VI. Risk Aggregation and Knowledge of Total Exposure
Thus far, the techniques used to measure, report, limit, and manage individual risks havebeen presented. In each of these cases, a process has been developed, or at least has evolved, tomeasure the risk considered, and techniques have been deployed to control each of them.
The extent of the differences, across risks of different types, is quite striking. Actuarialrisk is carefully modeled, but reported at infrequent intervals. There is often a lack of follow-upto see whether, based on the insurer’s experience, the actuarial assumptions have beenappropriate. Systematic risk, particularly interest rate risk, is typically measured by life insurerson both sides of the balance sheet, and by property/casualty insurers at least on the asset side.Interest rate risk exposure is discerned using measures of effective duration and convexity,scenario simulations, or a combination of the two. For assets it may be reported as often asweekly or monthly, but for liabilities it is generally reported only quarterly or annually. Thecredit risk process is a qualitative review of the performance potential of different bonds andborrowers. It results in a rating, periodic re-evaluation at reasonable intervals through time, andon-going monitoring of various types or measures of exposure. Liquidity risk, on the otherhand, more often than not, is dealt with as a planning exercise, although some reasonable work isdone to analyze the effect of adverse events that affect the firm.
The analytical approaches that are subsumed in each of these analyses are complex,difficult and not easily communicated to non-specialists in the risk considered. The insurer,however, must select appropriate levels for each risk and select, or at least articulate, anappropriate level of risk for the organization as a whole. How can and is this achieved?
The simple answer is “not very well.” Senior management often is presented with amyriad of reports on individual exposures, such as specific credits, and complex summaries ofthe individual risks, outlined above. The risks are not dimensioned in similar ways, andmanagement’s technical expertise to appreciate the true nature of both the risks themselves andthe analyses conducted to illustrate the insurer’s exposure to them is limited. Accordingly, overtime, the managers of specific risks have gained increased authority and autonomy. In light ofrecent losses, however, things are beginning to change.
At the organizational level, overall risk management is being centralized into a RiskManagement Committee, headed by someone designated as the Senior Risk Manager. Thepurpose of this institutional response is to empower one individual, or group, with the re-sponsibility to evaluate overall firm-level risk, and determine the best interest of the company asa whole. At the same time, this group is holding line officers more accountable for the risksunder their control, and the performance of the institution in that risk area. Activity and salesincentives are being replaced by performance compensation which is based, not on businessvolume, but on overall profitability.

27
At the analytical level, aggregate risk exposure is receiving increased scrutiny. To do so,however, requires the summation of the different types of risks outlined above. This isaccomplished in two distinct, but related ways. In the first approach, risk is measured in termsof variability of outcome. Where possible, a frequency distribution of net returns is estimated,from historical data, and the standard deviation of this distribution is estimated. Capital isallocated to activities as a function of this risk or volatility measure. Then, the risky position isrequired to carry an expected rate of return on allocated capital, which compensates the firm forthe associated incremental risk. By dimensioning all risk in terms of loss distributions, andallocating capital by the volatility of the proposed activity, risk is aggregated and priced in oneand the same exercise.
The second approach is similar to the first, but depends less on a capital allocationscheme and more on cash flow or earnings effects of the implied risky position. This approachcan be used to analyze total firm level risk in a similar manner to the first approach. Again, afrequency distribution of net returns from any one type of risk can be estimated from historicaldata. Extreme outcomes can then be estimated from the tail of the distribution. Either a worstcase historical example is used for this purpose, or a three or four standard deviation outcome isconsidered. Given the downside outcome associated with any risk position, the firm restricts itsexposure so that, in the worst case scenario, the insurer does not lose more than a certainpercentage of its surplus or current income. Therefore, rather than moving from volatility ofequity value through capital, this approach goes directly to the current earnings implicationsfrom a risky position. The approach, however, has two very obvious shortcomings. It is cashflow based, rather than market value driven; and it does not necessarily directly measure the totalvariability of potential outcomes through a priori distribution specification. Rather, it dependsupon a subjectively pre-specified range of the risky environments to drive the worst-casescenario.
Both measures attempt to treat the issue of trade-offs among risks using a commonmethodology to transform the specific risks to firm-level exposure. In addition, both canexamine the correlation of different risks and the extent to which they can, or should be viewedas offsetting. As a practical matter, however, only two of the insurers interviewed that wereusing these approaches viewed the array of risks as a standard portfolio problem. Rather, theyseparately evaluate each risk and aggregate total exposure by simple addition. As a result, muchis lost in the aggregation. Perhaps over time this crucial issue will be addressed more widely.
VII. Areas Where Further Work Will Improve Methodology
The insurance industry is clearly evolving to a higher level of risk managementtechniques and approaches than had been in place in the past. Yet, as this review indicates, thereis significant room for improvement. Before the areas of potential value added are reviewed,however, it is worthwhile to reiterate an earlier point. The risk management techniquesreviewed here are not the average, but the techniques used by firms at the higher end of themarket. The risk management approaches at smaller institutions, as well as larger but relativelyless sophisticated ones, are less precise and significantly less analytical. In some cases they
28
would need substantial upgrading to reach the level reported here. Accordingly, our reviewshould be viewed as a glimpse at best practice, not average practices.
Nonetheless, the techniques employed by those that define the industry standard coulduse some improvement. By category, recommended areas where additional analytic work wouldbe desirable are listed below.
A. Actuarial Risk
There remains too much disagreement in the most fundamental area of actuarial science— namely, what discount rate or rates does one use to value insurance liabilities.17 With suchbroad disagreement about what insurance is worth, or what it will cost the insurer, it is littlewonder that we encounter difficulties when it comes to managing risk. On the bright side, itmust be acknowledged that there is a flurry of activity taking place directed toward solving thisconundrum. In our opinion, as the scope of what exactly is being valued is more carefullydefined, there is a convergence in the estimates produced by the alternative valuation methods.18
During the past decade the tools have been developed that can take into account theinterest rate sensitivity of policy cash flows. However, many insurers have not employed thesetools. Among those who have, there is a severe problem with the data inputs that are necessaryto produce useful output. Insurers have not tracked or organized their lapse, surrender andclaims data in a manner that allows them to accurately model their interest rate sensitivity.While the models are capable of accommodating virtually any functional form of this behavior,including the effects of policy seasoning, channel of distribution, and so forth, little data exist toestimate the functional form. Of course, this was also the case with regard to the modeling ofmortgage-backed securities prepayment a decade ago, but since that time data were collected andanalyzed, allowing for the enlightened application of the valuation tools that we see today in thatsector. We expect that the same will be true for insurers in a few more years.
Another area where we expect to see rapid improvement is in the versatility of theactuarial software and its speed. Currently, only single-factor stochastic models are beingwidely used. This results in output that is inconsistent with the other side of the balance sheet,where two or more factors are typically used. Moreover, the speed of processing is so slow thatinsurers make undesirable compromises when it comes to fully modeling their products.Emerging computer technology undoubtedly will remove this impediment to better policypricing and risk analysis.
B. Systematic Risk
Tremendous progress has already been made over the past five years in this arena. Mostof it has been directed toward interest rate risk management, which is appropriate given itsimportance to insurers. An important area for further development is the incorporation of basisrisk and equity risk. Another important advance will be a consistent valuation methodology forboth sides of the balance sheet.
While simulation studies have substantially improved over the past few years, the use ofbook value accounting measures and cash flow losses continues to be problematic. Movements

29
to improve this methodology will require increased emphasis on market-based accounting. Sucha reporting mechanism must be employed on both sides of the balance sheet, however, not justthe asset portfolio.
The simulations also need to incorporate the advances in dynamic hedging that are usedin complex fixed income pricing models. As it stands, these simulations tend to be rathersimplistic, and scenario testing is rather limited.
C. Credit Risk
The evaluation of credit rating continues to be an imprecise process. We notedivergence’s between the NAIC ratings assigned to particular public and private placements vs.the ratings assigned by the Wall Street ratings agencies. We should never expect to see acomplete convergence here, as there is no single set of weights to apply to the risk factors acrossall industries and firms. However, we do expect to see less divergence over time, as morebecomes known about the factors that lead to default.
We also expect to see more enlightened practices when it comes to aggregating creditrisks. A sensible aggregation scheme would take into account default rates, default losses, andthe shape of the distribution of losses across all ratings categories. In time we may even see amove toward market-based default measures, at least on publicly traded debt instruments. Weanticipate that credit risks will soon be evaluated in a framework consistent with other financialrisks. Some insurers are already moving in this direction.
D. Liquidity Risk
For the life companies, this seems to be the least of their major financial risks. Mostcompanies are doing a satisfactory job of managing this risk. With the advent of mark-to-marketaccounting, the problems for liquidity caused by the fiction of book accounting will graduallysubside. Most life insurers model this risk well. In the property/casualty sector, it remains alarge risk. Crisis models need to be better linked to operational details. In addition, theusefulness of such exercises is limited by the realism of the environment considered.
If liquidity is to be managed, the price of illiquidity must be defined and build intoilliquid positions. While this logic has been adopted by some institutions, this pricing ofliquidity is not commonplace.
E. Firm Level Risk
The ability of insurance companies to estimate and manage firm level risk is a long wayoff. To reach this goal requires much more precision in the estimation and management of theindividual risks within the firm. Aggregation only has meaning to the extent that the individualelements can be aggregated. This presumes that they are measured correctly, dimensioned in asimilar manner, and incorporated in a unified framework of risk. When this is accomplished,risks of different types will be contrasted and compared, and trade offs will become possible.However, to achieve this requires a significant amount of work on the individual risks within theindustry before any reasonable aggregation can transpire.

30
References
Altman, E. I. and I. T. Vanderhoof, editors, Fair Value of Insurance Liabilities, Irwin Press,forthcoming 1996.
Alexander, J. N., P. J. Bouyoucos, M. H. Siegel, and A. Gola, “The Goldman Sachs Insurer CIOSurvey,” Industry Resource Group, May 1994.
Babbel, D. F., “A Perspective on Model Investment Laws for Insurers” C.L.U. Journal, September1994.
Babbel, D. F., “Financial Valuation of Insurance Liabilities,” Fair Value of Insurance Liabilities,E. Altman and I. T. Vanderhoof, editors, Irwin Press, forthcoming 1996.
Babbel, D. F., “Asset-Liability Matching in the Life Insurance Industry” The Financial Dynamicsof the Insurance Industry, E. Altman and I. T. Vanderhoof, editors, Irwin Press, 1994.
Babbel, D. F. and D. R. Klock, “Insurance Pedagogy: Executive Opinions and Priorities” Journalof Risk and Insurance, December 1988.
Babbel, D. F. and D. R. Klock, “Measuring the Interest Rate Sensitivity of Property/ CasualtyInsurer Liabilities” Insurance, Risk Management, and Public Policy, S. G. Gustavson andS. E. Harrington, editors, Kluwer Press, 1993.
Babbel, D. F. and J. Lamm-Tennant, “Trends in Asset/Liability Management for Life Insurers”Insurance Perspectives, Goldman Sachs, November 1987.
Babbel, D. F., C. B. Merrill, and W. Panning, “Default Risk and the Effective Duration of Bonds”Financial Analysts Journal, forthcoming 1996.
Babbel, D. F., R. Stricker, and I. T. Vanderhoof, “A Modern Approach to PerformanceMeasurement for Insurers” Operations Research Models in Quantitative Finance, R. L.D’Ecclesia and S. A. Zenios, editors, Physica-Verlag, 1994.
Barton, E., G. Bodnar, and A. Kaul, “Exchange Rate Variability and the Riskiness of U.S.Multinational Firms: Evidence from the Breakdown of the Bretton Woods System,”Working Paper 94-6, Wharton Weiss Center, 1994.
Beard, R. E., T. Pentikäinen, and E. Pesonen, Risk Theory, 3rd ed., Chapman and Hall, NewYork, 1984.
Beaver, W. H. and G. Parker, Risk Management, Problems and Solutions, McGraw Hill, NewYork, 1995.
Black, K. Jr. and H. D. Skipper, Jr., Life Insurance, 12th ed., Prentice Hall, Englewood Cliffs,N.J., 1994.
31
Bouyoucos, P. J. and M. H. Siegel, “The Goldman Sachs Insurer CIO Survey,” Industry ResourceGroup, October 1992.
Brander, J., and T. Lewis, “Oligopoly and Financial Structure: The Limited Liability Effect,”American Economic Review, December 1986.
Breeden, D., and S. Viswanathan, “Why Do Firms Hedge? An Asymmetric InformationModel,” Working Paper, Duke University, 1990.
Campbell, T., and W. Kracaw, Financial Risk Management: Fixed Income and ForeignExchange, Harper Collins, New York, 1993.
Campbell, T., and W. Kracaw, “Information Production, Market Signaling and the Theory ofFinancial Intermediation,” Journal of Finance, 1980.
Choi, J. H., “Estimating Market Value of Loss Payments of Property/Liability InsuranceCompanies Using Modern Valuation Technology,” Working Paper, Wharton School,1992.
Cummins, J. D. and R. A. Derrig, Financial Models of Insurance Solvency, Kluwer AcademicPublishers, Boston, 1989.
Cummins, J. D. and G. Grace, “Tax Management and Investment Strategies of Property-Liability Insurers,” Journal of Banking and Finance, 1994.
DeMarzo, P., and D. Duffie, “Corporate Incentives for Hedging and Hedge Accounting,”Working Paper, Northwestern University, 1992.
Doherty, N. A., Corporate Risk Management: A Financial Exposition, McGraw Hill, 1985.
Fazzari, S. M., R. G. Hubbard, and B. C. Petersen, “Financial Constraints and CorporateInvestment,” Brookings Papers on Economic Activity, 1988.
Fite, D., and P. Pfleiderer, “Should Firms Use Derivatives to Manage Risk?” in Risk Man-agement Problems and Solutions, (Beaver and Parker, eds.) McGraw Hill, New York,1995.
Froot, K., D. Scharfstein, and J. Stein, “A Framework for Risk Management,” Harvard BusinessReview, November 1994.
Froot, K., D. Scharfstein, and J. Stein, “Risk Management: Coordinating Investment andFinancing Policies,” Journal of Finance, December 1993.
Geezy, D., B. Minton, and C. Schrand, “Why Firms Hedge: Distinguishing Among ExistingTheories,” Working Paper, 1995.
Gennotte, G. and D. Pyle, “Capital Controls and Bank Risk,” Journal of Banking and Finance,September 1991.

32
Gerber, H. U., An Introduction to Mathematical Risk Theory, Richard D. Irwin, Inc.,Homewood, Illinois, 1979.
Greenawalt, M. and J. Sinkey, “Bank Loan Loss Provisions and the Income SmoothingHypothesis: An Empirical Analysis,” Journal of Financial Services Research, December1988.
Helfat, C. and D. Teece, “Vertical Integration and Risk Reduction,” Journal of Law, Economicsand Organization, Spring 1987.
Hoshi, T., A. Kashyap, and D. Scharfstein, “Corporate Structure, Liquidity, and Investment:Evidence from Japanese Industrial Groups,” Quarterly Journal of Economics, 1991.
Huber, P. W., Liability: The Legal Revolution and Its Consequences, Basic Books, 1988.
Jorion, P., “The Pricing of Exchange Rate Risk in the U.S. Equity Markets,” Journal ofFinancial and Quantitative Analysis, July 1991.
Lamm-Tennant, J., “Asset/Liability Management for the Life Insurer: Situation Analysis andStrategy Formulation,” Journal of Risk and Insurance, September 1989.
Lamm-Tennant, J., “Survey and Commentary on Investment Policies and Practices of the U.S.Insurance Industry,” Chalke Incorporated, Chantilly, Virginia, 1994.
Lamm-Tennant, J. and D. Gattis, “Survey and Commentary on Investment Policies and Practicesof the U.S. Insurance Industry,” SS&C, Bloomfield, Connecticut, 1996.
Lamm-Tennant, J. and T. Rollins, “Incentives for Discretionary Accounting Practices:Ownership Structure, Earnings and Taxation,” Journal of Risk and Insurance, September1994.
Litterman, R. and K. Winkelmann, “Managing Market Exposure,” Risk Management Series,Goldman, Sachs & Co., New York, January 1996.
Marcus, A., “Deregulation and Bank Financial Policy,” Journal of Banking and Finance,December 1984.
Maksimovic, V., “Capital Structure in Reported Oligopolies,” Rand Journal of Economics,Augumn 1988.
Merton, R. C., “Financial Innovation and the Management and Regulation of Financial Insti-tutions,” Journal of Banking and Finance, June 1995.
Merton, R. C., “On the Application of the Continuous-Time Theory of Finance to FinancialIntermediation and Insurance,” Geneva Papers on Risk and Insurance, July 1989.
Millette, M. J., A. J. Levinson and J. A. Oleinick, “The Goldman Sachs Insurer CIO Survey,”Industry Resource Group, June 1996.

33
Moody’s Investor Services, Moody’s Credit Ratings and Research, Moody’s 1995.
Myers, S. C., “Determinants of Corporate Borrowing,” Journal of Financial Economics, 1990.
Nance, D. R., C. W. Smith, and C. W. Smithson, “On the Determinants of Corporate Hedging,”Journal of Finance, 1993.
Oldfield, G. and A. Santomero, “The Place of Risk Management in Financial Institutions,”Working Paper, Wharton Financial Institutions Center, 1995.
Ross, S., “The Determination of Financial Structure: The Incentive Signaling Approach,” BellJournal of Economics, Spring 1977.
Ross, S., “The Economic Theory of Agency: The Principal’s Problem,” American EconomicReview, May 1973.
Santomero, A., “Financial Risk Management: The Whys and Hows,” Financial Markets,Institutions, and Investments, December 1995.
Santomero, A., “Commercial Bank Risk Management: An Analysis of the Process,” WorkingPaper, Wharton Financial Institutions Center, 1995.
Santomero, A., “The Changing Structure of Financial Institutions: A Review Essay,” Journal ofMonetary Economics, 1989A.
Scholes, M., G. P. Wilson and M. Wolfson, “Tax Planning, Regulatory Capital Planning andFinancial Reporting Strategy for Commercial Banks,” Review of Financial Studies, 1990.
Siegel, M. H., M. J. Millette and D. Pouraghabagher, “The Goldman Sachs Insurer CIO Survey,”Industry Resource Group, April 1995.
Smith, C. W. and R. Stulz, “The Determinants of Firm’s Hedging Policies,” Journal ofFinancial and Quantitative Analysis, 1985.
Smith, C. W., C. Smithson, and D. Wilford, Strategic Risk Management, Harper and Row, NewYork, 1990.
Smith, M. L., “The Life Insurance Policy as an Options Package,” Journal of Risk and Insurance,September 1982.
Staking, K. B. and D. F. Babbel, “The Relation between Capital Structure, Interest RateSensitivity, and Market Value in the Property-Liability Insurance Industry,” Journal ofRisk and Insurance, December 1995.
Stulz, R., “Optimal Hedging Policies,” Journal of Financial and Quantitative Analysis, 1984.
Warner, J., “Bankruptcy Costs: Some Evidence,” Journal of Finance, May 1977.

34
Weiss, L., “Bankruptcy Resolution: Direct Costs and Violation of Priority Claims,” Journal ofFinance and Economics, 1990.

36
Footnotes
1Members of the team included Anthony Santomero (leader), David Babbel, Yuval Bar-Or, Richard Herring, Paul Hoffman, Susan Kerr, Spencer Martin, Steve Pilloff, JeffreyTrester, and Sri Zaheer.2See Alexander et al [1994], and Siegel, Millette and Pouraghabagher [1995].3See Lamm-Tennant [1995] and Lamm-Tennant and Gattis [1996].4See, for example, Merton [1989, especially pp. 242-258].5See Oldfield and Santomero [1995].6Our discussion of these risks follows that of Black and Skipper [1994].7See Huber [1988].8See Black and Skipper [1994] and Beard, Pentikäinen, and Pesonen [1984], Gerber[1979], and Cummins and Derrig [1989].9See M. Smith [1982].10The value of the policy loan option by itself could account for 20-45% of the presentvalue of all future insurance premiums, if the option were used optimally. Whenfactoring in the suboptimal utilization of this option, he estimated that the cost to aninsurer of providing this option was in the 8-12% range. Yet insurers had historicallycharged nothing for this option. Indeed, it was simply mandated that insurers begin tooffer this option.11Measures of interest rate sensitivity which take into account the interest-sensitive cashflows of an asset or liability stream are referred to as “effective duration and convexity,”or alternatively, “option-adjusted duration and convexity.” Measures of interest ratesensitivity which assume all cash flows are fixed, or at least insensitive to movements ininterest rates, include “modified duration and convexity” and “Macaulay duration.”12For example, we estimated the duration on a block of participating whole life policiesfor one mutual company. Its Macaulay duration was around 22 years, while its effectiveduration was approximately 5.6. See Lamm-Tennant [1989] for a revealing survey ofthe level of sophistication in understanding and applying duration and Babbel [1994] fora discussion of the pitfalls in using the older duration measures.13See Babbel and Klock [1993].14See Choi [1992].15See Babbel [1996] for an explanation.16See Babbel, Merrill and Panning [1996] for an explanation of the correction procedure.17See Altman and Vanderhoof [1996].18See Babbel [1996].