by analyst market perspective & investment outlook · by daisy tolles, cfa analyst in the third...
TRANSCRIPT

BY Daisy Tolles, CFAAnalyst
In the third quarter of 2015, investors saw heightened volatility across global markets. In fact,
the U.S. saw its first stock market correction since 2011, with the S&P 500 falling 12.35%
between May 21 and August 25.1 Volatility increased when China devalued its currency
during the first week of August, signaling a potential economic slowdown. With China being
the largest consumer of most commodities, fears over a slowdown in China echoed broader
concerns about global growth, as a decline in demand for global commodities puts pressure
on commodity exporters – particularly the emerging market (EM) countries. Brazil and Russia,
both of which rely on Chinese demand for their exports, are already in recessions. Moreover,
countries dependent on oil exports have been hurt by low oil prices. Slowing global growth
likely fed into the Federal Reserve’s decision not to initiate a rate hike in September, as had
been previously expected earlier in the year.
Market Perspective& Investment OutlookMarket Perspective& Investment Outlook
INVESTED WINTER 2016
The slowdown we’re seeing in emerging market economies comes after a decade of expansion. Historically, each recent decade experienced a major bubble that eventually unwound. Once a bubble deflates, its growth trajectory over the next decade tends to be sluggish. This was the case with Japan in the 1990s after the country’s vast expansion in the 1980s, as well as with technology stocks in the 2000s after that sector’s rise in the 1990s. Now, we are seeing signs that the EM bubble that developed in the 2000s is unwinding. In the first decade of the 2000s, money poured into EM countries. When China was admitted to the World Trade Organization in 2001, the country – with its rapidly expanding manufacturing base and aggressive urbanization and infrastructure development plan – was seen as a primary driver of growth. The heightened investment activity in China created high levels of demand for raw materials and commodities, produced in countries such as Brazil, Russia, Indonesia, and South Africa. This demand in turn caused commodity prices to rise, while global investors all wanted a piece of the growth. Later in the decade, the combination of the construction-intensive economic program in China and stimulative monetary policies stemming from the global financial crisis of 2008 further drove up demand and commodity prices. At the same time, the over-construction in China created a real estate bubble and led to vacancies, in new buildings and new cities alike, throughout the country.
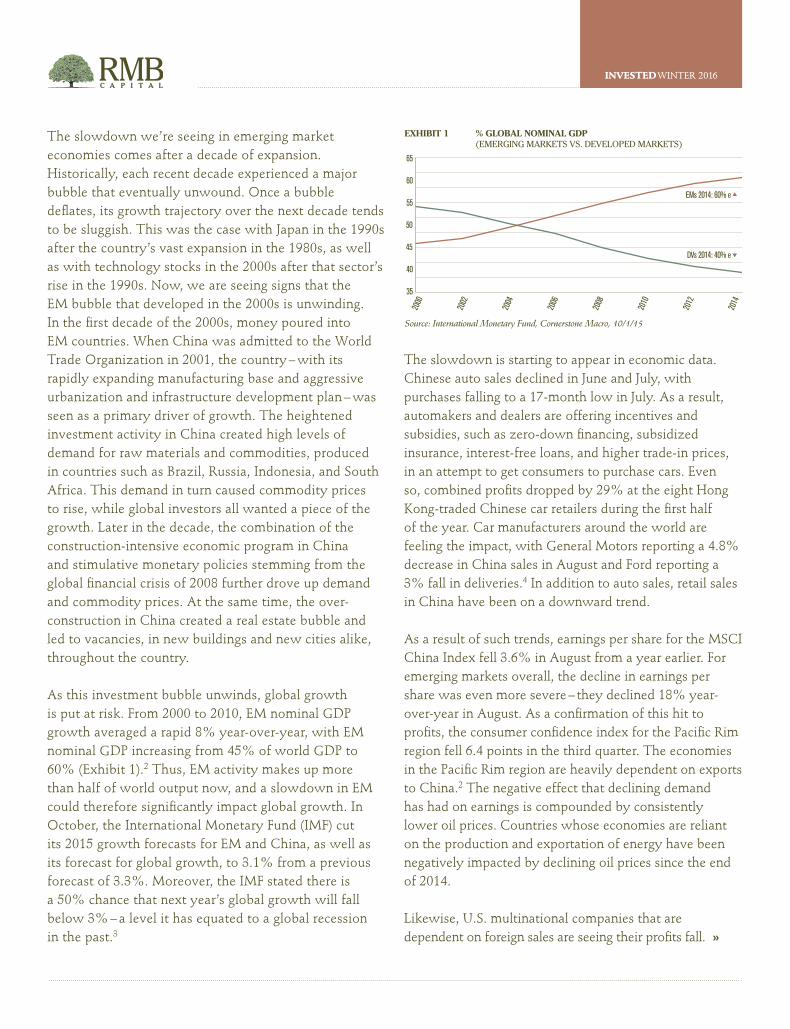
As this investment bubble unwinds, global growth is put at risk. From 2000 to 2010, EM nominal GDP growth averaged a rapid 8% year-over-year, with EM nominal GDP increasing from 45% of world GDP to 60% (Exhibit 1).2 Thus, EM activity makes up more than half of world output now, and a slowdown in EM could therefore significantly impact global growth. In October, the International Monetary Fund (IMF) cut its 2015 growth forecasts for EM and China, as well as its forecast for global growth, to 3.1% from a previous forecast of 3.3%. Moreover, the IMF stated there is a 50% chance that next year’s global growth will fall below 3% – a level it has equated to a global recession in the past.3
The slowdown is starting to appear in economic data. Chinese auto sales declined in June and July, with purchases falling to a 17-month low in July. As a result, automakers and dealers are offering incentives and subsidies, such as zero-down financing, subsidized insurance, interest-free loans, and higher trade-in prices, in an attempt to get consumers to purchase cars. Even so, combined profits dropped by 29% at the eight Hong Kong-traded Chinese car retailers during the first half of the year. Car manufacturers around the world are feeling the impact, with General Motors reporting a 4.8% decrease in China sales in August and Ford reporting a 3% fall in deliveries.4 In addition to auto sales, retail sales in China have been on a downward trend.
As a result of such trends, earnings per share for the MSCI China Index fell 3.6% in August from a year earlier. For emerging markets overall, the decline in earnings per share was even more severe – they declined 18% year-over-year in August. As a confirmation of this hit to profits, the consumer confidence index for the Pacific Rim region fell 6.4 points in the third quarter. The economies in the Pacific Rim region are heavily dependent on exports to China.2 The negative effect that declining demand has had on earnings is compounded by consistently lower oil prices. Countries whose economies are reliant on the production and exportation of energy have been negatively impacted by declining oil prices since the end of 2014.
Likewise, U.S. multinational companies that are dependent on foreign sales are seeing their profits fall. »
45
65
EMs 2014: 60% e
DVs 2014: 40% e
60
55
50
35
40
EXHIBIT 1 % GLOBAL NOMINAL GDP(EMERGING MARKETS VS. DEVELOPED MARKETS)
Source: International Monetary Fund, Cornerstone Macro, 10/1/15
2000
2002
2004
2006
2008
2010
2012
2014
INVESTED WINTER 2016

In the second quarter of 2015, foreign profits of U.S. companies declined 3.1% year-over-year.2 In addition to declining overseas demand, U.S. multinational companies have been further hit by a stronger dollar. Earnings for companies that see more than 50% of their revenue come from outside of the U.S. declined 11% in the third quarter. In contrast, earnings for companies that see more than 50% of their sales from within the U.S. showed a 5% gain over the quarter from a year earlier.5 Therefore, we expect to see domestic corporate profits decouple from foreign profits, and domestically focused companies should continue to do well.
On its own, the U.S. economy continues to show signs of strength. While the IMF lowered its growth forecasts for many parts of the world in October, the U.S. forecasts are in a rising trend. Growth is slower than average because of the global weakness, but it should continue to be solid (Exhibit 2).
There are several factors underlying continued growth in the U.S. For starters, government spending is likely to pick up, which would reduce fiscal drag’s negative impact on GDP growth. We are already seeing a rise in spending by state and local governments, which should boost total government spending. And the decline in the U.S. federal budget deficit, stemming from reduced spending and the tax increases of 2013, should encourage more federal spending. The deficit as a percentage of GDP has fallen to less than one-third of its 2009 peak level and to below its historical average (since 1930) of 3.2% (Exhibit 3). As a result, total government spending is expected to grow approximately
2% in 2016, which will help lift overall GDP.6
In addition, despite weaker jobs data recently, the U.S. unemployment rate remains at a seven-year low, while wages are beginning to turn upward. This should further support the U.S. consumer, who already has a strong footing. Household net worth is 24% above the prior peak reached in 2007, and household debt payments as a percentage of disposable personal income are 26% below their peak, signifying that households have significantly delevered (Exhibits 4A and 4B).7 A strong employment situation, rising income levels, and well-positioned consumers should in turn boost spending, which has been surprisingly weak throughout this economic recovery. In fact, consumer spending could rise as much as 3.5% in 2016.6 Rising U.S. housing prices could also add momentum to increasing personal income levels and, therefore, to consumer spending. Moreover, the low-inflation environment means that consumers won’t see their real purchasing power erode. Low inflation also signifies that the current expansion could last for another few years. The last four low-inflation recoveries prior to the current one averaged 33 quarters in length, with a range of 24 to 40 quarters. The current expansion, which started in June 2009, would therefore have to last about another eight quarters just to be average.6
Based on our expectation that the U.S. expansion has more years left, we expect the U.S. to decouple from the rest of the world as it continues to demonstrate economic strength in the face of global headwinds. However, this does not mean that we expect financial
2%
4%
0%
-4%
-2%
-6%
-8%
-10%
-12%
EXHIBIT 3 U.S. FEDERAL GOVERNMENT BUDGET BALANCE(AS A PERCENTAGE OF GDP)
Source: Goldman Sachs, 8/26/15
’00 ’01 ’02 ’03 ’04 ’05 ’06 ’07 ’08 ’09 ’10 ’11 ’12 ’13 ’14 ’15 ’16 ’17
2.31.2
-1.5
AverageSince 1930:
-3.2%
Forecasts
-3.3 -3.4-2.5
-1.8-1.1
-3.1
-9.8-8.7 -8.5
-6.8
-4.1-2.8 -2.4 -2.8 -2.6
8%
10%
6%
2%
4%
0%
-2%
-4%
-6%
EXHIBIT 2 U.S. REAL GDP(YEAR-OVER-YEAR PERCENTAGE CHANGE)
Source: J.P. Morgan Asset Management, 9/30/15
1970
1975
1980
1985
1990
1995
2000
2005
2010
2015
Average:2.9%
Real GDP 2Q15YoY % chg: 2.7%QoQ % chg: 3.9%
ExpansionAverage:
2.2%
INVESTED WINTER 2016

$90,000 3Q15: $84,335
2Q07: $67,858$80,000
$70,000
$60,000
$50,000
$40,000
$30,000
$20,000
$10,000
EXHIBIT 4A HOUSEHOLD NET WORTH(NOT SEASONALLY ADJUSTED, USD BILLIONS)
Source: J.P. Morgan Asset Management, 9/30/15
1990
1992
1994
1996
1998
2000
2002
2004
2006
2008
2010
2012
2014
14%
13%
12%
11%
10%
9%
EXHIBIT 4B HOUSEHOLD DEBT SERVICE RATIO(SEASONALLY ADJUSTED DEBT PAYMENTS AS APERCENTAGE OF DISPOSABLE PERSONAL INCOME)
Source: J.P. Morgan Asset Management, 9/30/15
1980
1985
1990
1995
2000
2005
2010
2015
1Q80:10.6%
4Q07:13.2%
3Q15:9.8%
markets to consistently rise in tandem. The Fed is likely to raise rates going forward, even though rates should now stay low for longer as a result of global weakness. The uncertainty surrounding a rate rise will make fixed income markets volatile, and we maintain our short-duration bias in expectation of rising rates in the future. On the equity side, stretched valuation levels for U.S. stocks should lower potential returns going forward. The forward and trailing P/E ratios for the S&P 500 are both above long-term average levels. On the other hand, forward P/E ratios for Europe and Japan look relatively cheaper, with Japan’s P/E actually below average by 15%. Therefore, we continue to feel comfortable with our allocations to developed international stocks. While emerging market equities are also relatively less expensive, we maintain our cautious outlook for that region based on the deteriorating fundamentals discussed above.
Overall, the combination of stretched equity valuations and low interest rates will create additional volatility. In the face of such volatility, we will monitor the investment universe to identify any opportunities that may arise.
Flash Update: The U.S. regained momentum in the fourth quarter, after a global slowdown rattled markets in the third quarter. Rebounding from lackluster job growth in August and September, U.S. payrolls in October had their largest rise since December 2014. November also produced a strong jobs report, meeting market and Fed expectations. Average hourly earnings have been rising gradually, which has helped breed strong automobile sales – 2015 is on track to be the U.S. auto industry’s best sales year ever. With the support of this positive data, the rate hike that was announced in the December Fed meeting was no surprise. However, we expect tightening to proceed slowly and cautiously, given continuing concerns about global growth, growing geopolitical tensions, and increased market volatility.
1 Crandall, Pierce & Company, “Bulls, Bears & Corrections: Frequency, Magnitude and Duration,” August 31, 2015.2 Cornerstone Macro Economic Research, “CSM’s Global GDP Outlook: Global Recession in 1H of 2016? No and Yes,” October 1, 2015.3 International Monetary Fund, October 6, 2015.4 Bloomberg, September 8, 2015.5 FactSet, “Earnings Insight,” November 6, 2015.6 Cornerstone Macro Economic Research, “CSM’s U.S. Economic Outlook: Where Will You Be When the Next U.S. Recession Starts?” September 21, 2015.7 J.P. Morgan Asset Management, “The Guide to the Markets,” September 30, 2015.
INVESTED WINTER 2016

The opinions and analyses expressed in this communication are based on RMB Capital Management LLC’s research and professional experience, and are expressed as of the date of our mailing of this communica-tion. Certain information expressed represents an assessment at a specific point in time and is not intended to be a forecast or guarantee of future results, nor is it intended to speak to any future time periods. RMB Capital makes no warranty or representation, express or implied, nor does RMB Capital accept any liability, with respect to the information and data set forth herein, and RMB Capital specifically disclaims any duty to update any of the information and data contained in this communication. The information and data in this communication do not constitute legal, tax, accounting, investment, or other professional advice.
Index Descriptions
• The S&P 500 is widely regarded as the best single gauge of the U.S. equity market. It includes 500 leading companies in leading industries of the U.S. economy. The S&P 500 focuses on the large-cap segment of the market and covers approximately 75% of U.S. equities.
• The MSCI China Index captures large- and mid-cap representation across China H shares, B shares, red chips, and P chips. With 143 constituents, the index covers about 85% of this China equity universe.
An investment cannot be made directly into an index. The index data assumes reinvestment of all income and does not account for fees, taxes, or transaction costs. The investment strategy and types of securities held by the comparison index may be substantially different from the investment strategy and types of securities held by your account or private fund.
INVESTED WINTER 2016