bw lpg nok hold 37.00 39.89 nm nm 33.0 equity research …€¦ · dorian lpg usd hold 8.50 7.95 nm...
TRANSCRIPT

IMO 2020 UPDATE
2,052 scrubbers so far The latest scrubber data from DNV GL show an accelerating increase in planned scrubber installations during 2019. The pre-2020 total of scrubber-fitted vessels now stands at 2,052, quickly closing in on our 2,300 forecast. Dry bulk has the majority of this month’s additions. The accelerating uptake for 2019 installation indicates still-available capacity in our view, and our estimate is looking increasingly conservative.
Latest DNV GL numbers show 2,052 installed by end-2019. After increasing its
forecasts for 2019 scrubber uptake by 22% last month, this month’s numbers show a
further 23% increase, to take scheduled scrubber uptake for end-2019 to 2,052.
DNB Markets’ 2,300 forecast starting to look conservative, as 502 scrubbers were
added to the pre-2020 orderbooks during the last month. This is up from the 282
increase last month, and we still have 14 months to go before the regulations kick in.
Dry bulk uptake growth accelerating 2.0x from last month. Dry bulk was
responsible for 51% (255) of the additions in the latest revisions, while 17% (87) was
for tankers and 9% (45) for container ships.
2019 installations balloon 52%, to 1,268, with only 105 booked for 2020. The
latest data show 1,268 scrubber installations are planned for 2019 (up 52%, or 432
units from 836 reported in October), while only 37 additions leave 2020 installations at
105. We see the accelerating growth in 2019 as a sign of still-available capacity, and
are likely to see continued additions ahead, though the minor uptick for 2020 could
indicate tighter pre-2020 scrubber availability.
Shipping vs OSEBX (12m)
Source: Factset
EQUITY RESEARCH 2 November 2018
Research report prepared by DNB Markets, a division of DNB Bank ASA
This report was completed and disseminated at 7:51 CET on 02 November 2018
70
80
90
100
110
120
Oct Dec Feb Apr Jun Aug Oct
Shipping OSEBX (Rebased)
Target Share
Company Cur Rec Price Price P/E 18e P/E 19e P/E 20e
A. P. Møller Mærsk DKK BUY 10400 8364 nm 13.4 10.1
Avance Gas NOK HOLD 22.00 21.10 nm nm 11.2
BW LPG NOK HOLD 37.00 39.89 nm nm 33.0
D/S Norden DKK BUY 139.00 91.10 nm 24.6 8.4
DHT Holdings USD BUY 7.60 5.03 nm 56.7 5.2
Dorian LPG USD HOLD 8.50 7.95 nm nm nm
Eagle Bulk Shipping USD BUY 6.30 4.99 37.5 10.6 4.7
Epic Gas NOK BUY 19.40 10.50 6.0 2.0 1.3
Euronav USD BUY 14.80 9.20 nm nm 9.7
Flex LNG NOK BUY 22.30 14.80 nm 24.4 7.0
Frontline NOK BUY 60.00 61.05 nm 18.4 6.4
GasLog USD BUY 19.90 20.46 31.4 20.7 10.3
Genco Shipping & Trading USD BUY 19.20 11.02 13.5 3.9 2.7
Golar LNG USD BUY 43.00 26.78 nm nm nm
Golar LNG Partners USD SELL 11.10 14.11 17.6 27.6 16.4
Golden Ocean NOK BUY 95.00 63.25 9.9 5.2 4.0
Hunter Group ASA NOK BUY 5.30 3.92 nm nm 6.2
Höegh LNG Holdings NOK BUY 63.00 39.25 8.1 7.3 6.0
Höegh LNG Partners USD HOLD 19.10 17.81 9.7 11.6 11.9
MPC Container Ships NOK BUY 70.00 40.60
Odfjell NOK BUY 44.00 30.50 nm 12.5 5.3
Safe Bulkers USD BUY 3.80 2.53 9.8 3.7 2.7
Scorpio Tankers USD BUY 3.00 1.79 nm nm nm
Stolt-Nielsen NOK BUY 172.0 113.4 7.6 4.7 4.3
Teekay Tankers USD BUY 2.00 1.11 nm 7.8 1.8
Wallenius Wilhelmsen ASA NOK BUY 49.00 28.90 13.2 6.2 5.0
Wilh. Wilhelmsen Holding NOK BUY 273.0 170.0 4.3 6.1 5.2
Source: DNB Markets
ANALYSTS
Nicolay Dyvik
+47 24 16 91 87
Jørgen Lian
+47 24 16 91 88
Mats Bye
+47 24 16 91 86
Please see the last two pages for important information. This research report was not produced in the US.Analysts employed by non-USaffiliates are not registered/qualified research analysts with FINRA in the United States.

DNB Markets
02 November 2018
2
502 scrubbers added to DNV GL’s end-2019 forecast DNV GL’s updated scrubber uptake data shows a 502 (23%) increase MOM (which is up from
the 282, or 22%, revision for October) in the number of scrubbers scheduled to be fitted by end-
2019. This lifts the total to 2,052 from 1,268 in our initial report on scrubber uptake from 13
September and the 1,550 reported a month ago. This compares to DNB Market’s 2,300
estimate, which now seems rather conservative given that more than 500 scrubbers were added
in a month and we still have 14 months to go, despite reports that the main scrubber producers
are nearing full order books for pre-2020 delivery.
DNV GL’s current number of vessels with scrubbers at year-end and by segment
(including newbuilds)
Source: DNV GL (underlying data), DNB Markets (calculations)
Of all confirmed scrubber orders by end-2019, 76% (up from 71% in our 13 September report)
are scheduled to be installed in the three major shipping segments: dry bulk, tankers, and
container. A still-growing portion of all scrubber orders are confirmed retrofits (now 72%, up
from 62%).
DNV GL’s current number of newbuilds and retrofits (year-end, including newbuilds)
Source: DNV GL (underlying data), DNB Markets (calculations)
DNV GL’s latest forecasts show an accelerating increase in scrubber uptake, but still leave
some upside to our estimate of 2,300 scrubbers installed by early 2020. While 98% of
October revisions were additional scrubbers in the three main segments (dry bulk, tankers,
and container), the November revisions were down to 77% within these segments (12%, or
59 scrubbers were added in the Cruise & Ferry segment).
786 808 811
161
513 537 537
120
270 288 288
103 149 165
200
248289 304
96
118118 118
97234
306378
784
20522157 2175
0
500
1000
1500
2000
2500
2014 2015 2016 2017 2018 2019 2020 2021
Vessels
with s
cru
bber
(num
ber)
Bulk Tankers Container Gas Cruise&Ferry RoRo&PCC General cargo Other
18 49 73
123
283 5
92
614
618
79 185
233
255
501
1460
1543
1557
97234
306378
784
20522157 2175
19% 18% 17%
24%
54%
76% 76% 75%
0%
10%
20%
30%
40%
50%
60%
70%
80%
90%
0
500
1000
1500
2000
2500
2014 2015 2016 2017 2018 2019 2020 2021
Share
of
majo
r segm
ents
(dry
bulk
, ta
nkers
and c
onta
iner)
Vessels
with s
cru
bber
(num
ber)
Newbuildings Retrofits Dry bulk, tankers and container's share of scrubber uptake
DNB Markets
02 November 2018
3
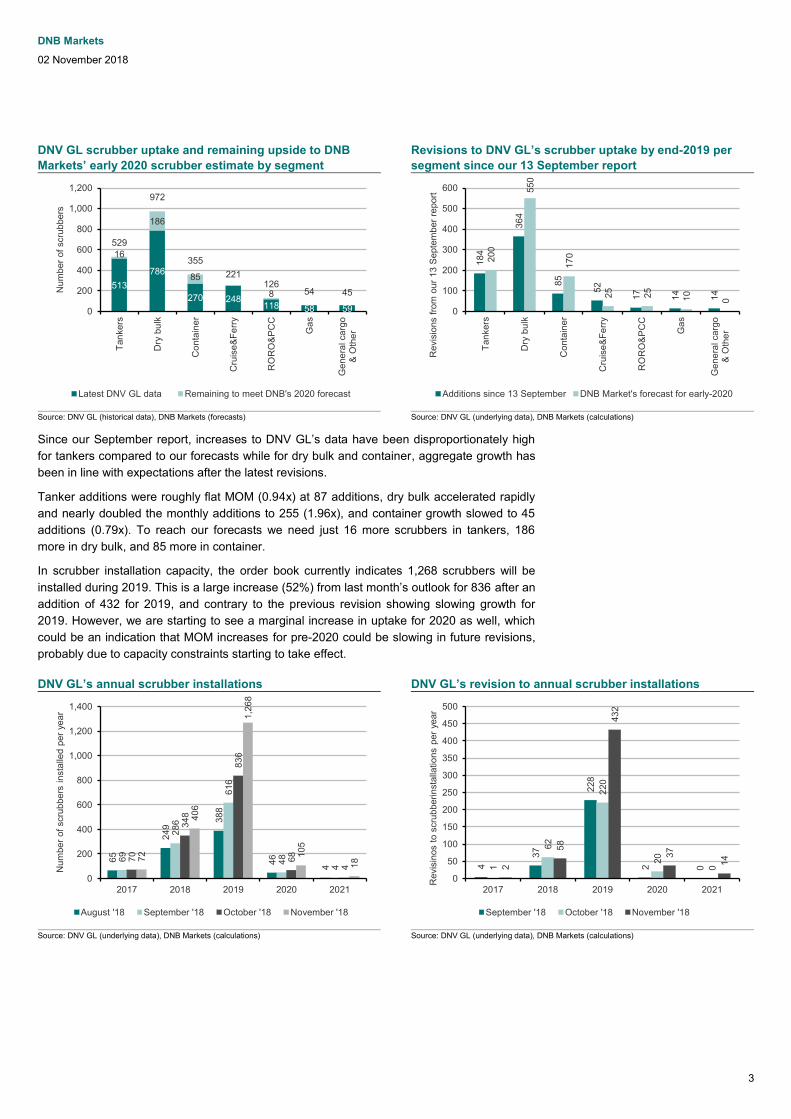
DNV GL scrubber uptake and remaining upside to DNB
Markets’ early 2020 scrubber estimate by segment
Revisions to DNV GL’s scrubber uptake by end-2019 per
segment since our 13 September report
Source: DNV GL (historical data), DNB Markets (forecasts) Source: DNV GL (underlying data), DNB Markets (calculations)
Since our September report, increases to DNV GL’s data have been disproportionately high
for tankers compared to our forecasts while for dry bulk and container, aggregate growth has
been in line with expectations after the latest revisions.
Tanker additions were roughly flat MOM (0.94x) at 87 additions, dry bulk accelerated rapidly
and nearly doubled the monthly additions to 255 (1.96x), and container growth slowed to 45
additions (0.79x). To reach our forecasts we need just 16 more scrubbers in tankers, 186
more in dry bulk, and 85 more in container.
In scrubber installation capacity, the order book currently indicates 1,268 scrubbers will be
installed during 2019. This is a large increase (52%) from last month’s outlook for 836 after an
addition of 432 for 2019, and contrary to the previous revision showing slowing growth for
2019. However, we are starting to see a marginal increase in uptake for 2020 as well, which
could be an indication that MOM increases for pre-2020 could be slowing in future revisions,
probably due to capacity constraints starting to take effect.
DNV GL’s annual scrubber installations DNV GL’s revision to annual scrubber installations
Source: DNV GL (underlying data), DNB Markets (calculations) Source: DNV GL (underlying data), DNB Markets (calculations)
513
786
270 248118 58 59
16
186
85
8
529
972
355
221126
54 45
0
200
400
600
800
1,000
1,200
Tan
kers
Dry
bu
lk
Co
nta
ine
r
Cru
ise
&F
err
y
RO
RO
&P
CC
Ga
s
Ge
ne
ral carg
o&
Oth
er
Nu
mber
of
scru
bbers
Latest DNV GL data Remaining to meet DNB's 2020 forecast
184
364
85
52
17
14
14
200
550
170
25
25
10
0
0
100
200
300
400
500
600
Ta
nke
rs
Dry
bu
lk
Co
nta
ine
r
Cru
ise
&F
err
y
RO
RO
&P
CC
Ga
s
Ge
ne
ral carg
o&
Oth
er
Re
vis
ions f
rom
our
13 S
epte
mber
report
Additions since 13 September DNB Market's forecast for early-2020
65
249
388
46
4
69
286
616
48
4
70
348
836
68
4
72
406
1,2
68
105
18
0
200
400
600
800
1,000
1,200
1,400
2017 2018 2019 2020 2021
Nu
mb
er
of
scru
bb
ers
in
sta
lled
pe
r ye
ar
August '18 September '18 October '18 November '18
4
37
228
2 01
62
220
20
02
58
432
37
14
0
50
100
150
200
250
300
350
400
450
500
2017 2018 2019 2020 2021
Re
vis
inos t
o s
cru
bberin
sta
llatio
ns p
er
year
September '18 October '18 November '18

DNB Markets
02 November 2018
4
Monthly revisions to DNV GL’s scrubber uptake data
DNV GL total scrubber uptake revisions DNV GL total scrubber installations per year
Source: DNV GL (underlying data), DNB Markets (calculations) Source: DNV GL (underlying data), DNB Markets (calculations)
Revisions to total scrubber uptake by end-2019 Revisions to total scrubber uptake by end-2020
Source: DNV GL (underlying data), DNB Markets (calculations) Source: DNV GL (underlying data), DNB Markets (calculations)
End-2019 uptake revisions by segment Share of end-2019 revisions by segment
Source: DNV GL (underlying data), DNB Markets (calculations) Source: DNV GL (underlying data), DNB Markets (calculations)
291
356
605
993
1,0
39
294
363
649
1,2
65
1,3
13
296
366
714
1,5
50
1,6
18
306
378
784
2,0
52
2,1
57
0
500
1,000
1,500
2,000
2,500
2016 2017 2018 2019 2020
Scru
bbers
in
sta
lled b
y end o
f ye
ar
August '18 September '18 October '18 November '18
76
65
249
388
4664
69
286
616
4865
70
348
836
68
72
72
406
1,2
68
105
0
200
400
600
800
1,000
1,200
1,400
2016 2017 2018 2019 2020
Nu
mber
of
scru
bbers
in
sta
lled p
er
year
August '18 September '18 October '18 November '18
993
1,2
65
1,5
50 2,0
52272
285
502
0
500
1,000
1,500
2,000
2,500
Nu
mber
of
scru
bbers
by
end 2
019
1,0
39
1,3
13
1,6
18 2
,157274
305
539
0
500
1,000
1,500
2,000
2,500
Nu
mber
of
scru
bbers
by
end 2
020
130
255
93
87
57
45
59
285
502
0
100
200
300
400
500
600
Oct'18 Nov'18
End-2
019 r
evis
ions
Bulk Tankers Container Gas
Cruise&Ferry RoRo&PCC General cargo Other
46%51%
33% 17%
20%
9%
12%
0%
10%
20%
30%
40%
50%
60%
70%
80%
90%
100%
Oct'18 Nov'18
Share
of
end
-2019 r
evis
ions
Bulk Tankers Container Gas
Cruise&Ferry RoRo&PCC General cargo Other

DNB Markets
02 November 2018
5
DNV GL dry bulk scrubber uptake revisions DNV GL dry bulk scrubber installations per year
Source: DNV GL (underlying data), DNB Markets (calculations) Source: DNV GL (underlying data), DNB Markets (calculations)
DNV GL tankers scrubber uptake revisions DNV GL tankers scrubber installations per year
Source: DNV GL (underlying data), DNB Markets (calculations) Source: DNV GL (underlying data), DNB Markets (calculations)
DNV GL container scrubber uptake revisions DNV GL container scrubber uptake revisions
Source: DNV GL (underlying data), DNB Markets (calculations) Source: DNV GL (underlying data), DNB Markets (calculations)
16 27 7
6
278
289
12 23
84
401
419
16 27
128
531
549
17 26
140
786
808
0
100
200
300
400
500
600
700
800
900
2016 2017 2018 2019 2020
Scru
bbers
in
sta
lled b
y end o
f ye
ar
August '18 September '18 October '18 November '18
3 11 4
9
202
11
3 11
61
317
18
3 11
101
403
18
3 9
114
646
22
0
100
200
300
400
500
600
700
2016 2017 2018 2019 2020
Nu
mber
of
scru
bbers
in
sta
lled p
er
year
August '18 September '18 October '18 November '18
17 29
113
220
225
18 35
140
333
338
18 35
152
426
439
15 33
161
513 537
0
100
200
300
400
500
600
2016 2017 2018 2019 2020
Scru
bbers
in
sta
lled b
y end o
f ye
ar
August '18 September '18 October '18 November '18
9 12
84
107
55
17
105
193
55
17
117
274
13
5
18
128
352
24
0
50
100
150
200
250
300
350
400
2016 2017 2018 2019 2020
Nu
mber
of
scru
bbers
in
sta
lled p
er
year
August '18 September '18 October '18 November '18
18 3
1
111
148 1
70
13 2
4
108
168 186
15 2
6
116
225 243
19 3
0
120
270 288
0
50
100
150
200
250
300
350
2016 2017 2018 2019 2020
Scru
bbers
in
sta
lled b
y end o
f ye
ar
August '18 September '18 October '18 November '18
5
13
80
37
22
2
11
84
60
18
2
11
90
109
18
2
11
90
150
18
0
20
40
60
80
100
120
140
160
2016 2017 2018 2019 2020
Nu
mber
of
scru
bbers
in
sta
lled p
er
year
August '18 September '18 October '18 November '18
DNB Markets
02 November 2018
6
Important Information This report has been prepared by DNB Markets, a division of DNB Bank ASA. DNB Bank ASA is a part of the DNB
Group. This report is based on information obtained from public sources that DNB Markets believes to be reliable but
which DNB Markets has not independently verified, and DNB Markets makes no guarantee, representation or warranty
as to its accuracy or completeness. This report does not, and does not attempt to, contain everything material which
there is to be said about the Company. Any opinions expressed herein reflect DNB Markets’ judgement at the time the
report was prepared and are subject to change without notice.
Any use of non-DNB logos in this report is solely for the purpose of assisting in identifying the relevant issuer. DNB is not
affiliated with any such issuer.
This report is for clients only, and not for publication, and has been prepared for information purposes only by DNB Markets, a division of DNB Bank ASA. This report is the property of DNB Markets. DNB Markets retains all intellectual property rights (including, but not limited to, copyright) relating to the report. Sell-side investment firms are not allowed any commercial use (including, but not limited to, reproduction and redistribution) of the report contents, either partially or in full, without DNB Markets’ explicit and prior written consent. However, buy-side investment firms may use the report when making investment decisions, and may also base investment advice given to clients on the report. Such use is dependent on the buy-side investment firm citing DNB Markets as the source.
Price targets are based on a combination of several valuation methods such as discounted cash flow, pricing based on earnings multiples, multiple on book value, net asset value and peer comparison. Substantial material sources for coverage of this company include historical financial figures and communication with the company, and relevant third party information. If you would like further information on the valuation, methodology or underlying assumptions used in this note, please contact the analyst (contact details on front page).
Recommendation structure and risk classification
DNB Markets recommendations are based on absolute performance:
Buy - indicates an expected return greater than 10% within 12 months
Hold - indicates an expected return between 0 and 10% within 12 months
Sell - indicates an expected negative return within 12 months
The return-requirement bands above may be applied with some degree of flexibility depending on the liquidity and volatility characteristics of the individual share.
High risk - Volatility over 40 percent.
Medium risk - Volatility from 25 percent to 40 percent.
Low risk - Volatility under 25 percent.
Investing in any security is subject to substantial risk. Return on investment may vary greatly.
Careful consideration for possible financial distress should be accounted for before investing in any security.
Recommendation distribution and corporate clients for the last 12 months
Buy Hold Sell No_rec Total
Number 136 70 21 8 235
% of total 58% 30% 9% 3%
DNB Markets client 23% 10% 2% 1% 86
Readers should assume that DNB Markets may currently or may in the coming three months and beyond be providing or seeking
to provide confidential investment banking services or other services to the company/companies
Share positions in the company: Analyst* Employees** DNB*** Update
Number of shares 0 0 0 01/11/2018
*The analyst or any close associates. **Share positions include people involved in the production of credit and equity research,
including people that could reasonably be expected to have access to it before distribution.
***Share positions as part of DNB Group. Holdings as part of DNB Markets investment services activity are not included.
30
35
40
45
50
55
60
65
29-1-18 28-2-18 31-3-18 30-4-18 31-5-18 30-6-18 31-7-18 30-8-18 30-9-18 30-10-18
Price, Rating, and Price Target History Frontline (FRO NO) as of 1-11-18
Source: Factset Estimates (Prices) / DNB (ratings and target price)
19-2-18H : 33.0
6-3-18 B : 42.0
29-5-18 B : 60.0
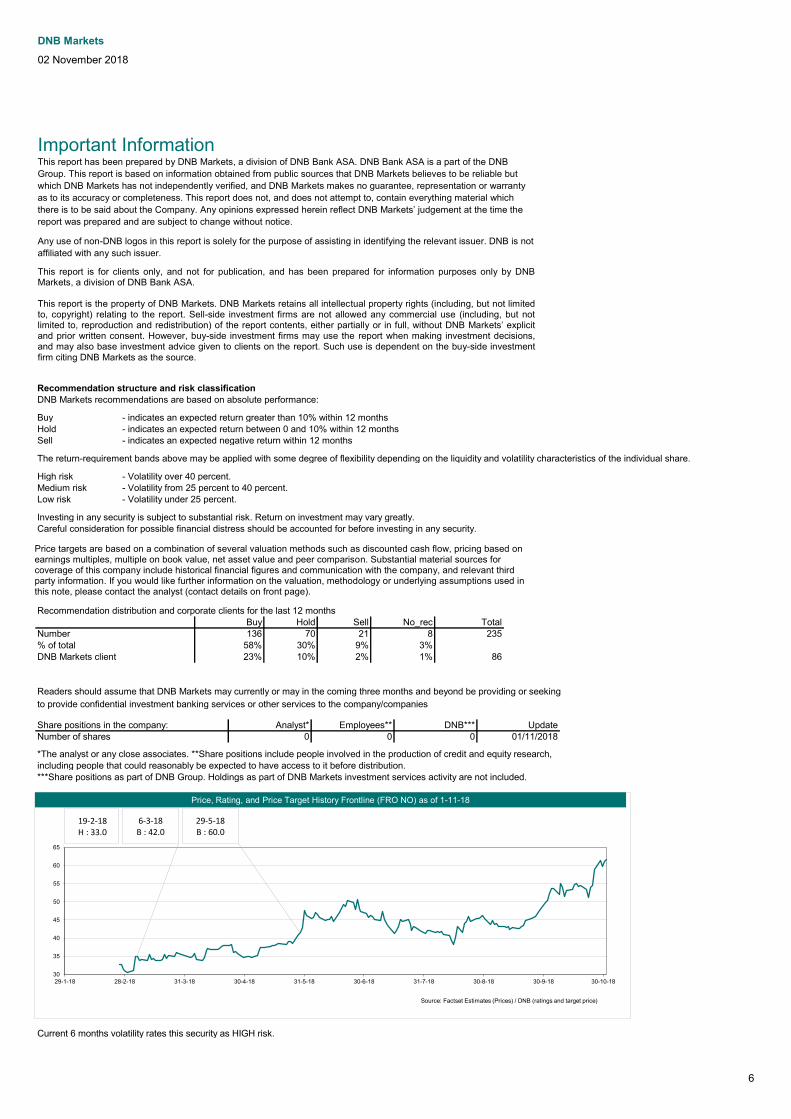
Current 6 months volatility rates this security as HIGH risk.

DNB Markets
02 November 2018
7
DNB Markets is market maker/liquidity provider for Odfjell. DNB Markets has provided investment services and/or ancillary services to the company and received compensation for it during the past 12 months.
Readers should assume that DNB Markets may currently or may in the coming three months and beyond be providing or seeking
to provide confidential investment banking services or other services to the company/companies
Share positions in the company: Analyst* Employees** DNB*** Update
Number of shares 0 0 0 01/11/2018
*The analyst or any close associates. **Share positions include people involved in the production of credit and equity research,
including people that could reasonably be expected to have access to it before distribution.
***Share positions as part of DNB Group. Holdings as part of DNB Markets investment services activity are not included.
28
30
32
34
36
38
40
42
44
29-1-18 28-2-18 31-3-18 30-4-18 31-5-18 30-6-18 31-7-18 30-8-18 30-9-18 30-10-18
Price, Rating, and Price Target History Odfjell (ODF NO) as of 1-11-18
Source: Factset Estimates (Prices) / DNB (ratings and target price)
25-8-17B : 37.0
7-5-18 B : 44.0
14-5-18 B : 43.0
27-8-18 B : 44.0
Current 6 months volatility rates this security as MEDIUM risk.
DNB Markets has provided investment services and/or ancillary services to the company and received compensation for it during the past 12 months.
Readers should assume that DNB Markets may currently or may in the coming three months and beyond be providing or seeking
to provide confidential investment banking services or other services to the company/companies
Share positions in the company: Analyst* Employees** DNB*** Update
Number of shares 0 2000 0 01/11/2018
*The analyst or any close associates. **Share positions include people involved in the production of credit and equity research,
including people that could reasonably be expected to have access to it before distribution.
***Share positions as part of DNB Group. Holdings as part of DNB Markets investment services activity are not included.
90
100
110
120
130
140
150
160
170
180
29-1-18 28-2-18 31-3-18 30-4-18 31-5-18 30-6-18 31-7-18 30-8-18 30-9-18 30-10-18
Price, Rating, and Price Target History Stolt-Nielsen (SNI NO) as of 1-11-18
Source: Factset Estimates (Prices) / DNB (ratings and target price)
5-2-18B : 143
10-4-18 B : 138
6-7-18 B : 172
Current 6 months volatility rates this security as MEDIUM risk.
Readers should assume that DNB Markets may currently or may in the coming three months and beyond be providing or seeking
to provide confidential investment banking services or other services to the company/companies
Share positions in the company: Analyst* Employees** DNB*** Update
Number of shares 0 77 0 01/11/2018
*The analyst or any close associates. **Share positions include people involved in the production of credit and equity research,
including people that could reasonably be expected to have access to it before distribution.
***Share positions as part of DNB Group. Holdings as part of DNB Markets investment services activity are not included.
DNB Markets
02 November 2018
8
160
180
200
220
240
260
280
300
320
340
29-1-18 28-2-18 31-3-18 30-4-18 31-5-18 30-6-18 31-7-18 30-8-18 30-9-18 30-10-18
Price, Rating, and Price Target History Wilh. Wilhelmsen Holding (WWI NO) as of 1-11-18
Source: Factset Estimates (Prices) / DNB (ratings and target price)
13-11-17B : 323
14-5-18 B : 273
Current 6 months volatility rates this security as MEDIUM risk.
Readers should assume that DNB Markets may currently or may in the coming three months and beyond be providing or seeking
to provide confidential investment banking services or other services to the company/companies
Share positions in the company: Analyst* Employees** DNB*** Update
Number of shares 0 0 0 01/11/2018
*The analyst or any close associates. **Share positions include people involved in the production of credit and equity research,
including people that could reasonably be expected to have access to it before distribution.
***Share positions as part of DNB Group. Holdings as part of DNB Markets investment services activity are not included.
20
25
30
35
40
45
50
29-1-18 28-2-18 31-3-18 30-4-18 31-5-18 30-6-18 31-7-18 30-8-18 30-9-18 30-10-18
Price, Rating, and Price Target History Golar LNG (GLNG US) as of 1-11-18
Source: Factset Estimates (Prices) / DNB (ratings and target price)
13-9-17B : 33.0
23-4-18 B : 49.0
31-5-18 B : 39.0
5-9-18 B : 43.0
Current 6 months volatility rates this security as HIGH risk.
Readers should assume that DNB Markets may currently or may in the coming three months and beyond be providing or seeking
to provide confidential investment banking services or other services to the company/companies
Share positions in the company: Analyst* Employees** DNB*** Update
Number of shares 0 0 0 01/11/2018
*The analyst or any close associates. **Share positions include people involved in the production of credit and equity research,
including people that could reasonably be expected to have access to it before distribution.
***Share positions as part of DNB Group. Holdings as part of DNB Markets investment services activity are not included.
DNB Markets
02 November 2018
9
7,000
8,000
9,000
10,000
11,000
12,000
13,000
29-1-18 28-2-18 31-3-18 30-4-18 31-5-18 30-6-18 31-7-18 30-8-18 30-9-18 30-10-18
Price, Rating, and Price Target History A. P. Møller Mærsk (MAERSKB DC) as of 1-11-18
Source: Factset Estimates (Prices) / DNB (ratings and target price)
20-2-18B : 12900
22-5-18 B : 11800
4-7-18 B : 10400
Current 6 months volatility rates this security as MEDIUM risk.
Readers should assume that DNB Markets may currently or may in the coming three months and beyond be providing or seeking
to provide confidential investment banking services or other services to the company/companies
Share positions in the company: Analyst* Employees** DNB*** Update
Number of shares 0 0 0 01/11/2018
*The analyst or any close associates. **Share positions include people involved in the production of credit and equity research,
including people that could reasonably be expected to have access to it before distribution.
***Share positions as part of DNB Group. Holdings as part of DNB Markets investment services activity are not included.
55
60
65
70
75
80
85
90
95
29-1-18 28-2-18 31-3-18 30-4-18 31-5-18 30-6-18 31-7-18 30-8-18 30-9-18 30-10-18
Price, Rating, and Price Target History Golden Ocean (GOGL NO) as of 1-11-18
Source: Factset Estimates (Prices) / DNB (ratings and target price)
20-2-18B : 83.0
25-5-18 B : 84.0
31-5-18 B : 85.0
7-8-18 B : 88.0
20-8-18 B : 90.0
13-9-18 B : 95.0
Current 6 months volatility rates this security as MEDIUM risk.
Readers should assume that DNB Markets may currently or may in the coming three months and beyond be providing or seeking
to provide confidential investment banking services or other services to the company/companies
Share positions in the company: Analyst* Employees** DNB*** Update
Number of shares 0 0 0 01/11/2018
*The analyst or any close associates. **Share positions include people involved in the production of credit and equity research,
including people that could reasonably be expected to have access to it before distribution.
***Share positions as part of DNB Group. Holdings as part of DNB Markets investment services activity are not included.

DNB Markets
02 November 2018
10
7
8
9
10
11
12
13
14
15
29-1-18 28-2-18 31-3-18 30-4-18 31-5-18 30-6-18 31-7-18 30-8-18 30-9-18 30-10-18
Price, Rating, and Price Target History Euronav (EURN US) as of 1-11-18
Source: Factset Estimates (Prices) / DNB (ratings and target price)
26-1-18H : 9.00
6-3-18 B : 10.7
6-7-18 B : 12.5
10-8-18 B : 12.8
31-10-18 B : 14.8
Current 6 months volatility rates this security as MEDIUM risk.
Readers should assume that DNB Markets may currently or may in the coming three months and beyond be providing or seeking
to provide confidential investment banking services or other services to the company/companies
Share positions in the company: Analyst* Employees** DNB*** Update
Number of shares 0 0 0 01/11/2018
*The analyst or any close associates. **Share positions include people involved in the production of credit and equity research,
including people that could reasonably be expected to have access to it before distribution.
***Share positions as part of DNB Group. Holdings as part of DNB Markets investment services activity are not included.
4.5
5.0
5.5
6.0
6.5
7.0
7.5
8.0
29-1-18 28-2-18 31-3-18 30-4-18 31-5-18 30-6-18 31-7-18 30-8-18 30-9-18 30-10-18
Price, Rating, and Price Target History Eagle Bulk Shipping (EGLE US) as of 1-11-18
Source: Factset Estimates (Prices) / DNB (ratings and target price)
#N/A18-6-18 B : 7.10
14-8-18 B : 7.50
13-9-18 B : 6.30
Current 6 months volatility rates this security as HIGH risk.
Readers should assume that DNB Markets may currently or may in the coming three months and beyond be providing or seeking
to provide confidential investment banking services or other services to the company/companies
Share positions in the company: Analyst* Employees** DNB*** Update
Number of shares 0 0 0 01/11/2018
*The analyst or any close associates. **Share positions include people involved in the production of credit and equity research,
including people that could reasonably be expected to have access to it before distribution.
***Share positions as part of DNB Group. Holdings as part of DNB Markets investment services activity are not included.
DNB Markets
02 November 2018
11
10
12
14
16
18
20
22
29-1-18 28-2-18 31-3-18 30-4-18 31-5-18 30-6-18 31-7-18 30-8-18 30-9-18 30-10-18
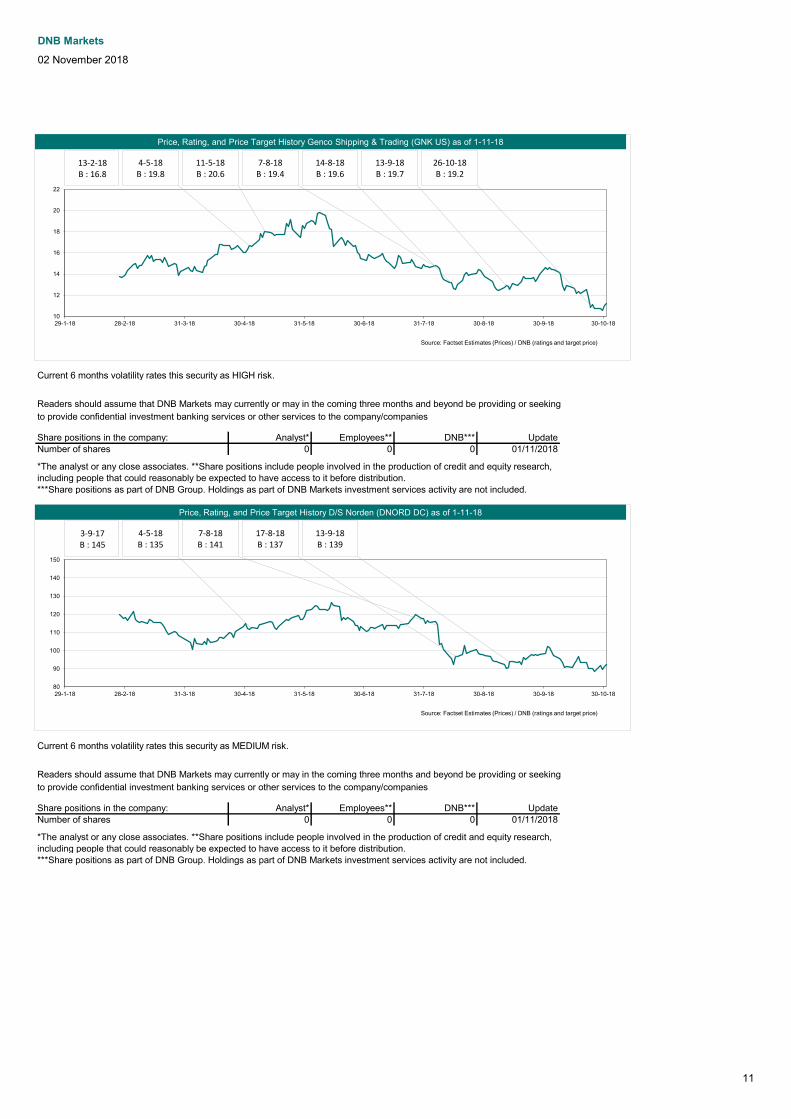
Price, Rating, and Price Target History Genco Shipping & Trading (GNK US) as of 1-11-18
Source: Factset Estimates (Prices) / DNB (ratings and target price)
13-2-18B : 16.8
4-5-18 B : 19.8
11-5-18 B : 20.6
7-8-18 B : 19.4
14-8-18 B : 19.6
13-9-18 B : 19.7
26-10-18 B : 19.2
Current 6 months volatility rates this security as HIGH risk.
Readers should assume that DNB Markets may currently or may in the coming three months and beyond be providing or seeking
to provide confidential investment banking services or other services to the company/companies
Share positions in the company: Analyst* Employees** DNB*** Update
Number of shares 0 0 0 01/11/2018
*The analyst or any close associates. **Share positions include people involved in the production of credit and equity research,
including people that could reasonably be expected to have access to it before distribution.
***Share positions as part of DNB Group. Holdings as part of DNB Markets investment services activity are not included.
80
90
100
110
120
130
140
150
29-1-18 28-2-18 31-3-18 30-4-18 31-5-18 30-6-18 31-7-18 30-8-18 30-9-18 30-10-18
Price, Rating, and Price Target History D/S Norden (DNORD DC) as of 1-11-18
Source: Factset Estimates (Prices) / DNB (ratings and target price)
3-9-17B : 145
4-5-18 B : 135
7-8-18 B : 141
17-8-18 B : 137
13-9-18 B : 139
Current 6 months volatility rates this security as MEDIUM risk.
Readers should assume that DNB Markets may currently or may in the coming three months and beyond be providing or seeking
to provide confidential investment banking services or other services to the company/companies
Share positions in the company: Analyst* Employees** DNB*** Update
Number of shares 0 0 0 01/11/2018
*The analyst or any close associates. **Share positions include people involved in the production of credit and equity research,
including people that could reasonably be expected to have access to it before distribution.
***Share positions as part of DNB Group. Holdings as part of DNB Markets investment services activity are not included.
DNB Markets
02 November 2018
12
2.2
2.4
2.6
2.8
3.0
3.2
3.4
3.6
3.8
4.0
4.2
29-1-18 28-2-18 31-3-18 30-4-18 31-5-18 30-6-18 31-7-18 30-8-18 30-9-18 30-10-18
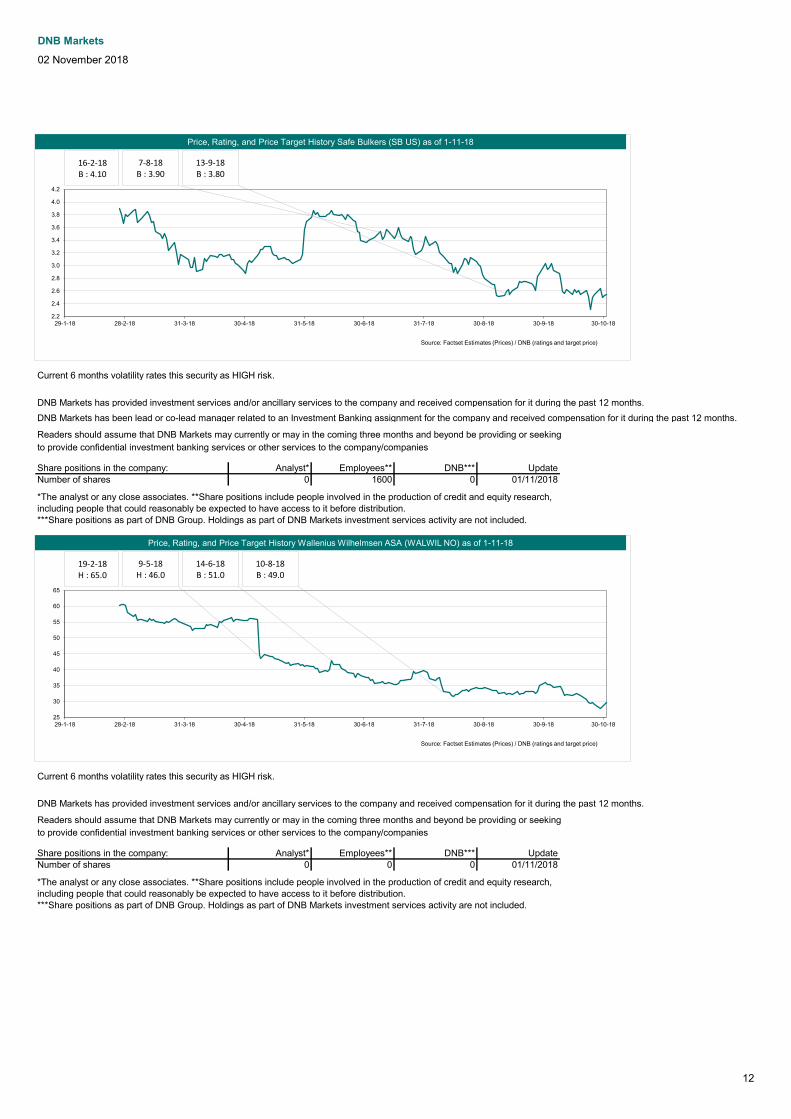
Price, Rating, and Price Target History Safe Bulkers (SB US) as of 1-11-18
Source: Factset Estimates (Prices) / DNB (ratings and target price)
16-2-18B : 4.10
7-8-18 B : 3.90
13-9-18 B : 3.80
Current 6 months volatility rates this security as HIGH risk.
DNB Markets has provided investment services and/or ancillary services to the company and received compensation for it during the past 12 months. DNB Markets has been lead or co-lead manager related to an Investment Banking assignment for the company and received compensation for it during the past 12 months.
Readers should assume that DNB Markets may currently or may in the coming three months and beyond be providing or seeking
to provide confidential investment banking services or other services to the company/companies
Share positions in the company: Analyst* Employees** DNB*** Update
Number of shares 0 1600 0 01/11/2018
*The analyst or any close associates. **Share positions include people involved in the production of credit and equity research,
including people that could reasonably be expected to have access to it before distribution.
***Share positions as part of DNB Group. Holdings as part of DNB Markets investment services activity are not included.
25
30
35
40
45
50
55
60
65
29-1-18 28-2-18 31-3-18 30-4-18 31-5-18 30-6-18 31-7-18 30-8-18 30-9-18 30-10-18
Price, Rating, and Price Target History Wallenius Wilhelmsen ASA (WALWIL NO) as of 1-11-18
Source: Factset Estimates (Prices) / DNB (ratings and target price)
19-2-18H : 65.0
9-5-18 H : 46.0
14-6-18 B : 51.0
10-8-18 B : 49.0
Current 6 months volatility rates this security as HIGH risk.
DNB Markets has provided investment services and/or ancillary services to the company and received compensation for it during the past 12 months.
Readers should assume that DNB Markets may currently or may in the coming three months and beyond be providing or seeking
to provide confidential investment banking services or other services to the company/companies
Share positions in the company: Analyst* Employees** DNB*** Update
Number of shares 0 0 0 01/11/2018
*The analyst or any close associates. **Share positions include people involved in the production of credit and equity research,
including people that could reasonably be expected to have access to it before distribution.
***Share positions as part of DNB Group. Holdings as part of DNB Markets investment services activity are not included.

DNB Markets
02 November 2018
13
35
40
45
50
55
60
65
70
75
80
85
29-1-18 28-2-18 31-3-18 30-4-18 31-5-18 30-6-18 31-7-18 30-8-18 30-9-18 30-10-18
Price, Rating, and Price Target History Höegh LNG Holdings (HLNG NO) as of 1-11-18
Source: Factset Estimates (Prices) / DNB (ratings and target price)
15-2-18B : 84.0
1-3-18 B : 76.0 1-3-18 B : 76.0
25-5-18 B : 78.0
31-5-18 B : 67.0
3-8-18 B : 65.0
24-8-18 B : 63.0
Current 6 months volatility rates this security as MEDIUM risk.
Readers should assume that DNB Markets may currently or may in the coming three months and beyond be providing or seeking
to provide confidential investment banking services or other services to the company/companies
Share positions in the company: Analyst* Employees** DNB*** Update
Number of shares 0 0 0 01/11/2018
*The analyst or any close associates. **Share positions include people involved in the production of credit and equity research,
including people that could reasonably be expected to have access to it before distribution.
***Share positions as part of DNB Group. Holdings as part of DNB Markets investment services activity are not included.
11
12
13
14
15
16
17
18
19
20
21
22
29-1-18 28-2-18 31-3-18 30-4-18 31-5-18 30-6-18 31-7-18 30-8-18 30-9-18 30-10-18
Price, Rating, and Price Target History Golar LNG Partners (GMLP US) as of 1-11-18
Source: Factset Estimates (Prices) / DNB (ratings and target price)
13-9-17H : 21.0
5-9-18 S : 11.1
Current 6 months volatility rates this security as HIGH risk.
Readers should assume that DNB Markets may currently or may in the coming three months and beyond be providing or seeking
to provide confidential investment banking services or other services to the company/companies
Share positions in the company: Analyst* Employees** DNB*** Update
Number of shares 0 0 0 01/11/2018
*The analyst or any close associates. **Share positions include people involved in the production of credit and equity research,
including people that could reasonably be expected to have access to it before distribution.
***Share positions as part of DNB Group. Holdings as part of DNB Markets investment services activity are not included.

DNB Markets
02 November 2018
14
1.5
2.0
2.5
3.0
3.5
4.0
4.5
29-1-18 28-2-18 31-3-18 30-4-18 31-5-18 30-6-18 31-7-18 30-8-18 30-9-18 30-10-18
Price, Rating, and Price Target History Scorpio Tankers (STNG US) as of 1-11-18
Source: Factset Estimates (Prices) / DNB (ratings and target price)
21-11-17H : 3.40
6-3-18 H : 2.40
25-4-18 B : 3.70
30-4-18 B : 4.00
29-10-18 B : 3.00
Current 6 months volatility rates this security as HIGH risk.
Readers should assume that DNB Markets may currently or may in the coming three months and beyond be providing or seeking
to provide confidential investment banking services or other services to the company/companies
Share positions in the company: Analyst* Employees** DNB*** Update
Number of shares 0 0 0 01/11/2018
*The analyst or any close associates. **Share positions include people involved in the production of credit and equity research,
including people that could reasonably be expected to have access to it before distribution.
***Share positions as part of DNB Group. Holdings as part of DNB Markets investment services activity are not included.
0.8
1.0
1.2
1.4
1.6
1.8
2.0
2.2
29-1-18 28-2-18 31-3-18 30-4-18 31-5-18 30-6-18 31-7-18 30-8-18 30-9-18 30-10-18
Price, Rating, and Price Target History Teekay Tankers (TNK US) as of 1-11-18
Source: Factset Estimates (Prices) / DNB (ratings and target price)
24-11-17H : 1.50
6-3-18 B : 1.80
6-7-18 B : 2.00
Current 6 months volatility rates this security as HIGH risk.
Readers should assume that DNB Markets may currently or may in the coming three months and beyond be providing or seeking
to provide confidential investment banking services or other services to the company/companies
Share positions in the company: Analyst* Employees** DNB*** Update
Number of shares 0 0 0 01/11/2018
*The analyst or any close associates. **Share positions include people involved in the production of credit and equity research,
including people that could reasonably be expected to have access to it before distribution.
***Share positions as part of DNB Group. Holdings as part of DNB Markets investment services activity are not included.

DNB Markets
02 November 2018
15
15
16
17
18
19
20
21
22
23
29-1-18 28-2-18 31-3-18 30-4-18 31-5-18 30-6-18 31-7-18 30-8-18 30-9-18 30-10-18
Price, Rating, and Price Target History GasLog (GLOG US) as of 1-11-18
Source: Factset Estimates (Prices) / DNB (ratings and target price)
21-2-18H : 18.9
30-4-18 H : 17.7
14-5-18 H : 18.2
5-9-18 B : 19.9
Current 6 months volatility rates this security as MEDIUM risk.
DNB Markets has provided investment services and/or ancillary services to the company and received compensation for it during the past 12 months.
Readers should assume that DNB Markets may currently or may in the coming three months and beyond be providing or seeking
to provide confidential investment banking services or other services to the company/companies
Share positions in the company: Analyst* Employees** DNB*** Update
Number of shares 0 0 0 01/11/2018
*The analyst or any close associates. **Share positions include people involved in the production of credit and equity research,
including people that could reasonably be expected to have access to it before distribution.
***Share positions as part of DNB Group. Holdings as part of DNB Markets investment services activity are not included.
16
18
20
22
24
26
28
29-1-18 28-2-18 31-3-18 30-4-18 31-5-18 30-6-18 31-7-18 30-8-18 30-9-18 30-10-18
Price, Rating, and Price Target History Avance Gas (AVANCE NO) as of 1-11-18
Source: Factset Estimates (Prices) / DNB (ratings and target price)
16-2-18B : 28.0
24-4-18 H : 22.0
Current 6 months volatility rates this security as MEDIUM risk.
DNB Markets has provided investment services and/or ancillary services to the company and received compensation for it during the past 12 months.
Readers should assume that DNB Markets may currently or may in the coming three months and beyond be providing or seeking
to provide confidential investment banking services or other services to the company/companies
Share positions in the company: Analyst* Employees** DNB*** Update
Number of shares 0 0 0 01/11/2018
*The analyst or any close associates. **Share positions include people involved in the production of credit and equity research,
including people that could reasonably be expected to have access to it before distribution.
***Share positions as part of DNB Group. Holdings as part of DNB Markets investment services activity are not included.

DNB Markets
02 November 2018
16
6.8
7.0
7.2
7.4
7.6
7.8
8.0
8.2
8.4
8.6
8.8
29-1-18 28-2-18 31-3-18 30-4-18 31-5-18 30-6-18 31-7-18 30-8-18 30-9-18 30-10-18
Price, Rating, and Price Target History Dorian LPG (LPG US) as of 1-11-18
Source: Factset Estimates (Prices) / DNB (ratings and target price)
23-2-18H : 8.20
29-10-18 H : 8.50
Current 6 months volatility rates this security as HIGH risk.
DNB Markets has provided investment services and/or ancillary services to the company and received compensation for it during the past 12 months.
Readers should assume that DNB Markets may currently or may in the coming three months and beyond be providing or seeking
to provide confidential investment banking services or other services to the company/companies
Share positions in the company: Analyst* Employees** DNB*** Update
Number of shares 0 0 0 01/11/2018
*The analyst or any close associates. **Share positions include people involved in the production of credit and equity research,
including people that could reasonably be expected to have access to it before distribution.
***Share positions as part of DNB Group. Holdings as part of DNB Markets investment services activity are not included.
28
30
32
34
36
38
40
42
44
46
29-1-18 28-2-18 31-3-18 30-4-18 31-5-18 30-6-18 31-7-18 30-8-18 30-9-18 30-10-18
Price, Rating, and Price Target History BW LPG (BWLPG NO) as of 1-11-18
Source: Factset Estimates (Prices) / DNB (ratings and target price)
13-2-18B : 44.0
2-3-18 B : 45.0 2-3-18 B : 45.0
24-4-18 H : 31.0
31-5-18 H : 34.0
9-8-18 H : 36.0
30-10-18 H : 37.0
Current 6 months volatility rates this security as HIGH risk.
Readers should assume that DNB Markets may currently or may in the coming three months and beyond be providing or seeking
to provide confidential investment banking services or other services to the company/companies
Share positions in the company: Analyst* Employees** DNB*** Update
Number of shares 0 0 0 01/11/2018
*The analyst or any close associates. **Share positions include people involved in the production of credit and equity research,
including people that could reasonably be expected to have access to it before distribution.
***Share positions as part of DNB Group. Holdings as part of DNB Markets investment services activity are not included.

DNB Markets
02 November 2018
17
3.0
3.5
4.0
4.5
5.0
5.5
6.0
6.5
7.0
7.5
8.0
29-1-18 28-2-18 31-3-18 30-4-18 31-5-18 30-6-18 31-7-18 30-8-18 30-9-18 30-10-18
Price, Rating, and Price Target History DHT Holdings (DHT US) as of 1-11-18
Source: Factset Estimates (Prices) / DNB (ratings and target price)
5-2-18H : 4.00
6-3-18 B : 5.20
11-5-18 B : 5.10
6-7-18 B : 6.30
1-11-18 B : 7.60
Current 6 months volatility rates this security as MEDIUM risk.
DNB Markets has provided investment services and/or ancillary services to the company and received compensation for it during the past 12 months.
Readers should assume that DNB Markets may currently or may in the coming three months and beyond be providing or seeking
to provide confidential investment banking services or other services to the company/companies
Share positions in the company: Analyst* Employees** DNB*** Update
Number of shares 0 0 0 01/11/2018
*The analyst or any close associates. **Share positions include people involved in the production of credit and equity research,
including people that could reasonably be expected to have access to it before distribution.
***Share positions as part of DNB Group. Holdings as part of DNB Markets investment services activity are not included.
6
8
10
12
14
16
18
20
29-1-18 28-2-18 31-3-18 30-4-18 31-5-18 30-6-18 31-7-18 30-8-18 30-9-18 30-10-18
Price, Rating, and Price Target History Epic Gas (EPICME NO) as of 1-11-18
Source: Factset Estimates (Prices) / DNB (ratings and target price)
15-2-18B : 19.4
Current 6 months volatility rates this security as HIGH risk.
DNB Markets has provided investment services and/or ancillary services to the company and received compensation for it during the past 12 months. DNB Markets has been lead or co-lead manager related to an Investment Banking assignment for the company and received compensation for it during the past 12 months.
Readers should assume that DNB Markets may currently or may in the coming three months and beyond be providing or seeking
to provide confidential investment banking services or other services to the company/companies
Share positions in the company: Analyst* Employees** DNB*** Update
Number of shares 0 0 0 01/11/2018
*The analyst or any close associates. **Share positions include people involved in the production of credit and equity research,
including people that could reasonably be expected to have access to it before distribution.
***Share positions as part of DNB Group. Holdings as part of DNB Markets investment services activity are not included.

DNB Markets
02 November 2018
18
10
12
14
16
18
20
22
24
29-1-18 28-2-18 31-3-18 30-4-18 31-5-18 30-6-18 31-7-18 30-8-18 30-9-18 30-10-18
Price, Rating, and Price Target History Flex LNG (FLNG NO) as of 1-11-18
Source: Factset Estimates (Prices) / DNB (ratings and target price)
16-2-18B : 16.2
23-5-18 B : 16.6
5-9-18 B : 18.8
15-10-18 B : 22.3
Current 6 months volatility rates this security as MEDIUM risk.
Readers should assume that DNB Markets may currently or may in the coming three months and beyond be providing or seeking
to provide confidential investment banking services or other services to the company/companies
Share positions in the company: Analyst* Employees** DNB*** Update
Number of shares 0 0 0 01/11/2018
*The analyst or any close associates. **Share positions include people involved in the production of credit and equity research,
including people that could reasonably be expected to have access to it before distribution.
***Share positions as part of DNB Group. Holdings as part of DNB Markets investment services activity are not included.
15
16
17
18
19
20
21
22
23
24
29-1-18 28-2-18 31-3-18 30-4-18 31-5-18 30-6-18 31-7-18 30-8-18 30-9-18 30-10-18
Price, Rating, and Price Target History Höegh LNG Partners (HMLP US) as of 1-11-18
Source: Factset Estimates (Prices) / DNB (ratings and target price)
13-9-17B : 23.1
3-8-18 H : 19.1
Current 6 months volatility rates this security as LOW risk.
DNB Markets has provided investment services and/or ancillary services to the company and received compensation for it during the past 12 months. DNB Markets has been lead or co-lead manager related to an Investment Banking assignment for the company and received compensation for it during the past 12 months.
Readers should assume that DNB Markets may currently or may in the coming three months and beyond be providing or seeking
to provide confidential investment banking services or other services to the company/companies
Share positions in the company: Analyst* Employees** DNB*** Update
Number of shares 0 500 0 01/11/2018
*The analyst or any close associates. **Share positions include people involved in the production of credit and equity research,
including people that could reasonably be expected to have access to it before distribution.
***Share positions as part of DNB Group. Holdings as part of DNB Markets investment services activity are not included.
DNB Markets
02 November 2018
19
Legal statement These materials constitute research as defined in section 9-27 (1) of the Norwegian Securities Trading Regulations (Norwegian: verdipapirforskriften), and are not investment advice as defined in section 2-4(1) of the Norwegian securities trading act (Norwegian verdipapirhandelloven). The analyst hereby certifies that (i) the views expressed in this report accurately reflect that research analyst’s personal views about the company and the securities that are the subject of this report, and (ii) no part of the research analyst’s compensation was, is, or will be, directly or indirectly, related to the specific recommendations or views expressed by that research analyst in this report. DNB Markets employees, including research analysts, may receive compensation that is generated by overall firm profitability. Confidentiality rules and internal rules restricting the exchange of information between different parts of DNB Markets/DNB Bank ASA or the DNB Group are in place to prevent employees of DNB Markets who are preparing this report from utilizing or being aware of information available in the DNB Group that may be relevant to the recipients’ decisions. DNB Markets and the DNB Group have incorporated internal rules and regulations in order to avoid any potential conflicts of interest.
The Report has been prepared by DNB Markets, a division of DNB Bank ASA, a Norwegian bank organized under the laws of the Kingdom of Norway and under supervision by the Norwegian Financial Supervisory Authority, The Monetary Authority of Singapore, and on a limited basis by the Financial Conduct Authority and the Prudential Regulation Authority of the UK, and the Financial Supervisory Authority of Sweden. Details about the extent of our regulation by local authorities outside Norway are available from us on request. It is issued subject to the General Business Terms for DNB Markets and information about the terms is available at www.dnb.no. For requests regarding the General Business Terms of the Singapore Branch of DNB Bank ASA, please contact +65 6212 6144. Information about the DNB Group can be found at www.dnb.com. DNB Markets is a member of The Norwegian Securities Dealers Association, which has issued recommendations and market standards for securities companies. The Association's Internet address where the recommendations and market standards can be found is: www.vpff.no. This report is not an offer to buy or sell any security or other financial instrument or to participate in any investment strategy. No liability whatsoever is accepted for any direct or indirect (including consequential) loss or expense arising from the use of this report. Distribution of research reports is in certain jurisdictions restricted by law. Persons in possession of this report should seek further guidance regarding such restrictions before distributing this report. Please contact DNB Markets at 08940 (+47 915 08940) for further information and inquiries regarding this report, including an overview on all recommendations from DNB Markets over the last 12 Months according to Market Abuse Regulations.
Additional information for clients in Singapore
40
45
50
55
60
65
70
29-1-18 28-2-18 31-3-18 30-4-18 31-5-18 30-6-18 31-7-18 30-8-18 30-9-18 30-10-18
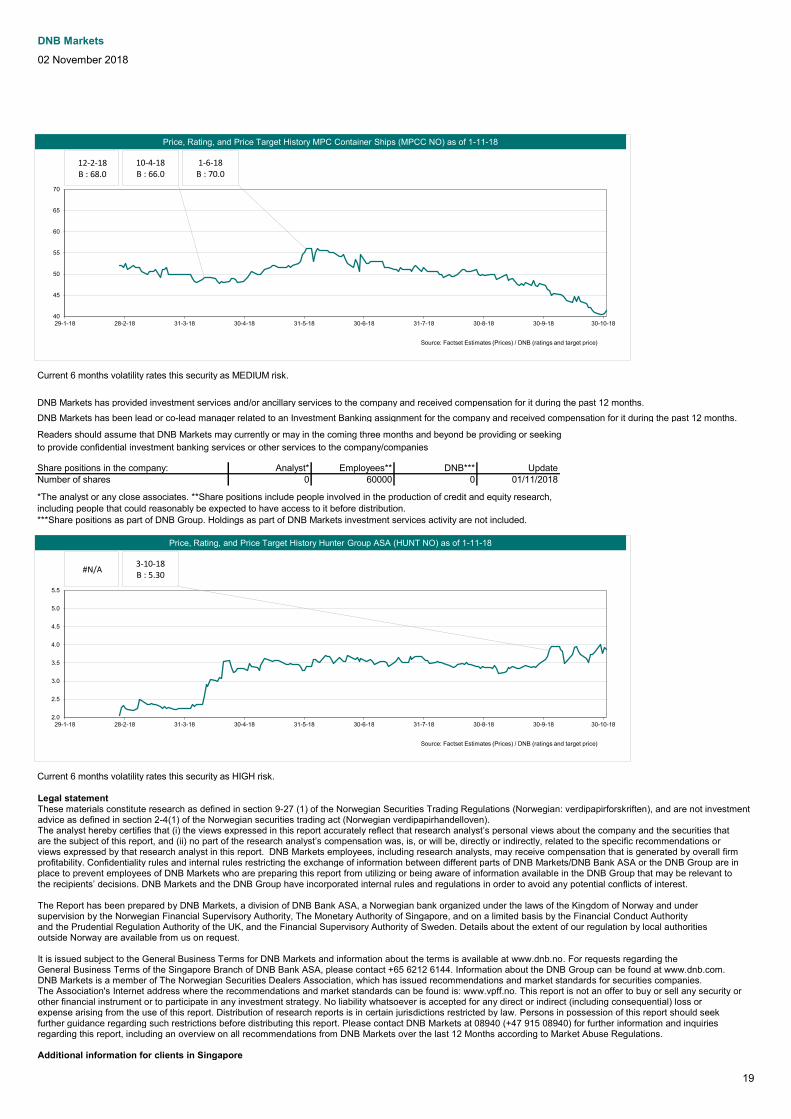
Price, Rating, and Price Target History MPC Container Ships (MPCC NO) as of 1-11-18
Source: Factset Estimates (Prices) / DNB (ratings and target price)
12-2-18B : 68.0
10-4-18 B : 66.0
1-6-18 B : 70.0
Current 6 months volatility rates this security as MEDIUM risk.
DNB Markets has provided investment services and/or ancillary services to the company and received compensation for it during the past 12 months. DNB Markets has been lead or co-lead manager related to an Investment Banking assignment for the company and received compensation for it during the past 12 months.
Readers should assume that DNB Markets may currently or may in the coming three months and beyond be providing or seeking
to provide confidential investment banking services or other services to the company/companies
Share positions in the company: Analyst* Employees** DNB*** Update
Number of shares 0 60000 0 01/11/2018
*The analyst or any close associates. **Share positions include people involved in the production of credit and equity research,
including people that could reasonably be expected to have access to it before distribution.
***Share positions as part of DNB Group. Holdings as part of DNB Markets investment services activity are not included.
2.0
2.5
3.0
3.5
4.0
4.5
5.0
5.5
29-1-18 28-2-18 31-3-18 30-4-18 31-5-18 30-6-18 31-7-18 30-8-18 30-9-18 30-10-18
Price, Rating, and Price Target History Hunter Group ASA (HUNT NO) as of 1-11-18
Source: Factset Estimates (Prices) / DNB (ratings and target price)
#N/A3-10-18 B : 5.30
Current 6 months volatility rates this security as HIGH risk.

DNB Markets
02 November 2018
20
The report has been distributed by the Singapore Branch of DNB Bank ASA. It is intended for general circulation and does not take into account the specific investment objectives, financial situation or particular needs of any particular person. You should seek advice from a financial adviser regarding the suitability of any product referred to in the report, taking into account your specific financial objectives, financial situation or particular needs before making a commitment to purchase any such product. You have received a copy of the report because you have been classified either as an accredited investor, an expert investor or as an institutional investor, as these terms have been defined under Singapore's Financial Advisers Act (Cap. 110) ("FAA") and/or the Financial Advisers Regulations ("FAR"). The Singapore Branch of DNB Bank ASA is a financial adviser exempt from licensing under the FAA but is otherwise subject to the legal requirements of the FAA and of the FAR. By virtue of your status as an accredited investor or as an expert investor, the Singapore Branch of DNB Bank ASA is, in respect of certain of its dealings with you or services rendered to you, exempt from having to comply with certain regulatory requirements of the FAA and FAR, including without limitation, sections 25, 27 and 36 of the FAA. Section 25 of the FAA requires a financial adviser to disclose material information concerning designated investment products which are recommended by the financial adviser to you as the client. Section 27 of the FAA requires a financial adviser to have a reasonable basis for making investment recommendations to you as the client. Section 36 of the FAA requires a financial adviser to include, within any circular or written communications in which he makes recommendations concerning securities, a statement of the nature of any interest which the financial adviser (and any person connected or associated with the financial adviser) might have in the securities. Please contact the Singapore branch of DNB Bank ASA at +65 6212 6144 in respect of any matters arising from, or in connection with, the report. The report is intended for and is to be circulated only to persons who are classified as an accredited investor, an expert investor or an institutional investor. If you are not an accredited investor, an expert investor or an institutional investor, please contact the Singapore Branch of DNB Bank ASA at +65 6212 6144. We, the DNB group, our associates, officers and/or employees may have interests in any products referred to in the report by acting in various roles including as distributor, holder of principal positions, adviser or lender. We, the DNB group, our associates, officers and/or employees may receive fees, brokerage or commissions for acting in those capacities. In addition, we, the DNB group, our associates, officers and/or employees may buy or sell products as principal or agent and may effect transactions which are not consistent with the information set out in the report.
In the United States Each research analyst named on the front page of this research report, or at the beginning of any subsection hereof, hereby certifies that (i) the views expressed in this report accurately reflect that research analyst’s personal views about the company and the securities that are the subject of this report; and (ii) no part of the research analyst’s compensation was, is, or will be, directly or indirectly, related to the specific recommendations or views expressed by that research analyst in this report.
The research analyst(s) named on this report are foreign research analysts as defined by FINRA Rule 1050. The only affiliate contributing to this research report is DNB Bank through its DNB Markets division (“DNB Markets/DNB Bank”); the foreign research analysts employed by DNB Markets/DNB Bank are named on the first page; the foreign research analysts are not registered/qualified as research analysts with FINRA; foreign research analysts are not associated persons of DNB Markets, Inc. and therefore are not subject to the restrictions set forth in FINRA Rules 2241 and 2242 regarding restrictions on communications with a subject company, public appearances and trading securities held by a research analyst account.
This is a Third Party Research Report as defined by FINRA Rules 2241 and 2242. Any material conflict of interest that can reasonably be expected to have influenced the choice of DNB Markets/DNB Bank as a research provider or the subject company of a DNB Markets/DNB Bank research report, including the disclosures required by FINRA Rules 2241 and 2242 can be found above.
This report is being furnished solely to Major U.S. Institutional Investors within the meaning of Rule 15a-6 under the U.S. Securities Exchange Act of 1934 and to such other U.S. Institutional Investors as DNB Markets, Inc. may determine. Distribution to non-Major U.S. Institutional Investors will be made only by DNB Markets, Inc., a separately incorporated subsidiary of DNB Bank that is a U.S. broker-dealer and a member of the Financial Industry Regulatory Authority (“FINRA”) and the Securities Investor Protection Corporation (“SIPC”).
Any U.S. recipient of this report seeking to obtain additional information or to effect any transaction in any security discussed herein or any related instrument or investment should contact DNB Markets, Inc., 200 Park Avenue, New York,NY 10166-0396, telephone number +1 212-551-9800.
In Canada The Report has been distributed in reliance on the International Dealer Exemption pursuant to NI 31-103 subsection 8.18(2) and subsection 8.18(4)(b). Please be advised that: 1. DNB Bank ASA (DNB Markets) and DNB Markets, Inc. are not registered as a dealer in the local jurisdiction to make the trade. We provide our services in Canada as an exempt international dealer. 2. The jurisdiction of DNB Bank ASA (DNB Markets) and DNB Markets, Inc.'s head office is Norway. 3. There may be difficulty enforcing legal rights against DNB Bank ASA (DNB Markets) and DNB Markets, Inc. because all or substantially all of their assets may be situated outside of Canada. 4. The name and address of the agent for service of process for DNB Bank ASA (DNB Markets) and DNB Markets, Inc. in the local jurisdiction is: Alberta: Blake, Cassels & Graydon LLP, 855 - 2nd Street S.W., Suite 3500, Bankers Hall East Tower, Calgary, AB T2P 4J8. British Columbia: Blakes Vancouver Services Inc., 595 Burrard Street, P.O. Box 49314, Suite 2600, Three Bentall Centre, Vancouver, BC V7X 1L3. Manitoba: Aikins, MacAulay & Thorvaldson LLP, 30th Floor, Commodity Exchange Tower, 360 Main Street, Winnipeg, MB R3C 4G1. New Brunswick: Stewart McKelvey, Suite 1000, Brunswick House, 44 Chipman Hill, PO Box 7289, Station A, Saint John, NB E2L 2A9. Newfoundland and Labrador: Stewart McKelvey, Suite 1100, Cabot Place, 100 New Gower Street, P.O. Box 5038, St. John's, NL A1C 5V3. Nova Scotia: Stewart McKelvey, Purdy's Wharf Tower One, 1959 Upper Water Street, Suite 900, P.O. Box 997, Halifax, NS B3J 2X2. Northwest Territories: Gerald Stang, Suite 201, 5120-49 Street, Yellowknife, NT X1A 1P8. Nunavut: Field LLP, P.O. Box 1779, Building 1088C, Iqaluit, NU X0A 0H0. Ontario: Blakes Extra-Provincial Services Inc., Suite 4000, 199 Bay Street, Toronto, ON M5L 1A9. Prince Edward Island: Stewart McKelvey, 65 Grafton Street, Charlottetown, PE C1A 1K8. Québec: Services Blakes Québec Inc., 600 de Maisonneuve Boulevard Ouest, Suite 2200, Tour KPMG, Montréal, QC H3A 3J2. Saskatchewan: MacPherson, Leslie & Tyerman LLP, 1500 Continental Bank Building, 1874 Scarth Street, Regina, SK S4P 4E9. Yukon: Grant Macdonald, Macdonald & Company, Suite 200, Financial Plaza, 204 Lambert Street, Whitehorse, YK Y1A 3T2.
In Brazil The analyst or any close associates do not hold nor do they have any direct/indirect involvement in the acquisition, sale, or intermediation of the securities discussed herein. Any financial interests, not disclosed above, that the analyst or any close associates holds in the issuer discussed in the report is limited to investment funds that do not mainly invest in the issuer or industry discussed in the report and the management of which these persons cannot influence.