buy right : sit tight - equity mutual funds - invest in … oswal asset management company (moamc)...
TRANSCRIPT

BUY RIGHT : SIT TIGHTBuying quality companies and riding their growth cycle
THINK EQUITYTHINK MOTILAL OSWAL

Motilal Oswal Asset Management Company (MOAMC) is one of India's fastest
growing asset management companies.
With a focus on equity investing and equity investment expertise inherited from
over 30 years of capital markets experience of our sponsors Motilal Oswal
Securities Ltd., we have created a single investing philosophy be it Mutual Fund
(MF) or Portfolio Management Services (PMS).
Like our investing philosophy, our product basket is also focused with
concentrated 'buy and hold' PMS Strategies and Mutual Fund schemes in the
Large Cap, Midcap and Multicap space respectively.
Our Value Strategy is one of the longest running products in PMS with a track
record of 14 years. And our MF offerings come with unique features such as “Low
Churn” and “Focused” portfolios.
With an investment management team of 19; we aim to be seen as an investment
management house focused on wholesaling through marquee distribution
platforms and strong relationships, backed by performance track record.
AMC
MOTILALOSWAL
1

SIT TIGHTBUY RIGHT
At Motilal Oswal Asset Management Company (MOAMC), our
investment philosophy is centered on two critical pillars of equity
investing – 'Buy Right: Sit Tight'. 'Buy Right' means buying quality
companies at a reasonable price and 'Sit Tight' means staying invested
in them for a long time to realise the full growth potential of the stocks.
Our Investment Philosophy
Data as on January 31, 2018
Past performance may or may not be sustained in future.
For detailed performance tables, please refer page no. 11 to 16 for Mutual Fund Schemes and 18 to 20 for Strategies of Portfolio Management Services
Process2Performance
Delivered an annualized return of 27.42% since incep�on as against
30.19% by Ni�y Free Float Midcap 100 Index
Delivered an annualized return of 18.01% since incep�on as against
15.26% by Ni�y 50 Index
MOSt Focused Mul�cap 35Inception Date:28 Apr 2014
MOSt Focused 25Inception Date: 13 May 2013
MOSt Focused Midcap 30
Inception Date: 24 Feb 2014
Delivered an annualized return of 18.80% since incep�on as against 6.57%
by Ni�y 500 IndexNTDOP StrategyIncep�on Date: 11 Dec 2007
Delivered an annualized return of 22.15% since incep�on as
against 12.12% by Ni�y 500 Index
MOSt Focused Long Term
Inception Date: 21 Jan 2015
Delivered an annualized return of 30.57% since incep�on as against
18.64% by Ni�y 500 Index
Delivered an annualized return of 17.90% since incep�on as against
14.14% by Ni�y Free Float Midcap 100 IndexIOP Strategy Inception Date: 11 Feb 2010
Delivered an annualized return of 24.64% since incep�on as against 17.44%
by Ni�y 50 IndexValue Strategy Inception Date: 24 Mar 2003
2
MOSt Focused Dynamic EquityInception Date:27 Sep 2016
Delivered an annualized return of 15.54% since incep�on as against
15.67% by CRISIL Hybrid 35 + 65 - Aggressive Index

How do we 'Buy Right' ?
Over the last 22 years, our chairman, Raamdeo Agrawal (one of India's foremost
value investors) has been analyzing the Indian equity market to come up with
investing insights in the form of the Annual Motilal Oswal Wealth Creation Study.
The learnings from all these studies have helped us evolve a unique and focused
investing process - 'QGLP'.
Every stock we buy in our Mutual Fund Schemes or PMS Strategies is based on
our QGLP parameters.
RIGHTBUY
Qfor QUALITY
Gfor GROWTH
Lfor LONGEVITY
Pfor PRICE
‘Quality’ denotes quality of the business and management
‘Growth’ denotes growth in earnings and sustained RoE
‘Longevity’ denotes longevity of the competitive
advantage or economic moat of
the business
‘Price’ denotes our approach of
buying a good business for a fair price rather than
buying a fair business for a
good price
Performance of QGLP stocks
Company Name CAGR %
Eicher Motors Ltd
Asian Paints Ltd
Hero Motocorp Ltd
HDFC Bank Ltd
Sun Pharma Industries Ltd
52.03
22.38
16.80
18.52
16.06
Here are a few more examples that show how QGLP stocks have fared in terms of compounded annual growth return (CAGR) over the last 20 years or since listing; whichever is later.
The given stocks are part of portfolio. The Stocks mentioned above are used to explain the concept and are for illustration purpose only and should not be used for development or implementation of an investment strategy. It shall not be constitute as an advice, an offer to sell/purchase or as an invitation or solicitation to do so for any securities. The statements made herein may include statements of future expectations and other forward-looking statements that are based on our current views and assumptions and involve known and unknown risks and uncertainties that could cause actual results, performance or events to differ materially from those expressed or implied in such statements. Past performance may or may not be sustained in future. Source: Bloomberg Consensus & Internal Research
Data as on January 31, 2018
3

TIGHTSIT
While Buying Right is all about following a process, Sitting Tight on a good buy
requires Focus & Discipline.
Buy and Hold: We believe in focused stock portfolios and are strictly buy and hold
investors and believe that while picking the right business needs skill; holding onto
these businesses to enable our investors to benefit from the entire growth cycle
needs even more skill.
Focus: Our portfolios are high conviction portfolios with 20 to 25 stocks being our
ideal number. We believe in adequate diversification as over-diversification
results in diluting returns for our investors and adding market risk.
Source: Bloomberg | Data as on January 31, 2018
The graph above is used to explain the concept and is for illustration purpose only and should not be used for development or implementation of an investment strategy. It should not be construed as investment advice to any party. The above figures are inflation adjusted.
Focused Por�olio
Ris
k
1 Stock 20 Stocks 100 Stocks
Risk reducing as the number of stocks raise. But after 20
stocks in portfolio, change ofrisk is minimal
Number of Stocks
How do we 'Sit Tight' ?
If you had invested ` 100 in the Sensex in 1979, your investment would have
mul�plied to ` 3,225 with dividend and to ` 1,808 without dividend.
Buy & Hold
Diversifica�on beyond your control becomes unmanageable and adds no value to your por�olio. Over diversifica�on can impact the overall performance of your por�olio. As in case of most por�olios, the top 5 good quality stocks contribute 80% of overall performance of your por�olio while the rest 20% is contributed by bad quality stocks.
4
Sensex
Sensex cu
mD
ividen
d
` 3,225
` 1,808
If you had invested Rs 100 .....
-
500
1,000
1,500
2,000
2,500
3,000
Mar
-79
Jun-
80
Sep-
81
Dec
-82
Mar
-84
Jun-
85
Sep-
86
Dec
-87
Mar
-89
Jun-
90
Sep-
91
Dec
-92
Mar
-94
Jun-
95
Sep-
96
Dec
-97
Mar
-99
Jun-
00
Sep-
01
Dec
-02
Mar
-04
Jun-
05
Sep-
06
Dec
-07
Mar
-09
Jun-
10
Sep-
11
Dec
-12
Mar
-14
Jun-
15
Sep-
16
Dec
-17
Pu
rch
asin
g P
ow
er
Sensex Sensex cum Dividend

"Great companies to invest are like wonderful castles, surrounded by deep, dangerous moats where the leader inside is an honest and decent person. Preferably, the castle gets its strength from the genius inside; the moat is permanent and acts as a powerful deterrent to those considering an attack; and inside, the leader makes gold but doesn't keep it all for himself.”
Large profit pool
Economic Moat i.e. sustained c o m p e t i t i v e a d v a n t a g e reflected in return ratios (RoE, RoCE) higher than cost of c a p i t a l a n d a l s o t h o s e of peers
F a v o u r a b l e c o m p e t i t i v e structure like monopoly or oligopoly
Secular and stable business, preferably consumer facing
Po s i t i v e d e m a n d - s u p p l y situation
Quality of Management
Competence
Sound business strategy
Excellence in execution
Rational dividend payout policy
Integrity
Honest and transparent
Concern for all stakeholders
Growth mindset
Long-range profit outlook
Efficient capital allocation, including growth by acquisitions
Quality of Business
Quality of business Quality of managementx
There are two aspects to Q: (1) Quality of business and (2) Quality of manage-ment. The rela�onship between the two is mul�plica�ve and not addi�ve. Thus, if one of the aspects is zero, Q will be equal to zero, no ma�er how high the other.
Quality is a subjec�ve concept, and yet there are several objec�ve indicators of the same, as listed below:
Q INDICATORS
Q Quality
Q =
5

Growth
"Growth creates value only when it takes place within the limits of a strong and sustainable company franchise, and these are rare.”GG Growth in earnings=
In inves�ng, there are two dimensions of growth: (1) Earnings growth and (2) Valua�on growth. The G of QGLP addresses earnings growth, whereas the P(rice) takes care of the Valua�on growth.
Earnings growth by itself doesn't mean much. It adds value only when the com-pany earns returns on capital higher than the cost of capital. Hence, growth is simply an amplifier: good when returns exceed the cost of capital, bad when returns are below the cost of capital, and neutral when returns equal the cost of capital.
In the final analysis, G (i.e. earnings growth in a company) is a quan�ta�ve reflec�on of Q (i.e. quality of business and management). G has four dimensions:
Mul�plica�ve dimensions ofearnings growth
EARNINGS GROWTH
Sales VolumeGrowth
Realisa�onGrowth
Opera�ngLeverage
FinancialLeverage
1. Volume growth - a func�on of demand growth matched by company's capacity to supply
2. Price growth - a func�on of company's pricing power, which in turn is a func�on of the compe��ve landscape
3. Opera�ng leverage - a func�on of the company's opera�ng cost structure. Higher the fixed cost, lower the unit cost incidence and higher the opera�ng leverage
4. Financial Leverage - a func�on of capital structure. Higher the debt-equity, higher the financial leverage and vice versa
6

L Longevity
L Longevity of quality and growth=
Having established the present quality and earnings growth of the company, the next challenge to investors is assessing how long it can sustain both. In the context of longevity, competence of management is tested at two levels:
(1) Extending CAP (i.e. Compe��ve Advantage Period), and
(2) Delaying growth slowdown.
"We like great companies with dominant positions, whose franchise is hard to duplicate and has tremendous staying power or some permanence to it.”
Extending CAP: Compe��ve Advantage Period (CAP) is the �me during which a company generates returns on investment that exceed its cost of capital. Compe��on eventually drives down returns to cost of capital, and some�mes even below it. However, a company with a great business and great management keeps extending its CAP, sustaining high return both for itself and its equity investors.
Delaying growth slowdown: Competent managements can delay growth slowdown by
(1) new streams of organic growth, and/or
(2) inorganic growth via judicious acquisi�ons.
Companies usually enjoy acertain CAP …
Compe��ve forces work tobring down excess return
RateofReturn
WACC
CAPTime (in years)
Return=WACC
… but high-quality companiestend to extend it
Incrementalexcess return
RateofReturn
WACC
CAP rolls over by 1 year
Time (in years)
Return=WACC
0 Year 1
WACC is the Weighted Average Cost of Capital
7

Case Study – Shriram Transport
PriceP "In the Bible, it says that love covers a mul�tude of sins. Well, in the inves�ng field, price covers a mul�tude of mistakes. For human beings, there is no subs�tute for love. For inves�ng there is no subs�tute for paying the right price – absolutely none.”
P Price (i.e. Favourable valua�on)=
Growth in stock price is a mul�plica�ve func�on of growth in earnings and growth in valua�on. The simplest way to improve the odds of valua�on growth is by ensuring favourable purchase price.
The price of a stock has to be seen in conjunc�on with the value it offers. Price is what we pay; value is what we get. Therefore, stock prices are a�rac�ve only when they are less than the value perceived in the stock.
A simple rule of thumb of favourable purchase price is low P/E, preferably single-digit. However, in certain situa�ons, low P/E may not be the sole determinant of favourable price e.g. during bo�om-of-the-cycle, earnings of cyclical stocks are depressed leading to high P/Es; likewise, where companies are expected to turn from loss to profit, current P/E cannot be calculated.
Ÿ Discount to historical valuation bands – P/E, Price/Book
Ÿ PEG Ratio (i.e. P/E ÷ Earnings growth; the lower the better)
Ÿ Discount to DCF value (Discounted Cash Flow) or Replacement cost
Few other measures of favourable purchase price
Ÿ Low Payback ratio (i.e. Market cap / Expected profits of next 5 years)
Ÿ High dividend yield
Ÿ Absolute market cap relative to the size of opportunity
Few other measures of favourable purchase price
8

For whom: Our equity expertise can be accessed by individual investors with an approach to long term savings through our Mutual Fund products for as low as Rs. 500 through a systematic investment plan (SIP).
Benefits: Our Mutual Fund Schemes pass through a rigorous investment process with an aim to deliver consistent performance. Investments in the Schemes can also be conveniently done online. As an investment house, since we have only one investment philosophy, we aim to keep life simple for us and our investors by having a focused menu of equity funds – one large cap, one midcap, one multicap, one tax saver fund and one dynamic fund.
MUTUAL
MOSt Focused 25
MOSt Focused Midcap 30
MOSt Focused Mul�cap 35
MOSt Focused Long Term
MOSt Focused Dynamic Equity
Invests in enduring wealth creators
Invests in emerging wealth creators
Invests in emerging and enduring wealth creators
Lock in fund that invests in wealth creators plus saves tax
Invest in equity, deriva�ves and debt instruments
Our Funds
FUNDS
Reap the full growthpoten�al of stocks
Low Churn
We do not buy morethan 20-25 stocks,reducing the riskof diversifica�on
FocusedPortfolio
Benefits of our Funds
9

For whom: Our PMS products are meant for financially savvy high net worth individuals (HNIs) who wish to u�lise our exper�se in building a por�olio of high quality companies or who have a large por�olio of stocks but lack the bandwidth to monitor them.
Benefits: With our Por�olio Management Services one can build an equity por�olio in the large cap and midcap segment with highly personalized service. Also, the 'Buy Right : Sit Tight' approach results in low churn in our por�olios and makes the cos�ng of our Por�olio Management Services very a�rac�ve.
Value Strategy
Next Trillion Dollar Opportunity Strategy
India Opportunity Por�olio Strategy
Concentrated large cap por�olio with only 15-20 stocks
Concentrated mul�cap por�olio with only 20-25 stocks
Concentrated midcap por�olio with only 15-20 stocks
PORTFOLIOMANAGEMENTSERVICES
Our Strategies
Benefits of our Strategies
Reap the full growthpoten�al of stocks
Low Churn
We do not buy morethan 20-25 stocks,reducing the riskof diversifica�on
FocusedPortfolio
High BrandRecall
Widely accepted anddistributed product
Behavior of an investor won't
impact the por�olio ofother investors
SegregatedPortfolio
One of the longestrunning strategies inthe industry with a
14+ years track record
Track Record Transparency
Transparency inpor�olio holdings,
transac�onsand expenses
10

1
2
3
4
5
6
7
8
9
10
Top 10 Holdings* Sector Allocation*
*Data as on January 31, 2018
Motilal Oswal MOSt Focused 25 Fund
Investment Objective : The investment objective of the Scheme is to achieve long term capital appreciation by investing in upto 25 companies with long term sustainable competitive advantage and growth potential. However, there can be no assurance or guarantee that the investment objective of the Scheme would be achieved.
Type of Scheme: An Open Ended Equity Scheme
Benchmark: Ni�y 50 Index
Entry: Nil
Exit Load: 1% if redeemed on or before 1 year from the date of allotment; Nil if redeemed a�er 1 year from the date of allotment
LARGE CAPFUND
“Date of inception: 13-May-2013. Incase, the start/end date of the concerned period is non business date (NBD), the NAV of the previous date is considered for computation of returns. The NAV per unit shown in the table is as on the start date of the said period. Past performance may or may not be sustained in the future. Performance is for Regular Plan Growth Option. Different plans have different expense structure. This scheme is currently managed by Mr. Siddharth Bothra. He has been managing this fund since 23-Nov-2016; Mr. Gautam Sinha Roy is the Co-Fund Manager for equity component since 26-Dec-2016 and Mr. Abhiroop Mukherjee is the Fund Manager for debt component since inception. The performance of the Schemes managed by them are on page no. 12,13,14,15 and 16. The scheme has been in existence for less than 5 years."
Inception date: 13-May-2013.For SIP returns, monthly investment of Rs. 10000/- invested on the 1st day of every month has been considered. Performance is for Regular Plan Growth Option . Past performance may or may not be sustained in the future.
SIP Performance*1 Year
MOStFocused 25 Nifty 50 Nifty 50MOSt
Focused 25
Since Inception
Invested Amount
Market Value
Returns (CAGR)%
132,060.55
19.07%
137,685.96
28.29%
458,440.84
16.32%
811,557.22
15.92%
MOStFocused 25 Nifty 50
467,889.35
17.76%
120,000 560,000360,000
849,884.15
17.95%
3 Year
Fund Manager
Mr. Siddharth Bothra -
Name Experience
Fund Manager
Mr. Gautam Sinha Roy -Co-Fund Manager
He has close to 14 years of experience in fund management and investment research. He has been co-managing this fund since 26-Dec-2016
He has a rich experience of more than 17 years in the field of research and investments. He has been managing this fund since 23-Nov-2016
HDFC Bank Ltd
Maruti Suzuki India Ltd
Housing Development Finance Corporation Ltd
ABB India Ltd
ICICI Lombard General Insurance Company Ltd
Container Corporation of India Ltd
HDFC Standard Life Insurance Company Ltd
United Spirits Ltd
Max Financial Services Ltd
Britannia Industries Ltd
9.24
9.03
8.75
6.25
5.82
5.42
5.32
5.07
4.81
4.77
MOSt Focused 25
Ni�y 50 Index (Benchmark)
NAV (Rs.) Per Unit (21.8644 as on 31-Jan-2018)
12,588
13,046
25.88
30.46
Performance*
Current Value ofInvestment of ` 10,000CAGR (%)
1 Year
17.3689
13,381
12,989
10.19
9.11
Current Value ofInvestment of ` 10,000CAGR (%)
3 Years
16.3405
21,864
19,557
18.01
15.26
Current Value ofInvestment of ` 10,000CAGR (%)
Since Inception
10.0000
3.32%
4.55%
5.97%
6.25%
6.95%
12.58%
12.63%
17.82%
29.11%
Cement
Consumer Durables
Petroleum Products
Industrial Capital Goods
Transportation
Auto
Consumer Non Durables
Bank
Finance
11
Sr. No. Name of Instrument % to Net Assets
Cash & Equivalent 0.81%
The performance of schemes of Motilal Oswal Mutual Fund is Benchmarked to the Total Return variant of respective Index chosen as Benchmark as against Price Return variant of respective Benchmark Index
1
2
3
4
5
6
7
8
9
10
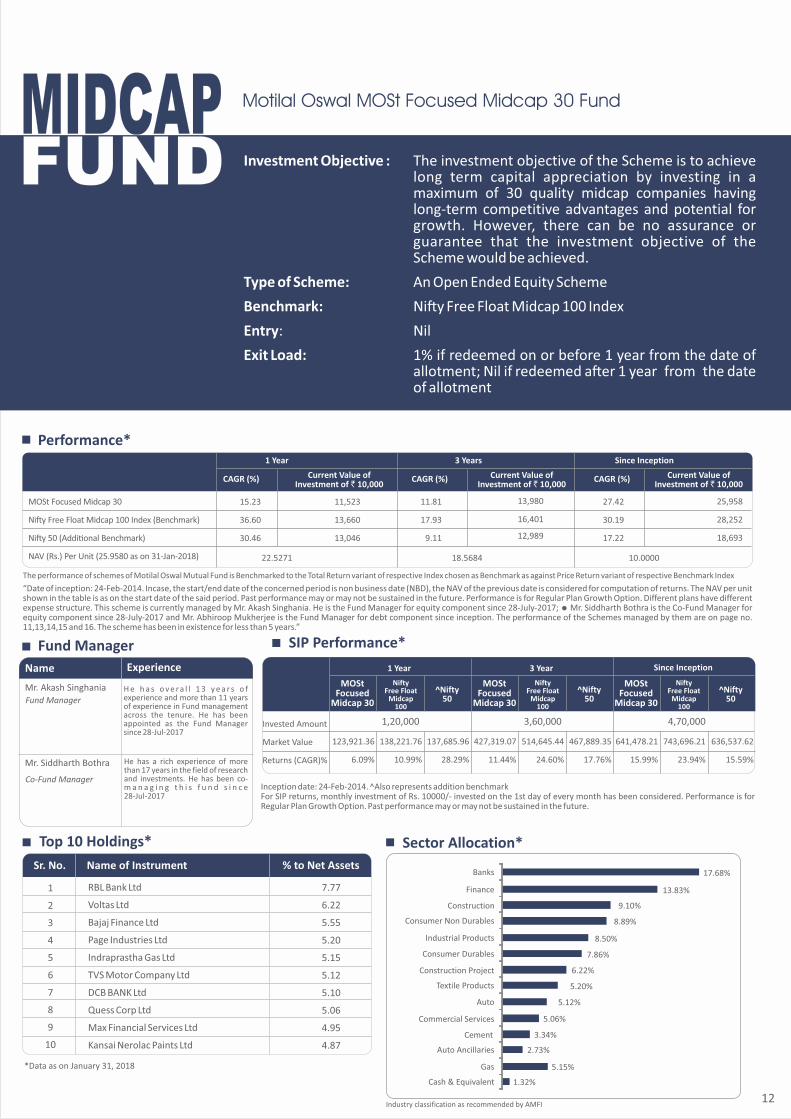
7.77
6.22
5.55
5.20
5.15
5.12
5.10
5.06
4.95
4.87
Top 10 Holdings* Sector Allocation*
12
MIDCAPFUND
Motilal Oswal MOSt Focused Midcap 30 Fund
Investment Objective : The investment objective of the Scheme is to achieve long term capital appreciation by investing in a maximum of 30 quality midcap companies having long-term competitive advantages and potential for growth. However, there can be no assurance or guarantee that the investment objective of the Scheme would be achieved.
Type of Scheme: An Open Ended Equity Scheme
Benchmark: Ni�y Free Float Midcap 100 Index
Entry: Nil
Exit Load: 1% if redeemed on or before 1 year from the date of allotment; Nil if redeemed a�er 1 year from the date of allotment
SIP Performance*
Inception date: 24-Feb-2014. ̂ Also represents addition benchmark For SIP returns, monthly investment of Rs. 10000/- invested on the 1st day of every month has been considered. Performance is for Regular Plan Growth Option. Past performance may or may not be sustained in the future.
RBL Bank Ltd
Voltas Ltd
Bajaj Finance Ltd
Page Industries Ltd
Indraprastha Gas Ltd
TVS Motor Company Ltd
DCB BANK Ltd
Quess Corp Ltd
Max Financial Services Ltd
Kansai Nerolac Paints Ltd
Fund Manager
Mr. Akash Singhania
Experience
Mr. Siddharth Bothra
Co-Fund Manager
He has a rich experience of more than 17 years in the field of research and investments. He has been co-m a n a g i n g t h i s f u n d s i n c e28-Jul-2017
H e h a s o v e r a l l 1 3 y e a r s o f experience and more than 11 years of experience in Fund management across the tenure. He has been appointed as the Fund Manager since 28-Jul-2017
Fund Manager
Name
“Date of inception: 24-Feb-2014. Incase, the start/end date of the concerned period is non business date (NBD), the NAV of the previous date is considered for computation of returns. The NAV per unit shown in the table is as on the start date of the said period. Past performance may or may not be sustained in the future. Performance is for Regular Plan Growth Option. Different plans have different expense structure. This scheme is currently managed by Mr. Akash Singhania. He is the Fund Manager for equity component since 28-July-2017; = Mr. Siddharth Bothra is the Co-Fund Manager for equity component since 28-July-2017 and Mr. Abhiroop Mukherjee is the Fund Manager for debt component since inception. The performance of the Schemes managed by them are on page no. 11,13,14,15 and 16. The scheme has been in existence for less than 5 years.”
Performance*
MOSt Focused Midcap 30
Ni�y Free Float Midcap 100 Index (Benchmark)
Ni�y 50 (Addi�onal Benchmark)
NAV (Rs.) Per Unit (25.9580 as on 31-Jan-2018)
11,523
13,660
13,046
15.23
36.60
30.46
Current Value ofInvestment of ` 10,000
CAGR (%)
1 Year
22.5271
13,980
16,401
12,989
11.81
17.93
9.11
Current Value ofInvestment of ` 10,000
CAGR (%)
3 Years
18.5684
25,958
28,252
18,693
27.42
30.19
17.22
Current Value ofInvestment of ` 10,000
CAGR (%)
Since Inception
10.0000
*Data as on January 31, 2018
1 Year
MOStFocused
Midcap 30
NiftyFree Float
Midcap100
Invested Amount
Market Value
Returns (CAGR)%
123,921.36
6.09%
1,20,000
138,221.76
10.99%
137,685.96
28.29%
^Nifty50
Since Inception3 Year
MOStFocused
Midcap 30
427,319.07
11.44%
3,60,000
514,645.44
24.60%
467,889.35
17.76%
^Nifty50
MOStFocused
Midcap 30
641,478.21
15.99%
4,70,000
743,696.21
23.94%
636,537.62
15.59%
^Nifty50
NiftyFree Float
Midcap100
NiftyFree Float
Midcap100
Sr. No. Name of Instrument % to Net Assets
5.15%
2.73%
3.34%
5.06%
5.12%
5.20%
6.22%
7.86%
8.50%
8.89%
9.10%
13.83%
17.68%
Gas
Auto Ancillaries
Cement
Commercial Services
Auto
Textile Products
Construction Project
Consumer Durables
Industrial Products
Consumer Non Durables
Construction
Finance
Banks
1.32%Cash & Equivalent
The performance of schemes of Motilal Oswal Mutual Fund is Benchmarked to the Total Return variant of respective Index chosen as Benchmark as against Price Return variant of respective Benchmark Index

1
2
3
4
5
6
7
8
9
10
9.88
8.42
8.04
5.27
4.82
4.65
4.29
4.23
4.12
4.03
Top 10 Holdings* Sector Allocation*
Motilal Oswal MOSt Focused Multicap 35 Fund
Investment Objective : The investment objective of the Scheme is to achieve long term capital appreciation by primarily investing in a maximum of 35 equity & equity related instruments across sectors and market capitalization levels. However, there can be no assurance or guarantee that the investment objective of the Scheme would be achieved.
Type of Scheme: An Open Ended Diversified Equity Scheme
Benchmark: Ni�y 500 Index
Entry: Nil
Exit Load: 1% if redeemed on or before 1 year from the date of allotment; Nil if redeemed a�er 1 year from the date of allotment
MULTICAPFUND
Inception date: 28-Apr-2014. ^Also represents addition benchmark. For SIP returns, monthly investment of Rs. 10000/- invested on the 1st day of every month has been considered. Performance is for Regular Plan Growth Option. Past performance may or may not be sustained in the future.
Fund Manager
Mr. GautamSinha Roy
Fund Manager
Name Experience
Mr. SiddharthBothra
Co-Fund Manager
He has a rich experience of more than 17 years in the field of research and investments. He has been co-managing this fund since 23-Nov-2016
He has close to 14 years of experience in fund management and investment research. He has been managing this fund since 5-May-2014
Housing Development Finance Corporation Ltd
Maruti Suzuki India Ltd
HDFC Bank Ltd
Hindustan Petroleum Corporation Ltd
Bharat Petroleum Corporation Ltd
IndusInd Bank Ltd
United Spirits Ltd
Jubilant Life Sciences Ltd
Interglobe Aviation Ltd
Eicher Motors Ltd
“Date of inception: 28-Apr-2014. Incase, the start/end date of the concerned period is non business date (NBD), the NAV of the previous date is considered for computation of returns. The NAV per unit shown in the table is as on the start date of the said period. Past performance may or may not be sustained in the future. Performance is for Regular Plan Growth Option. Different plans have different expense structure. This scheme is currently managed by Mr. Gautam Sinha Roy. He has been managing this fund since 5-May-2014; Mr. Siddharth Bothra is the Co-Fund Manager for equity component since 23-Nov-2016, Mr. Abhiroop Mukherjee is the Fund Manager for debt component since inception and Mr. Swapnil Mayekar for Foreign Securities since 10-Aug-2015. The performance of the Schemes managed by them are on page no. 11,12,14,15 and 16. The scheme has been in existence for less than 5 years."
MOSt Focused Mul�cap 35
Ni�y 500 Index (Benchmark)
Ni�y 50 (Addi�onal Benchmark)
NAV (Rs.) Per Unit (27.2911 as on 31-Jan-2018)
Performance*
*Data as on Jan 31, 2018
13,307
13,312
13,046
33.07
33.12
30.46
Current Value ofInvestment of ` 10,000
CAGR (%)
1 Year
20.5084
16,611
14,010
12,989
18.43
11.89
9.11
Current Value ofInvestment of ` 10,000
CAGR (%)
3 Years
16.4296
27,291
19,031
17,092
30.57
18.64
15.30
Current Value ofInvestment of ` 10,000
CAGR (%)
Since Inception
10.0000
SIP Performance*
13
1 Year
MOStFocused
Multicap 35
Nifty500
Invested Amount
Market Value
Returns (CAGR)%
134,488.49
23.02%
120,000
137,890.38
28.63%
137,685.96
28.29%
^Nifty50
Since Inception3 Year
MOStFocused
Multicap 35
501,604.27
22.74%
360,000
483,697.94
20.12%
467,889.35
17.76%
^Nifty50
MOStFocused
Multicap 35
696,488.95
23.84%
450,000
628.268.29
18.01%
600,475.02
15.50%
^Nifty50
Nifty500
Nifty500
Sr. No. Name of Instrument % to Net Assets
1.69%
3.00%
3.41%
4.12%
9.60%
9.64%
10.09%
12.44%
17.44%
27.54%
Software
Consumer Durables
Gas
Transportation
Consumer Non Durables
Pharmaceuticals
Petroleum Products
Auto
Banks
Finance
1.03%Cash & Equivalent
The performance of schemes of Motilal Oswal Mutual Fund is Benchmarked to the Total Return variant of respective Index chosen as Benchmark as against Price Return variant of respective Benchmark Index

1
2
3
4
5
6
7
8
9
10
9.32
8.28
8.22
6.24
5.14
5.01
4.71
4.68
4.52
4.38
Top 10 Holdings* Sector Allocation*
14
Motilal Oswal MOSt Focused Long Term Fund
Investment Objective : The investment objective of the Scheme is to generate long-term capital appreciation from a diversified portfolio of pre-dominantly equity and equity related instruments. However, there can be no assurance or guarantee that the investment objective of the Scheme would be achieved.
Type of Scheme: An open ended equity linked saving scheme with a 3 year lock-in.
Benchmark: Ni�y 500 Index
Entry / Exit Load: Nil
TAX SAVERFUND
SIP Performance*1 Year
MOStFocused
Long TermNifty 500 ^Nifty 50
MOStFocused
Long TermNifty 500
Since Inception/3 Years
^Nifty 50
Inception date: 21-Jan-2015. ̂ Also represents addition benchmarkFor SIP returns, monthly investment of Rs. 10000/- invested on the 1st day of every month has been considered. Performance is for Regular Plan Growth Option. Past performance may or may not be sustained in the future.
Invested Amount
Market Value
Returns (CAGR)%
137,231.51
27.54%
120,000 360,000
137,890.38
28.63%
137,685.96
28.29%
525,352.92
26.09%
483.844.77
20.13%
467,992.45
17.76%
Fund Manager
Mr. Gautam Sinha Roy -
Name Experience
Fund Manager
Mr. Siddharth Bothra -Co-Fund Manager
He has a rich experience of more than 17 years in the field of research and investments. He has been co-managing this fund since 26-Dec-2016
He has close to 14 years of experience in fund management and investment research. He has been managing this fund since inception
Housing Development Finance Corporation Ltd
Maruti Suzuki India Ltd
HDFC Bank Ltd
IndusInd Bank Ltd
Jubilant Life Sciences Ltd
Bharat Petroleum Corporation Ltd
ICICI Lombard General Insurance Company Ltd
Interglobe Aviation Ltd
Eris Lifesciences Ltd
Petronet LNG Ltd
“Date of inception: 21-Jan-2015. Incase, the start/end date of the concerned period is non business date (NBD), the NAV of the previous date is considered for computation of returns. The NAV per unit shown in the table is as on the start date of the said period. Past performance may or may not be sustained in the future. Performance is for Regular Plan Growth Option. Different plans have different expense structure. This scheme is currently managed by Mr. Gautam Sinha Roy. He has been managing this fund since inception; Mr. Siddharth Bothra is the Co-Fund Manager for equity component since 26-Dec-2016 and Mr. Abhiroop Mukherjee is the Fund Manager for debt component since inception. The performance of the Schemes managed by them are on page no. 11,12,13,15 and 16. The scheme has been in existence for less than 5 years."
MOSt Focused Long Term
Ni�y 500 Index (Benchmark)
Ni�y 50 (Addi�onal Benchmark)
NAV (Rs.) Per Unit (18.3360 as on 31-Jan-2018)
13,576
13,312
13,046
35.76
33.12
30.46
Performance*
Current Value of Investmentof ` 10,000
CAGR (%)
1 Year
13.5057
18,336
14,144
13,109
22.15
12.12
9.35
Current Value of Investmentof ` 10,000
CAGR (%)
Since Inception
10.3905
*Data as on January 31, 2018
Sr. No. Name of Instrument % to Net Assets
1.68%Auto Ancillaries
1.89%Pesticides
3.32%
3.48%
4.18%
4.38%
4.68%
7.64%
12.29%
12.57%
14.45%
26.09%
Consumer Non Durables
Commercial Services
Software
Gas
Transportation
Petroleum Products
Auto
Pharmaceuticals
Banks
Finance
2.49%Consumer Durables
17,647
14,010
12,989
20.84
11.89
9.11
Current Value of Investmentof ` 10,000
CAGR (%)
3 Years
10.0000
0.86%Cash & Equivalent
The performance of schemes of Motilal Oswal Mutual Fund is Benchmarked to the Total Return variant of respective Index chosen as Benchmark as against Price Return variant of respective Benchmark Index

NAV (Rs.) Per Unit (12.1447 : as on 31-Jan-2018)
20.36
21.04
30.46
12,036
12,104
13,046
15.54
15.67
20.48
12,145
12,164
12,848
Date of inception: 27-Sep-2016 Incase, the start/end date of the concerned period is non business date (NBD), the NAV of the previous date is considered for computation of returns. The NAV per unit shown in the table is as on the start date of the said period. Past performance may or may not be sustained in the future. Performance is for Regular Plan Growth Option. Different plans have different expense structure. This scheme is currently managed by Mr. Gautam Sinha Roy. He has been managing this fund since 23-Nov-2016; Mr. Siddharth Bothra is the Co-Fund Manager for equity component since 23-Nov-2016 and Mr. Abhiroop Mukherjee is the Fund Manager for debt component since inception. The performanceof the Schemes managed by them are on page no. 11,12,13,14 and 16. The scheme has been in existence for less than 3 years
MOSt Focused Dynamic Equity
Performance*
Current Value of Investment of ` 10,000CAGR (%)
1 Year
10.0900
Current Value of Investment of ` 10,000CAGR (%)
Since Inception
10.0000
CRISIL Hybrid 35 + 65 - Aggressive Index
Nifty 50 (Additional Benchmark)
Motilal Oswal MOSt Focused Dynamic Equity Fund
Investment Objective : The investment objective is to generate long term capital appreciation by investing in equity and equity related instruments including equity derivatives as well as debt instruments. However, there can be no assurance or guarantee that the investment objective of the Scheme would be achieved.
Type of Scheme: An open ended equity scheme
Benchmark: CRISIL Hybrid 35 + 65 - Aggressive Index
Entry: Nil
Exit Load: 1% if redeemed on or before 1 year from the date of allotment; Nil if redeemed a�er 1 year from the date of allotment
DYNAMICFUND
Fund Manager
Mr. Gautam Sinha Roy -
Name Experience
Fund Manager
He has close to 14 years of experience in fund management and investment research. He has been managing this fund since 23-Nov-2016
He has a rich experience of more than 17 years in the field of research and investments. He has been co-managing this fund since 23-Nov-2016
Mr. Siddharth Bothra -Co-Fund Manager
Mr. Abhiroop Mukherjee -Fund Manager for Debt Component
He has 10 years of experience in Trading Fixed Income Securities viz. G-sec, T-bills, Corporate Bonds CP, CD etc. He has been managing this fund since inception
1
2
3
4
5
6
Allocation*
Total Equity
Bonds and NCDs
Fixed Deposits
CBLO
Cash and Cash Equivalent (including Book Value of Futures)
Equity Derivatives
Total
64.98
24.34
0.79
3.41
31.57
-25.1
100.00
*Data as on January 31, 2018
Sector Allocation*
15
* Also represents addition benchmarkDate of inception: 27-Sep-2016 For SIP returns, monthly investment of ̀ 10,000/- invested on the 1st day of every month has been considered. Performance is for Regular Plan Growth Option. Past performance may or may not be sustained in the future.
Housing Development Finance Corporation Ltd1 8.70
Maruti Suzuki India Ltd2 7.79
Lupin Ltd3 5.21
HDFC Bank Ltd4 4.71
Bajaj Finance Ltd5 4.46
Jubilant Life Sciences Ltd6 3.47
Titan Company Ltd7 3.13
Max Financial Services Ltd8 2.71
Eicher Motors Ltd9 2.69United Spirits Ltd10 2.68
SIP Performance*1 Year Since Inception
Invested Amount 120,000
Market Value
Returns (CAGR)%
MOStFocused
Dynamic Equity
CRISIL Hybrid 35 + 65
Aggressive Index Nifty 50*
129,563.40
15.04%
131,636.50
18.38%
137,686.96
28.29%
160,000
178,595.80
16.51%
180,925.05
18.58%
190,785.99
27.41%
MOStFocused
Dynamic Equity Nifty 50*
Transportation
Petroleum Products
Consumer Durables
Consumer Non Durables
Bank
Pharmaceuticals
Auto
Finance
2.08%
2.68%
3.11%
3.13%
3.32%
6.64%
10.00%
10.48%
20.28%
Commercial Services
Sr. No. Name of Instrument % to Net AssetsCRISIL Hybrid
35 + 65Aggressive Index
1.80%Software
1.46%Gas
The performance of schemes of Motilal Oswal Mutual Fund is Benchmarked to the Total Return variant of respective Index chosen as Benchmark as against Price Return variant of respective Benchmark Index

OTHERFUNDS
MOSt Ultra Short Term Bond Fund Performance*
“Date of inception: 6-Sep-13. Incase, the start/end date of the concerned period is non business date (NBD), the NAV of the previous date is considered for computation of returns. The NAV per unit shown in the table is as on the start date of the said period. Past performance may or may not be sustained in the future. Performance is for Regular Plan Growth Option. Different plans have different expense structure. This scheme is currently managed by Mr. Abhiroop Mukherjee. He has been managing this fund since inception; The performance of the Schemes managed by him are on page no. 11 to 15. The scheme has been in existence for less than 5 years."
Motilal Oswal MOSt Shares NASDAQ 100 ETF Performance*
Mr. Abhiroop Mukherjee is the fund manager of the scheme MOSt Ultra Short Term Bond Fund and for the debt component of the scheme MOSt Focused 25, MOSt Focused Midcap 30, MOSt Focused Multicap 35, MOSt Focused Long Term and MOSt Focused Dynamic Equity.
Mr. Swapnil Mayekar is the fund manager of the scheme Motilal Oswal MOSt shares NASDAQ 100 ETF & for foreign securities of the scheme, Motilal Oswal MOSt Focused Multicap 35 fund.
16
MOSt Ultra Short Term Bond Fund
CRISIL Short Term Bond Fund Index (Benchmark)
CRISIL LIQUIFEX (Addi�onal Benchmark)
NAV (Rs.) Per Unit (13.2724 as on 31-Jan-2018)
10,548
10,538
10,668
5.48
5.38
6.68
Current Value ofInvestment of ` 10,000
CAGR (%)
1 Year
11,951
12,562
12,391
6.11
7.88
7.39
Current Value ofInvestment of ` 10,000
CAGR (%)
3 Years
13,272
14,508
14,069
6.64
8.81
8.06
Current Value ofInvestment of ` 10,000
CAGR (%)
Since Inception
10.0000
“Date of inception: 29-Mar-11. Incase, the start/end date of the concerned period is non business date (NBD), the NAV of the previous date is considered for computation of returns. The NAV per unit shown in the table is as on the start date of the said period. Past performance may or may not be sustained in the future. Performance is for Regular Plan Growth Option. Different plans have different expense structure.This scheme is currently managed by Mr. Swapnil Mayekar. He has been managing this fund since 10-Aug-2015". Other Scheme managed by him are on page 13.
MOSt Shares NASDAQ 100
NASDAQ 100 Index (In INR) (Benchmark)
Ni�y 50 (Addi�onal Benchmark)
NAV (Rs.) Per Unit ( 432.8965 as on 31-Jan-2018)
12,543
12,797
13,046
25.43
27.97
30.46
Current Valueof Investment
of ` 10,000CAGR (%)
1 Year
345.1358
16,796
17,679
12,989
18.87
20.92
9.11
Current Valueof Investment
of ` 10,000CAGR (%)
3 Years
257.7351
41,933
46,459
20,909
23.28
25.14
11.37
Current Valueof Investment
of ` 10,000CAGR (%)
Since Inception
103.2365
29,753
32,164
19,415
24.37
26.32
14.19
Current Valueof Investment
of ` 10,000CAGR (%)
5 Years
145.4945
12.5825 16.3405
*Data as on January 31, 2018
The performance of schemes of Motilal Oswal Mutual Fund is Benchmarked to the Total Return variant of respective Index chosen as Benchmark as against Price Return variant of respective Benchmark Index

PRODUCTLABEL
*Investors should consult their financial advisors if in doubt about whether the product is suitable for them.
Name of the Scheme This product is suitable for investors who are seeking*
Motilal Oswal MOStFocused 25 Fund(MOSt Focused 25)
• Return by investing in upto 25 companies with long term sustainable competitive advantage and growth potential
• Investment in Equity and equity related instruments subject to overall limit of 25 companies
Motilal Oswal MOSt FocusedMidcap 30 Fund(MOSt Focused Midcap 30)
• Long-term capital growth• Investment in equity and equity related instruments in a maximum of 30
quality mid-cap companies having long-term competitive advantages and potential for growth
Motilal Oswal MOSt FocusedMulticap 35 Fund(MOSt Focused Multicap 35)
• Long-term capital growth• Investment in a maximum of 35 equity and equity related instruments
across sectors and market capitalization levels.
Motilal Oswal MOSt FocusedLong Term Fund(MOSt Focused Long Term)
• Long-term capital growth• Investment predominantly in equity and equity related instruments
Low
Modera
tely
Low
High
ModeratelyHigh
Moderate
HighLow
Investors understand that their principal will be at Moderately High risk
Riskometer
Motilal Oswal MOStUltra Short Term Bond Fund(MOSt Ultra Short Term Bond)
• Optimal returns consistent with moderate levels of risk • Investment in debt securities and money market securities with average
maturity less than equal to 12 months
Motilal Oswal MOSt SharesNASDAQ-100 ETF(MOSt Shares NASDAQ 100)
• Return that corresponds generally to the performance of the NASDAQ 100 Index, subject to tracking error
• Investment in equity securities of NASDAQ 100 Index Low
Modera
tely
Low
High
ModeratelyHigh
Moderate
HighLow
Investors understand that their principal will be at High risk
Riskometer
Low
Modera
tely
Low
High
ModeratelyHigh
Moderate
HighLow
Investors understand that their principal will be at Moderately Low risk
Riskometer
Motilal Oswal MOSt FocusedDynamic Equity Fund(MOSt Focused Dynamic Equity)
• Long term capital appreciation• Investment in equity, derivatives and debt instruments
17

Value Strategy
Key Portfolio Analysis
Performance
The Strategy aims to benefit from the long term compounding effect on investments done in good businesses, run by great business managers for superior wealth creation.
Sr. No. Name of Instrument % to Net Assets
1
2
3
4
5
6
7
8
9
10
HDFC Bank Ltd.
Bharat Petroleum Corporation Ltd.
Kotak Mahindra Bank Ltd.
Asian Paints Ltd.
AU Small Finance Bank Ltd.
Bharat Forge Ltd.
Larsen & Toubro Ltd.
HDFC
Eicher Motors Ltd.
Sun Pharmaceuticals Ltd.
10.61
8.19
8.09
6.55
6.43
6.19
5.81
5.77
5.73
5.61
Top 10 HoldingsStrategy Details
Shrey Loonker
Kunal Jadhwani
Open ended
24th March 2003
Nifty 50 Index
3 Years +
Daily
Daily
Daily
LARGE CAPSTRATEGY
Ÿ Concentrated large cap with only 15-20 stocks
Ÿ One of the longest running products in the industry with a 14 years track record
Ÿ The corpus under this Strategy is over Rs. 2,826 cr as on January 31, 2018
Investment objective:
Performance Data (Since Inception) Value Strategy Nifty 50 Index
46.50
19.56
10.34
6.55
5.81
Sector Allocation
Sr. No. Sector Allocation % Allocation
1
2
3
4
5
Banking & Finance
Auto & Auto Ancillaries
Oil and Gas
FMCG
Engineering & Electricals
Fund Manager:
Co - Fund Manager:
Strategy Type:
Date of Incep�on:
Benchmark:
Investment Horizon:
Subscrip�on:
Redemp�on :
Valua�on Point:
Both, Value Strategy and Nifty 50 Index are rebased to 10 as on Mar 24, 2003
The Above strategy returns are of a Model Client as on January 31, 2018. Returns of individual clients may differ depending on factors such as time of entry/exit/ additional inflows in the strategies. The stocks forming part of the existing portfolio may or may not be bought for new client. Returns below 1 year are absolute and above 1 year are annualized. Strategy returns shown above are post fees & expenses. Past performance should not be used as a basis for comparison with other investments. Past performance may or may not be sustained in future.
Data as on January 31, 2018
Value Strategy Ni�y 50 Index
Inve
stm
ent
Val
ue
-10.00
40.00
90.00
140.00
190.00
240.0026.42X
10.90X
Ma
r-0
3
No
v-0
3
Jul-
04
Ma
r-0
5
No
v-0
5
Jul-
06
Ma
r-0
7
No
v-0
7
Jul-
08
Ma
r-0
9
No
v-0
9
Jul-
10
Ma
r-1
1
No
v-1
1
Jul-
12
Ma
r-1
3
No
v-1
3
Jul-
14
Ma
r-1
5
No
v-1
5
Jul-
16
Ma
r-1
7
Jan
-18
18
Standard Deviation (%)
Beta
22.98%
1.00
20.77%
0.82
Next Trillion Dollar Opportunity Strategy (NTDOP)
Key Portfolio Analysis
Performance Data (Since Inception) Nifty 500 IndexNTDOP Strategy
Performance
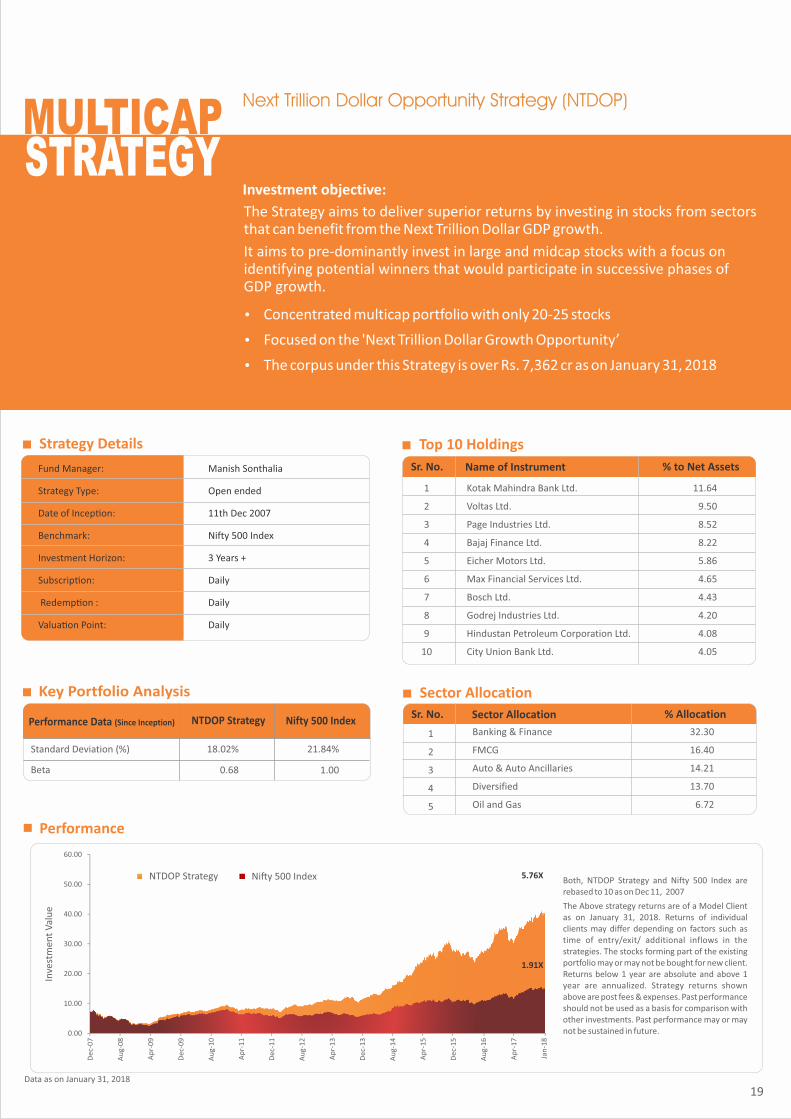
The Strategy aims to deliver superior returns by investing in stocks from sectors that can benefit from the Next Trillion Dollar GDP growth.
It aims to pre-dominantly invest in large and midcap stocks with a focus on identifying potential winners that would participate in successive phases of GDP growth.
Inve
stm
ent
Val
ue
NTDOP Strategy Ni�y 500 Index
Fund Manager:
Strategy Type:
Date of Incep�on:
Benchmark:
Investment Horizon:
Subscrip�on:
Redemp�on :
Valua�on Point:
Manish Sonthalia
Open ended
11th Dec 2007
Nifty 500 Index
3 Years +
Daily
Daily
Daily
Strategy Details
MULTICAPSTRATEGY
Ÿ Concentrated multicap portfolio with only 20-25 stocks
Ÿ Focused on the 'Next Trillion Dollar Growth Opportunity’
Ÿ The corpus under this Strategy is over Rs. 7,362 cr as on January 31, 2018
Investment objective:
Sr. No. Name of Instrument % to Net Assets
1
2
3
4
5
6
7
8
9
10
Top 10 Holdings
32.30
16.40
14.21
13.70
6.72
Sector Allocation
Sr. No. Sector Allocation % Allocation
1
2
3
4
5
Banking & Finance
FMCG
Auto & Auto Ancillaries
Diversified
Oil and Gas
Kotak Mahindra Bank Ltd.
Voltas Ltd.
Page Industries Ltd.
Bajaj Finance Ltd.
Eicher Motors Ltd.
Max Financial Services Ltd.
Bosch Ltd.
Godrej Industries Ltd.
Hindustan Petroleum Corporation Ltd.
City Union Bank Ltd.
11.64
9.50
8.52
8.22
5.86
4.65
4.43
4.20
4.08
4.05
Data as on January 31, 2018
0.00
10.00
20.00
30.00
40.00
50.00
60.00
De
c-0
7
Au
g-0
8
Ap
r-0
9
De
c-0
9
Au
g-1
0
Ap
r-1
1
De
c-1
1
Au
g-1
2
Ap
r-1
3
De
c-1
3
Au
g-1
4
Ap
r-1
5
De
c-1
5
Au
g-1
6
Ap
r-1
7
Jan
-18
5.76X
Both, NTDOP Strategy and Nifty 500 Index are rebased to 10 as on Dec 11, 2007
The Above strategy returns are of a Model Client as on January 31, 2018. Returns of individual clients may differ depending on factors such as time of entry/exit/ additional inflows in the strategies. The stocks forming part of the existing portfolio may or may not be bought for new client. Returns below 1 year are absolute and above 1 year are annualized. Strategy returns shown above are post fees & expenses. Past performance should not be used as a basis for comparison with other investments. Past performance may or may not be sustained in future.
19
1.91X
Standard Deviation (%)
Beta
21.84%
1.00
18.02%
0.68
India Opportunity Portfolio Strategy (IOP)
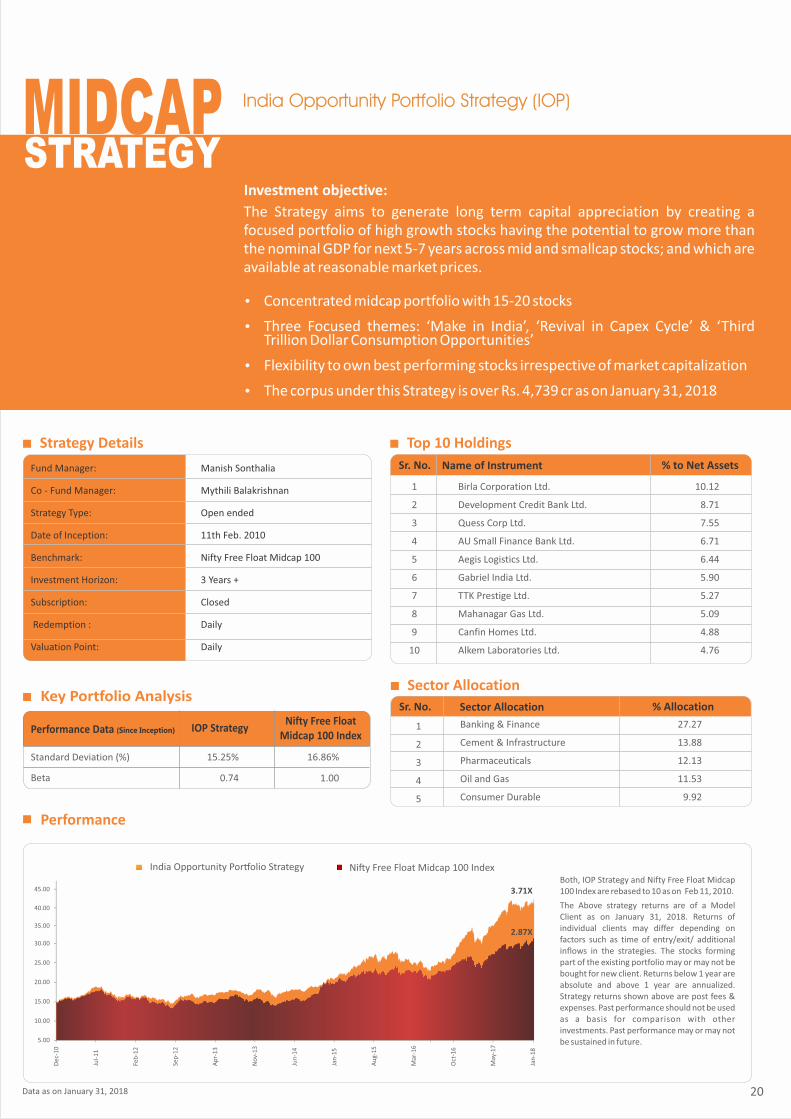
Manish Sonthalia
Mythili Balakrishnan
Open ended
11th Feb. 2010
Nifty Free Float Midcap 100
3 Years +
Closed
Daily
Daily
Strategy Details
Fund Manager:
Co - Fund Manager:
Strategy Type:
Date of Inception:
Benchmark:
Investment Horizon:
Subscription:
Redemption :
Valuation Point:
Key Portfolio Analysis
Performance
MIDCAPSTRATEGY
Both, IOP Strategy and Nifty Free Float Midcap 100 Index are rebased to 10 as on Feb 11, 2010.
The Above strategy returns are of a Model Client as on January 31, 2018. Returns of individual clients may differ depending on factors such as time of entry/exit/ additional inflows in the strategies. The stocks forming part of the existing portfolio may or may not be bought for new client. Returns below 1 year are absolute and above 1 year are annualized. Strategy returns shown above are post fees & expenses. Past performance should not be used as a basis for comparison with other investments. Past performance may or may not be sustained in future.
Sr. No. Name of Instrument % to Net Assets
1
2
3
4
5
6
7
8
9
10
Birla Corporation Ltd.
Development Credit Bank Ltd.
Quess Corp Ltd.
AU Small Finance Bank Ltd.
Aegis Logistics Ltd.
Gabriel India Ltd.
TTK Prestige Ltd.
Mahanagar Gas Ltd.
Canfin Homes Ltd.
Alkem Laboratories Ltd.
10.12
8.71
7.55
6.71
6.44
5.90
5.27
5.09
4.88
4.76
Top 10 Holdings
27.27
13.88
12.13
11.53
9.92
Sector Allocation
Sr. No. Sector Allocation % Allocation
1
2
3
4
5
Banking & Finance
Cement & Infrastructure
Pharmaceuticals
Oil and Gas
Consumer Durable
The Strategy aims to generate long term capital appreciation by creating a focused portfolio of high growth stocks having the potential to grow more than the nominal GDP for next 5-7 years across mid and smallcap stocks; and which are available at reasonable market prices.
Ÿ Concentrated midcap portfolio with 15-20 stocks
Ÿ Three Focused themes: ‘Make in India’, ‘Revival in Capex Cycle’ & ‘Third Trillion Dollar Consumption Opportunities’
Ÿ Flexibility to own best performing stocks irrespective of market capitalization
Ÿ The corpus under this Strategy is over Rs. 4,739 cr as on January 31, 2018
Investment objective:
Performance Data (Since Inception)Nifty Free Float
Midcap 100 IndexIOP Strategy
Standard Deviation (%)
Beta
16.86%
1.00
15.25%
0.74
Data as on January 31, 2018
India Opportunity Por�olio Strategy Ni�y Free Float Midcap 100 Index
3.71X
5.00
10.00
15.00
20.00
25.00
30.00
Dec
-10
Jul-
11
Feb
-12
Sep
-12
Ap
r-13
No
v-13
Jun
-14
Jan
-15
Au
g-15
Mar
-16
Oct
-16
May
-17
Jan
-18
2.37X
3.15X
20
2.87X35.00
40.00
45.00

TEAMMANAGEMENT
21
Raamdeo AgrawalChairman
Aashish P Somaiyaa CEO
MFFund
Manager
Gautam Sinha RoyVice President & Fund Manager
Equity Mutual Funds
Siddharth BothraSr. Vice President & Fund Manager
Equity Mutual Funds
Akash SinghaniaSr. Vice President & Fund Manager
Equity Mutual Funds
PMSFund
Manager
Manish SonthaliaSr. Vice President & Head Equity PMS
Mythili BalakrishnanVice President & Fund Manager
Equity PMS
Kunal JadhwaniVice President & Fund Manager
Equity PMS
Shrey LoonkerVice President & Fund Manager
Equity PMS

DISCLAIMER
This document has been issued on the basis of internal data, publicly available information and other sources believed to be reliable. The information contained in this document is for general purposes only and not a complete disclosure of every material fact. The information / data herein alone is not sufficient and shouldn't be used for the development or implementation of an investment strategy. It should not be construed as investment advice to any party. All opinions, figures, estimates and data included in this document are as on the date mentioned in the document. The document does not warrant the completeness or accuracy of the information and disclaims all liabilities, losses and damages arising out of the use of this information. The statements contained herein may include statements of future expectations and other forward-looking statements that are based on our current views and assumptions and involve known and unknown risks and uncertainties that could cause actual results, performance or events to differ materially from those expressed or implied in such statements. Readers shall be fully responsible/liable for any decision taken on the basis of this document. Investments in Securities are subject to market and other risks and there is no assurance or guarantee that the objectives of any of the strategies of the Portfolio Management Services will be achieved. Name of the Scheme(s)/Strategy(ies) does not in any manner indicate its future prospects and returns. Investors are advised to consult his / her own professional advisor. Past performance may or may not be sustained in future.
Mutual Fund investments are subject to market risks, read all scheme related documents carefully22

For any Mutual Fund queries, please write to mfservice@mo�laloswal.com, Similarly for PMS queries, please write to MOAMC.Customercare@mo�laloswal.com or visit mo�laloswalmf.com
THINK EQUITYTHINK MOTILAL OSWAL