buy right : sit tight 30 years of capital markets experience of our sponsors molal oswal securies...
TRANSCRIPT

BUY RIGHT : SIT TIGHTBuying quality companies and riding their growth cycle
THINK EQUITYTHINK MOTILAL OSWAL

Mo�lal Oswal Asset Management Company (MOAMC) is one of India's fastest
growing asset management companies.
With a focus on equity inves�ng and equity investment exper�se inherited from
over 30 years of capital markets experience of our sponsors Mo�lal Oswal
Securi�es Ltd., we have created a single inves�ng philosophy be it Mutual Fund
(MF) or Por�olio Management Services (PMS).
Like our inves�ng philosophy, our product basket is also focused with
concentrated 'buy and hold' PMS Strategies and Mutual Fund schemes in the
Large Cap, Midcap and Mul�cap space respec�vely.
Our Value Strategy is one of the longest running products in PMS with a track
record of 14 years. And our MF offerings come with unique features such as “Low
Churn” and “Focused” por�olios.
With an investment management team of 21; we aim to be seen as an investment
management house focused on wholesaling through marquee distribu�on
pla�orms and strong rela�onships, backed by performance track record.
AMC
MOTILALOSWAL
1

SIT TIGHTBUY RIGHT
At Mo�lal Oswal Asset Management Company (MOAMC), our
investment philosophy is centered on two cri�cal pillars of equity
inves�ng – 'Buy Right: Sit Tight'. 'Buy Right' means buying quality
companies at a reasonable price and 'Sit Tight' means staying invested
in them for a long �me to realise the full growth poten�al of the stocks.
Our Investment Philosophy
Data as on March 31, 2018
Past performance may or may not be sustained in future.
For detailed performance tables, please refer page no. 11 to 16 for Mutual Fund Schemes and 18 to 20 for Strategies of Por�olio Management Services
Process2Performance
Delivered an annualized return of 25.14% since incep�on as a ainst
25.73% by Ni�y Midap 100 TRI
Delivered an annualized return of 15.84% since incep�on as a ainst
12.79% by Ni�y 50 TRI
MOF35Incep�on Date:28 Apr 2014
MOF25Incep�on Date: 13 May 2013
MOF30 Incep�on Date: 24 Feb 2014
Delivered an annualized return of 17.99% since incep�on as a ainst 5.59%
by Ni�y 500 Ind xNTDOP StrategyIncep�on D te: 11 Dec 2007
Delivered an annualized return of 19.76% since incep�on as
against 8.66% by Ni�y5 00 TRIMOFLTE
Incep�on Date: 21 Jan 2015
Delivered an annualized return of 27.93% since incep�on as a ainst
15.39% by Ni�y 500 TRI
Delivered an annualized return of 15.85% since incep�on as a ainst
12.41% by Ni�y Midap 100 IndexIOP Strategy Incep�on Date: 11 Feb 2010
Delivered an annualized return of 23.93% since incep�on as a ainst 16.56%
by Ni�y 50 Ind xValue Strategy Incep�on Date: 24 Mar 2003
2
MOFDYNAMICIncep�on Date:27 Sep 2016
Delivered an annualized return of 13.02% since incep�on as a ainst
10.46% by CRISIL Hybrid 35 + 65 - Aggressive TRI

How do we 'Buy Right' ?
Over the last 22 years, our chairman, Raamdeo Agrawal (one of India's foremost
value investors) has been analyzing the Indian equity market to come up with
inves�ng insights in the form of the Annual Mo�lal Oswal Wealth Crea�on Study.
The learnings from all these studies have helped us evolve a unique and focused
inves�ng process - 'QGLP'.
Every stock we buy in our Mutual Fund Schemes or PMS Strategies is based on
our QGLP parameters.
RIGHTBUY
Qfor QUALITY
Gfor GROWTH
Lfor LONGEVITY
Pfor PRICE
‘Quality’ denotes quality of the business and management
‘Growth’ denotes growth in earnings and sustained RoE
‘Longevity’ denotes longevity of the compe��ve
advantage or economic moat of
the business
‘Price’ denotes our approach of
buying a good business for a fair price rather than
buying a fair business for a
good price
Performance of QGLP stocks
Company Name CAGR %
Eicher Motors Ltd
Berger Paints Ltd
Pidilite Industries Ltd
Asian Paints Ltd
HDFC Bank Ltd
60.42
34.81
30.02
25.02
21.75
Here are a few more examples that show how QGLP stocks have fared in terms of compounded annual growth return (CAGR) over the last 20 years or since lis�ng; whichever is later.
The given stocks are part of por�olio. The Stocks men�oned above are used to explain the concept and are for illustra�on purpose only and should not be used for development or implementa�on of an investment strategy. It shall not be cons�tute as an advice, an offer to sell/purchase or as an invita�on or solicita�on to do so for any securi�es. The statements made herein may include statements of future expecta�ons and other forward-looking statements that are based on our current views and assump�ons and involve known and unknown risks and uncertain�es that could cause actual results, performance or events to differ materially from those expressed or implied in such statements. Past performance may or may not be sustained in future. Source: Bloomberg Consensus & Internal Research
Data as on March 31, 2018
3
TIGHTSIT
While Buying Right is all about following a process, Si�ng Tight on a good buy
requires Focus & Discipline.
Buy and Hold: We believe in focused stock por�olios and are strictly buy and hold
investors and believe that while picking the right business needs skill; holding onto
these businesses to enable our investors to benefit from the en�re growth cycle
needs even more skill.
Focus: Our por�olios are high convic�on por�olios with 20 to 25 stocks being our
ideal number. We believe in adequate diversifica�on as over-diversifica�on
results in dilu�ng returns for our investors and adding market risk.
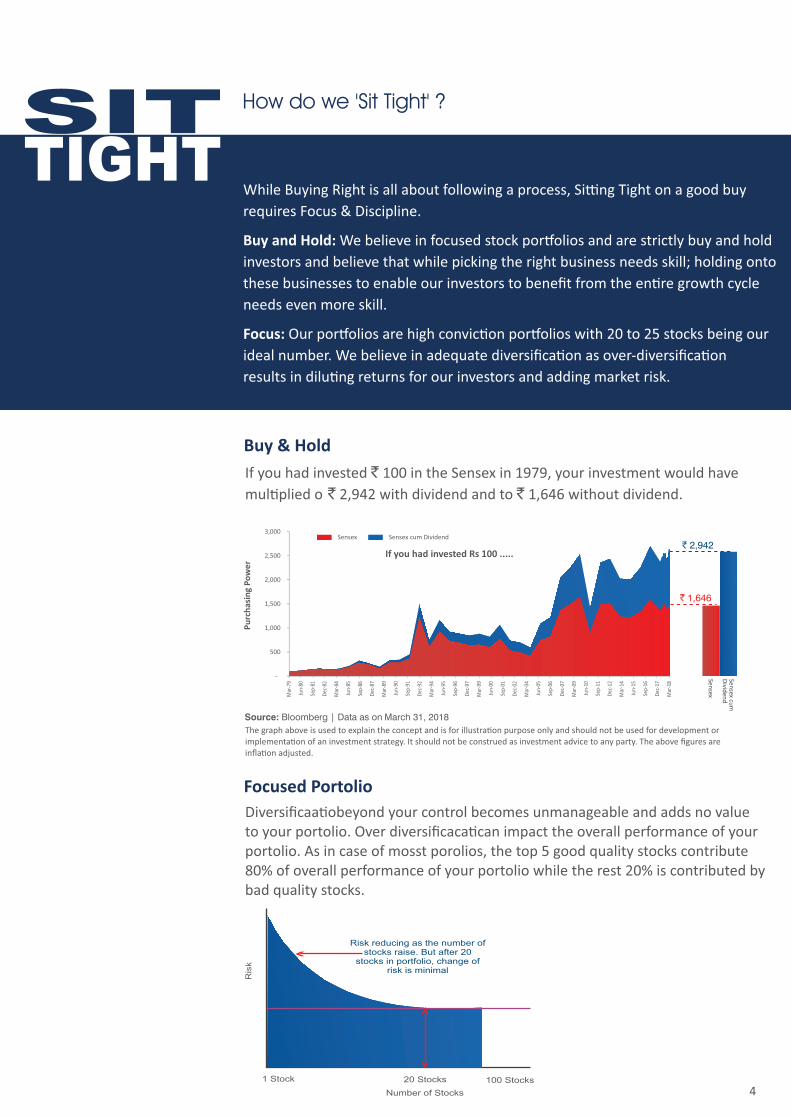
Source: Bloomberg | Data as on March 31, 2018
The graph above is used to explain the concept and is for illustra�on purpose only and should not be used for development or implementa�on of an investment strategy. It should not be construed as investment advice to any party. The above figures are infla�on adjusted.
Focused Portolio
Ris
k
1 Stock 20 Stocks 100 Stocks
Risk reducing as the number of stocks raise. But after 20
stocks in portfolio, change ofrisk is minimal
Number of Stocks
How do we 'Sit Tight' ?
If you had invested ` 100 in the Sensex in 1979, your investment would have
mul�plied o ` 2,942 with dividend and to ` 1,646 without dividend.
Buy & Hold
Diversificaa�obeyond your control becomes unmanageable and adds no value to your portolio. Over diversificaca�can impact the overall performance of your portolio. As in case of mosst porolios, the top 5 good quality stocks contribute 80% of overall performance of your portolio while the rest 20% is contributed by bad quality stocks.
4
Sensex
Sensex cu
mD
ividen
d
` 2,942
` 1,646
If you had invested Rs 100 .....
-
500
1,000
1,500
2,000
2,500
3,000
Mar
-79
Jun-
80
Sep-
81
Dec
-82
Mar
-84
Jun-
85
Sep-
86
Dec
-87
Mar
-89
Jun-
90
Sep-
91
Dec
-92
Mar
-94
Jun-
95
Sep-
96
Dec
-97
Mar
-99
Jun-
00
Sep-
01
Dec
-02
Mar
-04
Jun-
05
Sep-
06
Dec
-07
Mar
-09
Jun-
10
Sep-
11
Dec
-12
Mar
-14
Jun-
15
Sep-
16
Dec
-17
Mar
-18
Pu
rch
asin
g P
ow
er
Sensex Sensex cum Dividend
"Great companies to invest are like wonderful castles, surrounded by deep, dangerous moats where the leader inside is an honest and decent person. Preferably, the castle gets its strength from the genius inside; the moat is permanent and acts as a powerful deterrent to those considering an a�ack; and inside, the leader makes gold but doesn't keep it all for himself.”
Large profit pool
Economic Moat i.e. sustained compe��ve advantage reflected in return ra�os (RoE, RoCE) higher than cost of capital and also those of peers
Favourable compe��ve structure like monopoly or oligopoly
Secular and stable business, preferably consumer facing
Posi�ve demand-supply situa�on
Quality of Management
Competence
Sound business strategy
Excellence in execu�on
Ra�onal dividend payout policy
Integrity
Honest and transparent
Concern for all stakeholders
Growth mindset
Long-range profit outlook
Efficient capital alloca�on, including growth by acquisi�ons
Quality of Business
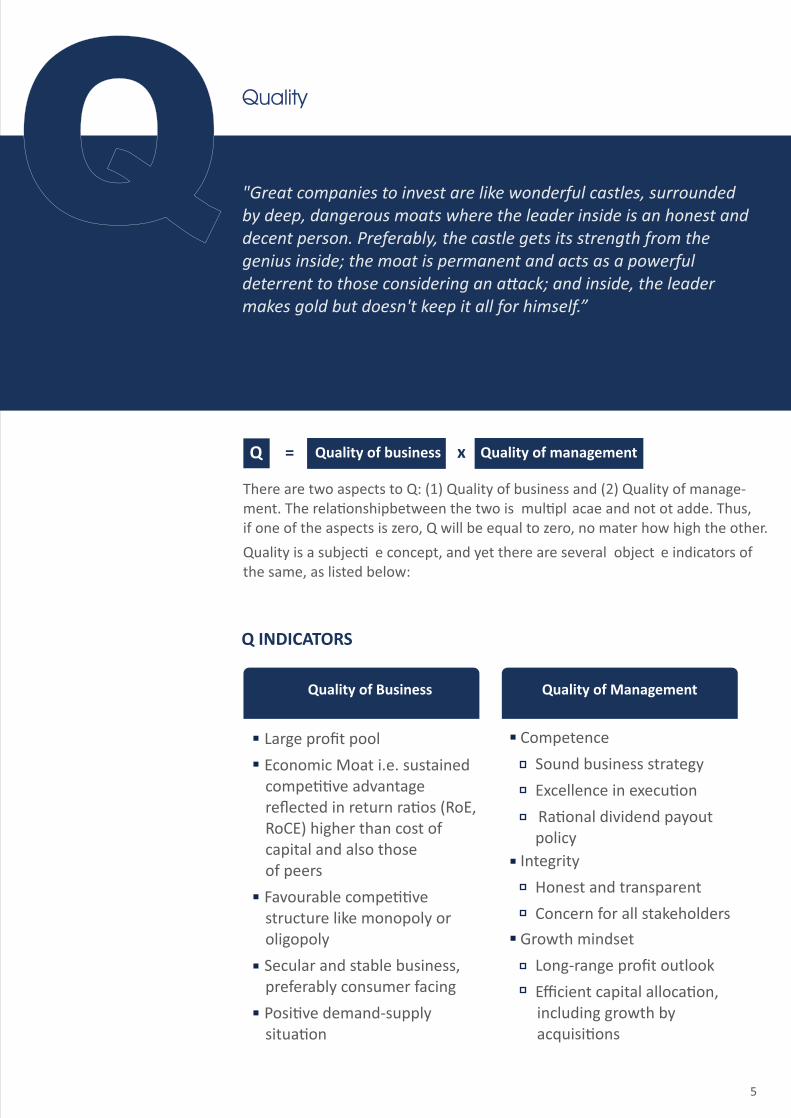
Quality of business Quality of managementx
There are two aspects to Q: (1) Quality of business and (2) Quality of manage-ment. The rela�onshipbetween the two is mul�pl acae and not ot adde. Thus, if one of the aspects is zero, Q will be equal to zero, no mater how high the other.
Quality is a subjec� e concept, and yet there are several object e indicators of the same, as listed below:
Q INDICATORS
Q Quality
Q =
5
Growth
"Growth creates value only when it takes place within the limits of a strong and sustainable company franchise, and these are rare.”GG Growth in earnings=
In inves�n , there are two dimensions of growth: (1) Earnings growth and (2) Valua�ongrowth. The G of QGLP addresses earnings growth, whereas the P(rice) takes care of the Valua�ongrowth.
Earnings growth by itself doesn't mean much. It adds value only when the com-pany earns returns on capital higher than the cost of capital. Hence, growth is simply an amplifier: good when returns exceed the cost of capital, bad when returns are below the cost of capital, and neutral when returns equal the cost of capital.
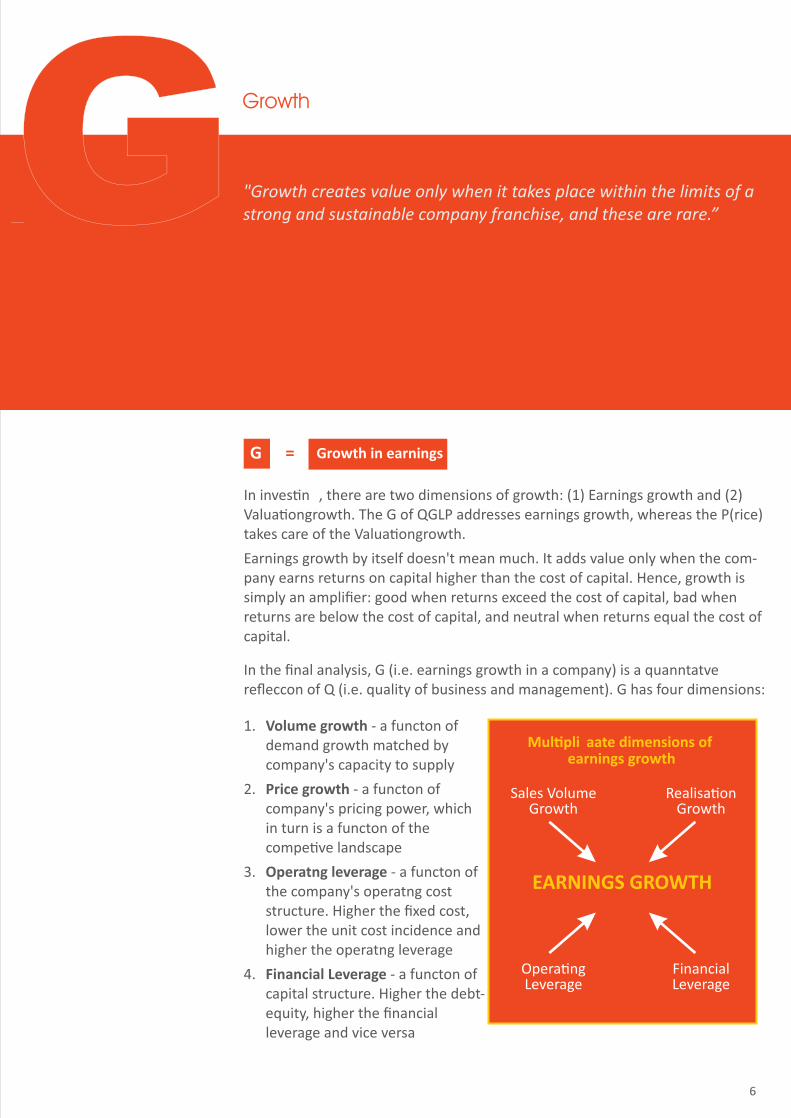
In the final analysis, G (i.e. earnings growth in a company) is a quanntatve refleccon of Q (i.e. quality of business and management). G has four dimensions:
Mul�pli aate dimensions ofearnings growth
EARNINGS GROWTH
Sales VolumeGrowth
Realisa�onGrowth
Opera�ngLeverage
FinancialLeverage
1. Volume growth - a functon of demand growth matched by company's capacity to supply
2. Price growth - a functon of company's pricing power, which in turn is a functon of the compe�ve landscape
3. Operatng leverage - a functon of the company's operatng cost structure. Higher the fixed cost, lower the unit cost incidence and higher the operatng leverage
4. Financial Leverage - a functon of capital structure. Higher the debt-equity, higher the financial leverage and vice versa
6

L Longevity
L Longevity of quality and growth=
Having established the present quality and earnings growth of the company, the next challenge to investors is assessing how long it can sustain both. In the context of longevity, competence of management is tested at two levels:
(1) Extending CAP (i.e. Compe�t e Advantage Period), and
(2) Delaying growth slowdown.
"We like great companies with dominant posi�ons, whose franchise is hard to duplicate and has tremendous staying power or some permanence to it.”
Extending CAP: Compe�t e Advantage Period (CAP) is the e � during which a company generates returns on investment that exceed its cost of capital. Compe��o eventually drives down returns to cost of capital, and someme�mes even below it. However, a company with a great business and great management keeps extending its CAP, sustaining high return both for itself and its equity investors.
Delaying growth slowdown: Competent managements can delay growth slowdown by
(1) new streams of organic growth, and/or
(2) inorganic growth via judicious acquisi�ons.
Companies usually enjoy acertain CAP …
Compe�t e forces work tobring down excess return
RateofReturn
WACC
CAPTime (in years)
Return=WACC
… but high-quality companiestend to extend it
Incrementalexcess return
RateofReturn
WACC
CAP rolls over by 1 year
Time (in years)
Return=WACC
0 Year 1
WACC is the Weighted Average Cost of Capital
7
Case Study – Shriram Transport
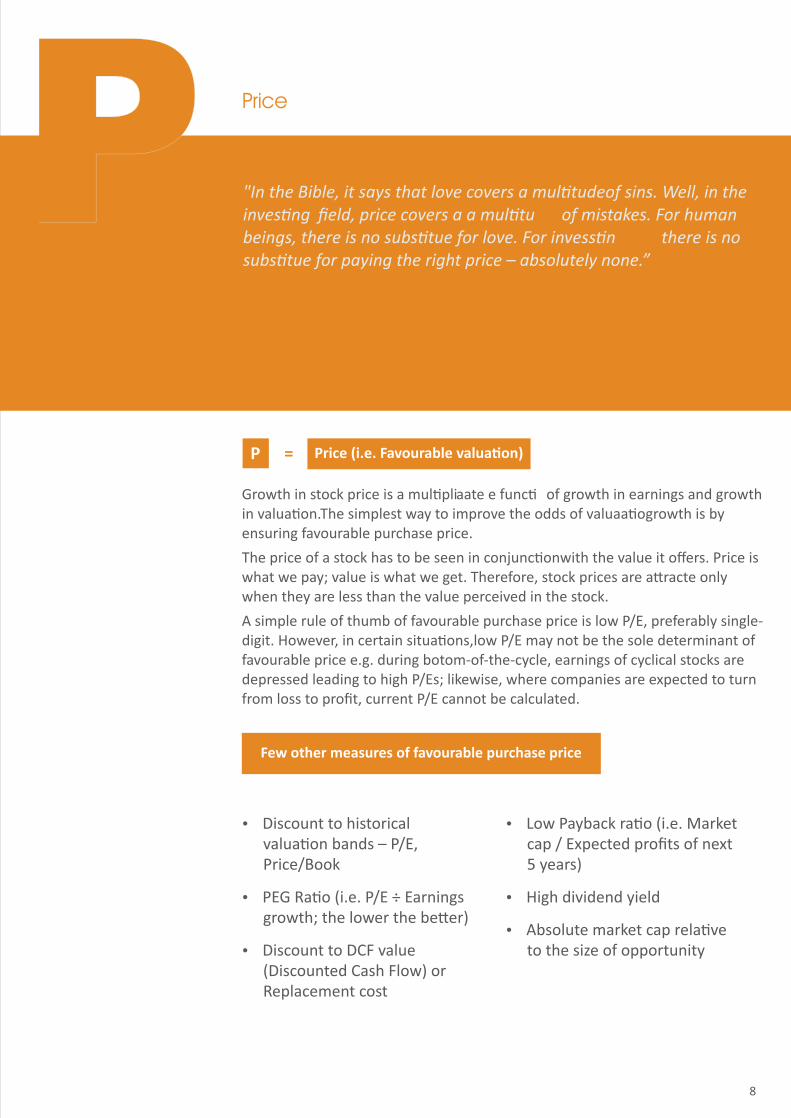
PriceP "In the Bible, it says that love covers a mul�tudeof sins. Well, in the inves�ng field, price covers a a mul�tu of mistakes. For human beings, there is no subs�tue for love. For invess�n there is no subs�tue for paying the right price – absolutely none.”
P Price (i.e. Favourable valua�on)=
Growth in stock price is a mul�pliaate e func� of growth in earnings and growth in valua�on.The simplest way to improve the odds of valuaa�ogrowth is by ensuring favourable purchase price.
The price of a stock has to be seen in conjunc�onwith the value it offers. Price is what we pay; value is what we get. Therefore, stock prices are a�racte only when they are less than the value perceived in the stock.
A simple rule of thumb of favourable purchase price is low P/E, preferably single-digit. However, in certain situa�ons,low P/E may not be the sole determinant of favourable price e.g. during botom-of-the-cycle, earnings of cyclical stocks are depressed leading to high P/Es; likewise, where companies are expected to turn from loss to profit, current P/E cannot be calculated.
Ÿ Discount to historical valua�on bands – P/E, Price/Book
Ÿ PEG Ra�o (i.e. P/E ÷ Earnings growth; the lower the be�er)
Ÿ Discount to DCF value (Discounted Cash Flow) or Replacement cost
Few other measures of favourable purchase price
Ÿ Low Payback ra�o (i.e. Market cap / Expected profits of next 5 years)
Ÿ High dividend yield
Ÿ Absolute market cap rela�ve to the size of opportunity
Few other measures of favourable purchase price
8
For whom: Our equity exper�se can be accessed by individual investors with an approach to long term savings through our Mutual Fund products for as low as Rs. 500 through a systema�c investment plan (SIP).
Benefits: Our Mutual Fund Schemes pass through a rigorous investment process with an aim to deliver consistent performance. Investments in the Schemes can also be conveniently done online. As an investment house, since we have only one investment philosophy, we aim to keep life simple for us and our investors by having a focused menu of equity funds – one large cap, one midcap, one mul�cap, one tax saver fund and one dynamic fund.
MUTUAL
Mo�lal Owal Focused 25 Fund (MOF25)
Mo�lal Owal Midcap 30 Fund (MOF30)
Mo�lal Owwal Multap 35 Fund (MOF35)
Mo�lal Owal Long Term Equity Fund (MOFLTE)
Mo�lal Owal Dynamic Fund (MOFDYNAMIC)
Invests in enduring wealth creators
Invests in emerging wealth creators
Invests in emerging and enduring wealth creators
Lock in fund that invests in wealth creators plus saves tax
Invest in equity, deriva� es, debt, money market instruments and units issued by REITs and InvITs.
Our Funds
FUNDS
Reap the full growthpoten�al of tocks
Low Churn
We do not buy morethan 25-30 stocks,reducing the riskof diversificaa�on
FocusedPortfolio
Benefits of our Funds
9
For whom: Our PMS products are meant for financially savvy high net worth individuals (HNIs) who wish to u�liseour eexper�sin building a a poolio of high quality companies or who have a large portolio of stocks but lack the bandwidth to monitor them.
Benefits: With our Portolio Management Services one can build an equity portolio in the large cap and midcap segment with highly personalized service. Also, the 'Buy Right : Sit Tight' approach results in low churn in our portolios and makes the cos�ngof our PPorolio Management Services very a a�ra e.
Value Strategy
Next Trillion Dollar Opportunity Strategy
India Opportunity Portolio Strategy
Concentrated large cap portolio with only 20-25 stocks
Concentrated mul� cap porolio with only 25-30 stocks
Concentrated midcap portolio with only 20-25 stocks
PORTFOLIOMANAGEMENTSERVICES
Our Strategies
Benefits of our Strategies
Reap the full growthpoten�al of tocks
Low Churn
We do not buy morethan 25-30 stocks,reducing the riskof diversificaa�on
FocusedPortfolio
High BrandRecall
Widely accepted anddistributed product
Behavior of an investor won't
impact the portolio ofother investors
SegregatedPortfolio
One of the longestrunning strategies inthe industry with a
14+ years track record
Track Record Transparency
Transparency inportolio holdings,
transac�onsand expenses
10
Motilal Oswal Focused 25 Fund (MOF25)LARGE CAPFUND
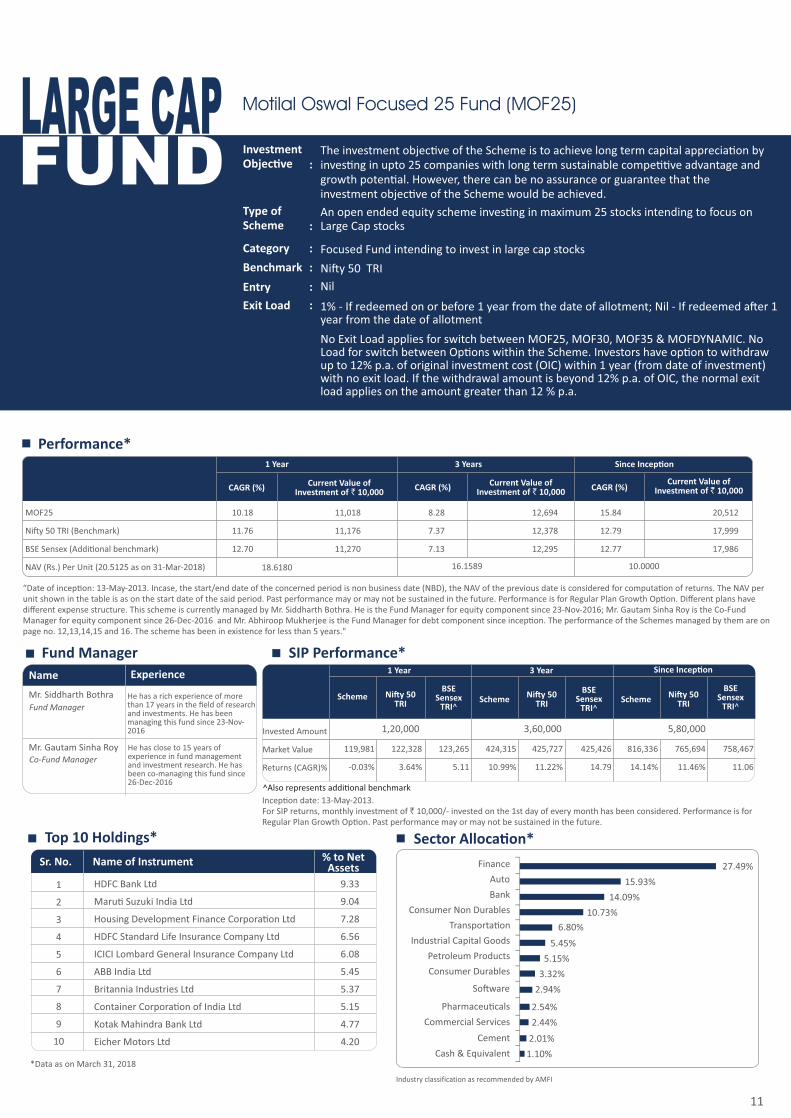
“Date of incep�on: 13-May-2013. Incase, the start/end date of the concerned period is non business date (NBD), the NAV of the previous date is considered for computa�on of returns. The NAV per unit shown in the table is as on the start date of the said period. Past performance may or may not be sustained in the future. Performance is for Regular Plan Growth Op�on. Different plans have different expense structure. This scheme is currently managed by Mr. Siddharth Bothra. He is the Fund Manager for equity component since 23-Nov-2016; Mr. Gautam Sinha Roy is the Co-Fund Manager for equity component since 26-Dec-2016 and Mr. Abhiroop Mukherjee is the Fund Manager for debt component since incep�on. The performance of the Schemes managed by them are on page no. 12,13,14,15 and 16. The scheme has been in existence for less than 5 years."
MOF25
Ni�y 50 TRI (Benchmark)
BSE Sensex (Addi�onal benchmark)
NAV (Rs.) Per Unit (20.5125 as on 31-Mar-2018)
11,018
11,176
11,270
10.18
11.76
12.70
Performance*
Current Value ofInvestment of ` 10,000CAGR (%)
1 Year
18.6180
12,694
12,378
12,295
8.28
7.37
7.13
Current Value ofInvestment of ` 10,000CAGR (%)
3 Years
16.1589
20,512
17,999
17,986
15.84
12.79
12.77
Current Value ofInvestment of ` 10,000CAGR (%)
Since Incep�on
10.0000
11
InvestmentObjec�ve
The investment objec�ve of the Scheme is to achieve long term capital apprecia�on by inves�ng in upto 25 companies with long term sustainable compe��ve advantage and growth poten�al. However, there can be no assurance or guarantee that the investment objec�ve of the Scheme would be achieved.
Type of Scheme
An open ended equity scheme inves�ng in maximum 25 stocks intending to focus on Large Cap stocks
Benchmark Ni�y 50 TRI
:
:
:
Entry Nil:
Exit Load 1% - If redeemed on or before 1 year from the date of allotment; Nil - If redeemed a�er 1 year from the date of allotment
:
No Exit Load applies for switch between MOF25, MOF30, MOF35 & MOFDYNAMIC. No Load for switch between Op�ons within the Scheme. Investors have op�on to withdraw up to 12% p.a. of original investment cost (OIC) within 1 year (from date of investment) with no exit load. If the withdrawal amount is beyond 12% p.a. of OIC, the normal exit load applies on the amount greater than 12 % p.a.
Category Focused Fund intending to invest in large cap stocks:
1
2
3
4
5
6
7
8
9
10
Top 10 Holdings* Sector Alloca�on*
*Data as on March 31, 2018
HDFC Bank Ltd
Maru� Suzuki India Ltd
Housing Development Finance Corpora�on Ltd
HDFC Standard Life Insurance Company Ltd
ICICI Lombard General Insurance Company Ltd
ABB India Ltd
Britannia Industries Ltd
Container Corpora�on of India Ltd
Kotak Mahindra Bank Ltd
Eicher Motors Ltd
9.33
9.04
7.28
6.56
6.08
5.45
5.37
5.15
4.77
4.20
2.94%
3.32%
5.15%
5.45%
6.80%
10.73%
14.09%
15.93%
27.49%
So�ware
Consumer Durables
Petroleum Products
Industrial Capital Goods
Transporta�on
Consumer Non Durables
Bank
Auto
FinanceSr. No. Name of Instrument % to Net Assets
Pharmaceu�cals 2.54%
Commercial Services 2.44%
Cement 2.01%
Cash & Equivalent 1.10%
Fund Manager
Mr. Siddharth Bothra
Experience
Mr. Gautam Sinha RoyCo-Fund Manager
He has close to 15 years of experience in fund management and investment research. He has been co-managing this fund since 26-Dec-2016
He has a rich experience of more than 17 years in the field of research and investments. He has been managing this fund since 23-Nov-2016
Fund Manager
Name
SIP Performance*
Incep�on date: 13-May-2013.For SIP returns, monthly investment of ` 10,000/- invested on the 1st day of every month has been considered. Performance is for Regular Plan Growth Op�on. Past performance may or may not be sustained in the future.
1 Year
Scheme Ni�y 50 TRI
Invested Amount
Market Value
Returns (CAGR)%
119,981
-0.03%
1,20,000
122,328
3.64%
123,265
5.11
BSESensex
TRI^
Since Incep�on3 Year
Scheme
424,315
10.99%
3,60,000
425,727
11.22%
425,426
14.79
BSESensex
TRI^Scheme
816,336
14.14%
5,80,000
765,694
11.46%
758,467
11.06
BSESensex
TRI^
Ni�y 50 TRI
Ni�y 50 TRI
^Also represents addi�onal benchmark
0.64%Cash & Equivalent
1
2
3
4
5
6
7
8
9
10
6.00
5.34
5.32
5.27
5.27
5.20
5.18
4.81
4.70
4.41
Top 10 Holdings* Sector Alloca�on*
12
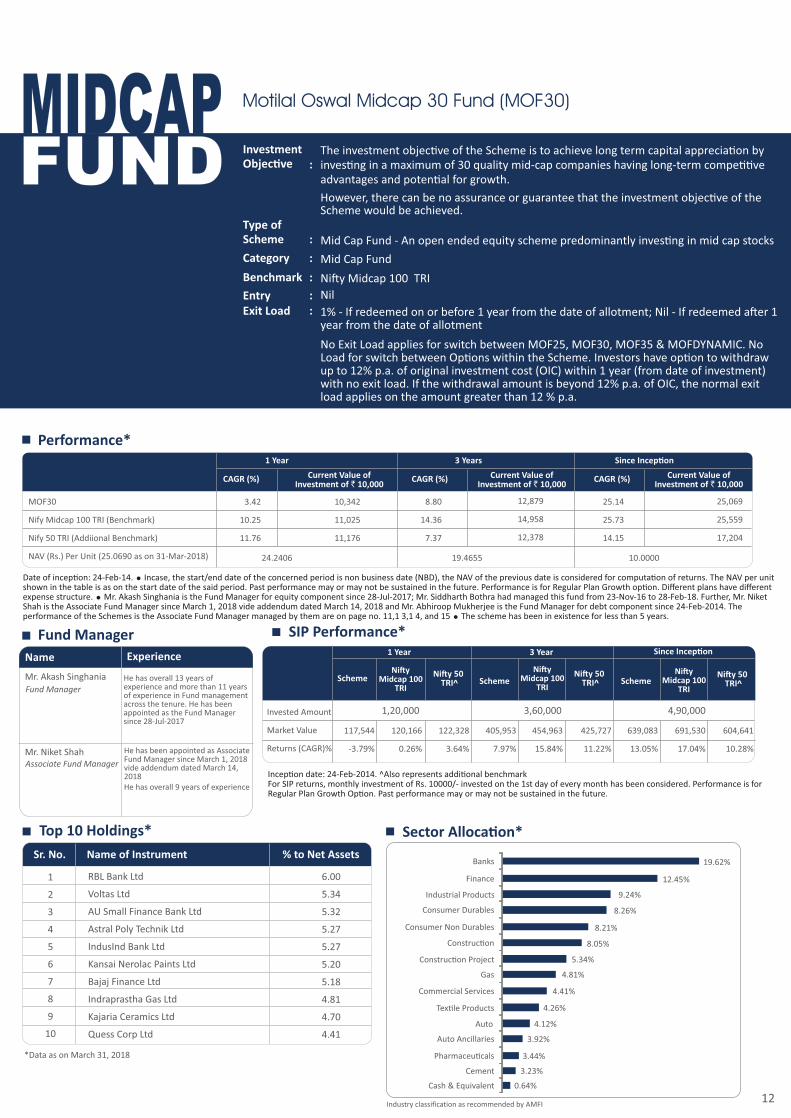
MIDCAPFUND
Motilal Oswal Midcap 30 Fund (MOF30)
RBL Bank Ltd
Voltas Ltd
AU Small Finance Bank Ltd
Astral Poly Technik Ltd
IndusInd Bank Ltd
Kansai Nerolac Paints Ltd
Bajaj Finance Ltd
Indraprastha Gas Ltd
Kajaria Ceramics Ltd
Quess Corp Ltd
Fund Manager
Mr. Akash Singhania
Experience
Mr. Niket ShahAssociate Fund Manager
He has been appointed as Associate Fund Manager since March 1, 2018 vide addendum dated March 14, 2018He has overall 9 years of experience
He has overall 13 years of experience and more than 11 years of experience in Fund management across the tenure. He has been appointed as the Fund Manager since 28-Jul-2017
Fund Manager
Name
Date of incep�on: 24-Feb-14. = Incase, the start/end date of the concerned period is non business date (NBD), the NAV of the previous date is considered for computa�on of returns. The NAV per unit shown in the table is as on the start date of the said period. Past performance may or may not be sustained in the future. Performance is for Regular Plan Growth op�on. Different plans have different expense structure. = Mr. Akash Singhania is the Fund Manager for equity component since 28-Jul-2017; Mr. Siddharth Bothra had managed this fund from 23-Nov-16 to 28-Feb-18. Further, Mr. Niket Shah is the Associate Fund Manager since March 1, 2018 vide addendum dated March 14, 2018 and Mr. Abhiroop Mukherjee is the Fund Manager for debt component since 24-Feb-2014. The performance of the Schemes is the Associate Fund Manager managed by them are on page no. 11,1 3,1 4, and 15 = The scheme has been in existence for less than 5 years.
Performance*
MOF30
Nify Midcap 100 TRI (Benchmark)
Nify 50 TRI (Addiional Benchmark)
NAV (Rs.) Per Unit (25.0690 as on 31-Mar-2018)
10,342
11,025
11,176
3.42
10.25
11.76
Current Value ofInvestment of ` 10,000
CAGR (%)
24.2406
12,879
14,958
12,378
8.80
14.36
7.37
Current Value ofInvestment of ` 10,000
CAGR (%)
19.4655
25,069
25,559
17,204
25.14
25.73
14.15
Current Value ofInvestment of ` 10,000
CAGR (%)
10.0000
*Data as on March 31, 2018
SIP Performance*
Incep�on date: 24-Feb-2014. ^Also represents addi�onal benchmarkFor SIP returns, monthly investment of Rs. 10000/- invested on the 1st day of every month has been considered. Performance is for Regular Plan Growth Op�on. Past performance may or may not be sustained in the future.
1 Year
SchemeNi�y
Midcap 100 TRI
Invested Amount
Market Value
Returns (CAGR)%
117,544
-3.79%
1,20,000
120,166
0.26%
122,328
3.64%
Ni�y 50 TRI^
Since Incep�on3 Year
Scheme
405,953
7.97%
3,60,000
454,963
15.84%
425,727
11.22%
Ni�y 50 TRI^ Scheme
639,083
13.05%
4,90,000
691,530
17.04%
604,641
10.28%
Ni�y 50 TRI^
Ni�y Midcap 100
TRI
Ni�y Midcap 100
TRI
Sr. No. Name of Instrument % to Net Assets
3.44%
3.92%
4.12%
4.26%
4.41%
4.81%
5.34%
8.05%
8.21%
8.26%
9.24%
12.45%
19.62%
Pharmaceu�cals
Auto Ancillaries
Auto
Tex�le Products
Commercial Services
Gas
Construc�on Project
Construc�on
Consumer Non Durables
Consumer Durables
Industrial Products
Finance
Banks
3.23%Cement
1 Year 3 Years Since Incep�on
InvestmentObjec�ve
The investment objec�ve of the Scheme is to achieve long term capital apprecia�on by inves�ng in a maximum of 30 quality mid-cap companies having long-term compe��ve advantages and poten�al for growth.
Type of Scheme Mid Cap Fund - An open ended equity scheme predominantly inves�ng in mid cap stocks
Benchmark Ni�y Midcap 100 TRI
:
:
:
Entry Nil:Exit Load 1% - If redeemed on or before 1 year from the date of allotment; Nil - If redeemed a�er 1
year from the date of allotment:
No Exit Load applies for switch between MOF25, MOF30, MOF35 & MOFDYNAMIC. No Load for switch between Op�ons within the Scheme. Investors have op�on to withdraw up to 12% p.a. of original investment cost (OIC) within 1 year (from date of investment) with no exit load. If the withdrawal amount is beyond 12% p.a. of OIC, the normal exit load applies on the amount greater than 12 % p.a.
Category Mid Cap Fund:
However, there can be no assurance or guarantee that the investment objec�ve of the Scheme would be achieved.

1
2
3
4
5
6
7
8
9
10
9.20
7.71
7.70
5.15
4.71
4.67
4.48
4.33
4.02
3.99
Top 10 Holdings* Sector Alloca�on*
Motilal Oswal Multicap 35 Fund (MOF35)MULTICAPFUND
Incep�on date: 28-Apr-2014. ^Also represents addi�onal benchmark For SIP returns, monthly investment of Rs. 10000/- invested on the 1st day of every month has been considered. Performance is for Regular Plan Growth Op�on. Past performance may or may not be sustained in the future.
Fund Manager
Mr. GautamSinha Roy
Fund Manager
Name Experience
Mr. SiddharthBothra
Co-Fund Manager
He has a rich experience of more than 17 years in the field of research and investments. He has been co-managing this fund since 23-Nov-2016
He has close to 15 years of experience in fund management and investment research. He has been managing this fund since 5-May-2014
Housing Development Finance Corpora�on Ltd
Maru� Suzuki India Ltd
HDFC Bank Ltd
IndusInd Bank Ltd
Interglobe Avia�on Ltd
Hindustan Petroleum Corpora�on Ltd
Bharat Petroleum Corpora�on Ltd
Eicher Motors Ltd
Bajaj Finance Ltd
United Spirits Ltd
Date of incep�on: 28-Apr-14. = Incase, the start/end date of the concerned period is non business date (NBD), the NAV of the previous date is considered for computa�on of returns. The NAV per unit shown in the table is as on the start date of the said period. Past performance may or may not be sustained in the future. Performance is for Regular Plan Growth op�on. Different plans have different expense structure. =Mr. Gautam Sinha Roy is the Fund Manager for equity component since 5-May-2014; = Mr. Siddharth Bothra is the Co-Fund Manager for equity component since 23-Nov-2016, Mr. Abhiroop Mukherjee is the Fund Manager for debt component since 28-Apr-2014 and Mr. Swapnil Mayekar for Foreign Securi�es since 10-Aug-2015. The performance of the Schemes managed by them are on page no. 11,12,14,15 and 16 = The scheme has been in existence for less than 5 years.
MOF35
Ni�y 500 TRI (Benchmark)
Ni�y 50 TRI (Addi�onal Benchmark)
NAV (Rs.) Per Unit (26.3035 as on 31-Mar-2018)
Performance*
*Data as on March 31, 2018
11,552
11,287
11,176
15.52
12.87
11.76
Current Value ofInvestment of ` 10,000
CAGR (%)
1 Year
22.7704
15,456
13,240
12,378
15.62
9.81
7.37
Current Value ofInvestment of ` 10,000
CAGR (%)
3 Years
17.0181
26,303
17,539
15,730
27.93
15.39
12.23
Current Value ofInvestment of ` 10,000
CAGR (%)
Since Incep�on
10.0000
SIP Performance*
13
1 Year
Scheme Ni�y 500 TRI
Invested Amount
Market Value
Returns (CAGR)%
124,545
7.14%
120,000
122,282
3.56%
122,328
3.64%
Ni�y 50 TRI^
Since Incep�on3 Year
Scheme
471,576
18.37%
360,000
439,110
13.36%
425,727
11.22%
Ni�y 50 TRI^
Scheme
690,836
20.00%
470,000
597,919
12.33%
571,456
9.97%
Ni�y 50 TRI^
Ni�y 500 TRI
Ni�y 500 TRI
Sr. No. Name of Instrument % to Net Assets
2.51%
2.88%
3.16%
4.71%
8.87%
9.16%
9.54%
13.92%
17.25%
26.76%
So�ware
Consumer Durables
Gas
Transporta�on
Consumer Non Durables
Petroleum Products
Pharmaceu�cals
Auto
Banks
Finance
1.24%Cash & Equivalent
InvestmentObjec�ve
The investment objec�ve of the Scheme is to achieve long term capital apprecia�on by primarily inves�ng in a maximum of 35 equity & equity related instruments across sectors and market-capitaliza�on levels.
Type of Scheme
Mul�Cap - An open ended equity scheme inves�ng across large cap, mid cap, small cap stocks
Benchmark Ni�y 500 TRI
:
:
:
Entry Nil:Exit Load 1% - If redeemed on or before 1 year from the date of allotment; Nil - If redeemed a�er 1
year from the date of allotment:
No Exit Load applies for switch between MOF25, MOF30, MOF35 & MOFDYNAMIC. No Load for switch between Op�ons within the Scheme. Investors have op�on to withdraw up to 12% p.a. of original investment cost (OIC) within 1 year (from date of investment) with no exit load. If the withdrawal amount is beyond 12% p.a. of OIC, the normal exit load applies on the amount greater than 12 % p.a.
Category Mul�Cap:
However, there can be no assurance or guarantee that the investment objec�ve of the Scheme would be achieved.

1
2
3
4
5
6
7
8
9
10
8.17
7.40
6.39
6.38
5.30
4.59
4.45
4.38
4.19
3.88
Top 10 Holdings* Sector Alloca�on*
14
Motilal Oswal Long Term Equity Fund (MOFLTE)TAX SAVERFUND
Housing Development Finance Corpora�on Ltd
HDFC Bank Ltd
Maru� Suzuki India Ltd
IndusInd Bank Ltd
Interglobe Avia�on Ltd
ICICI Lombard General Insurance Company Ltd
Eris Lifesciences Ltd
Eicher Motors Ltd
Bharat Petroleum Corpora�on Ltd
Quess Corp Ltd
“Date of incep�on: 21-Jan-2015. Incase, the start/end date of the concerned period is non business date (NBD), the NAV of the previous date is considered for computa�on of returns. The NAV per unit shown in the table is as on the start date of the said period. Past performance may or may not be sustained in the future. Performance is for Regular Plan Growth Op�on. Different plans have different expense structure. This scheme is currently managed by Mr. Gautam Sinha Roy is the Fund Manager for equity component since incep�on; Mr. Siddharth Bothra is the Co-Fund Manager for equity component since 26-Dec-2016 and Mr. Abhiroop Mukherjee is the Fund Manager for debt component since incep�on. The performance of the Schemes managed by them are on page no. 11,12,13,15 and 16. The scheme has been in existence for less than 5 years."
MOFLTE
Nify 500 TRI (Benchmark)
Nify 50 TRI (Addiional Benchmark)
NAV (Rs.) Per Unit (17.7828 as on 31-Mar-2018)
12,025
11,287
11,176
20.25
12.87
11.76
Performance*
Current Value of Investmentof ` 10,000
CAGR (%)
1 Year
14.7884
17,783
13,036
12,065
19.76
8.66
6.06
Current Value of Investmentof ` 10,000
CAGR (%)
Since Incep�on
10.7054
*Data as on March 31, 2018
Sr. No. Name of Instrument % to Net Assets
1.56%Auto Ancillaries
2.16%Industrial Products
3.61%
3.65%
3.84%
3.88%
5.30%
6.27%
8.56%
13.78%
14.52%
24.26%
Gas
So�ware
Consumer Non Durables
Commercial Services
Transporta�on
Petroleum Products
Pharmaceu�cals
Banks
Auto
Finance
2.34%Consumer Durables
16,611
13,240
12,378
18.43
9.81
7.37
Current Value of Investmentof ` 10,000
CAGR (%)
3 Years
10.0000
6.26%Cash & Equivalent
Fund Manager
Mr. Gautam Sinha Roy
Experience
Mr. Siddharth BothraCo-Fund Manager
He has a rich experience of more than 17 years in the field of research and investments. He has been co-managing this fund since 26-Dec-2016
He has close to 15 years of experience in fund management and investment research. He has been managing this fund since incep�on
Fund Manager
Name
SIP Performance*
Incep�on date: 21-Jan-2015. ^Also represents addi�onal benchmarkFor SIP returns, monthly investment of Rs. 10000/- invested on the 1st day of every month has been considered. Performance is for Regular Plan Growth Op�on. Past performance may or may not be sustained in the future.
1 Year
Scheme Ni�y 500 TRI
Invested Amount
Market Value
Returns (CAGR)%
127,198
11.37%
1,20,000
122,282
3.56%
122,328
3.64%
Ni�y 50 TRI^
Since Incep�on3 Year
Scheme
494,861
21.83%
3,60,000
439,110
13.36%
425,727
11.22%
Ni�y 50 TRI^ Scheme
529,114
21.46%
3,70,000
464,817
12.81%
449,546
10.63%
Ni�y 50 TRI^
Ni�y 500 TRI
Ni�y 500 TRI
InvestmentObjec�ve
The investment objec�ve of the Scheme is to generate long-term capital apprecia�on from a diversified por�olio of predominantly equity and equity related instruments. However, there can be no assurance or guarantee that the investment objec�ve of the Scheme would be achieved.
Type of Scheme
An open ended equity linked saving scheme with a statutory lock in of 3 years and tax benefit
Benchmark Ni�y 500 TRI
:
:
:
Category ELSS:
Entry NIL:
Exit NIL:

1.05%Industrial Products
NAV (Rs.) Per Unit (12.0253 : as on 31-Mar-2018)
11.86
9.96
11.76
11,186
10,996
11,176
13.02
10.46
11.76
12,025
11,616
11,824
Date of incep�on: 27-Sep-2016 Incase, the start/end date of the concerned period is non business date (NBD), the NAV of the previous date is considered for computa�on of returns. The NAV per unit shown in the table is as on the start date of the said period. Past performance may or may not be sustained in the future. Performance is for Regular Plan Growth Op�on. Different plans have different expense structure. This scheme is currently managed by Mr. Gautam Sinha Roy. He has been managing equity component since 23-Nov-2016; Mr. Siddharth Bothra is the Co-Fund Manager for equity component since 23-Nov-2016 and Mr. Abhiroop Mukherjee is the Fund Manager for debt component since incep�on. The performanceof the Schemes managed by them are on page no. 11,12,13,14 and 16. The scheme has been in existence for less than 3 years
MOFDYNAMIC
Performance*
Current Value of Investment of ` 10,000CAGR (%)
1 Year
10.7500
Current Value of Investment of ` 10,000CAGR (%)
Since Incep�on
10.0000
CRISIL Hybrid 35 + 65 - Aggressive Index TRI (Benchmark)
Ni�y 50 TRI (Addi�onal Benchmark)
Motilal Oswal Dynamic Fund (MOFDYNAMIC)DYNAMICFUND
Fund Manager
Mr. Gautam Sinha Roy -
Name Experience
Fund Manager
He has close to 15 years of experience in fund management and investment research. He has been managing this fund since 23-Nov-2016
He has a rich experience of more than 17 years in the field of research and investments. He has been co-managing this fund since 23-Nov-2016
Mr. Siddharth Bothra -Co-Fund Manager
Mr. Abhiroop Mukherjee -Fund Manager for Debt Component
He has 10 years of experience in Trading Fixed Income Securi�es viz. G-sec, T-bills, Corporate Bonds CP, CD etc. He has been managing this fund since incep�on
1
2
3
4
5
6
Alloca�on*
Total Equity
Bonds and NCDs
Fixed Deposits
CBLO
Cash and Cash Equivalent (including Book Value of Futures)
Equity Deriva�ves
Total
66.55
24.15
0.60
1.41
29.67
-22.38
100.00
*Data as on March 31, 2018
Sector Alloca�on*
15
^ Also represents addi�onal benchmarkDate of incep�on: 27-Sep-2016 For SIP returns, monthly investment of ` 10,000/- invested on the 1st day of every month has been considered. Performance is for Regular Plan Growth Op�on. Past performance may or may not be sustained in the future.
Housing Development Finance Corpora�on Ltd1 7.78
Bajaj Finance Ltd2 7.37
Maru� Suzuki India Ltd3 6.87
HDFC Bank Ltd4 4.50
United Spirits Ltd5 4.07
Eicher Motors Ltd6 2.74
Jubilant Life Sciences Ltd7 2.64
Max Financial Services Ltd8 2.45
Bharat Petroleum Corpora�on Ltd9 2.32Quess Corp Ltd10 2.31
SIP Performance*1 Year Since Incep�on
Invested Amount 120,000
Market Value
Returns (CAGR)%
SchemeCRISIL Hybrid
35 + 65 - Aggressive
TRI
Ni�y 50 TRI^
124,932
7.75%
122,489
3.89%
122,329
3.64%
180,000
196,777
11.83%
192,254
8.64%
194,461
10.20%
Scheme Ni�y 50 TRI^
Transporta�on
Commercial Services
Petroleum Products
Consumer Non Durables
Pharmaceu�cals
Bank
Auto
Finance
2.24%
2.29%
2.31%
3.04%
4.82%
6.03%
6.70%
11.59%
22.59%
Consumer Durables
Sr. No. Name of Instrument % to Net Assets CRISIL Hybrid 35 + 65
- Aggressive TRI
2.01%So�ware
1.87%Gas
InvestmentObjec�ve
The investment objec�ve is to generate long term capital apprecia�on by inves�ng in equity and equity related instruments including equity deriva�ves, debt, money market instruments and units issued by REITs and InvITs.
Type of Scheme An open ended dynamic asset alloca�on fund
Benchmark CRISIL Hybrid 35 + 65 - Aggressive TRI
:
:
:
Entry Nil:Exit Load 1% - If redeemed on or before 1 year from the date of allotment; Nil - If redeemed a�er 1
year from the date of allotment:
No Exit Load applies for switch between MOF25, MOF30, MOF35 & MOFDYNAMIC. No Load for switch between Op�ons within the Scheme. Investors have op�on to withdraw up to 12% p.a. of original investment cost (OIC) within 1 year (from date of investment) with no exit load. If the withdrawal amount is beyond 12% p.a. of OIC, the normal exit load applies on the amount greater than 12 % p.a.
Category Dynamic Asset Alloca�on:
However, there can be no assurance or guarantee that the investment objec�ve of the Scheme would be achieved.
OTHERFUNDS
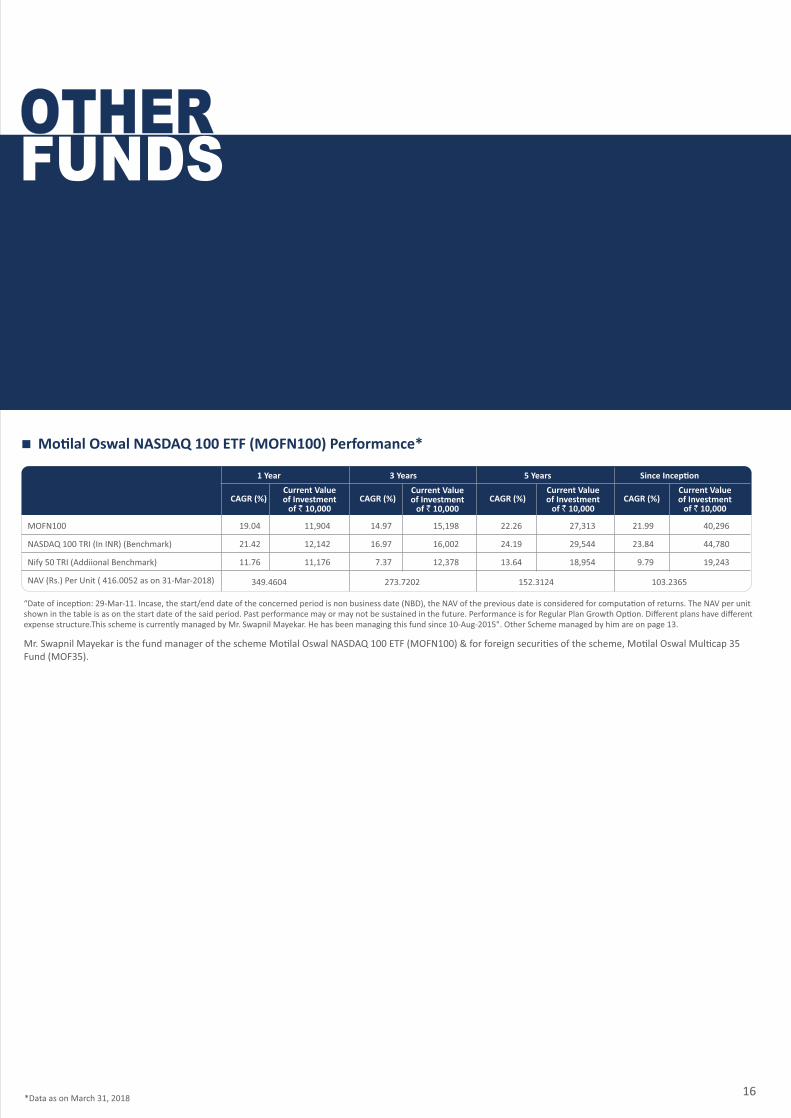
Mo�lal Oswal NASDAQ 100 ETF (MOFN100) Performance*
Mr. Swapnil Mayekar is the fund manager of the scheme Mo�lal Oswal NASDAQ 100 ETF (MOFN100) & for foreign securi�es of the scheme, Mo�lal Oswal Mul�cap 35 Fund (MOF35).
16
“Date of incep�on: 29-Mar-11. Incase, the start/end date of the concerned period is non business date (NBD), the NAV of the previous date is considered for computa�on of returns. The NAV per unit shown in the table is as on the start date of the said period. Past performance may or may not be sustained in the future. Performance is for Regular Plan Growth Op�on. Different plans have different expense structure.This scheme is currently managed by Mr. Swapnil Mayekar. He has been managing this fund since 10-Aug-2015". Other Scheme managed by him are on page 13.
MOFN100
NASDAQ 100 TRI (In INR) (Benchmark)
Nify 50 TRI (Addiional Benchmark)
NAV (Rs.) Per Unit ( 416.0052 as on 31-Mar-2018)
11,904
12,142
11,176
19.04
21.42
11.76
Current Valueof Investment
of ` 10,000CAGR (%)
1 Year
349.4604
15,198
16,002
12,378
14.97
16.97
7.37
Current Valueof Investment
of ` 10,000CAGR (%)
3 Years
273.7202
40,296
44,780
19,243
21.99
23.84
9.79
Current Valueof Investment
of ` 10,000CAGR (%)
Since Incep�on
103.2365
27,313
29,544
18,954
22.26
24.19
13.64
Current Valueof Investment
of ` 10,000CAGR (%)
5 Years
152.3124
*Data as on March 31, 2018
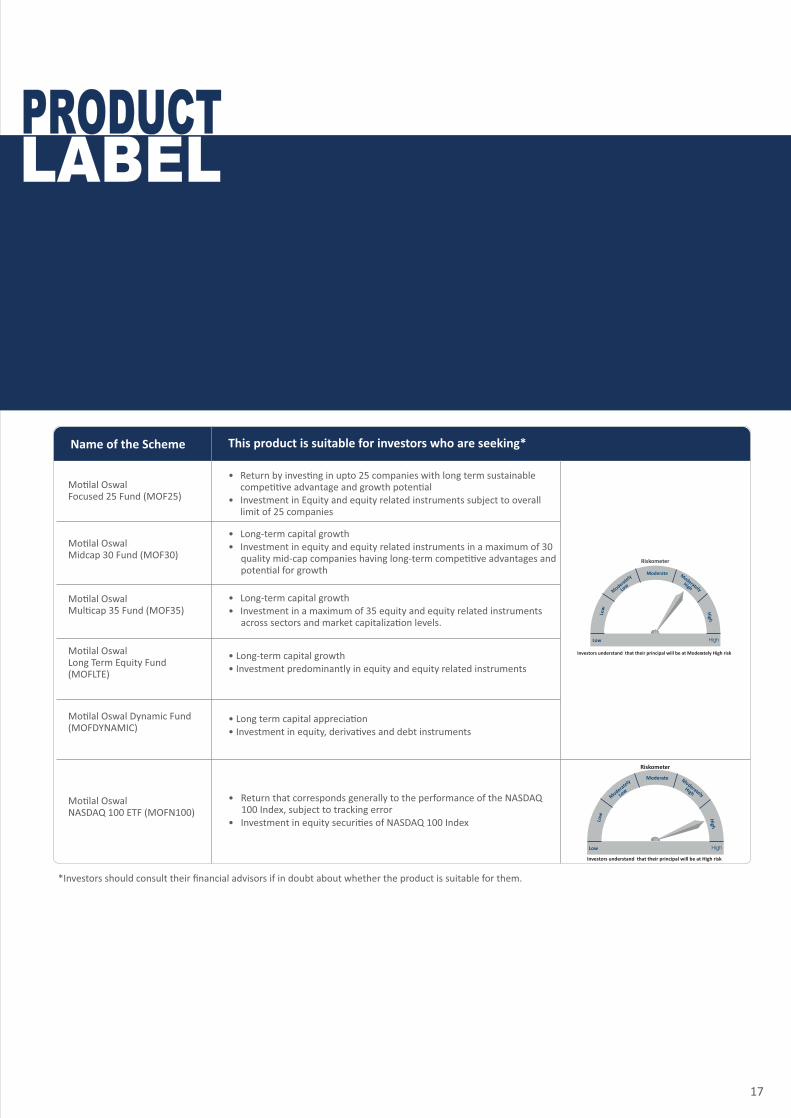
PRODUCTLABEL
*Investors should consult their financial advisors if in doubt about whether the product is suitable for them.
Name of the Scheme This product is suitable for investors who are seeking*
Mo�lal Oswal Focused 25 Fund (MOF25)
• Return by inves�ng in upto 25 companies with long term sustainable compe��ve advantage and growth poten�al
• Investment in Equity and equity related instruments subject to overall limit of 25 companies
Mo�lal OswalMidcap 30 Fund (MOF30)
• Long-term capital growth• Investment in equity and equity related instruments in a maximum of 30
quality mid-cap companies having long-term compe��ve advantages and poten�al for growth
Mo�lal OswalMul�cap 35 Fund (MOF35)
• Long-term capital growth• Investment in a maximum of 35 equity and equity related instruments
across sectors and market capitaliza�on levels.
Mo�lal OswalLong Term Equity Fund(MOFLTE)
• Long-term capital growth• Investment predominantly in equity and equity related instruments
Low
Modera
tely
Low
High
ModeratelyHigh
Moderate
HighLow
Investors understand that their principal will be at Moderately High risk
Riskometer
Mo�lal Oswal NASDAQ 100 ETF (MOFN100)
• Return that corresponds generally to the performance of the NASDAQ 100 Index, subject to tracking error
• Investment in equity securi�es of NASDAQ 100 Index Low
Modera
tely
Low
High
ModeratelyHigh
Moderate
HighLow
Investors understand that their principal will be at High risk
Riskometer
Mo�lal Oswal Dynamic Fund (MOFDYNAMIC)
• Long term capital apprecia�on• Investment in equity, deriva�ves and debt instruments
17

Value Strategy
Key Por�olio Analysis
Performance
The Strategy aims to benefit from the long term compounding effect on investments done in good businesses, run by great business managers for superior wealth crea�on.
Sr. No. Name of Instrument % to Net Assets
1
2
3
4
5
6
7
8
9
10
Top 10 HoldingsStrategy Details
Shrey Loonker
Kunal Jadhwani
Open ended
24th March 2003
Ni�y 50 Index
3 Years +
Daily
Daily
Daily
LARGE CAPSTRATEGY
Ÿ Concentrated large cap with only 20-25 stocks
Ÿ One of the longest running products in the industry with a 14 years track record
Ÿ The corpus under this Strategy is over Rs. 2,644 cr as on March 31, 2018
Investment objec�ve:
Performance Data (5 Years) Value Strategy Ni�y 50 Index
46.78
24.01
9.56
5.68
5.05
Sector Alloca�on
Sr. No. Sector Alloca�on % Alloca�on
1
2
3
4
5
Banking & Finance
Auto & Auto Ancillaries
Oil & Gas
Engineering & Electricals
Pharmaceu�cals
Fund Manager:
Co - Fund Manager:
Strategy Type:
Date of Incep�on:
Benchmark:
Investment Horizon:
Subscrip�on:
Redemp�on:
Valua�onPoint:
Both, Value Strategy and Ni�y 50 Index are rebased to 10 as on Mar 24, 2003
The Above strategy returns are of a Model Client as on March 31, 2018. Returns of individual clients may differ depending on factors such as �me of entry/exit/ addi�onal inflows in the strategies. The stocks forming part of the exis�ng por�olio may or may not be bought for new client. Returns below 1 year are absolute and above 1 year are annualized. Strategy returns shown above are post fees & expenses. Past performance should not be used as a basis for comparison with other investments. Past performance may or may not be sustained in future.
Data as on March 31, 2018
Value Strategy Ni�y 50 Ind x
Inve
stm
ent
Val
ue
-10.00
40.00
90.00
140.00
190.00
240.0025.12X
10.00X
Ma
r-0
3
De
c-0
3
Se
p-0
4
Jun
-05
Ma
r-0
6
De
c-0
6
Se
p-0
7
Jun
-08
Ma
r-0
9
De
c-0
9
Se
p-1
0
Jun
-11
Ma
r-1
2
De
c-1
2
Se
p-1
3
Jun
-14
Ma
r-1
5
De
c-1
5
Se
p-1
6
Jun
-17
Ma
r-1
8
18
Standard Devia�on (%)
Beta
13.73%
1.00
14.93%
0.95
The selec�on of the stocks will be based on the criteria of strategy at the �me of ini�al idea�on and investment made as per the model por�olio of the strategy
HDFC Bank Ltd.
Kotak Mahindra Bank Ltd.
Bharat Petroleum Corpora�on Ltd.
AU Small Finance Bank Ltd.
Bharat Forge Ltd.
Eicher Motors Ltd.
Housing Development Finance Corpora�on Ltd.
Larsen & Toubro Ltd.
Bajaj Finserv Ltd.
ICICI Lombard General Insurance Company Ltd.
10.53
8.07
7.50
6.38
6.37
6.37
5.68
5.68
5.64
5.52

Next Trillion Dollar Opportunity Strategy (NTDOP)
Key Por�olio Analysis
Performance Data (5 Years) Ni�y 500 IndexNTDOP Strategy
Performance
The Strategy aims to deliver superior returns by inves�ng in stocks from sectors that can benefit from the Next Trillion Dollar GDP growth.
It aims to pre-dominantly invest in large and midcap stocks with a focus on iden�fying poten�al winners that would par�cipate in successive phases of GDP growth.
Inve
stm
ent
Val
ue
NTDOP Strategy Ni�y 500 Ind x
Fund Manager:
Strategy Type:
Date of Incep�on:
Benchmark:
Investment Horizon:
Subscrip�on:
Redemp�on:
Valua�onPoint:
Manish Sonthalia
Open ended
11th Dec 2007
Ni�y 500 Index
3 Years +
Daily
Daily
Daily
Strategy Details
MULTICAPSTRATEGY
Ÿ Concentrated mul�cap por�olio with only 25-30 stocks
Ÿ Focused on the 'Next Trillion Dollar Growth Opportunity’
Ÿ The corpus under this Strategy is over Rs. 7,431 cr as on March 31, 2018
Investment objec�ve:
Sr. No. Name of Instrument % to Net Assets
1
2
3
4
5
6
7
8
9
10
Top 10 Holdings
32.00
16.38
14.56
14.04
6.52
Sector Alloca�on
Sr. No. Sector Alloca�on % Alloca�on
1
2
3
4
5
Banking & Finance
FMCG
Auto & Auto Ancillaries
Diversified
Oil & Gas
Data as on March 31, 2018
0.00
10.00
20.00
30.00
40.00
50.00
60.00
Dec
-07
Mar
-08
Jun
-08
Sep
-08
Dec
-08
Mar
-09
Jun
-09
Sep
-09
Dec
-09
Mar
-10
Jun
-10
Sep
-10
Dec
-10
Mar
-11
Jun
-11
Sep
-11
Dec
-11
Mar
-12
Jun
-12
Sep
-12
Dec
-12
Mar
-13
Jun
-13
Sep
-13
Dec
-13
Mar
-14
Jun
-14
Sep
-14
Dec
-14
Mar
-15
Jun
-15
Sep
-15
Dec
-15
Mar
-16
Jun
-16
Sep
-16
Dec
-16
Mar
-17
Jun
-17
Sep
-17
Dec
-17
Mar
-18
5.52X
Both, NTDOP Strategy and Ni�y 500 Index are rebased to 10 as on Dec 11, 2007
The Above strategy returns are of a Model Client as on March 31, 2018. Returns of individual clients may differ depending on factors such as �me of entry/exit/ addi�onal inflows in the strategies. The stocks forming part of the exis�ng por�olio may or may not be bought for new client. Returns below 1 year are absolute and above 1 year are annualized. Strategy returns shown above are post fees & expenses. Past performance should not be used as a basis for comparison with other investments. Past performance may or may not be sustained in future.
19
1.75X
Standard Devia�on (%)
Beta
14.27%
1.00
18.07%
1.00
The selec�on of the stocks will be based on the criteria of strategy at the �me of ini�al idea�on and investment made as per the model por�olio of the strategy
Kotak Mahindra Bank
Voltas
Page Industries
Bajaj Finance
Eicher Motors
City Union Bank
Bosch
Max Financial Services
Bharat Forge
Godrej Industries
11.40
10.09
8.63
8.61
6.48
4.56
4.11
4.08
3.98
3.95
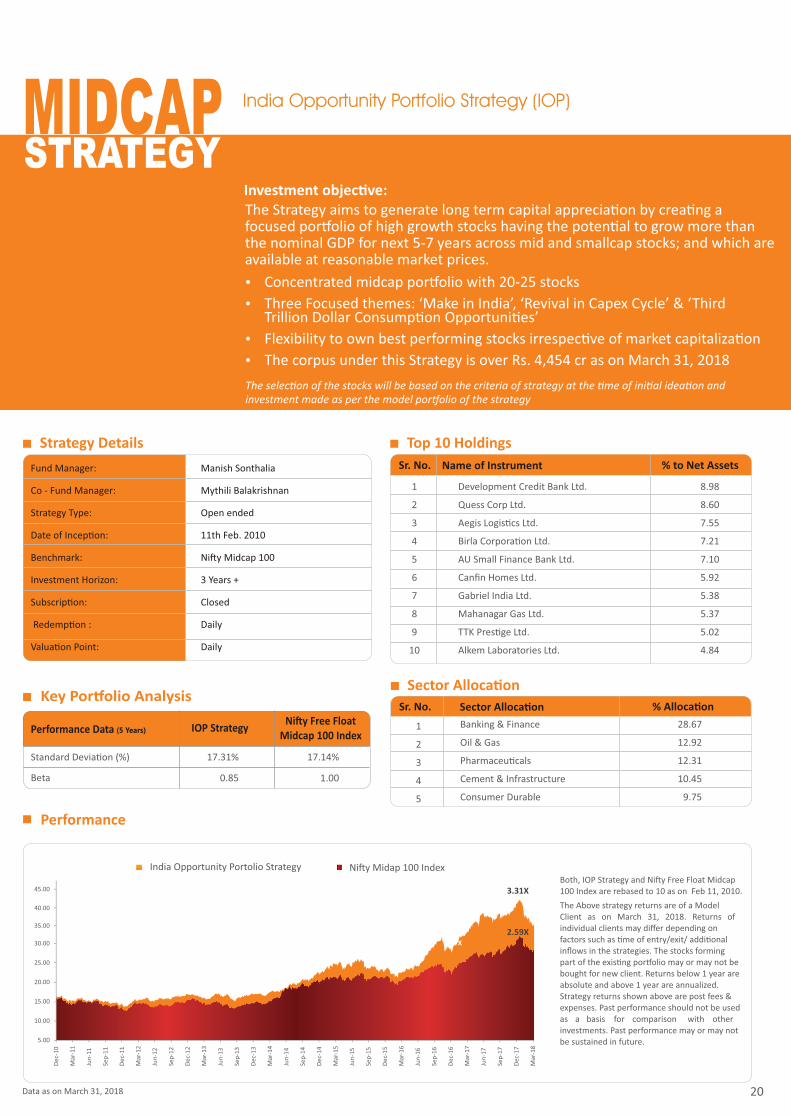
India Opportunity Portfolio Strategy (IOP)
Manish Sonthalia
Mythili Balakrishnan
Open ended
11th Feb. 2010
Ni�y Midcap 100
3 Years +
Closed
Daily
Daily
Strategy Details
Fund Manager:
Co - Fund Manager:
Strategy Type:
Date of Incep�on:
Benchmark:
Investment Horizon:
Subscrip�on:
Redemp�on :
Valua�on Point:
Key Por�olio Analysis
Performance
MIDCAPSTRATEGY
Both, IOP Strategy and Ni�y Free Float Midcap 100 Index are rebased to 10 as on Feb 11, 2010.
The Above strategy returns are of a Model Client as on March 31, 2018. Returns of individual clients may differ depending on factors such as �me of entry/exit/ addi�onal inflows in the strategies. The stocks forming part of the exis�ng por�olio may or may not be bought for new client. Returns below 1 year are absolute and above 1 year are annualized. Strategy returns shown above are post fees & expenses. Past performance should not be used as a basis for comparison with other investments. Past performance may or may not be sustained in future.
Sr. No. Name of Instrument % to Net Assets
1
2
3
4
5
6
7
8
9
10
Development Credit Bank Ltd.
Quess Corp Ltd.
Aegis Logis�cs Ltd.
Birla Corpora�on Ltd.
AU Small Finance Bank Ltd.
Canfin Homes Ltd.
Gabriel India Ltd.
Mahanagar Gas Ltd.
TTK Pres�ge Ltd.
Alkem Laboratories Ltd.
8.98
8.60
7.55
7.21
7.10
5.92
5.38
5.37
5.02
4.84
Top 10 Holdings
28.67
12.92
12.31
10.45
9.75
Sector Alloca�on
Sr. No. Sector Alloca�on % Alloca�on
1
2
3
4
5
Banking & Finance
Oil & Gas
Pharmaceu�cals
Cement & Infrastructure
Consumer Durable
The Strategy aims to generate long term capital apprecia�on by crea�ng a focused por�olio of high growth stocks having the poten�al to grow more than the nominal GDP for next 5-7 years across mid and smallcap stocks; and which are available at reasonable market prices.
Ÿ Concentrated midcap por�olio with 20-25 stocks
Ÿ Three Focused themes: ‘Make in India’, ‘Revival in Capex Cycle’ & ‘Third Trillion Dollar Consump�on Opportuni�es’
Ÿ Flexibility to own best performing stocks irrespec�ve of market capitaliza�on
Ÿ The corpus under this Strategy is over Rs. 4,454 cr as on March 31, 2018
Investment objec�ve:
Performance Data (5 Years)Ni�y Free Float
Midcap 100 IndexIOP Strategy
Standard Devia�on (%)
Beta
17.14%
1.00
17.31%
0.85
Data as on March 31, 2018
India Opportunity Portolio Strategy Ni�y Midap 100 Index
3.31X
5.00
10.00
15.00
20.00
25.00
30.00
De
c-1
0
Mar
-11
Jun
-11
Sep
-11
De
c-1
1
Mar
-12
Jun
-12
Sep
-12
De
c-1
2
Mar
-13
Jun
-13
Sep
-13
De
c-1
3
Mar
-14
Jun
-14
Sep
-14
De
c-1
4
Mar
-15
Jun
-15
Sep
-15
De
c-1
5
Mar
-16
Jun
-16
Sep
-16
De
c-1
6
Mar
-17
Jun
-17
Sep
-17
De
c-1
7
Mar
-18
2.37X
3.15X
20
2.59X35.00
40.00
45.00
The selec�on of the stocks will be based on the criteria of strategy at the �me of ini�al idea�on and investment made as per the model por�olio of the strategy
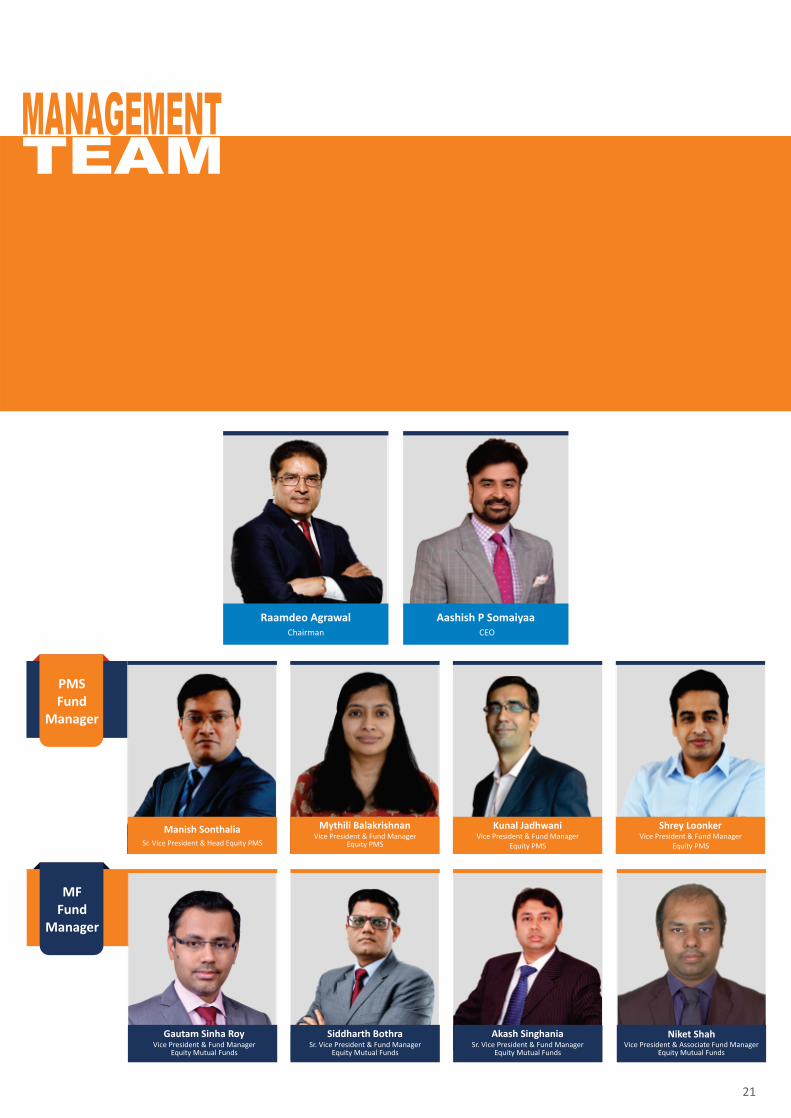
TEAMMANAGEMENT
21
Raamdeo AgrawalChairman
Aashish P Somaiyaa CEO
MFFund
Manager
Gautam Sinha RoyVice President & Fund Manager
Equity Mutual Funds
Siddharth BothraSr. Vice President & Fund Manager
Equity Mutual Funds
Akash SinghaniaSr. Vice President & Fund Manager
Equity Mutual Funds
PMSFund
Manager
Manish SonthaliaSr. Vice President & Head Equity PMS
Mythili BalakrishnanVice President & Fund Manager
Equity PMS
Kunal JadhwaniVice President & Fund Manager
Equity PMS
Shrey LoonkerVice President & Fund Manager
Equity PMS
Vice President & Associate Fund ManagerEquity Mutual Funds
Niket Shah
DISCLAIMER
This document has been issued on the basis of internal data, publicly available informa�on and other sources believed to be reliable. The informa�on contained in this document is for general purposes only and not a complete disclosure of every material fact. The informa�on / data herein alone is not sufficient and shouldn't be used for the development or implementa�on of an investment strategy. It should not be construed as investment advice to any party. All opinions, figures, es�mates and data included in this document are as on the date men�oned in the document. The document does not warrant the completeness or accuracy of the informa�on and disclaims all liabili�es, losses and damages arising out of the use of this informa�on. The statements contained herein may include statements of future expecta�ons and other forward-looking statements that are based on our current views and assump�ons and involve known and unknown risks and uncertain�es that could cause actual results, performance or events to differ materially from those expressed or implied in such statements. Readers shall be fully responsible/liable for any decision taken on the basis of this document. Investments in Securi�es are subject to market and other risks and there is no assurance or guarantee that the objec�ves of any of the strategies of the Por�olio Management Services will be achieved. Name of the Scheme(s)/Strategy(ies) does not in any manner indicate its future prospects and returns. Investors are advised to consult his / her own professional advisor. Past performance may or may not be sustained in future.
Mutual Fund investments are subject to market risks, read all scheme related documents carefully22

For any Mutual Fund queries, please write to mfservice@mo�lalowal.com, Similarly for PMS queries please call us on 022-39804238 or write to
moamc.customercare@mo�lalowal.ccom or visit mo�lal walmf.com
THINK EQUITYTHINK MOTILAL OSWAL