buy - power your trade: investment decisions, financial...
TRANSCRIPT

Time Technoplast Ltd Buy
- 1 - Monday, 18th September, 2017
This document is for private circulation, and must be read in conjunction with the disclaimer on the last page.
ST
OC
K P
OIN
TE
R
Key Financials (Rs in cr)
EPS
EPS
Growth RONW ROCE P/E EV / EBITDA
(`) (%) (%) (%) (x) (x)
2016 2472.1 348.0 138.3 6.6 26.1 13.0 14.9 25.8 11.3
2017 2754.6 404.2 147.1 6.5 -1.2 12.2 14.5 26.1 11.2
2018E 3225.4 474.1 184.6 8.2 25.5 13.4 15.6 20.8 9.7
2019E 3923.2 592.4 264.6 11.7 43.3 16.6 18.6 14.5 7.8
2020E 4311.5 657.5 312.0 13.8 17.9 16.7 19.0 12.3 6.9
Y/E MarNet
RevenueEBITDA Adj. PAT
Target Price ₹ 304 CMP ₹ 205 FY20E22xPE
Index Details Time Technoplast Ltd (TTL) has emerged as a clear winner in the
packaging space after having perfected its business model to iron
out all deficiencies that it used to face earlier. In a short span of 10
years, it has scaled its business to become a multinational
conglomerate with market leadership in 8 countries. All its segments
have witnessed high growth with products like composite cylinders,
for which it has an order book of ~2.5x its current capacity. We
believe that the MOX film and Composite cylinders segments will
drive the company’s future growth and, being extremely profitable,
will influence margins positively. The Plastics segment (77% of total
revenues) is expected to have stable operations with high free cash
flow generation.
Over the period FY17-20, we expect revenues to grow at a CAGR of
16.1% from Rs 2,754.6 crore to Rs 4,311.5 crore. The EBITDA and
PAT too are expected to grow at a CAGR of 17.6% to Rs 657.5 crore
and 27.8%, from Rs 151.4 crore to Rs 316.3 crore, respectively, over
the same period. Return ratios - ROE and ROCE - too are expected to
grow by 451 bps to 16.7% and by 453 bps to 19%, respectively.
We initiate coverage on TTL as a BUY with a price objective of Rs
304, representing a potential upside of 48.3% over a period of 18
months. Our optimism stems from the following-
The Plastic and Drum business will provide stability to the
company, growing at a CAGR of 8.1% from Rs 2,152 crore in
FY17 to Rs 2,720.4 crore by FY20 and will generate positive
cash flows.
Sensex 32,475
Nifty 10,158
Industry Packaging
Scrip Details
MktCap (` cr) 4,438.1
BVPS (`) 58.64
O/s Shares (Cr) 22.62
AvVol 1,46,000
52 Week H/L 62/208.9
Div Yield (%) 0.4
FVPS (`) 1.0
Shareholding Pattern
Shareholders %
Promoters 52.6
Public 47.4
Total 100.0
Time Technoplast vs. Sensex
0
50
100
150
200
250
0
5000
10000
15000
20000
25000
30000
35000
SENSEX Time Technoplast
- 2 - Monday, 18th
September, 2017
This document is for private circulation, and must be read in conjunction with the disclaimer on the last page.
The HDPE and DWC pipes segment is expected to grow on
the back of rapid infrastructure build up. This segment is
expected to grow at a CAGR of 28.1% from Rs 235 crore in
FY17 to Rs 493.1 crore by FY20.
The nascent and fast growing MOX film market, with only one
large competitor (Supreme Industries), provides significant
headroom for growth of this segment. We expect revenues to
grow at a CAGR of 115.9% from Rs 100 crore in FY17 to Rs
465.9 crore by FY20.
Barring India, Composite cylinders have been a hit in other
parts of Asia where the company has a huge order book. The
Indian market for the same is also expected to open up in a
big way with its initial order from RIL. This segment is
expected to grow at a CAGR of 53.7% from Rs 72 crore in
FY17 to Rs 261.2 crore by FY20.
The company has enough cash in hand to repay its long term
debt and will see a fall in its debt-equity from 0.6 in FY17 to
0.4 by FY20.
The operating cash flows of the company are expected to
grow at a CAGR of 43.4% from Rs 157 crore in FY17 to Rs
462.4 crore by FY20. This will outstrip its investment needs
and will lead to a fall in debts and a rise in investments.

- 3 - Monday, 18th
September, 2017
This document is for private circulation, and must be read in conjunction with the disclaimer on the last page.
Company Background
Time Technoplast Ltd (TTL), a leading manufacturer of polymer products is a
multinational conglomerate with operations in Bahrain, Egypt, Indonesia, India,
Malaysia, U.A.E, Taiwan, Thailand & Vietnam.
The company's portfolio consists of technology driven innovative Established
products (Packaging, Lifestyle, Automotive Components, and Infrastructure
related products) and Value Added products (Intermediate Bulk Containers-
IBC, composite cylinders and MOX film).
Since its inception in 1992, the company has focused on research and
development. With its futuristic product design and superior customer service,
facilitated by 28 manufacturing units & 10 regional and marketing offices, it has
become the market leader in 8 of the 9 countries in which it operates.
Business Verticals of Time Technoplast
Source: Time Technoplast, Ventura Research

- 4 - Monday, 18th
September, 2017
This document is for private circulation, and must be read in conjunction with the disclaimer on the last page.
Geographic presence of the company is spread over Asia & Africa
Source: Time Technoplast, Ventura Research
- 5 - Monday, 18th
September, 2017
This document is for private circulation, and must be read in conjunction with the disclaimer on the last page.
Historically what went wrong with the company
In the past, TTL has undertaken several initiatives which have not materialsed
as anticipated. We enumerate five such instances which did not play out:
Composite substitute for LPG cylinders did not fire
Despite composite cylinders having compelling features (viz unique blastproof
attribute, lighter weight, transparent body to check gas levels and non-corrosive
nature), the product did not receive much acceptance in the Indian market. The
only drawback was that the product was 20% costlier than normal steel
cylinders.
However, this domestic failure has turned out to be a blessing in disguise as the
company’s current export order book is far more than its current installed
capacity to manufacture such cylinders.
China & South Korea geography expansion disappointed
The company had forayed into North China (JV with a local player- Fanshun
Elan Plastech Co Ltd) and South Korea. This was primarily for manufacturing
intermediate bulk containers). However, with both these geographies not
performing as anticipated, TTL exited these markets completely. While it took a
complete loss in China, its Korean operations were relocated to Indonesia,
where there was significant demand potential.
Simultaneous multi market expansion dented return ratios
After gaining a leadership position in the Indian industrial packaging market, TTL
in 2012, turned to the Asian industrial packaging market for growth
opportunities. As part of its international strategy, it set up manufacturing
facilities in 10 countries viz. China, Thailand, Indonesia, Taiwan, South Korea,
UAE, Bahrain, Egypt, Malaysia and Vietnam. The overseas facilities had a much
lower capacity utilization (~35-40%) leading to the crashing of TTL’s ROCE
(from 17.8% in 2011 to 14% in 2012) & ROE (from 19.7% in 2011 to 13.4% in
2012). However, the falling ratios were only a short term pain considering the
long term strategy of the company.
Fuel tank disruption market opportunity did not pan out as anticipated
Plastic fuel tanks, which TTL manufactured, presented a good market
opportunity owing to their much lighter weight, ability to be moulded into any
shape as per the structure of the automobile and non leakage feature. However,
this did not take off in India for want of approvals. Cars come in and go out of
favour amongst customers even before companies were able to get approval for
such tanks. TTL had almost secured orders for manufacturing such tanks for
TATA, but the car itself was replaced before TTL could get a green signal.

- 6 - Monday, 18th
September, 2017
This document is for private circulation, and must be read in conjunction with the disclaimer on the last page.
Battery and furniture business fails
The company’s battery business started off well, delivering EBITDA margins in
excess of 20%. However, with the failure of the telecom sector, the business
slumped. Similarly, the company entered the furniture business, which did not
perform and the company had to shut that down too.
Inspite of these strategic failures, the company has done well, growing its
revenue at a CAGR of 13.7% from Rs 1,275.7 crore to Rs 2,754.6 crore over the
period FY11 to FY17 with earnings growing at a CAGR of 4.8% from Rs 147.1
crore to Rs 111 crore over the same period. Going forward revenues are
expected to grow at a CAGR of 16.1% to Rs 4,311.5 crore by FY20. EBITDA &
PAT are expected to grow at a CAGR of 17.6% and 27.9% to Rs 657.5 crore
and Rs 317.2 crore respectively. Our optimism is based on the following:
Key Milestones of the company
0%
5%
10%
15%
20%
25%
30%
35%
0
500
1,000
1,500
2,000
2,500
3,000
3,500
4,000
4,500
5,000
FY06 FY07 FY08 FY09 FY10 FY11 FY12 FY13 FY 14 FY 15 FY 16 FY17 FY18E FY19E FY20E
Revenues EBITDA Margin PAT Margin
Exit from China geography
Company to undertake MOX film business & doubling of cylinder capacity
Entered China
geography
Company lists
on NSE/BSE
Gets order from
RIL for cylinders
In Rs. CrIn %
Acquired TPL
Plastech Ltd
Source: Time Technoplast, Ventura Research
0%
5%
10%
15%
20%
25%
30%
35%
0
500
1,000
1,500
2,000
2,500
3,000
3,500
4,000
4,500
5,000
FY06 FY07 FY08 FY09 FY10 FY11 FY12 FY13 FY 14 FY 15 FY 16 FY17 FY18E FY19E FY20E
Revenues ROE ROCE
In %Multiple product and business expansion with heavy capex lead to steep fall
In Rs. Cr
Multi market expansion led
to crashing of ratios
Source: Time Technoplast, Ventura Research

- 7 - Monday, 18th
September, 2017
This document is for private circulation, and must be read in conjunction with the disclaimer on the last page.
Plastics to continue to account for the bulk of revenues
The plastic business (except IBCs) is expected to grow at a CAGR of 8.1%
From Rs 2,152 crore in FY17 to Rs 2,720.4 crore by FY20. The IBC business is
expected to grow at a CAGR of 7.7% from Rs 297 crore in FY17 to Rs 370.9
crore by FY20.
Diversified Market
TTL produces polymer drums / barrels, Jerry cans, Intermediate Bulk Containers
and Pails for varied packaging requirements at its 23 manufacturing facilities (4
of these are housed in its subsidiaries). It caters to varied sectors like specialty
chemicals (31%), construction chemicals (13%), paints and pigments (12%),
food and beverage (29%), pharmaceutical (5%), petroleum (5%) and
miscellaneous (industrial coatings, agricultural, mineral, packaging, automotive
and building products-5%).
Geography-wise, the markets are spread across in 9 countries namely India,
Egypt, Bahrain, UAE, Thailand, Vietnam, Malaysia, Indonesia and Taiwan.
While in India it has a dominant position with a 55% market share, it is a market
leader in 8 of the 9 countries where it has a presence (all barring Malaysia).
Technological capabilities that are at par with international peers provide
immunity from competition
The technological capabilities of TTL are on par with its global peers Mauser,
Schutz & Greif. This provides no player a significant advantage over others.
Hence, TTL has immunity from any competitive cannibalization in the markets
where it has a strong presence.
Plastic business to remain company’s cash cow
-
500
1,000
1,500
2,000
2,500
3,000
FY 15 FY 16 FY17 FY18 E FY19 E FY20 E
Drums, Cans & other ancillary products EBITDA Drums
In Rs. Cr
Source: Time Technoplast, Ventura Research
IBC business to be steady
-
50
100
150
200
250
300
350
400
FY 15 FY 16 FY17 FY18 E FY19 E FY20 E
Intermediate Bulk Container (IBCs) EBITDA IBCs
In Rs. Cr
Source: Time Technoplast, Ventura Research
- 8 - Monday, 18th
September, 2017
This document is for private circulation, and must be read in conjunction with the disclaimer on the last page.
China is also not a competitive threat, given the fact that the products are
voluminous in nature and transport beyond a radius of 300 kms makes it
economically unviable.
Expansion through various routes- Buy outs, JVs & Greenfield
These products had a one player market all over the world, enjoying a
leadership position while others were small players. So, from 2009 there was a
rush to capture market share all over and with Asian countries growing at a
higher rate than others. TTL started setting up units in all these places. If a
market had strong player the approach was to buy it out. If a competitor did not
agree to it, TTL used to set up a factory and with its product incurring lower raw
material costs, the other player used to bow out. The company applied this
strategy to market leaders in Thailand & Taiwan, ultimately acquiring them. The
rest of the locations were Greenfield projects. Apart from this, the company has
a 49% stake in a JV with Mauser for production of steel drums, which it
undertakes only on a made to order basis for its customers.
Opening up of PSU and government orders to the bidding process
augments well for the company
Earlier all orders from the Indian government used to a single player as there
was no competitive bidding process. But now the government has opened up
gates for the same, TTL with its superior technology and cost effectiveness
stands at good stead to grab such orders.
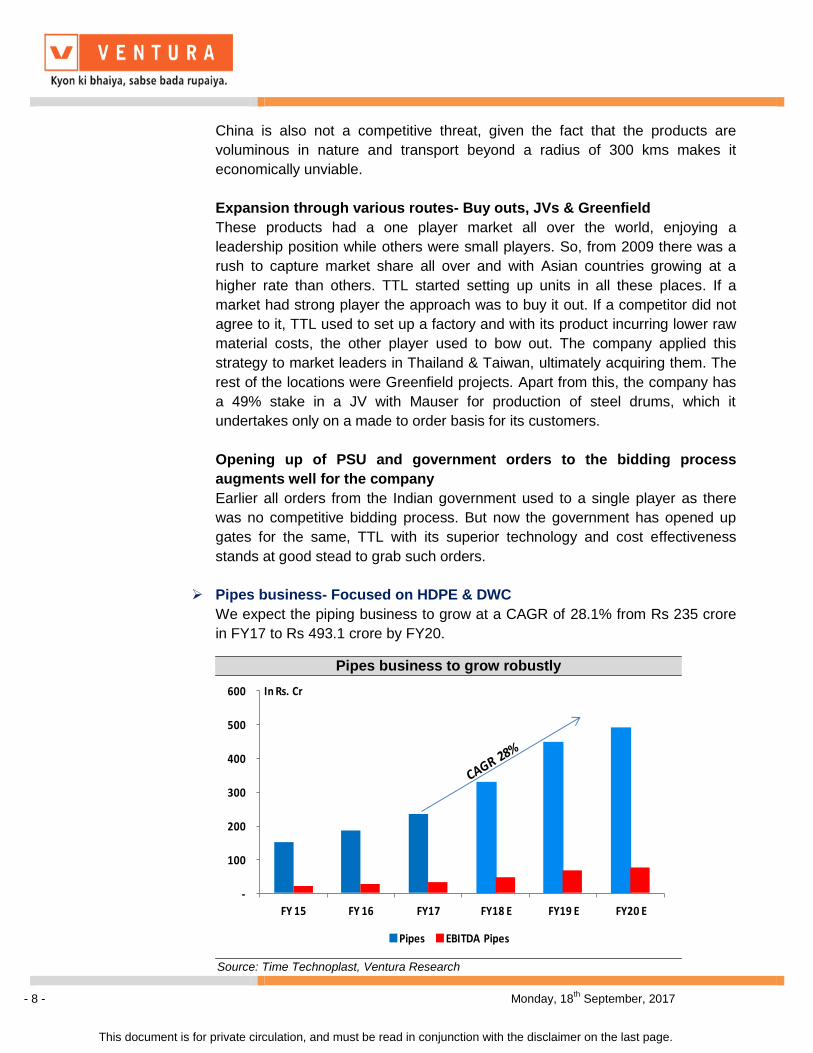
Pipes business- Focused on HDPE & DWC
We expect the piping business to grow at a CAGR of 28.1% from Rs 235 crore
in FY17 to Rs 493.1 crore by FY20.
Pipes business to grow robustly
-
100
200
300
400
500
600
FY 15 FY 16 FY17 FY18 E FY19 E FY20 E
Pipes EBITDA Pipes
In Rs. Cr
Source: Time Technoplast, Ventura Research
- 9 - Monday, 18th
September, 2017
This document is for private circulation, and must be read in conjunction with the disclaimer on the last page.
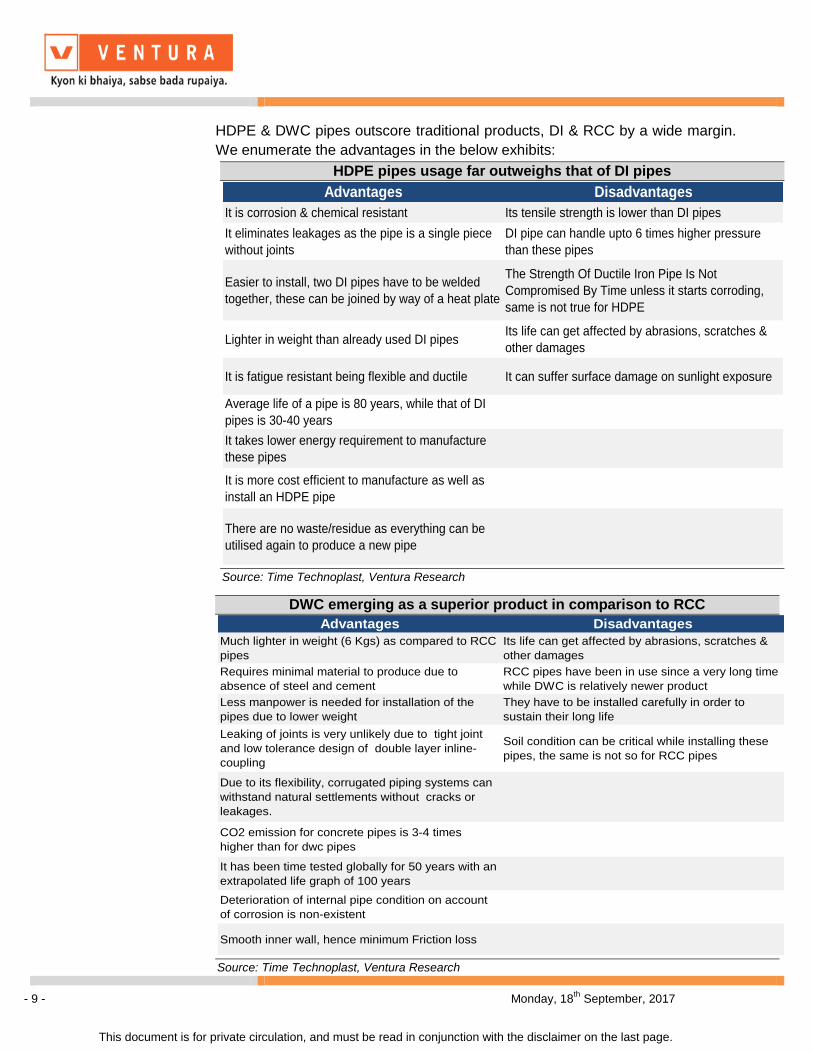
HDPE & DWC pipes outscore traditional products, DI & RCC by a wide margin.
We enumerate the advantages in the below exhibits:
HDPE pipes usage far outweighs that of DI pipes
Advantages Disadvantages
It is corrosion & chemical resistant Its tensile strength is lower than DI pipes
It eliminates leakages as the pipe is a single piece
without joints
DI pipe can handle upto 6 times higher pressure
than these pipes
Easier to install, two DI pipes have to be welded
together, these can be joined by way of a heat plate
The Strength Of Ductile Iron Pipe Is Not
Compromised By Time unless it starts corroding,
same is not true for HDPE
Lighter in weight than already used DI pipesIts life can get affected by abrasions, scratches &
other damages
It is fatigue resistant being flexible and ductile It can suffer surface damage on sunlight exposure
Average life of a pipe is 80 years, while that of DI
pipes is 30-40 years
It takes lower energy requirement to manufacture
these pipes
It is more cost efficient to manufacture as well as
install an HDPE pipe
There are no waste/residue as everything can be
utilised again to produce a new pipe
Source: Time Technoplast, Ventura Research
DWC emerging as a superior product in comparison to RCC
Advantages Disadvantages
Much lighter in weight (6 Kgs) as compared to RCC
pipes
Its life can get affected by abrasions, scratches &
other damages
Requires minimal material to produce due to
absence of steel and cement
RCC pipes have been in use since a very long time
while DWC is relatively newer product
Less manpower is needed for installation of the
pipes due to lower weight
They have to be installed carefully in order to
sustain their long life
Leaking of joints is very unlikely due to tight joint
and low tolerance design of double layer inline-
coupling
Soil condition can be critical while installing these
pipes, the same is not so for RCC pipes
Due to its flexibility, corrugated piping systems can
withstand natural settlements without cracks or
leakages.
CO2 emission for concrete pipes is 3-4 times
higher than for dwc pipes
It has been time tested globally for 50 years with an
extrapolated life graph of 100 years
Deterioration of internal pipe condition on account
of corrosion is non-existent
Smooth inner wall, hence minimum Friction loss
Source: Time Technoplast, Ventura Research
- 10 - Monday, 18th
September, 2017
This document is for private circulation, and must be read in conjunction with the disclaimer on the last page.
Goa & Southern India replacing DI & RCC pipes - presenting huge
opportunities
In Goa (Panaji region) the sewage and drinking water lines criss-cross
the entire area, these lines were fully made up of DI & RCC pipes which
recently started leaking, leading to impurities entering drinking water.
The government decided to replace the entire line compulsorily with
HDPE pipes.
The Chennai region faced water shortage and pipes were needed to
bring water from various nearby quarries to the city, for which only HDPE
pipes are being used.
In order to cater to the huge demand for DWC & HDPE, TTL has set up a
manufacturing facility in Hyderabad.
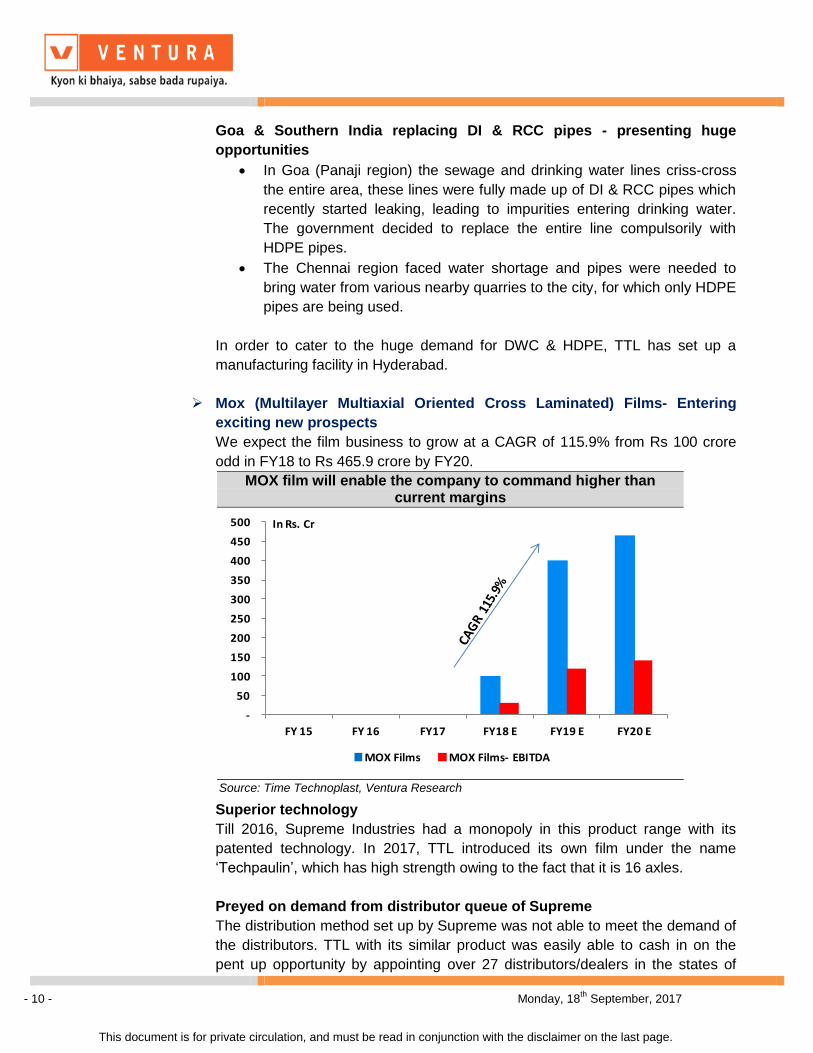
Mox (Multilayer Multiaxial Oriented Cross Laminated) Films- Entering
exciting new prospects
We expect the film business to grow at a CAGR of 115.9% from Rs 100 crore
odd in FY18 to Rs 465.9 crore by FY20.
Superior technology
Till 2016, Supreme Industries had a monopoly in this product range with its
patented technology. In 2017, TTL introduced its own film under the name
‘Techpaulin’, which has high strength owing to the fact that it is 16 axles.
Preyed on demand from distributor queue of Supreme
The distribution method set up by Supreme was not able to meet the demand of
the distributors. TTL with its similar product was easily able to cash in on the
pent up opportunity by appointing over 27 distributors/dealers in the states of
MOX film will enable the company to command higher than current margins
-
50
100
150
200
250
300
350
400
450
500
FY 15 FY 16 FY17 FY18 E FY19 E FY20 E
MOX Films MOX Films- EBITDA
In Rs. Cr
Source: Time Technoplast, Ventura Research

- 11 - Monday, 18th
September, 2017
This document is for private circulation, and must be read in conjunction with the disclaimer on the last page.
Kerala, Andhra Pradesh, Karnataka, Telangana and Maharashtra (in the initial
phase). The company is in the process of further appointing distributors and
dealers in other states.
Product commands high margins
The management has forecast margins in excess of 20%. This is higher than
the company’s current margin of 14.8%. As this market operates on payment
against supply or advance payment, after the product is established, it helps the
company improve its working capital cycle in the long run.
High growth segment
The company’s capacity will get fully utilized from its initial orders in Southern
India and its predicting further demand pan India. With such heavy demand and
the fact that there are only two companies which make this product, the
segment is poised to growth very fast. The company has undertaken extensive
marketing in countries like Australia and Pakistan as well to further fuel growth.
Multiple applications
The product is amenable to multiple uses. It can be used to cover primarily
anything and is an easy substitute to the “Tarpatri” used on top of trucks, roofs,
kaccha houses, vendor’s shops, pond underlining etc. Apart from this, the
product can be put to other high end uses as well. TTL has tied up with an
Israeli company to make these films infrared proof, which makes it suitable for
use over greenhouses, as it will not allow any insects to navigate inside, and
enable dispersions to help the sunlight spread evenly. Such films are designed
to handle a temperature variation up to 18 degrees, thereby helping in better
growth of plants. The company has also created waterproof cement bags. At a
price of Rs 10 per bag, these are 33% lower than the current bags which cost
Rs 15. Additionally, they have a 67% lower weight at 40 grams/bag compared to
the current bags which weigh 120 grams.
Multiple benefits
The product has multiple benefits- it is light weight yet tough, easy to handle and
100% recyclable, hence eco-friendly. It is U. V. stabilized with stronger heat
sealed joints, thus 100% leak proof. It is also waterproof (weather resistant) and
Rot proof, available in 5 attractive colours and various thicknesses. Being
flexible, it is convenient for covering irregular shapes and sizes with excellent
tear/tensile/puncture and impact resistance.

- 12 - Monday, 18th
September, 2017
This document is for private circulation, and must be read in conjunction with the disclaimer on the last page.
Composite cylinders- unique blastproof technology
We expect the cylinder business to grow at a CAGR of 53.7% from Rs 72 crore
in FY17 to Rs 261.2 crore by FY20.
Global opportunities
As outlined earlier in the report, despite the product not seeing the light of the
day in the Indian markets, the company is well positioned globally. Today, this
product is an immense success, with having got approvals in 50 countries and
exported to 26 of them. It has also started receiving orders for the same with
Composite cylinders are set to replace the steel ones in future
Advantages Disadvantages
It is blast proof in nature making it safe for
commercial and household usesIts cost is 20% higher than normal steel cylinders
It is corrosion & rust resistantIt requires a deposit of Rs 500 extra due to its
higher cost of production
It is half the weight of steel cylinders
It is translucent allowing user to check the amount
of gas left inside
It is easy to manufacture and fabricate.
Improved stiffness and impact resistance properties
Higher fatigue endurance limit
Can perform in diverse weather conditions as well
Its average life is 25 years while that of steel
cylinders are 10-15 years
Source: Time Technoplast, Ventura Research
Cylinder revenue will shoot up after doubling of capacity post FY18
-
50
100
150
200
250
300
FY 15 FY 16 FY17 FY18 E FY19 E FY20 E
Composite Cylinders Composite Cylinders- EBITDA
In Rs. Cr
Source: Time Technoplast, Ventura Research
- 13 - Monday, 18th
September, 2017
This document is for private circulation, and must be read in conjunction with the disclaimer on the last page.
South Korea enacting compulsory replacement of 7 million steel cylinders. Even
smaller countries like Bangladesh, Dubai, Nepal, Philippines & Mauritius are
looking to replace their steel cylinders with the composite ones.
Orders exceed capacity
The current order book of the company stands at 18 lakh cylinders, while the
company’s current capacity stands at 7 lakh cylinders. The company plans to
double its capacity to 14 lakh cylinders by the end of FY 2018, but even this is
falling short of its current order book.
Opening up of India LPG markets
Further, with the global opportunities and the “Pradhan Mantri Ujjwala Yojana”
scheme taking colour, the future demand for such cylinders looks very bright.
Order from RIL
TTL got its first domestic order from Reliance Gas which supplies LPG in
Pune. All composite cylinders supplied by Reliance within the city are of
TTL. Further, RIL now intends to roll out LPG distribution in the entire
country, for which they have chosen a few cities in Maharashtra and
Gujarat initially. In this regard, TTL has received a repeat order from RIL
and expects sizeable orders, going forward.
Regulated prices to be freed
The government has ordered state-run oil companies to raise subsidised
cooking gas (LPG) prices by Rs 4 per cylinder every month to eliminate
all the subsidies by March 2018. This move will bring the price of gas
supplied by private players on par with government cylinder prices. This
is expected to further fuel order flows from RIL.
Multiple usages
Apart from its use as LPG gas cylinders in homes; this product can be used in
commercial spaces, yachts, outdoor camping and industrial areas. The cylinders
are also being modified so that it can be used for CNG storage, which is used in
cars. CNG requires 3 times more pressure than LPG and thus, the company,
through its R&D efforts, is in the process of producing cylinders for CNG
connections as well. The company aspires to even manufacture hydrogen
cylinders, which require 12 times more pressure than LPG cylinders. R&D for
both these is underway.
Steel drums produced on ‘made to order’ basis for customers
Apart from its composite cylinders, the company, through its JV with Mauser
also produces steel cylinders. These are strictly made after the company
receives an order from its clients. Although, it does not form a significant part of
the revenue mix, it remains an important cog, in order to satisfy its clients fully,
- 14 - Monday, 18th
September, 2017
This document is for private circulation, and must be read in conjunction with the disclaimer on the last page.
as not all reactive chemicals can be stored in polymer drums and containers.
So, in order to provide a complete gamut of services the company undertakes
such orders.
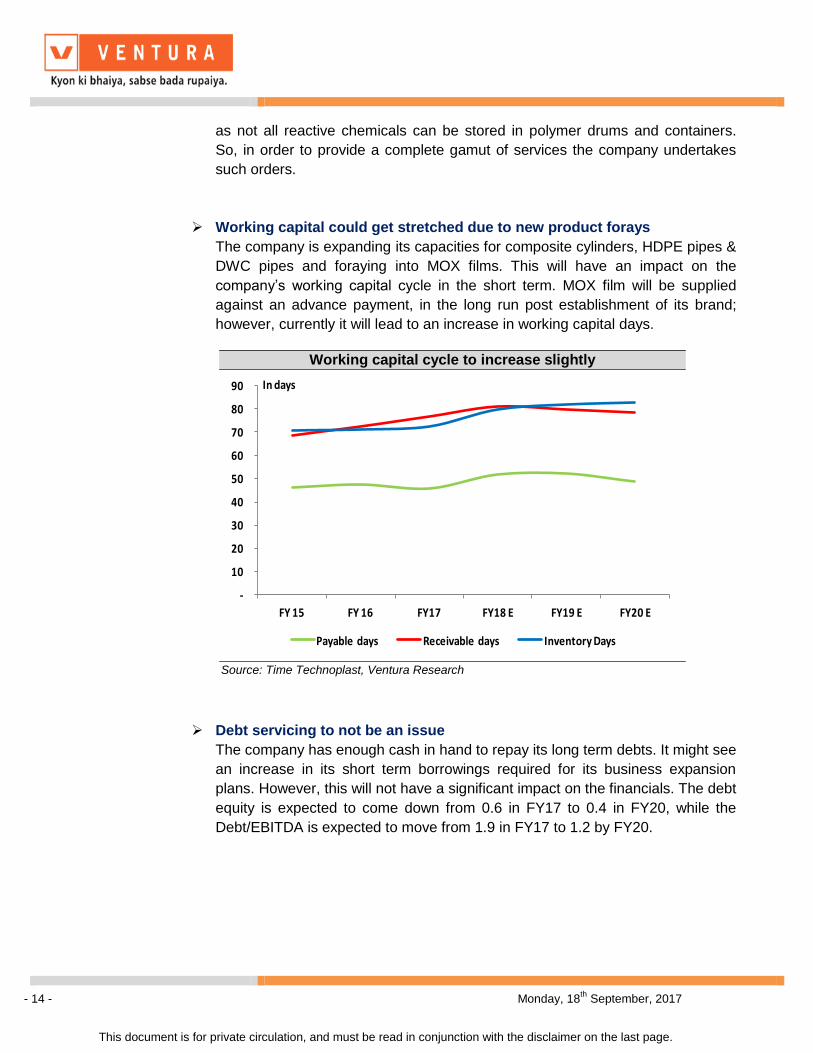
Working capital could get stretched due to new product forays
The company is expanding its capacities for composite cylinders, HDPE pipes &
DWC pipes and foraying into MOX films. This will have an impact on the
company’s working capital cycle in the short term. MOX film will be supplied
against an advance payment, in the long run post establishment of its brand;
however, currently it will lead to an increase in working capital days.
Debt servicing to not be an issue
The company has enough cash in hand to repay its long term debts. It might see
an increase in its short term borrowings required for its business expansion
plans. However, this will not have a significant impact on the financials. The debt
equity is expected to come down from 0.6 in FY17 to 0.4 in FY20, while the
Debt/EBITDA is expected to move from 1.9 in FY17 to 1.2 by FY20.
Working capital cycle to increase slightly
-
10
20
30
40
50
60
70
80
90
FY 15 FY 16 FY17 FY18 E FY19 E FY20 E
Payable days Receivable days Inventory Days
In days
Source: Time Technoplast, Ventura Research

- 15 - Monday, 18th
September, 2017
This document is for private circulation, and must be read in conjunction with the disclaimer on the last page.
Cash flows to be healthy
Operating cashflows are expected to grow at a CAGR of 43.4% from Rs 157
crore in FY17 to Rs 462.4 crore in FY20. Cash flow generation outstrips the
investment needs.
Debt to go down subsequently with rising profits
-
0.5
1.0
1.5
2.0
2.5
FY 15 FY 16 FY17 FY18 E FY19 E FY20 E
Debt/Equity Debt/EBITDA
No of times
Source: Time Technoplast, Ventura Research
Operating cashflows to go up significantly
-
50
100
150
200
250
300
350
400
450
500
FY 15 FY 16 FY17 FY18 E FY19 E FY20 E
FY 15 FY 16 FY17 FY18 E FY19 E FY20 E
In Rs. Cr
Source: Time Technoplast, Ventura Research

- 16 - Monday, 18th
September, 2017
This document is for private circulation, and must be read in conjunction with the disclaimer on the last page.
Financial Performance
In Q1FY18, TTL reported a healthy 9.8% growth in topline to Rs 680.6 crore
from Rs 619.9 crore reported in the same quarter of the previous year. The
EBIDTA margin increased 13 bps to 14.9% from 14.8%, mainly on account of a
fall in goods purchased. The PAT stood at 36.9 crore increasing 11.8% YoY on
account of strong operating performance.
During FY17, TTL’s net sales stood at Rs 2,754.6 crore registering a growth of
13.7% YoY. The EBIDTA margin increased 31 bps YoY to 14.8% while the PAT
increased by 23.8% YoY to touch Rs 151.4 crore.
Financial Performance (Rs in crore)
Description Q1FY18 Q1FY17 FY17 FY16
Profit & Loss Statement
Net Sales 680.6 619.9 2754.6 2422.7
Growth(%) 9.8% 13.7%
Total Expenditure 579.1 528.0 2350.4 2074.9
% of sales 85.1% 85.2% 85.3% 85.6%
EBDITA 101.5 91.8 404.2 347.8
EBDITA Margin % 14.9% 14.8% 14.7% 14.4%
Other Income 0.4 0.1 2.2 2.1
PBDIT 101.9 92.0 406.5 350.0
Depreciation 32.8 26.4 115.5 98.8
Interest 21.0 23.4 90.1 96.2
Exceptional items 0.0 0.0 0.0 0.0
PBT 48.0 42.2 200.9 154.9
Margin % 7.1% 6.8% 7.3% 6.4%
Tax Provisions 11.1 9.2 49.4 32.6
Reported PAT 36.9 33.0 151.4 122.4
Extraordinary items 0.0 0.0 0.0 19.5
Minority Interest -0.6 -1.1 -4.3 -3.7
Share of Associate 0.0 0.0 0.0 0.0
PAT 36.3 31.9 147.1 138.1
Margin % 5.3% 5.1% 5.3% 5.7%
Source: Time Technoplast, Ventura Research

- 17 - Monday, 18th
September, 2017
This document is for private circulation, and must be read in conjunction with the disclaimer on the last page.
Financial Outlook
The revenue growth trajectory is expected to continue, going forward on the
back of increased expansion in the composite cylinder and foray into the Mox
film segment. We expect overall revenues to grow at a CAGR of 16.1% over
FY17-20 to Rs 4,311.5 crore from Rs 2,754.6 crore reported in FY17. Further,
the EBIDTA and PAT margins are expected to go upto 14.8% and 5.5% in FY20
from 15.6% and 7.4% respectively.
Return ratios ROCE and ROE are also expected to get bumped up by 451 bps
and 453 bps to 19.1% and 16.7% from 14.5% and 12.2% respectively by FY20.
Revenues, EBIDTA and PAT margins
0%
5%
10%
15%
20%
1,000
1,500
2,000
2,500
3,000
3,500
4,000
4,500
FY 15 FY 16 FY17 FY18 E FY19 E FY20 EPlastics PipesComposite Cylinders Intermediate Bulk Container (IBCs)Mox Film EBITDA marginPAT margin
In Rs. Cr In %
Source: Time Technoplast, Ventura Research
Strong financials to boost ROCE and ROE
0%
5%
10%
15%
20%
25%
FY 15 FY 16 FY17 FY18 E FY19 E FY20 E
ROCE ROE
In %
Source: Time Technoplast, Ventura Research
- 18 - Monday, 18th
September, 2017
This document is for private circulation, and must be read in conjunction with the disclaimer on the last page.
Key Risk and Threats
Bulk of the plastic business supplies its products to the chemical industry (31%
of specialty chemicals & 13% of construction chemicals). Any slowdown in these
industries will have a direct effect on company’s growth rate in this segment.
All the products are made of HDPE; an increase in the same will have to be
followed by a subsequent hike in sale prices for the company to maintain similar
margins. Currently the prices have been stable but might fluctuate in the future.
The company operates in 8 countries apart from India; any fluctuations in the
exchange rates in such countries might have an effect on the company’s
financials.
It might become difficult for the company to market and sell its MOX films
considering the undisputed leadership by Supreme Industries Ltd in that space.

- 19 - Monday, 18th
September, 2017
This document is for private circulation, and must be read in conjunction with the disclaimer on the last page.
Valuation
We initiate coverage on TTL with a BUY with a price objective of Rs 304 (22X
FY20 earnings) representing a potential upside of 48.3% from the CMP of Rs
205.
Peer Comparison (Rs in crore)
Y/E March Sales EBITDA PAT
EBITDA
Margin
(%)
PAT
Margin
(%)
ROE
(%)
ROCE
(%)
P/E
(x)
P/BV
(x)
EV/
EBITDA
(x)
Time Technoplast
2016 2,472.1 348.0 138.3 14.1 5.6 13.0 14.9 25.8 3.1 11.3
2017 2,754.6 404.2 147.1 14.7 5.3 12.2 14.5 26.1 2.9 11.2
2018E 3,225.4 474.1 184.6 14.7 5.7 13.4 15.6 20.8 2.6 9.7
2019E 3,923.2 592.4 264.6 15.1 6.7 16.6 18.6 14.5 2.2 7.8
2020E 4,311.5 657.5 312.9 15.3 7.3 16.7 19.1 12.3 1.9 6.9
Sintex Plastics Technology
2016
2017 5,810.6 1,013.2 420.8 17.4 7.2 13.5 11.4 14.2 1.9 9.5
2018E 6,349.9 1,118.4 470.6 17.6 7.4 13.1 11.9 13.3 1.7 8.3
2019E 7,014.6 1,281.9 571.1 18.3 8.1 13.7 12.9 11.4 1.6 7.0
Nilkamal Ltd
2016 1,860.1 214.6 103.9 11.5 5.6 19.3 25.0 14.4 2.6 13.6
2017 1,956.6 229.3 118.5 11.7 6.1 18.5 23.8 23.8 3.9 12.7
2018E 2,260.6 261.2 135.9 11.6 6.0 16.9 29.0 20.6 3.4 11.2
2019E 2,500.1 290.1 154.2 11.6 6.2 16.7 28.6 18.1 2.9 10.1
Supreme Industries
2016 2,958.6 461.1 228.9 15.6 7.7 18.1 23.8 N/A 7.1 31.3
2017 7,401.5 767.0 376.7 10.4 5.1 25.0 33.0 32.1 8.2 18.8
2018E 4,992.5 801.9 428.7 16.1 6.3 24.7 30.5 30.2 7.3 17.3
2019E 5,898.6 979.4 550.8 16.6 9.3 27.0 34.4 24.6 6.2 14.5
Source: Time Technoplast, Bloomberg, Ventura Research

- 20 - Monday, 18th
September, 2017
This document is for private circulation, and must be read in conjunction with the disclaimer on the last page.
Time Technoplast PB trend
0
20
40
60
80
100
120
140
160
180
200
CMP 1X 1.5X 2X 2.5X 3X
Source: Time Technoplast, Ventura Research
Time Technoplast EV/EBITDA trend
0
500
1000
1500
2000
2500
3000
3500
4000
4500
5000
01-04-2013 01-04-2014 01-04-2015 01-04-2016 01-04-2017
EV 4X 5.75X 7.5X 9.25X 11X
Source: Time Technoplast, Ventura Research
Time Technoplast PE trend
0
20
40
60
80
100
120
140
160
180
200
31-03-2013 31-03-2014 31-03-2015 31-03-2016 31-03-2017
CMP 7X 11.5X 16X 20.5X 25X
Source: Time Technoplast, Ventura Research
- 21 - Monday, 18th
September, 2017
This document is for private circulation, and must be read in conjunction with the disclaimer on the last page.
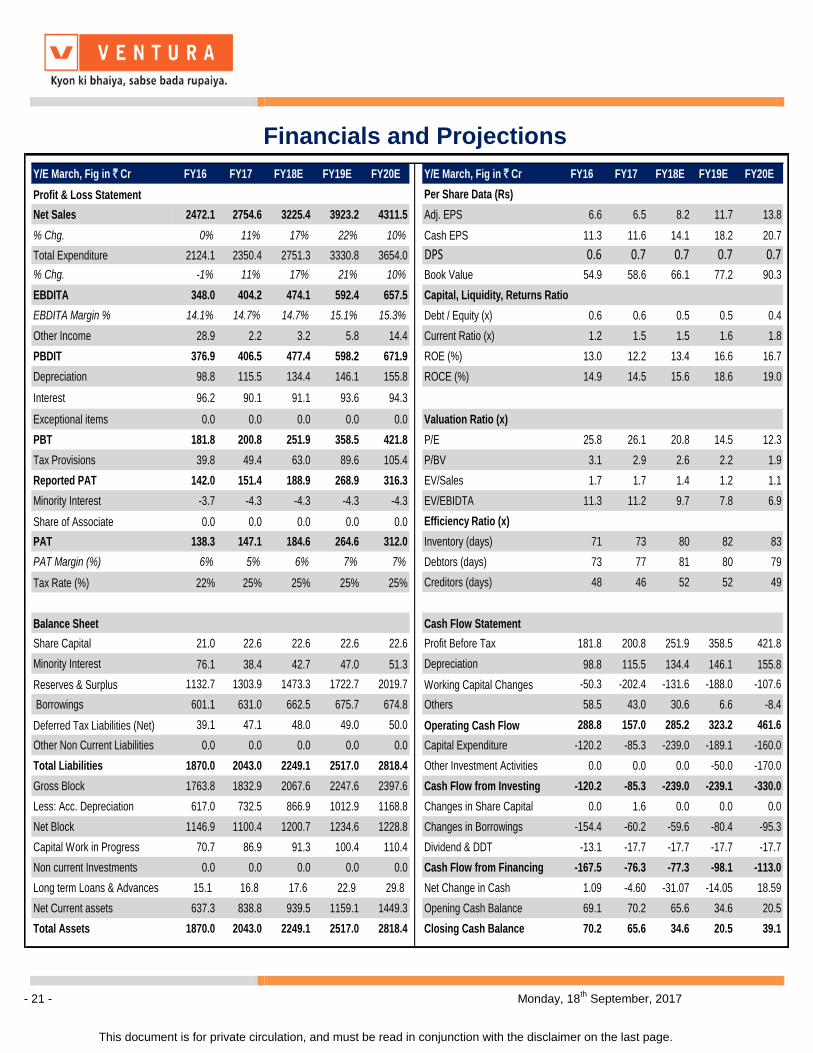
Financials and Projections
Y/E March, Fig in ` Cr FY16 FY17 FY18E FY19E FY20E Y/E March, Fig in ` Cr FY16 FY17 FY18E FY19E FY20E
Profit & Loss Statement Per Share Data (Rs)
Net Sales 2472.1 2754.6 3225.4 3923.2 4311.5 Adj. EPS 6.6 6.5 8.2 11.7 13.8
% Chg. 0% 11% 17% 22% 10% Cash EPS 11.3 11.6 14.1 18.2 20.7
Total Expenditure 2124.1 2350.4 2751.3 3330.8 3654.0 DPS 0.6 0.7 0.7 0.7 0.7
% Chg. -1% 11% 17% 21% 10% Book Value 54.9 58.6 66.1 77.2 90.3
EBDITA 348.0 404.2 474.1 592.4 657.5 Capital, Liquidity, Returns Ratio
EBDITA Margin % 14.1% 14.7% 14.7% 15.1% 15.3% Debt / Equity (x) 0.6 0.6 0.5 0.5 0.4
Other Income 28.9 2.2 3.2 5.8 14.4 Current Ratio (x) 1.2 1.5 1.5 1.6 1.8
PBDIT 376.9 406.5 477.4 598.2 671.9 ROE (%) 13.0 12.2 13.4 16.6 16.7
Depreciation 98.8 115.5 134.4 146.1 155.8 ROCE (%) 14.9 14.5 15.6 18.6 19.0
Interest 96.2 90.1 91.1 93.6 94.3
Exceptional items 0.0 0.0 0.0 0.0 0.0 Valuation Ratio (x)
PBT 181.8 200.8 251.9 358.5 421.8 P/E 25.8 26.1 20.8 14.5 12.3
Tax Provisions 39.8 49.4 63.0 89.6 105.4 P/BV 3.1 2.9 2.6 2.2 1.9
Reported PAT 142.0 151.4 188.9 268.9 316.3 EV/Sales 1.7 1.7 1.4 1.2 1.1
Minority Interest -3.7 -4.3 -4.3 -4.3 -4.3 EV/EBIDTA 11.3 11.2 9.7 7.8 6.9
Share of Associate 0.0 0.0 0.0 0.0 0.0 Efficiency Ratio (x)
PAT 138.3 147.1 184.6 264.6 312.0 Inventory (days) 71 73 80 82 83
PAT Margin (%) 6% 5% 6% 7% 7% Debtors (days) 73 77 81 80 79
Tax Rate (%) 22% 25% 25% 25% 25% Creditors (days) 48 46 52 52 49
Balance Sheet Cash Flow Statement
Share Capital 21.0 22.6 22.6 22.6 22.6 Profit Before Tax 181.8 200.8 251.9 358.5 421.8
Minority Interest 76.1 38.4 42.7 47.0 51.3 Depreciation 98.8 115.5 134.4 146.1 155.8
Reserves & Surplus 1132.7 1303.9 1473.3 1722.7 2019.7 Working Capital Changes -50.3 -202.4 -131.6 -188.0 -107.6
Borrowings 601.1 631.0 662.5 675.7 674.8 Others 58.5 43.0 30.6 6.6 -8.4
Deferred Tax Liabilities (Net) 39.1 47.1 48.0 49.0 50.0 Operating Cash Flow 288.8 157.0 285.2 323.2 461.6
Other Non Current Liabilities 0.0 0.0 0.0 0.0 0.0 Capital Expenditure -120.2 -85.3 -239.0 -189.1 -160.0
Total Liabilities 1870.0 2043.0 2249.1 2517.0 2818.4 Other Investment Activities 0.0 0.0 0.0 -50.0 -170.0
Gross Block 1763.8 1832.9 2067.6 2247.6 2397.6 Cash Flow from Investing -120.2 -85.3 -239.0 -239.1 -330.0
Less: Acc. Depreciation 617.0 732.5 866.9 1012.9 1168.8 Changes in Share Capital 0.0 1.6 0.0 0.0 0.0
Net Block 1146.9 1100.4 1200.7 1234.6 1228.8 Changes in Borrowings -154.4 -60.2 -59.6 -80.4 -95.3
Capital Work in Progress 70.7 86.9 91.3 100.4 110.4 Dividend & DDT -13.1 -17.7 -17.7 -17.7 -17.7
Non current Investments 0.0 0.0 0.0 0.0 0.0 Cash Flow from Financing -167.5 -76.3 -77.3 -98.1 -113.0
Long term Loans & Advances 15.1 16.8 17.6 22.9 29.8 Net Change in Cash 1.09 -4.60 -31.07 -14.05 18.59
Net Current assets 637.3 838.8 939.5 1159.1 1449.3 Opening Cash Balance 69.1 70.2 65.6 34.6 20.5
Total Assets 1870.0 2043.0 2249.1 2517.0 2818.4 Closing Cash Balance 70.2 65.6 34.6 20.5 39.1
- 22 - Monday, 18th
September, 2017
This document is for private circulation, and must be read in conjunction with the disclaimer on the last page.
Disclosures and Disclaimer
Ventura Securities Limited (VSL) is a SEBI registered intermediary offering broking, depository and portfolio management services to clients. VSL is member of BSE, NSE and MCX-SX. VSL is a depository participant of NSDL. VSL states that no disciplinary action whatsoever has been taken by SEBI against it in last five years except administrative warning issued in connection with technical and venial lapses observed while inspection of books of accounts and records. Ventura Commodities Limited, Ventura Guaranty Limited, Ventura Insurance Brokers Limited and Ventura Allied Services Private Limited are associates of VSL. Research Analyst (RA) involved in the preparation of this research report and VSL disclose that neither RA nor VSL nor its associates (i) have any financial interest in the company which is the subject matter of this research report (ii) holds ownership of one percent or more in the securities of subject company (iii) have any material conflict of interest at the time of publication of this research report (iv) have received any compensation from the subject company in the past twelve months (v) have managed or co-managed public offering of securities for the subject company in past twelve months (vi) have received any compensation for investment banking merchant banking or brokerage services from the subject company in the past twelve months (vii) have received any compensation for product or services from the subject company in the past twelve months (viii) have received any compensation or other benefits from the subject company or third party in connection with the research report. RA involved in the preparation of this research report discloses that he / she has not served as an officer, director or employee of the subject company. RA involved in the preparation of this research report and VSL discloses that they have not been engaged in the market making activity for the subject company. Our sales people, dealers, traders and other professionals may provide oral or written market commentary or trading strategies to our clients that reflect opinions that are contrary to the opinions expressed herein. We may have earlier issued or may issue in future reports on the companies covered herein with recommendations/ information inconsistent or different those made in this report. In reviewing this document, you should be aware that any or all of the foregoing, among other things, may give rise to or potential conflicts of interest. We may rely on information barriers, such as "Chinese Walls" to control the flow of information contained in one or more areas within us, or other areas, units, groups or affiliates of VSL. This report is for information purposes only and this document/material should not be construed as an offer to sell or the solicitation of an offer to buy, purchase or subscribe to any securities, and neither this document nor anything contained herein shall form the basis of or be relied upon in connection with any contract or commitment whatsoever. This document does not solicit any action based on the material contained herein. It is for the general information of the clients / prospective clients of VSL. VSL will not treat recipients as clients by virtue of their receiving this report. It does not constitute a personal recommendation or take into account the particular investment objectives, financial situations, or needs of clients / prospective clients. Similarly, this document does not have regard to the specific investment objectives, financial situation/circumstances and the particular needs of any specific person who may receive this document. The securities discussed in this report may not be suitable for all investors. The appropriateness of a particular investment or strategy will depend on an investor's individual circumstances and objectives. Persons who may receive this document should consider and independently evaluate whether it is suitable for his/ her/their particular circumstances and, if necessary, seek professional/financial advice. And such person shall be responsible for conducting his/her/their own investigation and analysis of the information contained or referred to in this document and of evaluating the merits and risks involved in the securities forming the subject matter of this document. The projections and forecasts described in this report were based upon a number of estimates and assumptions and are inherently subject to significant uncertainties and contingencies. Projections and forecasts are necessarily speculative in nature, and it can be expected that one or more of the estimates on which the projections and forecasts were based will not materialize or will vary significantly from actual results, and such variances will likely increase over time. All projections and forecasts described in this report have been prepared solely by the authors of this report independently of the Company. These projections and forecasts were not prepared with a view toward compliance with published guidelines or generally accepted accounting principles. No independent accountants have expressed an opinion or any other form of assurance on these projections or forecasts. You should not regard the inclusion of the projections and forecasts described herein as a representation or warranty by VSL, its associates, the authors of this report or any other person that these projections or forecasts or their underlying assumptions will be achieved. For these reasons, you should only consider the projections and forecasts described in this report after carefully evaluating all of the information in this report, including the assumptions underlying such projections and forecasts. The price and value of the investments referred to in this document/material and the income from them may go down as well as up, and investors may realize losses on any investments. Past performance is not a guide for future performance. Future returns are not guaranteed and a loss of original capital may occur. Actual results may differ materially from those set forth in projections. Forward-looking statements are not predictions and may be subject to change without notice. We do not provide tax advice to our clients, and all investors are strongly advised to consult regarding any potential investment. VSL, the RA involved in the preparation of this research report and its associates accept no liabilities for any loss or damage of any kind arising out of the use of this report. This report/document has been prepared by VSL, based upon information available to the public and sources, believed to be reliable. No representation or warranty, express or implied is made that it is accurate or complete. VSL has reviewed the report and, in so far as it includes current or historical information, it is believed to be reliable, although its accuracy and completeness cannot be guaranteed. The opinions expressed in this document/material are subject to change without notice and have no obligation to tell you when opinions or information in this report change. This report or recommendations or information contained herein do/does not constitute or purport to constitute investment advice in publicly accessible media and should not be reproduced, transmitted or published by the recipient. The report is for the use and consumption of the recipient only. This publication may not be distributed to the public used by the public media without the express written consent of VSL. This report or any portion hereof may not be printed, sold or distributed without the written consent of VSL. This document does not constitute an offer or invitation to subscribe for or purchase or deal in any securities and neither this document nor anything contained herein shall form the basis of any contract or commitment whatsoever. This document is strictly confidential and is being furnished to you solely for your information, may not be distributed to the press or other media and may not be reproduced or redistributed to any other person. The opinions and projections expressed herein are entirely those of the author and are given as part of the normal research activity of VSL and are given as of this date and are subject to change without notice. Any opinion estimate or projection herein constitutes a view as of the date of this report and there can be no assurance that future results or events will be consistent with any such opinions, estimate or projection. This document has not been prepared by or in conjunction with or on behalf of or at the instigation of, or by arrangement with the company or any of its directors or any other person. Information in this document must not be relied upon as having been authorized or approved by the company or its directors or any other person. Any opinions and projections contained herein are entirely those of the authors. None of the company or its directors or any other person accepts any liability whatsoever for any loss arising from any use of this document or its contents or otherwise arising in connection therewith. The information contained herein is not intended for publication or distribution or circulation in any manner whatsoever and any unauthorized reading, dissemination, distribution or copying of this communication is prohibited unless otherwise expressly authorized. Please ensure that you have read “Risk Disclosure Document for Capital Market and Derivatives Segments” as prescribed by Securities and Exchange Board of India before investing in Securities Market. Ventura Securities Limited Corporate Office: 8th Floor, ‘B’ Wing, I Think Techno Campus, Pokhran Road no. 02, Off Eastern Express Highway, Thane (West) 400 607.