butler–volmer–monod model for describing bio-anode polarization curves
TRANSCRIPT
Bioresource Technology 102 (2011) 381–387
Contents lists available at ScienceDirect
Bioresource Technology
journal homepage: www.elsevier .com/locate /bior tech
Butler–Volmer–Monod model for describing bio-anode polarization curves
Hubertus V.M. Hamelers a,*, Annemiek ter Heijne a,b, Nienke Stein a,b, René A. Rozendal c,Cees J.N. Buisman a,b
a Sub-Department of Environmental Technology, Wageningen University, Bomenweg 2, P.O. Box 8129, 6700 EV Wageningen, The Netherlandsb Wetsus, Centre of Excellence for Sustainable Water Technology, Agora 1, P.O. Box 1113, 8900 CC Leeuwarden, The Netherlandsc Advanced Water Management Centre, The University of Queensland, St. Lucia, QLD 4072, Australia
a r t i c l e i n f o
Article history:Received 31 March 2010Received in revised form 22 June 2010Accepted 25 June 2010Available online 23 July 2010
Keywords:Bioelectrochemical systemMicrobial Fuel CellAnodeButler–VolmerMonod
0960-8524/$ - see front matter � 2010 Elsevier Ltd. Adoi:10.1016/j.biortech.2010.06.156
* Corresponding author. Tel.: +31 317 483447.E-mail address: [email protected] (H.V.M. Ha
a b s t r a c t
A kinetic model of the bio-anode was developed based on a simple representation of the underlying bio-chemical conversions as described by enzyme kinetics, and electron transfer reactions as described by theButler–Volmer electron transfer kinetics. This Butler–Volmer–Monod model was well able to describe themeasured bio-anode polarization curves. The Butler–Volmer–Monod model was compared to theNernst–Monod model described the experimental data significantly better. The Butler–Volmer–Monodmodel has the Nernst–Monod model as its full electrochemically reversible limit. Contrary to theNernst–Monod model, the Butler–Volmer–Monod model predicts zero current at equilibrium potential.Besides, the Butler–Volmer–Monod model predicts that the apparent Monod constant is dependent onanode potential, which was supported by experimental results.
� 2010 Elsevier Ltd. All rights reserved.
1. Introduction
Bioelectrochemical systems (BESs), such as Microbial Fuel Cells(MFCs) (Logan et al., 2006; Rabaey and Verstraete, 2005) andMicrobial Electrolysis Cells (MECs) (Logan et al., 2008) use electro-chemically active microorganisms on a bio-anode for the conver-sion of chemical energy of organic materials directly intoelectrical energy. BESs are constructed by electrically coupling abio-anode with a suitable cathode in an electrochemical cell.
The working principle of bio-anodes is based on the catalytic ac-tion of electrochemically active microorganisms that grow on theanode surface. The anode itself is chemically inert and serves asa current collector and support for the electrochemically activemicroorganisms. The electrochemically active microorganismsconvert organic material to carbon dioxide, protons, and electronsand subsequently transfer the produced electrons to the anode sur-face. The conversion of the organic material into carbon dioxide,protons and electrons occurs inside the microorganism and theconversion rate is determined by enzyme kinetics. The transfer ofelectrons from the microorganism to the electrode however, occursat the interface between the microorganisms and the electrodesurface, and is described by electron transfer kinetics, like the But-ler–Volmer relationship.
ll rights reserved.
melers).
In theory, the Gibbs free energy that is released in the oxidationof organic material can be fully converted into electrical energy ofelectrons. The efficiency of this conversion however, is typicallylower than 100% due to losses at the bio-anode. To quantify theseanode losses it is common practice to record the anode polarizationcurve (Logan et al., 2006; Ter Heijne et al., 2008; Aelterman et al.,2008; Manohar et al., 2008). Anode polarization curves show cur-rent density as a function of the anode potential or vice versaand, therefore, give a direct measurement of the energy losses atthe anode at a certain current density.
Only few papers have been dealing with the kinetics of the bio-anode (Picioreanu et al., 2007, 2008; Marcus et al., 2007; Torreset al., 2008). There is only a single model, the Nernst-Monod model(Marcus et al., 2007; Torres et al., 2008; Finkelstein et al., 2006),that specifically aims at modeling the bio-anode performance withrespect to the effect of substrate and anode potential. The Nernst-Monod model is a modified version of the Monod model by consid-ering the electrode as the final electron acceptor.
In this study, we will further explore the kinetics by developinga kinetic model based on a simple representation of the underlyingbiochemical conversions as described by enzyme kinetics, andelectron transfer reactions as described by the Butler–Volmer elec-tron transfer kinetics. We will therefore refer to our model as theButler–Volmer–Monod model. This simple representation makesit possible to derive an analytical solution of the Butler–Volmer–Monod model. Such an analytical solution is attractive as it makesdescription and analysis of polarization curves easier. We applied
382 H.V.M. Hamelers et al. / Bioresource Technology 102 (2011) 381–387
the Butler–Volmer–Monod model to a set of polarization curvesobtained under different growth conditions and anode materials.The similarities and differences between the Butler–Volmer–Monod model and the Nernst–Monod model are investigated anddiscussed.
2. Model description
At the bio-anode, electrochemically active bacteria are capableof oxidizing organic matter and transferring the electrons to theanode. It is generally accepted that the first step is the biochemicaloxidation of the electron donor to CO2, protons and electrons,transferred to a certain redox component, for example NAD+. Thesecond step, the transfer of electrons from NADH type redox com-ponents to the anode is still an active area of research. Three dis-tinct mechanisms for transfer from the redox component to theanode have been proposed (Torres et al., 2010): direct contact, sol-uble mediators, and a conductive matrix. In all mechanisms, heter-ogeneous electron transfer is involved, which is brought about by aredox component that is oxidized at the anode and transfers itselectron(s). In the direct mechanism, this redox component residesat the outer cell surface, in the mediator mechanism this redoxcomponent is a small soluble molecule that shuttles between thecell and the anode. The nature of the conductivity of a conductivesolid matrix has not yet been revealed, it is however hypothesizedthat bound cytochromes, i.e. redox components, play a role. Thesemechanisms and their kinetic implications have been recently re-viewed (Torres et al., 2010).
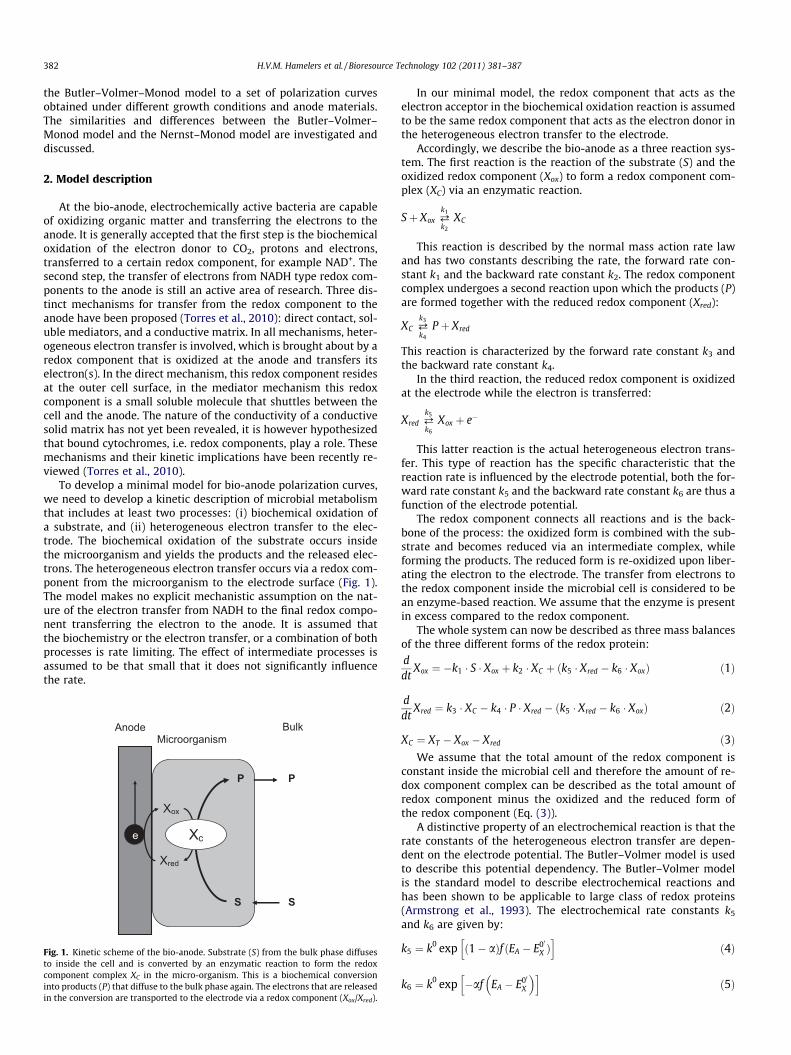
To develop a minimal model for bio-anode polarization curves,we need to develop a kinetic description of microbial metabolismthat includes at least two processes: (i) biochemical oxidation ofa substrate, and (ii) heterogeneous electron transfer to the elec-trode. The biochemical oxidation of the substrate occurs insidethe microorganism and yields the products and the released elec-trons. The heterogeneous electron transfer occurs via a redox com-ponent from the microorganism to the electrode surface (Fig. 1).The model makes no explicit mechanistic assumption on the nat-ure of the electron transfer from NADH to the final redox compo-nent transferring the electron to the anode. It is assumed thatthe biochemistry or the electron transfer, or a combination of bothprocesses is rate limiting. The effect of intermediate processes isassumed to be that small that it does not significantly influencethe rate.
Bulk
e
Xox
Xred
P
Anode Microorganism
S
P
S
Xc
Fig. 1. Kinetic scheme of the bio-anode. Substrate (S) from the bulk phase diffusesto inside the cell and is converted by an enzymatic reaction to form the redoxcomponent complex XC in the micro-organism. This is a biochemical conversioninto products (P) that diffuse to the bulk phase again. The electrons that are releasedin the conversion are transported to the electrode via a redox component (Xox/Xred).
In our minimal model, the redox component that acts as theelectron acceptor in the biochemical oxidation reaction is assumedto be the same redox component that acts as the electron donor inthe heterogeneous electron transfer to the electrode.
Accordingly, we describe the bio-anode as a three reaction sys-tem. The first reaction is the reaction of the substrate (S) and theoxidized redox component (Xox) to form a redox component com-plex (XC) via an enzymatic reaction.
Sþ Xox ¢k1
k2
XC
This reaction is described by the normal mass action rate lawand has two constants describing the rate, the forward rate con-stant k1 and the backward rate constant k2. The redox componentcomplex undergoes a second reaction upon which the products (P)are formed together with the reduced redox component (Xred):
XC ¢k3
k4
P þ Xred
This reaction is characterized by the forward rate constant k3 andthe backward rate constant k4.
In the third reaction, the reduced redox component is oxidizedat the electrode while the electron is transferred:
Xred ¢k5
k6
Xox þ e�
This latter reaction is the actual heterogeneous electron trans-fer. This type of reaction has the specific characteristic that thereaction rate is influenced by the electrode potential, both the for-ward rate constant k5 and the backward rate constant k6 are thus afunction of the electrode potential.
The redox component connects all reactions and is the back-bone of the process: the oxidized form is combined with the sub-strate and becomes reduced via an intermediate complex, whileforming the products. The reduced form is re-oxidized upon liber-ating the electron to the electrode. The transfer from electrons tothe redox component inside the microbial cell is considered to bean enzyme-based reaction. We assume that the enzyme is presentin excess compared to the redox component.
The whole system can now be described as three mass balancesof the three different forms of the redox protein:
ddt
Xox ¼ �k1 � S � Xox þ k2 � XC þ ðk5 � Xred � k6 � XoxÞ ð1Þ
ddt
Xred ¼ k3 � XC � k4 � P � Xred � ðk5 � Xred � k6 � XoxÞ ð2Þ
XC ¼ XT � Xox � Xred ð3ÞWe assume that the total amount of the redox component is
constant inside the microbial cell and therefore the amount of re-dox component complex can be described as the total amount ofredox component minus the oxidized and the reduced form ofthe redox component (Eq. (3)).
A distinctive property of an electrochemical reaction is that therate constants of the heterogeneous electron transfer are depen-dent on the electrode potential. The Butler–Volmer model is usedto describe this potential dependency. The Butler–Volmer modelis the standard model to describe electrochemical reactions andhas been shown to be applicable to large class of redox proteins(Armstrong et al., 1993). The electrochemical rate constants k5
and k6 are given by:
k5 ¼ k0 exp ð1� aÞf ðEA � E00
X Þh i
ð4Þ
k6 ¼ k0 exp �af EA � E00
X
� �h ið5Þ

H.V.M. Hamelers et al. / Bioresource Technology 102 (2011) 381–387 383
In which, k0, standard heterogeneous rate constant (cm/s); a, trans-fer coefficient (–); f ; F
RT (1/V); EA, anode potential (V); E00
X , formal po-tential of redox component (V).
The transfer coefficient has a value between 0 and 1, and is typ-ically around 0.5 (Bard and Faulkner, 2001).
The primary output is the measured current density (I) at theanode. This observed current is the net result of two opposite reac-tions occurring simultaneously at the anode surface: the oxidationof Xred giving rise to a forward anodic current densityIf ¼ n � F � k5 � Xred, and the reduction of Xox giving rise to a back-ward cathodic current density Ib ¼ n � F � k6 � Xox. The observed cur-rent density at the anode is thus given by the difference betweenthe forward and backward current:
I ¼ n � Fðk5 � Xred � k6 � XoxÞ ð6Þ
where, n, moles of electrons involved in the reaction; F, Faradayconstant (C/mol).
By substituting Eqs. (4) and (5) in (6), we find the more familiarButler–Volmer rate equation (Bard and Faulkner, 2001) for hetero-geneous electron transfer:
I ¼ n � F
� k0 Xred � exp 1� að Þf EA � E00
X
� �h i� Xox � exp �af EA � E00
X
� �h i� �ð7Þ
As the amount of any redox component X is expressed as its cov-erage (mol/m2), the current is expressed as current density. The sub-strate and products are expressed as concentrations (mol/m3).
A comparable kinetic description has been used in the field ofvoltammetry of electroactive enzymes, see for an overview Heer-ing et al. (1998). Although conventionally, k4 is assumed zero, herewe include k4 to assure that also the thermodynamic equilibriumcan be modeled.
Substituting Eq. (3) in Eqs. (1) and (2) gives two differentialequations for Xox and Xred. When there is a steady-state situation,the derivative terms are zero and S, P and the potential remain con-stant. For such a linear system a steady-state solution for Xox andXred can be straightforwardly found using matrix inversion. Wefound the solution using MathCad routines. Substituting this solu-tion for Xox and Xred in the output equation for the current density(Eq. (6)) yields a solution for the current density.
To make the model solution interpretable, we have rewrittenthe model using more standard parameter representation (Cleland,1963). Therefore, the following parameters have been introduced:
2.1. Substrate affinity constant
KM ¼k2 þ k3
k1ð8Þ
The substrate affinity constant or the so-called Michaelis–Men-ten constant describes the effect of substrate on the biochemicalconversion. This constant is empirically determined as the concen-tration at which half of the turnover is achieved.
2.2. Product inhibition constant
KP ¼k2 þ k3
k4ð9Þ
The product inhibition constant describes the extent to whicha certain product concentration leads to an inhibition of the turn-over rate. Although the inhibition constant looks similar to thesubstrate affinity constant, it can in most cases not be interpretedsimilarly as the concentration at which half of the turnover rate isachieved.
2.3. Limiting current density
Imax ¼ n � F � XT � k3 ð10Þ
The parameter Imax describes the maximum current density thatcan be obtained and can also be called limiting current density.This limiting current density is determined by the enzymatic reac-tion, because the rate of the electrochemical reaction can be in-creased at will by increasing the anode potential.
2.4. Exchange current density
The exchange current density is a measure of the maximumanodic current density that can be achieved at equilibrium condi-tion, i.e. at zero current. At equilibrium, the resulting current den-sity is zero, because the anodic current is compensated by anequally sized cathodic current. The exchange current density is ameasure for the reversibility of the reaction, and thus how fastthe electrochemical reaction of the redox component runs. It canbe described by:
Iex ¼ n � F � XT � k0 � exp � 1� að Þ � f � E00
X � ES=P
� �h ið11Þ
where ES/P, thermodynamical anode potential (V), which is the the-oretical anode potential as calculated using the Nernst equation asdescribed in (Hamelers et al., 2010).
Combining Eq. (1)–(11) yields the Butler–Volmer–Monod mod-el, being a steady-state solution for the current density as a func-tion of overpotential:
I ¼ Imax1� e�f �g
K1 � e�ð1�aÞf �g þ K2e�f �g þ KMS þ 1� � ð12Þ
This equation contains the overpotential g, defined as EA � ES/P,
and two lumped parameters: K1 and K2. These new parameters aredefined as:
K1 ¼Imax
Iex1þ P � k4
k3þ exp �f � E00
X � ES=P
� �� �� �ð13Þ
K2 ¼k3
k21þ KP
P
� �ð14Þ
It is important to note at this point that at steady-state, S and Pare constant, and thus so is the equilibrium potential. This meansthat during recording of a polarization curve the values of K1 andK2 remain constant, and that no individual kinetic constant canbe determined from a polarization curve. The interpretation ofthe parameters K1 and K2 will be discussed in Section 4.2.
3. Methods
3.1. Experimental
3.1.1. Polarization curvesPolarization curves used for parameter fitting were obtained in
previous study (Ter Heijne et al., 2008). The setup consisted of fourMFCs which were hydraulically connected in series and which con-tained four different anode materials: flat graphite, roughenedgraphite, Pt-coated titanium, and uncoated titanium. The data ofthe uncoated titanium anode were left out because of its bad per-formance. The anode was continuously fed with 20 mM KCH3COOand 20 mM phosphate buffer at pH 7, and the catholyte was a50 mM Fe(III)[CN]6 solution. pH was controlled at pH 7. The acetateconcentration was high enough to avoid mass transfer limitations(Ter Heijne et al., 2008). Because of the pH control, buffer concen-tration, continuous feeding, and the large volume to area ratio of
384 H.V.M. Hamelers et al. / Bioresource Technology 102 (2011) 381–387
the reactors, the concentrations of substrates and products can beconsidered to be in steady-state and constant during the recordingof the polarization curve.
For each type of electrode material, the cells were subsequentlyoperated with different external loads. The effect of a load is thatthe cell operates at a certain anode potential. Each cell operated5–8 days at a specific load. The average anode potential duringthe day proceeding the recording of a polarization curve wasreported.
Bio-anode polarization curves were obtained by dc-voltamme-try, using chronoamperometry with a potentiostat (Ivium Technol-ogies, Eindhoven, The Netherlands). The cell voltage was decreasedstepwise and was kept at each voltage during 120 s in order to letthe current stabilize. The measured range was a cell voltage of0.65 V down to 0.30 V, decreased in steps of 0.050 V, until a stablecurrent was reached. When a maximum in the current density wasfound, the measurement was terminated to prevent damage to themicroorganisms. Anode potential was measured and collectedevery 30 s during these measurements on a PC via a FieldpointFP-AI-110 module (National Instruments, Austin, Texas). The lastdata point was selected for data presentation. During the last30 s of these measurements, the current changed with less than0.5% for all three materials (Ter Heijne et al., 2008), so a steady-state situation can be assumed.
3.1.2. Effect of acetate concentrationIn addition, we studied the effect of acetate concentration and
anode potential on current density. This was studied in the samecell containing a rough graphite anode. Potassium acetate, buffer(25 mM) and nutrients were fed continuously at such rate thatHRT was 5 h. Acetate was fed at six different concentrations: from20 mM down to 10, 5, 2, 1, and 0.5 mM. Each substrate concentra-tion was tested for 2 days to obtain a steady-state situation. Anodepotential was first controlled at �0.4 V vs. Ag/AgCl, using a poten-tiostat (Ivium Technologies, Eindhoven, The Netherlands). After allacetate concentrations were tested, anode potential was controlledat �0.3 V vs. Ag/AgCl and the same procedure was repeated. Foreach acetate concentration, after 15 h, generally a stable currentdensity was found, deviating <5%. Average current density wasdetermined after 15 h of operation till the end of the experiment.Acetate concentrations were determined using a Gas Chromato-graph (GC). The GC (HP 5890 series II, Agilent Technologies,Amstelveen, The Netherlands) was equipped with an AT-Aqua-wax-DA column (Alltech) and a flame ionization detector (FID).Temperature was raised from 80 to 210 �C, with 25 �C/min. Nitro-gen was used as carrier gas.
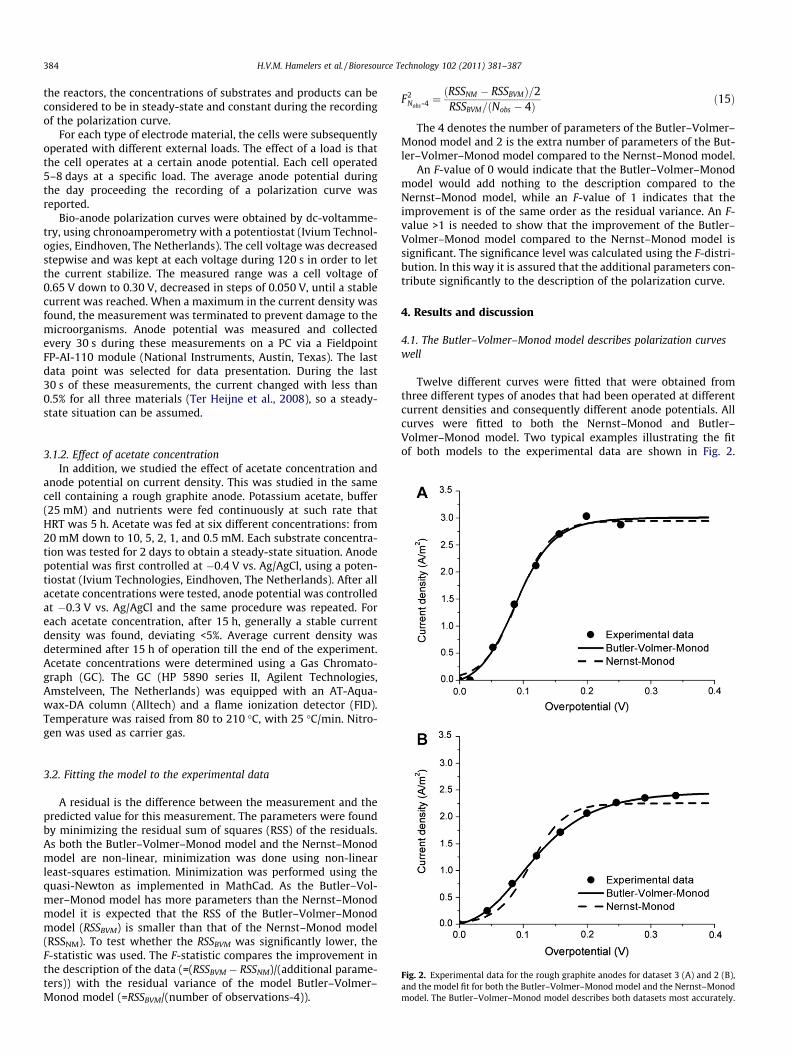
Fig. 2. Experimental data for the rough graphite anodes for dataset 3 (A) and 2 (B),and the model fit for both the Butler–Volmer–Monod model and the Nernst–Monodmodel. The Butler–Volmer–Monod model describes both datasets most accurately.
3.2. Fitting the model to the experimental data
A residual is the difference between the measurement and thepredicted value for this measurement. The parameters were foundby minimizing the residual sum of squares (RSS) of the residuals.As both the Butler–Volmer–Monod model and the Nernst–Monodmodel are non-linear, minimization was done using non-linearleast-squares estimation. Minimization was performed using thequasi-Newton as implemented in MathCad. As the Butler–Vol-mer–Monod model has more parameters than the Nernst–Monodmodel it is expected that the RSS of the Butler–Volmer–Monodmodel (RSSBVM) is smaller than that of the Nernst–Monod model(RSSNM). To test whether the RSSBVM was significantly lower, theF-statistic was used. The F-statistic compares the improvement inthe description of the data (=(RSSBVM � RSSNM)/(additional parame-ters)) with the residual variance of the model Butler–Volmer–Monod model (=RSSBVM/(number of observations-4)).
F2Nobs-4 ¼
ðRSSNM � RSSBVMÞ=2RSSBVM=ðNobs � 4Þ ð15Þ
The 4 denotes the number of parameters of the Butler–Volmer–Monod model and 2 is the extra number of parameters of the But-ler–Volmer–Monod model compared to the Nernst–Monod model.
An F-value of 0 would indicate that the Butler–Volmer–Monodmodel would add nothing to the description compared to theNernst–Monod model, while an F-value of 1 indicates that theimprovement is of the same order as the residual variance. An F-value >1 is needed to show that the improvement of the Butler–Volmer–Monod model compared to the Nernst–Monod model issignificant. The significance level was calculated using the F-distri-bution. In this way it is assured that the additional parameters con-tribute significantly to the description of the polarization curve.
4. Results and discussion
4.1. The Butler–Volmer–Monod model describes polarization curveswell
Twelve different curves were fitted that were obtained fromthree different types of anodes that had been operated at differentcurrent densities and consequently different anode potentials. Allcurves were fitted to both the Nernst–Monod and Butler–Volmer–Monod model. Two typical examples illustrating the fitof both models to the experimental data are shown in Fig. 2.
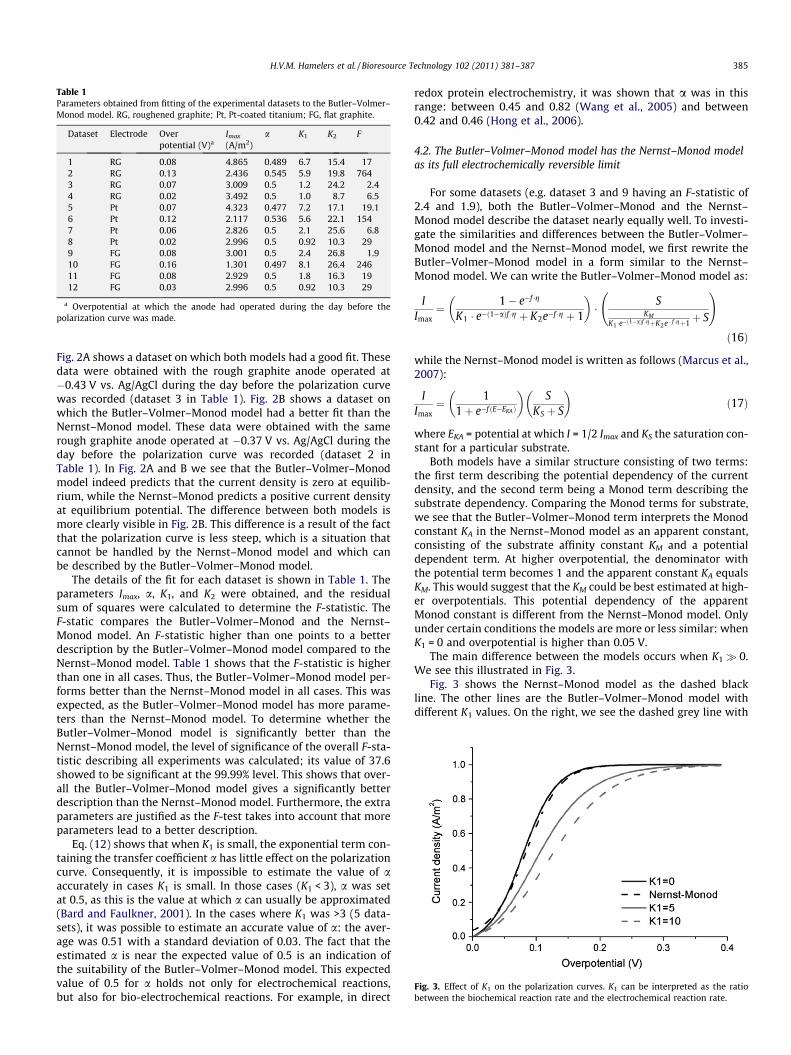
Table 1Parameters obtained from fitting of the experimental datasets to the Butler–Volmer–Monod model. RG, roughened graphite; Pt, Pt-coated titanium; FG, flat graphite.
Dataset Electrode Overpotential (V)a
Imax
(A/m2)a K1 K2 F
1 RG 0.08 4.865 0.489 6.7 15.4 172 RG 0.13 2.436 0.545 5.9 19.8 7643 RG 0.07 3.009 0.5 1.2 24.2 2.44 RG 0.02 3.492 0.5 1.0 8.7 6.55 Pt 0.07 4.323 0.477 7.2 17.1 19.16 Pt 0.12 2.117 0.536 5.6 22.1 1547 Pt 0.06 2.826 0.5 2.1 25.6 6.88 Pt 0.02 2.996 0.5 0.92 10.3 299 FG 0.08 3.001 0.5 2.4 26.8 1.910 FG 0.16 1.301 0.497 8.1 26.4 24611 FG 0.08 2.929 0.5 1.8 16.3 1912 FG 0.03 2.996 0.5 0.92 10.3 29
a Overpotential at which the anode had operated during the day before thepolarization curve was made.
Fig. 3. Effect of K1 on the polarization curves. K1 can be interpreted as the ratiobetween the biochemical reaction rate and the electrochemical reaction rate.
H.V.M. Hamelers et al. / Bioresource Technology 102 (2011) 381–387 385
Fig. 2A shows a dataset on which both models had a good fit. Thesedata were obtained with the rough graphite anode operated at�0.43 V vs. Ag/AgCl during the day before the polarization curvewas recorded (dataset 3 in Table 1). Fig. 2B shows a dataset onwhich the Butler–Volmer–Monod model had a better fit than theNernst–Monod model. These data were obtained with the samerough graphite anode operated at �0.37 V vs. Ag/AgCl during theday before the polarization curve was recorded (dataset 2 inTable 1). In Fig. 2A and B we see that the Butler–Volmer–Monodmodel indeed predicts that the current density is zero at equilib-rium, while the Nernst–Monod predicts a positive current densityat equilibrium potential. The difference between both models ismore clearly visible in Fig. 2B. This difference is a result of the factthat the polarization curve is less steep, which is a situation thatcannot be handled by the Nernst–Monod model and which canbe described by the Butler–Volmer–Monod model.
The details of the fit for each dataset is shown in Table 1. Theparameters Imax, a, K1, and K2 were obtained, and the residualsum of squares were calculated to determine the F-statistic. TheF-static compares the Butler–Volmer–Monod and the Nernst–Monod model. An F-statistic higher than one points to a betterdescription by the Butler–Volmer–Monod model compared to theNernst–Monod model. Table 1 shows that the F-statistic is higherthan one in all cases. Thus, the Butler–Volmer–Monod model per-forms better than the Nernst–Monod model in all cases. This wasexpected, as the Butler–Volmer–Monod model has more parame-ters than the Nernst–Monod model. To determine whether theButler–Volmer–Monod model is significantly better than theNernst–Monod model, the level of significance of the overall F-sta-tistic describing all experiments was calculated; its value of 37.6showed to be significant at the 99.99% level. This shows that over-all the Butler–Volmer–Monod model gives a significantly betterdescription than the Nernst–Monod model. Furthermore, the extraparameters are justified as the F-test takes into account that moreparameters lead to a better description.
Eq. (12) shows that when K1 is small, the exponential term con-taining the transfer coefficient a has little effect on the polarizationcurve. Consequently, it is impossible to estimate the value of aaccurately in cases K1 is small. In those cases (K1 < 3), a was setat 0.5, as this is the value at which a can usually be approximated(Bard and Faulkner, 2001). In the cases where K1 was >3 (5 data-sets), it was possible to estimate an accurate value of a: the aver-age was 0.51 with a standard deviation of 0.03. The fact that theestimated a is near the expected value of 0.5 is an indication ofthe suitability of the Butler–Volmer–Monod model. This expectedvalue of 0.5 for a holds not only for electrochemical reactions,but also for bio-electrochemical reactions. For example, in direct
redox protein electrochemistry, it was shown that a was in thisrange: between 0.45 and 0.82 (Wang et al., 2005) and between0.42 and 0.46 (Hong et al., 2006).
4.2. The Butler–Volmer–Monod model has the Nernst–Monod modelas its full electrochemically reversible limit
For some datasets (e.g. dataset 3 and 9 having an F-statistic of2.4 and 1.9), both the Butler–Volmer–Monod and the Nernst–Monod model describe the dataset nearly equally well. To investi-gate the similarities and differences between the Butler–Volmer–Monod model and the Nernst–Monod model, we first rewrite theButler–Volmer–Monod model in a form similar to the Nernst–Monod model. We can write the Butler–Volmer–Monod model as:
IImax¼ 1� e�f �g
K1 � e�ð1�aÞf �g þ K2e�f �g þ 1
� �� S
KMK1 �e�ð1�aÞf �gþK2e�f �gþ1þ S
!
ð16Þ
while the Nernst–Monod model is written as follows (Marcus et al.,2007):
IImax¼ 1
1þ e�f ðE�EKAÞ
� �S
KS þ S
� �ð17Þ
where EKA = potential at which I = 1/2 Imax and KS the saturation con-stant for a particular substrate.
Both models have a similar structure consisting of two terms:the first term describing the potential dependency of the currentdensity, and the second term being a Monod term describing thesubstrate dependency. Comparing the Monod terms for substrate,we see that the Butler–Volmer–Monod term interprets the Monodconstant KA in the Nernst–Monod model as an apparent constant,consisting of the substrate affinity constant KM and a potentialdependent term. At higher overpotential, the denominator withthe potential term becomes 1 and the apparent constant KA equalsKM. This would suggest that the KM could be best estimated at high-er overpotentials. This potential dependency of the apparentMonod constant is different from the Nernst–Monod model. Onlyunder certain conditions the models are more or less similar: whenK1 = 0 and overpotential is higher than 0.05 V.
The main difference between the models occurs when K1� 0.We see this illustrated in Fig. 3.
Fig. 3 shows the Nernst–Monod model as the dashed blackline. The other lines are the Butler–Volmer–Monod model withdifferent K1 values. On the right, we see the dashed grey line with
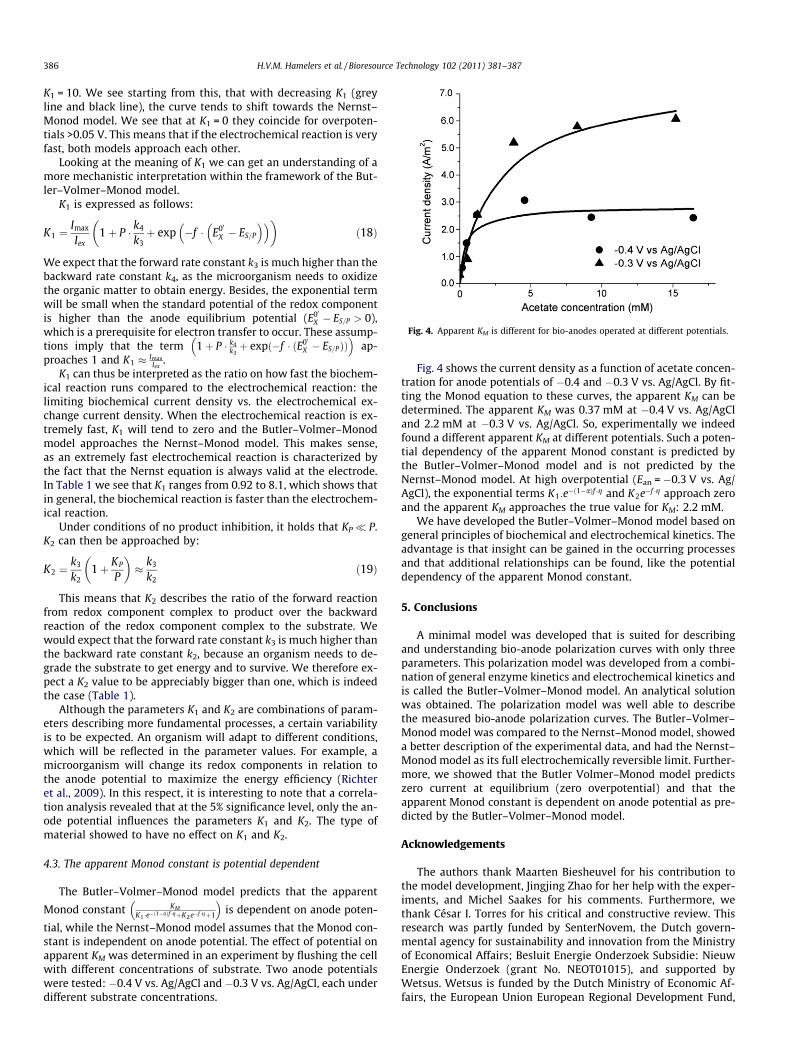
Fig. 4. Apparent KM is different for bio-anodes operated at different potentials.
386 H.V.M. Hamelers et al. / Bioresource Technology 102 (2011) 381–387
K1 = 10. We see starting from this, that with decreasing K1 (greyline and black line), the curve tends to shift towards the Nernst–Monod model. We see that at K1 = 0 they coincide for overpoten-tials >0.05 V. This means that if the electrochemical reaction is veryfast, both models approach each other.
Looking at the meaning of K1 we can get an understanding of amore mechanistic interpretation within the framework of the But-ler–Volmer–Monod model.
K1 is expressed as follows:
K1 ¼Imax
Iex1þ P � k4
k3þ exp �f � E00
X � ES=P
� �� �� �ð18Þ
We expect that the forward rate constant k3 is much higher than thebackward rate constant k4, as the microorganism needs to oxidizethe organic matter to obtain energy. Besides, the exponential termwill be small when the standard potential of the redox componentis higher than the anode equilibrium potential (E00
X � ES=P > 0),which is a prerequisite for electron transfer to occur. These assump-tions imply that the term 1þ P � k4
k3þ expð�f � ðE00
X � ES=PÞÞ� �
ap-proaches 1 and K1 � Imax
Iex.
K1 can thus be interpreted as the ratio on how fast the biochem-ical reaction runs compared to the electrochemical reaction: thelimiting biochemical current density vs. the electrochemical ex-change current density. When the electrochemical reaction is ex-tremely fast, K1 will tend to zero and the Butler–Volmer–Monodmodel approaches the Nernst–Monod model. This makes sense,as an extremely fast electrochemical reaction is characterized bythe fact that the Nernst equation is always valid at the electrode.In Table 1 we see that K1 ranges from 0.92 to 8.1, which shows thatin general, the biochemical reaction is faster than the electrochem-ical reaction.
Under conditions of no product inhibition, it holds that KP� P.K2 can then be approached by:
K2 ¼k3
k21þ KP
P
� �� k3
k2ð19Þ
This means that K2 describes the ratio of the forward reactionfrom redox component complex to product over the backwardreaction of the redox component complex to the substrate. Wewould expect that the forward rate constant k3 is much higher thanthe backward rate constant k2, because an organism needs to de-grade the substrate to get energy and to survive. We therefore ex-pect a K2 value to be appreciably bigger than one, which is indeedthe case (Table 1).
Although the parameters K1 and K2 are combinations of param-eters describing more fundamental processes, a certain variabilityis to be expected. An organism will adapt to different conditions,which will be reflected in the parameter values. For example, amicroorganism will change its redox components in relation tothe anode potential to maximize the energy efficiency (Richteret al., 2009). In this respect, it is interesting to note that a correla-tion analysis revealed that at the 5% significance level, only the an-ode potential influences the parameters K1 and K2. The type ofmaterial showed to have no effect on K1 and K2.
4.3. The apparent Monod constant is potential dependent
The Butler–Volmer–Monod model predicts that the apparent
Monod constant KMK1 �e�ð1�aÞf �gþK2e�f �gþ1
� �is dependent on anode poten-
tial, while the Nernst–Monod model assumes that the Monod con-stant is independent on anode potential. The effect of potential onapparent KM was determined in an experiment by flushing the cellwith different concentrations of substrate. Two anode potentialswere tested: �0.4 V vs. Ag/AgCl and �0.3 V vs. Ag/AgCl, each underdifferent substrate concentrations.
Fig. 4 shows the current density as a function of acetate concen-tration for anode potentials of �0.4 and �0.3 V vs. Ag/AgCl. By fit-ting the Monod equation to these curves, the apparent KM can bedetermined. The apparent KM was 0.37 mM at �0.4 V vs. Ag/AgCland 2.2 mM at �0.3 V vs. Ag/AgCl. So, experimentally we indeedfound a different apparent KM at different potentials. Such a poten-tial dependency of the apparent Monod constant is predicted bythe Butler–Volmer–Monod model and is not predicted by theNernst–Monod model. At high overpotential (Ean = �0.3 V vs. Ag/AgCl), the exponential terms K1:e�ð1�aÞf �g and K2e�f �g approach zeroand the apparent KM approaches the true value for KM: 2.2 mM.
We have developed the Butler–Volmer–Monod model based ongeneral principles of biochemical and electrochemical kinetics. Theadvantage is that insight can be gained in the occurring processesand that additional relationships can be found, like the potentialdependency of the apparent Monod constant.
5. Conclusions
A minimal model was developed that is suited for describingand understanding bio-anode polarization curves with only threeparameters. This polarization model was developed from a combi-nation of general enzyme kinetics and electrochemical kinetics andis called the Butler–Volmer–Monod model. An analytical solutionwas obtained. The polarization model was well able to describethe measured bio-anode polarization curves. The Butler–Volmer–Monod model was compared to the Nernst–Monod model, showeda better description of the experimental data, and had the Nernst–Monod model as its full electrochemically reversible limit. Further-more, we showed that the Butler Volmer–Monod model predictszero current at equilibrium (zero overpotential) and that theapparent Monod constant is dependent on anode potential as pre-dicted by the Butler–Volmer–Monod model.
Acknowledgements
The authors thank Maarten Biesheuvel for his contribution tothe model development, Jingjing Zhao for her help with the exper-iments, and Michel Saakes for his comments. Furthermore, wethank César I. Torres for his critical and constructive review. Thisresearch was partly funded by SenterNovem, the Dutch govern-mental agency for sustainability and innovation from the Ministryof Economical Affairs; Besluit Energie Onderzoek Subsidie: NieuwEnergie Onderzoek (grant No. NEOT01015), and supported byWetsus. Wetsus is funded by the Dutch Ministry of Economic Af-fairs, the European Union European Regional Development Fund,
H.V.M. Hamelers et al. / Bioresource Technology 102 (2011) 381–387 387
the Province of Fryslân, the city of Leeuwarden and by the EZ-KOMPAS Program of the ‘‘Samenwerkingsverband Noord-Nederland”.
References
Aelterman, P., Freguia, S., Keller, J., Verstraete, W., Rabaey, K., 2008. The anodepotential regulates bacterial activity in microbial fuel cells. Appl. Microbiol.Biotechnol. 78, 409–418.
Armstrong, F.A., Butt, J.N., Sucheta, A., 1993. Voltammetric studies of redox-activecenters in metalloproteins adsorbed on electrodes. Methods Enzymol. 227,479–500.
Bard, A.J., Faulkner, L.R., 2001. Electrochemical methods: fundamentals andapplications, second ed. John Wiley & Sons, New York.
Cleland, W.W., 1963. The kinetics of enzyme-catalyzed reactions with two or moresubstrates or products. II. Inhibition: nomenclature and theory. Biochim.Biophys. Acta 67, 173–187.
Finkelstein, D.A., Tender, L.M., Zeikus, J.G., 2006. Effect of electrode potential onelectrode-reducing microbiota. Environ. Sci. Technol. 40, 6990–6995.
Hamelers, H.V.M., Ter Heijne, A., Sleutels, T.H.J.A., Jeremiasse, A.W., Strik, D.P.B.T.B.,Buisman, C.J.N., 2010. New applications and performance of bioelectrochemicalsystems. Appl. Microbiol. Biotechnol. 85, 1673–1685.
Heering, H.A., Hirst, J., Armstrong, F.A., 1998. Interpreting the catalytic voltammetryof electroactive enzymes adsorbed on electrodes. J. Phys. Chem. B 102, 6889–6902.
Hong, J., Ghourchian, H., Moosavi-Movahedi, A.A., 2006. Direct electron transfer ofredox proteins on a nafion-cysteine modified gold electrode. Electrochem.Commun. 8, 1572–1576.
Logan, B.E., Hamelers, B., Rozendal, R., Schröder, U., Keller, J., Freguia, S., Aelterman,P., Verstraete, W., Rabaey, K., 2006. Microbial fuel cells: methodology andtechnology. Environ. Sci. Technol. 40, 5181–5192.
Logan, B.E., Call, D., Cheng, S., Hamelers, H.V.M., Sleutels, T.H.J.A., Jeremiasse, A.W.,Rozendal, R.A., 2008. Microbial electrolysis cells for high yield hydrogen gasproduction from organic matter. Environ. Sci. Technol. 42, 8630–8640.
Manohar, A.K., Bretschger, O., Nealson, K.H., Mansfeld, F., 2008. The polarizationbehavior of the anode in a microbial fuel cell. Electrochim. Acta 53, 3508–3513.
Marcus, A.K., Torres, C.I., Rittmann, B.E., 2007. Conduction-based modeling of thebiofilm anode of a microbial fuel cell. Biotechnol. Bioeng. 98, 1171–1182.
Picioreanu, C., Head, I.M., Katuri, K.P., van Loosdrecht, M.C.M., Scott, K., 2007. Acomputational model for biofilm-based microbial fuel cells. Water Res. 41,2921–2940.
Picioreanu, C., Katuri, K.P., Head, I.M., Van Loosdrecht, M.C.M., Scott, K., 2008.Mathematical model for microbial fuel cells with anodic biofilms and anaerobicdigestion. Water Sci. Technol. 57, 965–971.
Rabaey, K., Verstraete, W., 2005. Microbial fuel cells: novel biotechnology for energygeneration. Trends Biotechnol. 23, 291–298.
Richter, H., Nevin, K.P., Jia, H., Lowy, D.A., Lovley, D.R., Tender, L.M., 2009. Cyclicvoltammetry of biofilms of wild type and mutant geobacter sulfurreducens onfuel cell anodes indicates possible roles of OmcB, OmcZ, type IV pili, and protonsin extracellular electron transfer. Energy Environ. Sci. 2, 506–516.
Ter Heijne, A., Hamelers, H.V.M., Saakes, M., Buisman, C.J.N., 2008. Performance ofnon-porous graphite and titanium-based anodes in microbial fuel cells.Electrochim. Acta 53, 5697–5703.
Torres, C.I., Marcus, A.K., Parameswaran, P., Rittmann, B.E., 2008. Kineticexperiments for evaluating the Nernst-Monod model for anode-respiringbacteria (ARB) in a biofilm anode. Environ. Sci. Technol. 42, 6593–6597.
Torres, C.I., Marcus, A.K., Lee, H.S., Parameswaran, P., Krajmalnik-Brown, R.,Rittmann, B.E., 2010. A kinetic perspective on extracellular electron transferby anode-respiring bacteria. FEMS Microbiol. Rev. 34, 3–17.
Wang, S.F., Chen, T., Zhang, Z.L., Shen, X.C., Lu, Z.X., Pang, D.W., Wong, K.Y., 2005.Direct electrochemistry and electrocatalysis of heme proteins entrapped inagarose hydrogel films in room-temperature ionic liquids. Langmuir 21, 9260–9266.