buster-report on buster refinement run in directory 01...
TRANSCRIPT
buster-report LATEX/pdf output
Report on BUSTER refinement run in directory 01 refine
Contents
1 Run overview 21.1 Geometry WARNING messages . . . . . . . . . . . . . . . . . . . . . . . . . . . . . . . . . . . 2
1.1.1 At start of refinement . . . . . . . . . . . . . . . . . . . . . . . . . . . . . . . . . . . . 21.2 Run conditions . . . . . . . . . . . . . . . . . . . . . . . . . . . . . . . . . . . . . . . . . . . . 21.3 Refinement vital statistics . . . . . . . . . . . . . . . . . . . . . . . . . . . . . . . . . . . . . . 2
2 RSCC, R-factor, LLG and geometry evolution over the refine 42.1 Reciprocal space correlation coefficient plots . . . . . . . . . . . . . . . . . . . . . . . . . . . . 4
2.1.1 Initial RSCC plot . . . . . . . . . . . . . . . . . . . . . . . . . . . . . . . . . . . . . . . 42.1.2 Final RSCC plot . . . . . . . . . . . . . . . . . . . . . . . . . . . . . . . . . . . . . . . 4
2.2 R-factor behaviour during refinement . . . . . . . . . . . . . . . . . . . . . . . . . . . . . . . . 52.3 LLG behaviour during refinement . . . . . . . . . . . . . . . . . . . . . . . . . . . . . . . . . . 52.4 Geometry behaviour during optimisation . . . . . . . . . . . . . . . . . . . . . . . . . . . . . . 6
2.4.1 Graph of RMS(bond) against cycle of refinement . . . . . . . . . . . . . . . . . . . . . 62.4.2 Graph of RMS(angle) against cycle of refinement . . . . . . . . . . . . . . . . . . . . . 6
3 MolProbity analysis 73.1 Summary statistics . . . . . . . . . . . . . . . . . . . . . . . . . . . . . . . . . . . . . . . . . . 73.2 Ramachandran plot . . . . . . . . . . . . . . . . . . . . . . . . . . . . . . . . . . . . . . . . . 8
4 Ligand analysis 94.1 468 A 501 . . . . . . . . . . . . . . . . . . . . . . . . . . . . . . . . . . . . . . . . . . . . . . . 9
4.1.1 Statistics for ligand . . . . . . . . . . . . . . . . . . . . . . . . . . . . . . . . . . . . . . 94.1.2 Picture of ligand in electron density . . . . . . . . . . . . . . . . . . . . . . . . . . . . 94.1.3 Mogul analysis for 468 A 501 . . . . . . . . . . . . . . . . . . . . . . . . . . . . . . . . 10
4.2 NAD A 500 . . . . . . . . . . . . . . . . . . . . . . . . . . . . . . . . . . . . . . . . . . . . . . 154.2.1 Statistics for ligand . . . . . . . . . . . . . . . . . . . . . . . . . . . . . . . . . . . . . . 154.2.2 Picture of ligand in electron density . . . . . . . . . . . . . . . . . . . . . . . . . . . . 154.2.3 Mogul analysis for NAD A 500 . . . . . . . . . . . . . . . . . . . . . . . . . . . . . . . 16
5 X-ray statistics 225.1 Scaling parameters in last cycle . . . . . . . . . . . . . . . . . . . . . . . . . . . . . . . . . . . 225.2 Wilson plots . . . . . . . . . . . . . . . . . . . . . . . . . . . . . . . . . . . . . . . . . . . . . . 22
5.2.1 Wilson plot at start of refinement . . . . . . . . . . . . . . . . . . . . . . . . . . . . . . 225.2.2 Wilson plot at end of refinement . . . . . . . . . . . . . . . . . . . . . . . . . . . . . . 22
6 Real-space correlations 236.1 Side chains of chain A . . . . . . . . . . . . . . . . . . . . . . . . . . . . . . . . . . . . . . . . 236.2 Mainchain of chain A . . . . . . . . . . . . . . . . . . . . . . . . . . . . . . . . . . . . . . . . . 23
1
1 Run overview
1.1 Geometry WARNING messages
1.1.1 At start of refinement
N.B. initial structure has some really bad geometry restraint violationsHave |δ/σ| deviations > 5.0 σ. Number of outliers for each term:2052 bond lengths. Worst is 27.3 σ 1.61 A A|501:C17=C16 (468)
18 bond angles. Worst is 17.3 σ 99.37◦ A|501:C2=C3=N11 (468)
2 planes. Worst is 13.8 σ 0.28 A A|501:C8=C7=N11=C3 (468)
5 idealD contacts. Worst 15.7 σ 1.17 A A|864:O=O (HOH) symm: 1555=11656
See logs/screen_initial.txt for more detail
1.2 Run conditions
refine command /mnt/scratch fs1/osmart/autobuster/Server/-
autoBUSTER/bin/linux64/refine -p 2h7p hydro-
genate.pdb -m 2h7p/2h7p.mtz -l 468.grade PDB -
ligand.cif -M TLSbasic -d 01 refine -report
BUSTER version, run at, by user 2.13.0, Mon Jun 16 17:53:36 BST 2014, osmart
in directory /home/osmart/2014/06/erice workshop/-
introtutorial/buster
nthreads, hostname, OS 6, hypatia, Ubuntu precise (12.04.4 LTS)
buster-report command /home/osmart/autobuster/Server/scripts/-
buster-report -d 01 refine -dr 01 re-
fine.report -f
buster-report version, run at, by user 1.1.4 <July 25 2015>, Sat Jul 25 19:27:21
2015, osmart
buster-report run on refine directory /home/osmart/2014/06/erice workshop/-
introtutorial/buster/01 refine
buster-report output directory /home/osmart/2014/06/erice workshop/-
introtutorial/buster/01 refine.report
final pdb coordinates 01 refine.report.pdb
final mtzfile 01 refine.report.mtz
For help on “Run conditions table” see BUSTER wiki pagehttp://www.globalphasing.com/buster/wiki/index.cgi?BRrunConditions
1.3 Refinement vital statistics
start finalNcycles big 0 5Ncycles small 0 307X-ray weight 4.00 3.24Rwork 0.1822 0.1518Rfree 0.1837 0.1778100 (Rfree −Rwork) 0.2% 2.6%LLGwork (cumulative Log-Likelihood Gain, working set) 0 0.2141LLGfree (cumulative Log-Likelihood Gain, free set) 0 0.0122RMS bond in A 0.0231 0.0094RMS angle in degrees 1.66 1.04High resolution limit in A 1.86 1.86Low resolution limit in A 46.20 17.34Number of waters 368 368
2
For help on “Refinement vital statistics” see BUSTER wiki pagehttp://www.globalphasing.com/buster/wiki/index.cgi?BRTblVitalStats
3
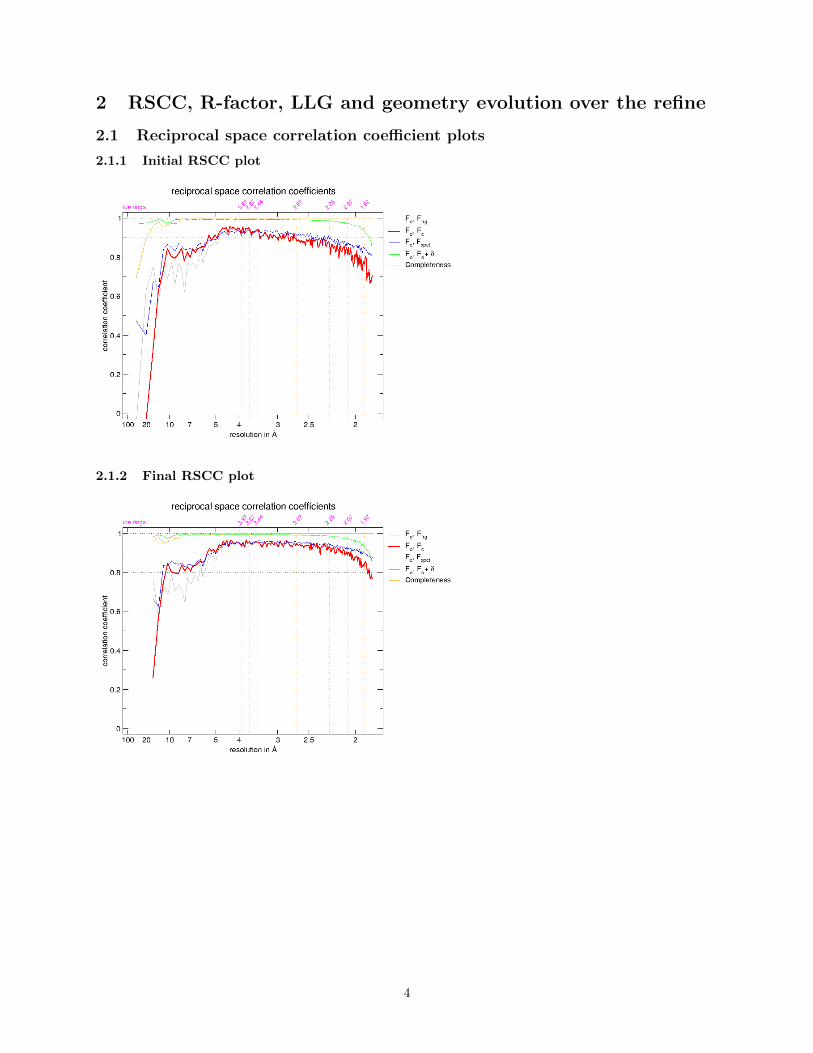
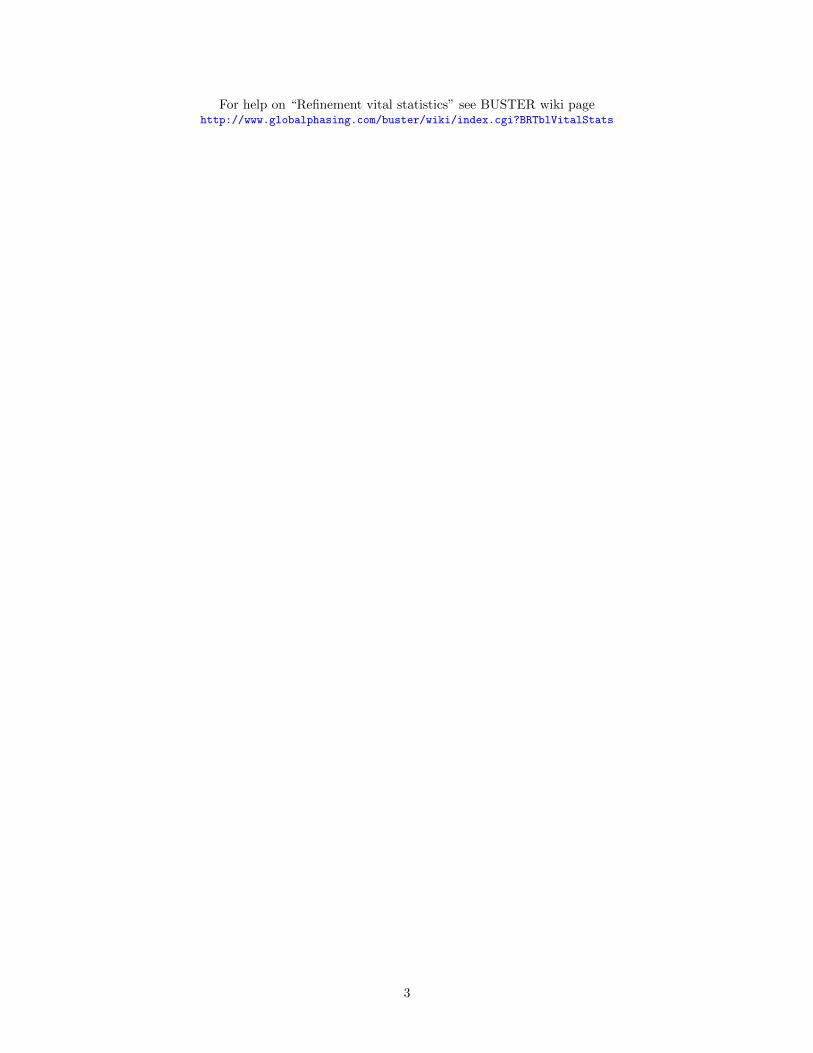
2 RSCC, R-factor, LLG and geometry evolution over the refine
2.1 Reciprocal space correlation coefficient plots
2.1.1 Initial RSCC plot
2.1.2 Final RSCC plot
4
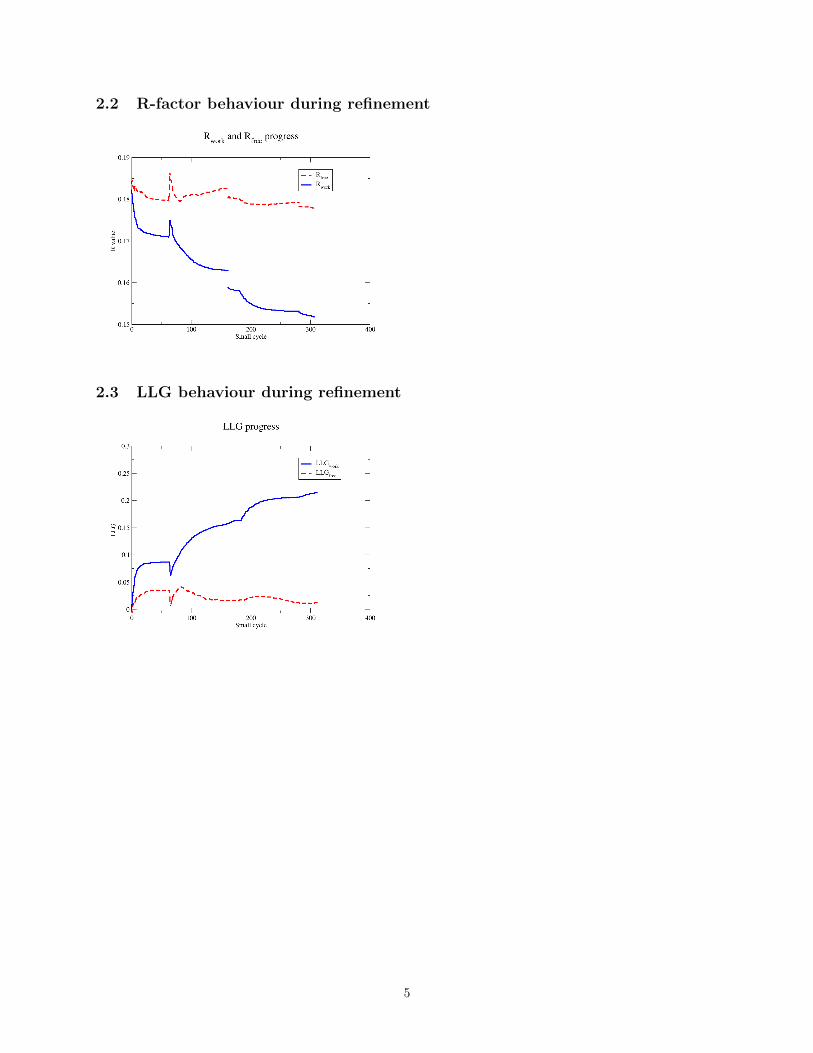
2.2 R-factor behaviour during refinement
2.3 LLG behaviour during refinement
5
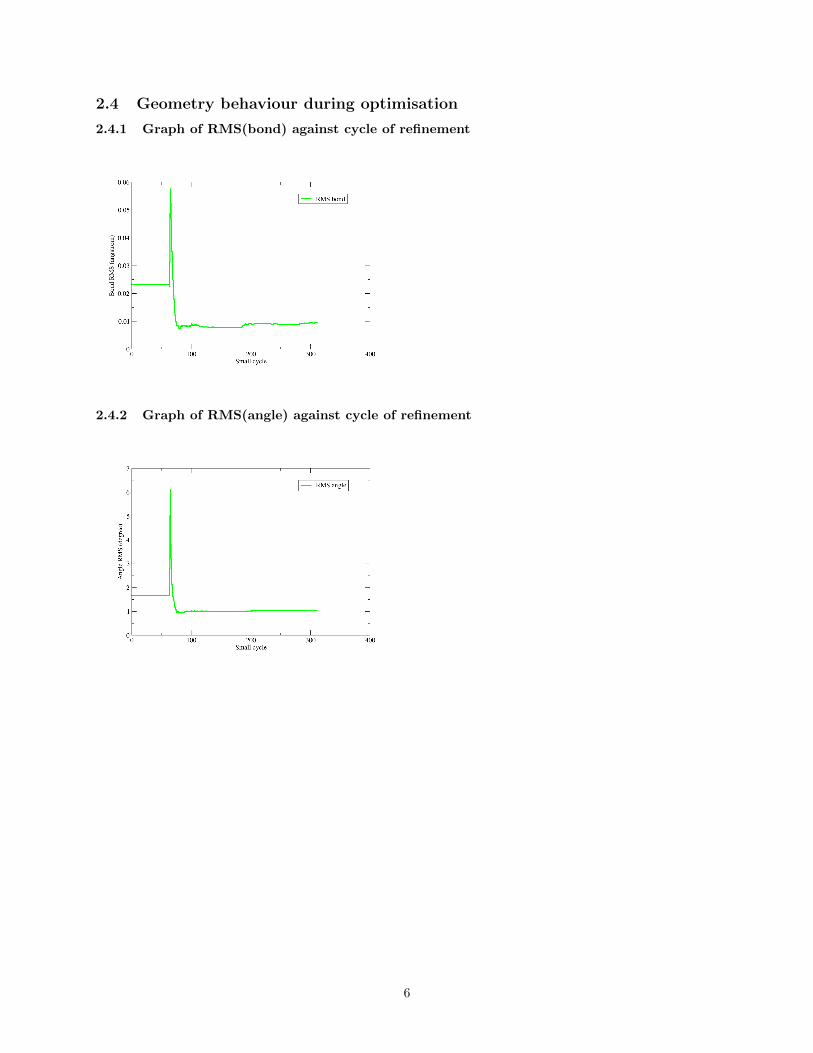
2.4 Geometry behaviour during optimisation
2.4.1 Graph of RMS(bond) against cycle of refinement
2.4.2 Graph of RMS(angle) against cycle of refinement
6
3 MolProbity analysis
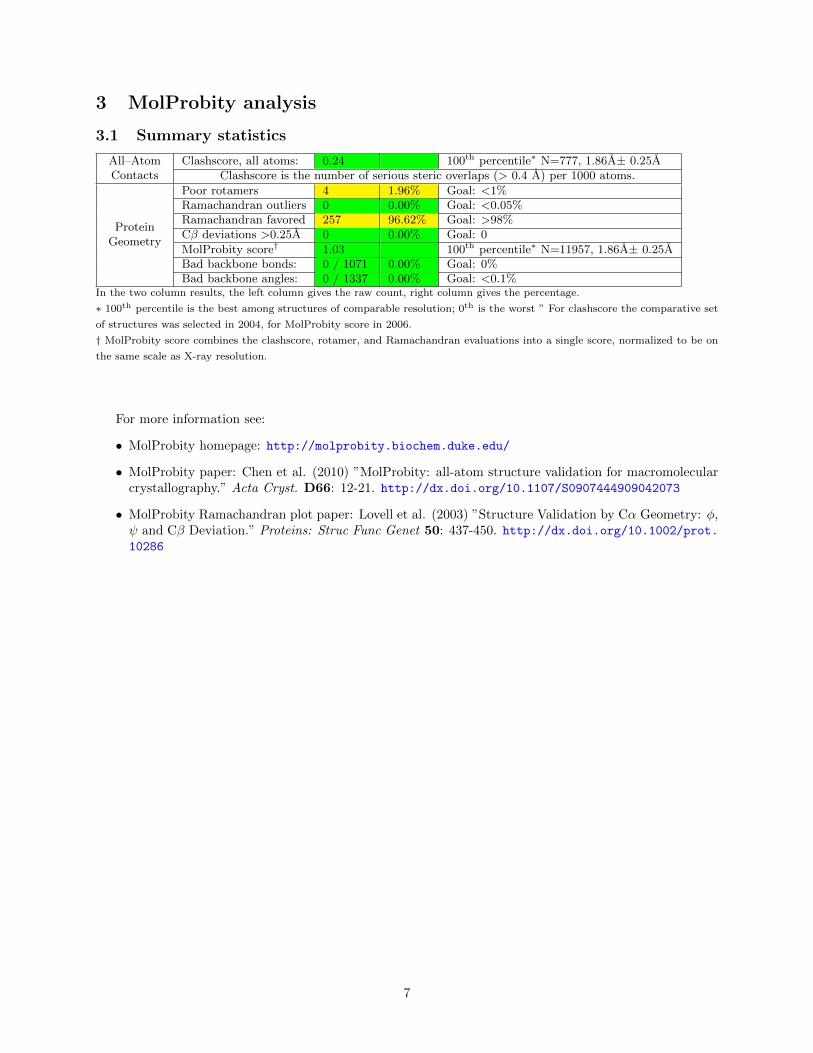
3.1 Summary statistics
All–AtomContacts
Clashscore, all atoms: 0.24 100th percentile∗ N=777, 1.86A± 0.25AClashscore is the number of serious steric overlaps (> 0.4 A) per 1000 atoms.
ProteinGeometry
Poor rotamers 4 1.96% Goal: <1%Ramachandran outliers 0 0.00% Goal: <0.05%Ramachandran favored 257 96.62% Goal: >98%Cβ deviations >0.25A 0 0.00% Goal: 0
MolProbity score† 1.03 100th percentile∗ N=11957, 1.86A± 0.25ABad backbone bonds: 0 / 1071 0.00% Goal: 0%Bad backbone angles: 0 / 1337 0.00% Goal: <0.1%
In the two column results, the left column gives the raw count, right column gives the percentage.
∗ 100th percentile is the best among structures of comparable resolution; 0th is the worst ” For clashscore the comparative set
of structures was selected in 2004, for MolProbity score in 2006.
† MolProbity score combines the clashscore, rotamer, and Ramachandran evaluations into a single score, normalized to be on
the same scale as X-ray resolution.
For more information see:
• MolProbity homepage: http://molprobity.biochem.duke.edu/
• MolProbity paper: Chen et al. (2010) ”MolProbity: all-atom structure validation for macromolecularcrystallography.” Acta Cryst. D66: 12-21. http://dx.doi.org/10.1107/S0907444909042073
• MolProbity Ramachandran plot paper: Lovell et al. (2003) ”Structure Validation by Cα Geometry: φ,ψ and Cβ Deviation.” Proteins: Struc Func Genet 50: 437-450. http://dx.doi.org/10.1002/prot.10286
7
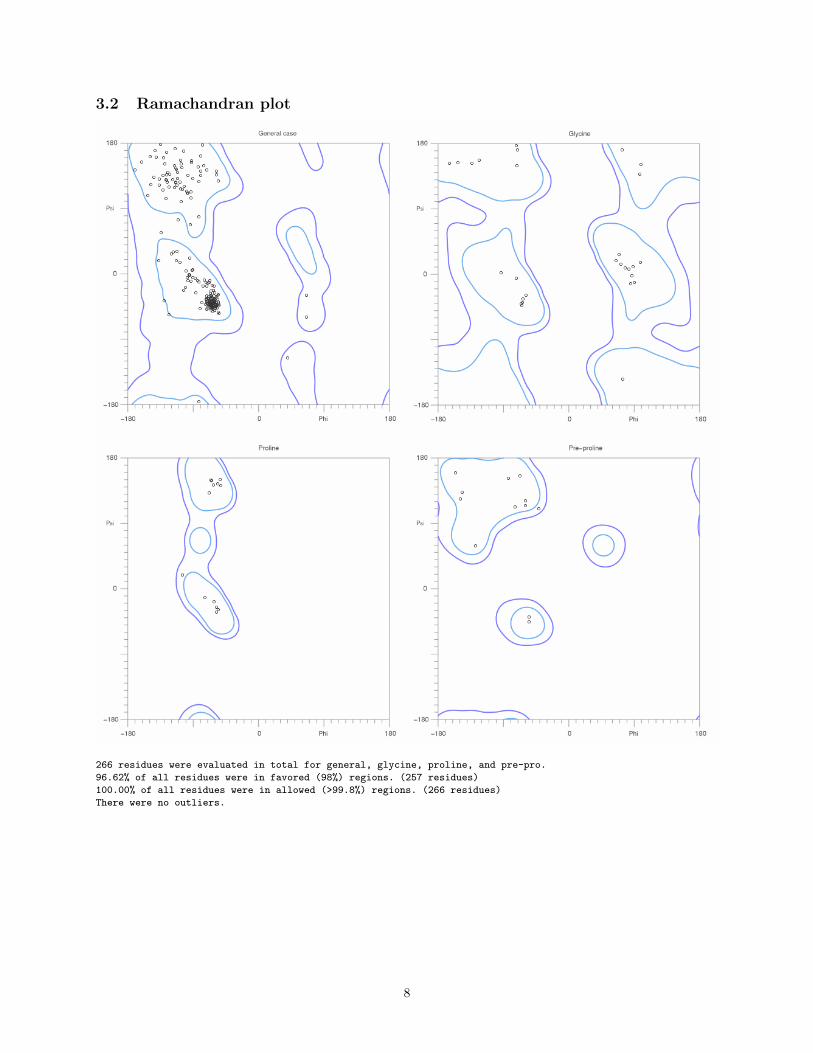
3.2 Ramachandran plot
266 residues were evaluated in total for general, glycine, proline, and pre-pro.
96.62% of all residues were in favored (98%) regions. (257 residues)
100.00% of all residues were in allowed (>99.8%) regions. (266 residues)
There were no outliers.
8
4 Ligand analysis
4.1 468 A 501
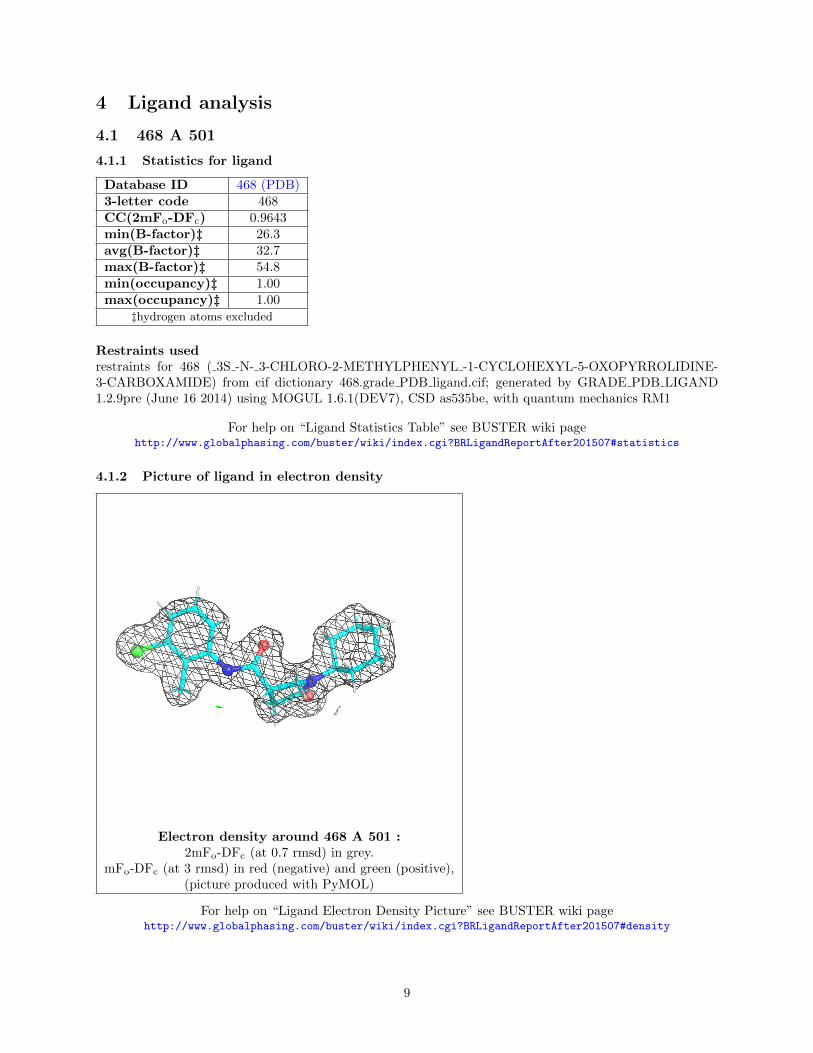
4.1.1 Statistics for ligand
Database ID 468 (PDB)3-letter code 468CC(2mFo-DFc) 0.9643min(B-factor)‡ 26.3avg(B-factor)‡ 32.7max(B-factor)‡ 54.8min(occupancy)‡ 1.00max(occupancy)‡ 1.00
‡hydrogen atoms excluded
Restraints usedrestraints for 468 ( 3S -N- 3-CHLORO-2-METHYLPHENYL -1-CYCLOHEXYL-5-OXOPYRROLIDINE-3-CARBOXAMIDE) from cif dictionary 468.grade PDB ligand.cif; generated by GRADE PDB LIGAND1.2.9pre (June 16 2014) using MOGUL 1.6.1(DEV7), CSD as535be, with quantum mechanics RM1
For help on “Ligand Statistics Table” see BUSTER wiki pagehttp://www.globalphasing.com/buster/wiki/index.cgi?BRLigandReportAfter201507#statistics
4.1.2 Picture of ligand in electron density
Electron density around 468 A 501 :2mFo-DFc (at 0.7 rmsd) in grey.
mFo-DFc (at 3 rmsd) in red (negative) and green (positive),(picture produced with PyMOL)
For help on “Ligand Electron Density Picture” see BUSTER wiki pagehttp://www.globalphasing.com/buster/wiki/index.cgi?BRLigandReportAfter201507#density
9

4.1.3 Mogul analysis for 468 A 501
Summary
‘bad’ bonds 0/25‘bad’ bond angles 0/31‘unusual’ dihedrals 0/3‘bad’ rings 0/3bonds rms Z 0.282angles rms Z 0.486
Mogul bonds‘good’ → green
‘unknown’ → gray
Mogul angles‘good’ → green
‘unknown’ → gray
Mogul dihedrals‘common’ → green‘unknown’ → gray
Mogul rings‘good’ → green
‘unknown’ → gray
For help on “Ligand Mogul Analysis” see BUSTER wiki pagehttp://www.globalphasing.com/buster/wiki/index.cgi?BRLigandReportAfter201507#Mogul
10
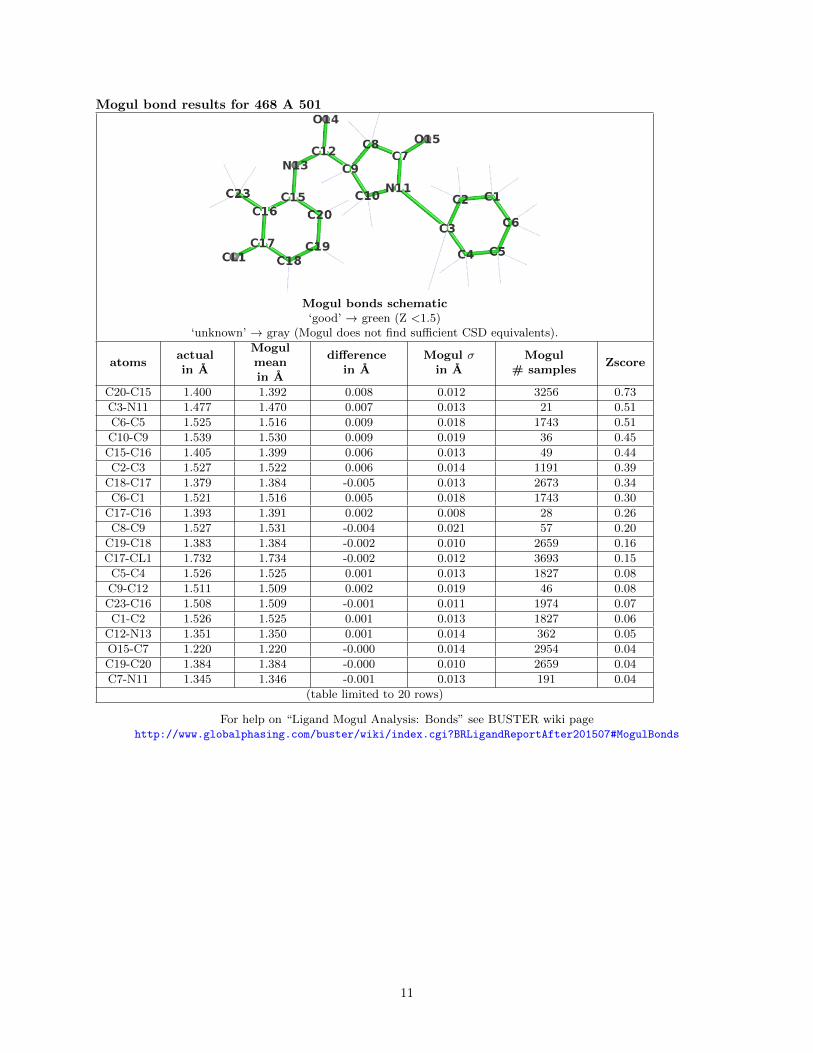
Mogul bond results for 468 A 501
Mogul bonds schematic‘good’ → green (Z <1.5)
‘unknown’ → gray (Mogul does not find sufficient CSD equivalents).
atomsactualin A
Mogulmeanin A
differencein A
Mogul σin A
Mogul# samples
Zscore
C20-C15 1.400 1.392 0.008 0.012 3256 0.73
C3-N11 1.477 1.470 0.007 0.013 21 0.51
C6-C5 1.525 1.516 0.009 0.018 1743 0.51
C10-C9 1.539 1.530 0.009 0.019 36 0.45
C15-C16 1.405 1.399 0.006 0.013 49 0.44
C2-C3 1.527 1.522 0.006 0.014 1191 0.39
C18-C17 1.379 1.384 -0.005 0.013 2673 0.34
C6-C1 1.521 1.516 0.005 0.018 1743 0.30
C17-C16 1.393 1.391 0.002 0.008 28 0.26
C8-C9 1.527 1.531 -0.004 0.021 57 0.20
C19-C18 1.383 1.384 -0.002 0.010 2659 0.16
C17-CL1 1.732 1.734 -0.002 0.012 3693 0.15
C5-C4 1.526 1.525 0.001 0.013 1827 0.08
C9-C12 1.511 1.509 0.002 0.019 46 0.08
C23-C16 1.508 1.509 -0.001 0.011 1974 0.07
C1-C2 1.526 1.525 0.001 0.013 1827 0.06
C12-N13 1.351 1.350 0.001 0.014 362 0.05
O15-C7 1.220 1.220 -0.000 0.014 2954 0.04
C19-C20 1.384 1.384 -0.000 0.010 2659 0.04
C7-N11 1.345 1.346 -0.001 0.013 191 0.04
(table limited to 20 rows)
For help on “Ligand Mogul Analysis: Bonds” see BUSTER wiki pagehttp://www.globalphasing.com/buster/wiki/index.cgi?BRLigandReportAfter201507#MogulBonds
11
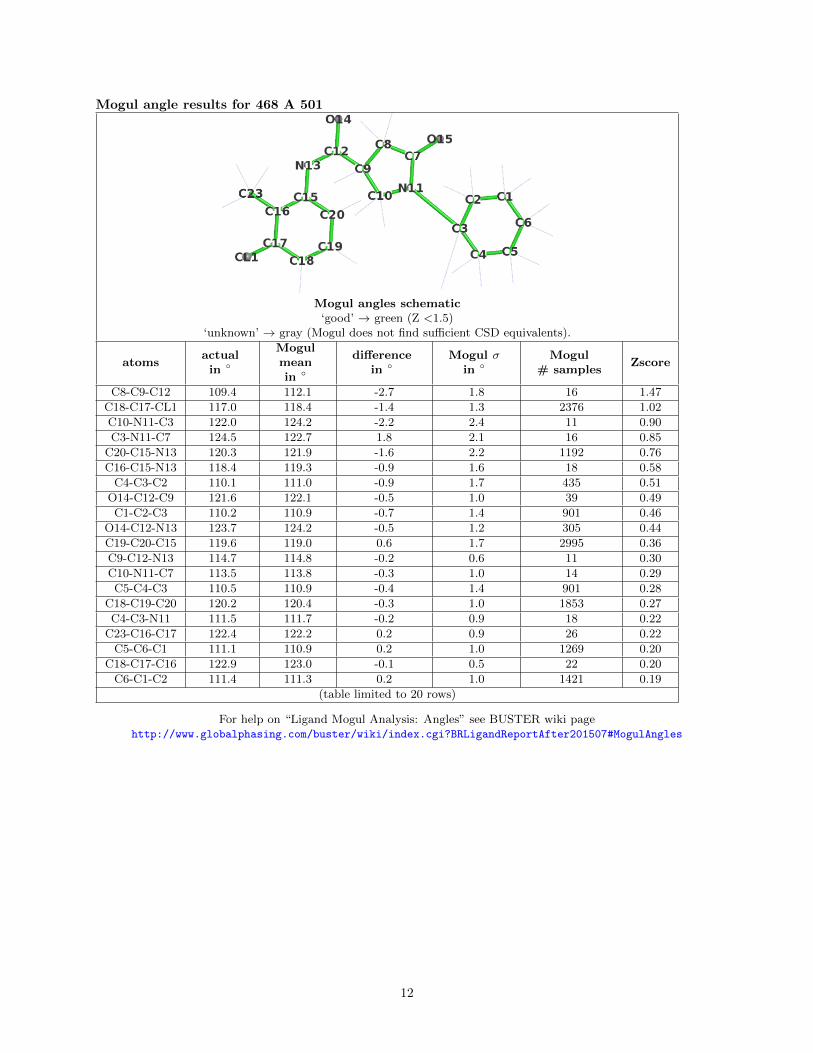
Mogul angle results for 468 A 501
Mogul angles schematic‘good’ → green (Z <1.5)
‘unknown’ → gray (Mogul does not find sufficient CSD equivalents).
atomsactualin ◦
Mogulmeanin ◦
differencein ◦
Mogul σin ◦
Mogul# samples
Zscore
C8-C9-C12 109.4 112.1 -2.7 1.8 16 1.47
C18-C17-CL1 117.0 118.4 -1.4 1.3 2376 1.02
C10-N11-C3 122.0 124.2 -2.2 2.4 11 0.90
C3-N11-C7 124.5 122.7 1.8 2.1 16 0.85
C20-C15-N13 120.3 121.9 -1.6 2.2 1192 0.76
C16-C15-N13 118.4 119.3 -0.9 1.6 18 0.58
C4-C3-C2 110.1 111.0 -0.9 1.7 435 0.51
O14-C12-C9 121.6 122.1 -0.5 1.0 39 0.49
C1-C2-C3 110.2 110.9 -0.7 1.4 901 0.46
O14-C12-N13 123.7 124.2 -0.5 1.2 305 0.44
C19-C20-C15 119.6 119.0 0.6 1.7 2995 0.36
C9-C12-N13 114.7 114.8 -0.2 0.6 11 0.30
C10-N11-C7 113.5 113.8 -0.3 1.0 14 0.29
C5-C4-C3 110.5 110.9 -0.4 1.4 901 0.28
C18-C19-C20 120.2 120.4 -0.3 1.0 1853 0.27
C4-C3-N11 111.5 111.7 -0.2 0.9 18 0.22
C23-C16-C17 122.4 122.2 0.2 0.9 26 0.22
C5-C6-C1 111.1 110.9 0.2 1.0 1269 0.20
C18-C17-C16 122.9 123.0 -0.1 0.5 22 0.20
C6-C1-C2 111.4 111.3 0.2 1.0 1421 0.19
(table limited to 20 rows)
For help on “Ligand Mogul Analysis: Angles” see BUSTER wiki pagehttp://www.globalphasing.com/buster/wiki/index.cgi?BRLigandReportAfter201507#MogulAngles
12
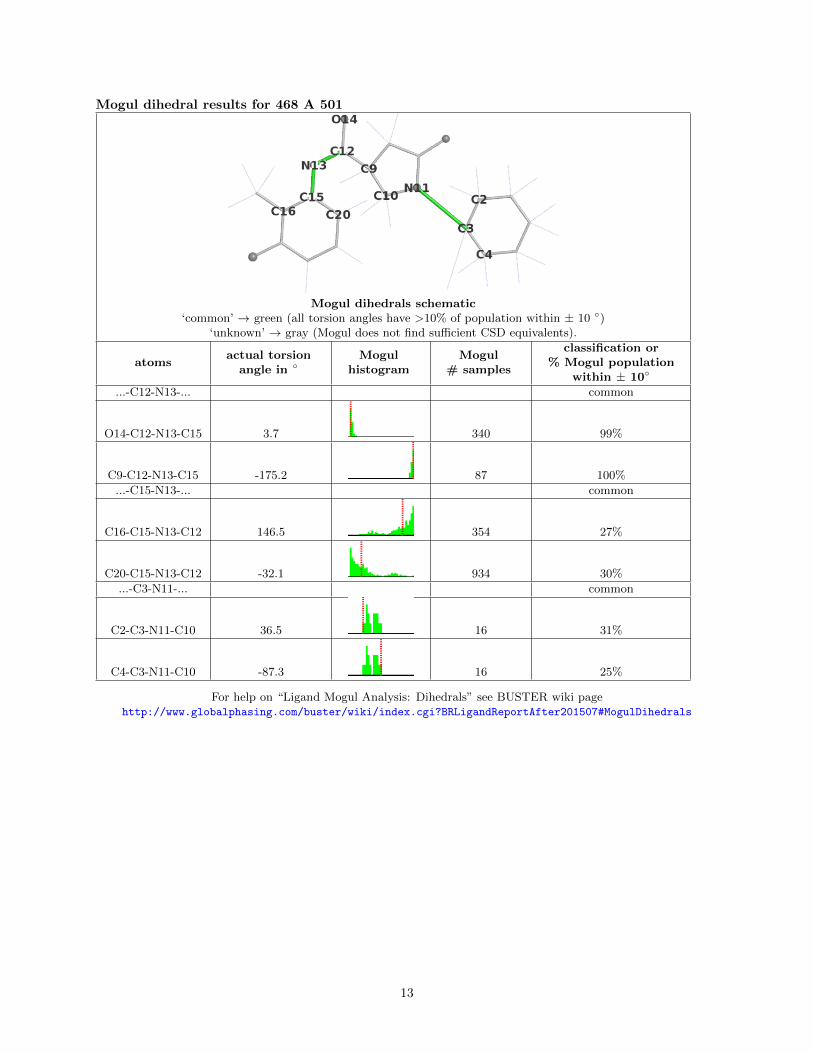
Mogul dihedral results for 468 A 501
Mogul dihedrals schematic‘common’ → green (all torsion angles have >10% of population within ± 10 ◦)
‘unknown’ → gray (Mogul does not find sufficient CSD equivalents).
atomsactual torsion
angle in ◦Mogul
histogramMogul
# samples
classification or% Mogul population
within ± 10◦
...-C12-N13-... common
O14-C12-N13-C15 3.7 340 99%
C9-C12-N13-C15 -175.2 87 100%
...-C15-N13-... common
C16-C15-N13-C12 146.5 354 27%
C20-C15-N13-C12 -32.1 934 30%
...-C3-N11-... common
C2-C3-N11-C10 36.5 16 31%
C4-C3-N11-C10 -87.3 16 25%
For help on “Ligand Mogul Analysis: Dihedrals” see BUSTER wiki pagehttp://www.globalphasing.com/buster/wiki/index.cgi?BRLigandReportAfter201507#MogulDihedrals
13

Mogul ring results for 468 A 501
Mogul rings schematic‘good’ → green (ring strangeness score <3 ◦)
‘unknown’ → gray (Mogul does not find sufficient CSD equivalents).
atomsMogul
# samplesRing strangeness
score‡ in ◦
C7-C8-C9-C10-N11 10 1.1
C15-C20-C19-C18-C17-C16 167 1.1
C1-C2-C3-C4-C5-C6 67 0.5‡‘ring strangeness score’ is the RMS difference in torsion angles between the instance of the ring in the ligand in themodel, and the nearest instance that mogul finds in the CSD.
For help on “Ligand Mogul Analysis: Rings” see BUSTER wiki pagehttp://www.globalphasing.com/buster/wiki/index.cgi?BRLigandReportAfter201507#MogulRings
14

4.2 NAD A 500
4.2.1 Statistics for ligand
Database ID NAD (PDB)
3-letter code NAD
CC(2mFo-DFc) 0.9812
min(B-factor)‡ 17.7
avg(B-factor)‡ 22.0
max(B-factor)‡ 25.5
min(occupancy)‡ 1.00
max(occupancy)‡ 1.00
‡hydrogen atoms excluded
Restraints usedrestraints for NAD (NICOTINAMIDE-ADENINE-DINUCLEOTIDE) from cif dictionary NAD.cif; buster common-compounds v 3.0, Generated by GRADE PDB LIGAND 1.2.9pre (June 16 2014) using MOGUL 1.6.1(DEV7), CSDas535be, with quantum mechanics RM1
For help on “Ligand Statistics Table” see BUSTER wiki pagehttp://www.globalphasing.com/buster/wiki/index.cgi?BRLigandReportAfter201507#statistics
4.2.2 Picture of ligand in electron density
Electron density around NAD A 500 :2mFo-DFc (at 0.7 rmsd) in grey.
mFo-DFc (at 3 rmsd) in red (negative) and green (positive),(picture produced with PyMOL)
For help on “Ligand Electron Density Picture” see BUSTER wiki pagehttp://www.globalphasing.com/buster/wiki/index.cgi?BRLigandReportAfter201507#density
15
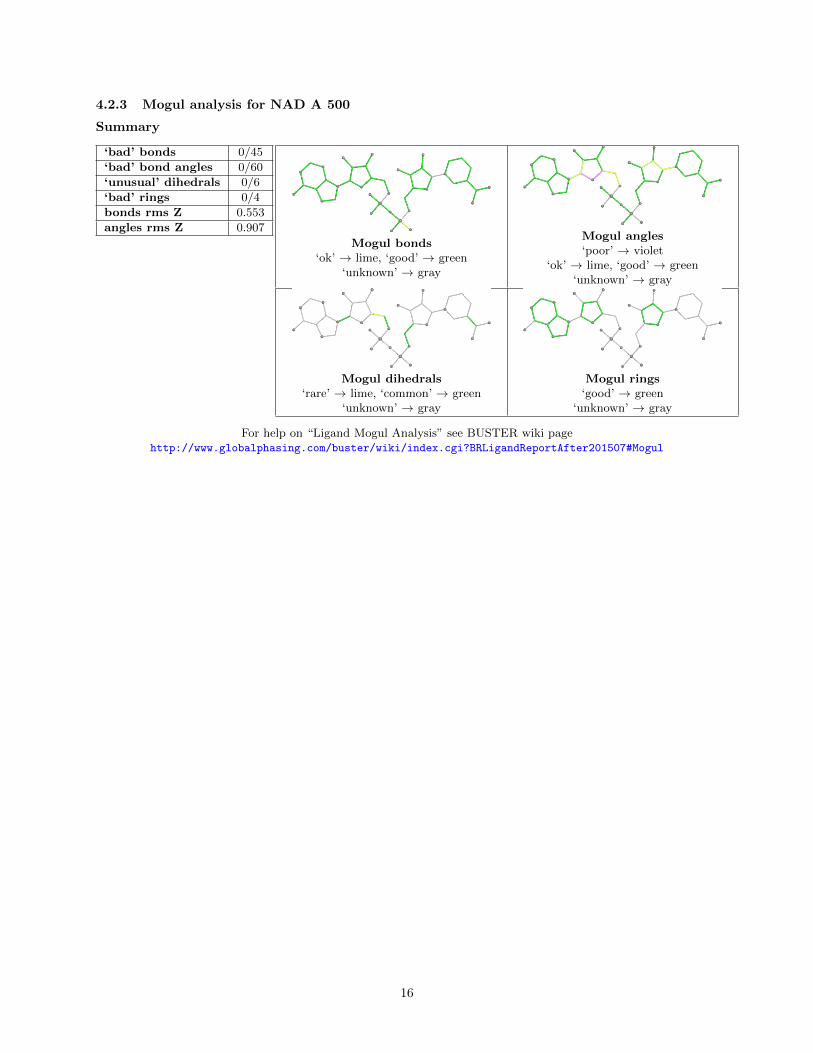
4.2.3 Mogul analysis for NAD A 500
Summary
‘bad’ bonds 0/45
‘bad’ bond angles 0/60
‘unusual’ dihedrals 0/6
‘bad’ rings 0/4
bonds rms Z 0.553
angles rms Z 0.907
Mogul bonds‘ok’ → lime, ‘good’ → green
‘unknown’ → gray
Mogul angles‘poor’ → violet
‘ok’ → lime, ‘good’ → green‘unknown’ → gray
Mogul dihedrals‘rare’ → lime, ‘common’ → green
‘unknown’ → gray
Mogul rings‘good’ → green
‘unknown’ → gray
For help on “Ligand Mogul Analysis” see BUSTER wiki pagehttp://www.globalphasing.com/buster/wiki/index.cgi?BRLigandReportAfter201507#Mogul
16
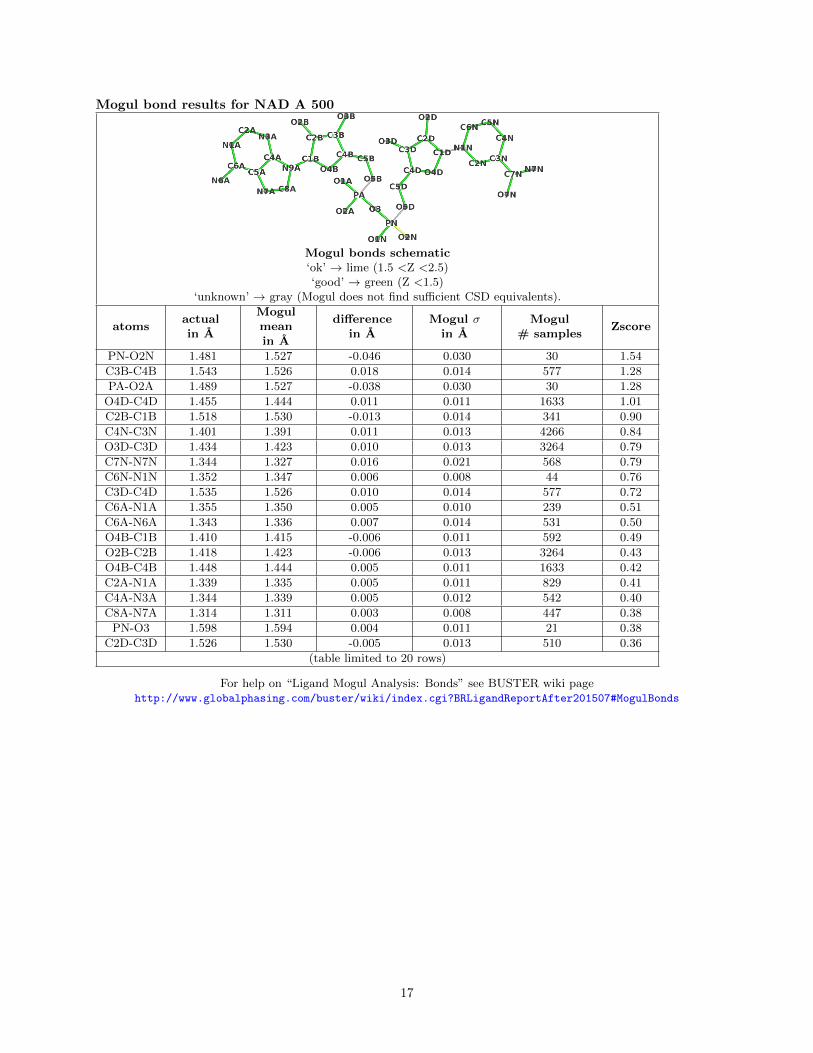
Mogul bond results for NAD A 500
Mogul bonds schematic‘ok’ → lime (1.5 <Z <2.5)‘good’ → green (Z <1.5)
‘unknown’ → gray (Mogul does not find sufficient CSD equivalents).
atomsactualin A
Mogulmeanin A
differencein A
Mogul σin A
Mogul# samples
Zscore
PN-O2N 1.481 1.527 -0.046 0.030 30 1.54
C3B-C4B 1.543 1.526 0.018 0.014 577 1.28
PA-O2A 1.489 1.527 -0.038 0.030 30 1.28
O4D-C4D 1.455 1.444 0.011 0.011 1633 1.01
C2B-C1B 1.518 1.530 -0.013 0.014 341 0.90
C4N-C3N 1.401 1.391 0.011 0.013 4266 0.84
O3D-C3D 1.434 1.423 0.010 0.013 3264 0.79
C7N-N7N 1.344 1.327 0.016 0.021 568 0.79
C6N-N1N 1.352 1.347 0.006 0.008 44 0.76
C3D-C4D 1.535 1.526 0.010 0.014 577 0.72
C6A-N1A 1.355 1.350 0.005 0.010 239 0.51
C6A-N6A 1.343 1.336 0.007 0.014 531 0.50
O4B-C1B 1.410 1.415 -0.006 0.011 592 0.49
O2B-C2B 1.418 1.423 -0.006 0.013 3264 0.43
O4B-C4B 1.448 1.444 0.005 0.011 1633 0.42
C2A-N1A 1.339 1.335 0.005 0.011 829 0.41
C4A-N3A 1.344 1.339 0.005 0.012 542 0.40
C8A-N7A 1.314 1.311 0.003 0.008 447 0.38
PN-O3 1.598 1.594 0.004 0.011 21 0.38
C2D-C3D 1.526 1.530 -0.005 0.013 510 0.36
(table limited to 20 rows)
For help on “Ligand Mogul Analysis: Bonds” see BUSTER wiki pagehttp://www.globalphasing.com/buster/wiki/index.cgi?BRLigandReportAfter201507#MogulBonds
17

Mogul angle results for NAD A 500
Mogul angles schematic‘poor’ → violet (2.5 <Z <4)‘ok’ → lime (1.5 <Z <2.5)‘good’ → green (Z <1.5)
‘unknown’ → gray (Mogul does not find sufficient CSD equivalents).
atomsactualin ◦
Mogulmeanin ◦
differencein ◦
Mogul σin ◦
Mogul# samples
Zscore
C4B-O4B-C1B 105.7 109.5 -3.8 1.4 434 2.61
C2D-C1D-N1N 117.8 113.6 4.2 1.8 20 2.30
O4B-C1B-N9A 111.3 108.4 2.9 1.3 66 2.25
O5B-C5B-C4B 104.6 109.1 -4.5 2.3 84 1.93
C3D-C2D-C1D 99.4 101.5 -2.1 1.2 285 1.82
O4B-C1B-C2B 104.4 106.5 -2.1 1.2 307 1.82
C4N-C3N-C7N 117.2 120.7 -3.5 2.4 598 1.45
C3B-C2B-C1B 99.8 101.5 -1.7 1.2 273 1.45
O3D-C3D-C2D 108.6 111.9 -3.3 2.6 938 1.26
C4A-N9A-C1B 125.0 127.0 -1.9 1.8 67 1.10
O4D-C1D-C2D 105.9 107.0 -1.1 1.1 17 1.07
O3-PA-O1A 111.2 108.7 2.5 2.4 19 1.02
O4B-C4B-C3B 106.6 105.3 1.3 1.3 448 1.02
O7N-C7N-C3N 118.7 119.5 -0.8 0.8 373 1.00
C1B-N9A-C8A 128.6 126.8 1.8 1.9 65 0.96
O2D-C2D-C1D 113.2 110.6 2.6 2.8 336 0.93
C2B-C1B-N9A 115.5 114.1 1.4 1.5 59 0.92
C6N-C5N-C4N 119.2 119.9 -0.7 0.7 149 0.92
C6N-N1N-C2N 121.8 122.2 -0.3 0.4 10 0.88
C3N-C7N-N7N 118.7 117.9 0.8 1.0 373 0.84
(table limited to 20 rows)
For help on “Ligand Mogul Analysis: Angles” see BUSTER wiki pagehttp://www.globalphasing.com/buster/wiki/index.cgi?BRLigandReportAfter201507#MogulAngles
18
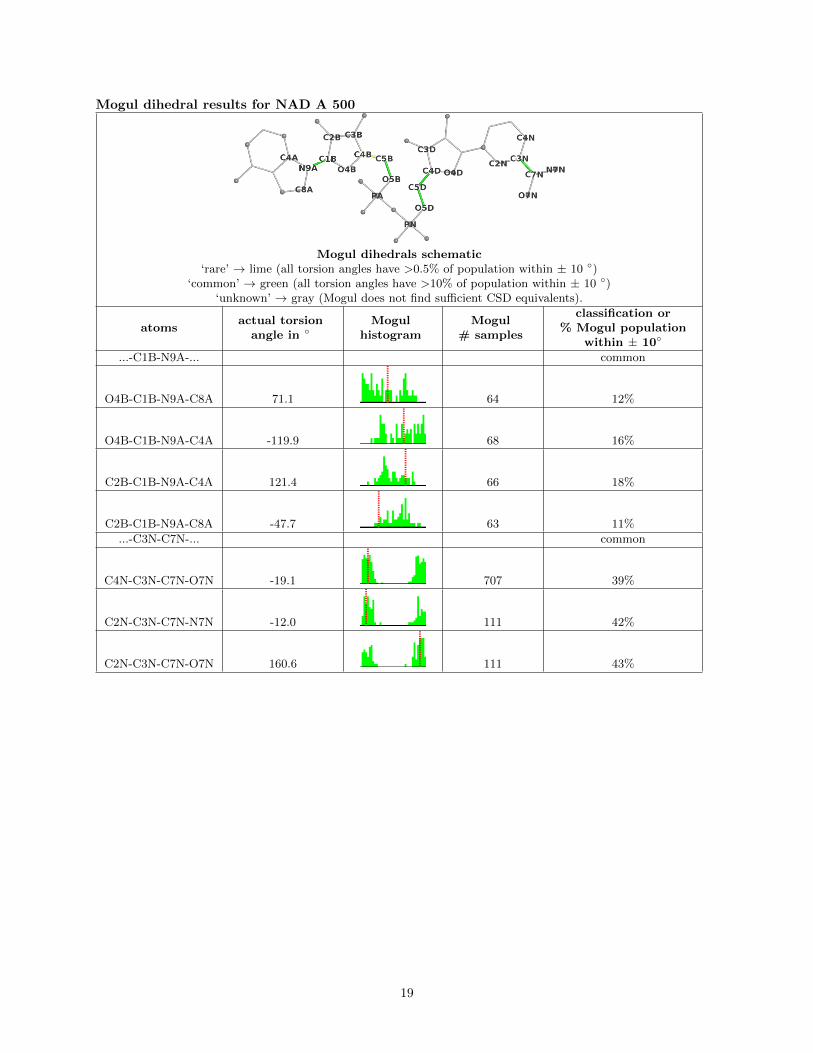
Mogul dihedral results for NAD A 500
Mogul dihedrals schematic‘rare’ → lime (all torsion angles have >0.5% of population within ± 10 ◦)
‘common’ → green (all torsion angles have >10% of population within ± 10 ◦)‘unknown’ → gray (Mogul does not find sufficient CSD equivalents).
atomsactual torsion
angle in ◦Mogul
histogramMogul
# samples
classification or% Mogul population
within ± 10◦
...-C1B-N9A-... common
O4B-C1B-N9A-C8A 71.1 64 12%
O4B-C1B-N9A-C4A -119.9 68 16%
C2B-C1B-N9A-C4A 121.4 66 18%
C2B-C1B-N9A-C8A -47.7 63 11%
...-C3N-C7N-... common
C4N-C3N-C7N-O7N -19.1 707 39%
C2N-C3N-C7N-N7N -12.0 111 42%
C2N-C3N-C7N-O7N 160.6 111 43%
19

atomsactual torsion
angle in ◦Mogul
histogramMogul
# samples
classification or% Mogul population
within ± 10◦
C4N-C3N-C7N-N7N 168.4 707 40%
...-C4B-C5B-... rare
C3B-C4B-C5B-O5B -67.1 63 40%
O4B-C4B-C5B-O5B 172.8 63 6%
...-C4D-C5D-... common
C3D-C4D-C5D-O5D 54.8 63 84%
O4D-C4D-C5D-O5D -65.0 63 90%
...-C5B-O5B-... common
C4B-C5B-O5B-PA 128.4 74 14%
...-C5D-O5D-... common
C4D-C5D-O5D-PN 147.5 74 42%
For help on “Ligand Mogul Analysis: Dihedrals” see BUSTER wiki pagehttp://www.globalphasing.com/buster/wiki/index.cgi?BRLigandReportAfter201507#MogulDihedrals
20

Mogul ring results for NAD A 500
Mogul rings schematic‘good’ → green (ring strangeness score <3 ◦)
‘unknown’ → gray (Mogul does not find sufficient CSD equivalents).
atomsMogul
# samplesRing strangeness
score‡ in ◦
C4B-O4B-C1B-C2B-C3B 191 1.4
C4D-O4D-C1D-C2D-C3D 191 0.5
C5A-C6A-N1A-C2A-N3A-C4A 184 0.2
N9A-C8A-N7A-C5A-C4A 186 0.1‡‘ring strangeness score’ is the RMS difference in torsion angles between the instance of the ring in the ligand in themodel, and the nearest instance that mogul finds in the CSD.
For help on “Ligand Mogul Analysis: Rings” see BUSTER wiki pagehttp://www.globalphasing.com/buster/wiki/index.cgi?BRLigandReportAfter201507#MogulRings
21
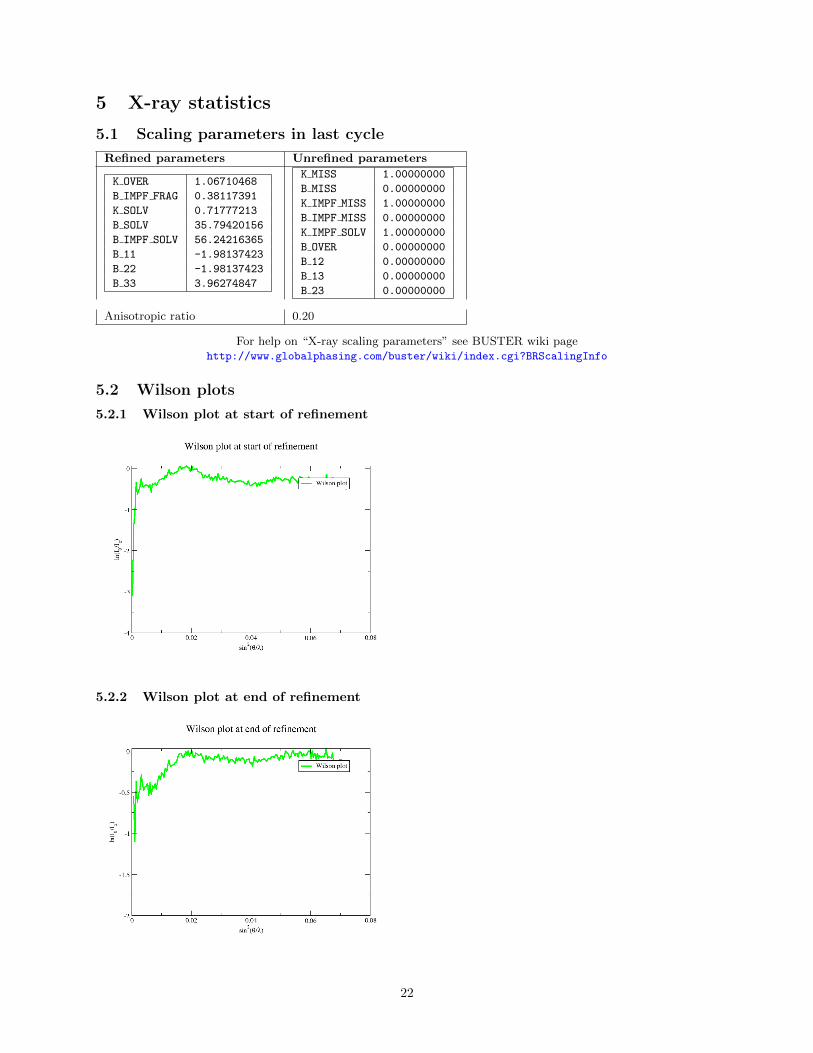
5 X-ray statistics
5.1 Scaling parameters in last cycle
Refined parameters Unrefined parameters
K OVER 1.06710468
B IMPF FRAG 0.38117391
K SOLV 0.71777213
B SOLV 35.79420156
B IMPF SOLV 56.24216365
B 11 -1.98137423
B 22 -1.98137423
B 33 3.96274847
K MISS 1.00000000
B MISS 0.00000000
K IMPF MISS 1.00000000
B IMPF MISS 0.00000000
K IMPF SOLV 1.00000000
B OVER 0.00000000
B 12 0.00000000
B 13 0.00000000
B 23 0.00000000
Anisotropic ratio 0.20
For help on “X-ray scaling parameters” see BUSTER wiki pagehttp://www.globalphasing.com/buster/wiki/index.cgi?BRScalingInfo
5.2 Wilson plots
5.2.1 Wilson plot at start of refinement
5.2.2 Wilson plot at end of refinement
22
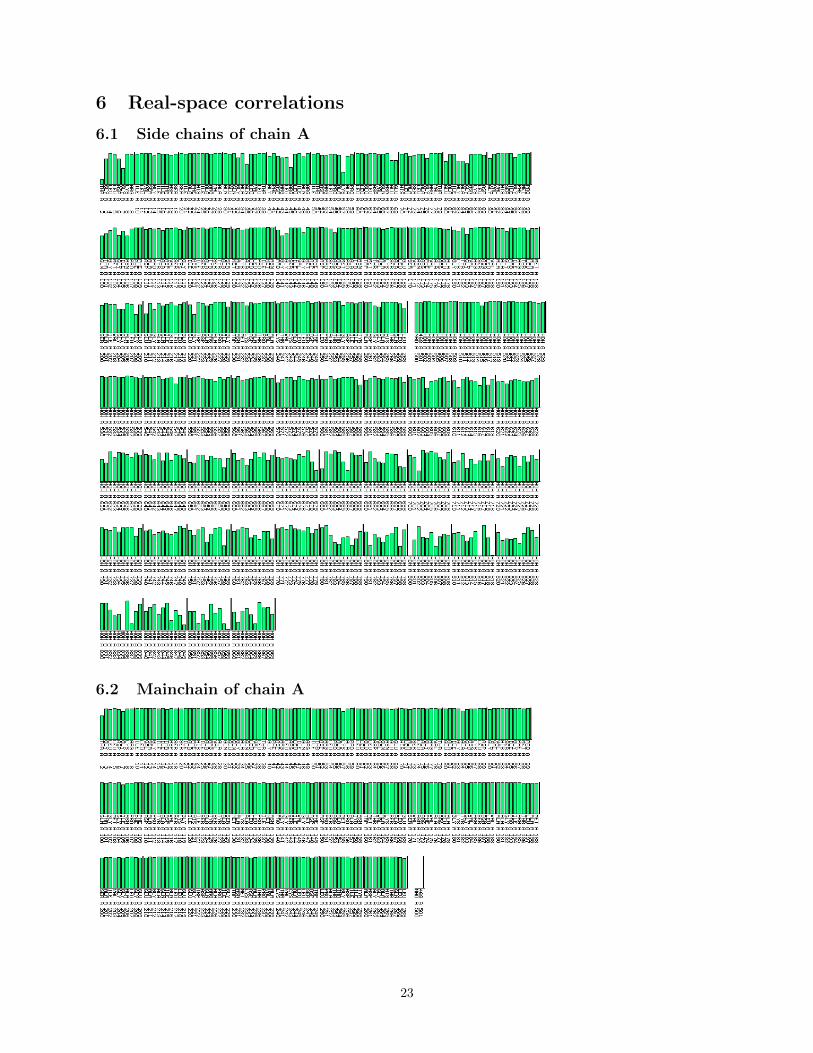
6 Real-space correlations
6.1 Side chains of chain A
6.2 Mainchain of chain A
23