business today - november 8, 2015
DESCRIPTION
Business Today - November 8, 2015TRANSCRIPT


The BT500 our annual exercise to rank companies by the averagemarket capitalisation they have enjoyed over the past six months al-ways throws up interesting insights. And it captures investor sentiment
more accurately than any other survey.Around this time last year, the equity markets were euphoric. The aggre-
gate average market capitalisation of the top 500 listed companies in thecountry had gone up by a staggering 36 per cent over the year before. Theaverage market capitalisation of the top company in our 2014 survey TataConsultancy Services (TCS) had gone up by 44 per cent over the previousyear. And among the top 50 companies, there was only one NTPC that hadseen its market capitalisation drop.
This year’s exercise shows just how lacklustre the market sentiment is.The aggregate average market capitalisation of the top 500 listed companiesstands at `95,29,373 crore a rise of 15 per cent, which seems quite respect-able. But that does not tell the full story. A closer examination of the numbersshows that for a very large number of big companies, market capitalisationshave barely budged in an entire year. In some cases, they have even gonedown. TCS retained its top spot this year, but its market cap moved up just 8.3per cent over the last year’s average. Among the prominent infotech compa-nies, only Infosys saw its market cap go up significantly.
Unlike last year, the top 50 had no less than ninecompanies that had seen their market cap erode. The top10 list alone had three companies whose average mar-ket capitalisation was lower than what they enjoyed inthe same period last year.
Because of the global crash in commodity prices,most oil and gas, and mining and mineral companiessaw their market values drop. ONGC has dropped by al-most 28 per cent. GAIL has seen its value erode by 15 percent, Oil India by 20 per cent, and Cairn India by awhopping 48 per cent.
Meanwhile, despite the overall subdued market, two sectors have seenquite a dramatic rise in their market caps. Drug makers have enjoyed a dreamrun, with all the prominent companies showing sharp increases in value. Sohave most private banks.
While market capitalisation forms the main part of our listings, we alsochecked profit, revenue and asset growth of the top 500 companies (exclud-ing the banking, financial services and insurance companies). The results arenot particularly encouraging. The aggregate profits of the top 500 profit-making companies grew by barely seven per cent over last year, the revenuegrowth was an anaemic 0.4 per cent, while return on capital employed forthe top 500 averaged 11 per cent and actually declined 40 basis points com-pared to last year.
The BT500 is the labour of love of Principal Research Analyst Niti Kiran,who calculates all the tables using the CMIE Prowess Database. Deputy EditorAlokesh Bhattacharyya anchors the overall issue, though it is a true teameffort with everyone chipping in with articles, calculations, graphics and otherrelated portions of the issue.
[email protected]@ProsaicView
From the Editor
Crunching the Numbers
For reprint rights and syndication enquiries, [email protected] or call +91-120-4078000
www.syndicationstoday.in
http://www.businesstoday.in
Editor-in-Chief: Aroon Purie Group Chief Executive Officer: Ashish BaggaGroup Editorial Director: Raj ChengappaIEditor: Prosenjit DattaManaging Editor: Rajeev Dubey Deputy Editors: Alokesh Bhattacharyya, Venkatesha Babu, Chitra Narayanan, Anand AdhikariICORRESPONDENTSSenior Editors: P.B. Jayakumar, Nevin John, Goutam Das Senior Associate Editors: Mahesh Nayak, Ajita Shashidhar, Joe C MathewAssociate Editors: E. Kumar Sharma, Dipak Mondal, Manu Kaushik, Taslima Khan, Anilesh MahajanSenior Assistant Editors: Sarika Malhotra, Chanchal Paul ChauhanAssistant Editor: Nidhi SingalIRESEARCH TEAMPrincipal Research Analyst: Niti Kiran
ICOPY DESK
Senior Editors: Rishi Joshi, Mahesh JagotaAssociate Editor: Samarpan DuttaChief Copy Editors: Gadadhar Padhy, Roopali JoshiSenior Sub Editor: Devika Singh
IPHOTOGRAPHYPhoto Editor: Vivan MehraDeputy Chief Photographer: Shekhar GhoshPrincipal Photographer: Rachit Goswami Senior Photographer: Nilotpal BaruahSenior Photo Researcher: Nikhil VermaIARTArt Editor: Safia ZahidDeputy Art Director : Anand SinhaAssistant Art Directors : Amit Sharma, Ajay ThakuriChief Visualisers: N. Ravishankar Reddy, Vikas Gupta Senior Visualiser: Raj Verma
IPRODUCTION
Chief of Production: Harish AggarwalSenior Production Coordinators: Narendra Singh, Rajesh VermaAssistant Manager: Rajkumar WahiSenior DTP Designer: Mohammed ShahidILIBRARYAssistant Librarian: Satbir Singh
IGroup Business Head: Manoj SharmaAssociate Publisher (Impact): Anil FernandesIIMPACT TEAM
Senior General Manager: Jitendra Lad (West)General Managers: Upendra Singh (Bangalore),Velu Balasubramaniam (Chennai)Deputy General Manager: Kaushiky Chakraborty (East)IMarketing: Vipul Hoon, General Manager; Reynold Robert, Brand ManagerINewsstand Sales: D.V.S. Rama Rao, Chief General Manager; Deepak Bhatt, General Manager (National Sales); Vipin Bagga, Deputy General Manager (Operations); Manish Kumar Srivastava, Regional Sales Manager (North); Joydeep Roy, Regional Sales Manager (East); Rajeev Gandhi, Regional Sales Manager (West); Arokia Raj L, Regional Sales Manager (South)
Vol. 24, No. 22, for the fortnight October 26, 2015 toNovember 8, 2015. Released on October 26, 2015.
Editorial Office: India Today Mediaplex, FC 8, Sector 16/A, Film City, Noida-201301; Tel.: 0120-4807100; Fax: 0120-4807150 Advertising Off ce (Gurgaon): A1-A2, Enkay Centre, Ground Floor, V.N. Commercial Complex, Udyog Vihar, Phase 5, Gurgaon-122001; Tel.: 0124-4948400; Fax: 0124-4030919; Mumbai: 1201, 12th Floor, Tower 2 A, One Indiabulls Centre (Jupiter Mills), S.B. Marg, Lower Parel (West), Mumbai-400013; Tel.: 022-66063355; Fax: 022-66063226; Chennai: 5th Floor, Main Building No. 443, Guna Complex, Anna Salai, Teynampet, Chennai-600018; Tel.: 044-28478525; Fax: 044-24361942; Bangalore: 202-204 Richmond Towers, 2nd Floor, 12, Richmond Road, Bangalore-560025; Tel.: 080-22212448, 080-30374106; Fax: 080-22218335; Kolkata: 52, J.L. Road, 4th floor, Kolkata-700071; Tel.: 033-22825398, 033-22827726, 033-22821922; Fax: 033-22827254; Hyderabad: 6-3-885/7/B, Raj Bhawan Road, Somajiguda, Hyderabad-500082; Tel.: 040-23401657, 040-23400479; Ahmedabad: 2nd Floor, 2C, Surya Rath Building, Behind White House, Panchwati, Off: C.G. Road,Ahmedabad-380006; Tel.: 079-6560393, 079-6560929; Fax: 079-6565293; Kochi: Karakkatt Road,Kochi-682016; Tel.: 0484-2377057, 0484-2377058; Fax: 0484-370962 Subscriptions: For assistance contact Customer Care, India Today Group, A-61, Sector-57, Noida (U.P.) - 201301; Tel.: 0120-2479900 from Delhi & Faridabad; 0120-2479900 (Monday-Friday, 10 am-6 pm) from Rest of India; Toll freeno:1800 1800 100 (from BSNL/ MTNL lines); Fax: 0120-4078080; E-mail: [email protected]
Sales: General Manager Sales, Living Media India Ltd, B-45, 3rd Floor, Sector-57, Noida (U.P.) - 201301; Tel.: 0120-4019500; Fax: 0120-4019664 © 1998 Living Media India Ltd. All rights reservedthrougout the world. Reproduction in any manner is prohibited.
Printed & published by Ashish Kumar Bagga on behalf of Living Media India Limited. Printed at Thomson Press India Limited, 18-35, Milestone, Delhi-Mathura Road, Faridabad-121007,(Haryana). Published at K-9, Connaught Circus, New Delhi-110 001. Editor: Prosenjit Datta
Business Today does not take responsibility for returning unsolicited publication material.All disputes are subject to the exclusive jurisdiction of competent courts and forums in Delhi/New Delhi only


Distribution WoesYour cover story, which addresses the ‘power for all by 2019’ issue (The Weak Link, October 25), rightly says that rhetoric will have to give way to reality and targets to execution. It is truly a matter of great shame that even 68 years af-ter Independence, our country, the world’s third-largest producer and consumer of power, can’t sup-ply 24x7 power. In the past, suc-cessive governments have failed to deliver on this emotive issue. The Narendra Modi-led government can’t simply rest on its laurels. For all its achievements, this is one is-sue for which the voters will not pardon the government. So, the government needs to focus on fix-ing an enormously inefficient and bankrupt power distribution sys-tem that has accumulated whop-ping losses of over `3.19 lakh crore. Once this is taken care of, and it will take quite an effort on the part of the government to fix it, it could very well be a smooth ride ahead. It is time for action. Kritika Sharma, Gurgaon
Kudos to SMEsThis refers to the interesting profiles of the 16 winners who made it to your sixth annual Best SMEs Survey list (October 11). They all deserved to be included due to their overall performance and tenacity to rise in spite of tough competition and sur-vival challenges amidst overall slowing down of foreign exports markets. Thumbs up to the BT team and the five-member jury for under-going a strenuous exercise of screen-ing, analysing and evaluating a huge mass of data to bring out a scintillating issue! As rightly stated in the editorial, SMEs really are the backbone of our economy and when they excel, they are definitely a valu-able asset since they create jobs for India’s growing workforce. SMES will drive the Indian economy. J.S. Broca, New Delhi
Deep AnalysisYour cover story (The Black Hole, October 11) uncovered the extent of the black money problem in India. It was investigative journalism of the highest order. The issues related to black money generation were sys-tematically dealt with in great detail to understand the gravity of the sit-uation. It is a clear case of fence eat-ing not only the crop, but also ex-tending its territories, diabolically derailing economic activities in the country and stalling the growth en-gine. It has become a systemic mal-aise as stringent responses were not initiated through policy formula-tions since Independence. The econ-omy is unbearably suffering from the double whammy of black money and illicit currency along with ter-rorism and drug trafficking by un-scrupulous citizens.
The hurriedly promulgated act to curb black money has buried the chances of retrieving lost money from foreign banks. It has porous clauses and thrown up more ques-tions than answers. The FM should have given substantial opportunities for voluntary disclosure, incorporat-ing broad incentives primarily as a prelude to the present legislation in-stead of reserving it for the 2016/17 budget. Simplification of tax struc-ture, streamlined sources of taxa-tion, taxpayer-friendly procedures, liberal tax holidays, immediate recti-fication of tax returns, reformed tax rates and transparent fiscal chan-nels will cohesively broaden the tax net. It will largely fill the coffers of the government and increasingly curtail both tax avoidance and tax evasion. Our systems must be rede-fined to lure the money earners to proactively embrace the practice of tax payment. B.Rajasekaran, Bangalore
Simply Inspiring! I was simply inspired by your cover story (The Most Powerful Women in Business, September 27). I am often called a feminist for taking a stand at my workplace, home, and among friends. Sometimes I have to work twice as hard to get the same re-turns as my male counterparts, and despite the normal daily hurdles that one faces, I face more for being a woman. I say that if feminism helps me get a little closer to my dream, in what is inevitably a man’s world, then I am happy being a fem-inist. I am quite ambitious and this package put together by you just made my day. Aditi Bhattacharjee, Nagpur
Re: Letters to the Editor
WRITE TO: The Editor, Business Today, India Today Mediaplex, FC-8, Sector 16/A, Film City, Noida-201301. Email: [email protected]/[email protected] Website: www.businesstoday.in Unsolicited articles will not be returned or acknowledged.Business Today reserves the right to edit letters for brevity and clarity before publication.
FOR SUBSCRIPTION ASSISTANCE WRITE TO:Customer Care, India Today Group, A-61, Sector-57, Noida (U.P.) — 201 301Phone: (0120) 2479900 from Delhi & Faridabad; (0120) 2479900 (Monday-Friday; 10 am-6 pm) from Rest of India; Toll free no. 1800 1800 100 (from BSNL/ MTNL lines); Fax: (0120) 4078080 E-mail: [email protected]
HOW TO CONTACT
BT
Send all your comments to: [email protected]
BT SCRAPBOOK� React to articles in BT�Suggest story ideas�Share your experience as consumer or SME�See what others have to say on our storieson scrapbook at www.businesstoday.in
8 BUSINESS TODAY November 8 2015


C O V E R B Y A N A N D S I N H A N O V E M B E R / 8 / 2 0 1 5 V O L U M E 2 4 / N U M B E R 2 2
CONTENTSCOVER STORY
INDIA’S MOST VALUABLE COMPANIES

38 THE GREAT CHURN 44 THE NUMBERS GAME50 THE DREAM PEDDLERS54 A DEBT END60 STRONG AND HEALTHY66 TCS: TOWARDS A DIGITAL FUTURE70 RIL: AMBANI’S BIG GAMBLE74 HDFC BANK: EYES ON FUTURE
78 SUN PHARMA: SUNBURN82 VEDANTA: ROUGH RIDE86 MOTHERSON SUMI: FAST COMPANY90 BRITANNIA INDS: A NEW RECIPE96 INDO COUNT INDS: BACK FROM THE BRINK100 INOX WIND: IT’S A BREEZE
101 METHODOLOGY: HOW WE DID IT102 THE TOP 1,000 COMPANIES140 TOTAL ASSETS: TOP 500 148 TOTAL INCOME: TOP 500 160 NET PROFIT: TOP 500172 DEBT: TOP 100176 INDEX

Page: 214-217From time to
time, you will see pagestitled “An Impact
Feature” or “Advertorial” in
Business Today. This is no different from an
advertisement and the magazine’s editorial staff
is not involved in its creation in any way.
An Feature
STAY CONNECTED WITH US ONwww.facebook.com/BusinessToday
@BT_India
businesstoda inCONTENTS
LEADERSPEAK220 IKarl-Johan PerssonCEO, H&M
218 I PEOPLEBUSINESS
32 I INTERVIEW/ Kalraj Mishra“Have launched schemes to boost MSME sector”
FOCUS
22 I TRAI-ing HardMove to penalise telcos for call drops is unlikely to make things better
24 I The Cracks Are ShowingThe RBI has taken action against two PSU banks for deteriorating asset quality. There might be more in queue
30 I Who Needs Words?As Facebook tests its reactions buttons, many predict that non-verbal communication is the future of social networks
14 I Quick takes on major events
UPFRONT
20 I Missing the TargetTax collections are falling short of expectations. This may force the government to cut expenditure
20
FEATURES
PERSONAL TECH
202 I Magic RealismVirtual Reality has existed for decades, but there’s a new sense of enthusiasm among tech giants promising a veritable new world
EX-LIBRIS212 I The Silo Effect: Why Putting Everything in its Place isn’t Such a Bright Idea: Mastering Silos; Combating Hunger and Achieving Food Security: Prescriptions for Food Security
HBR EXCLUSIVE186 I Customer data: Designing for Transparency and Trust
202


GOOD TIMES,BAD TIMESVijay Mallya, the erof Good Times, hadmixed time last fortnone hand, his F1 teaIndia had its first potaking third in the RGrand Prix. On the othe CBI raided his hoKingfisher Airline ofconnection with anIDBI Bank loan.
UPFRONT
`4,140CRORE
The amount that was finally declared as
being held abroad by the end of the
deadline of September 30 after
the new Black Money Act was enacted.
`6,100CRORE
The quantity of forex that was laundered in
the Bank of Baroda scam. The amount is expected to go up as
more banks are investigated.
IL
LU
ST
RA
TI
ON
S B
Y A
JA
Y T
HA
KU
RI
,
stwhile Kinga prettynight. On them Forcedium finish,
Russianother hand,
ouse andffices in
PLEASE SIT DOWNA new research shows that fears
about health risks of sitting for long periods may have been overstated. That comes as a big relief for all
those with sedentary jobs.
“Writers have manufactured a controversy and a protest”Says Finance Minister Arun Jaitley after over two dozen writers, poets and others have returned their Sahitya Academy and other awards, to protest against what they perceive as the growing intolerance of the government of the day.
THE $862 MILLION PINCHApple could face a fine of that amount after a US court ruled that it had infringed on an University of Wisconsin patent to speed up processors. The patent was a result of the work of two Indians – Gurinder Sohi and T.N. Vijaykumar.


CALENDAR
02 06FIGHTINGGRAFTWHAT: 6th Session ofthe Conference of theStates Parties to theUN Conventionagainst CorruptionWHEN: November 2-6, St. Petersburg, Russia
WHAT TO LOOK FOR: Will discuss issues related todealing with corruption through collaboration,including prevention of corruption, reviewingthe implementation of Convention, assetrecovery provisions and technical assistancefor members.
26 27SHARED LEARNING WHAT: Global Compact Local Networks WHEN: October 26-27, Santiago, Chile
WHAT TO LOOK FOR: A meeting for representatives of local networks within Americas to share learnings and best practices for mutual benefit.
NURSING INNOVATIONSWHAT: Start Up to Scale UpWHEN: November 9-11, Helsinki, Finland
WHAT TO LOOK FOR: A youth summit on global innovations hosted by the ministry of foreign affairs of Finland and the UNICEF. It features 500 ‘change-makers’ from around the world to advance innovations, including from UNICEF, WHO, UN Population Fund and UNAIDS.
DEBATING THE GERMAN MODELWHAT: CII’s Building Manufacturing Leadership WHEN: October 19, Mumbai
WHAT TO LOOK FOR: Discussion on how to make India the ‘Germany of the East’. Creating the leadership and the talent for global manufacturing leadership. Also, launch of an intensive programme for excellence in manufacturing by CII.
16 BUSINESS TODAY November 8 2015
TOWARDS A SUSTAINABLE PLANET WHAT: 9th UNESCO Youth ForumWHEN: October 26-28, Paris, France
WHAT TO LOOK FOR: Deliberation on sustainable development post-2015 around the theme “Young Global Citizens for a Sustainable Planet”. Simultaneously, online consultations and discussion platform will also kick off to engage the youth from around the world.
26 28
09 11


Over the years, tax collections havealways fallen short of the Union Budget estimates. This year too, the
central government is likely to mop up `50,000 crore less than the `14.5 lakh crore it had estimated in Budget 2015/16. The primary reason for the 3.5 per cent shortfall is the less-than-expected direct tax collec-tions from companies (corporate tax), indi-viduals and firms.
The government had expected a 16.5 per cent increase in overall (direct and indirect) tax collections over the revenue generated in 2014/15 in its 2015/16 budgetary projec-tions. The growth, so far, without consider-ing the additional resource mobilisation ef-forts of the finance ministry, has been just over 12 per cent. While direct tax collections till September grew 12 per cent, growth in indirect tax collections, excluding the extra
Missing the TargetTax collections are falling short of expectations. This may force the government to cut expenditure. By JOE C. MATHEW
22TRAI-ing Hard
24 PSU Banks in Trouble
16.5%Increase in overall
tax collections over the revenue
generated in 2014/15 was
expected by the government
RA
J V
ER
MA
20 BUSINESS TODAY November 8 2015

money earned from special measures such as introduction of additional excise duty on petroleum products, roll back of fiscal sops given to some sectors and hike in service tax, etc., was 12.2 per cent till August 2015. The gap narrowed because of the additional re-source mobilisation efforts, which saw over-all indirect tax collections grow 36.5 per cent, thereby, narrowing the overall tax collection gap to just five per cent of the Budget estimate.
Considering the gap between the Budget estimates and actual collections during 2014/15 was 8.7 per cent, the possibility of a five per cent shortfall in tax collections dur-ing 2015/16 might look marginal, but there are other reasons why it can be tricky.
One of the causalities of below-the-target revenue collections is a cut in the expendi-ture that gets budgeted for the year. In other words, one has to balance the government’s account book and control the overall fiscal deficit.
The moment the government realised that the actual overall tax revenues will be eight per cent lower than the Budget esti-mates of 2014/15, the actual expenditure was also revised to 6.7 per cent lower than what was budgeted for the year. If `2.27 lakh crore was the budgetary allocation for capital expenditure in Budget 2014/15, the revised numbers talked about spending `1.92 lakh crore – a cut of `46,826 crore in the central plan, and `60,240 crore in cen-tral assistance plans for states and Union Territories. The resulting fall in outlays was reflected across departments and ministries during 2014/15.
If the central government is determined to hold on to its fiscal deficit targets, gaps in the revenue targets for 2015/16 will have to be filled by rationalisation of expenditure. This has become all the more important be-cause PSU disinvestment for the current year has so far been widely off the mark. The Black Money Act, which was expected to fetch considerable one-time tax and penalty revenues for the government, has brought in just `4,147 crore, hardly sufficient to plug the `50,000 crore gap in revenue estimates in the Budget.
But, will there be a cut in expenditure? It may not happen during the current financial year, say finance ministry officials.
“In spite of 10 per cent increase in tax
devolution to the states, we have achieved over 30 per cent increase in plan capital ex-penditure. We are on course to achieving the fiscal deficit target (3.9 per cent of the GDP),” says Finance Secretary Ratan P. Watal. According to him, the government is hoping to meet its fiscal target without cutting down on expenditure because “the budgetary esti-mates, this time, has been more realistic”.
The reduction in crude oil prices and the resultant subsidy burden has also played a major role in enabling the government to keep its fiscal deficit targets intact.
In a recent press conference, top finance ministry officials were at pains to explain how infrastructure spending has picked up on the back of accelerated government spending on highways, railways and the power sector. What needs to be seen, though, is the result of what the ministry officials term as a “systematic restructuring of the expenditure” which they have been carrying out over the past one year.
The government says that it is continu-ing to rationalise central sector schemes and programmes in the run-up to the Union Budget 2016/17. If rationalisation means trimming of expenses and budgetary outlay of flagship schemes (which is what it nor-mally means), revenue collections during the first half of the financial year will hold the key to the expenditure tweaks that may hap-pen in the coming months. ~
@joecmathew
FALLING SHORTThe gap between estimates and actual tax collections is steadily rising with each passing year
Year
Budget estimate
(lakh crore)
Revised estimate
(lakh crore) ActualChange
in %
2015/16 14.5 14* N.A. -5
2014/15 13.7 12.5 N.A. -8.7
2013/14 12.4 11.6 11.4 -6.5
2012/13 10.8 10.4 10.4 -3.7
2011/12 9.3 9 8.9 -4.3
*Not official revision. Estimate from press conference of finance secretary; **Except for 2015-16 and 2014-15, % change are of budget
estimate and actual collection
November 8 2015 BUSINESS TODAY 21

22 BUSINESS TODAY November 8 2015
The Telecom Regulatory Authority ofIndia (Trai) has asked telecom compa-nies to compensate customers for call
drops from January. It has put in place amechanism under which the companies willhave to pay `1 to users per call drop. This willbe limited to three dropped calls per day.
The move has unnerved the operators andbrought relief to consumers. However, Trai’sapproach is ad hoc. It is expecting that penal-ising the companies will force them to shapeup. It is finding a solution to the call dropmenace by working on symptoms rather thanthe disease. At the heart of the problem iscongestion of telecom networks, and to someextent, shortage of spectrum with operators.For instance, the number of base stations, orBTS, installed by Indian telecom companies ismuch less compared with countries such asChina, Singapore and the UK. As per theCellular Operators Association of India, orCOAI, China Mobile, with a subscriber base of870 million, has 20 lakh BTS. In India, on anaverage, a typical telecom operator has 230million subscribers and two lakh BTS. This
means every BTS of China Mobile serves roughly 430 subscribers. For an Indian com-pany, the figure is 1,200. In the UK, Vodafone has 450 subscribers per BTS.
BTS is the antenna on the tower which is responsible for carrying out radio communi-cation between the network and phones. One tower usually has three BTS units.
The network congestion is aggravated by the fact that Indians talk more on phone than people in China, the UK and Singapore. In India, the average monthly usage is 494 minutes per subscriber as compared to China Mobile’s 429 minutes, Vodafone UK’s 194 minutes and Singapore-based Singtel’s 279 minutes.
Trai recently pointed out at a two-fold rise in call drops on 2G networks in the past one year. In June-July this year, it conducted drive tests on certain routes of Mumbai and Delhi in which it found out that the call drop rates of most companies were higher than the benchmark (which is 2 per cent).
The simplest way to decongest networks is to put up more towers, especially in densely populated areas. A Deloitte study says the number of mobile towers in India is likely to rise to over five lakh by 2020 from about four lakh at present.
The companies say that installing towers is a challenging task in India. In reply to Trai's paper on the compensation proposal, the COAI had said that despite clear Department of Telecom guidelines, state bod-ies disconnect electricity connection, seal premises and dismantle tower sites without giving prior notice.
The paper also says that in spite of strin-gent safety norms compared to several other countries, there is a lack of awareness on the electromagnetic field (EMF) radiation issue. In India, a fear of EMF emissions has led to shut-down of cell sites in several public places and residential areas.
Trai's stop-gap solution is expected to fall flat unless the key problems are dealt with. ~
@manukaushik
FOCUS Telecom
TRAI RECENTLY POINTED OUT AT A TWO-FOLD RISE
IN CALL DROPS ON 2G NETWORKS IN THE PAST ONE
YEAR.
TRAI-ing HardMove to penalise telcos for call drops is unlikely to make things better. By MANU KAUSHIK
RA
J VE
RM
A


24 BUSINESS TODAY November 8 2015
Exactly two years ago, the Reserve Bankof India (RBI) imposed lending restric-tions on Kolkata-based United Bank of
India. The reason: Its asset quality deterioratedmassively, return on assets (RoA) turned nega-tive and its capital adequacy ratio reached thebare minimum level. UBI has managed to stagea recovery of sorts but it is not out of the woodsyet. Meanwhile, the RBI has clamped down onyet another state owned bank, IndianOverseas Bank. This Chennai headquarteredbank has seen its capital adequacy plungingbelow nine per cent, NPAs ballooning to over10 per cent and return on assets taking a hit,sliding below 0.25 per cent.
The two state owned banks in questionwitnessed considerable deterioration in theirkey performance parameters when the RBItook corrective measures. Are there more skel-etons in the PSU banks’ cupboard?
“Possibly more,” says a senior privatebanker on condition of anonymity. There arealso legacy issues, according to Abizer Diwanji,National Head ( Financial Services ) at EY India.“What they (PSU banks) need urgently is afaster turnaround in their stressed assetsportfolio. They need to create better creditmanagement system and warning signals andalso a robust recovery policy,” says Diwanji.The banks who appear vulnerable includeCentral Bank of India, Dena Bank, Allahabad
Bank, Andhra Bank and Bank of India. Allahabad Bank, for instance, has a capital adequacy ratio (CAR) of only 10.22 per cent. In contrast, leading private banks, including ICICI Bank, HDFC Bank and Axis Bank, have a CAR of over 15 per cent.
The capital issue was partly addressed by the government when it announced the ‘Indradhanush’ framework for transforming PSU banks in August. On the cards is a capital infusion of `70,000 crore over the next four years. The other measures under the ‘Indradhanush’ initiative, such as appointing professional CEOs and board members, are also expected to yield results over the longer term.
In the short run, banks have no option but to preserve capital and arrest NPAs. The bad loans in the system have jumped from 2.36 per cent four years ago to a high of 4.62 per cent. Similarly, restructured assets have grown to 6.44 per cent. Together, the total stressed as-sets in the system (NPAs and restructured portfolio) have reached 11 per cent of the total advances. “There are also no robust systems for screening of projects, their viability, indus-try trends and also promoters’ background check,” says another banker.
In fact, the RBI has taken a number of steps to address the problem including early detection of stress, encouraging sale of NPAs by banks to Asset Reconstruction Companies (ARCs), strategic debt conversion into equity, joint lenders’ forum etc. “Our ways of dealing with distress have been very, very slow , murky and to some extent unfair. We have taken some steps, but government is probably taking bigger steps by bringing the bank-ruptcy code. If that happens, we have a proper system of redress,” RBI Governor Raghuram Rajan told Business Today in an exclusive in-terview last month.
The present state of affairs gives the gov-ernment another reason to push ahead with consolidation in the PSU banking space by merging smaller banks with larger entities. ~
@anandadhikari
FOCUS Banking
IN THE SHORT TERM, BANKS
HAVE NO OPTION BUT TO
PRESERVE CAPITAL AND
ARREST NPAS... THE RBI HAS
TAKEN STEPS TO ADDRESS THE
PROBLEM
The Cracks Are ShowingThe RBI has taken action against two PSU banks for deteriorating asset quality. There might be more in queue. By ANAND ADHIKARI
AJ
AY
TH
AK
UR
I


Admit it. Haven’t you often pressed Like or Favourite buttons on Facebook or Twitter because you were too lazy to write a comment? Long form may be trending in
traditional media, but on social networks, brevity rules. Soon, we may move to wordless communication going by the amount of investment social platforms are making in developing emoticons.
Coming soon on Facebook is ‘reac-tions’, which will give you an option of six different responses to a post – like, love, haha, yay, wow, sad and anger. It is be-ing tried in Ireland and Spain to start with before it is rolled out in other countries.
But Facebook is rather late to the non-verbal party. Chat apps such as Line,
SOCIAL UNIVERSE
Who NeedsWords?
WHAT’S TRENDING
As Facebook tests its reactions buttons, many predict that non-verbal communication is the future of social networks.By CHITRA NARAYANAN
30 BUSINESS TODAY November 8 2015
A Daily ObsessionInstant messaging use is on the rise globally. A study by TNS fi nds that over three out of fi ve Internet users (61 per cent) in APAC are now using instant messaging every day, whereas only 43 per cent of users in the geography use social networks every day. Facebook and Moments (WeChat) are the two top used platforms in APAC
Global APAC China India
*IM: Instant messaging; Source: TNS study Connected Life
DAILY IM* USE
DIGITAL DASHBOARD
55%
61%69
%
38% 48
%
43%
41%
38%
DAILY SOCIAL NETWORK USE

W e C h a t , W h a t s A p p , N i m b u z z a n d H i k e Messenger have stolen a march when it comes to emoticons and stickers. Says Vikas Saxena, CEO, Nimbuzz: “Around three to four years ago, when emojis became available, almost all peer-to-peer chat networks began using them to make communication more expressive.”
Gradually, the chat apps began working on taking emojis a step fur-ther, and stickers were born. Today, there are thousands of free stickers that users can download from stores. There are paid stickers as well – yes, users in Japan, Korea and the Middle East actually don’t mind paying for stickers that use cult characters. And now, brands are joining the party by pushing their products through the sticker option. For instance, on Nimbuzz, if you type Good Morning, an image of Kellogg’s cereals pops up as a sticker option.
The chat apps are really pushing the boundary on emoticon usage. Nimbuzz’ Saxena describes how users just need to type a word and the app suggests a suitable emoticon, saving the user the bother of searching through hundreds of options.
Hike Messenger, launched by Airtel founder Sunil Mittal’s son Kavin Bharti Mittal, has a similar sticker sug-
gestion tool. It offers over 5,000 stickers in 30 local Indian lan-guages bucketed into 25 categories. Obviously it’s going to be tough for users to search through the library. So, version
4.0 of the app recommends stickers based on what users are typing, mak-ing discovery easier.
The way we use emoticons on chat apps today, many predict that we are witnessing the birth of a new language. Says Kavin Mittal: “Messaging is undergoing a profound transformation... It’s becoming clear that it’s hard to go back to simple text once you have witnessed the deep emotion through which one can converse using stickers.”
Last year, two Britons, Matt Gray and Tom Scott, in fact, set up an in-stant messaging network called emoj.li whereby users could communicate only through emojis. Over 60,000 people downloaded the app, but today the site is closed, with a message posted on the home page that it was set up as a joke!
But with YouTube offering tutori-als on how to make your own stickers for WhatsApp and other chat apps, the joke may well turn into reality! ~
@ndcnn
LISTENING POST
Curated Moments Twitter’s standing as a breaking news source has been enhanced with the launch of Moments, feel experts. The recently launched feature enables users to see a curated selection of tweets in a single tap. The microblogging network has been plagued by fl at user growth and high churn rates. According to GlobalWebIn-dex’s social statistics, Twitter users are mainly passive and use the platform to consume news and check out trending topics rather than interact or engage. Moments, which can be accessed through a lightning bolt tab in the centre of the twitter app, will bring effi ciency in the process of discovering news. On the other hand, the ini-tial feedback is one of outrage at the ‘pesky notifi cation’. It's hard to please everyone!
Unlimited VacationProfessional networking fi rm LinkedIn joins a brave legion of companies to offer its employees an open-ended vacation policy. Under its new “discretionary time off” policy, employees no longer have a minimum or maximum amount of vacation time. Instead, they can decide when and how much time they want off. In a blog post, LinkedIn Vice President Pat Wadors said: “The concept is intended to help employees stay engaged, reduce burnout and is part of a growing movement to place more focus on results and empowerment, not hours worked. Is the company taking a risk? Not really, if you go by the statistics on vacations taken – most employees barely avail 50 per cent of their eligible time off anyway.
November 8 2015 BUSINESS TODAY 31
TOP THREE SOCIAL NETWORKS (DAILY USE BY ALL INTERNET USERS)
TOP THREE IM* PLATFORMS (DAILY USE BY ALL INTERNET USERS)
Global
APAC
China
India
30% 29%
33% 48%
49% 69%
51% 56%
20% 17%
25% 40%
37% 60%
3% 28%
15% 15%
16% 9%
21% 6%
1% 4%
Snapchat
QQ Space
Yahoo! Messenger
WhatsApp FB Messenger Weibo Sina UC

32 BUSINESS TODAY November 8 2015
“Have launched schemes to boost
MSME sector”
VI
VA
N M
EH
RA
INTERVIEW Kalraj Mishra

The National Democratic Alliance (NDA) gov-ernment at the Centre has put a lot of empha-sis on privately-owned small businesses and are trying to introduce new schemes and programmes to help and assist entrepreneurs. Union Minister for Micro, Small and Medium Enterprises KALRAJ MISHRA tells Business Today’s ANILESH S. MAHAJAN why this sector remains at the core of Prime Minister Narendra Modi’s Make In India initiative and
how it could change the employment landscape of India over the next few years. Excerpts:
Time and again, Prime Minister Narendra Modi has talked about the need to create more jobs, and the role of MSMEs in achieving this goal. After more than a year in office how far have you succeeded in overcom-ing the hurdles?
The most common complaints from entrepreneurs have been limited access to capital, power, and delays in clear-ances related to pollution, environment, labour, etc. We were aware of these problems and have devised several schemes and programmes to address such issues, including the credit, infrastructure, technology and marketing needs of start-ups. Some of the important steps we have taken in the last one year include the launch of several schemes such as the Credit Guarantee Scheme (CGS), Credit-linked Capital Subsidy Scheme (CLCSS), Cluster Development Programme (CDP) and the National Manufacturing Competitiveness Programme (NMCP). We are also talking to various stakeholders, including other central ministries, state governments, and private and public banks, to streamline the mechanism of granting loans, and simplify-ing labour laws and other related procedures to facilitate the setting up of these small businesses.
What is the objective of the Credit Guarantee Fund Trust (CGFT) established by the MSME ministry? How can a small entrepreneur get the benefit?
Availability of bank credit without the hassles of collaterals and third-party guarantees is a major step towards sup-porting first-generation entrepreneurs and help them re-alise their dreams of setting up a business of their own. The CGS strengthens the credit delivery system and facilitates flow of credit to the MSME sector. To operationalise the scheme, we, along with Small Industries Development Bank of India (SIDBI), set up the Credit Guarantee Fund Trust for Micro and Small Enterprises (CGTMSE). For obtain-ing a collateral-free loan, new or existing MSMEs engaged in the manufacturing and services sectors – excluding re-tail trade, educational institutions, agriculture, self-help groups, and training institutions – should approach banks or other financial institutions that are member lending
institutions (MLIs) of CGTMSE. The MLIs will use their com-mercial discretion and after due diligence would say whether a proposal is viable or not. Thereafter, they can seek guarantee cover from the CGTMSE and if the proposal satisfies the basic norms laid down under the CGS, the CGTMSE will extend the cover.
In the last Budget, Finance Minister Arun Jaitley had introduced the National Infrastructure Investment Fund (NIIF) with a mandate to invest in equities of infrastructure companies. Can we see a similar fund to give equity support to MSMEs?
SIDBI has launched the Make in India Soft Loan Fund for Micro, Small and Medium Enterprises (SMILE) on August 18, 2015. The objective of the scheme is to provide soft loans, in the nature of quasi-equity, and term loans on relatively soft terms to MSMEs to meet the required debt-equity ratio for establishment of an MSME and for pursuing opportunities for growth of existing MSMEs.
Experts say social sector schemes, such as the Mahatma Gandhi National Rural Employment Guarantee Scheme (MNREGS), should be extended to SMEs, especially those in the rural sector or catering to the rural sector. What are your thoughts?
There are no such plans at the government level. The Ministry of Rural Development is working on MNREGS. If they ask for our inputs we will give. At present, the scheme does not allow spending for the MSME segment.
What have you done to encourage agri-based busi-nesses. How will food parks benefit MSMEs?
We have started two programmes to encourage agro-based entrepreneurs – ASPIRE (A Scheme for Promotion of Innovation, Rural Industry and Entrepreneurship) and PMEGP (Prime Minister’s Employment Generation Programme). ASPIRE was launched in March to set up a network of technology centres and incubation centres to accelerate entrepreneurship and to promote start-ups for innovation and entrepreneurship in agro-industry, with a total outlay of `210 crore. It envisages setting up of liveli-hood business incubators, technology business incubators and assists start-ups by giving credit through the fund of funds managed by SIDBI for agri-based food parks.
PMEGP is a major credit-linked subsidy programme implemented by the MSME ministry. It is aimed at generat-ing self-employment opportunities through establishment of micro-enterprises in the non-farm sector by helping traditional artisans and unemployed youth. General cat-egory beneficiaries can get margin money subsidy of 25 per cent of the project cost in rural areas and 15 per cent in urban areas. For beneficiaries of special categories,
November 8 2015 BUSINESS TODAY 33

such as scheduled caste, scheduled tribe, and women, themargin money subsidy is 35 per cent in rural areas and25 per cent in urban areas. The maximum cost of projectsis `25 lakh in the manufacturing sector and `10 lakh inthe services sector.
What is the ministry doing to encourage India’straditional cottage industries?
The ministry’s SFURTI (Scheme of Fund for Regenerationof Traditional Industries) scheme is aimed at enhancingcompetitiveness of traditional khadi and village industries,including cottage industries, through replacement ofequipment, providing them with common facilities, prod-uct development, and other support services. It alsostrengthens cluster governance fortheir sustainability. It was launchedin 2005/06. The scheme has nowbeen revamped and from June and 13clusters have been accorded in-prin-ciple approval, while 17 clusters havegot final approval.
The ministry has skill mappedover 600 districts in India. Whatis the objective? How will this helpsmall entrepreneurs?
The objective behind skill mapping of640 districts across 36 states andUnion Territories is to develop a da-tabase on the industry clusters, prod-ucts of these clusters, skill develop-ment needs according to the prod-ucts manufactured, the name ofsuggested training programmes, in-cluding duration, number of institu-tions capable of giving that trainingin the area, the training capacity ofthese training institutes annually,total capacity of clusters to give em-ployment to trained persons, list of engineering colleges,polytechnics, ITIs both in government and private sector,and courses, intake capacity and machinery available.Small entrepreneurs can plan their requirements forskilled manpower and the training provider can organiseskill development programmes. This will ensure avail-ability of skilled personnel in the small scale sector at thedistrict level.
Is the ministry tying up with any private organisa-tion to use this skill map?
We are working on it. Currently, industry associations arevetting skill mapping data.
Is the ministry planning any initiative to increase skill development activities?
We are conducting skill development programmes for the entire value chain of manufacturing, starting from village industries to state-of-the-art manufacturing sec-tors, such as engineering and auto components, among several others. We have set a target of training 1.5 crore youth by 2022. During 2014/15, we have trained 8.37 lakh persons. The 18 tool rooms and technology devel-opment centres under the ministry are providing both long- and short-term training to more than one lakh youth at present. However, the present training capac-ity is much less than that required for making our MSMEs globally competitive. Fifteen new tool rooms are
being set up with assistance from World Bank during the 12th Five Year Plan.
What steps has the ministry taken to make it easier for small entre-preneurs to operate?
We are implementing a number of schemes and programmes for the benefit of the MSME sector and facili-tating the promotion and develop-ment by giving access to credit, infra-structure development and technol-ogy upgradation, etc. Apart from the major schemes mentioned earlier, the Prime Minister’s Employment Gene-ration Programme is also key to the ministry's scheme of things. We have recently launched a web portal Digital Employment Exchange for industries. We have also launched various schemes for promotion of innovation, entrepreneurship and to provide help for the agro industry.
For ease of doing business, the requirements for micro, small and medium enterprises is very different from other large enterprises. Land, municipal services and building permissions are pri-marily state subjects. Registration of an enterprise through Entrepreneur Memorandum I (intention to set up) and Entrepreneur Memorandum II (actual com-mencement) was seen as a cumbersome process. We have tried to replace it with the Udyog Aadhaar Form, a one-page on-line filing system. This has also been suggested by various expert panels, including the K.V. Kamath Committee, that was appointed by the govern-ment recently. ~
@anileshmahajan
34 BUSINESS TODAY November 8 2015
INTERVIEW Kalraj Mishra
“The SFURTI scheme is aimed at enhancing competitiveness of traditional khadi and village industries”


INDIA’S MOST VALUABLE COMPANIES
HOW THE TOP 10 HAVE FARED IN THE PAST 2015 2005 1995
TATA CONSULTANCY SERVICES 1 2 RELIANCE INDUSTRIES 2 1 1HDFC BANK 3 12 ITC 4 6 4
OIL & NATURAL GAS CORPN.* 5 COAL INDIA 6 INFOSYS 7 3 199
SUN PHARMACEUTICAL INDS. 8 24 196
STATE BANK OF INDIA* 9 HDFC 10 9 22*PSUs were ranked separately before 2011
EBB AND
FLOW

November 8 2015 BUSINESS TODAY 39
Half of the heavyweights have slipped out of the Top 10 in the past
decade. Several more from the decade before... By RAJEEV DUBEYThe Great Churn
INDIAN OILCORPN.
RELIANCE
INDUSTRIES
BHARAT
PETROLEUM CORPN.
HINDUSTAN
PETROLEUM CORPN.
ESSAR OIL
OIL & NATURAL
GAS CORPN.
NTPC
TATA CONSULTANCY
SERVICES
TOP 10 BY
TOTAL INCOME*5,04,337.14
5,43,959.6-7.3
3,49,535
4,10,349
-14.8
2,56,136.81
2,72,662.72-6.1
2,20,972.21
2,34,952.39
94,253.06
1,08,389.47-13.0
92,527.83
95,176.55-2.8
78,376.79
75,724
3.5
78,082.95
68,540.413.9
MANGALORE
REFINERY
& PETROCHEMICALS
63,298.19
75,683.63-16
2014/15 2013/14 GROWTH (%)
*Figures in ` crore Standalone DataThe list excludes BFSI Companies; Source: CMIE Prowess
-6.0
BHARTIAIRTEL
60,811.5
50,910.3
19.4
The old order changeth, yielding place to new…! If it wasn’t for Victorian poet Alfred Lord Tennyson’s soulful reference to life after the mythical King Arthur, it would be equally apt for India Inc. The history of corporate India is one of tireless change. Nowhere does it reflect better than in the annual rankings of corporate performance – the BT 500.
This listing of India’s largest companies by average market capitalisation over the past six
months remains the country’s most authentic barometer of swinging fortunes in India Inc.; of how the stock market rewards performance – and penalises the laggards.
In today’s competitive world, companies need a lot more than just status quo to be in the reckoning. Reputation can be fragile and the podium can be slippery, as evident from the BT 500 ranking over the years. In fact, ground reality can be painfully bitter at times. Only five of this year’s top 10 figured here have survived the past decade to retain their place in the Top 10 since the 2005 ranking. These are: Reliance Industries, TCS, ITC, Infosys and HDFC. Tata Consultancy Services was always a bellwether stock.
The No. 5 of 2005, Bharti Tele-Ventures (now called Bharti Airtel) made the $10.7 billion acquisition of Zain’s African telecom business but is still to digest it; Hindustan Unilever continues to experience growth pangs as innova-tion dried to a trickle; ICICI Bank sacrificed growth to con-solidate its skewed balance sheet and runaway NPAs under the new CEO Chanda Kochhar; and, Tata Steel, which is struggling to digest and revive its $7.6 billion acquisition of British steel maker Corus.

40 BUSINESS TODAY November 8 2015
“Commodity and real estate companies have been af-fected by market conditions. Infrastructure companies have suffered from regulatory and court-related problems,” says Motilal Oswal, Chairman and Managing Director, Motilal Financial Services and Motilal Oswal Securities.
But this decade was about TCS breaking away from the quartet of Indian IT services majors (TCS, Infosys, Wipro and Satyam), having spent several years joined at the hip with these firms. As TCS upped the ante by making a swift transition from geography-based strategic business units (SBUs) to sector-based SBUs, it kept widening the gap, while its peers struggled. Interestingly, there was a time back in 2005 when, on November 11, to be precise, Nandan Nilekani-led Infosys had overtaken TCS to be the second most valuable company in India after Reliance Industries. But that was just that, a momentary surge for Infosys. Since then, Infosys has slipped to No.7 and Wipro slipped out of the Top 10 between 2005 and 2015.
Consider the economic context in which this massive churn was taking place: The world had gone through a once-in-a-lifetime event in the Lehman crisis that crippled the American banking system and sent a majority of global economies into shivers of recession and slowdown for more
than half a decade. As a result, the global economy went through one of the biggest commodity boom and bust cycles where oil prices, for instance, rose to the peak of $145 per barrel before crashing to a low of $44 per barrel. Europe continues to struggle on the path of recovery and weaker European economies faced an unprecedented sovereign debt crisis, dragging down richer European economies. “These have been the most trying years for the world economy,” says Ajit Ranade, Chief Economist, Aditya Birla group.
But this was also a decade of excesses and a never-be-fore opportunity to create wealth. Between 2005 and 2015 rankings, the total market capitalisation of BT 500 companies shot up nearly eight times from `12.52 lakh crore to `95.29 lakh crore, adding over `83 lakh crore of wealth in these 10 years (in the previous decade up to 1995, the total market capitalisation of BT 500 companies grew just four times).
But while the BT 500 market capitalisation shot through nearly 800 per cent between 2005 and 2015, India’s GDP rose only 358 per cent during the same period. Government of India’s gross receipts grew 335 per cent and gross expenditure went up 337 per cent.
INDIA’S MOST VALUABLE COMPANIES
TOP 10 BY TOTAL ASSETS (` CRORE)
COMPANY 2014/15 2013/14 GROWTH (IN %)
RELIANCE INDUSTRIES 3,98,064 3,67,744 8.2
OIL & NATURAL GAS CORPN. 2,37,603.81 2,37,197.69 0.17
INDIAN OIL CORPN. 2,31,311.55 2,61,170.82 -11.43
NTPC 2,10,832.45 1,92,005.76 9.81
POWER GRID CORPN. OF INDIA 1,66,998.55 1,46,332.09 14.12
BHARTI AIRTEL 1,43,886.1 1,12,034.8 28.43
TATA STEEL 1,17,368.46 1,12,622.43 4.21
STEEL AUTHORITY OF INDIA 1,01,699.27 93,695.94 8.54
LARSEN & TOUBRO 89,596.96 80,964.48 10.66
VEDANTA 81,524.33 86,718.59 -5.99
The list excludes BFSI Companies Standalone Data; Source: CMIE Prowess
TOP 10 MARKET CAP GAINERS (` CRORE)
COMPANY APR-SEPT APR-SEPT ABSOLUTE 2015 2014 CHANGE
SUN PHARMACEUTICAL INDS. 2,18,277.68 1,45,869.38 72,408.30
HDFC BANK 2,61,464.66 1,94,848.72 66,615.94
KOTAK MAHINDRA BANK 1,23,126.74 70,667.28 52,459.46
INFOSYS 2,40,493.92 1,91,877.05 48,616.87
HINDUSTAN UNILEVER 1,88,159.54 1,40,181.48 47,978.06
MARUTI SUZUKI INDIA 1,21,336.58 74,485.38 46,851.20
AXIS BANK 1,30,353.23 86,971.73 43,381.50
HDFC 1,96,535.82 1,53,742.1 42,793.72
TATA CONSULTANCY SERVICES 5,01,476.13 4,63,202.86 38,273.27
LUPIN 81,596.67 49,147.29 32,449.38
TOP 10 BY NET PROFIT
22,4
01
RELIANCE INDUSTRIES
TCS ONGC COAL INDIA
BHARTI AIRTEL
21,9
84
18,7
50
18,4
75
17,7
3322
,095
13,3
8315
,009
13,2
826,
540
WIPRO
8,19
87,
387
-19.7 -10.81.9 1.5 103.1
INFOSYS NTPC ITC
12,16
410
,194
10,3
1910
,975
9,63
88,
814
-6.019.3 9.4
2014/15 2013/14 GROWTH (%)
Net profi t in ` crore; The list excludes BFSI Companies; Standalone Data; Source: CMIE Prowess
10.9
HINDUSTAN ZINC
8,13
96,
905
17.9


42 BUSINESS TODAY November 8 2015
A majority of this wealth has been created by techcompanies such as TCS (whose market cap has gone up from `62,463 crore to `5.01 lakh crore and Infosys (from `60,000 crore to `2.4 lakh crore). Also, banking giants SBI (`2 lakh crore) and HDFC Bank (`2.61 lakh crore), which have risen to the Top 10. Or, for that matter, newly listed firms such as Coal India (`2.41 lakh crore) whose stock was not being traded a decade ago.
Ranade says the Lehman crisis worked to the advan-tage of PSU banks such as SBI. “General public transferred their cash from private banks to PSU banks fearing a Lehman-like impact in India,” he says. “However, HDFC Bank wasn’t affected because of strategic management and capability. It also had the most balanced portfolio between retail and corporate customers.”
Now, that was about the changes in the past decade. Look back the decade before 1995, and the 2015 list is down to just two survivors: Reliance Industries and ITC. Guess who slipped out of the Top 10 as others set a scorch-ing pace of topline growth and stock market valuation: It’s the legendary FMCG major Hindustan Unilever, which was at No.2 two decades ago; Tata Steel; engineering giant Larsen & Toubro; Tata Motors (earlier called Telco), which hasn’t produced a winner in the marketplace in a long time; Bajaj Auto, which made the fatal mistake of exiting the scooters business (where it was the market leader) that now accounts for over 60 per cent of several urban markets and over 20 per cent of the entire two-wheeler industry. Bajaj continues to ignore the segment and has no offering for the customer; Colgate-Palmolive; Hindalco and Grasim.
Inarguably, the 2025 list will be dramatically different from this year’s. It could well be the decade of tech or tech-enabled businesses rather than the brick-and-mortar heroes of the past. “Technology has definitely taken over. Those who have been able to transition to technology are faring better,” says Oswal. Listed Flipkart or Snapdeal could find themselves up there, or the fast-growing and highly-profitable IndiGo, which is preparing for a listing soon. Not to forget an Ola or OYO! ~
@rajeevdubey
MOTILAL OSWAL, Chairman and Managing Director, Motilal Financial Services and Motilal Oswal Securities
“Technology has defi nitely taken over. Those who have been able to transition to technology are faring better.”
MARKET CAP TO SALES RATIO AVG M CAP* TOTAL INCOME M CAP TO SALES RATIO
COMPANY Apr-Sept Apr-Sept 2014/15 2013/14 2015 2014
2015 2014
WESTLIFE DEVELOPMENT ^^ 4,444.1 5,299.6 3.5 4.6 1,255.4 1144.6
GREENCREST FINANCIAL SERVICES 2,417.9 1,563.9 3.6 1.7 671.7 904.0
ADANI TRANSMISSION 3,456.6 NA 23.8 0.0 145.1 NA
BAJAJ FINSERV 26,022.0 14,755.0 211.7 157.3 122.9 93.8
BF UTILITIES ** 2,215.8 2,488.7 25.2 29.7 88.0 83.7
SUN PHARMACEUTICAL INDS. ^^ 2,18,277.7 1,45,869.4 3173.7 2789.3 68.8 52.3
NETWORK18 MEDIA & INVST. 5,690.9 5,038.3 86.7 175.0 65.6 28.8
SUN PHARMA ADVANCED RESEARCH CO. 9,622.3 4,033.5 158.8 177.0 60.6 22.8
IIFL HOLDINGS 5,720.2 3,584.1 110.1 88.7 52.0 40.4
HMT 5,050.6 4,561.0 97.3 412.9 51.9 11.0
^^ 12 months ended March 2014; ** 12 months ended September 2014; *Average market capitalisation in `crore; total income in `crore; Standalone Data; Source: CMIE Prowess
INDIA’S MOST VALUABLE COMPANIES
AJIT RANADE, Chief Economist, Aditya Birla group
“These have been the most trying years for the world economy”
RA
CH
IT
GO
SW
AM
I


The NumbersGame2,7
5,890
2,51,4
88
2,79,5
82
2,84,1
42
5,76,8
10
5,76,8
99
4,27,8
18
4,53,2
42 7,95,2
56 1,25,2
874
1996
1997
1998
1999
2000
2001
2002
2003
2004
2005
Discernible trends from an analysis of BT500 data
SOARING VALUATIONS The market value of BT500 companies has risen substantially over the previous year
Research by: Niti Kiran
Graphic by: Anand Sinha
From 1993 to 1996, market value of the fi nancial year ending March was used | From 1997 to 2001, average market capitalisation between April 1 and March 31 was used | Since 2002, average
SECTORAL WINNERSRank Company Mcap*2015
1 19 Tata Motors 1,22,785
2 20 Maruti Suzuki India 1,21,337
3 26 M&M 77,630
4 29 Bosch 72,238
5 32 Bajaj Auto 66,897
*Average Mcap (in `cr) for Apr-Sept 2015
Rank Company Mcap*2015
1 3 HDFC Bank 2,61,465
2 9 State Bank Of India 2,00,169
3 10 HDFC 1,96,536
4 12 ICICI Bank 1,74,852
5 17 Axis Bank 1,30,353
Rank Company Mcap*2015
1 4 ITC 2,57,369
2 11 Hindustan Unilever 1,88,160
3 35 Nestle India 61,438
4 40 United Spirits 50,412
5 44 Dabur India 48,681
Auto
& An
cillar
ies
BFSI FMCG
INDIA’S MOST VALUABLE COMPANIES FINE PRINT

20,75
,824
31,95
,230
33,22
,819
31,13,
436 43
,73,85
3
62,17
,132
58,10
,261
61,28
,017
83,00
,601 95
,29,
373
2006
2007
2008
2009
2010
2011
2012
2013
2014
2015
market capitalisation between April 1 and September 30 is being used to calculate the total | Before 2011, state-run companies were listed separately
Rank Company Mcap* 2015
1 14 Larsen & Toubro 1,57,656
2 72 Bharat Electronics 27,353
3 159 Voltas 9,923
4 180 IRB Infra. Developers 8,297
5 188 GMR Infra. 7,544
Rank Company Mcap* 2015
1 1 TCS 5,01,476
2 7 Infosys 2,40,494
3 15 Wipro 1,39,264
4 16 HCL Technologies 1,32,191
5 38 Tech Mahindra 53,771
Rank Company Mcap* 2015
1 6 Coal India 2,41,897
2 31 Hindustan Zinc 66,904
3 47 NMDC 45,576
4 68 Tata Steel 28,248
5 86 SAIL 25,334
Infrastructure & Engineering IT & ITES Mining & Metals

SECTORAL WINNERS
DIPPING CASH RESERVESThe companies are leveragingtheir cash reserves to runbusiness operations
RANK RANK COMPANY2015 2014
366 877 Indo Count Inds.
463 825 Caplin Point Lab.
467 794 TVS Srichakra
416 739 Eveready Indus. (India)
332 648 Ricoh India
RANK RANK COMPANY2015 2014
433 243 Jaypee Infratech
481 289 CCL International
384 190 Unitech
323 112 JP Associates
425 208 JP Power Ventures
FAVOURED SECTORSThe leading sectors by market cap
TOP GAINERS & LOSERS
Cash in `crore; Ex-BFSI companiesStandalone data
2010/
11
2011/
12
2012/
13
2013/
14
2014/
15
3,07,7
01
3,21,9
60
3,34,1
71
3,27,7
22
3,11,5
10
BFSI IT & ITES Oil & Gas FMCG Auto & Ancillaries
20151992
35
30
25
20
15
10
5
0
The figures (in %) for each sector are a percentage of total BT 500 market cap
Rank Company Mcap*2015
1 2 Reliance Industries 2,97,742
2 5 ONGC 2,45,899
3 22 Indian Oil Corpn. 93,781
4 34 Bharat Petroleum 61,594
5 48 GAIL (India) 45,315
*Average Mcap (in `cr) for Apr-Sept 2015
Rank Company Mcap*2015
1 8 Sun Pharma Inds. 2,18,278
2 23 Lupin 81,597
3 33 Dr. Reddy'S Lab. 64,059
4 39 Cipla 53,044
5 50 Aurobindo Pharma 41,216
Rank Company Mcap*2015
1 21 NTPC 1,11,620
2 28 Power Grid Corpn. 72,897
3 101 NHPC 20,725
4 103 Tata Power Co. 19,221
5 115 JSW Energy 15,811
Oil&G
as
Pharma & Healthcare Power
Source: CMIE Prowess
INDIA’S MOSTVALUABLE COMPANIES FINE PRINT


SECTORAL WINNERS
SITTING ON THE FENCEForeign institutional investors have raised stake in 17 per cent of BT 500companies and shed stake in another 18 per cent
UNDERVALUED COMPANIESAround 15 per cent of BT 500 companies are trading at significant discount to their book values
Sep-14 Jun-15
FII FII Change*Company share share
Hathway Cable & Datacom 32.96 14.54 -18.42
KPIT Technologies 45.81 29.16 -16.65
Amtek Auto 32.56 18.83 -13.73
Magma Fincorp 29.49 17.33 -12.16
Pidilite Industries 15.92 5.79 -10.13
V-Guard Industries 18.97 8.84 -10.13
Aban
Offsh
ore
Adan
i Ent
erpr
ises
Allah
abad
Bank
Amte
k Aut
o
Andh
raBa
nk
Bank
OfBa
roda
Bank
OfInd
ia
Bank
OfMa
hara
shtra
Bom
bay R
ayon
Fash
ions
506.
97
94.0
9
203.
54
233.
66
152.
25
180.
91
66.8
8
195.
46
384.
83
237.7
86 78.45
43.9
70.3
176.8
34.4
151.3143.9
Closing Price BV per Share Data as on Oct 12, 2015
Rank Company Mcap*2015
1 98 DLF 21,812
2 146 NBCC 10,874
3 168 Oberoi Realty 9,093
4 174 Prestige Estates Proj. 8,932
5 236 Godrej Properties 5,388
*Average Mcap (in `cr) for Apr-Sept 2015
Rank Company Mcap*2015
1 13 Bharti Airtel 1,58,666
2 25 Bharti Infratel 79,750
3 36 Idea Cellular 61,137
4 113 Reliance Com. 15,883
5 133 Tata Com. 12,215
Rank Company Mcap*2015
1 245 Kaveri Seed Co. 5,064
2 251 Monsanto India 4,941
3 264 Advanta 4,572
4 295 KRBL 4,010
5 325 Bombay Burmah 3,417
Real
estat
e
Telecom Agriculture & Allied
Sep-14 Jun-15
FII FII Change*Company share share
Eveready Industries (India) 3.43 16.29 12.86
Just Dial 26.64 38.7 12.06
Ashiana Housing 3.27 12.54 9.27
Marksans Pharma 7.31 14.54 7.23
Bharti Infratel 17.1 24.3 7.2
Motilal Oswal Financial Services 5.58 12.44 6.86
Source: CMIE Prowess
*In percentage points
INDIA’S MOSTVALUABLE COMPANIES FINE PRINT


INDIA’S MOST VALUABLE COMPANIES INFO TECH
IL
LU
ST
RA
TI
ON
BY
: R
AJ V
ER
MA

November 8 2015 BUSINESS TODAY 51
Indian software companiesmay not be reporting the 25to 30 per cent growth ratesthey had witnessed a fewyears ago and probably willnever again but they are stillmaking rapid strides on theback of innovation, improvedrevenue productivity and byinvesting heavily in technol-
ogy such as automation and theInternet of Things (IoT).
L o b b y g r o u p N a t i o n a lAssociation of Software and ServicesCompanies (NASSCOM) estimates thatthe Indian IT industry is worth $146billion, including exports of $98 bil-lion, in 2014/15 clocking year-on-year growth of 13 per cent. In2015/16 it is expected to grow be-tween 12 and 14 per cent. According
to B.V.R. Mohan Reddy, founder andExecutive Chairman, Cyient, an ITservices provider for the engineeringand aerospace industries, though thecurrent growth rate looks a little bittepid compared to what it was fiveyears ago, it is coming on a signifi-cantly larger base and amid challeng-ing market conditions. NASSCOM saysthe industry wouldtouch $225 billion by2020 and $350 billionby 2025.
Reddy, who is alsot h e C h a i r m a n o fNASSCOM, says IT com-panies are fast adaptingto the changing marketneeds and tappingnewer segments to stayahead of the curve. The
pack is being led by Tata Consultancy Services, Infosys, Wipro, Cognizant, HCL and Tech Mahindra.
The move of global IT majors to-wards automation, cloud, digital and software as a service (SaaS), was seen as a threat to the Indian IT services industry. However, the Indian com-panies were quick to react and have
invested substantially on innovation, building intellectual property, platforms, and using artificial intelligence (AI) and automation to deliver value. And now they are evolving more as solutions providers to ensure business out-comes, moving out of the shadows of the lift-
The Indian information technology services industry is investing in innovation, reskilling
and automation to adapt to a changing marketplace. By VENKATESHA BABU
NASSCOM SAYS THE IT SECTOR WOULD TOUCH $225 BILLION BY 2020 AND $350 BILLION BY 2025
TheDreamPeddlers

52 BUSINESS TODAY November 8 2015
and-shift model taking and executing orders atlower cost.
For instance, India’s largest IT services ex-porter TCS unveiled its AI platform ‘Ignio’ in June2015 as a standalone product, as well as a bun-dled offering with its other services. The secondlargest player Infosys unveiled ‘Aikido’, its um-brella offering in August. It would encompassdesign thinking, platforms and knowledge-basedIT services. Similar initiatives have been under-taken by most companies, big and small, in theIndian IT industry.
Indian technology companies have so farbeen compared to ducks floating on waterwhile the surface may seem calm they are pedal-ling furiously to glide smoothly. “Indian compa-nies are now changing tremendously to adapt tochallenges happening due to marketplace shifts
and changing needs of customers. I am confidentthat the Indian IT sector has the talent and ex-pertise to continue innovating and deliveringvalue,” says Reddy.
Sudin Apte, Research Director and CEO of ITservices advisory firm Offshore Insights, how-ever, is not quite sure. “The Indian IT sectormight grow in high single digits for the nextthree to five years. While the smart ones are in-
vesting and moving ahead of the curve, there is considerable pain for others. In NASSCOM’s top 50 Indian companies there are several who have no reason to exist. We will not see too many mergers and acquisitions as promoters will cling on for various reasons. Several of them are me-too companies,” says Apte, adding that Indian IT’s cost advantage has eroded and five of the top 10 IT employers in India today are multination-als including IBM, Accenture and Capgemini.
Apte further argues that delinking head-count growth from revenue growth was forced on Indian firms by clients demanding automa-tion in areas such as application maintenance, testing and infrastructure management. “TCS might have employed 300,000 people to get to $13 billion in size. The next 50 per cent growth on their current base, that is, to reach $20 billion in revenues, they may add just one-third of that number of people.”
Reddy agrees: “If it took 3.1 million employ-ees to generate $100 billion revenues for the industry, NASSCOM estimates that the next $100 billion is likely to take only 1.8 million.” He, however, adds that fears that Indian IT will not be able to sustain growth are uncalled for. “I have heard it before. We were told that after the Y2K work, it was the end of the road for us. After the dot-com bust in 2001 we were told the same thing. During the global economic meltdown in 2008, similar stuff was said. Indian IT is mature, innovative and delivers true value. This is why we expect it to continue to grow.”
The results of anticipating marketplace shifts and investing ahead of the curve are seen in the results of the likes of TCS and Cognizant, which have grown faster than their peers.
Says Sanchit Vir Gogia, CEO, Greyhound Research, another IT research and advisory firm: “While we might churn out lakhs of engi-neers every year, most of them are unemploy-able. Shifts in technology landscape means that even existing employees need to be reskilled in emerging technologies. Not all employees might be able to make the transition. Ability to attract and retain talent is going to be key.” He sites efforts by Infosys to train its employees in design thinking.
Reddy though sounds upbeat and bullish: “The best days of Indian IT are ahead. As long as the global economy does well, Indian IT will al-ways find ways and means to serve the needs of its customers.” ~
@venkateshababu
INDIA’S MOST VALUABLE COMPANIES INFO TECH
68,540
78,083
46,93651,210
40,67643,807
12,89717,157 17,182
19,707
Infosys Wipro HCLTechnologies
##
TechMahindra
Tata Consultancy
Services
1RANK
7RANK
15RANK
16RANK
38RANK
REVENUE 2013/14
REVENUE 2014/15
GROWTH (%)
MAKING GOOD OF TOUGH TIMESTop fi ve companies in the Indian IT space14
9
8
3315
##12 months ending June 2014; Standalone data; Source: CMIE Prowess


54 BUSINESS TODAY November 8 2015
In December 2014, Jaiprakash Associates sold two cement plants in Madhya Pradesh for `5,400 crore. This May, Tata Motors raised `7,500 crore through a rights issue. In June, DLF sold its movie theatre arm DT Cinemas to PVR for `500 crore. It has announced that it will sell 40 per cent stake in its subsidiary DLF Cyber City Developers.
For companies, there is nothing unusual about raising money. Some do it to expand their business, a routine activity. But in the above examples, the
money was raised to pay back money borrowed earlier. In other words, debt – humongous debt, which is becoming
a headache for these companies despite such efforts to contain the problem.
Devil is in the DetailThese fund-raising rounds should have brought down India Inc’s overall debt level. They have not, though the growth rate of debt has slowed. The debt of 395 companies in BT500 (excluding banks and financial institutions) rose just 3.6 per cent in 2014/15. In 2013/14, the rise was 14 per cent.
This is good news. But the fact is that the debt levels are still very high in absolute terms. Jaiprakash Associates, for instance, has sold assets worth `22,000 crore in the past
INDIA’S MOSTVALUABLECOMPANIESDEBT
A Debt EndGrowth in corporate India’s debt levels is slowing,
though any substantial improvement is still a few
quarters away. By DIPAK MONDAL
IN 2014/15, GROWTH IN OVERALL DEBT LEVELS HAS BEEN 3%

November 8 2015 BUSINESS TODAY 55
few years. Yet, its standalone debt is still around`36,000 crore. DLF’s debt was `12,058 crore onMarch 31, 2015. The figure for Tata Motors was`21,321 crore though its rights issue reduced itsgross debt by `2,000 crore. “This has also resultedin an improvement of `3,937 crore in cash andcash equivalents and, consequently, reduction ofnet debt-to-equity ratio from 1.36 on March 31to 0.63 on June 30,” says C. Ramakrishnan,Group Chief Financial Officer, Tata Motors.
The companies with highest debt among theBT500 companies Reliance Industries, Power
Gross NPAs of
banks have
risen from
4.1% to 4.62%
TOP 10 DEBT-LADEN COMPANIES COMPANY DEBT INTEREST TOTAL ` CR COVERAGE INTEREST (X TIMES EBIT) EXPENSE ` CR*
Reliance Industries 97,620 12.29 2,614
Power Grid Corpn. Of India 95,044 2.02 6,186
NTPC 86,541 2.66 5,738
Indian Oil Corpn 55,247 3.06 2,587
Vedanta 37,658 1.56 35,03
Reliance Communications 31,751 -0.21 2,317
Steel Authority Of India 29,897 2.56 1,454
Hindalco Industries 29,006 1.77 2,429
JSW Steel 28,898 2.02 2992
Jindal Steel & Power 28,314 1.05 2,634
EBIT is earnings before interest and taxes; *interest expense for 2014/15; debt as on March 31, 2015; standalone data; Source: CMIE Prowess
AJ
AY
TH
AK
UR
I

56 BUSINESS TODAY November 8 2015
Grid Corporation of India andNTPC — have seen their debt in-crease by 8.5 per cent, 14 per centand 21 per cent, respectively, in2014/15. However, for a companylike Reliance Industries, with oper-ating profit 13 times the annualinterest expense, debt may not bea big issue. But not everybody is sofortunate.
The situation is so bad thatmany big companies are not in a position to pay interest comfortably – that is, have an interest coverage ratio of less than two. The interest coverage ratio is calculated by divid-ing a company’s earnings before interest and taxes by interest payments. It shows how easily it can service its debt. Most analysts consider any figure less than two as high-risk.
The most indebted among companies with interest coverage ratio of less than two is Vedanta. It plans to raise `8,000 crore to refi-nance some debt. Its net debt at the end of March 2015 was `37,658 crore, slightly less than `38,945 in March 2014 (see Top 10 Debt-Laden Companies).
Reliance Communications, which comes second, had `32,000 crore debt on its books at the end of March 2015. Its interest expense for 2014/15 was `2,300 crore. Cash generated from operating activities was `3,300 crore. The company plans to sell a part of its tower busi-
ness, an overseas business unit and some properties, the company’s CEO, Gurdeep Singh, said at an in-vestors’ meet recently.
“These measures have helped, but the amounts that have been realised have been grossly inade-quate compared to the debt levels,” says Anjan Ghosh, Executive Vice President and Chief Rating Officer, ICRA Ltd.
Take Jaiprakash Associates. Despite efforts to reduce debt, its overall liabili-ties remained stagnant at `35,000-36,000 crore (on a standalone basis) in 2014/15. The interest cost rose from `2,750 crore to `3,314 crore during the year.
DLF’s debt came down from around 14,000 crore in 2013/14 to `12,058 crore in 2014/15. However, its interest coverage ratio continues to be below two. This means interest payments continue to be a drag on profitability.
However, many companies are struggling to even sell stake or assets. IVRCL, for example, has been trying to sell some assets — road projects and desalination plants — since September 2014, without much success.
The reason why such sales are not going through is mismatch in valuation expectations between potential buyers and sellers, and short-age of buyers due to economic slowdown. This also means that many companies have had to
INDIA’S MOST VALUABLE COMPANIES DEBT
2010/11 2011/12 2012/13 2013/14 2014/15
Figures (in `crore) at the end of March 2015; Source: CMIE Prowess; Standalone data
AGGREGATE DEBT (SECTORWISE)
2,50,000
3,00,000
3,50,000
2,00,000
1,50,000
1,00,000
50,000
0
Power Oil & Gas Mining & Metals Telecom Infrastructure & Engineering
MANY COMPANIES ARE STRUGGLING TO SELL STAKE OR ASSETS

sell some good cash generating assets, which has further impacted their ability to service debt.
A year-and-a-half-ago, when the National Democratic Alliance came to power at the Centre, there was expecta-tion that it would have the economy up and running within a year. This made people hopeful that companies with stressed assets would find it easier to raise capital. This has not happened, even though equity markets rose 25 per cent in 2014/15 and there has been a spurt in equity issuances. In 2014/15, money raised through initial public offerings, follow-on offers and offers-for-sale almost doubled to `30,000 crore. Similarly, the amount raised through qualified institutional placements trebled to `28,500 crore. However, not many debt-laden compa-nies managed to benefit from this.
“Though the sentiment in equity markets has been good, the overall feeling towards the infrastructure sec-tor and highly leveraged groups is still negative. It is difficult for such companies to get the right valuation,”
says Ghosh of ICRA.
Cash FlowWhat is worse is that some BT500 companies do not have enough cash flow to pay interest. Out of the 395 compa-nies in the sample, 34 have interest coverage ratio of less than one, which means their operating profit is less than their interest expense. For example, Suzlon Energy’s inter-est expense for 2014/15 was `1,083 crore, compared to operating profit of 250 crore and negative cash flow from operating activities of `15 crore. Its debt was `11,125 crore at the end of March 2015.
What’s making matters worse is the slower-than-expected revival of the economy. Most agencies have re-vised downward their 2015/16 gross domestic product, or GDP, growth forecasts for India.
“Though we have seen a few cases of debt restructur-
ing, the economy is still under a lot of stress. Therefore, these measures have not improved EBITDA margins of highly-leveraged companies. These will continue to be under stress,” says a banking analyst.
Banks at Receiving EndAccording to the RBI, gross non-performing assets, or NPAs, of banks have grown from 4.1 per cent of advances at the end of March 2014 to 4.62 per cent at the end of March 2015.
Also, banks have had to restructure many of these loans. The ratio of restructured loans to gross advances grew from 5.87 per cent in March 2014 to 6.44 per cent in March 2015. Total stressed assets (NPAs plus restruc-tured assets) grew from 10 per cent of gross advances in March 2014 to 11 per cent in March 2015. During loan restructuring, banks either increase the term or reduce
R. GANDHI, RBI Deputy Governor (in a public address)
“The sharp increase in stressed assets has adversely impacted profi tability of banks. The annual return on assets has come down from 1.09 per cent in 2010/11 to 0.78 per cent in 2014/15.”
RA
CH
IT
GO
SW
AM
I

the rate of interest or do both.“The sharp rise in stressed assets has ad-
versely impacted profitability of banks. Theirreturn on assets has come down from 1.09 percent in 2010/11 to 0.78 per cent in 2014/15,”RBI Deputy Governor R. Gandhi recently said ina public address.
Jyotinder Kaur, Principal Economist, HDFCBank, says this is a huge risk for banks. “Whileefforts have been made to bring downthe debt, I am not entirely convincedthat the process is complete. We area couple of quarters away from a fallin leverage ratios before any capacityexpansion can happen in the privatesector,” she says.
The Rupee Sword“Some of the problem of corporatedebt can be attributed to increasedaccess to the external debt market,”says Kaur. Over the past five years, non-govern-ment external debt as a percentage of GDP has been on the rise. It increased from 13.6 per cent in March 2010 to 19.3 per cent in March 2015. Outstanding external commercial borrowings have risen from $150 billion in March 2014 to $182 billion in March 2015, an increase of 32 per cent. If the rupee depreciates against major global currencies like dollar or euro, many com-
panies exposed to foreign currency loans willhave to pay more in rupee terms.
Vicious CycleOne direct fallout of high debt is slow revival ofthe capex cycle. “Companies have become cau-tious in bidding for new projects. Probably this isone way of keeping the debt from rising. If exist-ing projects start generating more revenue, the
magnitude of the problem may comedown,” says Ghosh of ICRA.
According to India Ratings esti-mates, capex spending in 2014/15may have been `2.76-2.8 lakhcrore, the lowest in the last fiveyears. “The capex of the top 500asset-owning companies, after hit-ting the peak of `3.1 lakh crore in2010/11, has been falling. Thecapex spend of these companies fell5.5 per cent to `2.93 lakh crore in
2011/12 and 2.6 per cent in 2012/13 to `2.85 lakh crore, before improving to `2.94 lakh crore in 2013/14,” it says in a report.
According to experts, unless the country’s economic growth takes bigger strides, many highly leveraged companies may continue to battle debt. ~
@dipak_mondal
58 BUSINESS TODAY November 8 2015
INDIA’S MOST VALUABLE COMPANIES DEBT
No of companies 395 2010/11 2011/12 2012/13 2013/14 2014/15 4-yr CAGR
TOTAL DEBT (`CR) 7,75,981 9,22,462 10,50,327 11,98,265 12,41,817 12.5
Y-O-Y GROWTH (%) 18.9 13.9 14.1 3.6
INTEREST EXPENSE (`CR) 50,056.1 63,695.4 78,477.3 88,258.7 94,626.7 17.3
Y-O-Y GROWTH (%) 27.2 23.2 12.5 7.2
NET CASH FLOW FROM OPERATING ACTIVITIES (`CR)
2,70,410 2,56,611 3,18,008 4,27,715 4,39,810 12.9
Y-O-Y GROWTH (%) -5.1 23.9 34.5 2.8
PBDITA (`CR) 4,93,611 5,37,731 5,83,520 6,44,099 6,65,648 7.8
PBIDTA/TOTAL INTEREST EXPENSE 9.9 8.4 7.4 7.3 7.0
OPERATING CASH/TOTAL DEBT 0.35 0.28 0.30 0.36 0.35
NO RESPITEFinancials of BT500 companies (excluding banks and fi nancial institutions)
PBIDTA is Profi t Before Interest, Depreciation, Tax and Amortization; Source: CMIE Prowess; Standalone data
FALL WILL PUT MORE STRESS ON COMPANIES THAT HAVE FOREIGN DEBT


60 BUSINESS TODAY November 8 2015
Big is getting bigger in the global pharma industry. I s r a e l i g i a n t T e v a Pharmaceutical Industries acquired the generics busi-ness of leading US player, Allergan, for $40.5 billion in July. Mylan N.V., which is now domiciled in the Netherlands with opera-
tional headquarters still out of the US, is pushing for a $33-billion hostile takeover of Ireland-based Perrigo, a maker of over-the-counter cough and allergy remedies. There have been a number of other M&As among US-based pharmacy chains or pharmacy benefit managers – intermedi-aries between drug companies and insur-ers – in the last few years. Will such con-
INDIA’S MOST VALUABLE COMPANIESPHARMA
Strong and Healthy All the major pharma companies
are showing growth, both in the
all-important US market and at
home. By E. KUMAR SHARMA

November 8 2015 BUSINESS TODAY 61
solidation impact the strength and in-fluence of other players in the long term, especially Indian pharma com-panies operating in global markets?
It is a difficult question to answer, but there are no such signs yet. On the contrary, most leading Indian pharma players have been growing in the all important US market – for many, their largest source of revenue. Around 47 per cent of Dr. Reddy’s Laboratories’ revenues in 2014/15, for instance, came from the US, as did 45 per cent of Lupin Ltd’s. (Only about 20 per cent of the revenues of leading Indian pharma players come from the domestic mar-ket.) Indian pharma companies have succeeded in holding their own so far mainly because they have moved up the value chain in time. They have long had a global reputation for making cheap generic drugs, but many have since moved beyond plain vanilla ge-nerics. “The migration of Indian companies to higher, value added ge-nerics has made a difference,” says G.V. Prasad, Co-chairman and CEO, Dr. Reddy’s Labs. “The US remains a major growth driver.” Value added or com-plex generics are those which are dif-ficult or expensive (or both) to manu-facture, with some even requiring clinical trials. They have limited com-petition and thereby provide scope for higher margins.
One of the companies, Sun Pharma, has even gone beyond gener-ics. It pulled off the one big merger that has taken place in India too in recent
times, completing its $4 billion takeo-ver of Ranbaxy Laboratories in April last year (2014) to become the coun-try’s largest pharma company. To add to its proprietary knowledge and strengthen its US presence, it is also acquiring US-based InSite Vision, Inc. for $48 million through one of its sub-sidiaries. InSite Vision focuses on spe-cialty ophthalmic products, and cur-rently has three such in advanced stages of development. In June, Sun Pharma inlicensed Xelpros, preserva-tive-free eye drops for glaucoma pa-tients, developed by its own research organisation, Sun Pharma Advanced Research Co (SPARC) for the US market.
But the company is yet to get the US Food and Drugs Administration (USFDA) approval.
Other Indian compa-nies have made acquisi-tions in the US too this year, though these have remained in the tradi-tional generic segment. In July, Lupin announced the acquisition of US-based
GAVIS Pharmaceuticals – a niche ge-neric drug specialist – for $880 million, its sixth acquisition in 18 months. And in September, Cipla Ltd acquired two US generics companies, InvaGen Pharmaceuticals and Exelan Pharmaceuticals, for $550 million.
Brokerage firm CLSA’s report on Indian pharma in August 2015 singles out Sun Pharma and Dr. Reddy’s for special praise. “Complex product launches by Sun Pharma and Dr Reddy’s over the past three years have delivered strong results, indicating that
AROUND 47% OF DR. REDDY’S LABS REVENUES IN 2014/15 CAME FROM THE US
AJ
AY
TH
AK
UR
I

62 BUSINESS TODAY November 8 2015
Indian players can move up the value chain,” says author Alok Dalal. “The US differentiated-product contribution to Sun Pharma’s sales and profit is eight per cent and 16 per cent (respec-tively), which could rise to 16 per cent and 26 per cent by 2019/20.” Sun Pharma acquired a majority stake in US-based Taro Pharmaceutical in 2010 and took over another US company, DUSA Pharmaceuticals, in 2012.
The report predicts that the three together could emerge as a strong force in the US’s derma-
tology and complex injectables markets. “We expect the company to launch its novel psoriasis drug Tildrakizumab (specialty product) in the US in 2017/18 with sales of $200 million by 2019/20,” it adds.
As for Dr. Reddy’s, the report expects its dif-ferentiated products in the US market to contrib-ute 33 per cent to its profit by 2019/20 from the current 13 per cent, with skin and central nerv-ous system treatments as the main growth driv-ers. “We expect biosimilars to be a growth driver (for Dr. Reddy’s) beyond 2019/20,” it adds. About other pharma companies, Dalal is more restrained. He notes that Lupin has advanced through its acquisition of GAVIS, but maintains Cipla – which gets only eight per cent of its rev-enue from the US – has a long way to go. “We upgrade Cadila Healthcare from ‘underperform’ to ‘outperform’ as its differentiated products pipeline can generate long-term returns,” he adds. Glenmark Pharmaceuticals too has filed three product approval applications in the US for immunosuppressants, apart from building on its niche strength in oral contraceptives, dermatol-ogy and oncology injectables.
Indian pharma companies have had their run-ins with the USFDA in the past, notably two years ago when the latter banned entry of drugs manufactured by leading companies such as Ranbaxy and Wockhardt Ltd at specified plants, claiming the plants fell short of its quality stand-ards. But the situation seems to have vastly im-proved. A recent Bank of America Merrill Lynch report by Manoj Garg, research analyst, DSP Merrill Lynch (India), shows that there were 75 approvals of Indian drugs by the USFDA in the April to September15 period this year, against 75 in the entire financial year 2014/15. “Clearly, one of the reasons behind the recent growth has been an acceleration in product ap-provals by the USFDA,” says Glenn Saldanha, Chairman and Managing Director, Glenmark Pharma. “Indian companies also now under-stand the US’s market better, both the kind of compliance required and the filing and product quality needed.”
The depreciation of the rupee since 2011, making Indian pharma products cheaper, has also worked to the industry’s advantage, as the Bank of America Merrill Lynch report notes that a five per cent rupee movement would have a 2.4 to 5.6 per cent impact on pharma universe’s earning per share. Another industry estimate maintains that for every one per cent fall in the rupee’s value against the dollar, the EPS of lead-
INDIA’S MOST VALUABLE COMPANIES PHARMA
CadilaHealthcare
Cipla Dr. Reddy’sLabs
GlenmarkPharma
Lupin SunPharma
3,02
0.8 5,
700.
2
6,47
9.710
,359
.3
5,89
7.510
,317
.6
1,293
.45,
371
4,55
1.710
,044
.3
3,37
2.3
8,47
7.5
A HEALTHY TREND
31/03/11 31/03/15 4 year CAGR (%) In ` crore
17.2 12.4 15 42.8 21.9 25.9
CadilaHealthcare
Cipla Dr. Reddy’sLabs
GlenmarkPharma
Lupin
591.0
1,268
954.
4 1,175
.8
850.
61,6
91.4
212.
21,1
78.8
814.
6
1, 381
.2-1,
476.
7
21 5.4 18.7 53.5 30.7 N.A.
SunPharma
31/03/11 31/03/15 4 year CAGR (%) In ` crore
2,37
8Most pharma companies have grown at a steady clip
TOTAL INCOME
PROFIT AFTER TAX
Figures are Net of Prior period and extra ordinary income; Source: CMIE Prowess; Standalone data


64 BUSINESS TODAY November 8 2015
ing pharma companies increases by 0.7 per cent.According to the report, Cadila Healthcare,Aurobindo Pharma and Lupin have been thebiggest beneficiaries of depreciation. Strategicpartnerships have also helped some companies
notably Cipla’s tie up with Teva which made itsole supplier of the generic drug Nexium (esome-prazole magnesium) in the US.
In the $15 billion domestic market too,Indian pharma companies have been showingsteady growth. There were many apprehensionswhen the National Pharmaceutical PricingAuthority passed a new Drug Price ControlOrder (DPCO) in May 2013, increasing the num-ber of drugs under price control from 74 to 348,but these have been belied. The order itself tookinto account market realities, changing the for-mula for calculating drug prices from the former‘cost plus’ approach to the more real-istic ‘market-based pricing’ ap-proach, and linking prices of thelisted drugs to inflation, so companieswould not have to seek governmentpermission each time they needed toraise prices. Prices of some formula-tions did indeed have to be reduced,but this affected the MNCs operatingin the country more than the whollyindigenous ones, since the former’sprices are usually higher.
Pharma companies have been growingwithin the country through select product ac-quisitions, marketing alliances and greaterpenetration. Dr. Reddy’s has been particularlyproactive in doing so in April this year it final-ised a `800 crore deal to buy up some of thebrands of Belgian pharma giant UCB being dis-tributed in India. The brands chosen willstrengthen Dr. Reddy’s presence in the dermatol-ogy, respiratory and pediatric segments. In May,it entered into a distribution agreement with theIndian arm of the UK-based AstraZeneca, to sell
two of its trademark products, Riax and Riax M,within the country. In August, Dr. Reddy’s an-nounced a strategic collaboration with leadingbiotechnology company Amgen to market threeof Amgen’s drugs related to oncology and cardi-ology. The industry is also benefiting from arapidly expanding market in certain chronicdisease segments like diabetes, brought on bywidespread lifestyle changes.
Despite the buoyant mood, a few concernsremain. A number of emerging markets such asRussia and its surrounding CIS countries,Venezuela, Brazil and South Africa are wrackedby currency turmoil far greater than what therupee faced. Most leading pharma companieshave about 15 to 20 per cent of their revenuescoming from these countries. Dr. Reddy’s andGlenmark Pharma, for instance, have a good
deal of exposure in Russia and the CIScountries as well as Venezuela.Analysts, however, maintain thecompanies concerned have imposedtight controls on their expenditure,taking the volatility into account.Future price regulation, be it in India,with more drugs being brought un-der the price control order, or in theUS, is another worry. US Presidentialhopeful Hillary Clinton’s recenttweet, condemning the ill conceived
attempt by US based Turing Pharmaceuticals to raise the price of one of its drugs by 5,000 per cent and vowing to oppose it, sounded ominous to some industry watchers.
But overall, most feel the good times will continue. “This is one industry that thrives on challenges,” says D.G. Shah, Director-General, Indian Pharmaceutical Alliance (IPA). “It is creative not only in discovering treatments and cures, but also in getting out of tight corners.” ~
@EKumarSharma
INDIA’S MOST VALUABLE COMPANIES PHARMA
SURGING AHEAD
S&P BSE Healthcare S&P BSE Sensex Figures rebased to 100
90
120
150
101.696.1
133.4
14-Oct-14 14-Oct-15
THE SIZE OF DOMESTIC PHARMA MARKET IS ABOUT $15 BN
The BSE Healthcare index has outperformed the Sensex
100


Tata Consultancy Services CEO N. Chandrasekaran

November 8 2015 BUSINESS TODAY 67
Tata Consultancy Services (TCS) CEO N. Chandrasekaranis a wired elite who has always been as excited about newgadget launches as teenage geeks. In fact, he wears an-other teenage personality with equal ease cool andconfident in both good and bad times. What sets himapart though is his vision for the company he heads. So,it came as no surprise to journalists when Chandra, as heis referred to by his friends, fended off uncomfortablequestions about TCS’s lower-than-expected results for thefifth consecutive quarter on October 14, and the subse-
quent 4 per cent fall in its share price, without a hitch. In fact, the tidesoon turned in his favour when he had journalists listening to himabout the digital promise TCS holds, going ahead. “At TCS we are ininvestment mode and, in the coming months, we are going to enhanceour digital capabilities,” he told Business Today.
TCS’s constant currency revenue grew by just 3.9 per cent in theSeptember quarter against the expected growth of 4.5 per cent. Analystssay the $15.5 billion company’s 5.8 per cent revenues growth to
INDIA’S MOST VALUABLE COMPANIES TCS
1RANK
A Digital FutureApart from being the market leader, Tata Consultancy Services remains one
of the top stock bets in the Indian IT sector. The company also enjoys the
industry best employee metrics and is expected to continue its growth at a
brisk pace on the back of its digital initiative. By AJITA SHASHIDHAR
TATA CONSULTANCY SERVICES● RANK 2015: 1
● RANK 2014: 1
● MARKET CAP FY15 APRIL-SEPT:
`5,01,476 crore
● TOTAL INCOME: `78,083 crore
● NET PROFIT: `18,750 crore
● ROCE: 41.7%
● SO WHAT: Invincible at No. 1 for past three years. Steadily increasing lead over others
Towards
Source: CMIE Prowess, Standalone data
VI
VA
N M
EH
RA

68 BUSINESS TODAY November 8 2015
`27,166 crore was marginally higher than their expectations. The muted growth, according to Chandra, was, however, not worrying. “The concept of digital has really moved on in the last couple of years from people looking at digital as a set of technologies which enable access on mobile and doing transaction on the mobile or building analytics around data to holistic trans-formation of businesses,” he added.
For the next hour or so, the discussions re-volved around the TCS app that enabled SMEs
to manage their businesses more efficiently. “If you are a restauranter, you will most likely have a separate tool to take orders, a separate cash-collection system and a swipe machine. We have eliminated all these and created one single application by which you will be able to manage all the aspects of the business, from taking orders, managing transactions and get-ting a daily report,” he explained, adding that TCS is transforming and positioning itself to operate in the digital world and cater to every sector, be it large automobile giants, retailers, banks or small businesses.
This is, however, not the first time that
Chandra has talked about going digital. In fact, he has been carefully transforming TCS into a digitally-sound company for over two years and the first step towards achieving that goal was to make his own workforce be digitally-enabled – encouraging them to create an in-house social media platform to build a women safety app. Today, TCS has over 4,000 in-house digital tools that facilitate employee engagement.
In 2014, he had set himself a goal to ensure TCS’s digital business becomes a $4 billion en-tity in five years. Barely a year later, digital has gone past the $2 billion mark and contributes 13.3 per cent to the company’s overall reve-nues. In the last one year alone, over one lakh out of the 3.3 lakh TCS engineers have received training in digital technology. This year, the company plans to hire another 70,000 to add to its digital workforce.
Well-known IT consultant Sid Pai, compli-ments TCS’s digital strategy. “TCS is investing ahead of the curve. It always had a long-term vision and, therefore, retained its position as the most valuable Indian company, says Pai. Even in the September quarter, TCS managed to crack the highest number of deals, compared to its peers in the industry. In the past one year, the market cap of TCS was higher than all the other Tata Group companies put together.
Unlike its peers, such as Cognizant and Accenture, which have also been building their digital business through acquisitions and digital
consulting services, TCS, says Sagar Rastogi, Equity Research Analyst at Ambit Capital, hasn't invested in consulting. “TCS has upheld its tra-ditional strategy of offering solutions at the low-est prices. It has invested in creating digital solu-tions for various industries. These moves have worked in its favour, as it has ensured that it maintains higher margins.” In comparison, other Indian IT majors, which have been offering consulting services to various companies, have suffered. This, says, Rastogi, may not necessarily work. “Indian IT companies are not known for their consulting services. They are better known for their solutions,” he says.
SAGAR RASTOGI, Equity Research Analyst, Ambit Capital
“TCS has upheld its traditional strategy of offering solutions, at the lowest prices. It has invested in creating digital solutions for various industries.”
INDIA’S MOST VALUABLE COMPANIES TCS
1RANK

Digital TCSChandra says investment in digital would be on a war-footing, to offer cutting edge digital solutions to its customers and trans-forming its own work environment. “You go to our various centres now, you will see that we are changing our office environ-ment to become agile spaces. We no longer have cubicles,” he says.
The company is also setting up inno-vation labs and digital studios. Chandra feels digital solutions are no longer re-stricted to merely creating a functional solution, but isall about creating an experience. “The whole idea ishow we get customers to think through the art of thepossible; not only from the point of view of businessmodels and business processes, but also in terms ofexperience by designing solutions which are experi-ence-rich.”
For instance, TCS has created an application for aleading global retailer that has enabled the entity tooffer better customer-experience. “They have a largeconsumer base. So, we have built knowledge platformsworking closely with them. We help them track everycustomer that visits their many stores, the nature of theshopping they do and, through analytics, help thempredict what they would like to buy the next time theyvisit the store. Accordingly, we help the retailer to give
tailor-made discounts or customised promotional offers to their customers.”
While a techie creates the apps, Chandra has felt the need to include so-ciologists and psychologists into his workforce to understand the psyche of consumers or the consumption habits of different communities, where the stores are situated,. “We also have people with artistic ability and design in our work-force. I expect this number of non-techies to increase manifold.” Pai, lauds this
strategy. “To offer cutting edge technical or digital solu-tions, one has to understand consumer psyche and human behaviour. Therefore, it makes sense.”
With businesses across industries increasingly depend-ing on data to offer real-time services and insights, TCS has invested in 12 real time platforms. Chandra says that while some of them are already producing revenues, some are in the build-out stage. “But over a period of time it will be matured enough to solve problems of different industries.”
Analysts feel this over emphasis on digital could back-fire. But, Chandraskekaran is confident: “There is so much opportunity. It has got so many elements. The Internet of Things is a big thing in itself, sensor analytics is a big thing, so is data analytics,” he explains. ~
@AjitaShashidhar
THE COMPANY IS SETTING UP INNOVATION LABS AND DIGITAL STUDIOS
Tata Consultancy Services, Chennai
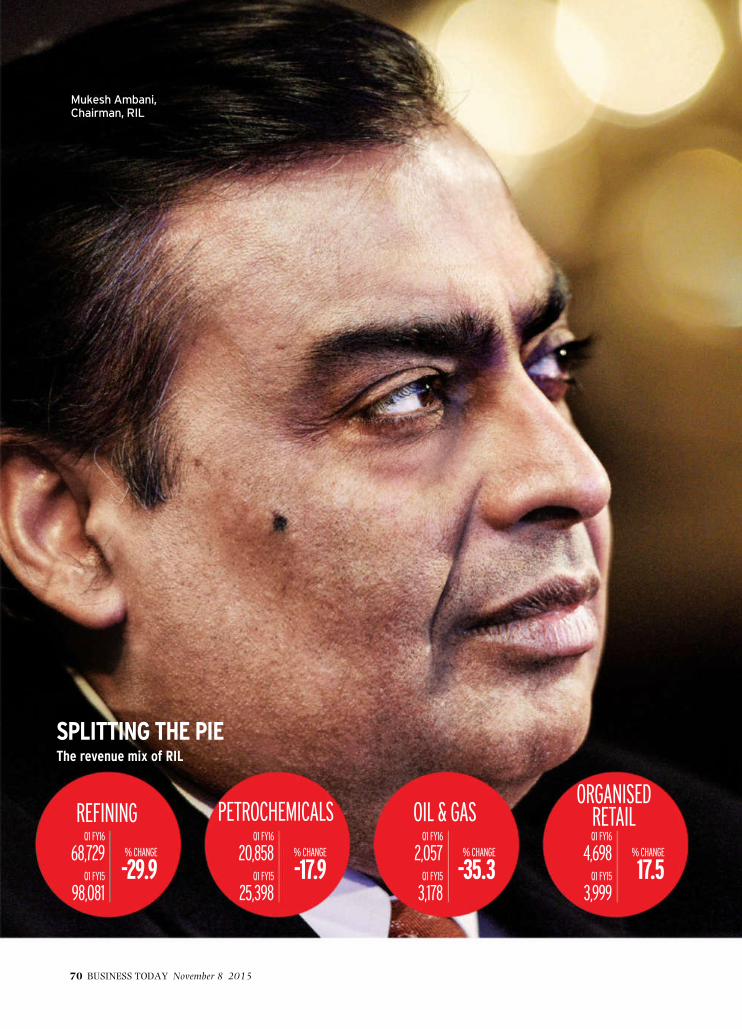
Mukesh Ambani, Chairman, RIL
70 BUSINESS TODAY November 8 2015
SPLITTING THE PIE The revenue mix of RIL
ORGANISED RETAIL
Q1 FY16
4,698Q1 FY15
3,999
% CHANGE
17.5
OIL & GAS Q1 FY16
2,057Q1 FY15
3,178
% CHANGE
-35.3
PETROCHEMICALS Q1 FY16
20,858Q1 FY15
25,398
% CHANGE
-17.9
REFINING Q1 FY16
68,729Q1 FY15
98,081
% CHANGE
-29.9

Ambani’sBig Gamble
Reliance Industries treads through one
of the largest investment cycles in its history,
expanding the petrochemical facility and
creating a 4G business.
By NEVIN JOHN
November 8 2015 BUSINESS TODAY 71
Billionaire Mukesh Ambani, Chairman of Reliance Industries (RIL), is on a spending spree. In the last financial year, RIL had invested over `1,00,000 crore, about 0.8 per cent of India’s GDP, in building a digital platform and expanding the petrochemical business. He plans to spend another `1,00,000 crore this financial year – a large chunk of this on the launch of Reliance Jio, the 4G business, in December.
The heavy capital expenditure has taken a toll on RIL’s market value. It slipped 8.9 per cent in this year’s BT 500. Still, the company improved its rank by one notch and came sec-ond after software behemoth TCS.
The last one year had its fair share of challenges for RIL. Its revenues dipped 14.8 per cent to `3,49,535 crore in 2014/15 because of the sharp fall in crude oil prices during the second
INDIA’S MOST VALUABLE COMPANIES RELIANCE INDUSTRIES
2RANK
OTHERSQ1 FY16
2,579Q1 FY15
1,772
% CHANGE
45.5
Figures in ` crore; Consolidated dataSource: Company
RIL● RANK 2015: 2
● RANK 2014: 3
● MARKET CAP FY15 APRIL-SEPT:
`2,97,742 crore
● TOTAL INCOME: `3,49,535 crore
● NET PROFIT: `22,401 crore
● ROCE: 7.5%
● SO WHAT: Back at No. 2 (from No. 3) but market cap down 8.9%Source: CMIE Prowess, Standalone data
AN
IL
AM
BA
NI

72 BUSINESS TODAY November 8 2015
half of the year.Crude oil averaged $85.4 a barrel in the fi-
nancial year, sliding 21 per cent. The compa-ny’s exports, too, were lower by 17.1 per cent at`228,651 crore. But sustained weakness in in-ternational crude prices has limited effect onearnings from RIL’s core business segmentsrefining and petrochemical. The company canpass on the cost variation as a refinery andpetrochemical producer. Indeed, strong operat-ing performance of these two segments helpedRIL improve its bottom line by 1.9 per cent to`22,401 crore.
RIL’s performance in the first quarter of2015/16 was a mirror image of the last financialyear. A robust performance from refining andpetrochemicals businesses ensured that profitwas higher by 4.4 per cent at `6,222 crore.
RIL’s twin refineries at Jamnagar maintaineda high operating rate of 110 per cent, processing67.9 million tonnes (MT) of crude during the lastfinancial year, compared to averagerefinery utilisation rates of 86.9 percent in North America, 80.7 per centin Europe and 83.5 per cent in Asia.In the first quarter of FY16, the refin-eries processed 16.6 MT of crude withan average utilisation of 107 per cent.
The expected commencement ofongoing projects (petcoke gasifiersand off-gas crackers) in its refineryand petrochemical businesses willboost the company’s core earningssubstantially from the next financial year.Indeed, the core segments are expected to re-main strong cash generators for RIL. The cokegasification facility at Jamnagar, which is one ofthe largest initiatives in the world, is expected tobe ready for commissioning in phases startingfrom early 2016.
According to Ambani, Reliance has alwaysbelieved in India and in businesses of the future.“The global economy in 2014/15 saw a steepdecline in oil prices, which had a significant im-pact on energy businesses. This coupled withslowing growth in some of the leading globaleconomies impacted currencies. But, there waspositive news in terms of faster-than-anticipatedeconomic growth recovery in the US, which pro-vided momentum for the global economic recov-ery,” said Ambani in the annual report.
Meanwhile, the government’s move to de-regulate diesel prices last year helped RIL re-enterthe domestic retail market. It plans to re-commis-sion its entire network of petroleum retail outlets
by the end of FY16. Nearly 400 outlets are opera-tional now. It will open 1,000 more outlets next year.
But for RIL, major trouble is brewing at KG D6. The block has produced nearly 2.5 TCF of natural gas and about 27 million barrels of crude oil, sub-stituting over $34 billion of energy imports. But RIL, along with partner BP, is struggling to main-tain production because of tough geological condi-tions. Further exploration and production is capi-tal intensive and technically challenging. “RIL’s interest in E&P might reduce because of the escalat-ing issues at KG D6,” says Ambareesh Baliga, an independent market expert.
The 4G ForayRIL has big plans for telecom. The company is building a wireless network that will be covering one lakh villages in the country and 80 per cent of the population. Jio has also deployed a network of nearly 250,000 route kilometres of fibre optics.
Over the next three years, it plans to double this footprint by deploy-ing fibre optics for the last mile.
S.P. Tulsian, an independent analyst, says that the recovery of the heavy investments in Jio – around `70,000 crore now – will be tough for RIL in the highly competitive Indian telecom mar-ket. “However, the company has managed to arrange cheapest loans because of its high credit
ratings,” he adds.However, Baliga believes that Jio will be a
game changer. “RIL is not bothered about the bottom line of Jio. The other players can’t afford doing it. In two to three years Jio will turn around.”
RIL’s only business delivering positive top line is Retail. Reliance Retail operates 2,747 stores across 210 cities in India. Despite a tough con-sumer environment, the retail business achieved a compounded annual revenue growth of 31 per cent over the last five years. The company plans to scale up its retail presence across formats from 200 cities to over 900 cities by next year. With the launch of Jio, Reliance Retail will come out with an e-commerce platform.
Clearly, Ambani is going all out to scale up his various businesses. The next one year is cru-cial for RIL and could well determine the fate of the company’s numerous initiatives. ~
@nevinjl
INDIA’S MOST VALUABLE COMPANIES RELIANCE INDUSTRIES
2RANK
RIL HAS INVESTED `70,000 CRORE IN JIO, ITS 4G BUSINESS


74 BUSINESS TODAY November 8 2015
In the UK, the online-only Atom Bank is set to challenge brick-and-mortar banks. In China, the knives are out as banks and e-commerce players encroach upon each other’s territory. Industrial Commercial Bank of China and China Construction Bank are hawking things such as shampoo and wine while Alibaba is expanding its financial services business. In India, dozens of digital wallet companies are expanding into retail pay-ments. There is also the upcoming competition from payment banks and small banks.
All this sounds similar to the scene in India a couple of dec-ades ago when HDFC Bank, along with ICICI Bank, stormed the cosy world of government-run banks with better service and technology. While government banks still account for 75 per cent of the industry in terms of deposits and advances, private banks dominate the top five positions in terms of market capitalisation. In the latest BT500 study, HDFC Bank has emerged as the top bank with a market cap of 2,61,465 crore. The figure for State Bank of India, or SBI, whose assets are almost three-and-a-half times that of HDFC Bank, is `2,00,169 crore. One reason for this is that private sector banks score over government banks on most efficiency parameters. HDFC Bank, for instance, has net non-
INDIA’S MOST VALUABLE COMPANIES HDFCBANK
3RANK
Eyes on FutureHDFC Bank, now India’s most valuable bank,
is leaving no stone unturned to embrace new
technology and meet the challenges from small
banks and payment banks. By ANAND ADHIKARI
HDFC● RANK 2015: 3
● RANK 2014: 6
● MARKET CAP FY15 APRIL-SEPT:
`2,.61,465 crore
● TOTAL INCOME: Rs 57,470 crore
● NET PROFIT: Rs 10,216 crore
● ROCE: 10.75%
● SO WHAT: First time in Top 5; grown market cap 34.2%Source: CMIE Prowess, Standalone data

HDFC Bank Managing Director Aditya Puri
November 8 2015 BUSINESS TODAY 75
VI
VA
N M
EH
RA

76 BUSINESS TODAY November 8 2015
performing assets, or NPAs, of 0.25 per cent, comfortable capital adequacy of 16.8 per cent, cost-to-income ratio of less than 0.44 and return on assets of 2 per cent. SBI is far behind with net NPAs at 2.12 per cent, capital adequacy of 12 per cent, a high cost-to-income ratio of 0.53 and re-turn on assets of just 0.68 per cent.
HDFC Bank, in fact, has done better thanother private banks too. For example, ICICIBank’s net NPAs are 1.61 per cent while AxisBank’s net NPAs are 0.46 per cent. The return
on assets is 1.86 per cent for ICICI Bank and 1.83 per cent for Axis Bank. In terms of capital, all three private players are quite comfortable at over 15 per cent as against the requirement of 9 per cent.
Future Challengers India’s second-largest private sector bank by as-sets (ICICI Bank is the leader), headed by Aditya Puri, a former Citibank executive, has set in mo-tion a strategy to become a full-scale digital bank.
Of course, India is years away from some-thing like Atom Bank, which is targeting 18-32 year olds through its app-only model. “This is not such a big phenomenon here,” says
Paresh Sukthankar, Deputy Managing Director of HDFC Bank.
For HDFC Bank, the biggest challenges in-clude new payment banks – such as Paytm, Reliance Industries, Tech Mahindra, NSDL and India Post – that are ready to launch opera-tions. These are allowed to accept deposits up to `1 lakh but cannot lend. Interestingly, whereas SBI has entered into an equity partner-ship with Reliance for a payment bank and Kotak Mahindra Bank has joined hands with Bharti Airtel, HDFC Bank has decided to take on the challenge alone. “Perhaps nobody is sure about how the space will pan out,” says Sukthankar.
Payment banks could be useful for investors as they would leverage the strength of existing banks and not invest too much on physical in-frastructure. Of course, there is a lot of uncer-tainty about what the future holds. “There is still not much clarity on the revenue model of pay-ment banks. There is certainly a limitation in earning high returns due to lending restric-tions,” says Saday Sinha, Banking Analyst, Kotak Securities Ltd. But Sukthankar is unfazed and says HDFC Bank’s ATM network helps them roll out customised offerings and new features. “As you scale up, transaction costs, say for an ATM, come down,” he says.
HDFC Bank is also building a digital bank that will offer the whole gamut of services — from account opening to loans online. The trigger
for this is traction in retail payments.
E-Commerce Play E-commerce is another big opportunity for banks. This is because more and more customers are using digital wallets, which are faster and more secure, instead of punching card details every time they transact online. While non-bank players like Paytm are already exploiting the opportunity, banks have been a bit late in joining the bandwagon. In June, HDFC Bank launched its mobile wallet or mobile payment application PayZapp for transactions such as remittances and bill payments. The wallet registers card de-tails once and pulls out money every time you
PARESH SUKTHANKAR, Deputy Managing Director, HDFC Bank
“We have signifi cantly increased our presence with strong brand visibility. The market is large enough to accommodate new players”
INDIA’S MOST VALUABLE COMPANIES HDFCBANK
3RANK
RA
CH
IT
GO
SW
AM
I

make a payment. While SBI, ICICI Bank andAxis Bank have also launched digital wallets,HDFC Bank has added Smartbuy, a platformfor e-commerce play. It is similar to the toolsadopted by Chinese banks. The Smartbuyoption helps users get the best deals on sitessuch as Flipkart, Cleartrip and Yatra. “We arefacilitating e-commerce transactions,” saysSukthankar.
Fight In Rural/Semi-Urban Markets The Reserve Bank of India is going all out fordeeper penetration of banking services inrural and semi-urban areas. That is why it has granted licences for payment and small finance banks. This is one area where HDFC Bank has perfected its model. “We have a model of one-two persons branches that offer tailor-made products in rural India,” says Sukthankar. Other banks have not done that well on this front.
At present, the bank’s 55 per cent branches are in rural and semi-urban areas. It is targeting 35 per cent revenue from these in the next few years. The current figure is 15 per cent.
Many new payment banks are keen to tie up with universal banks and vice versa. Similarly, small finance
banks, whose expertise is community bank-ing, will scale up their model with the advan-tage of low-cost funds (current and savings accounts). This will upset the calculation of the bank. But Sukthankar is optimistic. “We have significantly increased our presence with strong brand visibility. The market is large enough to accommodate new players,” he says. Kotak’s Sinha predicts enhanced competition for current and savings accounts.
Even as the new payment banks and small finance banks take time to scale up, HDFC Bank’s investors are watching how it is reacting to new mobile technologies, de-
ploying scalable technologies at the back-end, motivating its large work force, and meeting new customer needs. “They recognise that we have been one of the few banks that have grown consistently without compromising our asset quality and profitability,” say Sukthankar.
Some analysts say that HDFC Bank has never had it so good. The past, too, was encouraging. And there seems to be a credible digital plan for tomorrow. That’s what its investors are also hoping for. ~
@anandadhikari
AT PRESENT, THE BANK’S 55% BRANCHES ARE IN RURAL AND SEMI-URBAN AREAS

78 BUSINESS TODAY November 8 2015
Itwas a well thought out decision by the manage-ment of Sun Pharmac-eutical Industries. The merger with Ranbaxy Laboratories was intended to help India’s largest drug maker acquire scale and become a force to reckon with globally. Indeed, Sun
has emerged as the world’s fifth largest specialty generic drug maker. In the process, it has also vaulted into the elite group of top 10 Indian corporates in the BT500 rankings – it is now perched at the eighth spot, jumping three positions from its last year’s ranking of 11.
The merger with Ranbaxy, then the second-largest drug maker in the coun-try, helped Sun improve its average market capitalisation in the first six months of 2015/16 (April to September) by 49.6 per cent to `2,18,278 crore. The acquisition was announced in April
2014 and the all-stock deal at an enter-prise value of $4 billion was completed on March 25.
The mega deal boosted the market capitalisation and revenues of Sun Pharma but also hit the company’s bot-tom line. The last fiscal was a very chal-lenging year for the company, consider-ing its impeccable track record of deliver-ing high profits consistently and growing steadily inorganically (it has made nearly 20 successful acquisitions).
“Our success of the last decade was driven by our ability to develop and launch generic and branded generic products at a rapid pace with minimal costs,” said Dilip Shanghvi, Managing Director of Sun Pharma, in the annual report (2014/15) of the company. “The key determinant for success in the future will be our ability to retain these capa-bilities and combine them with an en-gine of innovation leading to a pipeline of complex generics (reverse engineered
INDIA’S MOST VALUABLE COMPANIES SUN PHARMA
8RANK
SunburnThe merger with Ranbaxy gives Sun Pharma heft and scale but comes
with its fair share of challenges in the near term. By P.B.JAYAKUMAR
SUN PHARMA● RANK 2015: 8
● RANK 2014: 11
● MARKET CAP FY15 APRIL-SEPT:
`2,18,278 crore
● TOTAL INCOME: `3,174 crore
● NET PROFIT: `(2,829) crore
● ROCE: (32.1)%
● SO WHAT: First time in Top 10. Market cap grown 49.6%Source: CMIE Prowess, Standalone data

November 8 2015 BUSINESS TODAY 79
cheap versions of patented drugs) and specialty products,” he added.
ConsolidationPrima facie, the Ranbaxy acquisition consolidated Sun Pharma’s position in the global generic drug industry and de-risked its over dependence on the US market. The consolidated com-bined revenue of Sun Pharma and Ranbaxy helped the merged entity
move into the big league – it became the world’s fifth-largest generic com-pany after Teva, Sandoz, Actavis and Mylan. With Teva now buying out Actavis (part of Allergan), Sun will soon move up to fourth rank.
Analysts say that Ranbaxy’s global muscle is the biggest advan-tage for Sun, especially in emerging markets and in India. The numbers reveal the big shift. In 2013/14, Sun Pharma’s consolidated revenues were `16,004 crore with net profit of `3,141 crore (This includes the rev-enues of Sun Pharma as well as its various subsidiary companies). A year later, powered by businesses of Ranbaxy, Sun’s consolidated reve-nues jumped to `27,287 crore with a net profit of 4,541 crore. While India sales surged from `3,692 crore to `6,717 crore, US sales rose from $1,620 million to $2,244 million and rest of the world sales climbed from $316 million to $992 million.
The acquisition also provided Sun a combined strength of 45 manufac-turing locations across the globe, 30,000 employees and 2,000 prod-ucts in 150 countries. In the domestic market, Sun also gained leadership
Dilip Shanghvi, MD of Sun Pharma
SHANGVI’S PRIORITY IS TO SMOOTHLY INTEGRATE RANBAXY AND BRING THE DERAILED BUSINESS BACK ON TRACK

80 BUSINESS TODAY November 8 2015
position in 11 doctor categories, including dia-betologists, consulting physicians, dermatolo-gists and urologists. The company has a totaldomestic market share of nearly nine per cent,much ahead of Abbott’s six per cent and Cipla’sfive per cent.
But the merger came with its fair share ofchallenges for Sun Pharma. Three of Ranbaxy’splants in India, supplying products to the US, arestill banned by the US Food and DrugAdministration (FDA) for not complying withmanufacturing stand-ards. Then the mergerwas delayed by a fewmonths due to court in-terventions and clear-ances required from vari-ous regulatory authori-ties. Also, legal expenses,high staff costs and one-time write-off (about`600 crore) affected theprofitability of the com-pany. Margins came un-der pressure. In calendar2014, after accountingfor the business ofRanbaxy, gross marginsfell from 83 per cent to73 per cent, EBITDA mar-gins dropped from 45 percent to 32 per cent andnet margins, while stillbetter than peers inIndia, nosedived from 35per cent to 20 per cent. On a standalone basis,Sun Pharma reported a net loss during the year.
“For year ended March 2015, EBITDA as wellas net profit were adversely impacted by a fewitems, relating to professional charges and im-plementation of Sun policies and practices onRanbaxy for the full year. Material cost as apercentage of the net sales was 25 per cent, staffcost at 16 per cent and other expenditure wereat 30 per cent,” Sudhir Valia, Whole TimeDirector of Sun Pharma, told an analyst meet.
To add to its woes, Sun was hit by manufac-turing issues at its Halol facility in the US, itsmain supplier to that country. Price erosion inseveral product categories in the US is also im-pacting Sun. Analysts, who are bullish on Sun’slong term growth, are concerned about mid-term prospects.
“Sun Pharma expects revenues to remain flat or show a decline in FY 2016, as the Ranbaxy integration is expected to increase its costs. The consolidated profit in addition to revenue may also be adversely impacted due to certain ex-penses and charges arising out of integration and remedial actions,” says Sarabjit Kour Nangra, Vice President, Research – Pharma at Angel Broking, noting that the woes of Ranbaxy integration were evident since the fourth quarter results of 2014/15. Shanghvi, who has already
warned of a flat revenue and profit growth this fi-nancial year, hopes to re-solve its US manufacturing issues and get synergistic benefits of $300 million from Ranbaxy by FY 2018.
“Going ahead, we ex-pect a staggered progress in its US sales because of the continued impact of price erosion and regula-tory supply constraint in its largest facility (Halol). We maintain that the clearance for its Halol plant is a couple of quar-ters away,” says Phillip Capital analysts Surya Patra and Mehul Seth.
Emkay global analysts Jatin Kotian and Gaurav Tinani believe approvals for new drugs from Halol,
uncertainty over launch of generic version of blood cancer drug Gleevec later in this financial year and integration of some of Ranbaxy’s India businesses, such as acute therapy, will continue to be issues that bother Sun in the near term.
But Shanghvi is gearing up for a bigger bat-tle. His priority is to smoothly integrate Ranbaxy and bring the derailed businesses back on track to carry on the good work of the past. Despite issues with the integration of Ranbaxy, Sun Pharma divested a couple of domestic assets of Ranbaxy, increased research and development expenses, and acquired a couple of small over-seas companies. Shangvi is now embarking on a major fund raising plan for bigger acquisitions to make Sun shine brighter. ~
@pb_pbjayan
INDIA’S MOST VALUABLE COMPANIES SUN PHARMA
8RANK
50%US Formulation
24%India Branded
Generics
4%ActiveIngredients& Others
8%Western Europe& Other Markets14%
EmergingMarkets
A GLOBAL FOOTPRINTRevenue Mix (Post Merger)
CONSOLIDATED`27,287 crore


82 BUSINESS TODAY November 8 2015
Anil Agarwal climbed up the busi-ness ladder at a fast pace.However, of late, things do notseem to be moving for hisVedanta group. First, it was de-nied permission to mine bauxiteat Niyamgiri, Orissa. Then, itwas hit by the mining ban inGoa, where its iron ore miningcompany Sesa Goa was based.
Later, it faced challenges in merging Sesa Goawith Sterlite, a copper producer. The two finallymerged in August 2013. In April this year, thecompany was named Vedanta Ltd.
The merger has failed to bring good tidingsfor the entity. In the last one year, Vedanta’smarket value has fallen 40.8 per cent to`46,405 crore, pulling down its BT500 ranksignificantly – from 21 to 46. This despite thefact that its standalone profit rose 79 per cent to `1,927 crore in 2014/15. The biggest reason for this is depressed metal prices due to the slowdown in China – which is exporting its surplus metal production – and other emerging markets that has clouded the outlook for metal and mining companies across the globe. Excess capacity in metals and mining, say analysts, is going to keep prices subdued for a long time, making stock in-vestors bearish on the space.
Vedanta’s subsidiary Cairn India has not fared any better. Its market
INDIA’S MOST VALUABLE COMPANIES VEDANTA
46RANK
Rough RideVedanta’s market value falls despite a
decent rise in profi ts as investors shun
mining and metal stocks. By NEVIN JOHN
VEDANTA● RANK 2015: 46
● RANK 2014: 21
● MARKET CAP FY15 APRIL-SEPT:
`46,405 crore
● TOTAL INCOME: `36,322 crore
● NET PROFIT: `1,927 crore
● ROCE: 2.68%
● SO WHAT: Rank down from 21 to 46; market cap falls 40.8%Source: CMIE Prowess, Standalone data

Vedanta’s zinc mine in Bhilwara, Rajasthan
November 8 2015 BUSINESS TODAY 83
V I V A N M E H R A

84 BUSINESS TODAY November 8 2015
value slipped 47.8 per cent to `33,474 crore as crude oil prices fell. Its rank fell from 29 to 59. The group has sought an approval for merging Cairn India with Vedanta. The merger is ex-pected by the beginning of next year.
The only group company that hasn’t been hit much is Hindustan Zinc – though its BT500 rank came down from 28 to 31, the average market value rose 1.6 per cent to `66,904 crore.
Slowdown in China has affected most metal companies across the globe, says Deven Choksey, Managing Director, KR Choksey
Investment Managers. The consolidated revenue of Vedanta — in-
cluding subsidiaries Cairn India and Hindustan Zinc — rose one per cent to `73,364 crore in 2014/15 after comparing with the adjusted pro forma numbers of 2013/14. This was due to higher copper production, ramp-up of the Korba facility and commissioning of Unit I at Talwandi Sabo Power. Also, sale of iron ore from Karnataka partially offset weak commodity prices. EBITDA for the year was `22,226 crore, 13 per cent less than in 2013/14.
Financing costs due to acquisitions stood at `5,659 crore. In addition, Vedanta announced an impairment charge of `19,180 crore ($3.1
billion) for loss of value in Cairn India, which it had acquired for $8.67 billion in 2011. Vedanta owns a 59.88 per cent stake in Cairn India.
Tom Albanese, Chief Executive Officer of Vedanta, recently told BT that the group saw the government’s Make in India initiative as an op-portunity. “Manufacturing requires enormous amounts of steel, iron ore, aluminium, copper, and oil and gas. That is where Vedanta’s busi-ness power comes in,” he said.
In the first quarter of 2015/16, the consoli-dated revenues were largely flat at `16,952 crore. Decline in crude oil prices by 44 per cent year-on-year impacted revenues by `1,856 crore; this was largely offset by improved reve-nues from copper, zinc and power businesses. The EBITDA, at `4,039 crore, was lower by 29 per cent due to steep fall in crude oil and alu-minium prices.
“Our diversified business model supported by operating strengths and structurally low-cost assets will give long-term returns to stakehold-ers,” Albanese said after announcing the first quarter results. “We continue to focus on im-proving efficiency, lowering costs and enhancing production across our well-invested asset base.”
Albanese, who joined Vedanta about one-and-a-half years ago, is looking to take the alu-minium facilities’ operating capacity above the last year’s level of 38 per cent. The other priori-ties include securing a local source of bauxite for refineries and smelters, enhancing iron ore min-
ing in Goa and de-risking the oil and gas business from weak oil prices.
“We need to continue strengthening our balance sheet through further deleveraging and simplifying the corporate structure. We will continue to have relentless focus on costs along-side capacity utilisation,” he says.
Vedanta’s present market price is low con-sidering its potential, according to Choksey. “The other positives are restarting of iron ore mining in Goa, rise in zinc demand and fall in explora-tion and production costs of Cairn from $35-36 a barrel to $30-32,” he adds. ~
@nevinjl
TOM ALBANESE, Chief Executive Offi cer/Vedanta
“We need to continue strengthening our balance sheet through further deleveraging and simplifying the corporate structure”
INDIA’S MOST VALUABLE COMPANIES VEDANTA
46RANK


Motherson Sumi Chairman Vivek Chaand Sehgal
INDIA’S MOST VALUABLE COMPANIES MOTHERSON SUMI
49RANK
MOTHERSON SUMI SYSTEMS● RANK 2015: 49
● RANK 2014: 64
● MARKET CAP FY15 APRIL-SEPT:
`42,651 crore
● TOTAL INCOME: `5,567 crore
● NET PROFIT: `515 crore
● ROCE: 19.5%
● SO WHAT: Breached Top 50; grown its market cap 46.4%Source: CMIE Prowess, Standalone data

Fast CompanyVivek Chaand Sehgal has driven Motherson Sumi Systems at
breakneck speed to the top of the Indian auto components
industry. By CHANCHAL PAL CHAUHAN
November 8 2015 BUSINESS TODAY 87
There are few companies that can match the pace of growth of Motherson Sumi Systems (MSSL). Starting from a humble T-Couple maker for the Maruti 800, the quintessential car that changed mobility in India, and `83 crore revenues in 1999, MSSL is now a `35,000-crore ($5.4-billion, consolidated revenues) entity, with profits of `1,291 crore. It all started with a meagre `1,000 ‘seed capital’ that first-generation entrepreneur Vivek Chaand Sehgal took from his mother to make electrical wires. For decades, MSSL remained a small player in the auto component industry. In 2009, as the world reeled from the aftershocks of the Lehman crisis, MSSL
hit gold with the acquisition of UK-based Visiocorp’s global rear view mirror business. Sehgal bought Visiocorp, a $750-million company, for $32 million in a stock cum cash deal.
“We saw opportunity in recession and Visiocorp made us truly global,” says Sehgal, recalling the calculated risk that changed the course of his business. Following the Visiocorp buy, MSSL’s consolidated revenues went from `2,595 crore in March 2009 to `6,702 crore in March 2010. But it wasn’t just about the revenues; the deal’s implications went much beyond that. Visiocorp came to MSSL along with its subsidiaries, and gave the buyer world leadership in a product MSSL wasn’t strong in; access to 16 manufacturing plants in 12 coun-
SH
EK
HA
R G
HO
SH

88 BUSINESS TODAY November 8 2015
tries, including Hungry, Mexico, Brazil, China and Australia; and marquee customers includ-ing the likes of BMW, GM, Ford, Peugeot-Citroen, Hyundai, Renault-Nissan and Volkswagen.
And then, in 2011, came the bigger buy, of distressed German polymer major Peguform. Sehgal bought the company, which had reve-nues of $1.5 billion in 2010, for $82 million for its 80 per cent stake. That took Motherson’s revenues (consolidated) up from `8,175 crore in 2011 to `14,702 crore in March 2012. Peguform gave him a product line-up that in-cluded door trims, dashboards and plastic mouldings, manufacturing across seven coun-tries, and world class customers like Porsche and Mercedes-Benz. “We always acquire what our customers suggest,” says Sehgal. “It’s not a case
of acquiring just an overseas asset, but an op-portunity to serve our customers better.”
Today, MSSL has 145 manufacturing plants in 25 countries across the world, and sees 85 per cent of its revenues coming from overseas.
No wonder the stock markets love the company. In 2005, MSSL’s six-month market cap was less than `2,000 crore. The Visiocorp acquisition spurred it close to `6,000 crore in 2010, and market cap crossed `12,000 crore in 2012. That was the time it broke into the Top 100 of the BT500. This year, MSSL’s six-month market cap has crossed `42,000 crore, propelling it into the elite league of India’s 50 most valuable companies.
Faith, and the five-year planAs a Group, Motherson has acquired 16 compa-nies in the past decade. That is less than the 22 acquired by the Arvind Dham-owned Amtek Group, but MSSL has raced past all its competi-tors in terms of turnover and valuations. Only a decade ago, MSSL was a fringe player in the do-mestic circuit, with companies like Bharat Forge, Sundaram Fasteners, Rane Group, Sona Koyo, Shriram Pistons, Asahi India, Subros,and Lumax Industries ruling the roost.
Pune-based Bharat Forge was the poster boy of the Indian component industry, exporting products like axles, crank shafts and connecting rods to Europe and the US. It was billed to strengthen its position as the largest player on the back of huge orders from its overseas clients, but failed to capitalise on the growing sector as it started moving into non-auto areas.
Sources in the component industry say that most of these players’ operations were restricted to the domestic market with some exposure to exports, but they avoided the risky inorganic route that catapulted MSSL as well as Amtek Group into multi-billion dollar entities, which others can’t match today. Today, Bharat Forge has consolidated revenues of `7,761 crore, and Amtek Auto, `15,700 crore.
His peers say that his strength lies in con-structing relationships. Sehgal’s first joint-venture with Japanese firm Sumitomo has gone from strength to strength and continues to
generate immense wealth for all. “Japanese are great partners if you keep their trust,” says a New Delhi-based component maker. “Sumitomo has given MSSL huge support right from initial joint venture when they ignored his liabilities and assessed the company only on its net asset value.”
Like its peers, MSSL initially grew by supply-ing core components to Maruti Suzuki. MSSL’s specialisation was wiring harnesses, which is one of the smallest electrical components for any car, but critical for its technical function-ing. “Initially, we continued to focus on our primary business of electric harnesses,” says Sehgal. “The consistent growth in absolute
INDIA’S MOST VALUABLE COMPANIES MOTHERSON SUMI
49RANK
Like its peers, MSSL initially grew by supplying core components to Maruti Suzuki. Its specialisation was wiring harnesses

volumes helped us lay the foundation to move beyond to automotive mirrors and plastics.”
And how has MSSL grown so consistently over the years? Sehgal credits that to a simple Excel sheet, where he maps the volumes he expects to produce in five years, based on his customers’ growth plans. Unlike the Indian government’s five-year plans, MSSL’s plans have mostly exceeded targets.
The first five-year plan happened when the company had revenues of just `14 crore, and it set a revenue target of `100 crore for the next five years, much to the bemusement of his team. “Two of my team members quit, saying this man has gone mad,” chuckles Sehgal. “We missed it by almost a fifth, purely on external reasons – as Maruti Udyog’s (then a different name) sales dipped.” But it gave Sehgal the confidence to move ahead. The next five-year target was comfortably achieved. “Later we achieved a handsome 50 per cent gain over our 2010 targets, hitting $1.5-billion turnover for the first time,” he says. “Subsequently, the confidence for such high aims helped us to become a `40,000 crore entity.” As a group, Samvardhana Motherson has rev-enues of `43,000 crore.
What’s the five-year target now for 2020? It is a rather ambitious $26 billion or `1.6 lakh crore. If achieved, MSSL would comprise almost 50 per cent of the entire component industry’s turnover. “We have been called crazy every time we set these five-year targets,” Sehgal says, smiling from ear to ear. “Nobody believes us when we start.” There are reasons behind Sehgal’s confidence. Currently, 14 new plants are coming up overseas and four more are being added in India, enlarg-ing the product portfolio to over 1,100. “The facilities that we are creating would form the foundation of our growth over the coming five years,” the company said in an investor presentation.
Expectedly, analysts tracking the component industry remain sceptical on the target, but do not rule out their achievement. “Motherson has been a clear exception across all players,” says Gaurav Vangaal, Senior Analyst at IHS Automotive, a global forecasting firm. “Many com-panies have sold their foreign assets on failure to turn them around or simple management failures. Motherson has not just made its foreign subsidiaries sustainable, but it has a unique ability to strengthen bonds with global
carmakers through these acquisitions with strong inflow of orders and technology.”
“His model of meeting specific needs of automakers makes him unique and couldn’t be emulated by others who largely remain dependent on aftermarket supplies to keep their facilities up and running,” says Vinnie Mehta, Director General of Automotive Component
Manufacturers’ Association of India, the apex body of component makers. For the record, MSSL has no presence in India’s automotive aftermarket.
Of course, Seghal’s ride to fame and riches has not been without bumps. He was almost on the verge of bankruptcy with the acquisition of Visiocorp that was much harder to turn around than he ex-pected. The second shock came in 2012, when the IPO of Samvardhana Motherson Finance Ltd., a group holding company, had to be withdrawn on poor investor re-
sponse. And the latest hit is the alleged emission cheat-ing case of one of his largest European customers, Volkswagen Group, involving over 11 million cars that has tanked MSSL shares on fears of repercussions on his global operations. Sehgal, though, insists the VW scandal will not impact his business.
If there’s one thing about Sehgal that you can’t miss, it is his broad, unwavering smile. Tricky questions don’t faze him. He doesn’t plan strategies to meet his targets. And he doesn’t see any challenges for his com-pany’s growth. Reason? When times are good, business is obviously good. And when times are bad, business is better because he can acquire companies at throwaway prices. He loves to live life well – he has driven almost every luxury car in the world and owns several, he loves golf, loves music, with Kishore Kumar being the favourite. His senior managers all have luxury cars, and also get plum overseas postings with every new acqui-sition. He doesn’t think much of MBAs or IIT grads, preferring to hire people from smaller, relatively un-known institutes.
And, he doesn’t take stress; he has tension. “It’s like a musical instrument – if the strings are not at the right tension, they won’t work,” he explains.
That would likely tense up the rest of the auto com-ponent fraternity. ~
@sablaik
COMPANY IS LOOKING AT A $26 BILLION REVENUE BY 2020

90 BUSINESS TODAY November 8 2015
Market cap up 159.7 per cent, top-line growth of 14 per cent and 68 per cent rise in bottom line — it has been a dream run for Britannia Industries, the `7,850-crore (consolidated rev-enues) biscuit and dairy products manufacturer, in 2014/15. There is an obvious sense of pride and satisfaction in the voice of the 53-year-old Managing Director (MD), Varun Berry, who says a lot of hard work has gone into taking the company to where it is now.
When Berry stepped into the shoes of Vinita Bali a year-and-a-half ago, Britannia was among the country’s leading
biscuit makers, but with quite a few missing links. “The company was sitting on past laurels, was laid back, and not really bothered about offering consum-ers delightful products, the fundamental ingredient for the success of any food company,” he says.
Britannia was way behind market leader Parle Products in market share and ITC Foods was clearly the rising star in biscuits. With popular products such as Chocofills and Chocomeltz, ITC was taking the market, especially its top end, by storm. “We had not come up with an innovative product for a long time,” says Berry.
In fact, if rumours are to be believed, one of the major reasons Chairman Nusli Wadia preferred Berry was Vinita Bali’s inability to expand market share in biscuits, the company’s core business. Under Bali, Britannia had also diversi-fied into a lot of new categories such as oats that did not yield the desired returns. In biscuits, too, the focus was too much on health. The company, for instance, launched biscuits for diabetics. These had few takers, as most Indians buy food
INDIA’S MOST VALUABLE COMPANIES BRITANNIA INDUSTRIES
61RANK
A New RecipeNew distribution strategy, launches and renewed focus on rural
areas helped Britannia increase profi ts. By AJITA SHASHIDHAR
BRITANNIA INDUSTRIES● RANK 2015: 61
● RANK 2014: 118
● MARKET CAP FY15 APRIL-SEPT:
`32,534 crore
● TOTAL INCOME: `7,607 crore
● NET PROFIT: `622 crore
● ROCE: 58.8%
● SO WHAT: Jumps 57 slots to get into Top 100; market cap rises 159.7%Source: CMIE Prowess, Standalone data

Britannia’s Managing Director Varun Berry
November 8 2015 BUSINESS TODAY 91
more for taste than nutrition.“ITC came up with delightful innovations in biscuits
and stole the show,” says A. Mahendran, Chairman & MD, Global Consumer Products. He was earlier the MD of Godrej Consumer Products. “Britannia has benefited more from low commodity prices. There is a mismatch between its top line and bottom line growth,” he says. Prices of commodi-ties such as sugar and wheat have fallen 25 to 30 per cent in the last one year, which has helped the company regis-ter healthy volume growth.
Berry agrees that falling commodity prices have helped volumes but asserts that the company also invested heav-ily in expanding the distribution network and improving the product pipeline. In March 2015, the company’s products were available in one million outlets, as against 7.5 lakh one-and-a-half year ago. The last one year, he says, has been spent in putting together cost-optimisation strategies related to ingredients, packaging and distribu-tion. “Our biscuits travel hundreds of kilometres to reach consumers. So, we asked ourselves if we should open smaller factories across the country? Though we set up a couple of larger factories, we reduced distribution costs by making products that were more in demand in that geog-raphy. This increased profitability.”
He also took tough calls like consolidation of stock-
keeping units or SKUs. Britannia had 250 SKUs of biscuits, cakes and rusks, besides 120 SKUs of dairy products. Around 80 biscuit and 65 dairy SKUs were axed. “We feared this could impact volumes, but we also believed that this way we would be able to do justice to the bigger SKUs,” says Berry. The company also identified blockbuster brands such as GoodDay, Nutrichoice, Milk Bikis, 50:50 and Tiger and made extra efforts to develop them.
Managing TalentWhen Berry joined the company in 2012, his foremost concern was that its biscuits were not as delicious as that of competition. But even more worrisome was the lack of urge to innovate. So, instead of product innovation, he first decided to put his team in place and rejig the distribu-tion network.
He got rid of as many as 300 people from the sales team. “We strengthened our team despite this. We did so by empowering people and making them responsible and accountable. In the earlier structure, we had sales coaches, who were not responsible for sales. This to my mind was a no-no.”
Berry spent 30 per cent of his early days hand-picking the core team. While it would have been easier to get peo-ple from outside, he decided to groom in-house talent to
N I L O T P A L B A R U A H

92 BUSINESS TODAY November 8 2015
ensure that the team didn’t feel alienated.“Today, seven people out of the 10 who report tome are from Britannia itself.”
DistributionBritannia has been known to be skewed to-wards urban markets. Its competitor Parle(with Parle G and Monaco) is more associatedwith rural markets. To change this, Berry de-cided to strengthen the rural presence. “We setup a hub-and-spoke rural distribution modeland within a year increased our rural reach byover 8,000 outlets. Today, rural is growingfaster than urban.”
Abneesh Roy, Associate Director(Institutional Equities - Research), EdelweissSecurities, in a recent report said thatBritannia’s rural share, especially in the Hindibelt (where Parle has a distinct edge), is one-fifth of Parle’s. Berry says their focus during thenext few months will be on rural penetration.He plans to bring the entire range of Britannia’svalue brands under the Tiger umbrella, tar-geted at rural markets.
The premium segment, Britannia’s strong-hold, has seen the launch of a lot of innovativeproducts such as Goodday Chunkies,Nutrichoice Heavens, Chocolush and Rum &Raisin Cakes. Berry believes this segment will
bring incremental growth.To make distribution in urban areas more
efficient, Berry built a split route model wherein the 250-odd SKUs were divided between two salespersons. “Earlier, one salesperson used to walk into a store. Now, two people go, each with different SKUs. This has helped us put more SKUs in stores,” says Berry.
Analysts feel Britannia still has a lot of work to do before it can match ITC in innovation. According to Peshwa Acharya, former Chief Marketing Officer of Reliance Retail and cur-rently founder of a marketing accelerator firm, thinkaconsumer.com, Britannia’s biggest plus is that it is synonymous with biscuits. “Britannia should use this to create more biscuit consump-tion opportunities. It could focus on the taste-plus-nutrition proposition.”
Both Acharya and Mahendran feel that it is crucial for the company to put its innovation pipeline on the treadmill.
Berry’s vision is to make Britannia a `20,000 crore company in the next five years. He plans to do this not just by investing in biscuits but also in adjacent categories. He doesn’t specify the categories but says chocolates, snacks and breakfast could be some areas of interest.
Berry is also focusing on the `400-crore dairy business. “We will announce our dairy strategy in the next three-four months.” The plan, he says, is to look at an integrated strat-egy, which will include a clear milk collection and processing model. Britannia at present works with contract manufacturers, which he
thinks isn’t viable.Berry is hopeful about global operations
whose turnover has doubled in the last one year from `300 crore to `600 crore. Britannia exports its products to around 72 countries and has production facilities in the UAE and Oman. “I want our international business to contrib-ute at least 25 per cent to revenues in the next few years.”
When asked what is the one big change that has happened in the company in the last one year, he says, “It is much more competitive now. There is absolutely no room for inertia.” ~
@ajitashashidhar
RA
CH
IT
GO
SW
AM
I
A. MAHENDRAN, Chairman & MD, Global Consumer Products
“ITC came up with delightful innovations in biscuits and stole the show”
INDIA’S MOST VALUABLE COMPANIES BRITANNIA INDUSTRIES
61RANK


96 BUSINESS TODAY November 8 2015
Five years ago, Warren Buffett, the world’s big-gest investor, had said his worst investment was the textile mill that went by the name Berkshire Hathaway. It was a name that he famously used to invest in several other businesses, although he
closed the mill after a while. But if Buffett had encountered Indo Count Industries, he would probably have changed his mind about textiles. In the past 18 months, the share price of the home textile company has jumped 20-fold, from `44 per share in April 2014 to over `900 in October 2015.
And if you think it’s just a stock thing, well, it’s not. In the past five years, the company, which makes bedsheets for exports, has demon-strated strong all-round performance. On a standalone basis, its top line grew
from `666 crore in 2010/11 to `1,680 crore in 2014/15. In the same period, its net profit rose from `9 crore to `139 crore. Among its peers, it has the highest return on capital employed and the lowest debt to equity ratio (see Magic Numbers). This, after it got itself into a mess in 2008, which resulted inthe company going in fora corporate debt restruc-turing (CDR) exercise,which it got out of inMarch 2015, four yearsahead of schedule.
No wonder investorshave been left enam-oured. The stock’s per-formance has alsomeant that Indo CountIndustries has made acomeback into the ex-alted BT 500 after 22 long years. Ithad the biggest jump in ranking – by 511 places to rank 366 in the pecking
order, thanks to an almost 650 per cent jump in average market capitali-sation – April to September 2015 – to `2,748 crore, compared to `350 crore in 2014.
Comeback CompanyThe journey to reach the top 500
companies wasn’t easy f o r I n d o C o u n t Industries. In August 2008, it had to go in for C D R f o l l o w i n g a `150-crore loss on ac-count of a forward de-rivative contract – at that time, its revenue was 290 crore. “It was a mistake, and we had to pay a huge price for it,” says R. Sundaram,
CFO and Company Secretary. “When the rupee was at `41 per dollar, we took a forward contract that the rupee
Back from the Brink
Indo Count Industries went into corporate debt restructuring in 2008; today,
the company has roared back into business, and is one of the most valuable
companies in India. By MAHESH NAYAK
INDIA’S MOST VALUABLE COMPANIES INDO COUNTINDUSTRIES
366RANK
IN THE PAST 18 MONTHS, THE SHARE PRICE OF INDO COUNT HAS JUMPED 20-FOLD

November 8 2015 BUSINESS TODAY 97
would appreciate to `35 per dollar, but it went to `55 per dollar. Due to the huge currency loss, our debt to equity was close to 1:8.”
Adds Anil Kumar Jain, Chairman and Managing Director of Indo Count Industries: “We were left with two op-tions – survive or suicide. Rather than fighting with the banks that got us into trouble due to the currency loss, we decided to get back strongly and grow the business such that today, without taking a hair cut, we have repaid every penny to the banks.”
What helped was that the com-pany had sowed the seeds for growth before the 2008 crisis. In 2006, it entered the home textile business – earlier, it was into spinning and ex-porting yarn and in consumer dura-bles – triggered by the US ending its quota regime in 2005. Today, home textiles account for 81 per cent of its revenues.
“Strategy of forward integration into home textile has been the game changer for Indo Count Industries,” says Rajesh Kothari, Managing Director of AlfAccurate Advisors, who has been an investor in Indo Count Industries since last October. “Unlike its peers (Alok Industries and Welspun) that went for backward in-tegration, Indo Count Industries re-mained asset light, which has helped them record impressive returns on their capital employed.”
The company focused on investing in processing capacities and out-sourced two-thirds of its spinning and weaving activity. “This was a con-scious strategy and probably we will be the only company in the world to adopt such a model,” says Anil Kumar Jain. Adds Manish Bhandari, Managing Director of Vallum Capital Advisors, “There are three reasons why the stock of Indo Count Industries was attractive and a buy. First, the business revival due to the shift in dy-namics from China to India in the home textile business; second, the de-clining raw material prices of cotton; and third, the under utilisation of ca-pacity of the company.”
MAGIC NUMBERS INDO COUNT WELSPUN TRIDENT ALOK INDUSTRIES INDUSTRIES
Total income ( crore) 1,687.19 4,671.15 3,834.47 22,719.56
Profi t ( crore) 139.04 510.14 117.82 348.76
RONW (%) 58.09 41.11 9.88 6.44
ROCE (%) 22.79 13.99 3.45 1.66
Debt to equity (times) 1.08 1.72 1.77 2.87
One year stock returns (%)* 418% 152.50% 32% -44%* (as 9 October 2015) Full Year fi nancials on standalone basis as on 31 March 2015; Source: CMIE Prowess
Anil Kumar Jain, CMD, Indo Count Industries
PH
OT
OG
RA
PH
S B
Y R
AC
HI
T G
OS
WA
MI

98 BUSINESS TODAY November 8 2015
In the past year, the company has ex-panded its addressable market from $4 billionto $13 billion in the US by diversifying into newproducts like fashion bedding, institutionallinen and utility bedding. “Going ahead, thenew product segment will account for 25 percent of the growth in the company,” says MohitJain, promoter at Indo Count Industries. Apartfrom diversifying its product range, the com-pany is also spreading its wings to Europe and
Australia. Today, the US accounts for 70 per cent of its revenues, which Jain wants to bring down to 50 per cent in four to five years. “We have already opened offices in Manchester and Melbourne,” he says. “We plan to open an office in Dubai to cater to the Middle East and North Africa region (MENA) region.” Anticipating further growth, the company plans to expand capacity at its existing Kolhapur plant, from 68 million metres to around 100 to 110 million metres over the next two years.
And, while Mohit Jain agrees that the rise in cotton prices and rupee appreciation are risks, he says he can handle them. Says K.K. Lalpuria, Executive Director at Indo Count Industries: “Rise in raw material prices, slow-down in the US market and rupee appreciation will hit everyone. Consider margins coming down by 10 per cent for everyone, we will still be profitable.”
CFO Sundaram has the last word when he says, so long as people prefer to sleep in beds, Indo Count Industries will be in business.
Well, that’s not something we’re arguing with. ~
@MaheshNayak
R. SUNDARAM, CFO & Company Secretary, Indo Count Industries
“It was a mistake, and we paid a huge price for it. When the rupee was at `41, we took a forward contract for `35, but it went to `55 per dollar. The huge currency loss, led to huge losses for us”
INDIA’S MOSTVALUABLECOMPANIESINDO COUNTINDUSTRIES
366RANK
SHAREHOLDER’S DELIGHTStock price comparison with peers
14/10/201513/10/2014
100
528.7
265.6
136.3101.559.9
INDO COUNT WELSPUN TRIDENT ALOK INDUSTRIES S&P BSE SENSEX
Figures rebased to 100


100 BUSINESS TODAY November 8 2015
Renewable energy, especially wind power, is ridinga strong tailwind. Ever since the NDA came topower at the Centre, it has emphasised on reducingthe dependency on conventional sources of energyand, instead, has worked towards increasing out-
put of renewable power.And, the focus on non-conventional ways to generate
electricity has provided the much-needed fillip to windenergy companies, including Noida-based Inox Wind,which makes wind turbine generators and provides turn-key solutions for wind power projects. It has a robust orderbook of 1,220 MW as on June 2015, with turnkey pro-jects contributing 60 per cent and equipment supply or-ders making the rest. Its clients include independentpower producers, utilities, public sector units and corpo-rates such as Tata Power, Continuum Wind and CESC.
The company’s two units, one at Una, HimachalPradesh, and the other at Ahmedabad, which has tied upwith Austrian wind major AMSC to manufacture 2MWwind turbine generators, has the capacity to produce 800MW. Once the third unit in Madhya Pradesh starts opera-tions, Inox’s annual capacity will be 1,600 MW. It is alsofocusing on increasing land bank across wind-rich states.
Founded in 2009, Inox has already made significantstrides in recent years. Its revenues have grown at astaggering CAGR of 60.35 per cent over the past twoyears from `1,005 crore in 2012/13 to `2, 558 crore in2014/15, while net profits have nearly doubled from
`148 crore in 2012/13 to `332 crore in 2014/15. Earlier this year, Inox went public with a `1,020-crore IPO that was oversubscribed by 18 times.
Inox now looks into the future with hope. One, the government has set an ambitious target of 60 GW of in-stalled wind energy capacity by 2022, up from 23.8 GW in July 2015. “Inox will introduce newer, technologically-advanced products, which yield higher energy at lower costs, thereby increasing the return on investments. It has sufficient land bank for the installation of an aggregate capacity of more than 4,500 MW,” says Devansh Jain, Director, Inox Wind. Besides gaining from manufacturing of turbine generators, Inox has the expertise to offer end-to-end solutions.
With renewable energy becoming more viable, the central and state governments are also supporting its production by launching a series of measures. Some measures include accelerated depreciation on wind power assets, generation-based incentives, inclusion of wind power projects as CSR activity and doubling of the National Clean Energy cess. These initiatives will benefit Inox in the years to come. ~
@manukaushik
INDIA’S MOST VALUABLE COMPANIESINOX WIND
167RANK
It’s a BreezeThe government’s renewable energy goals
are helping Inox Wind power move ahead.
By MANU KAUSHIK
Devansh Jain, Director, Inox Wind
V I V A N M E H R A

November 8 2015 BUSINESS TODAY 101
On October 16, 2014, the Bombay Stock Exchange’sSensex stood at 25999.34. Exactly a year later, onOctober 15, 2015, the value was 27010.14. That’sa rise of 3.9 per cent. Normally, you would associ-ate that with a steady, secular (no pun intended)
growth. But a glance at the chart alongside will tell youthat the ride was anything but steady.
The past one year has been one of hugely undulatingemotions – a less used term for business, but perhaps ap-propriate in the current context – for corporate India. Anew government had taken over at the Centre in mid-2014, amidst hopes of swifter decision making, sanerpolicies, less corruption, better tax policies, a softer interestrate regime, stronger GDP growth, and so on.
The crazy peaks and troughs of the chart sort of sym-bolise the joys and disappointments encountered on this journey. Of course, stock indices’ movements are influ-enced not only by government policy; company perfor-mance, strategies, moves, also contribute a fair bit. All put together, it has been one roller-coaster ride for com-panies and investors.
Which is why the BT500 becomes even more crucial in a time like this, in a time of great change. It coalesces the array of dancing numbers into a stable, understand-able pattern. The premise of the BT500, average market capitalisation of listed companies for six months between April and September, helps make that vision clear. And as such, this year’s BT500 listing was prepared with gusto, and much anticipation.
The ProcessThe base data for the exercise was pulled out of CMIE’s Prowess database. A total of 6,941 companies listed on the BSE and NSE were considered as our primary universe. To weed out illiquid companies, stocks that traded for less
than 20 per cent of the total number of trading days (125) between April 1 and September 30, 2015, were not considered. Finally, 3,378 companies qualified for the rankings. The top 1,000 companies, based on their aver-age market cap value, were ranked. Financial ParametersThe market capitalisation was the primary metric used to rank the companies. But just showing the market cap does not present a holistic picture. Therefore, we have pulled out some other key metrices, too. These include Total Assets, Total Income, Net Profit, profit as percentage of total income, Return on Net Worth and Return on Capital Employed. Rankings based on these parameters have also been pro-vided to give our readers an understanding of the broader picture. The financial year ended March 2015 was consid-ered for the financial parameters, and exceptions have been specified with footnotes. Standalone numbers were taken into account for all the ranked companies. ~
INDIA’S MOST VALUABLECOMPANIESMETHODOLOGY
How We Did It
ROLLER COASTER RIDEThe BSE Sensex has been highly volatile over the past year
20000
25000
25000
Oct 16, 2014 Oct 15, 2015
27,010.14
25,999.34
BSE Sensex

102 BUSINESS TODAY November 8 2015
AVERAGE MARKET CAPITALISATION ( crore)Apr-Sept 2015 Apr-Sept 2014 Growth % 2014/15 2013/14
OVERALLRANKS Rise
INDIA’S MOSTVALUABLE COMPANIES THE TOP 500
Reliance Industries The second most valued company is the leader in terms of net profi ts
2
Eicher MotorsMarket value has jumped 123 per cent, helping it climb 33 ranks
42
Fall NoChange
RANK
201
5
COMPANY
RANK
201
4
1 1 Tata Consultancy Services 5,01,476 4,63,203 8.3 4,82,880 3,68,810
2 3 Reliance Industries 2,97,742 3,26,885 (8.9) 3,10,494 2,73,815
3 6 HDFC Bank 2,61,465 1,94,849 34.2 2,16,954 1,58,214
4 4 ITC 2,57,369 2,75,711 (6.7) 2,82,581 2,60,954
5 2 Oil & Natural Gas Corpn. 2,45,899 3,39,456 (27.6) 3,22,036 2,52,151
6 5 Coal India 2,41,897 2,24,846 7.6 2,27,791 1,79,892
7 7 Infosys 2,40,494 1,91,877 25.3 2,16,270 1,76,143
8 11 Sun Pharmaceutical Inds. ^^ 2,18,278 1,45,869 49.6 1,64,468 1,14,488
9 8 State Bank of India 2,00,169 1,82,164 9.9 1,99,922 1,25,083
10 10 Housing Development Finance Corpn. 1,96,536 1,53,742 27.8 1,69,863 1,27,083
11 14 Hindustan Unilever 1,88,160 1,40,181 34.2 1,59,922 1,25,989
12 9 ICICI Bank 1,74,852 1,65,585 5.6 1,80,281 1,20,781
13 12 Bharti Airtel 1,58,666 1,41,663 12.0 1,45,434 1,25,023
14 13 Larsen & Toubro 1,57,656 1,41,647 11.3 1,45,784 89,389
15 15 Wipro 1,39,264 1,34,111 3.8 1,40,420 1,14,082
16 18 HCL Technologies ## 1,32,191 1,04,331 26.7 1,13,039 73,979
17 19 Axis Bank 1,30,353 86,972 49.9 1,03,674 57,328
18 24 Kotak Mahindra Bank 1,23,127 70,667 74.2 83,202 54,275
19 16 Tata Motors 1,22,785 1,25,624 (2.3) 1,35,855 92,391
20 23 Maruti Suzuki India 1,21,337 74,485 62.9 88,790 47,676
21 17 NTPC 1,11,620 1,16,568 (4.2) 1,17,675 1,15,325
22 20 Indian Oil Corpn. 93,781 81,260 15.4 82,486 57,277
23 39 Lupin 81,597 49,147 66.0 59,127 37,904
24 25 UltraTech Cement 80,655 68,011 18.6 71,777 50,319
25 42 Bharti Infratel 79,750 47,308 68.6 55,375 31,256
26 22 Mahindra & Mahindra 77,630 74,684 3.9 76,153 55,956
27 31 Asian Paints 77,363 55,518 39.3 64,196 46,032
28 27 Power Grid Corpn. of India 72,897 66,611 9.4 70,773 49,086
29 45 Bosch ^ 72,238 39,968 80.7 52,478 28,147
30 35 Adani Ports & Special Economic Zone 67,528 51,201 31.9 56,997 30,953
31 28 Hindustan Zinc 66,904 65,873 1.6 68,213 51,030
32 30 Bajaj Auto 66,897 61,740 8.4 65,212 55,359
33 43 Dr. Reddy’s Laboratories 64,059 45,805 39.9 50,832 40,017
34 44 Bharat Petroleum Corpn. 61,594 41,705 47.7 46,336 25,710
35 38 Nestle India @ 61,438 50,332 22.1 56,843 49,256
36 34 Idea Cellular 61,137 51,453 18.8 54,194 49,731
37 32 Bharat Heavy Electricals 59,523 55,288 7.7 59,116 39,879
38 40 Tech Mahindra 53,771 48,545 10.8 55,872 30,339
39 48 Cipla 53,044 36,275 46.2 44,204 32,286
40 47 United Spirits ^^ 50,412 37,046 36.1 40,575 35,113
41 37 Hero MotoCorp 50,277 50,363 (0.2) 54,050 33,014
42 75 Eicher Motors @ 49,975 22,379 123.3 30,956 10,892
43 62 IndusInd Bank 49,311 29,209 68.8 35,561 22,626
44 49 Dabur India 48,681 34,664 40.4 38,734 28,604
45 57 Siemens ** 48,469 30,496 58.9 33,636 19,814
46 21 Vedanta 46,405 78,404 (40.8) 71,744 38,456
47 26 NMDC 45,576 67,247 (32.2) 62,029 49,924
48 33 GAIL (India) 45,315 53,495 (15.3) 54,457 42,165
49 64 Motherson Sumi Systems 42,651 29,137 46.4 33,970 14,697
50 82 Aurobindo Pharma 41,216 20,595 100.1 26,230 8,074

“Ran
k20
14”
isas
publ
ished
inla
stye
ar’s
BT50
0;Pa
ram
eter
rank
sar
efo
rw
ithin
the
top
1,000
com
pani
es;R
anks
have
been
assig
ned
base
don
mul
tiple
deci
mal
s;Be
caus
eof
roun
ding
off,
som
era
nks
may
appe
arin
corr
ect;
Re-
sults
are
aud
ited
and
stan
dalo
ne; O
vera
ll ra
nks
are
base
d on
ave
rage
mar
ket
capi
talis
atio
n (A
pril
1, 20
15 to
Sep
tem
ber
30, 2
015)
; Fig
ures
in b
rack
ets
deno
te n
egat
ive
valu
e; R
OCE:
retu
rn o
n ca
pita
l em
ploy
ed; R
ONW
: ret
urn
on n
et
wor
th; n
a: n
ot a
vaila
ble;
NA:
not
app
licab
le; N
L: n
ot li
sted
on
the
bour
ses;
NR:
not
rank
ed la
st y
ear;
All t
he la
test
dat
a fo
r FY
201
5 un
less
oth
erw
ise in
dica
ted;
^^
12 m
onth
s en
ding
Mar
ch 2
014;
@ 12
mon
ths
endi
ng D
ecem
ber
2014
; **
12m
onth
sen
ding
Sept
embe
r20
14;#
#12
mon
ths
endi
ngJu
ne20
14;*
12m
onth
sen
ding
June
2015
;^15
mon
ths
endi
ngM
arch
2015
;#18
mon
ths
endi
ngDe
cem
ber
2014
;***
9m
onth
sen
ding
Mar
ch20
15;@
@15
mon
ths
end-
ing
Mar
ch20
14;@
@@
18m
onth
sen
ding
Mar
ch20
15;^
^^6
mon
ths
endi
ngM
arch
2015
;##
#9
mon
ths
endi
ngSe
ptem
ber
2014
;*@
15m
onth
sen
ding
June
2014
;#@
#18
mon
ths
endi
ngSe
ptem
ber
2013
;#^#
12m
onth
sen
ding
Mar
ch20
13;+
10m
onth
sen
ding
Mar
ch20
14;
BFSI B
anki
ng, f
inan
cial
ser
vice
s an
d in
sura
nce
com
pani
es h
ave
a di
ffere
nt w
ay o
f ear
ning
and
pre
sent
ing
finan
cial
dat
a, s
o th
eir
inco
me,
pro
fit a
nd a
sset
num
bers
hav
e no
t be
en ra
nked
. Th
e BT
500
com
pani
es o
ver
the
past
20
year
s at
: ww
w.b
usin
esst
oday
.in/b
t500
So
urce
: CM
IE P
row
ess
November 8 2015 BUSINESS TODAY 103
2014/15
NET PROFIT ( cr)2014/15 2013/14 Rank 2015
PROFIT AS % OFTOTAL INCOME
RONW (%) ROCE (%) TOTAL INCOME ( cr)2014/15 2013/14 Rank 2015
TOTAL ASSETS ( cr)2014/15 2013/14 Rank 2015
RANK
1-50
63,557 57,886 17 78,083 68,540 8 18,750 18,475 2 24.01 41.91 41.73
3,98,064 3,67,744 1 3,49,535 4,10,349 2 22,401 21,984 1 6.41 10.84 7.46
5,90,576 4,91,658 NA 57,470 49,352 NA 10,216 8,478 NA 17.78 19.37 10.75
44,717 39,710 30 52,086 48,374 15 9,638 8,814 8 18.50 33.88 33.81
2,37,604 2,37,198 2 92,528 95,177 6 17,733 22,095 3 19.16 12.70 12.64
23,512 25,052 49 14,642 16,519 50 13,383 15,009 4 91.41 80.67 80.67
62,451 53,211 18 51,210 46,936 16 12,164 10,194 6 23.75 26.98 26.98
14,122 9,529 76 3,174 2,789 208 (2,829) 517 885 (89.12) (37.23) (32.05)
20,51,494 17,94,570 NA 1,76,078 1,56,683 NA 13,102 10,891 NA 7.44 10.49 4.11
2,54,737 2,25,511 NA 27,882 24,543 NA 6,007 5,454 NA 21.55 20.39 2.66
13,942 13,269 79 34,040 30,648 28 4,315 3,867 18 12.68 123.28 123.28
6,48,784 5,96,882 NA 61,269 54,606 NA 11,175 9,810 NA 18.24 14.55 4.65
1,43,886 1,12,035 6 60,812 50,910 10 13,282 6,540 5 21.84 18.38 15.05
89,597 80,964 9 60,369 60,033 11 5,056 5,493 16 8.38 14.33 10.65
54,088 46,280 24 43,807 40,676 20 8,193 7,387 9 18.70 25.61 21.95
25,589 18,301 47 17,157 12,897 43 5,984 3,611 13 34.88 46.05 44.02
4,61,978 3,83,287 NA 44,023 38,296 NA 7,358 6,218 NA 16.71 17.75 6.91
1,06,076 87,628 NA 11,976 10,240 NA 1,866 1,503 NA 15.58 14.12 7.25
54,676 54,169 23 41,501 41,878 22 (4,646) 414 887 (11.19) -27.33 -13.16
42,685 38,616 32 56,229 49,934 13 3,711 2,783 19 6.60 16.61 15.75
2,10,832 1,92,006 4 78,377 75,724 7 10,319 10,975 7 13.17 12.32 6.43
2,31,312 2,61,171 3 5,04,337 5,43,960 1 5,270 7,017 14 1.04 7.88 3.83
11,096 8,895 97 10,068 9,475 74 2,397 2,355 27 23.81 29.95 29.60
35,570 29,935 39 26,443 23,499 32 2,015 2,144 35 7.62 11.21 8.30
23,724 23,427 48 7,400 5,570 93 2,647 1,055 25 35.77 14.83 14.83
33,308 31,641 41 42,327 43,891 21 3,324 3,758 20 7.85 18.45 15.18
7,330 6,756 131 13,859 12,341 52 1,327 1,169 46 9.58 33.90 33.53
1,66,999 1,46,332 5 17,770 15,728 42 4,961 4,492 17 27.92 13.66 3.96
12,379 10,795 92 13,479 9,821 54 1,338 885 45 9.92 19.61 19.20
25,809 20,906 46 4,740 5,032 143 2,183 2,016 31 46.06 21.41 10.63
49,057 41,713 28 19,240 17,003 39 8,139 6,905 10 42.30 20.15 20.15
15,704 14,895 68 23,107 21,904 33 2,814 3,248 22 12.18 27.72 27.49
19,178 16,768 57 10,319 10,028 71 1,681 1,933 37 16.29 16.84 13.05
71,407 73,728 15 2,56,137 2,72,663 3 5,082 4,060 15 1.98 24.39 13.54
5,928 6,410 158 10,272 9,516 72 1,185 1,117 49 11.53 45.51 36.51
59,170 45,081 21 31,732 26,416 29 2,810 1,689 23 8.85 15.00 6.79
79,388 84,665 11 34,567 43,993 27 1,419 3,461 43 4.11 4.23 4.06
17,908 15,577 60 19,707 17,182 38 2,256 2,695 30 11.45 22.74 22.38
16,866 14,273 63 10,373 9,836 70 1,181 1,388 50 11.39 11.16 10.05
11,164 13,227 95 21,115 19,025 36 (5,103) 321 888 (24.17) (100.00) (52.37)
10,539 10,113 100 29,888 27,711 30 2,386 2,109 28 7.98 39.30 38.40
2,236 1,490 327 3,447 2,002 192 559 279 84 16.22 54.40 53.61
1,09,393 87,190 NA 12,164 10,144 NA 1,794 1,408 NA 14.75 18.98 6.61
4,388 3,735 208 5,644 5,036 119 759 672 68 13.44 35.80 34.39
13,406 12,819 83 11,403 11,855 63 603 194 81 5.29 14.36 14.30
81,524 86,719 10 36,322 33,469 26 1,927 1,076 36 5.31 5.72 2.68
44,364 41,517 31 14,666 14,221 49 6,422 6,420 12 43.79 20.61 20.61
59,222 57,013 20 58,426 59,582 12 3,039 4,375 21 5.20 10.82 8.00
4,737 4,435 196 5,567 5,112 123 515 535 92 9.25 25.82 19.50
10,270 8,609 102 8,312 7,344 86 1,516 1,172 41 18.24 32.36 19.46

104 BUSINESS TODAY November 8 2015
AVERAGE MARKET CAPITALISATION ( crore)Apr-Sept 2015 Apr-Sept 2014 Growth % 2014/15 2013/14
OVERALLRANKS Rise
INDIA’S MOSTVALUABLE COMPANIES THE TOP 500
Britannia IndustriesJumped the most in termsof ranking among the top100 companies
61
DLFSlipped mostin top 100, even though its net profi t has increasedto `940 crorefrom `527 crore
98
Fall NoChange
RANK
201
5
COMPANY
RANK
201
4
51 59 Godrej Consumer Products 40,580 29,487 37.6 32,190 27,845
52 72 Shree Cement ## 38,264 24,827 54.1 29,402 15,429
53 77 Cadila Healthcare 37,619 22,136 69.9 26,851 15,966
54 46 Bank of Baroda 37,168 37,169 (0.0) 39,471 25,442
55 56 Ambuja Cements @ 35,699 33,205 7.5 35,011 27,708
56 67 Zee Entertainment Enterprises 34,467 27,097 27.2 30,791 24,148
57 51 Power Finance Corpn. 33,607 34,436 (2.4) 35,871 20,185
58 78 YES Bank 33,535 21,332 57.2 26,298 13,710
59 29 Cairn India 33,474 64,078 (47.8) 55,773 59,619
60 58 Grasim Industries 32,721 29,840 9.7 31,358 24,687
61 118 Britannia Industries 32,534 12,528 159.7 17,141 9,255
62 74 Container Corpn. of India 31,912 23,214 37.5 25,360 14,383
63 66 Oracle Financial Services Software 31,613 27,109 16.6 27,567 24,754
64 61 Titan Company 31,524 29,275 7.7 32,074 21,596
65 36 Adani Enterprises 31,328 51,141 (38.7) 55,128 23,928
66 93 Pidilite Industries 28,846 17,586 64.0 21,796 13,970
67 80 GlaxoSmithKline Pharmaceuticals ^ 28,255 21,173 33.4 23,597 21,476
68 41 Tata Steel 28,248 48,244 (41.4) 43,829 31,500
69 60 Rural Electrification Corpn. 28,036 29,278 (4.2) 30,364 19,887
70 79 ABB India @ 27,648 21,212 30.3 23,592 12,759
71 52 Oil India 27,557 34,339 (19.8) 33,651 29,770
72 108 Bharat Electronics 27,353 13,863 97.3 18,444 8,918
73 94 Glenmark Pharmaceuticals 27,322 16,855 62.1 18,814 14,637
74 55 Punjab National Bank 27,270 33,208 (17.9) 33,749 21,544
75 83 Colgate-Palmolive (India) 27,084 20,464 32.3 22,957 18,068
76 68 ACC @ 27,059 26,873 0.7 27,560 21,354
77 96 Marico 26,842 15,977 68.0 18,858 13,810
78 92 Cummins India 26,840 17,641 52.1 20,583 12,506
79 103 Bharat Forge 26,834 14,648 83.2 19,111 6,481
80 85 GlaxoSmithKline Consumer Healthcare 26,197 19,812 32.2 21,908 18,938
81 101 Bajaj Finserv 26,022 14,755 76.4 17,503 10,724
82 87 Divis Laboratories 25,914 19,267 34.5 21,071 14,716
83 132 Bajaj Finance 25,576 10,736 138.2 14,167 6,879
84 120 Emami 25,561 12,240 108.8 15,819 10,497
85 110 Hindustan Petroleum Corpn. 25,391 13,789 84.1 16,599 8,080
86 50 Steel Authority of India 25,334 34,553 (26.7) 33,270 24,068
87 86 United Breweries 25,306 19,631 28.9 21,149 20,596
88 89 Aditya Birla Nuvo 24,934 17,767 40.3 20,026 13,937
89 81 IDFC 23,954 20,803 15.1 23,130 17,461
90 121 Indiabulls Housing Finance 23,774 12,168 95.4 15,055 7,049
91 125 Torrent Pharmaceuticals 22,897 11,831 93.5 14,801 7,549
92 54 Hindalco Industries 22,824 33,689 (32.3) 32,375 21,586
93 95 Castrol India @ 22,664 16,555 36.9 19,948 15,526
94 99 LIC Housing Finance 22,446 15,301 46.7 18,447 10,881
95 149 Ashok Leyland 22,045 9,002 144.9 12,685 4,693
96 114 UPL 22,029 13,159 67.4 14,459 7,022
97 104 Essar Oil 21,843 14,393 51.8 15,200 8,382
98 53 DLF 21,812 33,759 (35.4) 29,915 30,071
99 63 JSW Steel 21,773 29,157 (25.3) 27,484 18,478
100 107 Procter & Gamble Hygiene & Health Care * 20,970 13,955 50.3 16,911 9,245

“Ran
k20
14”
isas
publ
ished
inla
stye
ar’s
BT50
0;Pa
ram
eter
rank
sar
efo
rw
ithin
the
top
1,000
com
pani
es;R
anks
have
been
assig
ned
base
don
mul
tiple
deci
mal
s;Be
caus
eof
roun
ding
off,
som
era
nks
may
appe
arin
corr
ect;
Re-
sults
are
aud
ited
and
stan
dalo
ne; O
vera
ll ra
nks
are
base
d on
ave
rage
mar
ket
capi
talis
atio
n (A
pril
1, 20
15 to
Sep
tem
ber
30, 2
015)
; Fig
ures
in b
rack
ets
deno
te n
egat
ive
valu
e; R
OCE:
retu
rn o
n ca
pita
l em
ploy
ed; R
ONW
: ret
urn
on n
et
wor
th; n
a: n
ot a
vaila
ble;
NA:
not
app
licab
le; N
L: n
ot li
sted
on
the
bour
ses;
NR:
not
rank
ed la
st y
ear;
All t
he la
test
dat
a fo
r FY
201
5 un
less
oth
erw
ise in
dica
ted;
^^
12 m
onth
s en
ding
Mar
ch 2
014;
@ 12
mon
ths
endi
ng D
ecem
ber
2014
; **
12m
onth
sen
ding
Sept
embe
r20
14;#
#12
mon
ths
endi
ngJu
ne20
14;*
12m
onth
sen
ding
June
2015
;^15
mon
ths
endi
ngM
arch
2015
;#18
mon
ths
endi
ngDe
cem
ber
2014
;***
9m
onth
sen
ding
Mar
ch20
15;@
@15
mon
ths
end-
ing
Mar
ch20
14;@
@@
18m
onth
sen
ding
Mar
ch20
15;^
^^6
mon
ths
endi
ngM
arch
2015
;##
#9
mon
ths
endi
ngSe
ptem
ber
2014
;*@
15m
onth
sen
ding
June
2014
;#@
#18
mon
ths
endi
ngSe
ptem
ber
2013
;#^#
12m
onth
sen
ding
Mar
ch20
13;+
10m
onth
sen
ding
Mar
ch20
14;
BFSI B
anki
ng, f
inan
cial
ser
vice
s an
d in
sura
nce
com
pani
es h
ave
a di
ffere
nt w
ay o
f ear
ning
and
pre
sent
ing
finan
cial
dat
a, s
o th
eir
inco
me,
pro
fit a
nd a
sset
num
bers
hav
e no
t be
en ra
nked
. Th
e BT
500
com
pani
es o
ver
the
past
20
year
s at
: ww
w.b
usin
esst
oday
.in/b
t500
So
urce
: CM
IE P
row
ess
November 8 2015 BUSINESS TODAY 105
2014/15
NET PROFIT ( cr)2014/15 2013/14 Rank 2015
PROFIT AS % OFTOTAL INCOME
RONW (%) ROCE (%) TOTAL INCOME ( cr)2014/15 2013/14 Rank 2015
TOTAL ASSETS ( cr)2014/15 2013/14 Rank 2015
RANK
51-100
5,862 5,249 163 4,769 4,340 141 654 565 76 13.72 20.43 18.82
7,347 6,168 130 6,950 6,451 100 787 1,004 66 11.33 18.46 14.29
7,726 6,501 126 5,704 4,619 116 1,271 904 48 22.28 31.17 22.72
7,14,989 6,59,505 NA 47,972 43,436 NA 3,398 4,541 NA 7.08 9.26 4.67
14,041 13,101 77 11,904 11,106 59 1,496 1,295 42 12.57 15.28 15.22
5,649 4,770 167 3,863 3,264 179 837 772 64 21.65 37.02 19.54
2,28,676 1,94,187 NA 25,247 21,545 NA 5,959 5,418 NA 23.60 20.00 2.93
1,36,170 1,09,016 NA 13,749 11,703 NA 2,005 1,616 NA 14.59 21.33 6.05
42,531 44,273 33 10,135 12,943 73 2,370 7,454 29 23.39 6.25 6.25
14,446 13,892 75 7,308 6,574 95 530 896 90 7.25 4.81 4.34
2,488 1,881 311 7,607 6,459 91 622 370 80 8.18 59.36 58.82
8,715 8,072 118 5,945 5,356 109 1,048 985 54 17.62 14.33 14.33
8,227 11,675 122 3,759 3,804 185 1,058 1,148 53 28.14 18.49 18.49
5,911 6,141 161 12,007 11,075 58 823 741 65 6.85 29.31 25.24
22,768 22,690 51 16,435 13,020 44 433 (153) 105 2.63 4.26 2.63
4,062 3,524 222 4,724 4,169 145 502 469 94 10.62 22.87 22.80
6,238 6,145 150 3,650 2,895 188 472 502 99 12.92 24.38 24.34
1,17,368 1,12,622 7 49,116 46,913 18 6,439 6,412 11 13.11 9.76 6.85
1,88,438 1,56,854 NA 20,391 17,124 NA 5,260 4,684 NA 25.80 23.11 3.26
9,181 9,351 112 8,174 8,204 88 229 177 171 2.80 8.33 7.05
37,418 36,149 36 11,155 11,238 65 2,510 2,981 26 22.50 11.89 8.32
17,228 16,302 61 7,374 6,808 94 1,145 922 52 15.52 15.34 15.34
8,619 4,614 120 5,371 2,506 128 1,008 434 56 18.76 25.64 23.37
6,03,743 5,50,748 NA 54,215 49,285 NA 3,065 3,345 NA 5.65 8.65 3.72
2,849 2,419 292 4,272 3,906 157 559 540 83 13.09 81.59 81.59
12,920 12,352 89 13,686 12,976 53 1,168 1,093 51 8.54 14.55 14.52
3,976 3,734 226 4,835 3,925 139 545 577 87 11.27 25.26 21.17
6,059 5,371 155 4,995 4,503 136 786 600 67 15.73 28.83 28.83
6,412 5,733 148 4,844 3,717 138 719 400 72 14.84 23.23 14.41
5,871 4,944 162 4,753 5,351 142 584 675 82 12.28 29.73 29.73
2,641 2,538 NA 212 157 NA 126 83 NA 59.50 5.01 5.01
5,187 4,317 178 3,154 2,616 209 847 792 63 26.86 25.68 25.51
32,824 24,630 NA 5,558 4,136 NA 898 719 NA 16.16 20.43 3.25
1,568 1,473 404 2,260 1,829 271 472 337 100 20.87 44.06 42.95
68,318 78,856 16 2,20,972 2,34,952 4 2,733 1,734 24 1.24 17.86 6.58
1,01,699 93,696 8 52,190 54,768 14 2,058 2,616 34 3.94 4.78 2.91
3,927 3,933 229 8,276 7,277 87 260 226 157 3.14 14.91 9.23
15,443 14,602 71 9,305 8,651 77 528 674 91 5.67 6.35 4.38
92,563 79,003 NA 9,393 8,299 NA 1,621 1,706 NA 17.26 10.32 2.11
56,569 43,654 NA 7,297 5,785 NA 1,978 1,510 NA 27.11 33.08 4.20
6,564 4,386 147 3,798 3,445 184 623 762 79 16.41 24.95 14.39
77,851 74,139 12 38,249 31,632 24 925 1,413 60 2.42 2.50 1.42
1,500 1,622 410 4,129 3,942 165 475 509 98 11.49 76.04 76.04
1,12,795 95,768 NA 10,911 9,398 NA 1,386 1,317 NA 12.71 18.06 1.39
13,418 13,031 82 15,333 11,596 46 335 29 129 2.18 9.13 4.35
7,734 7,177 125 6,064 5,646 108 492 435 97 8.12 14.42 10.23
60,923 54,619 19 94,253 1,08,389 5 1,521 126 40 1.61 41.94 5.52
36,020 37,657 38 4,104 4,026 168 940 527 59 22.91 5.55 3.14
77,461 71,677 13 51,007 49,626 17 2,166 1,335 32 4.25 8.94 4.11
1,963 1,519 360 2,480 2,188 250 346 302 126 13.95 31.02 31.02
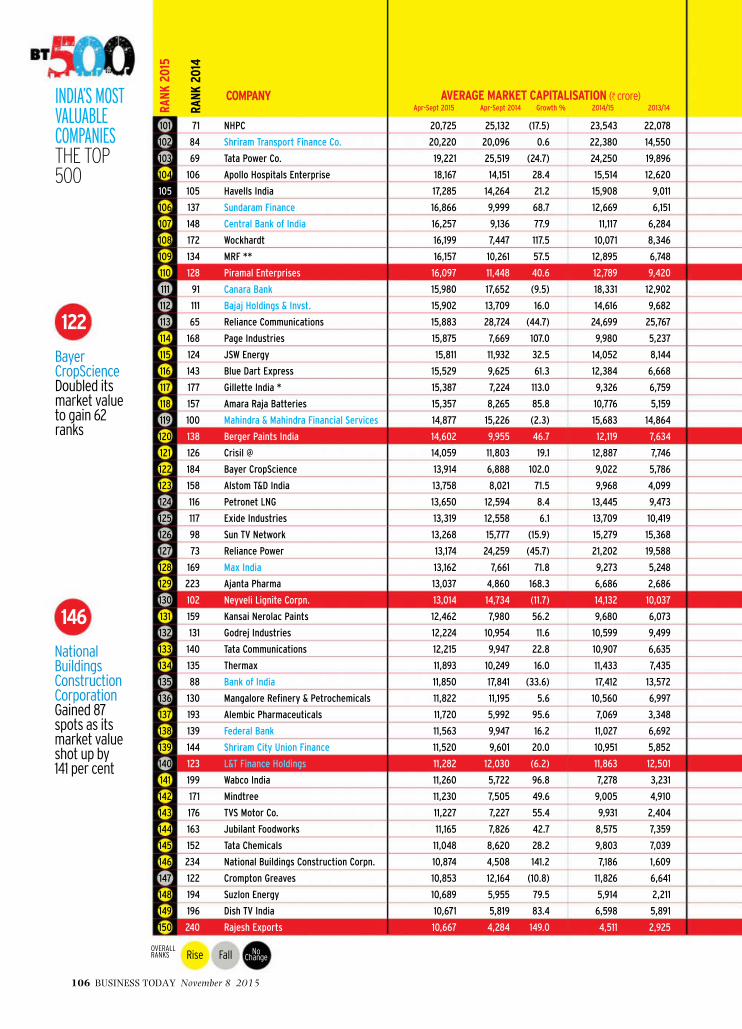
106 BUSINESS TODAY November 8 2015
AVERAGE MARKET CAPITALISATION ( crore)Apr-Sept 2015 Apr-Sept 2014 Growth % 2014/15 2013/14
OVERALLRANKS Rise
INDIA’S MOSTVALUABLE COMPANIES THE TOP 500
BayerCropScience Doubled its market valueto gain 62 ranks
122
NationalBuildings ConstructionCorporationGained 87 spots as its market valueshot up by 141 per cent
146
Fall NoChange
RANK
201
5
COMPANY
RANK
201
4
101 71 NHPC 20,725 25,132 (17.5) 23,543 22,078
102 84 Shriram Transport Finance Co. 20,220 20,096 0.6 22,380 14,550
103 69 Tata Power Co. 19,221 25,519 (24.7) 24,250 19,896
104 106 Apollo Hospitals Enterprise 18,167 14,151 28.4 15,514 12,620
105 105 Havells India 17,285 14,264 21.2 15,908 9,011
106 137 Sundaram Finance 16,866 9,999 68.7 12,669 6,151
107 148 Central Bank of India 16,257 9,136 77.9 11,117 6,284
108 172 Wockhardt 16,199 7,447 117.5 10,071 8,346
109 134 MRF ** 16,157 10,261 57.5 12,895 6,748
110 128 Piramal Enterprises 16,097 11,448 40.6 12,789 9,420
111 91 Canara Bank 15,980 17,652 (9.5) 18,331 12,902
112 111 Bajaj Holdings & Invst. 15,902 13,709 16.0 14,616 9,682
113 65 Reliance Communications 15,883 28,724 (44.7) 24,699 25,767
114 168 Page Industries 15,875 7,669 107.0 9,980 5,237
115 124 JSW Energy 15,811 11,932 32.5 14,052 8,144
116 143 Blue Dart Express 15,529 9,625 61.3 12,384 6,668
117 177 Gillette India * 15,387 7,224 113.0 9,326 6,759
118 157 Amara Raja Batteries 15,357 8,265 85.8 10,776 5,159
119 100 Mahindra & Mahindra Financial Services 14,877 15,226 (2.3) 15,683 14,864
120 138 Berger Paints India 14,602 9,955 46.7 12,119 7,634
121 126 Crisil @ 14,059 11,803 19.1 12,887 7,746
122 184 Bayer CropScience 13,914 6,888 102.0 9,022 5,786
123 158 Alstom T&D India 13,758 8,021 71.5 9,968 4,099
124 116 Petronet LNG 13,650 12,594 8.4 13,445 9,473
125 117 Exide Industries 13,319 12,558 6.1 13,709 10,419
126 98 Sun TV Network 13,268 15,777 (15.9) 15,279 15,368
127 73 Reliance Power 13,174 24,259 (45.7) 21,202 19,588
128 169 Max India 13,162 7,661 71.8 9,273 5,248
129 223 Ajanta Pharma 13,037 4,860 168.3 6,686 2,686
130 102 Neyveli Lignite Corpn. 13,014 14,734 (11.7) 14,132 10,037
131 159 Kansai Nerolac Paints 12,462 7,980 56.2 9,680 6,073
132 131 Godrej Industries 12,224 10,954 11.6 10,599 9,499
133 140 Tata Communications 12,215 9,947 22.8 10,907 6,635
134 135 Thermax 11,893 10,249 16.0 11,433 7,435
135 88 Bank of India 11,850 17,841 (33.6) 17,412 13,572
136 130 Mangalore Refinery & Petrochemicals 11,822 11,195 5.6 10,560 6,997
137 193 Alembic Pharmaceuticals 11,720 5,992 95.6 7,069 3,348
138 139 Federal Bank 11,563 9,947 16.2 11,027 6,692
139 144 Shriram City Union Finance 11,520 9,601 20.0 10,951 5,852
140 123 L&T Finance Holdings 11,282 12,030 (6.2) 11,863 12,501
141 199 Wabco India 11,260 5,722 96.8 7,278 3,231
142 171 Mindtree 11,230 7,505 49.6 9,005 4,910
143 176 TVS Motor Co. 11,227 7,227 55.4 9,931 2,404
144 163 Jubilant Foodworks 11,165 7,826 42.7 8,575 7,359
145 152 Tata Chemicals 11,048 8,620 28.2 9,803 7,039
146 234 National Buildings Construction Corpn. 10,874 4,508 141.2 7,186 1,609
147 122 Crompton Greaves 10,853 12,164 (10.8) 11,826 6,641
148 194 Suzlon Energy 10,689 5,955 79.5 5,914 2,211
149 196 Dish TV India 10,671 5,819 83.4 6,598 5,891
150 240 Rajesh Exports 10,667 4,284 149.0 4,511 2,925

“Ran
k20
14”
isas
publ
ished
inla
stye
ar’s
BT50
0;Pa
ram
eter
rank
sar
efo
rw
ithin
the
top
1,000
com
pani
es;R
anks
have
been
assig
ned
base
don
mul
tiple
deci
mal
s;Be
caus
eof
roun
ding
off,
som
era
nks
may
appe
arin
corr
ect;
Re-
sults
are
aud
ited
and
stan
dalo
ne; O
vera
ll ra
nks
are
base
d on
ave
rage
mar
ket
capi
talis
atio
n (A
pril
1, 20
15 to
Sep
tem
ber
30, 2
015)
; Fig
ures
in b
rack
ets
deno
te n
egat
ive
valu
e; R
OCE:
retu
rn o
n ca
pita
l em
ploy
ed; R
ONW
: ret
urn
on n
et
wor
th; n
a: n
ot a
vaila
ble;
NA:
not
app
licab
le; N
L: n
ot li
sted
on
the
bour
ses;
NR:
not
rank
ed la
st y
ear;
All t
he la
test
dat
a fo
r FY
201
5 un
less
oth
erw
ise in
dica
ted;
^^
12 m
onth
s en
ding
Mar
ch 2
014;
@ 12
mon
ths
endi
ng D
ecem
ber
2014
; **
12m
onth
sen
ding
Sept
embe
r20
14;#
#12
mon
ths
endi
ngJu
ne20
14;*
12m
onth
sen
ding
June
2015
;^15
mon
ths
endi
ngM
arch
2015
;#18
mon
ths
endi
ngDe
cem
ber
2014
;***
9m
onth
sen
ding
Mar
ch20
15;@
@15
mon
ths
end-
ing
Mar
ch20
14;@
@@
18m
onth
sen
ding
Mar
ch20
15;^
^^6
mon
ths
endi
ngM
arch
2015
;##
#9
mon
ths
endi
ngSe
ptem
ber
2014
;*@
15m
onth
sen
ding
June
2014
;#@
#18
mon
ths
endi
ngSe
ptem
ber
2013
;#^#
12m
onth
sen
ding
Mar
ch20
13;+
10m
onth
sen
ding
Mar
ch20
14;
BFSI B
anki
ng, f
inan
cial
ser
vice
s an
d in
sura
nce
com
pani
es h
ave
a di
ffere
nt w
ay o
f ear
ning
and
pre
sent
ing
finan
cial
dat
a, s
o th
eir
inco
me,
pro
fit a
nd a
sset
num
bers
hav
e no
t be
en ra
nked
. Th
e BT
500
com
pani
es o
ver
the
past
20
year
s at
: ww
w.b
usin
esst
oday
.in/b
t500
So
urce
: CM
IE P
row
ess
November 8 2015 BUSINESS TODAY 107
2014/15
NET PROFIT ( cr)2014/15 2013/14 Rank 2015
PROFIT AS % OFTOTAL INCOME
RONW (%) ROCE (%) TOTAL INCOME ( cr)2014/15 2013/14 Rank 2015
TOTAL ASSETS ( cr)2014/15 2013/14 Rank 2015
RANK
101-150
55,498 54,037 22 8,347 7,151 85 2,135 984 33 25.57 7.88 4.55
63,941 53,273 NA 8,645 7,888 NA 1,238 1,264 NA 14.32 14.21 2.53
33,963 30,915 40 9,723 9,402 76 1,026 974 55 10.55 7.24 3.83
5,820 4,857 164 4,638 3,884 149 347 331 125 7.47 11.32 7.80
3,697 3,433 238 5,923 5,333 111 465 479 101 7.85 20.64 19.43
17,514 16,117 NA 2,369 2,314 NA 454 443 NA 19.17 16.87 3.22
3,12,472 2,90,226 NA 28,322 26,364 NA 606 (1,263) NA 2.14 4.38 1.57
4,716 3,876 200 2,358 2,139 262 332 208 130 14.07 33.04 18.29
9,825 8,285 106 14,714 13,482 48 898 802 61 6.10 22.00 15.40
20,762 21,029 53 5,774 2,333 115 373 (370) 119 6.45 3.62 2.46
5,48,762 4,92,266 NA 49,130 43,796 NA 2,703 2,438 NA 5.50 10.69 5.22
6,467 5,980 NA 1,006 847 NA 868 733 NA 86.22 15.10 15.10
76,596 80,242 14 18,132 15,384 41 (1,331) (447) 881 (7.34) (3.96) (2.01)
1,120 887 477 1,552 1,195 360 196 154 186 12.63 58.02 39.35
15,427 15,391 72 6,627 6,065 102 996 602 57 15.03 13.65 8.38
1,360 1,242 430 2,293 1,976 267 127 124 249 5.53 27.21 20.06
1,219 1,067 451 2,089 1,804 290 158 51 211 7.57 22.82 22.82
2,395 1,988 317 4,680 3,886 146 411 367 110 8.78 26.83 25.49
35,074 31,666 NA 5,587 4,954 NA 832 887 NA 14.89 15.47 2.72
2,314 2,161 322 4,266 3,785 158 266 234 152 6.24 21.97 17.66
1,047 916 502 944 938 472 216 281 176 22.83 32.26 32.26
4,084 3,505 220 3,994 3,490 173 383 290 115 9.59 20.29 20.29
5,187 5,300 177 3,913 3,754 177 120 117 258 3.07 9.39 7.20
11,125 11,914 96 39,723 37,841 23 883 712 62 2.22 16.55 10.64
5,428 4,975 171 7,695 6,796 90 546 487 86 7.09 14.11 14.07
3,706 3,582 237 2,331 2,176 265 737 717 70 31.62 22.51 22.51
21,608 20,746 52 372 366 674 25 56 557 6.75 0.15 0.12
3,510 3,538 NA 625 1,063 NA 391 185 NA 62.55 11.78 11.46
1,088 880 486 1,405 1,136 384 308 221 140 21.95 46.62 40.50
23,133 22,115 50 7,194 7,066 97 1,579 1,501 39 21.95 10.97 9.00
2,354 2,266 320 4,240 3,753 160 265 207 153 6.25 17.54 16.99
4,391 3,703 207 1,795 1,701 320 157 125 213 8.73 10.15 4.80
18,053 17,614 59 5,214 5,161 131 675 542 75 12.94 8.31 7.60
5,118 5,058 184 5,132 4,326 134 336 253 128 6.55 15.65 14.89
6,18,698 5,73,190 NA 48,000 44,848 NA 1,709 2,729 NA 3.56 6.32 2.40
36,254 39,911 37 63,298 75,684 9 (1,712) 601 883 (2.71) (27.67) (10.98)
1,757 1,340 383 2,040 1,856 297 287 238 148 14.05 39.17 32.45
83,140 74,970 NA 8,504 7,754 NA 1,006 839 NA 11.83 13.74 8.88
18,042 16,391 NA 3,532 3,241 NA 558 521 NA 15.80 16.03 3.52
5,614 5,333 NA 332 294 NA 262 196 NA 78.86 7.40 4.92
1,124 967 475 1,481 1,229 372 121 117 257 8.15 14.91 14.91
2,654 2,113 302 3,631 3,081 189 534 451 88 14.72 29.26 29.02
4,644 3,615 201 10,848 8,744 67 348 262 124 3.21 22.73 15.26
1,109 883 479 2,091 1,748 288 123 126 253 5.90 19.97 19.52
13,251 13,019 86 10,529 9,200 69 638 436 78 6.06 10.90 7.31
5,056 4,396 186 4,809 4,173 140 277 247 150 5.77 22.62 22.62
6,893 5,734 144 8,746 8,301 82 728 521 71 8.32 19.83 17.99
15,810 18,657 67 2,654 5,602 239 (6,032) (924) 889 (227.28) (417.83) (49.92)
3,158 2,774 266 2,836 2,588 226 1 -(154) 745 0.04 0.00 0.09
15,528 11,061 70 37,978 23,538 25 264 227 154 0.69 9.68 4.27

108 BUSINESS TODAY November 8 2015
AVERAGE MARKET CAPITALISATION ( crore)Apr-Sept 2015 Apr-Sept 2014 Growth % 2014/15 2013/14
OVERALLRANKS Rise
INDIA’S MOSTVALUABLE COMPANIES THE TOP 500
RelianceInfrastructureFall in rank andmarket cap exemplifi es the travails ofthe power sector in India
154
Mahindra CIEAutomotive Catapulted from rank 482to 187, with itsmarket cap growing 461.9per cent
187
Fall NoChange
RANK
201
5
COMPANY
RANK
201
4
151 113 IDBI Bank 10,662 13,575 (21.5) 12,493 9,413
152 119 Union Bank of India 10,545 12,484 (15.5) 12,791 8,939
153 109 National Aluminium Co. 10,503 13,790 (23.8) 13,659 8,701
154 90 Reliance Infrastructure 10,321 17,760 (41.9) 15,749 10,160
155 192 Gujarat Pipavav Port ^ 10,236 6,111 67.5 7,793 2,620
156 207 3M India 10,226 5,418 88.8 6,529 3,879
157 141 SJVN 10,116 9,794 3.3 9,945 8,302
158 250 Pfizer 10,033 4,050 147.7 5,968 3,309
159 185 Voltas 9,923 6,788 46.2 7,644 3,156
160 164 Info Edge (India) 9,768 7,826 24.8 9,059 4,432
161 178 AIA Engineering 9,691 7,184 34.9 8,691 3,722
162 253 Sun Pharma Advanced Research Co. 9,622 4,034 138.6 5,341 3,363
163 115 Reliance Capital 9,439 12,880 (26.7) 12,281 8,447
164 97 Adani Power 9,384 15,890 (40.9) 14,751 10,998
165 147 Apollo Tyres 9,220 9,260 (0.4) 9,951 4,407
166 233 Abbott India 9,206 4,594 100.4 6,158 3,163
167 NL Inox Wind 9,187 na NA na na
168 161 Oberoi Realty 9,093 7,882 15.4 8,324 6,673
169 206 Cholamandalam Invest. & Finance Co. 9,086 5,429 67.3 6,373 3,491
170 145 Biocon 9,083 9,532 (4.7) 9,178 7,108
171 226 PI Industries 9,079 4,778 90.0 5,905 2,445
172 70 Jindal Steel & Power 9,076 25,413 (64.3) 20,008 23,784
173 241 Whirlpool of India 9,068 4,230 114.4 6,084 2,380
174 165 Prestige Estates Projects 8,932 7,822 14.2 8,600 5,155
175 183 Gruh Finance 8,869 6,897 28.6 8,016 4,177
176 136 Ipca Laboratories 8,857 10,067 (12.0) 9,454 8,638
177 142 Tata Global Beverages 8,576 9,736 (11.9) 9,675 9,071
178 150 Mphasis 8,400 8,990 (6.6) 8,549 8,578
179 180 Sanofi India @ 8,346 7,075 18.0 7,475 5,942
180 182 IRB Infrastructure Developers 8,297 6,942 19.5 7,646 3,058
181 181 Supreme Industries * 8,277 6,956 19.0 7,460 4,808
182 229 Hexaware Technologies @ 8,163 4,696 73.8 5,757 3,518
183 211 Fortis Healthcare 7,908 5,247 50.7 5,469 4,442
184 174 Indian Hotels Co. 7,846 7,311 7.3 8,151 4,336
185 186 Ramco Cements 7,787 6,639 17.3 7,229 4,570
186 133 Just Dial 7,617 10,420 (26.9) 10,312 7,512
187 482 Mahindra CIE Automotive 7,603 1,353 461.9 3,050 512
188 129 GMR Infrastructure 7,544 11,353 (33.5) 9,800 7,863
189 272 Symphony ## 7,497 3,625 106.8 5,297 1,351
190 284 Natco Pharma 7,492 3,376 121.9 4,160 2,028
191 187 Torrent Power 7,407 6,553 13.0 7,091 4,844
192 214 Gujarat Fluorochemicals 7,390 5,090 45.2 6,616 2,816
193 173 Muthoot Finance 7,380 7,324 0.8 7,652 4,547
194 160 CESC 7,317 7,934 (7.8) 8,335 4,599
195 209 SKF India @ 7,167 5,314 34.9 6,174 3,082
196 256 Honeywell Automation India ^ 7,161 3,935 82.0 5,123 2,222
197 245 FAG Bearings India @ 7,073 4,173 69.5 5,006 2,399
198 218 Tube Investments of India 7,034 5,001 40.6 5,758 2,905
199 275 Strides Arcolab 7,029 3,581 96.3 4,400 4,263
200 166 Bata India ^ 7,009 7,727 (9.3) 7,994 5,865

“Ran
k20
14”
isas
publ
ished
inla
stye
ar’s
BT50
0;Pa
ram
eter
rank
sar
efo
rw
ithin
the
top
1,000
com
pani
es;R
anks
have
been
assig
ned
base
don
mul
tiple
deci
mal
s;Be
caus
eof
roun
ding
off,
som
era
nks
may
appe
arin
corr
ect;
Re-
sults
are
aud
ited
and
stan
dalo
ne; O
vera
ll ra
nks
are
base
d on
ave
rage
mar
ket
capi
talis
atio
n (A
pril
1, 20
15 to
Sep
tem
ber
30, 2
015)
; Fig
ures
in b
rack
ets
deno
te n
egat
ive
valu
e; R
OCE:
retu
rn o
n ca
pita
l em
ploy
ed; R
ONW
: ret
urn
on n
et
wor
th; n
a: n
ot a
vaila
ble;
NA:
not
app
licab
le; N
L: n
ot li
sted
on
the
bour
ses;
NR:
not
rank
ed la
st y
ear;
All t
he la
test
dat
a fo
r FY
201
5 un
less
oth
erw
ise in
dica
ted;
^^
12 m
onth
s en
ding
Mar
ch 2
014;
@ 12
mon
ths
endi
ng D
ecem
ber
2014
; **
12m
onth
sen
ding
Sept
embe
r20
14;#
#12
mon
ths
endi
ngJu
ne20
14;*
12m
onth
sen
ding
June
2015
;^15
mon
ths
endi
ngM
arch
2015
;#18
mon
ths
endi
ngDe
cem
ber
2014
;***
9m
onth
sen
ding
Mar
ch20
15;@
@15
mon
ths
end-
ing
Mar
ch20
14;@
@@
18m
onth
sen
ding
Mar
ch20
15;^
^^6
mon
ths
endi
ngM
arch
2015
;##
#9
mon
ths
endi
ngSe
ptem
ber
2014
;*@
15m
onth
sen
ding
June
2014
;#@
#18
mon
ths
endi
ngSe
ptem
ber
2013
;#^#
12m
onth
sen
ding
Mar
ch20
13;+
10m
onth
sen
ding
Mar
ch20
14;
BFSI B
anki
ng, f
inan
cial
ser
vice
s an
d in
sura
nce
com
pani
es h
ave
a di
ffere
nt w
ay o
f ear
ning
and
pre
sent
ing
finan
cial
dat
a, s
o th
eir
inco
me,
pro
fit a
nd a
sset
num
bers
hav
e no
t be
en ra
nked
. Th
e BT
500
com
pani
es o
ver
the
past
20
year
s at
: ww
w.b
usin
esst
oday
.in/b
t500
So
urce
: CM
IE P
row
ess
November 8 2015 BUSINESS TODAY 109
2014/15
NET PROFIT ( cr)2014/15 2013/14 Rank 2015
PROFIT AS % OFTOTAL INCOME
RONW (%) ROCE (%) TOTAL INCOME ( cr)2014/15 2013/14 Rank 2015
TOTAL ASSETS ( cr)2014/15 2013/14 Rank 2015
RANK
151-200
3,56,527 3,29,408 NA 32,212 29,579 NA 873 1,121 NA 2.71 3.92 1.05
3,82,730 3,54,634 NA 35,645 32,171 NA 1,782 1,696 NA 5.00 10.11 3.56
16,384 16,842 64 8,814 7,716 81 1,322 642 47 15.00 10.61 10.61
51,710 51,018 26 12,475 12,636 57 1,401 1,284 44 11.23 6.82 3.85
2,459 2,188 313 909 557 480 387 192 114 42.61 24.25 22.14
1,534 1,437 408 1,943 1,840 308 108 43 276 5.57 14.38 13.19
15,549 14,355 69 3,265 2,113 200 1,677 1,115 38 51.35 17.42 13.79
2,644 984 303 1,998 1,274 302 100 221 289 5.02 7.63 7.62
4,354 4,223 211 5,583 5,349 121 336 186 127 6.02 19.55 18.24
2,329 1,292 321 723 549 532 194 128 188 26.82 15.99 15.98
2,025 1,692 347 2,287 1,876 269 415 285 107 18.13 27.98 26.15
167 207 822 159 177 780 (40) 30 820 (24.89) (33.25) (31.99)
36,026 36,807 NA 4,099 3,385 NA 773 409 NA 18.86 6.48 2.23
40,049 40,961 34 11,515 11,474 61 (69) 595 827 (0.60) (0.90) (0.21)
7,233 6,964 136 10,004 9,794 75 645 443 77 6.45 21.49 14.96
2,232 1,908 328 2,359 2,357 261 229 198 170 9.71 26.54 26.54
3,075 1,374 272 2,558 1,416 246 332 145 131 12.96 35.60 20.13
4,194 3,587 217 761 708 522 305 295 143 40.04 10.69 10.45
24,670 22,069 NA 3,876 3,380 NA 435 364 NA 11.23 17.52 2.02
3,349 3,228 262 2,433 2,311 255 361 324 121 14.85 14.48 13.91
1,921 1,492 364 2,230 1,862 274 243 184 162 10.91 31.11 27.01
48,358 43,564 29 15,877 16,127 45 (311) 1,292 858 (1.96) (2.43) (0.79)
1,864 1,583 367 3,680 3,178 187 211 123 177 5.72 25.84 25.84
9,203 7,188 111 2,573 2,152 244 414 340 108 16.10 12.07 7.50
9,578 7,538 NA 1,068 853 NA 202 177 NA 18.89 30.62 2.53
3,834 3,224 232 3,179 3,318 207 256 477 159 8.06 12.15 8.93
4,998 4,950 187 3,102 3,125 213 299 463 146 9.64 11.88 10.02
5,277 4,736 176 3,201 1,424 206 553 228 85 17.28 13.99 13.78
2,261 1,909 325 2,273 2,017 270 264 265 155 11.60 18.70 18.70
7,147 5,916 139 2,201 2,528 278 138 288 243 6.29 7.14 3.22
2,276 2,107 324 4,736 4,415 144 316 281 139 6.67 30.25 21.38
1,455 1,475 414 1,214 1,054 419 318 334 136 26.22 33.06 33.06
5,155 5,158 180 833 599 503 (34) 24 817 (4.07) (0.92) (0.68)
7,416 6,937 129 2,155 2,024 281 (82) (590) 831 (3.81) (3.09) (1.46)
7,091 6,888 140 4,255 4,416 159 242 138 163 5.70 9.45 4.51
1,143 887 468 639 502 561 139 121 241 21.75 23.00 23.00
2,781 1,118 296 1,847 439 317 78 18 333 4.20 4.79 4.60
15,193 14,333 74 670 1,263 552 (353) 166 862 (52.63) (4.29) (2.50)
324 247 754 466 325 632 99 63 291 21.20 47.11 47.11
1,397 1,181 424 741 644 528 153 110 215 20.65 18.98 14.10
16,014 15,463 66 10,597 8,824 68 742 95 69 7.00 11.34 5.96
4,075 3,657 221 1,799 1,323 319 382 74 116 21.26 14.22 11.24
27,122 26,004 NA 4,325 4,958 NA 671 780 NA 15.50 14.35 2.78
18,922 16,334 58 6,366 5,702 105 698 652 74 10.96 10.49 6.18
1,935 1,717 362 2,643 2,497 240 203 167 182 7.67 15.07 15.07
1,930 1,700 363 2,464 1,756 252 114 86 264 4.63 13.74 13.74
1,445 1,341 416 1,788 1,568 323 153 122 216 8.55 14.61 14.61
3,595 3,395 244 4,222 3,856 161 122 96 255 2.89 9.54 4.57
3,531 3,663 248 1,578 5,756 354 532 3,513 89 33.73 34.28 26.73
1,637 1,383 395 2,814 2,130 227 231 191 169 8.21 25.57 25.57

110 BUSINESS TODAY November 8 2015
AVERAGE MARKET CAPITALISATION ( crore)Apr-Sept 2015 Apr-Sept 2014 Growth % 2014/15 2013/14
OVERALLRANKS Rise
INDIA’S MOSTVALUABLE COMPANIES THE TOP 500
PC JewellerJumped 154 ranks as its market valuenearly trebled
205
Welspun IndiaGained a staggering 206 ranks as the company’smarket valuerises 253 per cent
211
Fall NoChange
RANK
201
5
COMPANY
RANK
201
4
201 179 Indian Bank 6,987 7,102 (1.6) 7,838 4,663
202 151 Engineers India 6,960 8,974 (22.4) 8,286 5,404
203 195 Arvind 6,939 5,946 16.7 6,641 2,713
204 230 Gujarat State Petronet 6,820 4,652 46.6 5,429 3,269
205 359 PC Jeweller 6,770 2,373 185.3 3,386 1,685
206 188 Balkrishna Industries 6,767 6,519 3.8 6,449 2,754
207 276 Bajaj Corp 6,688 3,510 90.5 4,516 3,509
208 175 Coromandel International 6,640 7,297 (9.0) 7,930 5,807
209 221 Century Textiles & Inds. 6,600 4,894 34.9 4,975 2,595
210 300 SRF 6,581 3,116 111.2 4,058 1,061
211 417 Welspun India 6,576 1,862 253.1 2,632 700
212 156 Syndicate Bank 6,571 8,295 (20.8) 7,924 5,707
213 NL Syngene International 6,529 na NA na na
214 246 Dewan Housing Finance Corpn. 6,503 4,135 57.3 4,901 2,159
215 294 Solar Industries India 6,496 3,226 101.3 4,215 1,662
216 191 Vakrangee 6,373 6,152 3.6 6,247 3,968
217 309 Thomas Cook (India) ^ 6,311 3,002 110.2 3,827 1,621
218 220 Akzo Nobel India 6,290 4,895 28.5 5,664 4,264
219 200 DB Corp 6,167 5,722 7.8 6,307 4,834
220 222 Indraprastha Gas 6,150 4,888 25.8 5,476 3,852
221 248 Cyient 6,096 4,059 50.2 4,945 2,694
222 212 EIH 6,054 5,202 16.4 5,723 3,202
223 285 SKS Microfinance 6,024 3,348 80.0 4,140 1,584
224 244 Kajaria Ceramics 6,023 4,179 44.1 4,734 1,908
225 204 CMC 5,989 5,484 9.2 5,691 4,103
226 146 UCO Bank 5,933 9,516 (37.6) 8,727 5,271
227 213 TV18 Broadcast 5,929 5,105 16.1 5,217 3,943
228 251 City Union Bank 5,848 4,046 44.6 4,768 2,681
229 217 Karur Vysya Bank 5,828 5,032 15.8 5,907 3,979
230 201 Religare Enterprises 5,794 5,565 4.1 5,842 4,721
231 274 IIFL Holdings 5,720 3,584 59.6 4,427 1,767
232 215 Network18 Media & Invst. 5,691 5,038 13.0 5,478 3,336
233 231 Persistent Systems 5,610 4,635 21.0 5,445 2,930
234 362 Relaxo Footwears 5,609 2,302 143.6 2,926 1,068
235 153 Hindustan Copper 5,586 8,591 (35.0) 7,716 6,716
236 232 Godrej Properties 5,388 4,632 16.3 4,914 3,809
237 277 Multi Commodity Exchange of India 5,350 3,466 54.4 4,066 3,012
238 202 Great Eastern Shipping Co. 5,336 5,543 (3.7) 5,572 4,047
239 154 Oriental Bank of Commerce 5,314 8,563 (37.9) 8,413 5,742
240 235 Phoenix Mills 5,296 4,487 18.0 4,938 3,398
241 286 Prism Cement 5,280 3,334 58.4 3,924 1,574
242 189 Allahabad Bank 5,261 6,426 (18.1) 6,358 4,739
243 319 Sadbhav Engineering 5,221 2,843 83.7 3,741 1,297
244 270 Jyothy Laboratories 5,219 3,655 42.8 4,193 3,106
245 216 Kaveri Seed Co. 5,064 5,035 0.6 5,504 2,383
246 303 HMT 5,051 4,561 10.7 5,225 2,138
247 342 BEML 5,029 2,517 99.8 2,968 757
248 203 Videocon Industries # 4,959 5,538 (10.5) 5,420 5,849
249 162 Jammu & Kashmir Bank 4,954 7,845 (36.9) 7,138 6,112
250 254 BASF India 4,949 3,964 24.8 4,621 2,573

“Ran
k20
14”
isas
publ
ished
inla
stye
ar’s
BT50
0;Pa
ram
eter
rank
sar
efo
rw
ithin
the
top
1,000
com
pani
es;R
anks
have
been
assig
ned
base
don
mul
tiple
deci
mal
s;Be
caus
eof
roun
ding
off,
som
era
nks
may
appe
arin
corr
ect;
Re-
sults
are
aud
ited
and
stan
dalo
ne; O
vera
ll ra
nks
are
base
d on
ave
rage
mar
ket
capi
talis
atio
n (A
pril
1, 20
15 to
Sep
tem
ber
30, 2
015)
; Fig
ures
in b
rack
ets
deno
te n
egat
ive
valu
e; R
OCE:
retu
rn o
n ca
pita
l em
ploy
ed; R
ONW
: ret
urn
on n
et
wor
th; n
a: n
ot a
vaila
ble;
NA:
not
app
licab
le; N
L: n
ot li
sted
on
the
bour
ses;
NR:
not
rank
ed la
st y
ear;
All t
he la
test
dat
a fo
r FY
201
5 un
less
oth
erw
ise in
dica
ted;
^^
12 m
onth
s en
ding
Mar
ch 2
014;
@ 12
mon
ths
endi
ng D
ecem
ber
2014
; **
12m
onth
sen
ding
Sept
embe
r20
14;#
#12
mon
ths
endi
ngJu
ne20
14;*
12m
onth
sen
ding
June
2015
;^15
mon
ths
endi
ngM
arch
2015
;#18
mon
ths
endi
ngDe
cem
ber
2014
;***
9m
onth
sen
ding
Mar
ch20
15;@
@15
mon
ths
end-
ing
Mar
ch20
14;@
@@
18m
onth
sen
ding
Mar
ch20
15;^
^^6
mon
ths
endi
ngM
arch
2015
;##
#9
mon
ths
endi
ngSe
ptem
ber
2014
;*@
15m
onth
sen
ding
June
2014
;#@
#18
mon
ths
endi
ngSe
ptem
ber
2013
;#^#
12m
onth
sen
ding
Mar
ch20
13;+
10m
onth
sen
ding
Mar
ch20
14;
BFSI B
anki
ng, f
inan
cial
ser
vice
s an
d in
sura
nce
com
pani
es h
ave
a di
ffere
nt w
ay o
f ear
ning
and
pre
sent
ing
finan
cial
dat
a, s
o th
eir
inco
me,
pro
fit a
nd a
sset
num
bers
hav
e no
t be
en ra
nked
. Th
e BT
500
com
pani
es o
ver
the
past
20
year
s at
: ww
w.b
usin
esst
oday
.in/b
t500
So
urce
: CM
IE P
row
ess
November 8 2015 BUSINESS TODAY 111
2014/15
NET PROFIT ( cr)2014/15 2013/14 Rank 2015
PROFIT AS % OFTOTAL INCOME
RONW (%) ROCE (%) TOTAL INCOME ( cr)2014/15 2013/14 Rank 2015
TOTAL ASSETS ( cr)2014/15 2013/14 Rank 2015
RANK
201-250
1,92,836 1,87,226 NA 17,290 16,628 NA 1,005 1,159 NA 5.81 8.48 6.42
4,607 4,586 202 1,995 2,181 303 308 480 141 15.44 12.25 12.25
7,009 6,358 142 5,423 4,949 127 377 361 118 6.96 15.29 7.47
5,547 5,408 168 1,117 1,106 439 410 419 111 36.75 11.86 8.64
4,773 4,290 193 6,408 5,375 104 378 356 117 5.90 20.60 14.12
5,319 4,878 174 4,123 3,630 166 498 488 96 12.09 23.86 11.22
570 582 650 853 712 497 173 150 201 20.32 34.19 34.19
8,386 7,117 121 11,511 9,565 62 403 345 112 3.50 18.33 9.84
10,677 9,616 99 8,421 7,411 84 (7) 3 795 (0.08) (0.38) (0.09)
4,882 4,478 189 3,997 3,750 172 308 217 142 7.70 13.71 8.48
5,130 4,300 182 4,671 3,686 147 510 30 93 10.92 41.11 13.99
3,03,135 2,51,861 NA 23,858 20,026 NA 1,523 1,711 NA 6.38 13.31 4.44
1,427 1,196 420 872 708 489 175 134 200 20.08 26.73 21.49
54,718 43,930 NA 5,989 4,971 NA 621 529 NA 10.37 15.13 1.29
797 825 566 1,139 1,005 429 108 84 277 9.47 22.04 15.55
2,038 1,729 346 2,785 1,975 230 320 199 134 11.50 31.45 21.96
2,156 1,392 332 516 375 609 33 46 502 6.43 3.79 3.24
1,849 2,086 371 2,867 2,741 224 186 150 194 6.50 21.12 21.12
1,955 1,815 361 2,041 1,882 296 317 306 138 15.53 26.20 23.53
3,428 3,301 258 4,095 4,345 169 438 360 104 10.69 22.67 20.08
2,231 1,945 329 1,406 1,312 383 271 255 151 19.29 18.28 18.28
3,386 3,430 260 1,367 1,291 394 81 95 322 5.95 3.34 3.04
4,699 2,497 NA 981 626 NA 188 70 NA 19.13 24.93 5.93
1,265 1,007 445 2,389 2,010 259 168 117 206 7.05 27.16 23.88
1,625 1,512 397 1,315 1,362 399 198 324 185 15.05 17.44 17.44
2,46,275 2,39,614 NA 21,479 19,722 NA 1,138 1,511 NA 5.30 10.15 4.12
4,015 3,862 225 623 532 568 15 59 633 2.35 0.42 0.40
27,871 24,994 NA 3,125 2,826 NA 395 347 NA 12.64 16.74 15.21
53,209 51,632 NA 6,072 5,687 NA 456 430 NA 7.50 12.13 6.65
4,201 4,011 NA 184 332 NA (104) (130) NA (56.24) (4.64) (2.95)
1,773 1,633 NA 110 89 NA 98 98 NA 89.25 7.21 7.08
3,551 4,257 247 87 175 814 (688) (75) 875 (793.02) (22.48) (19.14)
1,607 1,394 402 1,344 1,222 397 259 249 158 19.30 20.28 20.22
856 667 547 1,500 1,228 369 103 66 284 6.87 32.04 19.06
2,977 2,979 281 1,220 1,728 417 68 286 364 5.54 3.66 3.66
4,734 4,305 197 719 775 534 128 98 248 17.80 6.90 3.43
2,461 2,308 NA 361 445 NA 145 158 NA 40.21 10.72 10.72
9,445 9,485 108 2,020 1,797 299 317 205 137 15.71 6.52 3.94
2,30,514 2,20,303 NA 22,163 21,070 NA 497 1,139 NA 2.24 3.88 2.49
2,793 2,625 295 412 381 657 62 153 381 15.01 3.28 2.51
4,588 4,347 203 6,129 5,515 107 15 (82) 632 0.24 1.45 0.51
2,27,589 2,20,434 NA 22,097 21,115 NA 621 1,172 NA 2.81 5.50 2.53
3,525 3,025 249 3,038 2,414 217 114 106 265 3.74 9.99 5.17
2,023 1,896 348 1,557 1,362 359 143 106 230 9.17 15.50 9.92
1,205 1,026 453 1,131 1,012 432 302 211 144 26.68 47.22 47.14
1,480 1,519 412 97 413 806 (97) 87 836 (99.21) (22.49) (7.95)
4,791 4,926 192 3,063 3,213 216 7 5 691 0.22 0.33 0.23
38,294 37,060 35 20,666 19,209 37 3 (72) 713 0.01 0.03 0.01
76,085 78,620 NA 7,690 7,157 NA 509 1,182 NA 6.61 8.60 6.38
4,365 4,156 209 5,138 4,872 133 (67) 128 826 (1.30) (6.56) (2.84)

112 BUSINESS TODAY November 8 2015
AVERAGE MARKET CAPITALISATION ( crore)Apr-Sept 2015 Apr-Sept 2014 Growth % 2014/15 2013/14
OVERALLRANKS Rise
INDIA’S MOSTVALUABLE COMPANIES THE TOP 500
IndianOverseas BankFallen 100 ranks as NPAspush it into the red
255
Hitachi HomeSolutions Jumped 312 ranks and profi t rises more than nine times
292
Fall NoChange
RANK
201
5
COMPANY
RANK
201
4
251 273 Monsanto India 4,941 3,611 36.8 4,405 1,336
252 255 Edelweiss Financial Services 4,927 3,947 24.8 4,294 2,263
253 287 Alstom India 4,896 3,308 48.0 3,746 2,302
254 264 Astral Poly Technik 4,864 3,743 29.9 4,217 1,472
255 155 Indian Overseas Bank 4,823 8,391 (42.5) 7,598 5,036
256 267 eClerx Services 4,811 3,722 29.3 3,873 2,747
257 311 Schneider Electric Infrastructure 4,767 2,982 59.9 3,414 1,641
258 293 Dalmia Bharat 4,749 3,236 46.8 3,463 1,170
259 325 Vardhman Textiles 4,744 2,724 74.2 2,819 2,041
260 167 MMTC 4,680 7,727 (39.4) 6,832 9,178
261 338 Sintex Industries 4,648 2,567 81.1 3,187 1,107
262 301 Cox & Kings 4,617 3,114 48.3 3,995 1,586
263 399 Eros International Media 4,600 1,954 135.5 2,594 1,413
264 373 Advanta 4,572 2,191 108.6 2,621 1,090
265 430 NCC 4,555 1,766 157.9 2,899 687
266 260 Redington (India) ^^ 4,508 3,810 18.3 4,307 2,686
267 421 Tata Elxsi 4,492 1,797 149.9 2,115 863
268 238 TTK Prestige 4,487 4,320 3.9 4,262 3,844
269 282 Essar Ports 4,454 3,413 30.5 4,003 2,829
270 197 IFCI 4,453 5,752 (22.6) 5,941 4,092
271 210 Westlife Development ^^ 4,444 5,300 (16.1) 5,005 4,683
272 326 Future Retail 4,394 2,693 63.2 3,209 2,033
273 257 Pipavav Defence & Offshore Engg. Co. 4,392 3,852 14.0 3,758 3,955
274 198 Corporation Bank 4,389 5,736 (23.5) 5,563 4,673
275 252 Rallis India 4,386 4,037 8.6 4,215 2,956
276 328 JK Cement 4,376 2,669 64.0 3,573 1,436
277 225 Andhra Bank 4,371 4,792 (8.8) 4,889 3,835
278 337 Motilal Oswal Financial Services 4,356 2,578 69.0 3,126 1,141
279 454 Isgec Heavy Engg. 4,339 1,544 181.0 2,515 654
280 446 Century Plyboards (India) 4,238 1,632 159.7 2,726 761
281 335 Castex Technologies ** 4,226 2,584 63.6 2,323 1,970
282 356 ICRA 4,222 2,399 76.0 2,769 1,313
283 249 Lakshmi Machine Works 4,134 4,052 2.0 4,240 2,533
284 258 Jagran Prakashan 4,124 3,831 7.7 4,080 2,880
285 297 Credit Analysis & Research 4,110 3,132 31.3 3,727 1,935
286 332 Repco Home Finance 4,098 2,634 55.6 3,197 1,660
287 259 Trent 4,097 3,814 7.4 4,297 3,380
288 333 JK Lakshmi Cement 4,075 2,631 54.9 3,540 952
289 367 Grindwell Norton 4,047 2,226 81.8 2,784 1,356
290 279 Kirloskar Oil Engines 4,044 3,448 17.3 3,658 2,397
291 219 MOIL 4,033 4,947 (18.5) 4,960 3,679
292 604 Hitachi Home & Life Solutions (India) 4,030 866 365.5 1,701 357
293 391 Timken India 4,023 2,024 98.7 2,687 1,100
294 320 Jet Airways (India) 4,013 2,843 41.2 3,562 3,380
295 429 KRBL 4,010 1,773 126.1 2,235 708
296 236 Hathway Cable & Datacom 4,007 4,400 (8.9) 4,792 3,933
297 291 VA Tech Wabag 3,970 3,258 21.9 3,801 1,360
298 331 Allcargo Logistics 3,956 2,643 49.7 3,251 1,361
299 310 Hatsun Agro Products 3,944 2,999 31.5 3,194 1,831
300 242 Bank of Maharashtra 3,933 4,205 (6.5) 4,304 2,934

“Ran
k20
14”
isas
publ
ished
inla
stye
ar’s
BT50
0;Pa
ram
eter
rank
sar
efo
rw
ithin
the
top
1,000
com
pani
es;R
anks
have
been
assig
ned
base
don
mul
tiple
deci
mal
s;Be
caus
eof
roun
ding
off,
som
era
nks
may
appe
arin
corr
ect;
Re-
sults
are
aud
ited
and
stan
dalo
ne; O
vera
ll ra
nks
are
base
d on
ave
rage
mar
ket
capi
talis
atio
n (A
pril
1, 20
15 to
Sep
tem
ber
30, 2
015)
; Fig
ures
in b
rack
ets
deno
te n
egat
ive
valu
e; R
OCE:
retu
rn o
n ca
pita
l em
ploy
ed; R
ONW
: ret
urn
on n
et
wor
th; n
a: n
ot a
vaila
ble;
NA:
not
app
licab
le; N
L: n
ot li
sted
on
the
bour
ses;
NR:
not
rank
ed la
st y
ear;
All t
he la
test
dat
a fo
r FY
201
5 un
less
oth
erw
ise in
dica
ted;
^^
12 m
onth
s en
ding
Mar
ch 2
014;
@ 12
mon
ths
endi
ng D
ecem
ber
2014
; **
12m
onth
sen
ding
Sept
embe
r20
14;#
#12
mon
ths
endi
ngJu
ne20
14;*
12m
onth
sen
ding
June
2015
;^15
mon
ths
endi
ngM
arch
2015
;#18
mon
ths
endi
ngDe
cem
ber
2014
;***
9m
onth
sen
ding
Mar
ch20
15;@
@15
mon
ths
end-
ing
Mar
ch20
14;@
@@
18m
onth
sen
ding
Mar
ch20
15;^
^^6
mon
ths
endi
ngM
arch
2015
;##
#9
mon
ths
endi
ngSe
ptem
ber
2014
;*@
15m
onth
sen
ding
June
2014
;#@
#18
mon
ths
endi
ngSe
ptem
ber
2013
;#^#
12m
onth
sen
ding
Mar
ch20
13;+
10m
onth
sen
ding
Mar
ch20
14;
BFSI B
anki
ng, f
inan
cial
ser
vice
s an
d in
sura
nce
com
pani
es h
ave
a di
ffere
nt w
ay o
f ear
ning
and
pre
sent
ing
finan
cial
dat
a, s
o th
eir
inco
me,
pro
fit a
nd a
sset
num
bers
hav
e no
t be
en ra
nked
. Th
e BT
500
com
pani
es o
ver
the
past
20
year
s at
: ww
w.b
usin
esst
oday
.in/b
t500
So
urce
: CM
IE P
row
ess
November 8 2015 BUSINESS TODAY 113
2014/15
NET PROFIT ( cr)2014/15 2013/14 Rank 2015
PROFIT AS % OFTOTAL INCOME
RONW (%) ROCE (%) TOTAL INCOME ( cr)2014/15 2013/14 Rank 2015
TOTAL ASSETS ( cr)2014/15 2013/14 Rank 2015
RANK
251-300
603 611 634 608 624 577 106 123 278 17.48 29.58 29.58
6,625 2,337 NA 252 216 NA 111 73 NA 44.31 7.82 2.58
3,805 3,765 233 2,370 2,848 260 177 231 198 7.47 18.42 18.41
1,074 713 491 1,372 1,173 392 69 77 357 5.02 14.88 11.25
2,85,637 2,74,899 NA 26,945 25,129 NA (454) 602 NA (1.69) (3.23) -1.28
872 727 544 850 729 498 216 247 175 25.38 36.41 36.41
1,434 1,258 417 1,503 1,376 368 (29) (125) 810 (1.90) (28.74) -7.21
642 659 615 191 268 760 25 50 555 13.20 4.37 4.34
7,308 7,694 133 5,934 5,260 110 361 654 120 6.09 12.18 6.19
6,610 5,682 146 18,482 25,512 40 48 19 434 0.26 3.55 2.82
9,263 7,395 110 4,201 3,428 163 458 335 102 10.89 12.64 6.22
3,083 2,262 271 559 473 590 141 113 235 25.27 7.83 5.70
2,133 1,688 335 1,092 869 446 124 114 252 11.37 12.92 8.78
751 934 581 104 112 803 (5) 5 791 (4.98) (1.56) -0.66
9,546 9,211 107 8,524 6,319 83 112 41 269 1.31 3.91 2.19
3,045 2,842 273 11,380 10,465 64 240 171 165 2.11 20.56 14.50
596 483 638 863 812 493 90 75 306 10.38 34.58 34.58
900 875 533 1,429 1,339 380 92 112 300 6.46 15.05 14.73
3,452 3,336 256 88 87 813 1 (26) 753 0.68 0.02 0.02
35,054 29,067 NA 4,210 3,644 NA 514 508 NA 12.21 8.72 1.75
476 22 698 4 5 871 0.21 2 763 5.93 0.08 0.08
12,752 11,451 90 11,122 12,351 66 74 3 346 0.67 1.75 0.76
10,253 9,834 103 878 2,354 487 (369) 8 863 (42.02) (17.15) -4.65
2,26,480 2,22,347 NA 21,367 19,927 NA 584 562 NA 2.73 5.71 2.66
1,612 1,465 399 1,632 1,643 347 145 146 227 8.91 19.25 17.88
5,392 5,146 173 3,931 3,269 175 157 97 212 3.99 9.84 3.86
1,85,171 1,67,392 NA 17,990 15,631 NA 638 436 NA 3.55 7.11 2.75
1,073 766 NA 138 105 NA 68 44 NA 48.79 12.29 7.87
2,924 2,600 287 3,375 1,494 195 143 46 228 4.24 20.20 13.74
1,052 920 501 1,723 1,415 332 151 68 220 8.75 44.63 18.07
8,825 7,111 116 3,015 2,351 218 248 210 161 8.22 10.41 3.37
658 610 608 206 181 752 50 59 417 24.45 13.76 13.76
2,172 2,025 331 2,808 2,689 228 207 184 178 7.37 17.50 17.50
2,695 2,272 298 1,698 1,652 337 224 233 173 13.16 22.53 13.96
754 826 580 301 265 704 140 129 238 46.66 33.22 33.22
6,107 4,739 NA 693 535 NA 123 110 NA 17.76 15.88 2.33
1,975 1,920 358 1,618 1,392 349 100 54 290 6.18 7.44 6.37
4,198 3,605 216 2,608 2,342 241 96 93 295 3.67 7.30 3.11
921 822 531 1,215 1,032 418 101 82 288 8.31 17.25 17.21
1,976 1,896 357 2,734 2,548 235 143 178 229 5.24 10.97 10.97
3,651 3,490 240 1,164 1,340 425 428 509 106 36.78 13.15 13.15
1,090 770 485 1,715 1,210 334 78 8 332 4.53 28.16 19.04
866 740 545 973 770 466 81 45 325 8.29 19.66 19.53
20,379 19,515 56 21,253 18,226 35 (1,814) (3,668) 884 (8.53) 0.00 (23.53)
3,000 2,688 277 3,117 2,859 211 281 265 149 9.01 24.65 11.21
2,870 2,629 291 1,113 999 441 (175) (125) 848 (15.74) (16.64) -8.11
1,998 1,831 351 1,242 1,167 412 90 89 305 7.28 14.02 12.55
2,061 2,110 341 1,179 1,022 422 97 56 294 8.27 7.82 6.09
1,056 844 499 2,944 2,508 222 39 82 471 1.33 19.71 5.21
1,46,296 1,36,545 NA 13,823 12,943 NA 451 386 NA 3.26 7.06 2.75

114 BUSINESS TODAY November 8 2015
AVERAGE MARKET CAPITALISATION ( crore)Apr-Sept 2015 Apr-Sept 2014 Growth % 2014/15 2013/14
OVERALLRANKS Rise
INDIA’S MOSTVALUABLE COMPANIES THE TOP 500
KitexGarments RONW is a high45 per cent; market cap has more than tripled
301
Ricoh IndiaMarket cap jumps three and a half times, helpingit rise 316 ranks
332
Fall NoChange
RANK
201
5
COMPANY
RANK
201
4
301 513 Kitex Garments 3,909 1,197 226.4 1,822 325
302 266 Housing Development & Infrastructure 3,873 3,726 3.9 3,723 1,858
303 323 Finolex Cables 3,846 2,756 39.5 3,339 1,002
304 372 Sundaram-Clayton 3,821 2,193 74.3 2,792 678
305 350 Gateway Distriparks 3,818 2,449 55.9 3,134 1,319
306 316 Triveni Turbine 3,815 2,880 32.5 3,240 1,794
307 265 State Bank of Bikaner & Jaipur 3,801 3,735 1.8 4,006 2,451
308 357 Kalpataru Power Transmission 3,764 2,398 56.9 2,759 1,152
309 314 Atul 3,699 2,912 27.0 3,369 1,089
310 322 JM Financial ,684 2,791 32.0 3,256 1,860
311 410 DCB Bank 3,641 1,897 91.9 2,446 1,231
312 315 Jubilant Life Sciences 3,640 2,886 26.1 2,628 1,964
313 422 Shilpa Medicare 3,626 1,797 101.8 2,282 838
314 403 Asahi India Glass 3,623 1,930 87.8 2,509 935
315 405 Capital First 3,588 1,928 86.1 2,494 1,077
316 366 Zydus Wellness 3,580 2,255 58.7 2,675 2,137
317 376 Sundram Fasteners 3,564 2,164 64.7 2,991 840
318 247 Vijaya Bank 3,557 4,093 (13.1) 4,126 2,248
319 411 Orient Cement 3,549 1,893 87.5 2,569 801
320 395 Ceat 3,521 1,964 79.3 2,594 708
321 239 Sobha 3,499 4,312 (18.9) 4,399 3,178
322 227 IL&FS Transportation Networks 3,494 4,770 (26.7) 4,770 2,641
323 112 Jaiprakash Associates ^^ 3,459 13,706 (74.8) 10,238 11,223
324 NL Adani Transmission ˚ 3,457 na NA na na
325 528 Bombay Burmah Trdg. Corpn. 3,417 1,121 204.9 1,946 749
326 414 Zensar Technologies 3,390 1,873 80.9 2,315 1,270
327 586 Star Ferro & Cement 3,382 921 267.1 1,648 428
328 288 Finolex Industries 3,365 3,306 1.8 3,446 1,712
329 298 Birla Corporation 3,354 3,122 7.4 3,346 1,824
330 484 Suven Life Sciences 3,324 1,350 146.1 2,055 568
331 419 Aarti Industries 3,321 1,838 80.7 2,201 763
332 648 Ricoh India 3,270 742 340.5 1,074 319
333 432 Indoco Remedies 3,270 1,759 85.9 2,305 816
334 397 Entertainment Network (India) 3,257 1,958 66.4 2,285 1,363
335 334 Greaves Cotton 3,245 2,611 24.3 3,019 1,553
336 390 Ashoka Buildcon 3,228 2,027 59.3 2,159 923
337 278 Shoppers Stop 3,223 3,451 (6.6) 3,742 3,056
338 324 KEC International 3,222 2,749 17.2 2,570 1,100
339 292 Carborundum Universal 3,221 3,256 (1.1) 3,330 2,291
340 341 PVR 3,174 2,533 25.3 2,697 1,821
341 313 Tata Investment Corpn. 3,167 2,930 8.1 3,025 2,245
342 485 Marksans Pharma 3,159 1,347 134.4 1,820 421
343 262 South Indian Bank 3,151 3,759 (16.2) 3,719 2,912
344 NL VRL Logistics 3,145 na NA na na
345 306 Linde India @ 3,144 3,043 3.3 3,331 2,368
346 365 Responsive Industries 3,117 2,290 36.1 2,446 2,428
347 386 Sterlite Technologies 3,045 2,085 46.1 2,324 855
348 349 FDC 3,035 2,463 23.2 2,607 1,784
349 336 Blue Star 3,029 2,582 17.3 2,777 1,396
350 318 Rashtriya Chemicals & Fertilizers 3,027 2,866 5.6 3,188 1,850

“Ran
k201
4”is
aspu
blish
edin
last
year
’sBT
500;
Para
met
erra
nksa
refo
rwith
inth
eto
p1,0
00co
mpa
nies
;Ran
ksha
vebe
enas
signe
dba
sed
onm
ultip
lede
cim
als;
Beca
use
ofro
undi
ngof
f,so
me
rank
smay
appe
arin
corr
ect;
Resu
ltsar
eau
dite
d an
d sta
ndal
one;
Ove
rall r
anks
are b
ased
on a
vera
ge m
arke
t cap
italis
atio
n (Ap
ril 1,
201
5 to
Sept
embe
r 30,
201
5); F
igur
es in
brac
kets
deno
te ne
gativ
e val
ue; R
OCE:
retu
rn o
n cap
ital e
mpl
oyed
; RON
W: r
etur
n on n
et w
orth
; na:
not a
vaila
ble;
NA:
not
appl
icab
le; N
L: n
ot lis
ted
on th
e bo
urse
s; N
R: n
ot ra
nked
last
year
; All t
he la
test
dat
a fo
r FY
2015
unl
ess o
ther
wise
indi
cate
d;
^ 12
mon
ths e
ndin
g M
arch
201
4; @
12 m
onth
s end
ing
Dece
mbe
r 201
4; *
* 12
mon
ths e
ndin
g Se
ptem
ber 2
014;
##
12
mon
thse
ndin
gJun
e201
4;*1
2mon
thse
ndin
gJun
e201
5;^1
5mon
thse
ndin
gMar
ch20
15;#
18m
onth
send
ingD
ecem
ber2
014;
***9
mon
thse
ndin
gMar
ch20
15;@
@15
mon
thse
ndin
gMar
ch20
14;@
@@
18m
onth
send
ingM
arch
2015
;^^^
6mon
ths
endi
ngM
arch
2015
;##
#9
mon
thse
ndin
gSep
tem
ber2
014;
*@15
mon
thse
ndin
gJun
e201
4;#
@#
18m
onth
send
ingS
epte
mbe
r201
3;#
^#12
mon
thse
ndin
gMar
ch20
13;+
10m
onth
send
ingM
arch
2014
;˚Th
ecom
pany
was
inco
rpor
ated
in20
13an
dw
aslis
ted
in20
15,h
ence
earli
erda
tais
nota
vaila
ble
BFSI B
anki
ng, f
inan
cial
serv
ices
and
insu
ranc
e co
mpa
nies
hav
e a
diffe
rent
way
of e
arni
ng a
nd p
rese
ntin
g fin
anci
al d
ata,
so th
eir i
ncom
e, p
rofit
and
ass
et n
umbe
rs h
ave
not b
een
rank
ed.
The
BT50
0 co
mpa
nies
ove
r th
e pa
st 2
0 ye
ars
at: w
ww
.bus
ines
stod
ay.in
/bt5
00
Sour
ce: C
MIE
Pro
wes
s
November 8 2015 BUSINESS TODAY 115
2014/15
NET PROFIT ( cr)2014/15 2013/14 Rank 2015
PROFIT AS % OFTOTAL INCOME
RONW (%) ROCE (%) TOTAL INCOME ( cr)2014/15 2013/14 Rank 2015
TOTAL ASSETS ( cr)2014/15 2013/14 Rank 2015
RANK
301-350
536 405 665 525 456 605 99 57 292 18.78 44.98 26.83
16,292 16,081 65 1,097 940 445 233 243 168 21.20 2.21 1.79
1,642 1,572 394 2,656 2,569 238 199 208 184 7.48 16.78 15.04
1,014 988 508 1,476 1,320 374 71 54 350 4.82 19.82 9.76
906 778 532 308 201 700 81 37 325 26.21 12.43 11.72
564 548 653 685 538 545 91 68 304 13.29 43.71 42.75
1,02,496 91,055 NA 9,943 9,053 NA 777 732 NA 7.81 13.76 6.08
4,837 4,613 191 4,547 4,225 152 166 146 208 3.64 8.23 5.73
1,774 1,786 382 2,734 2,556 234 217 213 174 7.95 23.44 17.49
1,949 1,791 NA 105 87 NA 78 71 NA 74.71 4.77 4.60
16,150 12,936 NA 1,588 1,274 NA 191 151 NA 12.04 14.49 8.20
5,280 6,838 175 3,921 3,839 176 205 1 179 5.23 11.15 4.42
784 627 571 578 543 586 84 81 314 14.54 17.24 14.57
2,357 2,404 319 2,240 2,265 273 50 (40) 418 2.24 17.51 2.96
10,387 10,039 NA 1,430 1,097 NA 112 37 NA 7.83 9.10 1.17
489 434 686 242 223 729 109 96 274 45.04 29.78 29.78
2,048 1,857 343 2,590 2,229 242 135 121 245 5.22 16.56 8.91
1,42,643 1,37,359 NA 13,253 11,519 NA 439 416 NA 3.32 7.68 3.75
2,574 1,570 307 1,835 1,703 318 195 101 187 10.61 21.73 12.07
3,687 3,413 239 6,212 5,917 106 299 254 145 4.81 23.35 13.38
5,956 5,241 156 2,413 2,140 258 187 207 193 7.73 8.14 4.93
13,174 9,729 87 3,884 3,722 178 319 263 135 8.20 11.33 3.46
49,187 46,126 27 14,361 14,188 51 414 501 109 2.88 3.11 1.05
3,711 0.05 236 24 0 850 (18) 0 803 (75.24) (3.34) (0.97)
683 521 603 282 299 714 7 5 688 2.49 2.73 1.32
1,144 953 465 1,102 962 443 183 187 196 16.61 25.89 25.74
30 157 872 0.001 153 889 (1) 16 785 na (1.920) (1.62)
1,865 1,941 366 2,847 2,830 225 48 170 436 1.68 6.06 4.14
5,084 4,957 185 3,840 3,603 182 175 130 199 4.57 6.86 4.49
776 489 573 530 514 601 109 144 275 20.51 26.56 21.37
2,819 2,565 293 3,094 2,837 214 188 149 192 6.07 22.27 9.55
1,297 861 439 1,671 1,059 341 34 17 498 2.03 21.99 4.96
853 734 548 871 744 490 83 58 317 9.50 16.98 14.27
926 772 528 476 413 626 106 83 279 22.26 16.89 16.89
1,553 1,520 407 1,880 1,978 314 82 113 321 4.34 10.01 10.01
2,670 2,218 300 2,004 1,665 301 142 103 232 7.09 14.31 10.71
1,795 1,664 377 3,422 3,063 193 41 37 463 1.19 5.45 3.31
6,232 6,107 151 6,961 6,842 99 111 86 271 1.60 10.39 4.36
1,159 1,061 459 1,386 1,267 389 148 73 221 10.70 18.67 16.56
1,393 1,265 426 1,604 1,508 351 14 58 641 0.85 3.45 1.27
2,447 2,332 NA 233 225 NA 187 179 NA 80.05 8.85 8.85
529 376 668 418 323 653 67 56 366 16.04 27.28 20.42
59,161 55,006 NA 5,856 5,429 NA 307 508 NA 5.25 9.21 5.28
958 981 521 1,683 1,510 340 91 57 303 5.42 27.68 11.35
4,054 4,070 223 1,638 1,588 346 5 77 698 0.33 0.38 0.18
1,168 1,297 457 1,567 1,887 357 33 51 499 2.12 6.47 2.89
4,335 3,653 212 3,306 2,934 199 84 50 312 2.55 6.86 3.08
1,144 1,068 467 942 895 473 146 134 226 15.50 16.50 16.48
2,669 2,691 301 3,240 2,853 204 153 76 217 4.71 26.42 15.78
6,347 5,695 149 8,003 6,846 89 322 250 133 4.02 12.36 7.23

116 BUSINESS TODAY November 8 2015
AVERAGE MARKET CAPITALISATION ( crore)Apr-Sept 2015 Apr-Sept 2014 Growth % 2014/15 2013/14
OVERALLRANKS Rise
INDIA’S MOSTVALUABLE COMPANIES THE TOP 500
Amtek Auto Sharp fall in profi t/rank and low RONWof 6.5 per centappears con-sistent with the troubles it is facing
355
UnitechContinues to struggle withnegative ROCEand RONW
384
Fall NoChange
RANK
201
5
COMPANY
RANK
201
4
351 307 State Bank of Travancore 3,022 3,039 (0.6) 3,019 2,262
352 228 Gujarat Mineral Devp. Corpn. 2,956 4,721 (37.4) 4,437 3,644
353 NR Sharda Cropchem 2,930 2,275 28.8 2,446 na
354 312 Gujarat State Fertilizers & Chemicals 2,901 2,959 (2.0) 3,504 2,152
355 224 Amtek Auto ** 2,883 4,825 (40.3) 4,343 1,643
356 416 Ingersoll-Rand (India) 2,873 1,868 53.8 2,336 1,164
357 NR Yamini Investment Co. ^^ 2,872 11 26,178.0 12 6
358 237 Jain Irrigation Systems 2,869 4,341 (33.9) 3,795 2,662
359 433 Ratnamani Metals & Tubes 2,862 1,735 65.0 2,348 649
360 408 Dhanuka Agritech ^^ 2,849 1,914 48.8 2,320 785
361 584 Sequent Scientific 2,827 929 204.1 1,188 389
362 407 V-Guard Industries 2,784 1,924 44.7 2,440 1,440
363 493 Mangalam Industrial Finance 2,780 1,300 113.9 1,913 324
364 461 OCL India 2,775 1,477 87.8 1,939 847
365 302 Godfrey Phillips India 2,753 3,099 (11.1) 2,983 2,910
366 877 Indo Count Industries 2,748 367 648.9 820 97
367 438 Vinati Organics 2,747 1,680 63.5 2,041 723
368 441 Cera Sanitaryware 2,724 1,661 64.0 2,117 748
369 358 Raymond 2,712 2,386 13.7 2,714 1,602
370 477 Techno Electric & Engineering Co. 2,708 1,381 96.0 1,734 626
371 327 Astrazeneca Pharma India 2,704 2,691 0.5 2,428 2,025
372 329 Shipping Corpn. of India 2,702 2,655 1.8 2,667 1,721
373 567 CCL Products (India) 2,693 980 174.7 1,535 437
374 406 Kewal Kiran Clothing 2,654 1,924 37.9 2,095 1,121
375 299 India Cements ^^ 2,642 3,119 (15.3) 3,066 1,818
376 379 Welspun Corp 2,640 2,149 22.8 1,989 1,251
377 431 PTC India Financial Services 2,636 1,762 49.6 2,491 717
378 280 EID-Parry (India) 2,636 3,435 (23.3) 3,456 2,385
379 304 Bajaj Electricals 2,607 3,079 (15.3) 2,723 1,861
380 445 Texmaco Rail & Engineering 2,601 1,633 59.3 2,118 700
381 290 Indiabulls Real Estate 2,586 3,289 (21.4) 3,198 2,673
382 605 Aegis Logistics 2,580 866 198.1 1,160 476
383 369 Chambal Fertilisers & Chemicals 2,578 2,219 16.2 2,428 1,648
384 190 Unitech 2,571 6,422 (60.0) 5,594 4,755
385 355 NIIT Technologies 2,567 2,415 6.3 2,355 1,885
386 261 Dena Bank 2,558 3,776 (32.2) 3,452 2,395
387 428 Rupa & Co. 2,508 1,779 41.0 1,786 1,515
388 523 La Opala RG 2,501 1,149 117.7 1,690 518
389 330 VST Industries 2,500 2,645 (5.5) 2,705 2,433
390 636 Force Motors 2,498 788 217.1 1,226 424
391 353 Karnataka Bank 2,497 2,438 2.5 2,490 2,056
392 623 KPR Mill 2,465 817 201.8 1,140 494
393 351 Omaxe 2,454 2,440 0.6 2,396 2,416
394 281 Den Networks 2,450 3,435 (28.7) 2,936 2,691
395 444 HSIL 2,437 1,634 49.2 2,122 630
396 343 Mahindra Holidays & Resorts India 2,427 2,511 (3.4) 2,440 2,128
397 451 Greencrest Financial Services 2,418 1,564 54.6 1,956 221
398 392 Manappuram Finance 2,397 2,004 19.6 2,403 1,413
399 521 JK Tyre & Industries 2,395 1,169 104.9 1,831 507
400 296 McLeod Russel India 2,388 3,153 (24.3) 2,870 3,137

“Ran
k20
14”
isas
publ
ished
inla
stye
ar’s
BT50
0;Pa
ram
eter
rank
sar
efo
rw
ithin
the
top
1,000
com
pani
es;R
anks
have
been
assig
ned
base
don
mul
tiple
deci
mal
s;Be
caus
eof
roun
ding
off,
som
era
nks
may
appe
arin
corr
ect;
Re-
sults
are
aud
ited
and
stan
dalo
ne; O
vera
ll ra
nks
are
base
d on
ave
rage
mar
ket
capi
talis
atio
n (A
pril
1, 20
15 to
Sep
tem
ber
30, 2
015)
; Fig
ures
in b
rack
ets
deno
te n
egat
ive
valu
e; R
OCE:
retu
rn o
n ca
pita
l em
ploy
ed; R
ONW
: ret
urn
on n
et
wor
th; n
a: n
ot a
vaila
ble;
NA:
not
app
licab
le; N
L: n
ot li
sted
on
the
bour
ses;
NR:
not
rank
ed la
st y
ear;
All t
he la
test
dat
a fo
r FY
201
5 un
less
oth
erw
ise in
dica
ted;
^^
12 m
onth
s en
ding
Mar
ch 2
014;
@ 12
mon
ths
endi
ng D
ecem
ber
2014
; **
12m
onth
sen
ding
Sept
embe
r20
14;#
#12
mon
ths
endi
ngJu
ne20
14;*
12m
onth
sen
ding
June
2015
;^15
mon
ths
endi
ngM
arch
2015
;#18
mon
ths
endi
ngDe
cem
ber
2014
;***
9m
onth
sen
ding
Mar
ch20
15;@
@15
mon
ths
end-
ing
Mar
ch20
14;@
@@
18m
onth
sen
ding
Mar
ch20
15;^
^^6
mon
ths
endi
ngM
arch
2015
;##
#9
mon
ths
endi
ngSe
ptem
ber
2014
;*@
15m
onth
sen
ding
June
2014
;#@
#18
mon
ths
endi
ngSe
ptem
ber
2013
;#^#
12m
onth
sen
ding
Mar
ch20
13;+
10m
onth
sen
ding
Mar
ch20
14;
BFSI B
anki
ng, f
inan
cial
ser
vice
s an
d in
sura
nce
com
pani
es h
ave
a di
ffere
nt w
ay o
f ear
ning
and
pre
sent
ing
finan
cial
dat
a, s
o th
eir
inco
me,
pro
fit a
nd a
sset
num
bers
hav
e no
t be
en ra
nked
. Th
e BT
500
com
pani
es o
ver
the
past
20
year
s at
: ww
w.b
usin
esst
oday
.in/b
t500
So
urce
: CM
IE P
row
ess
November 8 2015 BUSINESS TODAY 117
2014/15
NET PROFIT ( cr)2014/15 2013/14 Rank 2015
PROFIT AS % OFTOTAL INCOME
RONW (%) ROCE (%) TOTAL INCOME ( cr)2014/15 2013/14 Rank 2015
TOTAL ASSETS ( cr)2014/15 2013/14 Rank 2015
RANK
351-400
1,05,595 1,05,285 NA 10,669 10,559 NA 336 304 NA 3.15 6.36 3.17
4,275 4,050 213 1,728 1,483 331 500 439 95 28.95 16.39 16.39
923 785 529 797 576 514 98 89 293 12.26 17.72 17.12
6,708 6,721 145 5,678 5,823 118 401 342 113 7.05 9.26 7.86
13,859 12,190 80 4,000 3,316 171 323 451 132 8.08 6.51 2.64
1,500 1,646 409 783 698 518 66 67 369 8.45 7.07 7.07
1 0.28 NA 0.15 0.16 NA 0.03 0 NA 20.00 10.53 10.53
7,242 6,978 135 4,434 4,335 154 49 4 423 1.11 2.10 0.92
1,228 1,151 450 1,793 1,450 322 173 143 203 9.62 20.60 19.22
517 420 672 834 653 502 93 64 298 11.17 31.29 27.87
677 599 604 543 469 595 41 (114) 462 7.60 39.88 9.20
737 688 586 1,764 1,543 327 71 70 352 4.01 20.32 16.21
96 96 NA 0.2 0.17 NA 0.06 (0.07) NA 30.00 0.06 0.06
3,320 2,521 263 2,551 2,142 248 114 98 266 4.46 9.86 5.21
2,071 1,944 340 4,486 4,221 153 183 171 197 4.08 14.91 12.32
1,155 976 462 1,687 1,464 338 139 105 240 8.24 58.09 22.79
651 588 612 837 761 501 116 86 262 13.83 31.12 23.85
646 455 614 865 702 492 68 52 362 7.83 23.51 19.55
3,501 3,352 251 2,795 2,416 229 101 88 287 3.62 8.92 4.02
1,124 1,032 474 713 623 537 85 70 310 11.87 12.94 10.29
415 421 718 533 508 598 (21) (1) 806 (3.91) (12.93) (12.91)
15,350 16,627 73 4,604 4,571 150 201 (275) 183 4.36 3.12 1.44
596 546 637 679 617 549 75 73 345 11.00 19.67 15.38
413 372 721 427 392 648 66 67 368 15.50 21.70 20.91
8,766 8,832 117 5,129 5,232 135 (162) 164 845 (3.17) (4.54) (2.43)
7,205 6,210 138 5,265 5,153 130 (16) (17) 801 (0.30) (0.82) (0.37)
7,070 5,600 NA 802 547 NA 161 208 NA 20.06 11.55 2.73
4,421 4,322 206 2,335 2,001 263 148 27 222 6.35 11.24 4.59
3,414 3,210 259 4,309 4,080 155 (14) (5) 798 (0.32) (2.02) (1.30)
1,361 1,030 428 502 506 616 14 17 639 2.74 1.87 1.64
8,715 7,593 119 331 389 686 23 145 573 6.98 0.40 0.29
600 603 636 441 380 641 109 19 272 24.80 30.15 21.01
7,303 7,801 134 9,038 8,227 79 237 303 166 2.62 10.77 3.67
28,899 27,871 44 1,395 2,153 387 (15) 79 800 (1.07) (0.15) (0.10)
1,757 1,456 384 1,398 1,389 386 148 214 223 10.55 15.15 14.71
1,29,921 1,24,863 NA 11,690 10,953 NA 265 552 NA 2.27 4.11 2.47
739 637 585 1,050 962 451 66 62 371 6.26 22.39 13.24
229 146 794 230 185 736 42 30 459 18.16 29.48 27.35
840 771 552 1,742 1,664 330 152 150 218 8.74 45.53 45.53
2,050 2,026 342 2,705 2,362 236 101 78 285 3.75 7.97 7.75
52,026 47,169 NA 5,286 4,699 NA 451 311 NA 8.54 14.02 9.61
1,777 1,735 381 2,104 1,990 287 146 131 225 6.94 17.98 9.79
4,961 4,826 188 981 1,223 464 40 62 468 4.09 2.44 1.24
3,036 3,083 274 944 937 471 (111) 5 838 (11.74) (6.50) (4.10)
2,898 2,867 289 2,005 1,889 300 104 56 281 5.20 8.15 4.73
2,720 2,616 297 808 799 512 79 95 329 9.78 10.39 10.33
51 49 NA 4 2 NA 1 1 NA 32.22 2.50 2.50
11,336 10,842 NA 1,981 2,144 NA 271 226 NA 13.67 10.66 2.52
5,921 5,168 159 6,799 6,578 101 253 135 160 3.73 26.19 7.33
2,984 2,871 280 1,461 1,539 377 64 210 377 4.37 4.75 3.86

118 BUSINESS TODAY November 8 2015
AVERAGE MARKET CAPITALISATION ( crore)Apr-Sept 2015 Apr-Sept 2014 Growth % 2014/15 2013/14
OVERALLRANKS Rise
INDIA’S MOSTVALUABLE COMPANIES THE TOP 500
Eveready Industries (India) Jumps 323 ranks as net profi t rises three and a half times
416
Jaiprakash Power VenturesThe company,which earliersold assets to manage a severe cash crunch, has crashed fromrank 208 to 425
425
Fall NoChange
RANK
201
5
COMPANY
RANK
201
4
401 413 Novartis India 2,381 1,878 26.8 1,967 1,443
402 490 Chennai Petroleum Corpn. 2,342 1,315 78.0 1,265 1,113
403 456 Siti Cable Network 2,342 1,523 53.7 1,759 896
404 470 Gulf Oil Lubricants India 2,338 1,431 63.4 2,030 na
405 409 Navneet Education 2,337 1,904 22.7 2,187 1,344
406 585 Shasun Pharmaceuticals 2,326 928 150.5 1,251 414
407 522 Sterling Holiday Resorts (India) ^^ 2,310 1,155 100.0 1,468 506
408 476 Future Consumer Enterprise 2,306 1,390 65.9 1,675 1,045
409 308 RattanIndia Power 2,273 3,014 (24.6) 3,090 1,992
410 613 J Kumar Infraprojects 2,271 847 168.2 1,184 479
411 295 KPIT Technologies 2,263 3,178 (28.8) 3,458 2,674
412 436 Greenply Industries 2,261 1,687 34.0 1,962 953
413 489 Federal-Mogul Goetze (India) ^ 2,256 1,319 71.0 1,750 1,099
414 NL PNC Infratech ^^ 2,228 na NA na na
415 348 BF Utilities ** 2,216 2,489 (11.0) 2,432 1,206
416 739 Eveready Industries (India) 2,211 548 303.6 945 185
417 692 Ramco Systems 2,203 650 239.0 931 191
418 352 State Bank of Mysore 2,203 2,438 (9.6) 2,493 2,255
419 378 Clariant Chemicals (India) @ 2,192 2,155 1.7 2,283 1,412
420 345 HT Media 2,184 2,496 (12.5) 2,671 2,071
421 457 Essel Propack 2,184 1,496 46.0 1,707 690
422 691 IFB Industries 2,170 655 231.4 1,281 273
423 347 Goldline International Finvest ^^ 2,168 2,489 (12.9) 2,534 na
424 511 Ashiana Housing 2,155 1,203 79.1 1,627 528
425 208 Jaiprakash Power Ventures 2,134 5,368 (60.2) 4,487 5,284
426 635 Kirloskar Brothers Investment 2,129 790 169.7 1,446 478
427 455 Nesco 2,126 1,530 39.0 1,810 1,047
428 375 Sunrise Asian 2,120 2,179 (2.7) 2,236 1,939
429 418 Elgi Equipments 2,117 1,857 14.0 2,090 1,307
430 464 JB Chemicals & Pharmaceuticals ^^ 2,096 1,461 43.5 1,597 840
431 412 Magma Fincorp 2,090 1,887 10.8 1,946 1,435
432 437 KSB Pumps @ 2,078 1,680 23.7 1,922 797
433 243 Jaypee Infratech 2,054 4,202 (51.1) 3,547 3,216
434 321 United Bank of India 2,053 2,800 (26.7) 2,827 1,589
435 620 Forbes & Co. 2,051 825 148.8 1,438 720
436 402 Unichem Laboratories 2,047 1,932 5.9 1,977 1,636
437 525 Poly Medicure ^^ 2,039 1,138 79.3 1,584 660
438 540 Granules India 2,032 1,086 87.1 1,362 342
439 360 Firstsource Solutions 2,022 2,348 (13.9) 2,307 1,157
440 374 SREI Infrastructure Finance 2,016 2,184 (7.7) 2,239 1,145
441 346 PTC India 1,987 2,492 (20.3) 2,573 1,630
442 657 Can Fin Homes 1,982 726 172.9 994 306
443 385 Jindal Saw 1,979 2,087 (5.2) 2,216 1,536
444 NL Manpasand Beverages 1,970 na NA na na
445 443 Mayur Uniquoters 1,917 1,640 16.9 1,771 631
446 283 Aban Offshore 1,906 3,393 (43.8) 3,159 1,390
447 371 Hindustan Construction Co. 1,900 2,201 (13.7) 2,131 767
448 492 Transport Corporation of India 1,900 1,314 44.6 1,579 470
449 628 Avanti Feeds 1,891 805 135.0 1,134 208
450 588 Huhtamaki PPL @ 1,882 920 104.4 1,169 428

“Ran
k20
14”
isas
publ
ished
inla
stye
ar’s
BT50
0;Pa
ram
eter
rank
sar
efo
rw
ithin
the
top
1,000
com
pani
es;R
anks
have
been
assig
ned
base
don
mul
tiple
deci
mal
s;Be
caus
eof
roun
ding
off,
som
era
nks
may
appe
arin
corr
ect;
Re-
sults
are
aud
ited
and
stan
dalo
ne; O
vera
ll ra
nks
are
base
d on
ave
rage
mar
ket
capi
talis
atio
n (A
pril
1, 20
15 to
Sep
tem
ber
30, 2
015)
; Fig
ures
in b
rack
ets
deno
te n
egat
ive
valu
e; R
OCE:
retu
rn o
n ca
pita
l em
ploy
ed; R
ONW
: ret
urn
on n
et
wor
th; n
a: n
ot a
vaila
ble;
NA:
not
app
licab
le; N
L: n
ot li
sted
on
the
bour
ses;
NR:
not
rank
ed la
st y
ear;
All t
he la
test
dat
a fo
r FY
201
5 un
less
oth
erw
ise in
dica
ted;
^^
12 m
onth
s en
ding
Mar
ch 2
014;
@ 12
mon
ths
endi
ng D
ecem
ber
2014
; **
12m
onth
sen
ding
Sept
embe
r20
14;#
#12
mon
ths
endi
ngJu
ne20
14;*
12m
onth
sen
ding
June
2015
;^15
mon
ths
endi
ngM
arch
2015
;#18
mon
ths
endi
ngDe
cem
ber
2014
;***
9m
onth
sen
ding
Mar
ch20
15;@
@15
mon
ths
end-
ing
Mar
ch20
14;@
@@
18m
onth
sen
ding
Mar
ch20
15;^
^^6
mon
ths
endi
ngM
arch
2015
;##
#9
mon
ths
endi
ngSe
ptem
ber
2014
;*@
15m
onth
sen
ding
June
2014
;#@
#18
mon
ths
endi
ngSe
ptem
ber
2013
;#^#
12m
onth
sen
ding
Mar
ch20
13;+
10m
onth
sen
ding
Mar
ch20
14;
BFSI B
anki
ng, f
inan
cial
ser
vice
s an
d in
sura
nce
com
pani
es h
ave
a di
ffere
nt w
ay o
f ear
ning
and
pre
sent
ing
finan
cial
dat
a, s
o th
eir
inco
me,
pro
fit a
nd a
sset
num
bers
hav
e no
t be
en ra
nked
. Th
e BT
500
com
pani
es o
ver
the
past
20
year
s at
: ww
w.b
usin
esst
oday
.in/b
t500
So
urce
: CM
IE P
row
ess
November 8 2015 BUSINESS TODAY 119
2014/15
NET PROFIT ( cr)2014/15 2013/14 Rank 2015
PROFIT AS % OFTOTAL INCOME
RONW (%) ROCE (%) TOTAL INCOME ( cr)2014/15 2013/14 Rank 2015
TOTAL ASSETS ( cr)2014/15 2013/14 Rank 2015
RANK
401-450
2,087 2,030 338 1,005 1,009 459 79 99 328 7.87 8.06 8.06
11,713 13,942 94 48,636 54,023 19 (39) (304) 819 0.08 (2.31) (0.54)
2,039 1,693 345 616 521 572 (118) (102) 841 (19.12) (97.97) (8.25)
604 34 631 1,128 0.002 434 77 (0.01) 335 6.86 82.72 38.44
840 860 551 979 882 465 129 113 247 13.21 24.31 17.94
1,352 1,163 432 1,129 985 433 41 35 461 3.66 11.43 4.48
622 455 625 136 112 787 (16) (21) 802 (12.02) (10.46) (9.28)
1,610 1,065 401 1,119 464 438 (94) 30 835 (8.38) (9.98) (7.69)
13,298 11,708 85 651 393 557 (340) (75) 861 (52.19) (6.41) (2.98)
1,692 1,653 387 1,357 1,198 395 94 84 297 6.96 13.84 7.75
1,738 1,674 385 1,281 960 405 152 149 219 11.87 14.56 10.33
1,157 1,735 461 1,628 2,256 348 122 114 256 7.48 22.84 11.76
1,073 955 492 1,705 1,268 336 31 21 517 1.84 7.21 4.80
1,282 1,117 441 1,163 1,308 426 70 79 354 6.03 11.79 8.17
244 228 790 25 30 847 1 5 739 5.13 1.78 0.75
1,128 1,128 473 1,344 1,228 396 49 14 431 3.65 8.05 5.94
618 550 627 225 174 739 2 (19) 732 0.69 0.79 0.29
79,613 74,101 NA 7,717 6,968 NA 407 273 NA 5.28 9.82 4.18
1,849 919 372 2,333 1,457 264 943 166 58 40.44 95.75 95.29
2,590 2,554 305 1,648 1,579 345 114 156 267 6.90 7.81 6.13
1,008 1,278 511 830 748 504 53 54 407 6.38 8.80 5.32
775 645 575 1,368 1,106 393 50 22 420 3.63 13.81 12.40
66 65 NA 1 0.47 NA 0.15 0.07 NA 12.10 0.29 0.29
1,130 634 471 140 89 786 46 21 439 32.51 11.43 10.77
32,461 29,510 42 4,067 2,750 170 137 20 244 3.37 2.16 0.49
370 349 NA 53 51 NA 48 49 NA 91.30 13.62 13.62
676 561 605 225 183 740 112 81 270 49.70 23.12 23.12
197 166 804 170 113 773 1 1 747 0.56 1.21 1.12
830 796 554 829 884 505 56 78 397 6.81 10.97 9.17
1,361 1,278 429 1,012 853 456 68 85 360 6.76 6.65 6.23
12,432 11,431 NA 2,046 1,879 NA 149 136 NA 7.28 13.08 1.40
885 772 539 882 805 485 65 60 372 7.42 13.50 13.13
20,574 20,360 55 3,258 3,332 202 355 (46) 122 10.90 5.72 2.39
1,23,028 1,25,105 NA 12,052 12,209 NA 256 (1,213) NA 2.12 5.62 2.78
487 500 689 322 312 691 (1) (30) 782 (0.18) (0.42) (0.19)
1,240 1,223 447 1,119 1,144 437 64 177 375 5.75 6.95 6.95
284 213 775 328 257 688 43 24 450 13.10 33.68 23.13
1,103 858 482 1,251 1,025 411 95 81 296 7.61 24.95 12.71
1,963 1,769 359 937 988 475 164 134 209 17.47 10.93 9.40
17,216 16,249 NA 1,900 1,806 NA 91 59 NA 4.78 3.47 0.57
4,867 4,109 190 13,039 11,438 55 203 251 181 1.56 7.89 7.89
8,356 5,924 NA 817 582 NA 86 76 NA 10.56 14.09 1.24
10,744 8,635 98 7,136 6,008 98 262 168 156 3.68 6.48 3.21
350 196 743 367 300 676 30 21 527 8.15 21.07 12.54
481 327 692 569 519 588 68 57 361 12.02 35.60 25.81
4,724 3,939 198 818 864 507 191 180 190 23.30 8.00 5.10
10,427 9,505 101 4,298 4,280 156 82 81 320 1.90 6.16 1.30
1,065 914 494 2,209 2,033 277 76 62 338 3.44 15.13 9.40
535 427 666 1,785 1,135 324 117 70 261 6.53 53.77 42.54
813 602 559 1,229 1,085 415 65 55 373 5.26 13.65 13.10

120 BUSINESS TODAY November 8 2015
AVERAGE MARKET CAPITALISATION ( crore)Apr-Sept 2015 Apr-Sept 2014 Growth % 2014/15 2013/14
OVERALLRANKS Rise
INDIA’S MOSTVALUABLE COMPANIES THE TOP 500
Rolta India Rank and market cap have slid, butnet profi t has jumped almost 60 per cent
457
Caplin Point Laboratories The companyhas not only risen more than 350 ranks, it also has the eighthbest ROCE in the entire BT500
463
Fall NoChange
RANK
201
5
COMPANY
RANK
201
4
451 268 KSK Energy Ventures 1,875 3,671 (48.9) 3,330 2,089
452 340 DCM Shriram 1,873 2,560 (26.8) 2,590 985
453 616 Dynamatic Technologies 1,869 842 122.0 1,171 325
454 471 Inox Leisure 1,865 1,411 32.2 1,552 741
455 389 Mahindra Lifespace Developers 1,860 2,031 (8.4) 2,030 1,635
456 496 Simplex Infrastructures 1,838 1,289 42.6 1,527 409
457 448 Rolta India 1,832 1,622 12.9 1,782 1,025
458 447 Kennametal India ## 1,807 1,624 11.3 1,724 1,065
459 380 Delta Corp 1,774 2,140 (17.1) 2,123 1,762
460 339 Vaibhav Global 1,770 2,562 (30.9) 2,477 1,125
461 622 SML Isuzu 1,753 818 114.4 1,102 398
462 364 Bombay Rayon Fashions 1,746 2,296 (23.9) 2,050 2,802
463 825 Caplin Point Laboratories ## 1,746 426 309.9 623 124
464 381 Polaris Consulting & Services 1,745 2,129 (18.1) 1,935 1,268
465 673 Minda Corporation 1,744 689 153.0 1,955 473
466 440 Punjab & Sind Bank 1,736 1,667 4.1 1,988 1,239
467 794 TVS Srichakra 1,705 472 261.3 817 170
468 535 Pantaloons Fashion & Retail 1,689 1,102 53.2 1,099 953
469 425 Tata Coffee 1,684 1,791 (6.0) 1,783 2,053
470 486 Tree House Education & Accessories 1,680 1,346 24.8 1,575 911
471 420 Himachal Futuristic Communications 1,676 1,805 (7.1) 2,014 1,006
472 766 Ramkrishna Forgings 1,674 507 230.0 741 208
473 707 Igarashi Motors India 1,664 621 167.9 801 179
474 472 Balmer Lawrie & Co. 1,657 1,409 17.7 1,548 940
475 450 Escorts 1,655 1,568 5.5 1,623 1,153
476 524 Hindustan Media Ventures 1,646 1,138 44.6 1,340 909
477 534 Lakshmi Vilas Bank 1,644 1,103 49.1 1,333 691
478 368 Puravankara Projects 1,641 2,222 (26.1) 2,116 1,753
479 387 Sunteck Realty 1,631 2,035 (19.9) 1,899 2,139
480 499 Brigade Enterprises 1,629 1,276 27.7 1,480 666
481 289 CCL International 1,625 3,289 (50.6) 3,974 907
482 473 Heidelberg Cement India ^ 1,625 1,398 16.2 1,642 864
483 775 Skipper 1,615 496 225.4 1,059 na
484 394 Kirloskar Brothers 1,601 1,993 (19.7) 1,875 1,211
485 674 MPS 1,595 688 131.7 1,021 294
486 NR Snowman Logistics 1,582 1,478 7.0 1,572 na
487 665 Ahluwalia Contracts (India) ^^ 1,582 707 123.7 1,036 170
488 688 Aarti Drugs 1,569 658 138.6 934 249
489 627 Sonata Software 1,563 806 93.9 1,127 339
490 544 Gati 1,559 1,065 46.4 1,596 314
491 629 JBF Industries 1,558 804 93.8 1,095 606
492 508 Suprajit Engineering 1,557 1,216 28.0 1,386 495
493 587 Trident 1,556 921 68.9 1,124 359
494 495 India Tourism Devp. Corpn. ^^ 1,553 1,289 20.4 1,244 3,881
495 563 Nirlon 1,541 1,002 53.8 1,335 316
496 396 Graphite India 1,539 1,958 (21.4) 1,829 1,485
497 768 Bliss GVS Pharma 1,532 504 204.0 690 375
498 NL Kaya 1,520 na NA na na
499 388 Fertilisers & Chemicals, Travancore 1,519 2,032 (25.3) 2,047 1,355
500 NL UFO Moviez India 1,514 na NA na na

“Ran
k20
14”
isas
publ
ished
inla
stye
ar’s
BT50
0;Pa
ram
eter
rank
sar
efo
rw
ithin
the
top
1,000
com
pani
es;R
anks
have
been
assig
ned
base
don
mul
tiple
deci
mal
s;Be
caus
eof
roun
ding
off,
som
era
nks
may
appe
arin
corr
ect;
Re-
sults
are
aud
ited
and
stan
dalo
ne; O
vera
ll ra
nks
are
base
d on
ave
rage
mar
ket
capi
talis
atio
n (A
pril
1, 20
15 to
Sep
tem
ber
30, 2
015)
; Fig
ures
in b
rack
ets
deno
te n
egat
ive
valu
e; R
OCE:
retu
rn o
n ca
pita
l em
ploy
ed; R
ONW
: ret
urn
on n
et
wor
th; n
a: n
ot a
vaila
ble;
NA:
not
app
licab
le; N
L: n
ot li
sted
on
the
bour
ses;
NR:
not
rank
ed la
st y
ear;
All t
he la
test
dat
a fo
r FY
201
5 un
less
oth
erw
ise in
dica
ted;
^^
12 m
onth
s en
ding
Mar
ch 2
014;
@ 12
mon
ths
endi
ng D
ecem
ber
2014
; **
12m
onth
sen
ding
Sept
embe
r20
14;#
#12
mon
ths
endi
ngJu
ne20
14;*
12m
onth
sen
ding
June
2015
;^15
mon
ths
endi
ngM
arch
2015
;#18
mon
ths
endi
ngDe
cem
ber
2014
;***
9m
onth
sen
ding
Mar
ch20
15;@
@15
mon
ths
end-
ing
Mar
ch20
14;@
@@
18m
onth
sen
ding
Mar
ch20
15;^
^^6
mon
ths
endi
ngM
arch
2015
;##
#9
mon
ths
endi
ngSe
ptem
ber
2014
;*@
15m
onth
sen
ding
June
2014
;#@
#18
mon
ths
endi
ngSe
ptem
ber
2013
;#^#
12m
onth
sen
ding
Mar
ch20
13;+
10m
onth
sen
ding
Mar
ch20
14;
BFSI B
anki
ng, f
inan
cial
ser
vice
s an
d in
sura
nce
com
pani
es h
ave
a di
ffere
nt w
ay o
f ear
ning
and
pre
sent
ing
finan
cial
dat
a, s
o th
eir
inco
me,
pro
fit a
nd a
sset
num
bers
hav
e no
t be
en ra
nked
. Th
e BT
500
com
pani
es o
ver
the
past
20
year
s at
: ww
w.b
usin
esst
oday
.in/b
t500
So
urce
: CM
IE P
row
ess
November 8 2015 BUSINESS TODAY 121
2014/15
NET PROFIT ( cr)2014/15 2013/14 Rank 2015
PROFIT AS % OFTOTAL INCOME
RONW (%) ROCE (%) TOTAL INCOME ( cr)2014/15 2013/14 Rank 2015
TOTAL ASSETS ( cr)2014/15 2013/14 Rank 2015
RANK
451-500
4,153 3,321 218 56 119 832 (6) 10 792 (10.41) (0.20) (0.17)
4,443 4,857 205 5,812 6,398 114 242 275 164 4.16 13.70 8.91
765 644 578 537 488 597 21 0.31 588 3.92 9.95 4.04
1,149 1,015 463 967 881 468 25 37 558 2.56 3.95 2.84
2,576 2,409 306 760 421 524 233 78 167 30.70 18.96 12.76
7,956 7,364 123 5,639 5,559 120 62 61 379 1.11 4.41 1.38
7,330 6,718 132 2,023 1,256 298 717 459 73 35.42 30.55 16.94
629 611 621 597 536 580 17 15 612 2.86 5.25 5.25
1,081 1,052 490 206 183 753 32 63 507 15.75 3.86 3.35
557 576 654 416 434 656 30 53 526 7.21 6.76 5.72
750 672 583 1,209 978 420 37 17 484 3.05 12.75 12.28
8,829 8,467 115 3,573 2,921 190 (79) (410) 830 (2.20) (2.90) (1.02)
174 128 817 170 125 774 26 14 552 15.10 51.95 48.10
983 1,667 514 1,718 2,127 333 130 158 246 7.57 14.70 14.70
547 577 657 700 671 543 35 22 493 4.98 11.63 8.84
97,848 94,624 NA 9,035 8,452 NA 121 277 NA 1.34 2.87 1.73
803 844 564 2,064 1,815 294 104 47 282 5.03 43.25 20.99
2,139 2,153 334 1,854 1,666 316 (228) (188) 851 (12.31) (49.38) (13.86)
954 881 522 735 693 529 104 107 283 14.12 16.19 13.81
807 527 563 215 159 747 58 44 395 26.87 11.03 9.34
1,795 1,617 376 2,700 2,071 237 190 147 191 7.03 22.47 15.64
1,419 1,013 421 798 471 513 75 8 343 9.37 20.36 7.63
443 362 706 410 386 658 49 46 432 11.93 20.82 16.90
1,464 1,449 413 2,953 2,854 220 147 157 224 4.99 17.12 17.12
3,466 3,590 254 4,216 6,514 162 75 245 344 1.77 4.20 3.34
1,082 832 489 877 763 488 141 111 237 16.06 20.93 18.99
24,705 20,653 NA 2,516 2,217 NA 132 60 NA 5.26 10.78 7.85
4,364 4,100 210 1,260 976 409 85 106 308 6.77 4.66 2.55
807 626 562 102 172 804 75 138 342 73.35 13.79 11.91
3,567 2,955 246 1,008 919 458 70 90 355 6.94 5.41 3.00
63 70 857 95 80 808 1 1 744 1.09 2.83 2.14
2,967 2,921 283 2,446 1,625 253 60 (41) 388 2.43 7.09 2.75
1,064 882 495 1,461 1,167 376 89 27 307 6.10 33.82 13.21
1,977 1,973 356 1,715 1,850 335 4 48 709 0.23 0.50 0.39
279 118 777 222 196 742 59 43 391 26.49 33.90 33.70
658 466 609 209 157 750 25 22 559 11.87 7.74 5.65
1,054 1,043 500 1,003 1,429 460 22 (76) 584 2.17 10.14 4.72
967 850 518 1,175 1,050 423 78 62 334 6.60 27.98 11.34
576 478 647 508 382 611 118 54 259 23.30 34.99 34.42
1,005 947 512 455 264 636 24 21 570 5.19 3.78 2.71
3,574 3,432 245 4,600 5,330 151 139 15 239 3.03 13.48 5.33
479 412 695 581 536 585 45 48 442 7.68 20.78 12.31
4,738 3,351 195 3,834 3,926 183 118 197 260 3.07 9.88 3.45
630 610 620 473 443 630 9 3 671 1.99 3.00 3.00
2,410 2,604 315 247 208 727 33 32 505 13.16 14.61 3.58
3,100 3,218 270 1,602 1,885 352 82 171 318 5.13 4.71 4.03
619 604 626 336 320 683 60 54 385 17.85 17.67 14.04
295 280 773 190 201 761 15 34 628 8.15 11.57 8.11
1,650 1,892 392 2,091 2,410 289 (400) (265) 864 (19.13) 0.00 (60.63)
629 610 622 305 272 703 26 35 553 8.37 6.66 5.16

BT
“Rank 2014” is as published in last year’s BT500; Parameter ranks are for within the top 1,000 companies; Ranks have been assigned based on multiple decimals; Be-cause of rounding off, some ranks may appear incorrect; Results are audited and standalone; Overall ranks are based on average market capitalisation (April 1, 2015 to September 30, 2015); Figures in brackets denote negative value; ROCE: return on capital employed; na: not available; NA: not applicable; NL: not listed on the bourses; NR: not ranked last year; All the latest data for FY 2015 unless otherwise indicated; ^^ 12 months ending March 2014; @ 12 months ending December 2014; ** 12 months ending September 2014; ## 12 months ending June 2014; * 12 months ending June 2015; ^ 15 months ending March 2015; # 18 months ending December 2014; *** 9months ending March 2015; @@ 15 months ending March 2014; @@@ 18 months ending March 2015; ^^^ 6 months ending March 2015; ### 9 months ending September2014; *@ 15 months ending June 2014; #@# 18 months ending September 2013; #^# 12 months ending March 2013; + 10 months ending March 2014; BFSI Banking, finan-cial services and insurance companies have a different way of earning and presenting financial data, so their income, profit and asset numbers have not been ranked. The BT500 companies over the past 20 years at: www.businesstoday.in/bt500 Source: CMIE Prowess
COMPANY
AVERAGE MARKETCAPITALISATION ( cr)
Apr-Sept Apr-Sept Growth2015 2014 %
TOTALASSETS ( cr)
2014/15 Rank2015
TOTAL INCOME( cr)
2014/15 Rank2015
NET PROFIT( cr)
2014/15 Rank2015
ROCE(%)
2014/15
INDIA’S MOST VALUABLE COMPANIES/ THE NEXT 500 OVERALLRANKS
Rise FallRA
NK 2
015
RANK
201
4
501 401 DB Realty 1,514 1,946 (22.2) 3,901 230 39 837 (29) 813 (0.80)
502 479 Wonderla Holidays 1,508 1,361 10.8 399 726 193 758 51 414 18.64
503 NR Visagar Polytex ## 1,495 248 503.9 56 858 71 824 1 745 3.06
504 570 Global Offshore Services 1,495 973 53.6 708 595 99 805 21 589 3.05
505 488 Lycos Internet 1,490 1,320 12.9 963 520 503 613 2 728 0.21
506 552 Accelya Kale Solutions * 1,487 1,034 43.8 302 769 298 705 77 336 88.39
507 556 Dishman Pharmaceuticals & Chemicals 1,486 1,021 45.4 1,698 386 550 592 58 392 4.20
508 576 Somany Ceramics 1,485 948 56.7 829 555 1,617 350 44 444 11.15
509 536 Kolte Patil Developers 1,481 1,100 34.6 1,558 406 211 749 44 446 4.34
510 481 Agro Tech Foods 1,480 1,356 9.1 435 708 760 523 37 482 11.72
511 610 Wheels India 1,478 856 72.8 1,245 446 2,144 284 30 529 4.06
512 741 KNR Constructions 1,477 546 170.7 1,011 510 889 483 73 347 11.54
513 370 Orissa Minerals Development Co. 1,474 2,214 (33.4) 928 527 75 819 18 607 2.15
514 527 Praj Industries 1,472 1,130 30.2 1,148 464 849 499 69 359 11.42
515 723 JMT Auto ^^ 1,465 574 155.1 544 661 329 687 7 686 2.27
516 559 Apar Industries 1,463 1,011 44.7 2,871 290 5,516 126 49 426 3.90
517 826 Take Solutions 1,452 426 241.2 325 753 39 838 11 655 3.56
518 491 Vesuvius India @ 1,438 1,314 9.4 764 579 722 533 59 390 14.15
519 460 Future Lifestyle Fashions 1,429 1,480 (3.4) 3,952 228 3,332 197 19 600 0.65
520 466 Bombay Dyeing & Mfg. Co. 1,428 1,458 (2.0) 4,148 219 2,567 245 (327) 859 (15.99)
521 453 Asian Star Co. 1,411 1,560 (9.5) 1,661 391 2,289 268 42 457 3.19
522 731 Sanghvi Movers 1,404 561 150.2 1,140 469 316 693 8 679 0.77
523 383 Tata Teleservices (Maharashtra) 1,387 2,113 (34.4) 6,169 153 2,946 221 (615) 871 (14.39)
524 404 Nava Bharat Ventures 1,384 1,929 (28.3) 2,941 286 1,235 413 142 231 5.33
525 424 India Power Corpn. 1,370 1,792 (23.6) 1,884 365 629 565 24 566 1.63
526 480 Swan Energy 1,368 1,358 0.7 1,123 476 312 694 5 703 0.79
527 510 Merck @ 1,357 1,204 12.7 1,217 452 918 478 43 448 8.02
528 578 Tide Water Oil Co. (India) 1,348 943 42.9 718 591 1,372 391 171 205 37.95
529 502 BS 1,343 1,265 6.2 2,001 350 1,936 309 69 358 6.23
530 469 Rain Industries @ 1,342 1,447 (7.3) 730 588 69 825 25 565 4.26
531 599 Kwality 1,337 886 51.0 1,855 369 5,281 129 141 236 8.87
532 462 Hawkins Cookers 1,335 1,474 (9.4) 185 809 544 594 32 510 40.63
533 434 National Fertilizers 1,334 1,713 (22.1) 13,763 81 8,909 80 (160) 844 (1.28)
534 361 GVK Power & Infrastructure 1,329 2,332 (43.0) 3,139 268 44 835 (130) 842 (4.23)
535 170 Bhushan Steel 1,324 7,549 (82.5) 52,938 25 11,749 60 (1,254) 880 (2.73)
536 NL Intellect Design Arena 1,316 na NA 704 597 475 629 (71) 829 (27.29)
537 581 Claris Lifesciences ^ 1,315 941 39.8 1,275 443 810 510 139 242 13.11
538 638 Prime Focus *@ 1,312 780 68.1 953 523 525 604 64 378 7.71
539 463 VIP Industries 1,309 1,469 (10.9) 500 678 1,074 447 48 435 14.91
540 516 Goodyear India @ 1,303 1,183 10.2 1,128 472 1,745 329 101 286 22.13
541 603 SpiceJet ^^ 1,300 867 50.0 2,944 285 6,437 103 (1,003) 877 (85.61)
542 NR Shreyas Shipping & Logistics 1,282 85 1,400.8 318 759 311 697 53 404 21.20
543 478 Ruchi Soya Industries 1,271 1,372 (7.3) 14,017 78 28,564 31 29 532 0.52
544 565 Jindal Poly Films 1,261 996 26.7 2,999 278 2,774 232 153 214 8.26
545 595 TV Today Network 1,259 900 39.9 818 557 501 617 81 323 19.00
546 393 Maharashtra Seamless 1,249 2,001 (37.6) 3,114 269 1,539 363 123 254 5.34
547 468 Gujarat Alkalies & Chemicals 1,244 1,450 (14.2) 3,024 275 2,223 276 228 172 10.17
548 498 VST Tillers Tractors ^^ 1,244 1,280 (2.9) 472 699 634 563 83 316 29.88
549 501 Gujarat Industries Power Co. 1,227 1,269 (3.3) 3,023 276 1,259 410 126 250 5.14
550 819 HBL Power Systems 1,224 437 180.2 1,611 400 1,451 378 15 634 1.13

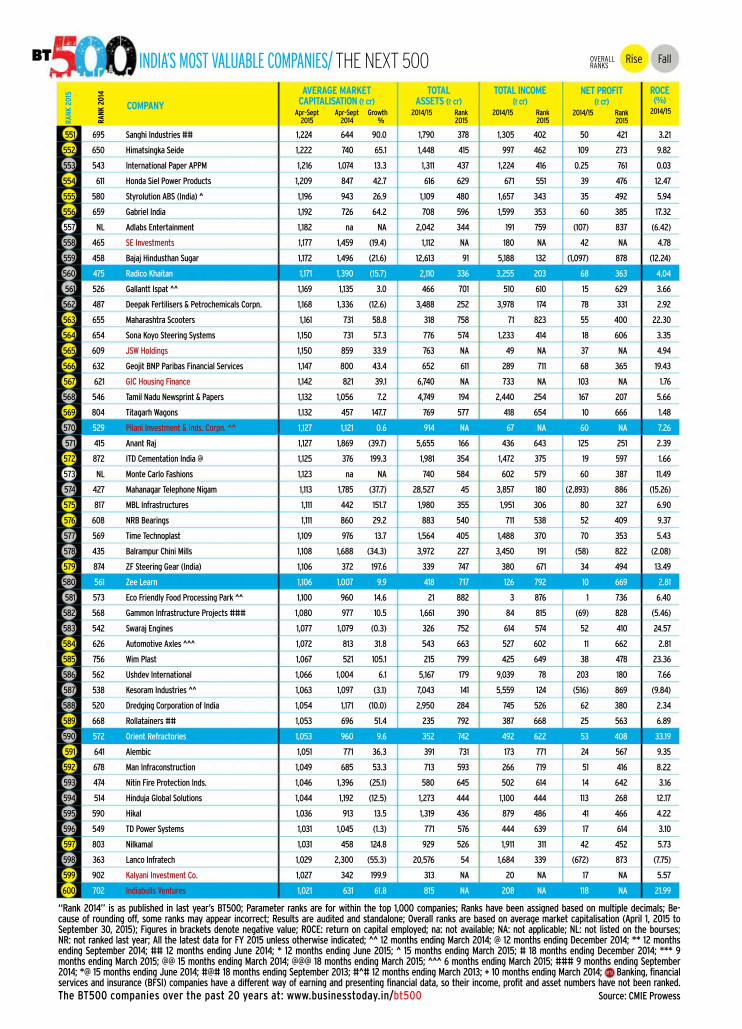
BT
“Rank 2014” is as published in last year’s BT500; Parameter ranks are for within the top 1,000 companies; Ranks have been assigned based on multiple decimals; Be-cause of rounding off, some ranks may appear incorrect; Results are audited and standalone; Overall ranks are based on average market capitalisation (April 1, 2015 to September 30, 2015); Figures in brackets denote negative value; ROCE: return on capital employed; na: not available; NA: not applicable; NL: not listed on the bourses; NR: not ranked last year; All the latest data for FY 2015 unless otherwise indicated; ^^ 12 months ending March 2014; @ 12 months ending December 2014; ** 12 months ending September 2014; ## 12 months ending June 2014; * 12 months ending June 2015; ^ 15 months ending March 2015; # 18 months ending December 2014; *** 9months ending March 2015; @@ 15 months ending March 2014; @@@ 18 months ending March 2015; ^^^ 6 months ending March 2015; ### 9 months ending September2014; *@ 15 months ending June 2014; #@# 18 months ending September 2013; #^# 12 months ending March 2013; + 10 months ending March 2014; BFSI Banking, financial services and insurance (BFSI) companies have a different way of earning and presenting financial data, so their income, profit and asset numbers have not been ranked. The BT500 companies over the past 20 years at: www.businesstoday.in/bt500 Source: CMIE Prowess
COMPANY
AVERAGE MARKETCAPITALISATION ( cr)
Apr-Sept Apr-Sept Growth2015 2014 %
TOTALASSETS ( cr)
2014/15 Rank2015
TOTAL INCOME( cr)
2014/15 Rank2015
NET PROFIT( cr)
2014/15 Rank2015
ROCE(%)
2014/15
INDIA’S MOST VALUABLE COMPANIES/ THE NEXT 500RA
NK20
15
RANK
2014
551 695 Sanghi Industries ## 1,224 644 90.0 1,790 378 1,305 402 50 421 3.21
552 650 Himatsingka Seide 1,222 740 65.1 1,448 415 997 462 109 273 9.82
553 543 International Paper APPM 1,216 1,074 13.3 1,311 437 1,224 416 0.25 761 0.03
554 611 Honda Siel Power Products 1,209 847 42.7 616 629 671 551 39 476 12.47
555 580 Styrolution ABS (India) ^ 1,196 943 26.9 1,109 480 1,657 343 35 492 5.94
556 659 Gabriel India 1,192 726 64.2 708 596 1,599 353 60 385 17.32
557 NL Adlabs Entertainment 1,182 na NA 2,042 344 191 759 (107) 837 (6.42)
558 465 SE Investments 1,177 1,459 (19.4) 1,112 NA 180 NA 42 NA 4.78
559 458 Bajaj Hindusthan Sugar 1,172 1,496 (21.6) 12,613 91 5,188 132 (1,097) 878 (12.24)
560 475 Radico Khaitan 1,171 1,390 (15.7) 2,110 336 3,255 203 68 363 4.04
561 526 Gallantt Ispat ^^ 1,169 1,135 3.0 466 701 510 610 15 629 3.66
562 487 Deepak Fertilisers & Petrochemicals Corpn. 1,168 1,336 (12.6) 3,488 252 3,978 174 78 331 2.92
563 655 Maharashtra Scooters 1,161 731 58.8 318 758 71 823 55 400 22.30
564 654 Sona Koyo Steering Systems 1,150 731 57.3 776 574 1,233 414 18 606 3.35
565 609 JSW Holdings 1,150 859 33.9 763 NA 49 NA 37 NA 4.94
566 632 Geojit BNP Paribas Financial Services 1,147 800 43.4 652 611 289 711 68 365 19.43
567 621 GIC Housing Finance 1,142 821 39.1 6,740 NA 733 NA 103 NA 1.76
568 546 Tamil Nadu Newsprint & Papers 1,132 1,056 7.2 4,749 194 2,440 254 167 207 5.66
569 804 Titagarh Wagons 1,132 457 147.7 769 577 418 654 10 666 1.48
570 529 Pilani Investment & Inds. Corpn. ^^ 1,127 1,121 0.6 914 NA 67 NA 60 NA 7.26
571 415 Anant Raj 1,127 1,869 (39.7) 5,655 166 436 643 125 251 2.39
572 872 ITD Cementation India @ 1,125 376 199.3 1,981 354 1,472 375 19 597 1.66
573 NL Monte Carlo Fashions 1,123 na NA 740 584 602 579 60 387 11.49
574 427 Mahanagar Telephone Nigam 1,113 1,785 (37.7) 28,527 45 3,857 180 (2,893) 886 (15.26)
575 817 MBL Infrastructures 1,111 442 151.7 1,980 355 1,951 306 80 327 6.90
576 608 NRB Bearings 1,111 860 29.2 883 540 711 538 52 409 9.37
577 569 Time Technoplast 1,109 976 13.7 1,564 405 1,488 370 70 353 5.43
578 435 Balrampur Chini Mills 1,108 1,688 (34.3) 3,972 227 3,450 191 (58) 822 (2.08)
579 874 ZF Steering Gear (India) 1,106 372 197.6 339 747 380 671 34 494 13.49
580 561 Zee Learn 1,106 1,007 9.9 418 717 126 792 10 669 2.81
581 573 Eco Friendly Food Processing Park ^^ 1,100 960 14.6 21 882 3 876 1 736 6.40
582 568 Gammon Infrastructure Projects ### 1,080 977 10.5 1,661 390 84 815 (69) 828 (5.46)
583 542 Swaraj Engines 1,077 1,079 (0.3) 326 752 614 574 52 410 24.57
584 626 Automotive Axles ^^^ 1,072 813 31.8 543 663 527 602 11 662 2.81
585 756 Wim Plast 1,067 521 105.1 215 799 425 649 38 478 23.36
586 562 Ushdev International 1,066 1,004 6.1 5,167 179 9,039 78 203 180 7.66
587 538 Kesoram Industries ^^ 1,063 1,097 (3.1) 7,043 141 5,559 124 (516) 869 (9.84)
588 520 Dredging Corporation of India 1,054 1,171 (10.0) 2,950 284 745 526 62 380 2.34
589 668 Rollatainers ## 1,053 696 51.4 235 792 387 668 25 563 6.89
590 572 Orient Refractories 1,053 960 9.6 352 742 492 622 53 408 33.19
591 641 Alembic 1,051 771 36.3 391 731 173 771 24 567 9.35
592 678 Man Infraconstruction 1,049 685 53.3 713 593 266 719 51 416 8.22
593 474 Nitin Fire Protection Inds. 1,046 1,396 (25.1) 580 645 502 614 14 642 3.16
594 514 Hinduja Global Solutions 1,044 1,192 (12.5) 1,273 444 1,100 444 113 268 12.17
595 590 Hikal 1,036 913 13.5 1,319 436 879 486 41 466 4.22
596 549 TD Power Systems 1,031 1,045 (1.3) 771 576 444 639 17 614 3.10
597 803 Nilkamal 1,031 458 124.8 929 526 1,911 311 42 452 5.73
598 363 Lanco Infratech 1,029 2,300 (55.3) 20,576 54 1,684 339 (672) 873 (7.75)
599 902 Kalyani Investment Co. 1,027 342 199.9 313 NA 20 NA 17 NA 5.57
600 702 Indiabulls Ventures 1,021 631 61.8 815 NA 208 NA 118 NA 21.99
OVERALLRANKS
Rise Fall


BT
“Rank 2014” is as published in last year’s BT500; Parameter ranks are for within the top 1,000 companies; Ranks have been assigned based on multiple decimals; Be-cause of rounding off, some ranks may appear incorrect; Results are audited and standalone; Overall ranks are based on average market capitalisation (April 1, 2015 to September 30, 2015); Figures in brackets denote negative value; ROCE: return on capital employed; na: not available; NA: not applicable; NL: not listed on the bourses; NR: not ranked last year; All the latest data for FY 2015 unless otherwise indicated; ^^ 12 months ending March 2014; @ 12 months ending December 2014; ** 12 months ending September 2014; ## 12 months ending June 2014; * 12 months ending June 2015; ^ 15 months ending March 2015; # 18 months ending December 2014; *** 9months ending March 2015; @@ 15 months ending March 2014; @@@ 18 months ending March 2015; ^^^ 6 months ending March 2015; ### 9 months ending September2014; *@ 15 months ending June 2014; #@# 18 months ending September 2013; #^# 12 months ending March 2013; + 10 months ending March 2014; BFSI Banking, financial services and insurance (BFSI) companies have a different way of earning and presenting financial data, so their income, profit and asset numbers have not been ranked. The BT500 companies over the past 20 years at: www.businesstoday.in/bt500 Source: CMIE Prowess
COMPANY
AVERAGE MARKETCAPITALISATION ( cr)
Apr-Sept Apr-Sept Growth2015 2014 %
TOTALASSETS ( cr)
2014/15 Rank2015
TOTAL INCOME( cr)
2014/15 Rank2015
NET PROFIT( cr)
2014/15 Rank2015
ROCE(%)
2014/15
INDIA’S MOST VALUABLE COMPANIES/ THE NEXT 500RA
NK20
15
RANK
2014
601 760 Navin Fluorine International 1,019 518 96.7 1,045 503 611 576 49 424 8.13
602 305 PSIT Infrastructure & Services #^# 1,018 3,052 (66.6) 171 818 143 785 0.04 771 0.14
603 685 APL Apollo Tubes 1,018 661 54.0 847 550 2,230 275 31 516 4.43
604 719 Atul Auto 1,011 585 72.7 178 815 546 593 41 464 37.65
605 814 Empire Industries 1,001 444 125.2 430 710 370 675 34 497 15.16
606 442 Jai Corp 1,000 1,645 (39.2) 2,089 337 749 525 58 393 2.82
607 786 Siyaram Silk Mills 998 481 107.6 982 515 1,527 367 79 330 11.01
608 602 Uflex 993 869 14.2 3,310 265 3,723 186 142 233 5.64
609 467 Gujarat Narmada Valley Fertilizers & Chem 992 1,453 (31.7) 10,094 104 4,988 137 (510) 867 (6.59)
610 738 Insecticides (India) 984 549 79.1 921 530 1,032 455 55 399 9.89
611 591 Esab India ^ 976 912 7.0 380 737 615 573 24 569 8.50
612 606 Cigniti Technologies ^^ 976 864 12.9 116 845 56 833 8 680 11.02
613 785 Kokuyo Camlin 976 483 101.9 426 712 576 587 5 702 1.74
614 845 Gayatri Projects 976 398 145.1 3,512 250 1,655 344 22 579 0.93
615 594 Astra Microwave Products 969 901 7.6 481 693 651 558 61 383 17.80
616 NR Stampede Capital ^^ 966 233 313.8 24 880 7 866 1 742 5.21
617 269 Risa International 966 3,664 (73.6) 102 848 177 768 3 715 7.82
618 624 Excel Crop Care 958 814 17.7 824 556 1,114 440 64 374 17.43
619 895 Sri Adhikari Brothers Television Network 951 348 173.0 337 749 91 811 5 704 1.74
620 NR 8K Miles Software Services 949 202 370.3 48 864 13 859 1 749 1.97
621 503 Hindusthan National Glass & Inds. ^^ 945 1,263 (25.2) 4,249 214 2,132 285 (218) 850 (6.36)
622 537 Tribhovandas Bhimji Zaveri 939 1,099 (14.5) 1,411 422 1,959 305 26 549 2.52
623 497 ABG Shipyard 939 1,285 (26.9) 12,355 93 402 662 (898) 876 (12.36)
624 863 Onmobile Global 938 383 144.7 1,103 483 435 644 9 673 1.21
625 NR Ram Minerals & Chemicals ^^ 934 121 669.5 3 889 0.09 888 0.01 773 0.31
626 531 Ballarpur Industries *** 934 1,115 (16.3) 2,973 282 488 624 9 674 0.34
627 452 Alok Industries @@@ 934 1,561 (40.2) 29,431 43 22,720 34 349 123 1.66
628 733 Elantas Beck India @ 933 561 66.5 195 806 391 667 32 515 25.92
629 398 Shree Renuka Sugars 933 1,957 (52.3) 7,542 127 5,828 113 -295 856 -5.72
630 504 State Trading Corpn. of India 933 1,259 (25.9) 5,130 181 14,776 47 26 547 1.77
631 827 Camlin Fine Sciences 929 421 120.9 349 744 445 638 26 550 11.70
632 716 GHCL 928 605 53.3 2,899 288 2,552 247 184 195 8.61
633 423 Ess Dee Aluminium 926 1,795 (48.4) 1,688 388 813 508 30 523 2.35
634 682 V-Mart Retail 925 670 38.0 346 745 724 531 37 483 16.54
635 NR Appu Marketing & Manufacturing ^^ 925 510 81.3 15 883 0.22 884 0.05 769 0.39
636 459 HCL Infosystems ## 918 1,482 (38.1) 3,638 242 5,859 112 (192) 849 (7.46)
637 862 Centum Electronics 918 385 138.1 305 765 334 684 32 511 19.62
638 515 Ojas Asset Reconstruction Co. 915 1,190 (23.1) 24 878 17 856 (0.11) 776 (0.54)
639 550 Hotel Leelaventure 910 1,042 (12.6) 6,098 154 777 519 (403) 865 (8.30)
640 NL Greenlam Industries 909 na NA 719 590 883 484 27 544 10.77
641 929 Mirza International 901 308 192.9 665 606 919 477 49 433 9.44
642 512 Bannari Amman Sugars 900 1,202 (25.1) 2,451 314 965 469 1 737 0.06
643 653 Supreme Petrochem * 899 732 22.8 882 541 2,963 219 36 490 9.24
644 NL MEP Infrastructure Developers ^^ 896 na NA 476 696 500 618 2 720 0.58
645 752 IL&FS Engg. & Construction Co. 891 525 69.8 4,040 224 2,479 251 3 716 0.13
646 714 R Systems International @ 889 607 46.4 360 739 350 680 75 341 41.14
647 802 Sunstar Realty Devp. ^^ 886 459 93.0 51 862 17 855 1 750 1.78
648 646 NIIT 885 753 17.6 1,278 442 440 642 (116) 840 (15.65)
649 558 Jindal Stainless ^^ 884 1,013 (12.7) 16,891 62 13,033 56 (1,390) 882 (11.69)
650 753 Rane Holdings 881 525 67.9 340 NA 60 NA 26 NA 9.38
OVERALLRANKS
Rise Fall


BT
“Rank 2014” is as published in last year’s BT500; Parameter ranks are for within the top 1,000 companies; Ranks have been assigned based on multiple decimals; Be-cause of rounding off, some ranks may appear incorrect; Results are audited and standalone; Overall ranks are based on average market capitalisation (April 1, 2015 to September 30, 2015); Figures in brackets denote negative value; ROCE: return on capital employed; na: not available; NA: not applicable; NL: not listed on the bourses; NR: not ranked last year; All the latest data for FY 2015 unless otherwise indicated; ^^ 12 months ending March 2014; @ 12 months ending December 2014; ** 12 months ending September 2014; ## 12 months ending June 2014; * 12 months ending June 2015; ^ 15 months ending March 2015; # 18 months ending December 2014; *** 9months ending March 2015; @@ 15 months ending March 2014; @@@ 18 months ending March 2015; ^^^ 6 months ending March 2015; ### 9 months ending September2014; *@ 15 months ending June 2014; #@# 18 months ending September 2013; #^# 12 months ending March 2013; + 10 months ending March 2014; BFSI Banking, financial services and insurance (BFSI) companies have a different way of earning and presenting financial data, so their income, profit and asset numbers have not been ranked. The BT500 companies over the past 20 years at: www.businesstoday.in/bt500 Source: CMIE Prowess
COMPANY
AVERAGE MARKETCAPITALISATION ( cr)
Apr-Sept Apr-Sept Growth2015 2014 %
TOTALASSETS ( cr)
2014/15 Rank2015
TOTAL INCOME( cr)
2014/15 Rank2015
NET PROFIT( cr)
2014/15 Rank2015
ROCE(%)
2014/15
INDIA’S MOST VALUABLE COMPANIES/ THE NEXT 500RA
NK20
15
RANK
2014
651 509 Parsvnath Developers 877 1,213 (27.7) 5,715 165 869 491 -88 834 -2.19
652 483 Punj Lloyd 875 1,351 (35.2) 13,088 88 5,689 117 (507) 866 (5.79)
653 729 Zee Media Corporation 872 563 54.7 632 619 394 666 8 681 1.85
654 NR Poddar Developers 869 101 762.4 306 764 106 801 21 587 14.58
655 539 Tata Sponge Iron 868 1,095 (20.7) 1,345 435 923 476 92 302 12.11
656 637 Mandhana Industries ^^ 866 782 10.8 1,675 389 1,535 364 59 389 4.25
657 661 Heritage Foods 864 717 20.4 529 667 2,081 291 28 537 8.39
658 555 Panacea Biotec 861 1,028 (16.2) 1,989 353 708 540 (65) 825 (5.29)
659 NR Srikalahasthi Pipes 855 170 404.0 987 513 1,135 430 82 319 11.76
660 722 KCP 854 575 48.4 1,070 493 710 539 16 621 1.95
661 656 Shanthi Gears 853 728 17.2 337 748 180 765 9 672 3.47
662 709 Hinduja Ventures 852 616 38.4 860 546 110 796 93 299 11.73
663 821 Jamna Auto Industries 852 436 95.6 476 697 1,123 436 29 530 10.68
664 664 Esteem Bio Organic Food Processing ^^ 851 711 19.6 30 873 3 873 2 726 6.92
665 607 Geometric 851 863 (1.5) 544 660 424 650 76 337 21.16
666 751 Sical Logistics 848 529 60.3 1,144 466 640 559 27 540 3.06
667 849 Vindhya Telelinks 846 396 113.4 812 560 725 530 58 394 11.28
668 778 Minda Industries 845 490 72.6 834 553 1,530 365 53 405 10.89
669 494 BGR Energy Systems 845 1,292 (34.6) 6,201 152 3,380 194 42 455 1.24
670 767 Talwalkars Better Value Fitness 841 507 65.8 586 641 218 744 39 473 8.32
671 505 Electrosteel Steels 838 1,240 (32.4) 13,391 84 2,049 295 (624) 872 (5.96)
672 669 Nucleus Software Exports 830 695 19.5 568 651 310 698 61 382 16.16
673 625 Banco Products (India) 822 814 1.0 503 676 472 631 42 456 8.99
674 658 Zuari Agro Chemicals 818 726 12.6 4,447 204 5,575 122 12 651 0.38
675 725 Elecon Engineering Co. 811 573 41.5 1,057 498 566 589 33 499 4.40
676 764 Indian Hume Pipe Co. 808 508 59.3 1,061 496 1,035 454 42 460 7.60
677 583 Savita Oil Technologies 804 931 (13.6) 1,172 455 2,069 293 -1 784 -0.20
678 677 Nectar Lifesciences 799 685 16.7 2,519 309 1,767 326 66 370 3.62
679 426 Globus Power Generation 798 1,786 (55.3) 184 810 0.26 882 (1) 781 (0.46)
680 530 Shrenuj & Co. 793 1,116 (28.9) 3,470 253 2,785 231 21 590 0.96
681 770 Ramco Industries 793 502 58.0 1,013 509 855 494 22 585 2.49
682 810 Foseco India @ 788 448 75.9 153 830 295 706 25 564 24.51
683 843 JBM Auto ^^ 782 402 94.7 584 643 651 556 25 560 7.39
684 633 SRS Real Infrastructure 781 794 (1.6) 578 646 844 500 5 700 1.18
685 715 Infinite Computer Solutions (India) 780 606 28.8 704 598 433 647 105 280 21.02
686 772 TTK Healthcare 778 500 55.7 276 780 490 623 16 627 10.79
687 939 MM Forgings 767 296 159.1 490 685 505 612 51 415 13.04
688 697 LG Balakrishnan & Bros. 767 644 19.1 799 565 1,148 427 64 375 13.98
689 921 Oricon Enterprises 766 319 140.1 604 630 89 812 7 690 1.28
690 600 Signet Industries ^^ 765 876 (12.7) 519 670 634 563 16 626 4.92
691 554 Hubtown 764 1,029 (25.8) 3,724 234 476 627 11 660 0.35
692 630 Orient Green Power Co. 762 804 (5.2) 1,489 411 63 827 (239) 852 (16.00)
693 596 Jackson Investments ^^ 762 897 (15.1) 35 868 5 867 0.20 764 0.65
694 858 Kama Holdings 757 388 95.2 474 NA 30 NA 30 NA 6.38
695 962 Kovai Medical Center & Hospital 756 277 173.3 389 734 408 659 39 475 13.19
696 NR MSR India ^^ 756 251 201.1 29 875 10 860 (0.19) 779 (0.89)
697 545 HEG 753 1,063 (29.2) 2,499 310 1,297 404 39 472 2.05
698 754 Kirloskar Ferrous Inds. 753 525 43.5 933 525 1,542 362 49 428 8.19
699 566 Gulf Oil Corpn. 750 984 (23.8) 1,171 456 152 782 31 521 6.23
700 615 Mangalore Chemicals & Fertilizers ^^ 742 838 (11.5) 2,676 299 3,327 198 71 351 3.72
OVERALLRANKS
Rise Fall


BT
“Rank 2014” is as published in last year’s BT500; Parameter ranks are for within the top 1,000 companies; Ranks have been assigned based on multiple decimals; Be-cause of rounding off, some ranks may appear incorrect; Results are audited and standalone; Overall ranks are based on average market capitalisation (April 1, 2015 toSeptember 30, 2015); Figures in brackets denote negative value; ROCE: return on capital employed; na: not available; NA: not applicable; NL: not listed on the bourses; NR: not ranked last year; All the latest data for FY 2015 unless otherwise indicated; ^^ 12 months ending March 2014; @ 12 months ending December 2014; ** 12 months ending September 2014; ## 12 months ending June 2014; * 12 months ending June 2015; ^ 15 months ending March 2015; # 18 months ending December 2014; *** 9months ending March 2015; @@ 15 months ending March 2014; @@@ 18 months ending March 2015; ^^^ 6 months ending March 2015; ### 9 months ending September2014; *@ 15 months ending June 2014; #@# 18 months ending September 2013; #^# 12 months ending March 2013; + 10 months ending March 2014; BFSI Banking, financial services and insurance (BFSI) companies have a different way of earning and presenting financial data, so their income, profit and asset numbers have not been ranked. The BT500 companies over the past 20 years at: www.businesstoday.in/bt500 Source: CMIE Prowess
COMPANY
AVERAGE MARKETCAPITALISATION ( cr)
Apr-Sept Apr-Sept Growth2015 2014 %
TOTALASSETS ( cr)
2014/15 Rank2015
TOTAL INCOME( cr)
2014/15 Rank2015
NET PROFIT( cr)
2014/15 Rank2015
ROCE(%)
2014/15
INDIA’S MOST VALUABLE COMPANIES/ THE NEXT 500RA
NK20
15
RANK
2014
701 840 Lloyd Electric & Engg. 742 405 83.4 1,785 379 1,887 313 85 309 6.26
702 681 Speciality Restaurants 741 676 9.6 393 729 307 701 9 670 3.08
703 708 Arcotech ^^ 737 621 18.6 460 704 704 542 33 503 11.11
704 647 Channel Nine Entertainment #^# 727 753 (3.5) 24 879 3 874 0.12 766 0.85
705 746 Munjal Showa 724 537 34.9 616 628 1,793 321 76 339 19.59
706 NL Majesco + 721 na NA 0.01 890 na NA na NA 0.00
707 619 Rainbow Papers ^^ 714 825 (13.5) 1,822 375 685 546 24 568 1.84
708 727 Fulford (India) 712 568 25.4 268 783 237 733 2 722 1.55
709 750 New Delhi Television 710 530 33.8 710 594 435 645 (26) 809 (4.74)
710 726 Sudarshan Chemical Inds. 709 570 24.3 1,024 506 1,192 421 42 453 6.65
711 593 Arihant Multi Commercial ^^ 709 902 (21.4) 33 869 28 843 1 751 3.82
712 830 Nocil 708 418 69.2 814 558 789 517 57 396 10.42
713 742 Sutlej Textiles & Inds. 704 540 30.4 1,353 431 1,949 307 115 263 10.21
714 764 Media Matrix Worldwide ^^ 701 508 38.2 167 824 4 868 0.42 756 0.38
715 634 Deepak Nitrite 699 790 (11.5) 1,133 470 1,420 381 53 403 6.27
716 699 Voltamp Transformers 699 643 8.6 496 682 586 583 28 535 6.56
717 NR Axiscades Engineering Technologies 699 226 209.3 154 829 190 762 11 655 10.10
718 547 Peninsula Land 698 1,052 (33.6) 3,626 243 295 707 (18) 805 (0.60)
719 700 Fiem Industries ^^ 696 642 8.4 456 705 793 515 37 480 12.64
720 711 Genus Power Infrastructures 696 614 13.3 1,057 497 949 470 53 406 6.67
721 500 Financial Technologies (India) 695 1,275 (45.5) 3,435 257 1,926 310 445 103 14.61
722 660 Andrew Yule & Co. 694 719 (3.5) 548 656 419 651 13 644 6.13
723 809 SQS India BFSI 693 450 53.9 144 833 216 746 18 601 18.37
724 755 Disa India ^ 691 523 32.2 197 805 207 751 18 605 20.02
725 NR Anuh Pharma 690 206 234.6 168 820 306 702 22 580 23.53
726 684 Polyplex Corporation 681 661 3.0 792 568 1,141 428 20 593 2.57
727 564 Electrosteel Castings 681 998 (31.8) 5,486 170 2,299 266 73 348 1.67
728 551 Himadri Chemicals & Industries 679 1,036 (34.5) 2,390 318 1,570 355 (14) 799 (0.71)
729 749 Adhunik Industries 675 531 27.2 299 771 456 635 11 659 5.24
730 643 ITI 674 764 (11.8) 5,409 172 706 541 (301) 857 0.00
731 NR D-Link (India) 673 222 202.9 263 785 627 566 21 586 17.78
732 774 Sagar Cements 673 497 35.4 971 517 1,104 442 297 147 49.94
733 745 Mangalam Cement 662 538 23.0 1,349 433 1,057 449 18 604 2.05
734 694 Byke Hospitality ^^ 661 647 2.2 126 842 156 781 16 620 16.58
735 965 Amrutanjan Health Care 656 274 139.8 132 840 176 769 17 611 16.52
736 NR Shemaroo Entertainment 656 na NA 493 683 325 689 42 458 10.23
737 NR Welspun Enterprises ^^ 653 102 539.1 647 613 240 731 (58) 823 (9.74)
738 NL Modi Udyog #^# 652 na NA 0.18 NA 0.01 NA 0.01 NA 0.00
739 663 Kirloskar Pneumatic Co. 651 715 (9.0) 498 680 494 620 23 576 7.81
740 NR KEI Industries 650 212 206.9 1,366 427 2,176 279 34 495 4.44
741 812 RSWM 650 446 45.7 2,141 333 3,138 210 84 311 5.04
742 NR Sangam (India) ^^ 640 232 176.0 1,101 484 1,478 373 41 467 4.30
743 898 Setco Automotive ^^ 637 346 83.9 414 719 399 665 23 572 7.82
744 885 Walchandnagar Industries ** 637 357 78.4 1,644 393 678 550 (12) 797 (2.47)
745 869 Kridhan Infra ^^ 633 377 67.8 93 852 39 836 1 748 1.06
746 835 Orissa Sponge Iron & Steel ^^ 632 414 52.8 589 640 4 870 (41) 821 (12.63)
747 NR Aplaya Creations ^^ 631 120 427.2 22 881 0.15 886 (0.15) 777 (1.05)
748 652 Tinplate Co. Of India 631 735 (14.2) 963 519 941 474 45 443 7.05
749 NR Pokarna 630 132 377.6 262 786 199 754 16 617 7.94
750 744 EIH Associated Hotels 630 538 17.1 402 724 232 734 25 560 8.79
OVERALLRANKS
Rise Fall


BT
“Rank 2014” is as published in last year’s BT500; Parameter ranks are for within the top 1,000 companies; Ranks have been assigned based on multiple decimals; Be-cause of rounding off, some ranks may appear incorrect; Results are audited and standalone; Overall ranks are based on average market capitalisation (April 1, 2015 to September 30, 2015); Figures in brackets denote negative value; ROCE: return on capital employed; na: not available; NA: not applicable; NL: not listed on the bourses; NR: not ranked last year; All the latest data for FY 2015 unless otherwise indicated; ^^ 12 months ending March 2014; @ 12 months ending December 2014; ** 12 months ending September 2014; ## 12 months ending June 2014; * 12 months ending June 2015; ^ 15 months ending March 2015; # 18 months ending December 2014; *** 9months ending March 2015; @@ 15 months ending March 2014; @@@ 18 months ending March 2015; ^^^ 6 months ending March 2015; ### 9 months ending September2014; *@ 15 months ending June 2014; #@# 18 months ending September 2013; #^# 12 months ending March 2013; + 10 months ending March 2014; BFSI Banking, financial services and insurance (BFSI) companies have a different way of earning and presenting financial data, so their income, profit and asset numbers have not been ranked. The BT500 companies over the past 20 years at: www.businesstoday.in/bt500 Source: CMIE Prowess
COMPANY
AVERAGE MARKETCAPITALISATION ( cr)
Apr-Sept Apr-Sept Growth2015 2014 %
TOTALASSETS ( cr)
2014/15 Rank2015
TOTAL INCOME( cr)
2014/15 Rank2015
NET PROFIT( cr)
2014/15 Rank2015
ROCE(%)
2014/15
INDIA’S MOST VALUABLE COMPANIES/ THE NEXT 500RA
NK20
15
RANK
2014
751 644 Maa Jagdambe Tradelinks ^^ 628 763 (17.7) 10 886 28 844 1 754 34.30
752 967 Atlas Jewellery India ^^ 628 273 130.1 75 855 73 821 2 729 4.32
753 597 HPC Biosciences ^^ 627 895 (30.0) 29 874 4 872 1 740 4.39
754 974 Rico Auto Industries 627 268 134.0 879 542 1,432 379 172 204 28.09
755 NR Shivam Autotech ^^ 620 196 216.5 383 736 419 652 28 534 10.45
756 801 Pennar Industries ^^ 620 459 35.0 694 602 897 481 13 649 3.10
757 662 Centrum Capital ## 618 717 (13.9) 503 NA 69 NA 11 NA 2.88
758 686 IL&FS Investment Managers 617 660 (6.6) 328 NA 118 NA 56 NA 51.29
759 958 Morepen Laboratories 610 279 118.3 500 679 379 672 1 755 0.14
760 773 Technocraft Industries (India) 610 499 22.1 1,027 505 808 511 70 356 9.99
761 747 Alkyl Amines Chemicals 608 533 14.1 427 711 519 608 45 440 15.13
762 813 Mastek 607 445 36.4 518 671 715 535 75 340 19.23
763 532 GCM Securities ^ 604 1,108 (45.5) 41 NA 2 NA 0.09 NA 0.26
764 758 Balmer Lawrie Invsts. 598 519 15.2 112 NA 38 NA 36 NA 45.17
765 NL Goenka Business & Finance ^^ 596 na NA 32 871 0.19 885 (0.01) 774 (0.06)
766 822 Borosil Glass Works 586 433 35.4 751 582 242 730 49 430 7.24
767 NR Zen Technologies 582 88 559.3 178 814 83 816 16 624 11.78
768 704 Gujarat Ambuja Exports 581 629 (7.7) 1,285 440 2,579 243 84 313 7.34
769 640 Patel Engineering 581 774 (25.0) 7,422 128 2,145 283 72 349 1.31
770 931 BF Investment 580 304 90.8 684 NA 21 NA 19 NA 2.78
771 721 Flexituff International ^^ 580 582 (0.4) 1,087 487 992 463 13 646 1.65
772 NR Vipul ^^ 577 187 208.9 952 524 275 716 3 712 0.58
773 541 Uttam Galva Steels 576 1,085 (46.9) 8,921 114 7,412 92 31 520 0.71
774 NR Simplex Trading & Agencies #^# 575 104 455.6 57 NA 0.04 NA (1) NA (0.83)
775 517 Usha Martin 572 1,183 (51.6) 7,883 124 4,152 164 (292) 855 (5.92)
776 816 India Motor Parts & Accessories 572 442 29.5 276 779 522 606 31 519 14.05
777 923 TIL 572 316 81.0 735 587 349 681 (29) 811 (5.38)
778 NR Orbit Exports 571 233 144.6 156 828 159 779 27 542 21.25
779 667 Zodiac Clothing Co. 571 702 (18.7) 296 772 342 682 11 661 4.71
780 855 Kirloskar Industries 569 392 45.3 776 572 67 826 45 441 6.63
781 836 Kalyani Steels 568 413 37.5 1,087 488 1,552 361 83 315 12.83
782 955 Welspun Enterprises ^^ 565 281 101.0 1,630 396 75 818 2 723 0.26
783 NR Shriram EPC 564 151 274.5 2,795 294 669 553 (253) 854 (12.40)
784 701 IVRCL 564 634 (11.0) 10,062 105 3,218 205 (672) 873 (11.64)
785 887 JMC Projects (India) 562 351 59.9 2,258 326 2,433 255 30 528 3.09
786 NL PDS Multinational Fashions 559 na NA 119 843 7 865 (2) 786 (1.64)
787 NL Ortel Communications 558 na NA 396 728 168 775 6 696 2.52
788 763 Mukand 557 512 8.8 5,918 160 3,264 201 2 731 0.05
789 NR Ravindra Energy ^^ 556 1 54,962.4 336 750 104 802 0.27 760 0.14
790 675 Dhanlaxmi Bank 556 687 (19.1) 14,355 NA 1,423 NA (241) NA (12.92)
791 631 Reliance Industrial Infrastructure 556 801 (30.6) 322 756 110 797 22 578 9.19
791 713 Som Distilleries & Breweries ^^ 556 608 (8.5) 167 823 196 756 20 592 18.69
793 NR Sharda Motor Industries 555 229 142.4 543 662 1,051 450 36 489 9.60
794 NR Intrasoft Technologies 552 69 701.5 97 850 35 839 5 701 6.19
795 734 Orient Paper & Inds. 552 559 (1.3) 1,306 438 1,889 312 (29) 812 (3.73)
796 925 Fortune Financial Services (India) 549 312 76.3 216 NA 5 NA 0.02 NA 0.01
797 718 Noida Toll Bridge Co. 549 588 (6.6) 654 610 131 790 81 324 15.58
798 780 Hercules Hoists 548 488 12.2 218 796 118 794 13 647 7.13
799 NR Virtual Global Education ^^ 546 206 164.6 55 859 9 862 0.01 767 0.20
800 968 Hindustan Composites 545 270 101.7 585 642 166 776 26 551 4.75
OVERALLRANKS
Rise Fall

BT
“Rank 2014” is as published in last year’s BT500; Parameter ranks are for within the top 1,000 companies; Ranks have been assigned based on multiple decimals; Be-cause of rounding off, some ranks may appear incorrect; Results are audited and standalone; Overall ranks are based on average market capitalisation (April 1, 2015 to September 30, 2015); Figures in brackets denote negative value; ROCE: return on capital employed; na: not available; NA: not applicable; NL: not listed on the bourses; NR: not ranked last year; All the latest data for FY 2015 unless otherwise indicated; ^^ 12 months ending March 2014; @ 12 months ending December 2014; ** 12 months ending September 2014; ## 12 months ending June 2014; * 12 months ending June 2015; ^ 15 months ending March 2015; # 18 months ending December 2014; *** 9months ending March 2015; @@ 15 months ending March 2014; @@@ 18 months ending March 2015; ^^^ 6 months ending March 2015; ### 9 months ending September2014; *@ 15 months ending June 2014; #@# 18 months ending September 2013; #^# 12 months ending March 2013; + 10 months ending March 2014; BFSI Banking, financial services and insurance (BFSI) companies have a different way of earning and presenting financial data, so their income, profit and asset numbers have not been ranked. The BT500 companies over the past 20 years at: www.businesstoday.in/bt500 Source: CMIE Prowess
COMPANY
AVERAGE MARKETCAPITALISATION ( cr)
Apr-Sept Apr-Sept Growth2015 2014 %
TOTALASSETS ( cr)
2014/15 Rank2015
TOTAL INCOME( cr)
2014/15 Rank2015
NET PROFIT( cr)
2014/15 Rank2015
ROCE(%)
2014/15
INDIA’S MOST VALUABLE COMPANIES/ THE NEXT 500RA
NK20
15
RANK
2014
801 553 Uttam Value Steels 544 1,033 (47.3) 5,124 183 5,542 125 (31) 815 (1.62)
802 NR Hester Biosciences 542 170 218.8 141 835 95 807 15 635 12.39
803 696 GTL Infrastructure 541 644 (16.0) 5,942 157 1,009 457 (515) 868 (8.99)
804 842 Indraprastha Medical Corpn. 540 403 34.2 463 703 714 536 32 506 13.12
805 897 Bhartiya International 540 347 55.7 419 715 435 646 14 637 4.36
806 NR Dwitiya Trading ^^ 538 123 339.1 7 888 2 879 (0.01) 774 (0.19)
807 954 Hi-Tech Gears ^^ 537 284 89.1 303 766 402 661 16 619 8.58
808 833 Surya Roshni 536 414 29.4 2,086 339 3,075 215 54 401 3.37
809 706 Ashapura Minechem ^^ 534 623 (14.3) 715 592 742 527 141 234 302.31
810 999 Oriental Carbon & Chemicals 533 254 110.0 391 730 308 699 51 412 15.99
811 548 Metalyst Forgings ** 533 1,050 (49.3) 4,214 215 2,417 257 193 189 5.71
812 506 Skil Infrastructure ^^ 533 1,232 (56.7) 6,931 143 378 673 (172) 847 (2.84)
813 601 Jayaswal Neco Industries 530 888 (40.3) 7,227 137 3,341 196 2 724 0.03
814 NR Ambika Cotton Mills 530 233 127.5 463 702 520 607 51 413 14.14
815 NR Apcotex Industries 529 215 146.6 181 812 400 664 25 562 18.69
816 680 Spice Mobility *** 529 680 (22.3) 276 781 23 851 (335) 860 (77.02)
817 995 Garware-Wall Ropes 527 255 106.8 700 600 792 516 43 449 12.37
818 728 Capri Global Capital 525 565 (7.0) 1,446 NA 195 NA 85 NA 8.23
819 710 Triveni Engineering & Inds. 523 615 (15.0) 3,140 267 2,147 282 (164) 846 (8.09)
820 NR Mahanivesh (India) ^^ 517 99 423.3 25 NA 0.08 NA 0.004 NA 0.00
821 735 Sandur Manganese & Iron Ores 513 554 (7.4) 503 677 324 690 14 636 3.76
822 941 WPIL 513 292 75.6 314 760 248 726 17 615 7.85
823 NR Arrow Coated Products ^^ 512 132 288.9 26 877 19 852 4 706 23.35
824 865 PNB Gilts 512 382 34.2 4,760 NA 410 NA 88 NA 1.96
825 914 Everest Industries 509 325 56.8 1,039 504 1,311 400 34 496 5.91
826 793 Aditya Birla Chemicals (India) 508 474 7.2 1,847 373 1,271 406 37 481 2.56
827 717 AVT Natural Products 506 597 (15.2) 238 791 260 724 30 524 16.40
828 947 SMS Pharmaceuticals 505 289 75.1 548 655 617 570 35 491 8.69
829 951 DFM Foods 505 287 76.0 152 832 291 709 11 658 11.95
830 687 Sreeleathers ^^ 503 660 (23.8) 208 800 58 829 7 685 3.73
831 NR Arshiya 501 223 124.9 2,402 316 57 831 (244) 853 (12.30)
832 899 HIL 500 346 44.7 874 543 1,263 408 67 367 13.33
833 852 Man Industries (India) ^^ 500 394 26.7 1,578 403 1,047 453 10 664 0.87
834 740 Sasken Communication Technologies 500 547 (8.7) 545 659 639 560 159 210 39.55
835 818 Pearl Global Industries 498 440 13.3 567 652 652 555 10 663 2.53
836 NR Repro India 494 222 122.1 485 691 408 660 20 595 4.83
837 806 JK Paper 493 454 8.6 3,647 241 2,492 249 (24) 808 (0.85)
838 823 Balaji Telefilms 491 429 14.4 487 688 223 741 12 652 2.87
839 651 Hindustan Oil Exploration Co. 490 735 (33.3) 490 684 58 830 (1,221) 879 (139.77)
840 864 Swelect Energy Systems 487 383 27.2 810 561 74 820 1 737 0.18
841 782 Orchid Chemicals & Pharmaceuticals #@# 478 486 (1.7) 4,723 199 2,069 292 (530) 870 (13.59)
842 950 Tourism Finance Corpn. of India 477 288 65.9 1,511 NA 188 NA 60 NA 4.40
843 892 Steel Strips Wheels 477 350 36.1 1,204 454 1,299 403 39 470 4.05
844 NR Indosolar ^^ 475 168 182.1 1,236 449 18 854 (137) 843 (13.53)
845 712 Lovable Lingerie 475 610 (22.1) 229 795 179 767 20 596 9.99
846 639 Opto Circuits (India) ^^ 474 776 (38.9) 2,524 308 263 722 42 454 1.82
847 952 Prozone Intu Properties 474 287 65.4 430 709 15 857 3 718 0.60
848 911 Meghmani Organics 473 330 43.5 1,159 460 1,048 452 26 546 2.72
849 NR Saregama India 473 192 146.4 301 770 230 735 16 625 10.03
850 991 Madhucon Projects 472 256 84.2 3,382 261 1,165 424 49 425 3.69
OVERALLRANKS
Rise Fall

BT
“Rank 2014” is as published in last year’s BT500; Parameter ranks are for within the top 1,000 companies; Ranks have been assigned based on multiple decimals; Be-cause of rounding off, some ranks may appear incorrect; Results are audited and standalone; Overall ranks are based on average market capitalisation (April 1, 2015 to September 30, 2015); Figures in brackets denote negative value; ROCE: return on capital employed; na: not available; NA: not applicable; NL: not listed on the bourses; NR: not ranked last year; All the latest data for FY 2015 unless otherwise indicated; ^^ 12 months ending March 2014; @ 12 months ending December 2014; ** 12 months ending September 2014; ## 12 months ending June 2014; * 12 months ending June 2015; ^ 15 months ending March 2015; # 18 months ending December 2014; *** 9months ending March 2015; @@ 15 months ending March 2014; @@@ 18 months ending March 2015; ^^^ 6 months ending March 2015; ### 9 months ending September2014; *@ 15 months ending June 2014; #@# 18 months ending September 2013; #^# 12 months ending March 2013; + 10 months ending March 2014; BFSI Banking, financial services and insurance (BFSI) companies have a different way of earning and presenting financial data, so their income, profit and asset numbers have not been ranked. The BT500 companies over the past 20 years at: www.businesstoday.in/bt500 Source: CMIE Prowess
COMPANY
AVERAGE MARKETCAPITALISATION ( cr)
Apr-Sept Apr-Sept Growth2015 2014 %
TOTALASSETS ( cr)
2014/15 Rank2015
TOTAL INCOME( cr)
2014/15 Rank2015
NET PROFIT( cr)
2014/15 Rank2015
ROCE(%)
2014/15
INDIA’S MOST VALUABLE COMPANIES/ THE NEXT 500RA
NK20
15
RANK
2014
851 784 Alps Motor Finance ^^ 472 484 (2.5) 14 884 2 878 0.02 772 0.24
852 618 Mercator 472 826 (42.9) 1,827 374 681 548 50 422 3.13
853 980 Ashapura Intimates Fashion 471 263 79.0 158 827 179 766 9 676 8.34
854 NR Indag Rubber 471 239 96.9 168 821 247 728 33 504 28.21
855 935 Shilpi Cable Technologies 471 302 55.7 899 535 1,412 382 31 518 7.34
856 NR Nandan Denim 470 190 147.1 896 538 1,127 435 51 411 7.36
857 NR High Ground Enterprise #^# 470 107 340.3 32 870 29 842 3 717 26.63
858 NR Indian Terrain Fashions 468 122 283.3 215 798 291 710 18 602 13.92
859 987 Ajmera Realty & Infra India ^^ 465 261 78.0 791 569 8 864 6 695 1.18
860 829 DIC India @ 465 419 11.0 505 675 811 509 (31) 814 (10.12)
861 796 Vivimed Labs ^^ 462 464 (0.4) 1,236 448 443 640 27 543 2.96
862 800 MT Educare 459 459 (0.1) 207 801 228 737 28 538 22.59
863 957 India Nippon Electricals 455 280 62.6 313 761 383 670 23 575 10.27
864 671 Jindal Drilling & Inds. ^^ 452 692 (34.7) 899 534 772 520 49 429 6.94
865 NR TCPL Packaging 449 133 236.8 400 725 525 603 32 509 12.09
866 986 Sandesh ^^ 447 261 71.2 547 658 316 692 46 438 10.40
867 518 Prakash Industries ^^ 444 1,181 (62.5) 3,463 255 2,899 223 173 202 5.81
868 912 Indo Rama Synthetics (India) 440 329 33.5 1,864 368 3,108 212 (22) 807 (2.16)
869 779 Capital Trade Links ^^ 438 490 (10.5) 7 NA 0.38 NA 0.05 NA 0.63
870 724 Taj GVK Hotels & Resorts 435 573 (24.2) 729 589 250 725 (2) 787 (0.33)
871 888 Bengal & Assam Co. 434 351 23.6 514 NA 39 NA 21 NA 4.49
872 797 RS Software (India) 434 460 (5.8) 232 793 357 679 60 384 31.89
873 582 Dhanleela Investments & Trdg. Co. ^^ 431 938 (54.0) 28 876 1 881 0.28 759 1.97
874 592 Indian Metals & Ferro Alloys 427 903 (52.7) 2,625 304 1,399 385 17 610 0.89
875 612 Sarda Energy & Minerals 426 847 (49.7) 1,783 380 1,558 358 56 398 3.52
876 788 Texmaco Infrastructure & Holdings 424 479 (11.5) 303 768 19 853 8 682 2.73
877 789 Atlanta 422 479 (11.8) 1,015 507 499 619 47 437 9.39
878 981 Subros 421 263 60.0 974 516 1,339 398 20 591 2.80
879 791 EPC Industrie 421 478 (11.9) 169 819 172 772 2 727 1.50
880 946 Phillips Carbon Black 420 289 45.3 2,174 330 2,747 233 13 647 0.76
881 799 Kothari Products 419 460 (8.9) 3,880 231 4,666 148 49 427 5.84
882 776 IFGL Refractories 417 494 (15.6) 303 767 362 678 27 541 13.09
883 382 Kailash Auto Finance ^^ 416 2,114 (80.3) 62 NA 2 NA 1 NA 1.45
884 679 Supreme Infrastructure India 416 684 (39.2) 2,992 279 1,528 366 17 609 0.82
885 670 Raj Television Network 416 693 (40.0) 200 803 93 809 8 677 5.44
886 924 LT Foods 416 312 33.4 1,429 419 1,856 315 31 522 2.58
887 575 Selan Exploration Technology 416 951 (56.3) 384 735 107 799 28 536 10.44
888 NR Elpro International ^^ 415 215 92.7 359 740 29 841 (4) 790 (1.56)
889 NR Bharat Rasayan 414 193 114.3 335 751 477 625 32 513 13.30
890 824 Essar Shipping 414 426 (2.8) 8,999 113 999 461 (83) 832 (0.98)
891 NR Sarla Performance Fibres ^^ 412 194 112.2 267 784 267 718 23 574 10.56
892 972 Neuland Laboratories 412 269 53.2 523 669 494 621 16 623 4.75
893 844 Oscar Investments ^ 411 399 2.8 1,998 NA 114 NA 32 NA 1.64
894 964 Action Construction Equipment 410 274 49.6 629 623 638 562 7 692 1.70
895 787 Pratibha Industries ^^ 409 480 (14.7) 3,319 264 1,569 356 37 487 1.83
896 NR Vadilal Industries 409 143 186.1 372 738 416 655 2 725 0.90
897 808 DCW 405 452 (10.4) 1,851 370 1,392 388 (6) 793 (0.46)
898 NR Maxwell Industries 402 136 195.2 257 789 262 723 7 689 3.68
899 676 Gitanjali Gems 400 716 (44.1) 9,433 109 7,218 96 19 598 0.24
900 837 Liberty Shoes 399 411 (2.9) 406 722 551 591 17 613 6.34
OVERALLRANKS
Rise Fall


BT
“Rank 2014” is as published in last year’s BT500; Parameter ranks are for within the top 1,000 companies; Ranks have been assigned based on multiple decimals; Be-cause of rounding off, some ranks may appear incorrect; Results are audited and standalone; Overall ranks are based on average market capitalisation (April 1, 2015 to September 30, 2015); Figures in brackets denote negative value; ROCE: return on capital employed; na: not available; NA: not applicable; NL: not listed on the bourses; NR: not ranked last year; All the latest data for FY 2015 unless otherwise indicated; ^^ 12 months ending March 2014; @ 12 months ending December 2014; ** 12 months ending September 2014; ## 12 months ending June 2014; * 12 months ending June 2015; ^ 15 months ending March 2015; # 18 months ending December 2014; *** 9months ending March 2015; @@ 15 months ending March 2014; @@@ 18 months ending March 2015; ^^^ 6 months ending March 2015; ### 9 months ending September2014; *@ 15 months ending June 2014; #@# 18 months ending September 2013; #^# 12 months ending March 2013; + 10 months ending March 2014; BFSI Banking, financial services and insurance (BFSI) companies have a different way of earning and presenting financial data, so their income, profit and asset numbers have not been ranked. The BT500 companies over the past 20 years at: www.businesstoday.in/bt500 Source: CMIE Prowess
COMPANY
AVERAGE MARKETCAPITALISATION ( cr)
Apr-Sept Apr-Sept Growth2015 2014 %
TOTALASSETS ( cr)
2014/15 Rank2015
TOTAL INCOME( cr)
2014/15 Rank2015
NET PROFIT( cr)
2014/15 Rank2015
ROCE(%)
2014/15
INDIA’S MOST VALUABLE COMPANIES/ THE NEXT 500RA
NK20
15
RANK
2014
901 880 Century Enka 396 365 8.4 1,116 478 1,378 390 37 486 4.19
902 839 Aurionpro Solutions 395 405 (2.5) 513 673 276 715 10 667 2.37
903 NR Astec Lifesciences 394 98 303.1 357 741 270 717 15 631 6.11
904 997 GMM Pfaudler ^^ 394 254 54.9 193 807 217 745 14 637 12.74
905 871 Munjal Auto Industries 392 377 3.9 421 714 973 467 38 479 13.69
906 NR Dion Global Solutions 391 207 89.1 398 727 49 834 (12) 796 (3.16)
907 856 West Coast Paper Mills 391 389 0.4 1,993 352 1,757 328 1 741 0.07
908 993 Om Metals Infraprojects 388 255 51.8 698 601 238 732 29 531 4.87
909 811 Nahar Spinning Mills 387 446 (13.4) 2,005 349 2,161 280 20 594 1.06
910 792 Venky’s (India) 386 474 (18.6) 1,433 418 1,767 325 19 599 1.76
911 NR Rossell India 385 225 71.3 292 774 144 784 4 708 1.83
912 NR Gandhi Special Tubes 384 247 55.7 175 816 107 798 16 622 9.95
913 838 Southern Petrochem Industries Corpn. 382 407 (6.0) 1,395 425 2,109 286 18 608 3.47
914 NR Nelcast 382 248 54.1 485 690 613 575 22 582 5.97
915 847 North Eastern Carrying Corpn. 381 397 (3.9) 163 825 532 600 6 697 4.02
916 944 Wendt (India) 381 290 31.4 180 813 122 793 15 630 17.19
917 NR Plastiblends India 379 224 69.4 258 788 533 599 30 525 17.39
918 970 TRF 376 269 39.4 1,164 458 587 582 (87) 833 (21.67)
919 NR Balaji Amines 375 209 79.2 603 633 661 554 36 488 7.74
920 883 Udaipur Cement Works 375 358 4.7 183 811 107 800 10 665 7.90
921 NR Grauer & Weil (India) 373 217 72.2 418 716 457 634 33 499 11.41
922 841 Syncom Formulations (India) 373 403 (7.4) 143 834 175 770 10 668 9.54
923 860 Oriental Hotels 371 387 (4.2) 898 536 312 695 (2) 788 (0.41)
924 NR SKM Egg Products Export (India) 369 43 766.5 139 836 289 712 25 556 23.31
925 NR Sunil Hitech Engineers 368 166 121.8 1,408 423 1,665 342 37 485 5.03
926 NR Kushal Tradelink 368 76 384.5 133 839 264 720 5 705 3.83
927 NR SRK Industries ^^ 367 197 85.8 44 865 24 848 1 734 3.46
928 NR Manali Petrochemicals 366 197 85.5 480 694 822 506 44 445 19.17
929 NR Vishnu Chemicals 365 114 218.6 496 681 453 637 22 583 7.34
930 NR Mapro Industries ^^ 364 94 286.6 9 887 2 877 0.05 769 1.34
931 854 Seamec 363 392 (7.4) 658 607 386 669 54 402 10.74
932 NR Saint-Gobain Sekurit India 363 199 82.8 116 844 150 783 7 692 8.46
933 762 Ganesh Housing Corpn. 363 516 (29.6) 1,105 481 187 763 32 514 3.33
934 NR Lumax Auto Technologies 362 227 59.4 280 776 590 581 32 511 20.19
935 961 McNally Bharat Engineering Co. 358 277 29.5 3,721 235 2,246 272 (114) 839 (6.92)
936 NR Ion Exchange (India) 358 220 63.2 637 618 770 521 26 548 9.58
937 832 SRS 358 416 (13.9) 1,617 398 3,855 181 39 474 3.35
937 NR Excel Industries 358 187 92.1 390 732 543 596 41 465 15.28
939 693 Shree Global Tradefin 356 648 (45.1) 488 687 294 708 0.41 757 0.10
940 960 Adi Finechem 352 277 27.2 104 846 165 778 14 640 16.91
941 NR Rai Saheb Rekhchand Mohota Spg. & Wvg. ^^ 352 62 465.5 153 830 283 713 1 734 1.21
942 820 Sunflag Iron & Steel Co. 351 437 (19.5) 1,346 434 1,965 304 (0.16) 778 (0.02)
943 894 Datamatics Global Services 350 349 0.1 512 674 197 755 25 554 5.38
944 NR Rane Engine Valve 348 163 113.5 403 723 475 628 23 571 9.96
945 915 Rane (Madras) 347 323 7.4 590 639 854 495 12 650 3.68
946 NL VB Industries ^^ 347 na NA 99 849 0.26 882 0.08 768 0.08
947 977 Omkar Speciality Chemicals 345 264 30.7 390 733 212 748 18 603 5.69
948 NR Alicon Castalloy ^^ 342 163 109.8 323 755 502 615 16 618 8.31
949 920 Lumax Industries 341 319 6.9 790 570 1,269 407 17 616 5.05
950 882 Bharat Bijlee 341 359 (5.1) 639 616 688 544 (34) 818 (8.72)
OVERALLRANKS
Rise Fall


BT
“Rank 2014” is as published in last year’s BT500; Parameter ranks are for within the top 1,000 companies; Ranks have been assigned based on multiple decimals; Be-cause of rounding off, some ranks may appear incorrect; Results are audited and standalone; Overall ranks are based on average market capitalisation (April 1, 2015 to September 30, 2015); Figures in brackets denote negative value; ROCE: return on capital employed; na: not available; NA: not applicable; NL: not listed on the bourses; NR: not ranked last year; All the latest data for FY 2015 unless otherwise indicated; ^^ 12 months ending March 2014; @ 12 months ending December 2014; ** 12 months ending September 2014; ## 12 months ending June 2014; * 12 months ending June 2015; ^ 15 months ending March 2015; # 18 months ending December 2014; *** 9months ending March 2015; @@ 15 months ending March 2014; @@@ 18 months ending March 2015; ^^^ 6 months ending March 2015; ### 9 months ending September2014; *@ 15 months ending June 2014; #@# 18 months ending September 2013; #^# 12 months ending March 2013; + 10 months ending March 2014; BFSI Banking, financial services and insurance (BFSI) companies have a different way of earning and presenting financial data, so their income, profit and asset numbers have not been ranked. The BT500 companies over the past 20 years at: www.businesstoday.in/bt500 Source: CMIE Prowess
COMPANY
AVERAGE MARKETCAPITALISATION ( cr)
Apr-Sept Apr-Sept Growth2015 2014 %
TOTALASSETS ( cr)
2014/15 Rank2015
TOTAL INCOME( cr)
2014/15 Rank2015
NET PROFIT( cr)
2014/15 Rank2015
ROCE(%)
2014/15
INDIA’S MOST VALUABLE COMPANIES/ THE NEXT 500RA
NK20
15
RANK
2014
951 783 Bodal Chemicals 339 485 (30.2) 539 664 1,133 431 92 301 21.42
952 916 National Peroxide 338 323 4.6 424 713 225 738 6 694 2.53
953 759 Ujaas Energy 338 519 (34.9) 413 720 134 788 12 654 4.06
954 NR GKW 336 247 36.2 103 847 26 846 1 743 1.17
955 971 Ador Welding 335 269 24.5 319 757 457 633 32 508 16.74
956 907 TTI Enterprise ^^ 334 338 (1.1) 26 NA 1 NA 0.03 NA 0.12
957 NR Fineotex Chemical 333 83 301.0 85 853 76 817 11 657 16.43
958 904 SRS Finance 332 341 (2.7) 208 NA 28 NA 6 NA 3.08
959 NR IOL Chemicals & Pharmaceuticals ^^ 332 163 103.4 794 567 626 567 3 711 0.58
960 876 SV Global Mill ^^ 331 368 (10.1) 37 867 0.12 887 (1) 783 (2.35)
961 NR Safari Industries (India) 330 217 52.0 130 841 221 743 4 707 4.85
962 949 Marathon Nextgen Realty 329 288 14.1 601 635 71 822 38 477 7.26
963 903 OCL Iron & Steel ^^ 326 342 (4.8) 2,477 312 620 569 2 721 0.11
964 NR Indo-National 324 177 83.0 217 797 365 677 29 533 17.35
965 867 Nalwa Sons Invsts. 324 380 (14.7) 350 NA 21 NA 6 NA 1.76
966 NR Sunshield Chemicals 323 151 114.4 133 838 128 791 (3) 789 (3.75)
967 NR Nila Infrastructures 322 128 152.3 343 746 132 789 12 653 4.80
968 NR IST 322 176 82.7 159 826 26 845 3 719 1.69
969 NR Optiemus Infracom ^^ 322 237 35.7 898 537 4,111 167 50 419 9.66
970 846 Pricol 322 397 (18.9) 572 648 1,061 448 (18) 804 (5.17)
971 985 Xchanging Solutions @ 322 261 23.0 278 778 165 777 7 684 4.17
972 938 Binny ^^ 321 298 8.0 313 762 10 861 (61) 824 (25.84)
973 857 Shree Ram Urban Infrastructure ^ 320 389 (17.7) 2,284 323 92 810 (33) 816 (3.08)
974 377 Trinity Tradelink ^^ 319 2,164 (85.3) 53 860 118 795 1 752 4.36
975 737 Manaksia 318 552 (42.5) 83 854 24 849 7 683 8.83
976 NR Transformers & Rectifiers (India) 318 232 37.0 702 599 602 578 (6) 794 (1.32)
977 703 Gujarat Natural Resources ^^ 315 629 (50.0) 96 851 4 869 1 733 1.76
978 933 Dhyana Finstock ^^ 314 303 3.8 31 NA 1 NA 0.37 NA 6.45
979 NR Kellton Tech Solutions ## 312 43 619.3 49 863 34 840 4 710 10.81
980 761 Ansal Properties & Infrastructure 312 517 (39.7) 5,514 169 853 496 22 581 0.92
980 NR Shaily Engineering Plastics 312 50 526.1 193 808 187 764 13 643 9.65
982 NR Orient Abrasives ^^ 311 247 25.8 205 802 195 757 7 686 4.05
983 NR IG Petrochemicals 311 153 103.2 604 632 1,305 401 9 675 2.13
984 875 Goodricke Group @ 310 369 (16.0) 580 644 616 571 22 577 10.31
985 NR AGC Networks 310 180 72.4 470 700 400 663 (0.38) 780 (0.16)
986 891 Grandma Trading & Agencies ^^ 309 351 (11.8) 14 885 1 880 0.15 765 1.14
987 853 Phoenix Lamps 309 393 (21.5) 260 787 264 721 27 539 13.33
988 NR Vardhman Holdings 308 210 47.0 242 NA 33 NA 30 NA 13.98
989 NR Jay Bharat Maruti 307 187 64.2 625 624 1,483 371 40 469 10.66
990 NR Bannari Amman Spg. Mills 306 202 51.0 848 549 683 547 13 645 1.84
991 NR Welspun Syntex 306 67 358.6 438 707 897 482 43 451 12.82
992 690 Global Infratech & Finance ^^ 305 655 (53.4) 72 856 15 858 2 730 3.74
993 NL Kalpa Commercial ^^ 305 na NA 52 861 9 863 0.22 762 0.42
994 NR Multibase India ^^ 304 105 190.5 43 866 61 828 5 699 16.13
995 NR Weizmann Forex 304 151 102.1 272 NA 179 NA 19 NA 9.29
996 698 RattanIndia Infrastructure ^^ 302 644 (53.1) 639 617 3 875 0.38 758 0.06
997 NR Zicom Electronic Security Systems ^^ 301 169 78.7 270 782 331 685 8 678 3.86
998 NR KSE 299 106 181.4 138 837 912 479 44 446 56.51
999 748 Butterfly Gandhimathi Appliances 299 533 (44.0) 571 649 582 584 3 714 0.69
1000 963 Shakti Pumps (India) ^^ 298 274 8.8 311 763 312 696 26 545 12.30
OVERALLRANKS
Rise Fall


BT
For the keys to symbols used, see footnotes in the main tables starting page 102; The list excludes BFSI companies; Standalone data Source: CMIE Prowess
INDIA’S MOST VALUABLE COMPANIES/ TOTAL ASSETS RANKING 2015
1 Reliance Industries 3,98,064 3,67,744 8.2 2
2 Oil & Natural Gas Corpn. 2,37,604 2,37,198 0.2 5
3 Indian Oil Corpn. 2,31,312 2,61,171 (11.4) 22
4 NTPC 2,10,832 1,92,006 9.8 21
5 Power Grid Corpn. of India 1,66,999 1,46,332 14.1 28
6 Bharti Airtel 1,43,886 1,12,035 28.4 13
7 Tata Steel 1,17,368 1,12,622 4.2 68
8 Steel Authority of India 1,01,699 93,696 8.5 86
9 Larsen & Toubro 89,597 80,964 10.7 14
10 Vedanta 81,524 86,719 (6.0) 46
11 Bharat Heavy Electricals 79,388 84,665 (6.2) 37
12 Hindalco Industries 77,851 74,139 5.0 92
13 JSW Steel 77,461 71,677 8.1 99
14 Reliance Communications 76,596 80,242 (4.5) 113
15 Bharat Petroleum Corpn. 71,407 73,728 (3.1) 34
16 Hindustan Petroleum Corpn. 68,318 78,856 (13.4) 85
17 Tata Consultancy Services 63,557 57,886 9.8 1
18 Infosys 62,451 53,211 17.4 7
19 Essar Oil 60,923 54,619 11.5 97
20 GAIL (India) 59,222 57,013 3.9 48
21 Idea Cellular 59,170 45,081 31.3 36
22 NHPC 55,498 54,037 2.7 101
23 Tata Motors 54,676 54,169 0.9 19
24 Wipro 54,088 46,280 16.9 15
25 Bhushan Steel 52,938 51,085 3.6 535
26 Reliance Infrastructure 51,710 51,018 1.4 154
27 Jaiprakash Associates ^^ 49,187 46,126 6.6 323
28 Hindustan Zinc 49,057 41,713 17.6 31
29 Jindal Steel & Power 48,358 43,564 11.0 172
30 ITC 44,717 39,710 12.6 4
31 NMDC 44,364 41,517 6.9 47
32 Maruti Suzuki India 42,685 38,616 10.5 20
33 Cairn India 42,531 44,273 (3.9) 59
34 Adani Power 40,049 40,961 (2.2) 164
35 Videocon Industries # 38,294 37,060 3.3 248
36 Oil India 37,418 36,149 3.5 71
37 Mangalore Refinery & Petrochem 36,254 39,911 (9.2) 136
38 DLF 36,020 37,657 (4.3) 98
39 UltraTech Cement 35,570 29,935 18.8 24
40 Tata Power Co. 33,963 30,915 9.9 103
41 Mahindra & Mahindra 33,308 31,641 5.3 26
42 Jaiprakash Power Ventures 32,461 29,510 10.0 425
43 Alok Industries @@@ 29,431 25,749 14.3 627
44 Unitech 28,899 27,871 3.7 384
45 Mahanagar Telephone Nigam 28,527 29,045 (1.8) 574
46 Adani Ports & Special Economic Zone 25,809 20,906 23.5 30
47 HCL Technologies ## 25,589 18,301 39.8 16
48 Bharti Infratel 23,724 23,427 1.3 25
49 Coal India 23,512 25,052 (6.1) 6
50 Neyveli Lignite Corpn. 23,133 22,115 4.6 130
TOTAL COMPANY TOTAL ASSETS OVERALLASSETS 2014/15 2013/14 Growth RANK RANKING 2015 % 2015
51 Adani Enterprises 22,768 22,690 0.3 65
52 Reliance Power 21,608 20,746 4.2 127
53 Piramal Enterprises 20,762 21,029 (1.3) 110
54 Lanco Infratech 20,576 19,266 6.8 598
55 Jaypee Infratech 20,574 20,360 1.1 433
56 Jet Airways (India) 20,379 19,515 4.4 294
57 Dr. Reddy’s Laboratories 19,178 16,768 14.4 33
58 CESC 18,922 16,334 15.8 194
59 Tata Communications 18,053 17,614 2.5 133
60 Tech Mahindra 17,908 15,577 15.0 38
61 Bharat Electronics 17,228 16,302 5.7 72
62 Jindal Stainless ^^ 16,891 17,640 (4.2) 649
63 Cipla 16,866 14,273 18.2 39
64 National Aluminium Co. 16,384 16,842 (2.7) 153
65 Housing Dev. & Infrastructure 16,292 16,081 1.3 302
66 Torrent Power 16,014 15,463 3.6 191
67 Suzlon Energy 15,810 18,657 (15.3) 148
68 Bajaj Auto 15,704 14,895 5.4 32
69 SJVN 15,549 14,355 8.3 157
70 Rajesh Exports 15,528 11,061 40.4 150
71 Aditya Birla Nuvo 15,443 14,602 5.8 88
72 JSW Energy 15,427 15,391 0.2 115
73 Shipping Corpn. of India 15,350 16,627 (7.7) 372
74 GMR Infrastructure 15,193 14,333 6.0 188
75 Grasim Industries 14,446 13,892 4.0 60
76 Sun Pharmaceutical Inds. ^^ 14,122 9,529 48.2 8
77 Ambuja Cements @ 14,041 13,101 7.2 55
78 Ruchi Soya Industries 14,017 12,438 12.7 543
79 Hindustan Unilever 13,942 13,269 5.1 11
80 Amtek Auto ** 13,859 12,190 13.7 355
81 National Fertilizers 13,763 14,069 (2.2) 533
82 Ashok Leyland 13,418 13,031 3.0 95
83 Siemens ** 13,406 12,819 4.6 45
84 Electrosteel Steels 13,391 11,401 17.5 671
85 RattanIndia Power 13,298 11,708 13.6 409
86 Tata Chemicals 13,251 13,019 1.8 145
87 IL&FS Transportation Networks 13,174 9,729 35.4 322
88 Punj Lloyd 13,088 14,045 (6.8) 652
89 ACC @ 12,920 12,352 4.6 76
90 Future Retail 12,752 11,451 11.4 272
91 Bajaj Hindusthan Sugar 12,613 13,023 (3.1) 559
92 Bosch ^ 12,379 10,795 14.7 29
93 ABG Shipyard 12,355 12,456 (0.8) 623
94 Chennai Petroleum Corpn. 11,713 13,942 (16.0) 402
95 United Spirits ^^ 11,164 13,227 (15.6) 40
96 Petronet LNG 11,125 11,914 (6.6) 124
97 Lupin 11,096 8,895 24.7 23
98 Jindal Saw 10,744 8,635 24.4 443
99 Century Textiles & Industries 10,677 9,616 11.0 209
100 Hero MotoCorp 10,539 10,113 4.2 41
TOTAL COMPANY TOTAL ASSETS OVERALLASSETS 2014/15 2013/14 Growth RANK RANKING 2015 % 2015
140 BUSINESS TODAY November 8 2015

101 Hindustan Construction Co. 10,427 9,505 9.7 447
102 Aurobindo Pharma 10,270 8,609 19.3 50
103 Pipavav Defence & Offshore Engg. 10,253 9,834 4.3 273
104 Gujarat Narmada Valley Fert. & Chem. 10,094 10,865 (7.1) 609
105 IVRCL 10,062 9,523 5.7 784
106 MRF ** 9,825 8,285 18.6 109
107 NCC 9,546 9,211 3.6 265
108 Great Eastern Shipping Co. 9,445 9,485 (0.4) 238
109 Gitanjali Gems 9,433 8,593 9.8 899
110 Sintex Industries 9,263 7,395 25.3 261
111 Prestige Estates Projects 9,203 7,188 28.0 174
112 ABB India @ 9,181 9,351 (1.8) 70
113 Essar Shipping 8,999 9,048 (0.5) 890
114 Uttam Galva Steels 8,921 8,027 11.1 773
115 Bombay Rayon Fashions 8,829 8,467 4.3 462
116 Castex Technologies ** 8,825 7,111 24.1 281
117 India Cements ^^ 8,766 8,832 (0.8) 375
118 Container Corpn. of India 8,715 8,072 8.0 62
119 Indiabulls Real Estate 8,715 7,593 14.8 381
120 Glenmark Pharmaceuticals 8,619 4,614 86.8 73
121 Coromandel International 8,386 7,117 17.8 208
122 Oracle Financial Services Software 8,227 11,675 (29.5) 63
123 Simplex Infrastructures 7,956 7,364 8.0 456
124 Usha Martin 7,883 8,128 (3.0) 775
125 UPL 7,734 7,177 7.8 96
126 Cadila Healthcare 7,726 6,501 18.8 53
127 Shree Renuka Sugars 7,542 7,000 7.7 629
128 Patel Engineering 7,422 6,922 7.2 769
129 Indian Hotels Co. 7,416 6,937 6.9 184
130 Shree Cement ## 7,347 6,168 19.1 52
131 Asian Paints 7,330 6,756 8.5 27
132 Rolta India 7,330 6,718 9.1 457
133 Vardhman Textiles 7,308 7,694 (5.0) 259
134 Chambal Fertilisers & Chemicals 7,303 7,801 (6.4) 383
135 Jain Irrigation Systems 7,242 6,978 3.8 358
136 Apollo Tyres 7,233 6,964 3.9 165
137 Jayaswal Neco Industries 7,227 6,576 9.9 813
138 Welspun Corpn. 7,205 6,210 16.0 376
139 IRB Infrastructure Developers 7,147 5,916 20.8 180
140 Ramco Cements 7,091 6,888 2.9 185
141 Kesoram Industries ^^ 7,043 7,243 (2.8) 587
142 Arvind 7,009 6,358 10.2 203
143 Skil Infrastructure ^^ 6,931 6,668 3.9 812
144 Crompton Greaves 6,893 5,734 20.2 147
145 Gujarat State Fertilizers & Chemicals 6,708 6,721 (0.2) 354
146 MMTC 6,610 5,682 16.3 260
147 Torrent Pharmaceuticals 6,564 4,386 49.7 91
148 Bharat Forge 6,412 5,733 11.9 79
149 Rashtriya Chemicals & Fertilizers 6,347 5,695 11.4 350
150 GlaxoSmithKline Pharmaceuticals ^ 6,238 6,145 1.5 67
TOTAL COMPANY TOTAL ASSETS OVERALLASSETS 2014/15 2013/14 Growth RANK RANKING 2015 % 2015

BT
For the keys to symbols used, see footnotes in the main tables starting page 102; The list excludes BFSI companies; Standalone data Source: CMIE Prowess
INDIA’S MOST VALUABLE COMPANIES/ TOTAL ASSETS RANKING 2015
201 TVS Motor Co. 4,644 3,615 28.5 143
202 Engineers India 4,607 4,586 0.5 202
203 Prism Cement 4,588 4,347 5.5 241
204 Zuari Agro Chemicals 4,447 4,393 1.2 674
205 DCM Shriram 4,443 4,857 (8.5) 452
206 EID-Parry (India) 4,421 4,322 2.3 378
207 Godrej Industries 4,391 3,703 18.6 132
208 Dabur India 4,388 3,735 17.5 44
209 BASF India 4,365 4,156 5.0 250
210 Puravankara Projects 4,364 4,100 6.4 478
211 Voltas 4,354 4,223 3.1 159
212 Sterlite Technologies 4,335 3,653 18.7 347
213 Gujarat Mineral Devp. Corpn. 4,275 4,050 5.6 352
214 Hindusthan National Glass & Inds. ^^ 4,249 4,652 (8.7) 621
215 Metalyst Forgings ** 4,214 3,556 18.5 811
216 JK Lakshmi Cement 4,198 3,605 16.5 288
217 Oberoi Realty 4,194 3,587 16.9 168
218 KSK Energy Ventures 4,153 3,321 25.0 451
219 Bombay Dyeing & Mfg. Co. 4,148 3,908 6.2 520
220 Bayer Cropscience 4,084 3,505 16.5 122
221 Gujarat Fluorochemicals 4,075 3,657 11.4 192
222 Pidilite Industries 4,062 3,524 15.3 66
223 Linde India @ 4,054 4,070 (0.4) 345
224 IL&FS Engg. & Construction Co. 4,040 3,617 11.7 645
225 TV18 Broadcast 4,015 3,862 4.0 227
226 Marico 3,976 3,734 6.5 77
227 Balrampur Chini Mills 3,972 4,228 (6.1) 578
228 Future Lifestyle Fashions 3,952 3,945 0.2 519
229 United Breweries 3,927 3,933 (0.1) 87
230 DB Realty 3,901 3,777 3.3 501
231 Kothari Products 3,880 3,185 21.8 881
232 Ipca Laboratories 3,834 3,224 18.9 176
233 Alstom India 3,805 3,765 1.1 253
234 Hubtown 3,724 3,871 (3.8) 691
235 McNally Bharat Engineering 3,721 3,245 14.7 935
236 Adani Transmission 3,711 0.05 NA 324
237 Sun TV Network 3,706 3,582 3.5 126
238 Havells India 3,697 3,433 7.7 105
239 Ceat 3,687 3,413 8.0 320
240 MOIL 3,651 3,490 4.6 291
241 JK Paper 3,647 3,736 (2.4) 837
242 HCL Infosystems ## 3,638 6,028 (39.6) 636
243 Peninsula Land 3,626 3,100 17.0 718
244 Tube Investments of India 3,595 3,395 5.9 198
245 JBF Industries 3,574 3,432 4.1 491
246 Brigade Enterprises 3,567 2,955 20.7 480
247 Network18 Media & Invst. 3,551 4,257 (16.6) 232
248 Strides Arcolab 3,531 3,663 (3.6) 199
249 Sadbhav Engineering 3,525 3,025 16.5 243
250 Gayatri Projects 3,512 3,319 5.8 614
TOTAL COMPANY TOTAL ASSETS OVERALLASSETS 2014/15 2013/14 Growth RANK RANKING 2015 % 2015
151 KEC International 6,232 6,107 2.0 338
152 BGR Energy Systems 6,201 6,343 (2.2) 669
153 Tata Teleservices (Maharashtra) 6,169 5,766 7.0 523
154 Hotel Leelaventure 6,098 6,476 (5.8) 639
155 Cummins India 6,059 5,371 12.8 78
156 Sobha 5,956 5,241 13.6 321
157 GTL Infrastructure 5,942 6,624 (10.3) 803
158 Nestle India @ 5,928 6,410 (7.5) 35
159 JK Tyre & Industries 5,921 5,168 14.6 399
160 Mukand 5,918 5,704 3.8 788
161 Titan Company 5,911 6,141 (3.7) 64
162 GlaxoSmithKline Consumer Healthcare 5,871 4,944 18.7 80
163 Godrej Consumer Products 5,862 5,249 11.7 51
164 Apollo Hospitals Enterprise 5,820 4,857 19.8 104
165 Parsvnath Developers 5,715 6,565 (13.0) 651
166 Anant Raj 5,655 5,584 1.3 571
167 Zee Entertainment Enterprises 5,649 4,770 18.4 56
168 Gujarat State Petronet 5,547 5,408 2.6 204
169 Ansal Properties & Infrastructure 5,514 5,514 (0.0) 980
170 Electrosteel Castings 5,486 5,429 1.0 727
171 Exide Industries 5,428 4,975 9.1 125
172 ITI 5,409 5,155 4.9 730
173 JK Cement 5,392 5,146 4.8 276
174 Balkrishna Industries 5,319 4,878 9.0 206
175 Jubilant Life Sciences 5,280 6,838 (22.8) 312
176 Mphasis 5,277 4,736 11.4 178
177 Alstom T&D India 5,187 5,300 (2.1) 123
178 Divis Laboratories 5,187 4,317 20.2 82
179 Ushdev International 5,167 3,122 65.5 586
180 Fortis Healthcare 5,155 5,158 (0.1) 183
181 State Trading Corpn. of India 5,130 3,790 35.4 630
182 Welspun India 5,130 4,300 19.3 211
183 Uttam Value Steels 5,124 4,263 20.2 801
184 Thermax 5,118 5,058 1.2 134
185 Birla Corporation 5,084 4,957 2.6 329
186 National Buildings Constn. Corpn. 5,056 4,396 15.0 146
187 Tata Global Beverages 4,998 4,950 1.0 177
188 Omaxe 4,961 4,826 2.8 393
189 SRF 4,882 4,478 9.0 210
190 PTC India 4,867 4,109 18.5 441
191 Kalpataru Power Transmission 4,837 4,613 4.9 308
192 BEML 4,791 4,926 (2.7) 247
193 PC Jeweller 4,773 4,290 11.3 205
194 Tamil Nadu Newsprint & Papers 4,749 3,759 26.3 568
195 Trident 4,738 3,351 41.4 493
196 Motherson Sumi Systems 4,737 4,435 6.8 49
197 Godrej Properties 4,734 4,305 10.0 236
198 Aban Offshore 4,724 3,939 19.9 446
199 Orchid Chem. & Pharma #@# 4,723 3,899 21.2 841
200 Wockhardt 4,716 3,876 21.7 108
TOTAL COMPANY TOTAL ASSETS OVERALLASSETS 2014/15 2013/14 Growth RANK RANKING 2015 % 2015
142 BUSINESS TODAY November 8 2015

251 Raymond 3,501 3,352 4.4 369
252 Deepak Fertilisers & Petro. Corpn. 3,488 3,186 9.5 562
253 Shrenuj & Co. 3,470 3,701 (6.2) 680
254 Escorts 3,466 3,590 (3.5) 475
255 Prakash Industries ^^ 3,463 3,271 5.9 867
256 Essar Ports 3,452 3,336 3.5 269
257 Financial Technologies (India) 3,435 3,186 7.8 721
258 Indraprastha Gas 3,428 3,301 3.8 220
259 Bajaj Electricals 3,414 3,210 6.4 379
260 EIH 3,386 3,430 (1.3) 222
261 Madhucon Projects 3,382 3,170 6.7 850
262 Biocon 3,349 3,228 3.8 170
263 OCL India 3,320 2,521 31.7 364
264 Pratibha Industries ^^ 3,319 2,510 32.2 895
265 Uflex 3,310 3,386 (2.2) 608
266 Dish TV India 3,158 2,774 13.8 149
267 Triveni Engineering & Inds. 3,140 3,141 (0.0) 819
268 GVK Power & Infrastructure 3,139 3,019 4.0 534
269 Maharashtra Seamless 3,114 3,167 (1.7) 546
270 Graphite India 3,100 3,218 (3.7) 496
271 Cox & Kings 3,083 2,262 36.3 262
272 Inox Wind 3,075 1,374 123.8 167
273 Redington (India) ^^ 3,045 2,842 7.1 266
274 Den Networks 3,036 3,083 (1.5) 394
275 Gujarat Alkalies & Chemicals 3,024 2,862 5.7 547
276 Gujarat Industries Power Co. 3,023 3,001 0.7 549
277 KRBL 3,000 2,688 11.6 295
278 Jindal Poly Films 2,999 2,753 8.9 544
279 Supreme Infrastructure India 2,992 2,416 23.8 884
280 McLeod Russel India 2,984 2,871 3.9 400
281 Hindustan Copper 2,977 2,979 (0.1) 235
282 Ballarpur Industries *** 2,973 2,960 0.4 626
283 Heidelberg Cement India ^ 2,967 2,921 1.6 482
284 Dredging Corpn. of India 2,950 3,266 (9.7) 588
285 SpiceJet ^^ 2,944 3,072 (4.1) 541
286 Nava Bharat Ventures 2,941 2,826 4.1 524
287 Isgec Heavy Engineering 2,924 2,600 12.5 279
288 GHCL 2,899 2,920 (0.7) 632
289 HSIL 2,898 2,867 1.1 395
290 Apar Industries 2,871 2,947 (2.6) 516
291 Hathway Cable & Datacom 2,870 2,629 9.2 296
292 Colgate-Palmolive (India) 2,849 2,419 17.8 75
293 Aarti Industries 2,819 2,565 9.9 331
294 Shriram EPC 2,795 2,545 9.8 783
295 Phoenix Mills 2,793 2,625 6.4 240
296 Mahindra CIE Automotive 2,781 1,118 148.8 187
297 Mahindra Holidays & Resorts India 2,720 2,616 4.0 396
298 Jagran Prakashan 2,695 2,272 18.6 284
299 Mangalore Chemicals & Fertilizers ^^ 2,676 2,336 14.5 700
300 Ashoka Buildcon 2,670 2,218 20.4 336
TOTAL COMPANY TOTAL ASSETS OVERALLASSETS 2014/15 2013/14 Growth RANKRANKING 2015 % 2015

BT
For the keys to symbols used, see footnotes in the main tables starting page 102; The list excludes BFSI companies; Standalone data Source: CMIE Prowess
INDIA’S MOST VALUABLE COMPANIES/ TOTAL ASSETS RANKING 2015
351 VA Tech Wabag 1,998 1,831 9.1 297
352 West Coast Paper Mills 1,993 2,164 (7.9) 907
353 Panacea Biotec 1,989 2,009 (1.0) 658
354 ITD Cementation India @ 1,981 1,640 20.8 572
355 MBL Infrastructures 1,980 1,535 29.0 575
356 Kirloskar Brothers 1,977 1,973 0.2 484
357 Kirloskar Oil Engines 1,976 1,896 4.2 290
358 Trent 1,975 1,920 2.9 287
359 Firstsource Solutions 1,963 1,769 11.0 439
360 P&G Hygi. & Health Care* 1,963 1,519 29.2 100
361 DB Corp 1,955 1,815 7.7 219
362 SKF India @ 1,935 1,717 12.7 195
363 Honeywell Automation India ^ 1,930 1,700 13.5 196
364 PI Industries 1,921 1,492 28.8 171
365 India Power Corpn. 1,884 1,719 9.6 525
366 Finolex Industries 1,865 1,941 (3.9) 328
367 Whirlpool of India 1,864 1,583 17.8 173
368 Indo Rama Synthetics (India) 1,864 2,032 (8.2) 868
369 Kwality 1,855 1,585 17.1 531
370 DCW 1,851 1,797 3.0 897
371 Akzo Nobel India 1,849 2,086 (11.4) 218
372 Clariant Chemicals (India) @ 1,849 919 101.3 419
373 Aditya Birla Chemicals (India) 1,847 1,787 3.4 826
374 Mercator 1,827 1,696 7.7 852
375 Rainbow Papers ^^ 1,822 1,399 30.2 707
376 Himachal Futuristic Communications 1,795 1,617 11.1 471
377 Shoppers Stop 1,795 1,664 7.9 337
378 Sanghi Industries ## 1,790 1,915 (6.5) 551
379 Lloyd Electric & Engg. 1,785 1,484 20.3 701
380 Sarda Energy & Minerals 1,783 1,846 (3.4) 875
381 KPR Mill 1,777 1,735 2.5 392
382 Atul 1,774 1,786 (0.7) 309
383 Alembic Pharmaceuticals 1,757 1,340 31.1 137
384 NIIT Technologies 1,757 1,456 20.7 385
385 KPIT Technologies 1,738 1,674 3.8 411
386 Dishman Pharmaceuticals & Chem 1,698 1,574 7.9 507
387 J Kumar Infraprojects 1,692 1,653 2.4 410
388 Ess Dee Aluminium 1,688 1,560 8.2 633
389 Mandhana Industries ^^ 1,675 1,524 9.9 656
390 Gammon Infra Projects ### 1,661 1,602 3.7 582
391 Asian Star Co. 1,661 1,481 12.2 521
392 Fertilisers & Chemicals, Travancore 1,650 1,892 (12.8) 499
393 Walchandnagar Industries ** 1,644 1,611 2.1 744
394 Finolex Cables 1,642 1,572 4.4 303
395 Bata India ^ 1,637 1,383 18.4 200
396 Welspun Enterprises ^^ 1,630 0.05 NA 782
397 CMC 1,625 1,512 7.5 225
398 SRS 1,617 1,570 3.0 937
399 Rallis India 1,612 1,465 10.0 275
400 HBL Power Systems 1,611 1,789 (9.9) 550
TOTAL COMPANY TOTAL ASSETS OVERALLASSETS 2014/15 2013/14 Growth RANK RANKING 2015 % 2015
301 Blue Star 2,669 2,691 (0.8) 349
302 Mindtree 2,654 2,113 25.6 142
303 Pfizer 2,644 984 168.7 158
304 Indian Metals & Ferro Alloys 2,625 2,569 2.2 874
305 HT Media 2,590 2,554 1.4 420
306 Mahindra Lifespace Developers 2,576 2,409 6.9 455
307 Orient Cement 2,574 1,570 64.0 319
308 Opto Circuits (India) ^^ 2,524 2,475 2.0 846
309 Nectar Lifesciences 2,519 2,403 4.8 678
310 HEG 2,499 2,752 (9.2) 697
311 Britannia Industries 2,488 1,881 32.3 61
312 OCL Iron & Steel ^^ 2,477 2,305 7.4 963
313 Gujarat Pipavav Port ^ 2,459 2,188 12.4 155
314 Bannari Amman Sugars 2,451 2,281 7.5 642
315 Nirlon 2,410 2,604 (7.5) 495
316 Arshiya 2,402 2,500 (3.9) 831
317 Amara Raja Batteries 2,395 1,988 20.5 118
318 Himadri Chemicals & Inds. 2,390 2,601 (8.1) 728
319 Asahi India Glass 2,357 2,404 (2.0) 314
320 Kansai Nerolac Paints 2,354 2,266 3.9 131
321 Info Edge (India) 2,329 1,292 80.3 160
322 Berger Paints India 2,314 2,161 7.1 120
323 Shree Ram Urban Infrastructure ^ 2,284 1,968 16.0 973
324 Supreme Industries * 2,276 2,107 8.0 181
325 Sanofi India @ 2,261 1,909 18.5 179
326 JMC Projects (India) 2,258 1,859 21.5 785
327 Eicher Motors @ 2,236 1,490 50.1 42
328 Abbott India 2,232 1,908 17.0 166
329 Cyient 2,231 1,945 14.7 221
330 Phillips Carbon Black 2,174 2,324 (6.4) 880
331 Lakshmi Machine Works 2,172 2,025 7.3 283
332 Thomas Cook (India) ^ 2,156 1,392 54.9 217
333 RSWM 2,141 1,888 13.4 741
334 Pantaloons Fashion & Retail 2,139 2,153 (0.7) 468
335 Eros International Media 2,133 1,688 26.4 263
336 Radico Khaitan 2,110 2,039 3.5 560
337 Jai Corp 2,089 2,155 (3.1) 606
338 Novartis India 2,087 2,030 2.8 401
339 Surya Roshni 2,086 2,077 0.4 808
340 Godfrey Phillips India 2,071 1,944 6.6 365
341 Allcargo Logistics 2,061 2,110 (2.3) 298
342 Force Motors 2,050 2,026 1.2 390
343 Sundram Fasteners 2,048 1,857 10.3 317
344 Adlabs Entertainment 2,042 1,522 34.1 557
345 Siti Cable Network 2,039 1,693 20.4 403
346 Vakrangee 2,038 1,729 17.9 216
347 AIA Engineering 2,025 1,692 19.6 161
348 Jyothy Laboratories 2,023 1,896 6.7 244
349 Nahar Spinning Mills 2,005 2,175 (7.8) 909
350 BS 2,001 1,640 22.0 529
TOTAL COMPANY TOTAL ASSETS OVERALLASSETS 2014/15 2013/14 Growth RANK RANKING 2015 % 2015
144 BUSINESS TODAY November 8 2015

401 Future Consumer Enterprise 1,610 1,065 51.2 408
402 Persistent Systems 1,607 1,394 15.3 233
403 Man Industries (India) ^^ 1,578 1,628 (3.1) 833
404 Emami 1,568 1,473 6.5 84
405 Time Technoplast 1,564 1,507 3.8 577
406 Kolte Patil Developers 1,558 1,400 11.3 509
407 Greaves Cotton 1,553 1,520 2.2 335
408 3M India 1,534 1,437 6.7 156
409 Ingersoll-Rand (India) 1,500 1,646 (8.9) 356
410 Castrol India @ 1,500 1,622 (7.6) 93
411 Orient Green Power Co. 1,489 1,705 (12.7) 692
412 HMT 1,480 1,519 (2.5) 246
413 Balmer Lawrie & Co. 1,464 1,449 1.0 474
414 Hexaware Technologies @ 1,455 1,475 (1.4) 182
415 Himatsingka Seide 1,448 1,338 8.2 552
416 FAG Bearings India @ 1,445 1,341 7.8 197
417 Schneider Electric Infrastructure 1,434 1,258 13.9 257
418 Venky’s (India) 1,433 1,232 16.3 910
419 LT Foods 1,429 1,264 13.0 886
420 Syngene International 1,427 1,196 19.4 213
421 Ramkrishna Forgings 1,419 1,013 40.1 472
422 Tribhovandas Bhimji Zaveri 1,411 1,401 0.8 622
423 Sunil Hitech Engineers 1,408 1,399 0.7 925
424 Natco Pharma 1,397 1,181 18.2 190
425 Southern Petrochem Inds. Corpn. 1,395 1,494 (6.6) 913
426 PVR 1,393 1,265 10.2 340
427 KEI Industries 1,366 1,269 7.7 740
428 Texmaco Rail & Engineering 1,361 1,030 32.1 380
429 JB Chemicals & Pharmaceuticals ^^ 1,361 1,278 6.5 430
430 Blue Dart Express 1,360 1,242 9.5 116
431 Sutlej Textiles & Industries 1,353 1,284 5.4 713
432 Shasun Pharmaceuticals 1,352 1,163 16.2 406
433 Mangalam Cement 1,349 1,236 9.1 733
434 Sunflag Iron & Steel Co. 1,346 1,326 1.5 942
435 Tata Sponge Iron 1,345 1,254 7.2 655
436 Hikal 1,319 1,280 3.0 595
437 International Paper APPM 1,311 1,376 (4.7) 553
438 Orient Paper & Industries 1,306 1,291 1.2 795
439 Ricoh India 1,297 861 50.7 332
440 Gujarat Ambuja Exports 1,285 1,311 (2.0) 768
441 PNC Infratech ^^ 1,282 1,117 14.8 414
442 NIIT 1,278 923 38.4 648
443 Claris Lifesciences ^ 1,275 1,743 (26.9) 537
444 Hinduja Global Solutions 1,273 1,196 6.4 594
445 Kajaria Ceramics 1,265 1,007 25.7 224
446 Wheels India 1,245 1,136 9.7 511
447 Unichem Laboratories 1,240 1,223 1.4 436
448 Vivimed Labs ^^ 1,236 955 29.4 861
449 Indosolar ^^ 1,236 1,210 2.2 844
450 Ratnamani Metals & Tubes 1,228 1,151 6.7 359
TOTAL COMPANY TOTAL ASSETS OVERALLASSETS 2014/15 2013/14 Growth RANKRANKING 2015 % 201 5


BT INDIA’S MOST VALUABLECOMPANIES/ TOTAL ASSETS RANKING 2015
451 Gillette India * 1,219 1,067 14.2 117
452 Merck @ 1,217 1,129 7.9 527
453 Kaveri Seed Co. 1,205 1,026 17.5 245
454 Steel Strips Wheels 1,204 1,190 1.2 843
455 Savita Oil Technologies 1,172 1,561 (24.9) 677
456 Gulf Oil Corpn. 1,171 1,598 (26.7) 699
457 Responsive Industries 1,168 1,297 (10.0) 346
458 TRF 1,164 1,113 4.6 918
459 Carborundum Universal 1,159 1,061 9.3 339
460 Meghmani Organics 1,159 1,241 (6.6) 848
461 Greenply Industries 1,157 1,735 (33.3) 412
462 Indo Count Industries 1,155 976 18.3 366
463 Inox Leisure 1,149 1,015 13.2 454
464 Praj Industries 1,148 1,185 (3.2) 514
465 Zensar Technologies 1,144 953 20.1 326
466 Sical Logistics 1,144 960 19.1 666
467 FDC 1,144 1,068 7.0 348
468 Just Dial 1,143 887 28.7 186
469 Sanghvi Movers 1,140 1,251 (8.9) 522
470 Deepak Nitrite 1,133 1,067 6.1 715
471 Ashiana Housing 1,130 634 78.1 424
472 Goodyear India @ 1,128 1,043 8.2 540
473 Eveready Industries (India) 1,128 1,128 0.0 416
474 Techno Electric & Engg. Co. 1,124 1,032 8.9 370
475 Wabco India 1,124 967 16.2 141
476 Swan Energy 1,123 1,155 (2.7) 526
477 Page Industries 1,120 887 26.3 114
478 Century Enka 1,116 1,130 (1.3) 901
479 Jubilant Foodworks 1,109 883 25.6 144
480 Styrolution ABS (India) ^ 1,109 1,128 (1.7) 555
481 Ganesh Housing Corpn. 1,105 1,092 1.3 933
482 Granules India 1,103 858 28.6 438
483 Onmobile Global 1,103 1,183 (6.8) 624
484 Sangam (India) ^^ 1,101 1,137 (3.1) 742
485 Hitachi Home & Life Solutions (India) 1,090 770 41.7 292
486 Ajanta Pharma 1,088 880 23.6 129
487 Flexituff International ^^ 1,087 909 19.6 771
488 Kalyani Steels 1,087 1,036 4.9 781
489 Hindustan Media Ventures 1,082 832 30.0 476
490 Delta Corp 1,081 1,052 2.8 459
491 Astral Poly Technik 1,074 713 50.5 254
492 Federal-Mogul Goetze (India) ^ 1,073 955 12.3 413
493 KCP 1,070 1,044 2.5 660
494 Transport Corporation of India 1,065 914 16.5 448
495 Skipper 1,064 882 20.7 483
496 Indian Hume Pipe Co. 1,061 930 14.1 676
497 Genus Power Infrastructures 1,057 883 19.8 720
498 Elecon Engineering Co. 1,057 1,063 (0.6) 675
499 Hatsun Agro Products 1,056 844 25.1 299
500 Ahluwalia Contracts (India) ^^ 1,054 1,043 1.1 487
TOTAL COMPANY TOTAL ASSETS OVERALLASSETS 2014/15 2013/14 Growth RANK RANKING 2015 % 2015
For the keys to symbols used, see footnotes in the main tables starting page 102; The list excludes BFSI companies; Standalone data Source: CMIE Prowess

BT
For the keys to symbols used, see footnotes in the main tables starting page 102; The list excludes BFSI companies; Standalone data Source: CMIE Prowess
INDIA’S MOST VALUABLE COMPANIES/ TOTAL INCOME TOP 500
1 Indian Oil Corpn. 5,04,337 5,43,960 (7.3) 22
2 Reliance Industries 3,49,535 4,10,349 (14.8) 2
3 Bharat Petroleum Corpn. 2,56,137 2,72,663 (6.1) 34
4 Hindustan Petroleum Corpn. 2,20,972 2,34,952 (6.0) 85
5 Essar Oil 94,253 1,08,389 (13.0) 97
6 Oil & Natural Gas Corpn. 92,528 95,177 (2.8) 5
7 NTPC 78,377 75,724 3.5 21
8 Tata Consultancy Services 78,083 68,540 13.9 1
9 Mangalore Refinery & Petrochemicals 63,298 75,684 (16.4) 136
10 Bharti Airtel 60,812 50,910 19.4 13
11 Larsen & Toubro 60,369 60,033 0.6 14
12 GAIL (India) 58,426 59,582 (1.9) 48
13 Maruti Suzuki India 56,229 49,934 12.6 20
14 Steel Authority of India 52,190 54,768 (4.7) 86
15 ITC 52,086 48,374 7.7 4
16 Infosys 51,210 46,936 9.1 7
17 JSW Steel 51,007 49,626 2.8 99
18 Tata Steel 49,116 46,913 4.7 68
19 Chennai Petroleum Corpn. 48,636 54,023 (10.0) 402
20 Wipro 43,807 40,676 7.7 15
21 Mahindra & Mahindra 42,327 43,891 (3.6) 26
22 Tata Motors 41,501 41,878 (0.9) 19
23 Petronet LNG 39,723 37,841 5.0 124
24 Hindalco Industries 38,249 31,632 20.9 92
25 Rajesh Exports 37,978 23,538 61.3 150
26 Vedanta 36,322 33,469 8.5 46
27 Bharat Heavy Electricals 34,567 43,993 (21.4) 37
28 Hindustan Unilever 34,040 30,648 11.1 11
29 Idea Cellular 31,732 26,416 20.1 36
30 Hero MotoCorp 29,888 27,711 7.9 41
31 Ruchi Soya Industries 28,564 24,699 15.6 543
32 UltraTech Cement 26,443 23,499 12.5 24
33 Bajaj Auto 23,107 21,904 5.5 32
34 Alok Industries @@@ 22,720 20,906 8.7 627
35 Jet Airways (India) 21,253 18,226 16.6 294
36 United Spirits ^^ 21,115 19,025 11.0 40
37 Videocon Industries # 20,666 19,209 7.6 248
38 Tech Mahindra 19,707 17,182 14.7 38
39 Hindustan Zinc 19,240 17,003 13.2 31
40 MMTC 18,482 25,512 (27.6) 260
41 Reliance Communications 18,132 15,384 17.9 113
42 Power Grid Corpn. of India 17,770 15,728 13.0 28
43 HCL Technologies ## 17,157 12,897 33.0 16
44 Adani Enterprises 16,435 13,020 26.2 65
45 Jindal Steel & Power 15,877 16,127 (1.6) 172
46 Ashok Leyland 15,333 11,596 32.2 95
47 State Trading Corpn. of India 14,776 15,695 (5.9) 630
48 MRF ** 14,714 13,482 9.1 109
49 NMDC 14,666 14,221 3.1 47
50 Coal India 14,642 16,519 (11.4) 6
COMPANY TOTAL INCOME ( ` CRORE) BT 1000 INCOME 2014/15 2013/14 Growth RANK RANK % 2015
51 Jaiprakash Associates ^^ 14,361 14,188 1.2 323
52 Asian Paints 13,859 12,341 12.3 27
53 ACC @ 13,686 12,976 5.5 76
54 Bosch ^ 13,479 9,821 37.2 29
55 PTC India 13,039 11,438 14.0 441
56 Jindal Stainless ^^ 13,033 11,168 16.7 649
57 Reliance Infrastructure 12,475 12,636 (1.3) 154
58 Titan Company 12,007 11,075 8.4 64
59 Ambuja Cements @ 11,904 11,106 7.2 55
60 Bhushan Steel 11,749 10,630 10.5 535
61 Adani Power 11,515 11,474 0.4 164
62 Coromandel International 11,511 9,565 20.4 208
63 Siemens ** 11,403 11,855 (3.8) 45
64 Redington (India) ^^ 11,380 10,465 8.7 266
65 Oil India 11,155 11,238 (0.7) 71
66 Future Retail 11,122 12,351 (10.0) 272
67 TVS Motor Co. 10,848 8,744 24.1 143
68 Torrent Power 10,597 8,824 20.1 191
69 Tata Chemicals 10,529 9,200 14.4 145
70 Cipla 10,373 9,836 5.5 39
71 Dr. Reddy’s Laboratories 10,319 10,028 2.9 33
72 Nestle India @ 10,272 9,516 7.9 35
73 Cairn India 10,135 12,943 (21.7) 59
74 Lupin 10,068 9,475 6.3 23
75 Apollo Tyres 10,004 9,794 2.1 165
76 Tata Power Co. 9,723 9,402 3.4 103
77 Aditya Birla Nuvo 9,305 8,651 7.6 88
78 Ushdev International 9,039 6,352 42.3 586
79 Chambal Fertilisers & Chemicals 9,038 8,227 9.9 383
80 National Fertilizers 8,909 8,446 5.5 533
81 National Aluminium Co. 8,814 7,716 14.2 153
82 Crompton Greaves 8,746 8,301 5.4 147
83 NCC 8,524 6,319 34.9 265
84 Century Textiles & Industries 8,421 7,411 13.6 209
85 NHPC 8,347 7,151 16.7 101
86 Aurobindo Pharma 8,312 7,344 13.2 50
87 United Breweries 8,276 7,277 13.7 87
88 ABB India @ 8,174 8,204 (0.4) 70
89 Rashtriya Chemicals & Fertilizers 8,003 6,846 16.9 350
90 Exide Industries 7,695 6,796 13.2 125
91 Britannia Industries 7,607 6,459 17.8 61
92 Uttam Galva Steels 7,412 5,955 24.5 773
93 Bharti Infratel 7,400 5,570 32.9 25
94 Bharat Electronics 7,374 6,808 8.3 72
95 Grasim Industries 7,308 6,574 11.2 60
96 Gitanjali Gems 7,218 7,379 (2.2) 899
97 Neyveli Lignite Corpn. 7,194 7,066 1.8 130
98 Jindal Saw 7,136 6,008 18.8 443
99 KEC International 6,961 6,842 1.7 338
100 Shree Cement ## 6,950 6,451 7.7 52
COMPANY TOTAL INCOME ( ` CRORE) BT 1000 INCOME 2014/15 2013/14 Growth RANK RANK % 2015
148 BUSINESS TODAY November 8 2015


BT
For the keys to symbols used, see footnotes in the main tables starting page 102; The list excludes BFSI companies; Standalone data Source: CMIE Prowess
INDIA’S MOST VALUABLE COMPANIES/ TOTAL INCOME TOP 500
101 JK Tyre & Industries 6,799 6,578 3.4 399
102 JSW Energy 6,627 6,065 9.3 115
103 SpiceJet ^^ 6,437 5,805 10.9 541
104 PC Jeweller 6,408 5,375 19.2 205
105 CESC 6,366 5,702 11.6 194
106 Ceat 6,212 5,917 5.0 320
107 Prism Cement 6,129 5,515 11.1 241
108 UPL 6,064 5,646 7.4 96
109 Container Corpn. of India 5,945 5,356 11.0 62
110 Vardhman Textiles 5,934 5,260 12.8 259
111 Havells India 5,923 5,333 11.1 105
112 HCL Infosystems ## 5,859 8,810 (33.5) 636
113 Shree Renuka Sugars 5,828 6,700 (13.0) 629
114 DCM Shriram 5,812 6,398 (9.2) 452
115 Piramal Enterprises 5,774 2,333 147.5 110
116 Cadila Healthcare 5,704 4,619 23.5 53
117 Punj Lloyd 5,689 8,511 (33.2) 652
118 Gujarat State Fertilizers & Chemicals 5,678 5,823 (2.5) 354
119 Dabur India 5,644 5,036 12.1 44
120 Simplex Infrastructures 5,639 5,559 1.5 456
121 Voltas 5,583 5,349 4.4 159
122 Zuari Agro Chemicals 5,575 5,409 3.1 674
123 Motherson Sumi Systems 5,567 5,112 8.9 49
124 Kesoram Industries ^^ 5,559 6,214 (10.5) 587
125 Uttam Value Steels 5,542 7,425 (25.4) 801
126 Apar Industries 5,516 5,029 9.7 516
127 Arvind 5,423 4,949 9.6 203
128 Glenmark Pharmaceuticals 5,371 2,506 114.3 73
129 Kwality 5,281 4,582 15.2 531
130 Welspun Corp 5,265 5,153 2.2 376
131 Tata Communications 5,214 5,161 1.0 133
132 Bajaj Hindusthan Sugar 5,188 7,089 (26.8) 559
133 BASF India 5,138 4,872 5.5 250
134 Thermax 5,132 4,326 18.6 134
135 India Cements ^^ 5,129 5,232 (2.0) 375
136 Cummins India 4,995 4,503 10.9 78
137 Gujarat Narmada Valley Fert & Chem 4,988 5,209 (4.3) 609
138 Bharat Forge 4,844 3,717 30.3 79
139 Marico 4,835 3,925 23.2 77
140 National Buildings Constn. Corpn. 4,809 4,173 15.2 146
141 Godrej Consumer Products 4,769 4,340 9.9 51
142 GlaxoSmithKline Consumer Healthcare 4,753 5,351 (11.2) 80
143 Adani Ports & Special Economic Zone 4,740 5,032 (5.8) 30
144 Supreme Industries * 4,736 4,415 7.3 181
145 Pidilite Industries 4,724 4,169 13.3 66
146 Amara Raja Batteries 4,680 3,886 20.4 118
147 Welspun India 4,671 3,686 26.7 211
148 Kothari Products 4,666 4,326 7.9 881
149 Apollo Hospitals Enterprise 4,638 3,884 19.4 104
150 Shipping Corpn. of India 4,604 4,571 0.7 372
COMPANY TOTAL INCOME ( ` CRORE) BT 1000 INCOME 2014/15 2013/14 Growth RANK RANK % 2015
151 JBF Industries 4,600 5,330 (13.7) 491
152 Kalpataru Power Transmission 4,547 4,225 7.6 308
153 Godfrey Phillips India 4,486 4,221 6.3 365
154 Jain Irrigation Systems 4,434 4,335 2.3 358
155 Bajaj Electricals 4,309 4,080 5.6 379
156 Hindustan Construction Co. 4,298 4,280 0.4 447
157 Colgate-Palmolive (India) 4,272 3,906 9.4 75
158 Berger Paints India 4,266 3,785 12.7 120
159 Ramco Cements 4,255 4,416 (3.6) 185
160 Kansai Nerolac Paints 4,240 3,753 13.0 131
161 Tube Investments of India 4,222 3,856 9.5 198
162 Escorts 4,216 6,514 (35.3) 475
163 Sintex Industries 4,201 3,428 22.5 261
164 Usha Martin 4,152 3,663 13.4 775
165 Castrol India @ 4,129 3,942 4.8 93
166 Balkrishna Industries 4,123 3,630 13.6 206
167 Optiemus Infracom ^^ 4,111 2,835 45.0 969
168 DLF 4,104 4,026 1.9 98
169 Indraprastha Gas 4,095 4,345 (5.8) 220
170 Jaiprakash Power Ventures 4,067 2,750 47.9 425
171 Amtek Auto ** 4,000 3,316 20.6 355
172 SRF 3,997 3,750 6.6 210
173 Bayer CropScience 3,994 3,490 14.4 122
174 Deepak Fertilisers & Petro. Corpn. 3,978 4,084 (2.6) 562
175 JK Cement 3,931 3,269 20.2 276
176 Jubilant Life Sciences 3,921 3,839 2.1 312
177 Alstom T & D India 3,913 3,754 4.2 123
178 IL&FS Transportation Networks 3,884 3,722 4.3 322
179 Zee Entertainment Enterprises 3,863 3,264 18.3 56
180 Mahanagar Telephone Nigam 3,857 15,408 (75.0) 574
181 SRS 3,855 3,462 11.4 937
182 Birla Corporation 3,840 3,603 6.6 329
183 Trident 3,834 3,926 (2.3) 493
184 Torrent Pharmaceuticals 3,798 3,445 10.2 91
185 Oracle Financial Services Software 3,759 3,804 (1.2) 63
186 Uflex 3,723 3,566 4.4 608
187 Whirlpool of India 3,680 3,178 15.8 173
188 GlaxoSmithKline Pharmaceuticals ^ 3,650 2,895 26.1 67
189 Mindtree 3,631 3,081 17.8 142
190 Bombay Rayon Fashions 3,573 2,921 22.3 462
191 Balrampur Chini Mills 3,450 2,859 20.7 578
192 Eicher Motors @ 3,447 2,002 72.2 42
193 Shoppers Stop 3,422 3,063 11.7 337
194 BGR Energy Systems 3,380 3,306 2.2 669
195 Isgec Heavy Engg. 3,375 1,494 125.8 279
196 Jayaswal Neco Industries 3,341 3,516 (5.0) 813
197 Future Lifestyle Fashions 3,332 3,239 2.9 519
198 Mangalore Chemicals & Fertilizers ^^ 3,327 2,804 18.7 700
199 Sterlite Technologies 3,306 2,934 12.7 347
200 SJVN 3,265 2,113 54.6 157
COMPANY TOTAL INCOME ( ` CRORE) BT 1000 INCOME 2014/15 2013/14 Growth RANK RANK % 2015
150 BUSINESS TODAY November 8 2015


BT
For the keys to symbols used, see footnotes in the main tables starting page 102; The list excludes BFSI companies; Standalone data Source: CMIE Prowess
INDIA’S MOST VALUABLE COMPANIES/ TOTAL INCOME TOP 500
201 Mukand 3,264 2,948 10.7 788
202 Jaypee Infratech 3,258 3,332 (2.2) 433
203 Radico Khaitan 3,255 3,087 5.4 560
204 Blue Star 3,240 2,853 13.5 349
205 IVRCL 3,218 4,350 (26.0) 784
206 Mphasis 3,201 1,424 124.7 178
207 Ipca Laboratories 3,179 3,318 (4.2) 176
208 Sun Pharmaceutical Inds. ^^ 3,174 2,789 13.8 8
209 Divis Laboratories 3,154 2,616 20.6 82
210 RSWM 3,138 2,999 4.7 741
211 KRBL 3,117 2,859 9.0 295
212 Indo Rama Synthetics (India) 3,108 3,161 (1.7) 868
213 Tata Global Beverages 3,102 3,125 (0.7) 177
214 Aarti Industries 3,094 2,837 9.1 331
215 Surya Roshni 3,075 3,254 (5.5) 808
216 BEML 3,063 3,213 (4.6) 247
217 Sadbhav Engineering 3,038 2,414 25.9 243
218 Castex Technologies ** 3,015 2,351 28.2 281
219 Supreme Petrochem * 2,963 3,618 (18.1) 643
220 Balmer Lawrie & Co. 2,953 2,854 3.5 474
221 Tata Teleservices (Maharashtra) 2,946 2,935 0.4 523
222 Hatsun Agro Products 2,944 2,508 17.4 299
223 Prakash Industries ^^ 2,899 2,797 3.6 867
224 Akzo Nobel India 2,867 2,741 4.6 218
225 Finolex Industries 2,847 2,830 0.6 328
226 Dish TV India 2,836 2,588 9.6 149
227 Bata India ^ 2,814 2,130 32.1 200
228 Lakshmi Machine Works 2,808 2,689 4.4 283
229 Raymond 2,795 2,416 15.7 369
230 Vakrangee 2,785 1,975 41.0 216
231 Shrenuj & Co. 2,785 2,567 8.5 680
232 Jindal Poly Films 2,774 2,889 (4.0) 544
233 Phillips Carbon Black 2,747 2,576 6.6 880
234 Atul 2,734 2,556 7.0 309
235 Kirloskar Oil Engines 2,734 2,548 7.3 290
236 Force Motors 2,705 2,362 14.5 390
237 Himachal Futuristic Communications 2,700 2,071 30.3 471
238 Finolex Cables 2,656 2,569 3.4 303
239 Suzlon Energy 2,654 5,602 (52.6) 148
240 SKF India @ 2,643 2,497 5.9 195
241 JK Lakshmi Cement 2,608 2,342 11.3 288
242 Sundram Fasteners 2,590 2,229 16.2 317
243 Gujarat Ambuja Exports 2,579 3,140 (17.9) 768
244 Prestige Estates Projects 2,573 2,152 19.5 174
245 Bombay Dyeing & Mfg. Co. 2,567 2,823 (9.1) 520
246 Inox Wind 2,558 1,416 80.6 167
247 GHCL 2,552 2,376 7.4 632
248 OCL India 2,551 2,142 19.1 364
249 JK Paper 2,492 2,026 23.0 837
250 P&G Hygiene & Health Care * 2,480 2,188 13.4 100
COMPANY TOTAL INCOME ( ` CRORE) BT 1000 INCOME 2014/15 2013/14 Growth RANK RANK % 2015
251 IL&FS Engg. & Construction Co. 2,479 3,436 (27.9) 645
252 Honeywell Automation India ^ 2,464 1,756 40.3 196
253 Heidelberg Cement India ^ 2,446 1,625 50.5 482
254 Tamil Nadu Newsprint & Papers 2,440 2,563 (4.8) 568
255 Biocon 2,433 2,311 5.2 170
255 JMC Projects (India) 2,433 2,678 (9.2) 785
257 Metalyst Forgings ** 2,417 1,762 37.2 811
258 Sobha 2,413 2,140 12.8 321
259 Kajaria Ceramics 2,389 2,010 18.9 224
260 Alstom India 2,370 2,848 (16.8) 253
261 Abbott India 2,359 2,357 0.1 166
262 Wockhardt 2,358 2,139 10.2 108
263 EID-Parry (India) 2,335 2,001 16.7 378
264 Clariant Chemicals (India) @ 2,333 1,457 60.1 419
265 Sun TV Network 2,331 2,176 7.1 126
266 Electrosteel Castings 2,299 2,300 (0.1) 727
267 Blue Dart Express 2,293 1,976 16.0 116
268 Asian Star Co. 2,289 2,297 (0.3) 521
269 AIA Engineering 2,287 1,876 21.9 161
270 Sanofi India @ 2,273 2,017 12.7 179
271 Emami 2,260 1,829 23.6 84
272 McNally Bharat Engg. Co. 2,246 2,160 3.9 935
273 Asahi India Glass 2,240 2,265 (1.1) 314
274 PI Industries 2,230 1,862 19.8 171
275 APL Apollo Tubes 2,230 2,188 1.9 603
276 Gujarat Alkalies & Chemicals 2,223 2,150 3.4 547
277 Transport Corporation of India 2,209 2,033 8.7 448
278 IRB Infrastructure Developers 2,201 2,528 (13.0) 180
279 Kei Industries 2,176 1,765 23.3 740
280 Nahar Spinning Mills 2,161 2,211 (2.3) 909
281 Indian Hotels Co. 2,155 2,024 6.5 184
282 Triveni Engineering & Inds. 2,147 3,332 (35.6) 819
283 Patel Engineering 2,145 2,495 (14.0) 769
284 Wheels India 2,144 1,978 8.4 511
285 Hindusthan National Glass & Inds. ^^ 2,132 2,055 3.7 621
286 Southern Petrochem Inds. Corpn. 2,109 1,535 37.4 913
287 KPR Mill 2,104 1,990 5.7 392
288 Jubilant Foodworks 2,091 1,748 19.6 144
289 Fertilisers & Chemicals, Travancore 2,091 2,410 (13.2) 499
290 Gillette India * 2,089 1,804 15.8 117
291 Heritage Foods 2,081 1,728 20.4 657
292 Orchid Chemicals & Pharma.#@# 2,069 1,982 4.4 841
293 Savita Oil Technologies 2,069 2,392 (13.5) 677
294 TVS Srichakra 2,064 1,815 13.7 467
295 Electrosteel Steels 2,049 583 251.3 671
296 DB Corp 2,041 1,882 8.5 219
297 Alembic Pharmaceuticals 2,040 1,856 9.9 137
298 Rolta India 2,023 1,256 61.1 457
299 Great Eastern Shipping Co. 2,020 1,797 12.4 238
300 HSIL 2,005 1,889 6.1 395
COMPANY TOTAL INCOME ( ` CRORE) BT 1000 INCOME 2014/15 2013/14 Growth RANK RANK % 2015
152 BUSINESS TODAY November 8 2015


BT
For the keys to symbols used, see footnotes in the main tables starting page 102; The list excludes BFSI companies; Standalone data Source: CMIE Prowess
INDIA’S MOST VALUABLE COMPANIES/ TOTAL INCOME TOP 500
301 Ashoka Buildcon 2,004 1,665 20.4 336
302 Pfizer 1,998 1,274 56.8 158
303 Engineers India 1,995 2,181 (8.5) 202
304 Sunflag Iron & Steel Co. 1,965 1,776 10.7 942
305 Tribhovandas Bhimji Zaveri 1,959 1,825 7.4 622
306 MBL Infrastructures 1,951 1,758 11.0 575
307 Sutlej Textiles & Industries 1,949 1,956 (0.3) 713
308 3M India 1,943 1,840 5.6 156
309 BS 1,936 1,817 6.6 529
310 Financial Technologies (India) 1,926 619 211.3 721
311 Nilkamal 1,911 1,751 9.1 597
312 Orient Paper & Inds. 1,889 1,789 5.5 795
313 Lloyd Electric & Engineering 1,887 1,480 27.5 701
314 Greaves Cotton 1,880 1,978 (4.9) 335
315 LT Foods 1,856 1,811 2.5 886
316 Pantaloons Fashion & Retail 1,854 1,666 11.2 468
317 Mahindra C I E Automotive 1,847 439 320.4 187
318 Orient Cement 1,835 1,703 7.8 319
319 Gujarat Fluorochemicals 1,799 1,323 35.9 192
320 Godrej Industries 1,795 1,701 5.5 132
321 Munjal Showa 1,793 1,741 3.0 705
322 Ratnamani Metals & Tubes 1,793 1,450 23.6 359
323 FAG Bearings India @ 1,788 1,568 14.0 197
324 Avanti Feeds 1,785 1,135 57.3 449
325 Venky’s (India) 1,767 1,778 (0.6) 910
326 Nectar Lifesciences 1,767 1,721 2.7 678
327 V-Guard Industries 1,764 1,543 14.4 362
328 West Coast Paper Mills 1,757 1,667 5.4 907
329 Goodyear India @ 1,745 1,744 0.1 540
330 VST Industries 1,742 1,664 4.7 389
331 Gujarat Mineral Devp. Corpn. 1,728 1,483 16.5 352
332 Century Plyboards (India) 1,723 1,415 21.8 280
333 Polaris Consulting & Services 1,718 2,127 (19.2) 464
334 Hitachi Home & Life Solutions (India) 1,715 1,210 41.7 292
335 Kirloskar Brothers 1,715 1,850 (7.3) 484
336 Federal-Mogul Goetze (India) ^ 1,705 1,268 34.4 413
337 Jagran Prakashan 1,698 1,652 2.8 284
338 Indo Count Inds. 1,687 1,464 15.3 366
339 Lanco Infratech 1,684 2,349 (28.3) 598
340 VRL Logistics 1,683 1,510 11.4 344
341 Ricoh India 1,671 1,059 57.8 332
342 Sunil Hitech Engineers 1,665 1,442 15.5 925
343 Styrolution ABS (India) ^ 1,657 1,272 30.2 555
344 Gayatri Projects 1,655 1,855 (10.8) 614
345 HT Media 1,648 1,579 4.3 420
346 Linde India @ 1,638 1,588 3.1 345
347 Rallis India 1,632 1,643 (0.7) 275
348 Greenply Industries 1,628 2,256 (27.8) 412
349 Trent 1,618 1,392 16.3 287
350 Somany Ceramics 1,617 1,332 21.4 508
COMPANY TOTAL INCOME ( ` CRORE) BT 1000 INCOME 2014/15 2013/14 Growth RANK RANK % 2015
351 PVR 1,604 1,508 6.4 340
352 Graphite India 1,602 1,885 (15.0) 496
353 Gabriel India 1,599 1,427 12.1 556
354 Strides Arcolab 1,578 5,756 (72.6) 199
355 Himadri Chemicals & Inds. 1,570 1,556 0.9 728
356 Pratibha Industries ^^ 1,569 1,663 (5.7) 895
357 Responsive Industries 1,567 1,887 (16.9) 346
358 Sarda Energy & Minerals 1,558 1,431 8.9 875
359 Jyothy Laboratories 1,557 1,362 14.3 244
360 Page Industries 1,552 1,195 29.9 114
361 Kalyani Steels 1,552 1,423 9.1 781
362 Kirloskar Ferrous Industries 1,542 1,394 10.6 698
363 Maharashtra Seamless 1,539 1,371 12.3 546
364 Mandhana Industries ^^ 1,535 1,390 10.4 656
365 Minda Industries 1,530 1,241 23.3 668
366 Supreme Infrastructure India 1,528 2,177 (29.8) 884
367 Siyaram Silk Mills 1,527 1,321 15.6 607
368 Schneider Electric Infrastructure 1,503 1,376 9.2 257
369 Relaxo Footwears 1,500 1,228 22.2 234
370 Time Technoplast 1,488 1,375 8.3 577
371 Jay Bharat Maruti 1,483 1,373 8.0 989
372 Wabco India 1,481 1,229 20.4 141
373 Sangam (India) ^^ 1,478 1,498 (1.3) 742
374 Sundaram-Clayton 1,476 1,320 11.8 304
375 ITD Cementation India @ 1,472 1,279 15.1 572
376 Skipper 1,461 1,167 25.2 483
377 McLeod Russel India 1,461 1,539 (5.1) 400
378 HBL Power Systems 1,451 1,446 0.3 550
379 Rico Auto Inds. 1,432 1,045 37.0 754
380 TTK Prestige 1,429 1,339 6.7 268
381 Deepak Nitrite 1,420 1,354 4.9 715
382 Shilpi Cable Technologies 1,412 989 42.7 855
383 Cyient 1,406 1,312 7.1 221
384 Ajanta Pharma 1,405 1,136 23.7 129
385 Indian Metals & Ferro Alloys 1,399 1,361 2.8 874
386 NIIT Technologies 1,398 1,389 0.7 385
387 Unitech 1,395 2,153 (35.2) 384
388 DCW 1,392 1,462 (4.8) 897
389 Carborundum Universal 1,386 1,267 9.4 339
390 Century Enka 1,378 1,662 (17.1) 901
391 Tide Water Oil Co. (India) 1,372 1,171 17.2 528
392 Astral Poly Technik 1,372 1,173 16.9 254
393 IFB Industries 1,368 1,106 23.7 422
394 EIH 1,367 1,291 5.8 222
395 J Kumar Infraprojects 1,357 1,198 13.3 410
396 Eveready Industries (India) 1,344 1,228 9.5 416
397 Persistent Systems 1,344 1,222 9.9 233
398 Subros 1,339 1,324 1.1 878
399 CMC 1,315 1,362 (3.5) 225
400 Everest Industries 1,311 1,108 18.4 825
COMPANY TOTAL INCOME ( ` CRORE) BT 1000 INCOME 2014/15 2013/14 Growth RANK RANK % 2015
154 BUSINESS TODAY November 8 2015


BT
For the keys to symbols used, see footnotes in the main tables starting page 102; The list excludes BFSI companies; ˚ The company was incorporated in 2013 and was listed in2015, hence earlier data is not available; Standalone data Source: CMIE Prowess
INDIA’S MOST VALUABLE COMPANIES/ TOTAL INCOME TOP 500 COMPANY TOTAL INCOME ( ` CRORE) BT 1000 INCOME 2014/15 2013/14 Growth RANK RANK % 2015
451 Rupa & Co. 1,050 962 9.1 387
452 Meghmani Organics 1,048 986 6.3 848
453 Man Industries (India) ^^ 1,047 1,552 (32.6) 833
454 Indian Hume Pipe Co. 1,035 835 24.0 676
455 Insecticides (India) 1,032 923 11.8 610
456 JB Chemicals & Pharmaceuticals ^^ 1,012 853 18.7 430
457 GTL Infrastructure 1,009 1,142 (11.7) 803
458 Brigade Enterprises 1,008 919 9.7 480
459 Novartis India 1,005 1,009 (0.5) 401
460 Ahluwalia Contracts (India) ^^ 1,003 1,429 (29.8) 487
461 Essar Shipping 999 1,032 (3.2) 890
462 Himatsingka Seide 997 1,023 (2.5) 552
463 Flexituff International ^^ 992 874 13.5 771
464 Omaxe 981 1,223 (19.8) 393
465 Navneet Education 979 882 11.0 405
466 Timken India 973 770 26.4 293
467 Munjal Auto Industries 973 892 9.1 905
468 Inox Leisure 967 881 9.9 454
469 Bannari Amman Sugars 965 665 45.1 642
470 Genus Power Infrastructures 949 797 19.1 720
471 DEN Networks 944 937 0.8 394
472 Crisil @ 944 938 0.6 121
473 FDC 942 895 5.2 348
474 Tinplate Co. Of India 941 1,084 (13.3) 748
475 Firstsource Solutions 937 988 (5.1) 439
476 Tata Sponge Iron 923 894 3.3 655
477 Mirza International 919 708 29.8 641
478 Merck @ 918 848 8.3 527
479 KSE 912 808 12.9 998
480 Gujarat Pipavav Port ^ 909 557 63.2 155
481 Pennar Industries ^^ 897 1,019 (11.9) 756
482 Welspun Syntex 897 960 (6.6) 991
483 KNR Constructions 889 854 4.2 512
484 Greenlam Industries˚ 883 0 NA 640
485 KSB Pumps @ 882 805 9.6 432
486 Hikal 879 869 1.2 595
487 Pipavav Defence & Offshore Engg. 878 2,354 (62.7) 273
488 Hindustan Media Ventures 877 763 15.0 476
489 Syngene International 872 708 23.2 213
490 Indoco Remedies 871 744 17.0 333
491 Parsvnath Developers 869 536 62.2 651
492 Cera Sanitaryware 865 702 23.1 368
493 Tata Elxsi 863 812 6.2 267
494 Ramco Industries 855 761 12.4 681
495 Rane (Madras) 854 794 7.5 945
496 Ansal Properties & Infrastructure 853 927 (8.0) 980
497 Bajaj Corp 853 712 19.8 207
498 Eclerx Services 850 729 16.6 256
499 Praj Industries 849 775 9.6 514
500 SRS Real Infrastructure 844 840 0.4 684
COMPANY TOTAL INCOME ( ` CRORE) BT 1000 INCOME 2014/15 2013/14 Growth RANK RANK % 2015
401 IG Petrochemicals 1,305 1,331 (2.0) 983
402 Sanghi Industries ## 1,305 1,178 10.7 551
403 Steel Strips Wheels 1,299 1,191 9.1 843
404 HEG 1,297 1,552 (16.4) 697
405 KPIT Technologies 1,281 960 33.5 411
406 Aditya Birla Chemicals (India) 1,271 1,193 6.5 826
407 Lumax Industries 1,269 1,251 1.5 949
408 HIL 1,263 987 27.9 832
409 Puravankara Projects 1,260 976 29.0 478
410 Gujarat Industries Power Co. 1,259 1,412 (10.8) 549
411 Granules India 1,251 1,025 22.1 438
412 VA Tech Wabag 1,242 1,167 6.4 297
413 Nava Bharat Ventures 1,235 1,177 4.9 524
414 Sona Koyo Steering Systems 1,233 1,226 0.6 564
415 Huhtamaki PPL @ 1,229 1,085 13.3 450
416 International Paper APPM 1,224 1,172 4.5 553
417 Hindustan Copper 1,220 1,728 (29.4) 235
418 Grindwell Norton 1,215 1,032 17.8 289
419 Hexaware Technologies @ 1,214 1,054 15.2 182
420 SML Isuzu 1,209 978 23.6 461
421 Sudarshan Chemical Inds. 1,192 1,108 7.6 710
422 Allcargo Logistics 1,179 1,022 15.4 298
423 Aarti Drugs 1,175 1,050 11.9 488
424 Madhucon Projects 1,165 898 29.8 850
425 MOIL 1,164 1,340 (13.2) 291
426 PNC Infratech ^^ 1,163 1,308 (11.1) 414
427 LG Balakrishnan & Bros. 1,148 1,072 7.0 688
428 Polyplex Corporation 1,141 1,221 (6.6) 726
429 Solar Industries India 1,139 1,005 13.4 215
430 Srikalahasthi Pipes 1,135 1,047 8.4 659
431 Bodal Chemicals 1,133 1,041 8.9 951
432 Kaveri Seed Co. 1,131 1,012 11.8 245
433 Shasun Pharmaceuticals 1,129 985 14.6 406
434 Gulf Oil Lubricants India 1,128 0.002 NA 404
435 Nandan Denim 1,127 917 22.9 856
436 Jamna Auto Inds. 1,123 837 34.2 663
437 Unichem Laboratories 1,119 1,144 (2.1) 436
438 Future Consumer Enterprise 1,119 464 141.3 408
439 Gujarat State Petronet 1,117 1,106 1.0 204
440 Excel Crop Care 1,114 1,058 5.3 618
441 Hathway Cable & Datacom 1,113 999 11.4 296
442 Sagar Cements 1,104 649 70.2 732
443 Zensar Technologies 1,102 962 14.6 326
444 Hinduja Global Solutions 1,100 934 17.7 594
445 Housing Dev. & Infrastructure 1,097 940 16.7 302
446 Eros International Media 1,092 869 25.7 263
447 VIP Industries 1,074 1,008 6.5 539
448 Pricol 1,061 1,022 3.8 970
449 Mangalam Cement 1,057 813 30.1 733
450 Sharda Motor Industries 1,051 982 7.0 793
156 BUSINESS TODAY November 8 2015


BT
For the keys to symbols used, see footnotes in the main tables starting page 102; The list excludes BFSI companies; Standalone data Source: CMIE Prowess
INDIA’S MOST VALUABLE COMPANIES/ NET PROFIT TOP 500
1 Reliance Industries 22,401 21,984 1.9 2
2 Tata Consultancy Services 18,750 18,475 1.5 1
3 Oil & Natural Gas Corpn. 17,733 22,095 (19.7) 5
4 Coal India 13,383 15,009 (10.8) 6
5 Bharti Airtel 13,282 6,540 103.1 13
6 Infosys 12,164 10,194 19.3 7
7 NTPC 10,319 10,975 (6.0) 21
8 ITC 9,638 8,814 9.4 4
9 Wipro 8,193 7,387 10.9 15
10 Hindustan Zinc 8,139 6,905 17.9 31
11 Tata Steel 6,439 6,412 0.4 68
12 NMDC 6,422 6,420 0.0 47
13 HCL Technologies ## 5,984 3,611 65.7 16
14 Indian Oil Corpn. 5,270 7,017 (24.9) 22
15 Bharat Petroleum Corpn. 5,082 4,060 25.2 34
16 Larsen & Toubro 5,056 5,493 (8.0) 14
17 Power Grid Corpn. of India 4,961 4,492 10.4 28
18 Hindustan Unilever 4,315 3,867 11.6 11
19 Maruti Suzuki India 3,711 2,783 33.4 20
20 Mahindra & Mahindra 3,324 3,758 (11.6) 26
21 GAIL (India) 3,039 4,375 (30.5) 48
22 Bajaj Auto 2,814 3,248 (13.4) 32
23 Idea Cellular 2,810 1,689 66.3 36
24 Hindustan Petroleum Corpn. 2,733 1,734 57.6 85
25 Bharti Infratel 2,647 1,055 151.0 25
26 Oil India 2,510 2,981 (15.8) 71
27 Lupin 2,397 2,355 1.8 23
28 Hero MotoCorp 2,386 2,109 13.1 41
29 Cairn India 2,370 7,454 (68.2) 59
30 Tech Mahindra 2,256 2,695 (16.3) 38
31 Adani Ports & Special Economic Zone 2,183 2,016 8.3 30
32 JSW Steel 2,166 1,335 62.3 99
33 NHPC 2,135 984 116.9 101
34 Steel Authority of India 2,058 2,616 (21.4) 86
35 UltraTech Cement 2,015 2,144 (6.0) 24
36 Vedanta 1,927 1,076 79.1 46
37 Dr. Reddy’s Laboratories 1,681 1,933 (13.1) 33
38 SJVN 1,677 1,115 50.4 157
39 Neyveli Lignite Corpn. 1,579 1,501 5.2 130
40 Essar Oil 1,521 126 1,109.4 97
41 Aurobindo Pharma 1,516 1,172 29.4 50
42 Ambuja Cements @ 1,496 1,295 15.6 55
43 Bharat Heavy Electricals 1,419 3,461 (59.0) 37
44 Reliance Infrastructure 1,401 1,284 9.2 154
45 Bosch ^ 1,338 885 51.2 29
46 Asian Paints 1,327 1,169 13.5 27
47 National Aluminium Co. 1,322 642 105.8 153
48 Cadila Healthcare 1,271 904 40.7 53
49 Nestle India @ 1,185 1,117 6.0 35
50 Cipla 1,181 1,388 (14.9) 39
COMPANY NET PROFIT ( ` CRORE) BT 1000 PROFIT 2014/15 2013/14 Growth RANK RANK % 2015
51 ACC @ 1,168 1,093 6.9 76
52 Bharat Electronics 1,145 922 24.1 72
53 Oracle Financial Services Software 1,058 1,148 (7.9) 63
54 Container Corpn. of India 1,048 985 6.4 62
55 Tata Power Co. 1,026 974 5.2 103
56 Glenmark Pharmaceuticals 1,008 434 132.2 73
57 JSW Energy 996 602 65.4 115
58 Clariant Chemicals (India) @ 943 166 466.9 419
59 DLF 940 527 78.4 98
60 Hindalco Industries 925 1,413 (34.5) 92
61 MRF ** 898 802 11.9 109
62 Petronet L N G 883 712 24.0 124
63 Divis Laboratories 847 792 7.0 82
64 Zee Entertainment Enterprises 837 772 8.3 56
65 Titan Company 823 741 11.1 64
66 Shree Cement ## 787 1,004 (21.6) 52
67 Cummins India 786 600 31.0 78
68 Dabur India 759 672 12.9 44
69 Torrent Power 742 95 682.4 191
70 Sun TV Network 737 717 2.8 126
71 Crompton Greaves 728 521 39.7 147
72 Bharat Forge 719 400 79.8 79
73 Rolta India 717 459 56.0 457
74 CESC 698 652 7.0 194
75 Tata Communications 675 542 24.4 133
76 Godrej Consumer Products 654 565 15.9 51
77 Apollo Tyres 645 443 45.7 165
78 Tata Chemicals 638 436 46.3 145
79 Torrent Pharmaceuticals 623 762 (18.3) 91
80 Britannia Industries 622 370 68.3 61
81 Siemens ** 603 194 210.9 45
82 GlaxoSmithKline Consumer Healthcare 584 675 (13.5) 80
83 Colgate-Palmolive (India) 559 540 3.5 75
84 Eicher Motors @ 559 279 100.6 42
85 Mphasis 553 228 142.9 178
86 Exide Industries 546 487 12.1 125
87 Marico 545 577 (5.6) 77
88 Mindtree 534 451 18.4 142
89 Strides Arcolab 532 3,513 (84.8) 199
90 Grasim Industries 530 896 (40.9) 60
91 Aditya Birla Nuvo 528 674 (21.7) 88
92 Motherson Sumi Systems 515 535 (3.8) 49
93 Welspun India 510 30 1,609.6 211
94 Pidilite Industries 502 469 7.1 66
95 Gujarat Mineral Development Corpn. 500 439 13.9 352
96 Balkrishna Industries 498 488 2.0 206
97 UPL 492 435 13.3 96
98 Castrol India @ 475 509 (6.7) 93
99 GlaxoSmithKline Pharmaceuticals ^ 472 502 (6.0) 67
100 Emami 472 337 39.8 84
COMPANY NET PROFIT ( ` CRORE) BT 1000 PROFIT 2014/15 2013/14 Growth RANK RANK % 2015
160 BUSINESS TODAY November 8 2015


BT
For the keys to symbols used, see footnotes in the main tables starting page 102; The list excludes BFSI companies; Standalone data Source: CMIE Prowess
INDIA’S MOST VALUABLE COMPANIES/ NET PROFIT TOP 500
101 Havells India 465 479 (2.9) 105
102 Sintex Industries 458 335 36.5 261
103 Financial Technologies (India) 445 (229) (294.8) 721
104 Indraprastha Gas 438 360 21.5 220
105 Adani Enterprises 433 (153) (383.9) 65
106 MOIL 428 509 (15.9) 291
107 AIA Engineering 415 285 45.4 161
108 Prestige Estates Projects 414 340 21.8 174
109 Jaiprakash Associates ^^ 414 501 (17.4) 323
110 Amara Raja Batteries 411 367 11.8 118
111 Gujarat State Petronet 410 419 (2.1) 204
112 Coromandel International 403 345 16.9 208
113 Gujarat State Fertilizers & Chemicals 401 342 17.1 354
114 Gujarat Pipavav Port ^ 387 192 102.0 155
115 Bayer Cropscience 383 290 32.3 122
116 Gujarat Fluorochemicals 382 74 413.8 192
117 PC Jeweller 378 356 6.2 205
118 Arvind 377 361 4.4 203
119 Piramal Enterprises 373 (370) (200.7) 110
120 Vardhman Textiles 361 654 (44.7) 259
121 Biocon 361 324 11.3 170
122 Jaypee Infratech 355 (46) (878.3) 433
123 Alok Industries @@@ 349 920 (62.1) 627
124 TVS Motor Co. 348 262 32.9 143
125 Apollo Hospitals Enterprise 347 331 4.8 104
126 P&G Hygiene & Health Care * 346 302 14.6 100
127 Voltas 336 186 81.0 159
128 Thermax 336 253 32.8 134
129 Ashok Leyland 335 29 1,039.6 95
130 Wockhardt 332 208 59.6 108
131 Inox Wind 332 145 128.8 167
132 Amtek Auto ** 323 451 (28.3) 355
133 Rashtriya Chemicals & Fertilizers 322 250 28.9 350
134 Vakrangee 320 199 60.9 216
135 IL&FS Transportation Networks 319 263 20.9 322
136 Hexaware Technologies @ 318 334 (4.7) 182
137 Great Eastern Shipping Co. 317 205 55.0 238
138 DB Corp 317 306 3.5 219
139 Supreme Industries * 316 281 12.2 181
140 Ajanta Pharma 308 221 39.6 129
141 Engineers India 308 480 (35.8) 202
142 SRF 308 217 42.1 210
143 Oberoi Realty 305 295 3.3 168
144 Kaveri Seed Co. 302 211 43.4 245
145 Ceat 299 254 17.8 320
146 Tata Global Beverages 299 463 (35.4) 177
147 Sagar Cements 297 (26) (1,259.7) 732
148 Alembic Pharmaceuticals 287 238 20.3 137
149 KRBL 281 265 5.9 295
150 National Buildings Constn. Corpn. 277 247 12.2 146
COMPANY NET PROFIT ( ` CRORE) BT 1000 PROFIT 2014/15 2013/14 Growth RANK RANK % 2015
151 Cyient 271 255 6.4 221
152 Berger Paints India 266 234 13.6 120
153 Kansai Nerolac Paints 265 207 28.2 131
154 Rajesh Exports 264 227 16.3 150
155 Sanofi India @ 264 265 (0.6) 179
156 Jindal Saw 262 168 55.9 443
157 United Breweries 260 226 15.0 87
158 Persistent Systems 259 249 4.3 233
159 Ipca Laboratories 256 477 (46.3) 176
160 JK Tyre & Industries 253 135 88.1 399
161 Castex Technologies ** 248 210 17.9 281
162 PI Industries 243 184 32.4 171
163 Ramco Cements 242 138 76.0 185
164 DCM Shriram 242 275 (11.9) 452
165 Redington (India) ^^ 240 171 39.9 266
166 Chambal Fertilisers & Chemicals 237 303 (21.9) 383
167 Mahindra Lifespace Developers 233 78 200.1 455
168 Housing Dev. & Infrastructure 233 243 (4.4) 302
169 Bata India ^ 231 191 21.2 200
170 Abbott India 229 198 15.4 166
171 ABB India @ 229 177 29.2 70
172 Gujarat Alkalies & Chemicals 228 185 23.1 547
173 Jagran Prakashan 224 233 (3.9) 284
174 Atul 217 213 2.2 309
175 eClerx Services 216 247 (12.5) 256
176 Crisil @ 216 281 (23.4) 121
177 Whirlpool of India 211 123 71.3 173
178 Lakshmi Machine Works 207 184 12.6 283
179 Jubilant Life Sciences 205 1 24,913.4 312
180 Ushdev International 203 104 96.0 586
181 PTC India 203 251 (19.2) 441
182 SKF India @ 203 167 21.6 195
183 Shipping Corpn. of India 201 (275) (173.2) 372
184 Finolex Cables 199 208 (4.3) 303
185 CMC 198 324 (38.9) 225
186 Page Industries 196 154 27.5 114
187 Orient Cement 195 101 92.8 319
188 Info Edge (India) 194 128 50.9 160
189 Metalyst Forgings ** 193 173 11.4 811
190 Aban Offshore 191 180 5.6 446
191 Himachal Futuristic Communications 190 147 28.8 471
192 Aarti Industries 188 149 26.3 331
193 Sobha 187 207 (9.6) 321
194 Akzo Nobel India 186 150 24.0 218
195 GHCL 184 96 91.4 632
196 Zensar Technologies 183 187 (2.2) 326
197 Godfrey Phillips India 183 171 7.3 365
198 Alstom India 177 231 (23.2) 253
199 Birla Corporation 175 130 35.2 329
200 Syngene International 175 134 30.7 213
COMPANY NET PROFIT ( ` CRORE) BT 1000 PROFIT 2014/15 2013/14 Growth RANK RANK % 2015
162 BUSINESS TODAY November 8 2015


BT
For the keys to symbols used, see footnotes in the main tables starting page 102; The list excludes BFSI companies; Standalone data Source: CMIE Prowess
INDIA’S MOST VALUABLE COMPANIES/ NET PROFIT TOP 500
201 Bajaj Corp 173 150 15.2 207
202 Prakash Industries ^^ 173 165 5.0 867
203 Ratnamani Metals & Tubes 173 143 20.8 359
204 Rico Auto Industries 172 3 6,435.0 754
205 Tide Water Oil Co. (India) 171 68 150.5 528
206 Kajaria Ceramics 168 117 44.2 224
207 Tamil Nadu Newsprint & Papers 167 161 3.4 568
208 Kalpataru Power Transmission 166 146 13.1 308
209 Firstsource Solutions 164 134 21.8 439
210 Sasken Communication Tech 159 58 174.2 834
211 Gillette India * 158 51 207.5 117
212 JK Cement 157 97 61.7 276
213 Godrej Industries 157 125 24.9 132
214 Jindal Poly Films 153 83 84.0 544
215 Natco Pharma 153 110 38.8 190
216 FAG Bearings India @ 153 122 25.5 197
217 Blue Star 153 76 101.0 349
218 VST Industries 152 150 1.4 389
219 KPIT Technologies 152 149 1.9 411
220 Century Plyboards (India) 151 68 122.5 280
221 Carborundum Universal 148 73 103.8 339
222 EID-Parry (India) 148 27 458.8 378
223 NIIT Technologies 148 214 (31.0) 385
224 Balmer Lawrie & Co. 147 157 (5.9) 474
225 KPR Mill 146 131 11.8 392
226 FDC 146 134 8.5 348
227 Rallis India 145 146 (0.6) 275
228 Isgec Heavy Engineering 143 46 209.6 279
229 Kirloskar Oil Engines 143 178 (19.8) 290
230 Jyothy Laboratories 143 106 34.6 244
231 Nava Bharat Ventures 142 193 (26.2) 524
232 Ashoka Buildcon 142 103 37.5 336
233 Uflex 142 129 9.8 608
234 Ashapura Minechem ^^ 141 32 336.2 809
235 Cox & Kings 141 113 25.3 262
236 Kwality 141 127 11.3 531
237 Hindustan Media Ventures 141 111 26.7 476
238 Credit Analysis & Research 140 129 9.1 285
239 JBF Industries 139 15 822.8 491
240 Indo Count Industries 139 105 32.5 366
241 Just Dial 139 121 15.2 186
242 Claris Lifesciences ^ 139 81 71.0 537
243 IRB Infrastructure Developers 138 288 (52.0) 180
244 Jaiprakash Power Ventures 137 20 595.4 425
245 Sundram Fasteners 135 121 11.9 317
246 Polaris Consulting & Services 130 158 (17.5) 464
247 Navneet Education 129 113 14.2 405
248 Godrej Properties 128 98 31.0 236
249 Blue Dart Express 127 124 2.0 116
250 Gujarat Industries Power Co. 126 186 (32.0) 549
COMPANY NET PROFIT ( ` CRORE) BT 1000 PROFIT 2014/15 2013/14 Growth RANK RANK % 2015
251 Anant Raj 125 88 41.5 571
252 Eros International Media 124 114 8.9 263
253 Jubilant Foodworks 123 126 (2.0) 144
254 Maharashtra Seamless 123 97 26.2 546
255 Tube Investments of India 122 96 27.6 198
256 Greenply Industries 122 114 6.4 412
257 Wabco India 121 117 2.7 141
258 Alstom T & D India 120 117 2.5 123
259 Sonata Software 118 54 118.1 489
260 Trident 118 197 (40.2) 493
261 Avanti Feeds 117 70 67.1 449
262 Vinati Organics 116 86 34.4 367
263 Sutlej Textiles & Industries 115 131 (12.1) 713
264 Honeywell Automation India ^ 114 86 32.5 196
265 Sadbhav Engineering 114 106 7.1 243
266 OCL India 114 98 16.2 364
267 HT Media 114 156 (27.0) 420
268 Hinduja Global Solutions 113 137 (17.5) 594
269 NCC 112 41 175.9 265
270 Nesco 112 81 37.8 427
271 KEC International 111 86 30.1 338
272 Aegis Logistics 109 19 463.6 382
273 Himatsingka Seide 109 59 85.8 552
274 Zydus Wellness 109 96 13.0 316
275 Suven Life Sciences 109 144 (24.6) 330
276 3M India 108 43 152.0 156
277 Solar Industries India 108 84 28.7 215
278 Monsanto India 106 123 (13.5) 251
279 Entertainment Network (India) 106 83 27.0 334
280 Infinite Computer Solutions (India) 105 58 80.9 685
281 HSIL 104 56 85.3 395
282 TVS Srichakra 104 47 118.7 467
283 Tata Coffee 104 107 (2.6) 469
284 Relaxo Footwears 103 66 57.0 234
285 Force Motors 101 78 30.5 390
286 Goodyear India @ 101 94 7.6 540
287 Raymond 101 88 14.9 369
288 Grindwell Norton 101 82 22.7 289
289 Pfizer 100 221 (54.6) 158
290 Trent 100 54 84.4 287
291 Symphony ## 99 63 57.7 189
292 Kitex Garments 99 57 71.7 301
293 Sharda Cropchem 98 89 10.3 353
294 Allcargo Logistics 97 56 73.7 298
295 JK Lakshmi Cement 96 93 2.8 288
296 Granules India 95 81 17.6 438
297 J Kumar Infraprojects 94 84 12.3 410
298 Dhanuka Agritech ^^ 93 64 44.5 360
299 Hinduja Ventures 93 82 12.9 662
300 TTK Prestige 92 112 (17.4) 268
COMPANY NET PROFIT ( ` CRORE) BT 1000 PROFIT 2014/15 2013/14 Growth RANK RANK % 2015
164 BUSINESS TODAY November 8 2015


BT
For the keys to symbols used, see footnotes in the main tables starting page 102; The list excludes BFSI companies; Standalone data Source: CMIE Prowess
INDIA’S MOST VALUABLE COMPANIES/ NET PROFIT TOP 500
301 Bodal Chemicals 92 31 200.2 951
302 Tata Sponge Iron 92 101 (9.2) 655
303 VRL Logistics 91 57 60.0 344
304 Triveni Turbine 91 68 33.1 306
305 VA Tech Wabag 90 89 2.1 297
306 Tata Elxsi 90 75 19.3 267
307 Skipper 89 27 231.4 483
308 Puravankara Projects 85 106 (19.5) 478
309 Lloyd Electric & Engg. 85 77 10.0 701
310 Techno Electric & Engg. Co. 85 70 21.0 370
311 RSWM 84 98 (14.3) 741
312 Sterlite Technologies 84 50 67.8 347
313 Gujarat Ambuja Exports 84 112 (24.6) 768
314 Shilpa Medicare 84 81 4.0 313
315 Kalyani Steels 83 59 42.2 781
316 VST Tillers Tractors ^^ 83 49 70.8 548
317 Indoco Remedies 83 58 43.0 333
318 Graphite India 82 171 (51.9) 496
319 Srikalahasthi Pipes 82 39 112.4 659
320 Hindustan Construction Co. 82 81 1.3 447
321 Greaves Cotton 82 113 (27.9) 335
322 EIH 81 95 (14.5) 222
323 TV Today Network 81 61 32.1 545
324 Noida Toll Bridge Co. 81 55 47.6 797
325 Timken India 81 45 80.3 293
325 Gateway Distriparks 81 37 117.7 305
327 MBL Infrastructures 80 75 6.7 575
328 Novartis India 79 99 (19.7) 401
329 Mahindra Holidays & Resorts India 79 95 (16.4) 396
330 Siyaram Silk Mills 79 64 22.4 607
331 Deepak Fertilisers & Petro. Corpn. 78 244 (67.9) 562
332 Hitachi Home & Life Solutions (India) 78 8 866.0 292
333 Mahindra CIE Automotive 78 18 332.2 187
334 Aarti Drugs 78 62 25.7 488
335 Gulf Oil Lubricants India 77 (0.01) (7,74,200.0) 404
336 Accelya Kale Solutions * 77 90 (13.7) 506
337 Geometric 76 58 31.8 665
338 Transport Corporation of India 76 62 22.5 448
339 Munjal Showa 76 70 8.5 705
340 Mastek 75 28 167.7 762
341 R Systems International @ 75 37 105.3 646
342 Sunteck Realty 75 138 (45.5) 479
343 Ramkrishna Forgings 75 8 784.5 472
344 Escorts 75 245 (69.5) 475
345 CCL Products (India) 75 73 1.9 373
346 Future Retail 74 3 2,535.6 272
347 KNR Constructions 73 61 19.7 512
348 Electrosteel Castings 73 101 (27.7) 727
349 Patel Engineering 72 123 (41.6) 769
350 Sundaram-Clayton 71 54 32.6 304
COMPANY NET PROFIT ( ` CRORE) BT 1000 PROFIT 2014/15 2013/14 Growth RANK RANK % 2015
351 Mangalore Chemicals & Fertilizers ^^ 71 67 6.5 700
352 V-Guard Industries 71 70 0.8 362
353 Time Technoplast 70 79 (10.9) 577
354 PNC Infratech ^^ 70 79 (11.3) 414
355 Brigade Enterprises 70 90 (22.0) 480
356 Technocraft Industries (India) 70 80 (12.7) 760
357 Astral Poly Technik 69 77 (10.8) 254
358 BS 69 63 9.4 529
359 Praj Industries 69 62 9.8 514
360 JB Chemicals & Pharmaceuticals ^^ 68 85 (19.4) 430
361 Mayur Uniquoters 68 57 20.5 445
362 Cera Sanitaryware 68 52 30.3 368
363 Radico Khaitan 68 71 (5.1) 560
364 Hindustan Copper 68 286 (76.4) 235
365 Geojit BNP Paribas Financial Services 68 (77) (187.2) 566
366 Marksans Pharma 67 56 20.8 342
367 HIL 67 7 837.7 832
368 Kewal Kiran Clothing 66 67 (1.2) 374
369 Ingersoll-Rand (India) 66 67 (1.2) 356
370 Nectar Lifesciences 66 62 6.0 678
371 Rupa & Co. 66 62 5.9 387
372 KSB Pumps @ 65 60 9.5 432
373 Huhtamaki PPL @ 65 55 18.5 450
374 Excel Crop Care 64 67 (4.1) 618
375 Unichem Laboratories 64 177 (63.6) 436
375 LG Balakrishnan & Bros. 64 54 18.5 688
377 McLeod Russel India 64 210 (69.6) 400
378 Prime Focus *@ 64 (59) (207.7) 538
379 Simplex Infrastructures 62 61 3.1 456
380 Dredging Corporation of India 62 38 66.2 588
381 Phoenix Mills 62 153 (59.5) 240
382 Nucleus Software Exports 61 55 10.3 672
383 Astra Microwave Products 61 51 19.2 615
384 RS Software (India) 60 51 18.1 872
385 Bliss GVS Pharma 60 54 11.3 497
385 Gabriel India 60 43 40.9 556
387 Monte Carlo Fashions 60 54 9.9 573
388 Heidelberg Cement India ^ 60 (41) (246.2) 482
389 Mandhana Industries ^^ 59 65 (9.3) 656
390 Vesuvius India @ 59 65 (9.2) 518
391 MPS 59 43 35.1 485
392 Dishman Pharma & Chemicals 58 87 (32.6) 507
393 Jai Corp 58 78 (25.4) 606
394 Vindhya Telelinks 58 21 177.3 667
395 Tree House Education & Accessories 58 44 31.3 470
396 Nocil 57 24 140.3 712
397 Elgi Equipments 56 78 (27.9) 429
398 Sarda Energy & Minerals 56 75 (25.9) 875
399 Insecticides (India) 55 40 37.3 610
400 Maharashtra Scooters 55 48 15.0 563
COMPANY NET PROFIT ( ` CRORE) BT 1000 PROFIT 2014/15 2013/14 Growth RANK RANK % 2015
166 BUSINESS TODAY November 8 2015


BT
For the keys to symbols used, see footnotes in the main tables starting page 102; The list excludes BFSI companies; Standalone data Source: CMIE Prowess
INDIA’S MOST VALUABLE COMPANIES/ NET PROFIT TOP 500
401 Surya Roshni 54 53 1.4 808
402 Seamec 54 1 5,044.8 931
403 Deepak Nitrite 53 38 39.4 715
404 Shreyas Shipping & Logistics 53 -8 (757.0) 542
405 Minda Industries 53 27 96.2 668
406 Genus Power Infrastructures 53 60 (12.1) 720
407 Essel Propack 53 54 (2.8) 421
408 Orient Refractories 53 53 (0.0) 590
409 NRB Bearings 52 38 36.4 576
410 Swaraj Engines 52 67 (22.6) 583
411 Nandan Denim 51 39 30.8 856
412 Oriental Carbon & Chemicals 51 40 26.9 810
413 Ambika Cotton Mills 51 48 6.3 814
414 Wonderla Holidays 51 40 26.9 502
415 MM Forgings 51 29 72.4 687
416 Man Infraconstruction 51 29 77.0 592
417 ICRA 50 59 (14.1) 282
418 Asahi India Glass 50 (40) (224.8) 314
419 Optiemus Infracom ^^ 50 31 63.7 969
420 IFB Industries 50 22 130.2 422
421 Sanghi Industries ## 50 46 8.1 551
422 Mercator 50 9 438.0 852
423 Jain Irrigation Systems 49 4 1,166.4 358
424 Navin Fluorine International 49 51 (2.5) 601
425 Madhucon Projects 49 32 55.5 850
426 Apar Industries 49 69 (28.3) 516
427 Kothari Products 49 42 16.6 881
428 Kirloskar Ferrous Industries 49 40 23.7 698
429 Jindal Drilling & Inds. ^^ 49 66 (25.3) 864
430 Borosil Glass Works 49 37 32.3 766
431 Eveready Industries (India) 49 14 260.5 416
432 Igarashi Motors India 49 46 6.1 473
433 Mirza International 49 43 14.3 641
434 MMTC 48 19 157.0 260
435 VIP Industries 48 58 (18.0) 539
436 Finolex Industries 48 170 (71.9) 328
437 Atlanta 47 42 10.9 877
438 Sandesh ^^ 46 58 (20.5) 866
439 Ashiana Housing 46 21 112.9 424
440 Alkyl Amines Chemicals 45 43 5.9 761
441 Kirloskar Industries 45 47 (4.6) 780
442 Suprajit Engineering 45 48 (6.4) 492
443 Tinplate Co. of India 45 63 (29.0) 748
444 Somany Ceramics 44 28 58.3 508
445 Manali Petrochemicals 44 29 51.4 928
446 Kolte Patil Developers 44 46 (5.9) 509
446 KSE 44 15 183.9 998
448 Merck @ 43 56 (22.7) 527
449 Garware-Wall Ropes 43 27 61.5 817
450 Poly Medicure ^^ 43 24 79.2 437
COMPANY NET PROFIT ( ` CRORE) BT 1000 PROFIT 2014/15 2013/14 Growth RANK RANK % 2015
451 Welspun Syntex 43 20 117.1 991
452 Nilkamal 42 40 6.1 597
453 Sudarshan Chemical Inds. 42 34 23.2 710
454 Opto Circuits (India) ^^ 42 241 (82.5) 846
455 BGR Energy Systems 42 110 (61.5) 669
456 Banco Products (India) 42 68 (38.4) 673
457 Asian Star Co. 42 41 2.7 521
458 Shemaroo Entertainment 42 28 50.2 736
459 La Opala RG 42 30 39.4 388
460 Indian Hume Pipe Co. 42 24 72.8 676
461 Shasun Pharmaceuticals 41 35 17.4 406
462 Sequent Scientific 41 (114) (136.1) 361
463 Shoppers Stop 41 37 10.1 337
464 Atul Auto 41 30 36.2 604
465 Excel Industries 41 17 132.0 937
466 Hikal 41 64 (36.8) 595
467 Sangam (India) ^^ 41 51 (21.1) 742
468 Omaxe 40 62 (35.5) 393
469 Jay Bharat Maruti 40 17 142.0 989
470 Steel Strips Wheels 39 24 61.9 843
471 Hatsun Agro Products 39 82 (52.1) 299
472 HEG 39 87 (55.0) 697
473 Talwalkars Better Value Fitness 39 33 16.3 670
474 SRS 39 43 (9.2) 937
475 Kovai Medical Center & Hospital 39 24 63.2 695
476 Honda Siel Power Products 39 19 105.6 554
477 Marathon Nextgen Realty 38 36 5.3 962
478 Wim Plast 38 33 18.0 585
479 Munjal Auto Industries 38 48 (20.2) 905
480 Fiem Industries ^^ 37 27 36.9 719
481 Aditya Birla Chemicals (India) 37 50 (25.0) 826
482 Agro Tech Foods 37 43 (13.5) 510
483 V-Mart Retail 37 25 47.7 634
484 SML Isuzu 37 17 112.3 461
485 Sunil Hitech Engineers 37 25 47.7 925
486 Century Enka 37 63 (41.9) 901
487 Pratibha Industries ^^ 37 95 (61.6) 895
488 Balaji Amines 36 34 8.5 919
489 Sharda Motor Inds. 36 15 140.7 793
490 Supreme Petrochem * 36 31 16.7 643
491 SMS Pharmaceuticals 35 20 72.9 828
492 Styrolution ABS (India) ^ 35 51 (30.7) 555
493 Minda Corporation 35 22 60.2 465
494 ZF Steering Gear (India) 34 14 144.5 579
495 Kei Industries 34 12 195.3 740
496 Everest Industries 34 9 273.9 825
497 Empire Industries 34 36 (5.8) 605
498 Ricoh India 34 17 96.7 332
499 Responsive Industries 33 51 (34.7) 346
499 Elecon Engineering Co. 33 27 21.0 675
COMPANY NET PROFIT ( ` CRORE) BT 1000 PROFIT 2014/15 2013/14 Growth RANK RANK % 2015
168 BUSINESS TODAY November 8 2015


BT
For the keys to symbols used, see footnotes in the main tables starting page 102; The list excludes BFSI companies; Standalone data Source: CMIE Prowess
INDIA’S MOST VALUABLE COMPANIES/ DEBT TOP 100
1 Reliance Industries 97,620 89,968 8.5 2
2 Power Grid Corpn. of India 95,045 83,170 14.3 28
3 NTPC 86,541 67,173 28.8 21
4 Indian Oil Corpn. 55,248 86,263 (36.0) 22
5 Bhushan Steel 39,659 35,328 12.3 535
6 Vedanta 37,659 38,945 (3.3) 46
7 Reliance Communications 31,751 33,633 (5.6) 113
8 Steel Authority of India 29,898 25,281 18.3 86
9 Hindalco Industries 29,007 27,020 7.4 92
10 JSW Steel 28,899 27,949 3.4 99
11 Jindal Steel & Power 28,315 24,369 16.2 172
12 Tata Steel 28,198 27,917 1.0 68
13 Jaiprakash Associates ^^ 28,159 24,349 15.6 323
14 Idea Cellular 25,889 19,377 33.6 36
15 Videocon Industries # 24,272 23,390 3.8 248
16 Essar Oil 24,071 23,845 0.9 97
17 Adani Power 24,007 25,282 (5.0) 164
18 Jaiprakash Power Ventures 23,036 20,541 12.1 425
19 Bharti Airtel 21,570 10,365 108.1 13
20 Tata Motors 21,321 15,302 39.3 19
21 Hindustan Petroleum Corpn. 20,335 32,166 (36.8) 85
22 NHPC 19,836 19,866 (0.2) 101
23 Reliance Infrastructure 16,814 14,842 13.3 154
24 Mahanagar Telephone Nigam 16,604 14,210 16.8 574
25 Alok Industries @@@ 15,540 16,030 (3.1) 627
26 Bharat Petroleum Corpn. 13,098 20,322 (35.5) 34
27 Larsen & Toubro 12,937 11,459 12.9 14
28 Tata Power Co. 12,538 12,675 (1.1) 103
29 DLF 12,058 13,900 (13.2) 98
30 Jet Airways (India) 11,911 10,457 13.9 294
31 Adani Ports & Special Economic Zone 11,768 8,909 32.1 30
32 Jindal Stainless ^^ 11,255 10,900 3.3 649
33 Suzlon Energy 11,125 10,153 9.6 148
34 Electrosteel Steels 10,317 8,398 22.9 671
35 GAIL (India) 9,556 10,268 (6.9) 48
36 Mangalore Refinery & Petrochemicals 9,032 9,793 (7.8) 136
37 Jaypee Infratech 8,915 8,436 5.7 433
38 Oil India 8,341 9,783 (14.7) 71
39 IL&FS Transportation Networks 7,816 5,001 56.3 322
40 Amtek Auto ** 7,779 6,757 15.1 355
41 National Fertilizers 7,645 7,558 1.1 533
42 Tata Teleservices (Maharashtra) 7,416 6,522 13.7 523
43 UltraTech Cement 7,414 5,199 42.6 24
44 ABG Shipyard 7,310 5,384 35.8 623
45 Bajaj Hindusthan Sugar 7,284 6,275 16.1 559
46 Lanco Infratech 6,864 5,771 19.0 598
47 Shipping Corpn. of India 6,833 8,257 (17.2) 372
48 RattanIndia Power 6,617 5,619 17.8 409
49 Pipavav Defence & Offshore Engg. 6,354 5,221 21.7 273
50 Century Textiles & Industries 6,139 5,679 8.1 209
COMPANY DEBT ( ` CRORE) BT 1000 DEBT 2014/15 2013/14 Growth RANK RANK % 2015
51 Wipro 6,103 4,583 33.2 15
52 Adani Enterprises 6,024 6,577 (8.4) 65
53 Castex Technologies ** 5,679 4,266 33.1 281
54 Torrent Power 5,655 6,162 (8.2) 191
55 Unitech 5,610 5,944 (5.6) 384
56 GMR Infrastructure 5,434 6,358 (14.5) 188
57 Chennai Petroleum Corpn. 5,399 5,600 (3.6) 402
58 Bombay Rayon Fashions 5,342 4,667 14.5 462
59 CESC 5,234 4,030 29.9 194
60 Punj Lloyd 5,227 5,332 (2.0) 652
61 Gitanjali Gems 5,142 4,962 3.6 899
62 Hindustan Construction Co. 5,078 4,817 5.4 447
63 Hotel Leelaventure 5,051 4,969 1.6 639
64 GTL Infrastructure 4,958 5,058 (2.0) 803
65 IVRCL 4,920 4,054 21.4 784
66 United Spirits ^^ 4,901 4,382 11.9 40
67 Future Retail 4,823 6,268 (23.1) 272
68 Jindal Saw 4,795 3,457 38.7 443
69 Kesoram Industries ^^ 4,625 4,807 (3.8) 587
70 Reliance Power 4,496 3,764 19.5 127
71 JSW Energy 4,232 4,939 (14.3) 115
72 Patel Engineering 4,117 3,516 17.1 769
73 Jayaswal Neco Industries 4,097 3,656 12.1 813
74 Sintex Industries 3,966 3,518 12.7 261
75 Chambal Fertilisers & Chemicals 3,950 4,547 (13.1) 383
76 Piramal Enterprises 3,862 5,893 (34.5) 110
77 Gujarat Narmada Valley Fert. & Chem. 3,844 3,904 (1.5) 609
78 Rajesh Exports 3,827 3,089 23.9 150
79 Essar Shipping 3,762 3,833 (1.9) 890
80 Mahindra & Mahindra 3,728 4,045 (7.8) 26
81 Aditya Birla Nuvo 3,688 3,753 (1.7) 88
82 Usha Martin 3,685 3,446 6.9 775
83 Ruchi Soya Inds. 3,656 2,943 24.2 543
84 Shree Renuka Sugars 3,553 3,887 (8.6) 629
85 Orchid Chemicals & Pharma #@# 3,414 1,996 71.0 841
86 Ashok Leyland 3,350 4,690 (28.6) 95
87 Aurobindo Pharma 3,285 2,925 12.3 50
88 Simplex Infrastructures 3,250 2,938 10.6 456
89 Indian Hotels Co. 3,209 2,691 19.3 184
90 India Cements ^^ 3,202 3,023 5.9 375
91 Neyveli Lignite Corpn. 3,164 3,150 0.4 130
92 Uttam Galva Steels 3,132 2,857 9.6 773
93 Dr. Reddy’s Laboratories 3,126 2,666 17.2 33
94 Jain Irrigation Systems 3,084 2,939 4.9 358
95 Great Eastern Shipping Co. 3,069 3,312 (7.3) 238
96 Indiabulls Real Estate 2,829 1,771 59.8 381
97 Arvind 2,750 2,417 13.8 203
98 Tata Chemicals 2,716 3,035 (10.5) 145
99 Ramco Cements 2,712 2,910 (6.8) 185
100 Petronet LNG 2,654 3,267 (18.8) 124
COMPANY DEBT ( ` CRORE) BT 1000 DEBT 2014/15 2013/14 Growth RANK RANK % 2015
172 BUSINESS TODAY November 8 2015


●3 156 3M India 108
● 8 620 8K Miles Software Services 126
● A
488 Aarti Drugs 120331 Aarti Industries 114446 Aban Offshore 11870 ABB India 104166 Abbott India 108623 ABG Shipyard 12676 ACC 104506 Accelya Kale Solutions 122894 Action Constn. Equipment 13465 Adani Enterprises 10430 Adani Ports & SEZ 102164 Adani Power 108324 Adani Transmission 114729 Adhunik Industries 130940 Adi Finechem 136826 Aditya Birla Chemicals (India) 13388 Aditya Birla Nuvo 104557 Adlabs Entertainment 124955 Ador Welding 138264 Advanta 112382 Aegis Logistics 116985 AGC Networks 138510 Agro Tech Foods 122487 Ahluwalia Contracts (India) 120161 AIA Engineering 108129 Ajanta Pharma 106859 Ajmera Realty & Infra India 134218 Akzo Nobel India 110591 Alembic 124137 Alembic Pharmaceuticals 106948 Alicon Castalloy 136761 Alkyl Amines Chemicals 132242 Allahabad Bank 110298 Allcargo Logistics 112627 Alok Industries 126851 Alps Motor Finance 134253 Alstom India 112123 Alstom T & D India 106118 Amara Raja Batteries 106814 Ambika Cotton Mills 13355 Ambuja Cements 104735 Amrutanjan Health Care 130355 Amtek Auto 116571 Anant Raj 124277 Andhra Bank 112722 Andrew Yule & Co. 130980 Ansal Properties & Infra 138725 Anuh Pharma 130516 Apar Industries 122815 Apcotex Industries 133603 APL Apollo Tubes 126747 Aplaya Creations 130104 Apollo Hospitals Enterprise 106165 Apollo Tyres 108
635 Appu Mkt. & Manufacturing 126703 Arcotech 130711 Arihant Multi Commercial 130823 Arrow Coated Products 133831 Arshiya 133203 Arvind 110314 Asahi India Glass 114853 Ashapura Intimates Fashion 134809 Ashapura Minechem 133424 Ashiana Housing 11895 Ashok Leyland 104336 Ashoka Buildcon 11427 Asian Paints 102521 Asian Star Co. 122903 Astec Lifesciences 136615 Astra Microwave Products 126254 Astral Poly Technik 112371 Astrazeneca Pharma India 116877 Atlanta 134752 Atlas Jewellery India 132309 Atul 114604 Atul Auto 126902 Aurionpro Solutions 13650 Aurobindo Pharma 102584 Automotive Axles 124449 Avanti Feeds 118827 AVT Natural Products 13317 Axis Bank 102717 Axiscades Engg. Technologies 130
● B
32 Bajaj Auto 102207 Bajaj Corp 110379 Bajaj Electricals 11683 Bajaj Finance 10481 Bajaj Finserv 104559 Bajaj Hindusthan Sugar 124112 Bajaj Holdings & Invst. 106919 Balaji Amines 136838 Balaji Telefilms 133206 Balkrishna Industries 110626 Ballarpur Industries 126474 Balmer Lawrie & Co. 120764 Balmer Lawrie Invsts. 132578 Balrampur Chini Mills 124673 Banco Products (India) 12854 Bank of Baroda 104135 Bank of India 106300 Bank of Maharashtra 112990 Bannari Amman Spg. Mills 138642 Bannari Amman Sugars 126250 BASF India 110200 Bata India 108122 Bayer Cropscience 106247 BEML 110871 Bengal & Assam Co. 134120 Berger Paints India 106770 BF Invst. 132415 BF Utilities 118669 BGR Energy Systems 128950 Bharat Bijlee 13672 Bharat Electronics 10479 Bharat Forge 104
37 Bharat Heavy Electricals 10234 Bharat Petroleum Corpn. 102889 Bharat Rasayan 13413 Bharti Airtel 10225 Bharti Infratel 102805 Bhartiya International 133535 Bhushan Steel 122972 Binny 138170 Biocon 108329 Birla Corporation 114497 Bliss G V S Pharma 120116 Blue Dart Express 106349 Blue Star 114951 Bodal Chemicals 138325 Bombay Burmah Trdg. Corpn. 114520 Bombay Dyeing & Mfg. Co. 122462 Bombay Rayon Fashions 120766 Borosil Glass Works 13229 Bosch 102480 Brigade Enterprises 12061 Britannia Industries 104529 BS 122999 Butterfly Gandhimathi App. 138734 Byke Hospitality 130
● C
53 Cadila Healthcare 10459 Cairn India 104631 Camlin Fine Sciences 126442 Can Fin Homes 118111 Canara Bank 106315 Capital First 114869 Capital Trade Links 134463 Caplin Point Laboratories 120818 Capri Global Capital 133339 Carborundum Universal 114281 Castex Technologies 11293 Castrol India 104481 CCL International 120373 CCL Products (India) 116320 Ceat 114107 Central Bank of India 106757 Centrum Capital 132637 Centum Electronics 126901 Century Enka 136280 Century Plyboards (India) 112209 Century Textiles & Inds. 110368 Cera Sanitaryware 116194 CESC 108383 Chambal Fertilisers & Chem 116704 Channel Nine Entertainment 130402 Chennai Petroleum Corpn. 118169 Cholamandalam Invst. & Fin. 108612 Cigniti Technologies 12639 Cipla 102228 City Union Bank 110419 Clariant Chemicals (India) 118537 Claris Lifesciences 122225 CMC 1106 Coal India 10275 Colgate-Palmolive (India) 10462 Container Corpn. of India 104208 Coromandel International 110
274 Corporation Bank 112262 Cox & Kings 112285 Credit Analysis & Research 112121 Crisil 106147 Crompton Greaves 10678 Cummins India 104221 Cyient 110
● D
44 Dabur India 102258 Dalmia Bharat 112943 Datamatics Global Services 136219 DB Corp 110501 DB Realty 122311 DCB Bank 114452 DCM Shriram 120897 DCW 134562 Deepak Fert. & Petrochem 124715 Deepak Nitrite 130459 Delta Corp 120394 Den Networks 116386 Dena Bank 116214 Dewan Housing Finance Corpn. 110829 DFM Foods 133790 Dhanlaxmi Bank 132873 Dhanleela Invst. & Trdg. Co. 134360 Dhanuka Agritech 116978 Dhyana Finstock 138860 DIC India 134906 Dion Global Solutions 136724 Disa India 130149 Dish T V India 106507 Dishman Pharma & Chemicals 12282 Divis Laboratories 10498 DLF 104731 D-Link (India) 13033 Dr. Reddy’s Laboratories 102588 Dredging Corpn. Of India 124806 Dwitiya Trading 133453 Dynamatic Technologies 120
● E
256 eClerx Services 112581 Eco Friendly Food Proc. Park 124252 Edelweiss Financial Services 11242 Eicher Motors 102378 EID-Parry (India) 116222 EIH 110750 EIH Associated Hotels 130628 Elantas Beck India 126675 Elecon Engineering Co. 128727 Electrosteel Castings 130671 Electrosteel Steels 128429 Elgi Equipments 118888 Elpro International 13484 Emami 104605 Empire Industries 126202 Engineers India 110334 Entertainment Network (India) 114879 EPC Industrie 134263 Eros International Media 112611 Esab India 126475 Escorts 120
176 BUSINESS TODAY November 8 2015
BT 1000 COMPANY PAGE BT 1000 COMPANY PAGE BT 1000 COMPANY PAGE BT 1000 COMPANY PAGERANK RANK RANK RANK
ALPHABETICAL INDEX OF COMPANIES RANKED
INDIA’S MOST VALUABLE COMPANIES INDEX

633 Ess Dee Aluminium 12697 Essar Oil 104269 Essar Ports 112890 Essar Shipping 134421 Essel Propack 118664 Esteem Bio Organic Food Proc. 128416 Eveready Industries (India) 118825 Everest Industries 133618 Excel Crop Care 126937 Excel Industries 136125 Exide Industries 106
● F
197 FAG Bearings India 108348 FDC 114138 Federal Bank 106413 Federal-Mogul Goetze (India) 118499 Fert. & Chemicals. Travancore 120719 Fiem Industries 130721 Financial Technologies (India) 130957 Fineotex Chemical 138303 Finolex Cables 114328 Finolex Industries 114439 Firstsource Solutions 118771 Flexituff International 132435 Forbes & Co. 118390 Force Motors 116183 Fortis Healthcare 108796 Fortune Fin. Services (India) 132682 Foseco India 128708 Fulford (India) 130408 Future Consumer Enterprise 118519 Future Lifestyle Fashions 122272 Future Retail 112
● G
556 Gabriel India 12448 GAIL (India) 102561 Gallantt Ispat 124582 Gammon Infra Projects 124912 Gandhi Special Tubes 136933 Ganesh Housing Corpn. 136817 Garware-Wall Ropes 133305 Gateway Distriparks 114490 Gati 120614 Gayatri Projects 126763 GCM Securities 132720 Genus Power Infrastructures 130566 Geojit BNP Paribas Fin. Services 124665 Geometric 128632 GHCL 126567 GIC Housing Finance 124117 Gillette India 106899 Gitanjali Gems 134954 GKW 13880 GSK Consumer Healthcare 10467 GSK Pharmaceuticals 10473 Glenmark Pharmaceuticals 104992 Global Infratech & Finance 138504 Global Offshore Services 122679 Globus Power Generation 128904 GMM Pfaudler 136188 GMR Infrastructure 108365 Godfrey Phillips India 11651 Godrej Consumer Products 104132 Godrej Industries 106236 Godrej Properties 110765 Goenka Business & Finance 132
423 Goldline International Finvest 118984 Goodricke Group 138540 Goodyear India 122986 Grandma Trading & Agencies 138438 Granules India 118496 Graphite India 12060 Grasim Industries 104921 Grauer & Weil (India) 136238 Great Eastern Shipping Co. 110335 Greaves Cotton 114397 Greencrest Financial Services 116640 Greenlam Industries 126412 Greenply Industries 118289 Grindwell Norton 112175 Gruh Finance 108803 GTL Infrastructure 133547 Gujarat Alkalies & Chemicals 122768 Gujarat Ambuja Exports 132192 Gujarat Fluorochemicals 108549 Gujarat Industries Power Co. 122352 Gujarat Mineral Dev. Corpn. 116609 GNVFC 126977 Gujarat Natural Resources 138155 Gujarat Pipavav Port 108354 Gujarat State Fert. & Chemicals 116204 Gujarat State Petronet 110699 Gulf Oil Corpn. 128404 Gulf Oil Lubricants India 118534 GVK Power & Infrastructure 122
● H
296 Hathway Cable & Datacom 112299 Hatsun Agro Products 112105 Havells India 106532 Hawkins Cookers 122550 HBL Power Systems 122636 HCL Infosystems 12616 HCL Technologies 1023 HDFC Bank 102697 HEG 128482 Heidelberg Cement India 120798 Hercules Hoists 132657 Heritage Foods 12841 Hero Motocorp 102802 Hester Biosciences 133182 Hexaware Technologies 108857 High Ground Enterprise 134595 Hikal 124832 HIL 133471 Himachal Futuristic Commn. 120728 Himadri Chemicals & Inds. 130552 Himatsingka Seide 12492 Hindalco Industries 104594 Hinduja Global Solutions 124662 Hinduja Ventures 128800 Hindustan Composites 132447 Hindustan Construction Co. 118235 Hindustan Copper 110476 Hindustan Media Ventures 120839 Hindustan Oil Exploration Co. 13385 Hindustan Petroleum Corpn. 10411 Hindustan Unilever 10231 Hindustan Zinc 102621 Hindusthan Natl. Glass & Inds. 126292 Hitachi Home Solutions (India) 112807 Hi-Tech Gears 133246 HMT 110554 Honda Siel Power Products 124
196 Honeywell Automation India 108639 Hotel Leelaventure 126302 Housing Dev. & Infrastructure 11410 Housing Dev. Finance Corpn. 102753 HPC Biosciences 132395 HSIL 116420 HT Media 118691 Hubtown 128450 Huhtamaki PPL 118
● I
12 ICICI Bank 102282 ICRA 112151 IDBI Bank 10836 Idea Cellular 10289 IDFC 104422 IFB Industries 118270 IFCI 112882 IFGL Refractories 134983 IG Petrochemicals 138473 Igarashi Motors India 120231 IIFL Holdings 110645 IL&FS Engg. & Construction 126758 IL&FS Investment Managers 132322 IL&FS Transportation Networks 114854 Indag Rubber 134375 India Cements 116776 India Motor Parts & Accessories 132863 India Nippon Electricals 134525 India Power Corpn. 122494 India Tourism Devp. Corpn. 12090 Indiabulls Housing Finance 104381 Indiabulls Real Estate 116600 Indiabulls Ventures 124201 Indian Bank 110184 Indian Hotels Co. 108676 Indian Hume Pipe Co. 128874 Indian Metals & Ferro Alloys 13422 Indian Oil Corpn. 102255 Indian Overseas Bank 112858 Indian Terrain Fashions 134366 Indo Count Inds. 116964 Indo- National 138868 Indo Rama Synthetics (India) 134333 Indoco Remedies 114844 Indosolar 133220 Indraprastha Gas 110804 Indraprastha Medical Corpn. 13343 Indusind Bank 102685 Infinite Comp. Solutions (India) 128160 Info Edge (India) 1087 Infosys 102356 Ingersoll-Rand (India) 116454 Inox Leisure 120167 Inox Wind 108610 Insecticides (India) 126536 Intellect Design Arena 122553 International Paper APPM 124794 Intrasoft Technologies 132959 IOL Chemicals & Pharma 138936 Ion Exchange (India) 136176 Ipca Laboratories 108180 IRB Infrastructure Developers 108279 Isgec Heavy Engg. 112968 IST 1384 ITC 102572 ITD Cementation India 124730 ITI 130
784 IVRCL 132
● J
410 J Kumar Infraprojects 118693 Jackson Investments 128284 Jagran Prakashan 112606 Jai Corp 126358 Jain Irrigation Systems 116323 Jaiprakash Associates 114425 Jaiprakash Power Ventures 118249 Jammu & Kashmir Bank 110663 Jamna Auto Inds. 128989 Jay Bharat Maruti 138813 Jayaswal Neco Inds. 133433 Jaypee Infratech 118430 JB Chemicals & Pharma 118491 JBF Industries 120683 JBM Auto 128294 Jet Airways (India) 112864 Jindal Drilling & Inds. 134544 Jindal Poly Films 122443 Jindal Saw 118649 Jindal Stainless 126172 Jindal Steel & Power 108276 JK Cement 112288 JK Lakshmi Cement 112837 JK Paper 133399 JK Tyre & Inds. 116310 JM Financial 114785 JMC Projects (India) 132515 JMT Auto 122115 JSW Energy 106565 JSW Holdings 12499 JSW Steel 104144 Jubilant Foodworks 106312 Jubilant Life Sciences 114186 Just Dial 108244 Jyothy Laboratories 110
● K
883 Kailash Auto Finance 134224 Kajaria Ceramics 110993 Kalpa Commercial 138308 Kalpataru Power Transmission 114599 Kalyani Investment Co. 124781 Kalyani Steels 132694 Kama Holdings 128131 Kansai Nerolac Paints 106391 Karnataka Bank 116229 Karur Vysya Bank 110245 Kaveri Seed Co. 110498 Kaya 120660 KCP 128338 KEC International 114740 Kei Industries 130979 Kellton Tech Solutions 138458 Kennametal India 120587 Kesoram Industries 124374 Kewal Kiran Clothing 116484 Kirloskar Brothers 120426 Kirloskar Brothers Invst. 118698 Kirloskar Ferrous Inds. 128780 Kirloskar Industries 132290 Kirloskar Oil Engines 112739 Kirloskar Pneumatic Co. 130301 Kitex Garments 114512 KNR Constructions 122613 Kokuyo Camlin 126
BT 1000 COMPANY PAGE BT 1000 COMPANY PAGE BT 1000 COMPANY PAGE BT 1000 COMPANY PAGERANK RANK RANK RANK

509 Kolte Patil Developers 12218 Kotak Mahindra Bank 102881 Kothari Products 134695 Kovai Medical Center & Hospital 128411 KPIT Technologies 118392 KPR Mill 116295 KRBL 112745 Kridhan Infra 130432 KSB Pumps 118998 KSE 138451 KSK Energy Ventures 120926 Kushal Tradelink 136531 Kwality 122
● L
140 L&T Finance Holdings 106388 La Opala RG 116283 Lakshmi Machine Works 112477 Lakshmi Vilas Bank 120598 Lanco Infratech 12414 Larsen & Toubro 102688 LG Balakrishnan & Bros. 128900 Liberty Shoes 13494 LIC Housing Finance 104345 Linde India 114701 Lloyd Electric & Engg. 130845 Lovable Lingerie 133886 LT Foods 134934 Lumax Auto Technologies 136949 Lumax Industries 13623 Lupin 102505 Lycos Internet 122
● M
751 Maa Jagdambe Tradelinks 132850 Madhucon Projects 133431 Magma Fincorp 118574 Mahanagar Telephone Nigam 124820 Mahanivesh (India) 133563 Maharashtra Scooters 124546 Maharashtra Seamless 12226 Mahindra & Mahindra 102119 M&M Financial Services 106187 Mahindra CIE Automotive 108396 Mahindra Holi & Resorts India 116455 Mahindra Lifespace Developers 120706 Majesco 130833 Man Industries (India) 133592 Man Infraconstruction 124975 Manaksia 138928 Manali Petrochemicals 136398 Manappuram Finance 116656 Mandhana Industries 128733 Mangalam Cement 130363 Mangalam Industrial Finance 116700 Mangalore Chem. & Fertilizers 128136 Mangalore Ref. & Petrochem 106444 Manpasand Beverages 118930 Mapro Industries 136962 Marathon Nextgen Realty 13877 Marico 104342 Marksans Pharma 11420 Maruti Suzuki India 102762 Mastek 132128 Max India 106898 Maxwell Industries 134
445 Mayur Uniquoters 118575 MBL Infrastructures 124400 Mcleod Russel India 116935 Mcnally Bharat Engg. Co. 136714 Media Matrix Worldwide 130848 Meghmani Organics 133644 MEP Infrastructure Developers 126852 Mercator 134527 Merck 122811 Metalyst Forgings 133465 Minda Corporation 120668 Minda Industries 128142 Mindtree 106641 Mirza International 126687 MM Forgings 128260 MMTC 112738 Modi Udyog 130291 MOIL 112251 Monsanto India 112573 Monte Carlo Fashions 124759 Morepen Laboratories 13249 Motherson Sumi Systems 102278 Motilal Oswal Financial Services 112178 Mphasis 108485 MPS 120109 MRF 106696 MSR India 128862 MT Educare 134788 Mukand 132237 Multi Commodity Exch. of India 110994 Multibase India 138905 Munjal Auto Inds. 136705 Munjal Showa 130193 Muthoot Finance 108
● N
909 Nahar Spinning Mills 136965 Nalwa Sons Invsts. 138856 Nandan Denim 134190 Natco Pharma 108153 National Aluminium Co. 108146 NBCC 106533 National Fertilizers 122952 National Peroxide 138524 Nava Bharat Ventures 122601 Navin Fluorine Intl. 126405 Navneet Education 118265 NCC 112678 Nectar Lifesciences 128914 Nelcast 136427 Nesco 11835 Nestle India 102232 Network18 Media & Invst. 110892 Neuland Laboratories 134709 New Delhi Television 130130 Neyveli Lignite Corpn. 106101 NHPC 106648 NIIT 126385 NIIT Technologies 116967 Nila Infrastructures 138597 Nilkamal 124495 Nirlon 120593 Nitin Fire Protection Inds. 12447 NMDC 102712 Nocil 130797 Noida Toll Bridge Co. 132
915 North Eastern Carrying Corpn. 136401 Novartis India 118576 NRB Bearings 12421 NTPC 102672 Nucleus Software Exports 128
● O
168 Oberoi Realty 108364 OCL India 116963 OCL Iron & Steel 1385 Oil & Natural Gas Corpn. 10271 Oil India 104638 Ojas Asset Reconstruction Co. 126908 Om Metals Infraprojects 136393 Omaxe 116947 Omkar Speciality Chemicals 136624 Onmobile Global 126969 Optiemus Infracom 138846 Opto Circuits (India) 13363 Oracle Fin. Services Software 104778 Orbit Exports 132841 Orchid Chem. & Pharma. 133689 Oricon Enterprises 128982 Orient Abrasives 138319 Orient Cement 114692 Orient Green Power Co. 128795 Orient Paper & Inds. 132590 Orient Refractories 124239 Oriental Bank Of Commerce 110810 Oriental Carbon & Chemicals 133923 Oriental Hotels 136513 Orissa Minerals Dev. Co. 122746 Orissa Sponge Iron & Steel 130787 Ortel Communications 132893 Oscar Investments 134
● P
114 Page Industries 106658 Panacea Biotec 128468 Pantaloons Fashion & Retail 120651 Parsvnath Developers 128769 Patel Engineering 132205 PC Jeweller 110786 PDS Multinational Fashions 132835 Pearl Global Inds. 133718 Peninsula Land 130756 Pennar Industries 132233 Persistent Systems 110124 Petronet LNG 106158 Pfizer 108880 Phillips Carbon Black 134987 Phoenix Lamps 138240 Phoenix Mills 110171 PI Industries 10866 Pidilite Industries 104570 Pilani Invst. & Inds. Corpn. 124273 Pipavav Def. & Offshore Engg. 112110 Piramal Enterprises 106917 Plastiblends India 136824 PNB Gilts 133414 PNC Infratech 118654 Poddar Developers 128749 Pokarna 130464 Polaris Consulting & Services 120437 Poly Medicure 118
726 Polyplex Corporation 13057 Power Finance Corpn. 10428 Power Grid Corpn. of India 102514 Praj Industries 122867 Prakash Industries 134895 Pratibha Industries 134174 Prestige Estates Projects 108970 Pricol 138538 Prime Focus 122241 Prism Cement 110100 P&G Hygiene & Health Care 104847 Prozone Intu Properties 133602 PSIT Infrastructure & Services 126441 PTC India 118377 PTC India Financial Services 116652 Punj Lloyd 128466 Punjab & Sind Bank 12074 Punjab National Bank 104478 Puravankara Projects 120340 PVR 114
● R
646 R Systems International 126560 Radico Khaitan 124941 Rai Saheb Rekhchand Mohota 136530 Rain Industries 122707 Rainbow Papers 130885 Raj Television Network 134150 Rajesh Exports 106275 Rallis India 112625 Ram Minerals & Chemicals 126185 Ramco Cements 108681 Ramco Industries 128417 Ramco Systems 118472 Ramkrishna Forgings 120945 Rane (Madras) 136944 Rane Engine Valve 136650 Rane Holdings 126350 Rashtriya Chem & Fertilizers 114359 Ratnamani Metals & Tubes 116996 Rattanindia Infrastructure 138409 Rattanindia Power 118789 Ravindra Energy 132369 Raymond 116266 Redington (India) 112234 Relaxo Footwears 110163 Reliance Capital 108113 Reliance Communications 106791 Reliance Industrial Infra 1322 Reliance Industries 102154 Reliance Infrastructure 108127 Reliance Power 106230 Religare Enterprises 110286 Repco Home Finance 112836 Repro India 133346 Responsive Industries 114754 Rico Auto Inds. 132332 Ricoh India 114617 Risa International 126589 Rollatainers 124457 Rolta India 120911 Rossell India 136872 RS Software (India) 134741 RSWM 130543 Ruchi Soya Inds. 122387 Rupa & Co. 116
178 BUSINESS TODAY November 8 2015
BT 1000 COMPANY PAGE BT 1000 COMPANY PAGE BT 1000 COMPANY PAGE BT 1000 COMPANY PAGERANK RANK RANK RANK
INDIA’S MOST VALUABLE COMPANIES INDEX


180 BUSINESS TODAY November 8 2015
69 Rural Electrification Corpn. 104
● S
243 Sadbhav Engineering 110961 Safari Industries (India) 138732 Sagar Cements 130932 Saint-Gobain Sekurit India 136866 Sandesh 134821 Sandur Manganese & Iron Ores 133742 Sangam (India) 130551 Sanghi Industries 124522 Sanghvi Movers 122179 Sanofi India 108875 Sarda Energy & Minerals 134849 Saregama India 133891 Sarla Performance Fibres 134834 Sasken Commn. Technologies 133677 Savita Oil Technologies 128257 Schneider Electric Infra 112558 SE Investments 124931 Seamec 136887 Selan Exploration Technology 134361 Sequent Scientific 116743 Setco Automotive 130980 Shaily Engineering Plastics 1381000 Shakti Pumps (India) 138661 Shanthi Gears 128353 Sharda Cropchem 116793 Sharda Motor Inds. 132406 Shasun Pharmaceuticals 118736 Shemaroo Entertainment 130313 Shilpa Medicare 114855 Shilpi Cable Technologies 134372 Shipping Corpn. of India 116755 Shivam Autotech 132337 Shoppers Stop 11452 Shree Cement 104939 Shree Global Tradefin 136973 Shree Ram Urban Infra 138629 Shree Renuka Sugars 126680 Shrenuj & Co. 128542 Shreyas Shipping & Logistics 122139 Shriram City Union Finance 106783 Shriram EPC 132102 Shriram Transport Finance Co. 106666 Sical Logistics 12845 Siemens 102690 Signet Industries 128456 Simplex Infrastructures 120774 Simplex Trading & Agencies 132261 Sintex Industries 112403 Siti Cable Network 118607 Siyaram Silk Mills 126157 SJVN 108195 SKF India 108812 Skil Infrastructure 133483 Skipper 120924 SKM Egg Products Export (India) 136223 SKS Microfinance 110461 SML Isuzu 120828 SMS Pharmaceuticals 133486 Snowman Logistics 120321 Sobha 114215 Solar Industries India 110791 Som Distilleries & Breweries 132508 Somany Ceramics 122564 Sona Koyo Steering Systems 124489 Sonata Software 120
343 South Indian Bank 114913 Southern Petrochem Inds. 136702 Speciality Restaurants 130816 Spice Mobility 133541 Spicejet 122723 SQS India BFSI 130830 Sreeleathers 133440 SREI Infrastructure Finance 118210 SRF 110619 Sri Adhikari Bro. TV Network 126659 Srikalahasthi Pipes 128927 SRK Industries 136937 SRS 136958 SRS Finance 138684 SRS Real Infrastructure 128616 Stampede Capital 126327 Star Ferro & Cement 114307 State Bank of Bikaner & Jaipur 1149 State Bank of India 102418 State Bank of Mysore 118351 State Bank of Travancore 116630 State Trading Corpn. of India 12686 Steel Authority of India 104843 Steel Strips Wheels 133407 Sterling Holiday Resorts (India) 118347 Sterlite Technologies 114199 Strides Arcolab 108555 Styrolution ABS (India) 124878 Subros 134710 Sudarshan Chemical Inds. 130162 Sun Pharma Adv. Research 1088 Sun Pharmaceutical Inds. 102126 Sun TV Network 106106 Sundaram Finance 106304 Sundaram-Clayton 114317 Sundram Fasteners 114942 Sunflag Iron & Steel Co. 136925 Sunil Hitech Engineers 136428 Sunrise Asian 118966 Sunshield Chemicals 138647 Sunstar Realty Devp. 126479 Sunteck Realty 120492 Suprajit Engineering 120181 Supreme Industries 108884 Supreme Infrastructure India 134643 Supreme Petrochem 126808 Surya Roshni 133713 Sutlej Textiles & Inds. 130330 Suven Life Sciences 114148 Suzlon Energy 106960 SV Global Mill 138526 Swan Energy 122583 Swaraj Engines 124840 Swelect Energy Systems 133189 Symphony 108922 Syncom Formulations (India) 136212 Syndicate Bank 110213 Syngene International 110
● T
870 Taj GVK Hotels & Resorts 134517 Take Solutions 122670 Talwalkars Better Value Fitness 128568 Tamil Nadu Newsprint & Papers 124145 Tata Chemicals 106469 Tata Coffee 120133 Tata Communications 1061 Tata Consultancy Services 102
267 Tata Elxsi 112177 Tata Global Beverages 108341 Tata Investment Corpn. 11419 Tata Motors 102103 Tata Power Co. 106655 Tata Sponge Iron 12868 Tata Steel 104523 Tata Teleservices (Maharashtra) 122865 TCPL Packaging 134596 TD Power Systems 12438 Tech Mahindra 102370 Techno Electric & Engg. Co. 116760 Technocraft Industries (India) 132876 Texmaco Infra & Holdings 134380 Texmaco Rail & Engg. 116134 Thermax 106217 Thomas Cook (India) 110528 Tide Water Oil Co. (India) 122777 TIL 132577 Time Technoplast 124293 Timken India 112748 Tinplate Co. of India 130569 Titagarh Wagons 12464 Titan Company 10491 Torrent Pharmaceuticals 104191 Torrent Power 108842 Tourism Finance Corpn. of India 133976 Transformers & Rectifiers (India) 138448 Transport Corporation of India 118470 Tree House Edu & Accessories 120287 Trent 112918 TRF 136622 Tribhovandas Bhimji Zaveri 126493 Trident 120974 Trinity Tradelink 138819 Triveni Engineering & Inds. 133306 Triveni Turbine 114956 TTI Enterprise 138686 TTK Healthcare 128268 TTK Prestige 112198 Tube Investments of India 108545 TV Today Network 122227 Tv18 Broadcast 110143 TVS Motor Co. 106467 TVS Srichakra 120
● U
226 UCO Bank 110920 Udaipur Cement Works 136608 Uflex 126500 UFO Moviez India 120953 Ujaas Energy 13824 UltraTech Cement 102436 Unichem Laboratories 118152 Union Bank of India 108384 Unitech 116434 United Bank of India 11887 United Breweries 10440 United Spirits 10296 UPL 104775 Usha Martin 132586 Ushdev International 124773 Uttam Galva Steels 132801 Uttam Value Steels 133
● V
297 VA Tech Wabag 112896 Vadilal Industries 134
460 Vaibhav Global 120216 Vakrangee 110988 Vardhman Holdings 138259 Vardhman Textiles 112946 VB Industries 13646 Vedanta 102910 Venky'S (India) 136518 Vesuvius India 122362 V-Guard Industries 116248 Videocon Industries 110318 Vijaya Bank 114367 Vinati Organics 116667 Vindhya Telelinks 128539 VIP Industries 122772 Vipul 132799 Virtual Global Education 132503 Visagar Polytex 122929 Vishnu Chemicals 136861 Vivimed Labs 134634 V-Mart Retail 126716 Voltamp Transformers 130159 Voltas 108344 VRL Logistics 114389 VST Industries 116548 VST Tillers Tractors 122
● W
141 Wabco India 106744 Walchandnagar Industries 130995 Weizmann Forex 138376 Welspun Corp 116737 Welspun Enterprises 130782 Welspun Enterprises (Merged) 132211 Welspun India 110991 Welspun Syntex 138916 Wendt (India) 136907 West Coast Paper Mills 136271 Westlife Development 112511 Wheels India 122173 Whirlpool Of India 108585 Wim Plast 12415 Wipro 102108 Wockhardt 106502 Wonderla Holidays 122822 WPIL 133
● X
971 Xchanging Solutions 138
● Y
357 Yamini Investment Co. 11658 YES Bank 104
● Z
56 Zee Entertainment Enterprises 104580 Zee Learn 124653 Zee Media Corpn. 128767 Zen Technologies 132326 Zensar Technologies 114579 ZF Steering Gear (India) 124997 Zicom Electr Security Systems 138779 Zodiac Clothing Co. 132674 Zuari Agro Chemicals 128316 Zydus Wellness 114
BT 1000 COMPANY PAGE BT 1000 COMPANY PAGE BT 1000 COMPANY PAGE BT 1000 COMPANY PAGERANK RANK RANK RANK
INDIA’S MOST VALUABLE COMPANIES INDEX


By TIMOTHY MOREY, THEODORE “THEO” FORBATH,
and ALLISON SCHOOP
Customer data:Designing
for Transparency and Trust
With the explosion of digital technologies, companies are sweeping up vast quantities of data about consumers’ ac-tivities, both online and off. Feeding this trend are new smart, connected products – from fitness trackers to home systems – that gather and transmit detailed information. Though some companies are open about their data prac-
tices, most prefer to keep consumers in the dark, choose control over sharing, and ask for forgiveness rather than permission. It’s also not unusual for companies to quietly collect personal data they have no immediate use for, reasoning that it might be valuable someday.
As current and former executives at frog, a firm that helps clients create products and services that leverage users’ personal data, we believe this shrouded approach to data gathering is shortsighted. Having free use of customer data may confer near-
November 8 2015 BUSINESS TODAY 187
IL
LU
ST
RA
TI
ON
BY
: RA
J VE
RM
A

term advantages. But our research shows that consumers are aware that they’re under surveillance – even though they may be poorly informed about the specific types of data collected about them – and are deeply anxious about how their personal information may be used.
In a future in which customer data will be a growing source of competitive advantage, gaining consumers’ conf idence wi l l be key.Companies that are transpar-ent about the information theygather, give customers controlof their personal data, and offerfair value in return for it will betrusted and will earn ongoingand even expanded access.Those that conceal how theyuse personal data and fail toprovide value for it stand tolose customers’ goodwill – andtheir business.
The Expanding Scopeof DataThe Internet’s first personal datacollectors were websites andapplications. By tracking users’activities online, marketerscould deliver targeted advertis-ing and content. More recently,intelligent technology in physi-
cal products has allowed companies in many industries to collect new types of information, including users’ locations and behaviour. The personalisation this data allows, such as constant adaptation to users’ preferences, has become central to the product experience. (Google’s Nest thermo-stat, for example, autonomously adjusts heating and cool-ing as it learns home owners’ habits.)
The rich new streams of data have also made it possible to tackle complex challenges in fields such as health care, environmental protection, and urban planning. Take Medtronic’s digital blood-glucose meter. It wirelessly con-nects an implanted sensor to a device that alerts patients and health care providers that blood-glucose levels are nearing troubling thresholds, allowing preemptive treat-ments. And the car service Uber has recently agreed to share ride-pattern data with Boston officials so that the city can improve transportation planning and prioritise road maintenance. These and countless other applications are increasing the power – and value – of personal data.
Of course, this flood of data presents enormous op-portunities for abuse. Large-scale security breaches, such as the recent theft of the credit card information of 56 million Home Depot customers, expose consumers’ vul-nerability to malicious agents. But revelations about companies’ covert activities also make consumers nerv-ous. Target famously aroused alarm when it was revealed that the retailer used data mining to identify shoppers who were likely to be pregnant – in some cases before they’d told anyone.
At the same time, consumers appreciate that data shar-ing can lead to products and services that make their lives easier and more entertaining, educate them, and save them money. Neither companies nor their customers want to turn back the clock on these tech-nologies – and indeed the de-velopment and adoption of products that leverage personal
ata continue to soar. The con-ultancy Gartner estimates that
nearly five billion connected “things” will be in use in 2015
up 30 per cent from 2014 –and that the number will quin-tuple by 2020.
Resolving this tension will require companies and policy-makers to move the data pri-vacy discussion beyond adver-tising use and the simplistic notion that aggressive data
HBR Exclusive
188 BUSINESS TODAY November 8 2015
IN THE DARK ABOUT DATAWhile most people are broadly aware that companies collect data on them, they’re surprisingly uninformed about the specifi c types of data they give up when they go online
PERCENTAGE OF PEOPLE WHO REALISE THAT THEY’RE SHARING THEIR
SOCIAL NETWORKFRIENDS’ LIST
27%
LOCATION
25%
WEB SEARCHES
23%
COMMUNICATIONHISTORY
such as chat logs
18%
IP ADDRESSES
17%
WEB-SURFINGHISTORY
14%
–

November 8 2015 BUSINESS TODAY 189
collection is bad. We believe the answer is more nuanced guidance – specifically, guidelines that align the interests of companies and their customers, and ensure that both parties benefit from personal data collection.
Consumer Awareness and ExpectationsTo help companies understand consumers’ attitudes about data, in 2014 we surveyed 900 people in five countries –the United States, the United Kingdom, Germany, China, and India – whose demographic mix represented the gen-eral online population. We looked at their awareness of how their data was collected and used, how they valued different types of data, their feelings about privacy, and what they expected in return for their data.
To find out whether consumers grasped what data they
shared, we asked: “To the best of your knowledge, what personal information have you put online yourself, either directly or indirectly, by your use of online services?” While awareness varied by country – Indians are the most cog-nizant of their data trail and Germans the least – overall the survey revealed an astonishingly low recognition of the specific types of information tracked online. On average, only 25 per cent of people knew that their data footprints included information on their location, and just 14 per cent understood that they were sharing their web-surfing his-tory, too. (See In the Dark about Data.)
It’s not as if consumers don’t realise that data about them is being captured, however; 97 per cent of the people surveyed expressed concern that businesses and the gov-ernment might misuse their data. Identity theft was a top concern (cited by 84 per cent of Chinese respondents at one end of the spectrum and 49 per cent of Indians at the other). Privacy issues also ranked high; 80 per cent of Germans and 72 per cent of Americans are reluctant to share information with businesses because they “just want to maintain [their] privacy.” So consumers clearly worry about their personal data – even if they don’t know exactly what they’re revealing.
To see how much consumers valued their data, we did conjoint analysis to determine what amount survey par-ticipants would be willing to pay to protect different types of information. (We used purchasing parity rather than exchange rates to convert all amounts to US dollars.) Though the value assigned varied widely among individu-als, we are able to determine, in effect, a median, by coun-try, for each data type.
The responses revealed significant differences from country to country and from one type of data to another. (See Putting a Price on Data.) Germans, for instance, place the most value on their personal data, and Chinese and Indians the least, with British and American respondents falling in the middle. Government identification, health, and credit card information tended to be the most highly valued across countries, and location and demographic information among the least.
We don’t believe this spectrum represents a “maturity model,” in which attitudes in a country predictably shift in a given direction over time (say, from less privacy conscious to more). Rather, our findings reflect funda-mental dissimilarities among cultures. The cultures of India and China, for example, are considered more hier-archical and collectivist, while Germany, the United States, and the United Kingdom are more individualistic, which may account for their citizens’ stronger feelings about personal information.
The Need to Deliver ValueIf companies understand how much data is worth to con-
PUTTING A PRICE ON DATASurveys of consumers in the United States, China, India, Great Britain, and Germany reveal that they value some types of information much more highly than others
APPROXIMATE AMOUNT PEOPLE WOULD PAY TO PROTECT EACH DATA TYPE (PPP)
HEALTHHISTORY
US
CREDIT CARDINFORMATION
PURCHASEHISTORY
DIGITALCOMMUNICATION
WEB SEARCHHISTORY
WEBBROWSING
LOCATION
DEMOGRAPHICINFORMATION
CONTACTINFORMATION
SOCIALPROFILE
ENERGY USE
GOVERNMENT ID
GBCN IN
$.24
DE
$184.20
> $50 < $50

ing a product or service better, for example, by allowing a map application to recommend a route based on a user’s location; (2) facilitating targeted marketing or advertising, such as ads based on a user’s browsing history; and (3) generating revenues through resale, by, say, selling credit card purchase data to third parties.
Our surveys reveal that when data is used to improve a product or service, consumers generally feel the enhance-ment itself is a fair trade for their data. But consumers ex-pect more value in return for data used to target marketing, and the most value for data that will be sold to third parties. In other words, the value consumers place on their data rises as its sensitivity and breadth increase from basic information that is voluntarily shared to detailed informa-tion about the consumer that the firm derives through analytics, and as its uses go from principally benefiting the consumer (in the form of product improvements) to princi-
sumers, they can offer commensurate value in return for it. Making the exchange transparent will be increasingly important in building trust.
A lot depends on the type of data and how the firm is going to use it. Our analysis looked at three categories: (1) self-reported data, or information people volunteer about themselves, such as their e-mail addresses, work and edu-cational history, and age and gender; (2) digital exhaust, such as location data and browsing history, which is cre-ated when using mobile devices, web services, or other connected technologies; and (3) profiling data, or personal profiles used to make predictions about individuals’ inter-ests and behaviours, which are derived by combining self-reported, digital exhaust, and other data. Our research shows that people value self-reported data the least, digital exhaust more, and profiling data the most.
We also examined three categories of data use: (1) mak-
190 BUSINESS TODAY November 8 2015
HBR Exclusive
THE FINANCE WEBSITE MINT SELLSTHE BASIC DATA IT GATHERS — BUTONLY TO FIRMS THAT CAN SAVECONSUMERS MONEY
SWAPPING VALUE FOR DATAThe value people put on data rises as its breadth and sensitivity increase and its use shifts benefi ts toward companies. And the more people value data, the more they expect companies to provide in return for it.
DATA TYPES USE OF DATA
PROFILING DATA Profi les that fi rms create by analysing personal data to make predictions about interests and behaviour
DIGITAL EXHAUSTData created during the use of digital products and services, such as browsing history or location
SELF-REPORTEDVolunteered information, such as e-mail address or employment history
IMPROVE A PRODUCT OR SERVICE
FACILITATE TARGETED MARKETING
SELL TO THIRD PARTIES
LOW BREADTH AND SENSITIVITY HIGH BREADTH AND SENSITIVITY
BENE
FITS
CON
SUM
ERS
BENE
FITS
COM
PANY
EXAMPLES
WITH ITS MAGICBANDS, DISNEY COMPILES EXTENSIVE PERSONAL DATA BUT USES IT ONLY TO IMPROVE SERVICE AND ADVERTISING
CONSUMERS EXPECT THE MOST VALUE FROM FACEBOOK, WHICH AGGRESSIVELY COLLECTS AND SELLS ALL THREE KINDS OF DATA


pally benefiting the firm (in the form of revenues from selling data). (See Swapping Value for Data.)
Let’s look now at how some com-panies manage this trade-off.
Samsung’s Galaxy V smart-phone uses digital exhaust to auto-matically add the contacts users call most to a favourites list. Most cus-tomers value the convenience enough to opt in to the feature – ef-fectively agreeing to swap data for enhanced performance.
Google’s predictive application Google Now harnesses profiling data to create an automated virtual as-sistant for consumers. By sifting through users’ e-mail, location, cal-endar, and other data, Google Now can, say, notify users when they need to leave the office to get across town for a meeting and provide a map for their commute. The app depends on more-valuable types of personal data but improves performance enough that many users willingly share it. Our global survey of consumers’ at-titudes towards predictive applica-tions finds that about two-thirds of people are willing (and in some cases eager) to share data in exchange for their benefits.
Disney likewise uses profiling data gathered by its MagicBand bracelet to enhance customers’ theme park and hotel experiences and create targeted marketing. By holding the MagicBand up to sensors around Disney facilities, wearers can access parks, check in at reserved attractions, unlock their hotel doors, and charge food and merchandise. Users hand over a lot of data, but they get convenience and a sense of privileged access in return, making the trade-off worthwhile. Consumers know exactly what they’re signing on for, because Disney clearly spells out its data collection policies in its online MagicBand registration process, highlighting links to FAQs and other information about privacy and security.
Firms that sell personal information to third parties, however, have a particularly high bar to clear, because consumers expect the most value for such use of their data. The personal finance website Mint makes this elegant ex-
change: If a customer uses a credit card abroad and incurs foreign transaction fees, Mint flags the fees and refers the customer to a card that doesn’t charge them. Mint receives a commission for the referral from the new-card issuer, and the customer avoids future fees. Mint and its customers both collect value from the deal.
Trust and TransparencyFirms may earn access to consumers’ data by offering value in return, but trust is an essential facilitator, our re-search shows. The more trusted a brand is, the more will-
192 BUSINESS TODAY November 8 2015
In a landmark case in September 2014, Germany ordered Google to stop violating its Federal Tele-media Act and Federal Data Protection Act. Under fi re was Google’s practice of compiling individual user data from its various services into detailed user profi les without users’ consent
Google was already facing fi nes from six other European coun-tries for breaking the
European Union’s rules on privacy, but Germany’s deci-sion to force the company to change its practices to com-ply with the country’s particu-lar data protection laws set a new precedent. Among the list of required measures was a directive that Google meet Germany’s stringent privacy options, in particular, provid-ing a “right to forget” service through which people could remove any personal informa-tion they did not want online. This marked a new era for global web-based businesses.
As the New York Times has reported, many countries now default to Europe’s data protection rules, adopting passages from the EU’s strict regulations almost word for word. At the same time, they
add regional legal interpre-tations. Brazil requires that tech companies get direct permission from users before sharing their data with online advertisers and marketers; South Africa forbids the transmission of people’s personal data to countries that don’t replicate its pri-vacy laws; and South Korea grants individuals the right to access at any time the online information that companies hold about them. The United States is exceptional in that its personal data laws are not clearly defi ned and not enforced by any independent governing body except in the case of data related to health care or minors. However, as Google’s experiences show, US-based companies that operate internationally may be forced to comply with more-stringent data laws elsewhere.
DATA LAWS ARE GROWING FIERCER
HBR Exclusive


194 BUSINESS TODAY November 8 2015
HBR Exclusive
value in exchange for certain data, the firm with the higher trust will find customers more willing to share. For exam-ple, if Amazon and Facebook both wanted to launch a mobile wallet service, Amazon, which received good rat-ings in our survey, would meet with more customer ac-ceptance than Facebook, which had low ratings. In this equation, trust could be an important competitive differ-entiator for Amazon.
Approaches That Build Trust Many have argued that the extensive data collection to-day’s business models rely on is fraught with security, fi-nancial, and brand risks. MIT’s Sandy Pentland and others have proposed principles and practices that would give consumers a clear view of their data and control over its use, reducing firms’ risks in the process. (See “With Big Data Comes Big Responsibility,” HBR, November 2014.)
We agree that these business models are perilous and that risk reduction is essential. And we believe reasoned policies governing data use are important. But firms must also take the lead in educating consumers about their per-sonal data. Any firm that thinks it’s sufficient to simply provide disclosures in an end-user licensing agreement or present the terms and conditions of data use at sign-up is missing the point. Such moves may address regulatory re-quirements, but they do little if anything to help consumers.
Consider the belated trust-building efforts under way at Facebook. The firm has been accused of riding rough-shod over user privacy in the past, launching services that pushed the boundaries on personal data use and
ing consumers are to share their data. Numerous studies have found that transparency about
the use and protection of consumers’ data reinforces trust. To assess this effect ourselves, we surveyed consumers about 46 companies representing seven categories of busi-ness around the world. We asked them to rate the firms on the following scale: completely trustworthy (respondents would freely share sensitive personal data with a firm be-cause they trust the firm not to misuse it); trustworthy (they would “not mind” exchanging sensitive data for a desired service); untrustworthy (they would provide sensitive data only if required to do so in exchange for an essential ser-vice); and completely untrustworthy (they would never share sensitive data with the firm).
After primary care doctors, new finance firms such as PayPal and China’s Alipay received the highest ratings on this scale, followed by e-commerce companies, consumer electronics makers, banks and insurance companies, and telecommunications carriers. Next came Internet leaders (such as Google and Yahoo) and the government. Ranked below these organisations were retailers and entertain-ment companies, with social networks like Facebook com-ing in last. (See Do They Trust You with Their Data?)
A firm that is considered untrustworthy will find it dif-ficult or impossible to collect certain types of data, regard-less of the value offered in exchange. Highly trusted firms, on the other hand, may be able to collect it simply by ask-ing, because customers are satisfied with past benefits re-ceived and confident the company will guard their data. In practical terms, this means that if two firms offer the same
DO THEY TRUST YOU WITH THEIR DATA?Consumers’ faith that their personal information will be handled responsibly varies widely from industry to industry. Here are the percentages of people who said that each category of organisation was “trustworthy” or “completely trustworthy” when it came to making sure that personal data was never used in any way that they wouldn’t want.
PAYMENT OR CREDITCARD COMPANIES
85%
TECHNOLOGY FIRMS
70%
CONSUMERELECTRONICS FIRMS
77%
GOVERNMENTS
66%
PRIMARY CAREDOCTORS
87%
TELECOM CARRIERS
73%
E-COMMERCE FIRMS
INTERNET GIANTS (SUCH AS GOOGLE
AND YAHOO)
68%
BANKS
76%
MEDIA ANDENTERTAINMENT
COMPANIES
61%
INSURANCECOMPANIES
76%
SOCIAL MEDIA FIRMS
56%
80%


plus strict policies that gov-ern how all data is han-dled… We believe in telling you up front exactly what’s g o i n g t o h a p p e n t o your personal information and asking for your permis-sion before you share it with us.”
On the site, Apple de-scribes the steps taken to keep people’s location, communication, browsing, health tracking, and trans-actions private. Cook ex-plains, “Our business model is very straightforward: We sell great products. We don’t build a profile based on your e-mail content or web-browsing habits to sell to advertisers. We don’t ‘monetise’ the information you store on your iPhone or in iCloud. And we don’t read your e-mail or your messages to get informa-tion to market to you. Our software and services are designed to make our de-vices better. Plain and sim-ple.” Its new stance earned Apple the highest possible score –six stars – from the nonprofit digital rights or-ganisation Electronic Frontier Foundation, a ma-jor improvement over its 2013 score of one star.
Enlightened Data Principles Facebook and Apple are taking steps in the right direction but are fixing issues that shouldn’t have arisen in the first place. Firms in that situation start the trust-building process with a handicap. Forward-looking companies, in contrast, are incorporating data privacy and security considerations into product development from the start, following three principles. The examples below each highlight one principle, but ideally companies should practice all three.
Teach your customers. Users can’t trust you if they don’t understand what you’re up to. Consider how one of our clients educates consumers about its use of highly sensitive personal data.
retreating only in the face of public backlash or the t h r e a t o f l i t i g a t i o n . Facebook Beacon, which exposed users’ web activi-ties without their permis-sion or knowledge, for example, was pulled only after a barrage of public criticism.
More recently, however, Facebook has increased its focus on safeguarding pri-vacy, educating users, and giving them control. It grasps that trust is no longer just “nice to have.” Commenting in a Wired in-terview on plans to improve Facebook Login, which al-lows users to log into third-party apps with their Facebook credentials, CEO Mark Zuckerberg explained that “to get to the next level and become more ubiqui-tous, [Facebook Login] needs to be trusted even more. We’re a bigger com-pany now and people have more questions. We need to give people more control over their information so that everyone feels comfort-able using these products.” In January 2015, Facebook launched Privacy Basics, an easy-to-understand site that explains what others see about a user and how people can customise and manage others’ activities on their pages.
Like Facebook, Apple has had its share of data privacy and security challenges – most recently when celebrity iPhoto accounts were hacked – and is taking those con-cerns ever more seriously. Particularly as Apple forays into mobile payments and watch-based fitness monitor-ing, consumer trust in its data handling will be para-mount. CEO Tim Cook clearly understands this. Launching a “bid to be conspicuously transparent,” as the Telegraph put it, Apple recently introduced a new sec-tion on its website devoted to data security and privacy. At the top is a message from Cook. “At Apple, your trust means everything to us,” he writes. “That’s why we re-spect your privacy and protect it with strong encryption,
Britain’s Channel 4 does an excel-lent job of educating its viewers about its data collection and
privacy policy. On a dedicated website, the TV station details the type of infor-mation gathered and how it’s used, and summarises the policy in a short, enter-taining video with comedian Alan Carr. As he deadpans, “We’ll ask you for your name, e-mail, and a few other details. Now, I know what you’re thinking. Why should you give us your name and inside-leg measurement? What will we do with that information?” He then explains that viewers maintain complete control of their data, that it will never be sold, and that it can be erased from the system at their request at any time.
The video, which has been watched millions of times, is one component of Channel 4’s vigorous Viewer Promise programme. According to Steven Forde, the channel’s director of viewer rela-tionship management, these efforts have built trust and encouraged data sharing: Eleven million viewers have registered on the site. Eighty per cent of them volunteer their address details, though they’re not required to, and fewer than 0.01 per cent opt out of targeted advertising.
USING HUMOUR TO TEACH ABOUT DATA PRIVACY
HBR Exclusive
196 BUSINESS TODAY November 8 2015


198 BUSINESS TODAY November 8 2015
like or don’t like. Pandora takes that information and de-velops a profile of each person’s musical tastes so that it cantailor the selection of songs streamed to him or her; themore data users provide, the better the tailoring becomes.In the free version of its service, Pandora uses that data totarget advertising. Customers get music they enjoy at nocharge and ads that are more relevant to them. Consumersclearly find the trade satisfactory; the free service has 80million active subscribers.
In designing its service, Pandora understood that cus-tomers are most willing to share data when they knowwhat value they’ll receive in return. It’s hard to set up thisexchange gracefully, but one effective approach is to start
slowly, asking for a few pieces oflow-value data that can be used toimprove a service. Provided thatthere’s a clear link between thedata collected and the enhance-ments delivered, customers willbecome more comfortable sharingadditional data as they grow morefamiliar with the service.
IF YOUR company still needs an-other reason to pursue the dataprinciples we’ve described, considerthis: Countries around the worldare clamping down on businesses’freewheeling approach to personaldata. (See the sidebar Data Laws AreGrowing Fiercer.)
There is an opportunity forcompanies in this defining mo-ment. They can abide by localrules only as required, or they can
help lead the change under way. Grudging and minimalcompliance may keep a firm out of trouble but will dolittle to gain consumers’ trust and may even undermineit. Voluntarily identifying and adopting the most strin-gent data privacy policies will inoculate a firm againstlegal challenges and send consumers an important mes-sage that helps confer competitive advantage. After all,in an information economy, access to data is critical, andconsumer trust is the key that will unlock it. ~
Timothy Morey, is the vice president of innovation strategy at frog, a global product strategy and design
firm. Theodore “Theo” Forbath is the global vice presi-dent of digital transformation at Cognizant. Allison Schoop is an associate strategy director at frog. This ar-ticle was published in Harvard Business Review, May 2015. Copyright ©2015 Harvard Business School Publishing Corporation. All rights reserved.
This client, an information exchange for biomedical researchers, compiles genomic data on anonymous par-ticipants from the general public. Like all health informa-tion, such data is highly sensitive and closely guarded. Building trust with participants at the outset is essential. So the project has made education and informed consent central to their experience. Before receiving a kit for col-lecting a saliva sample for analysis, volunteers must watch a video about the potential consequences of having their genome sequenced – including the possibility of discrimi-nation in employment and insurance – and after viewing it, must give a preliminary online consent to the process. The kit contains a more detailed hard-copy agreement that, once signed and returnedwith the sample, allows the ex-change to include the participant’sanonymised genomic informationin the database. If a participantreturns the sample without thesigned consent, her data is with-h e l d f r o m t h e e x c h a n g e .Participants can change theirminds at any time, revoking orgranting access to their data.
Give them control. The princi-ple of building control into dataexchange is even more fully devel-oped in another project, theMetadistretti e-monitor, a collabo-ration between frog, Flextronics,the University Politecnico diMilano, and other partners.Participating cardiac patientswear an e-monitor, which collectsECG data and transmits it viasmartphone to medical professionals and other caregiv-ers. The patients see all their own data and control how much data goes to whom, using a browser and an app. They can set up networks of health care providers, of family and friends, or of fellow users and patients, and send each different information. This patient-directed approach is a radical departure from the tradition of pa-ternalistic medicine that carries over to many medical devices even today, with which the patient doesn’t own his data or even have access to it.
Deliver in-kind value. Businesses needn’t pay users for data (in fact, our research suggests that offers to do so actu-ally reduce consumers’ trust). But as we’ve discussed, firms do have to give users value in return.
The music service Pandora was built on this principle. Pandora transparently gathers self-reported data; custom-ers volunteer their age, gender, and zip code when they sign up, and as they use the service they tag the songs they
HBR Exclusive


The 10-year-old always shared his excitement on the latest acquisitions – how he had zoomed past the hairpin turns on a racing car, the fighter jets he had flown, the AK47s and heavy artilleries he had fired, the hidden treasures he had discov-ered and how he had gone over the cliff risking his life. The gap between the realand virtual world, however, had a clear demarcation the real life separated bya computer screen, and not quite cut off from or unaware of one’s surroundings:“This is just for fun. I would not get to do it for real!” he would giggle, the excite-ment very evident in his voice.
But what happens when one crosses over to an as-good-as-real world withoutthe demarcation between the real and the make-believe? Well, if the recent excite-
ment around virtual reality (VR) is anything to go by, it’s the stuff of legend. And, kids and adults,alike, are eagerly awaiting the 2015-end/2016 launches of VR products to experience it firsthand.
VR, in some form or the other, had existed for over half a century, always promising, yet farfrom the magic realism it was synonymous with right from its inception. Central to the recentresurgence of VR, however, was a 19-year-old college dropout, working with a tiny team at hisparent’s garage to give shape to the Oculus Rift. Between the summer of 2012 and March 2014,
Virtual Reality has existed for decades, but there’sa new sense of enthusiasm among tech giants
promising a veritable new world. BY NIDHI SINGAL
MAGICREALISM
PERSONAL TECH

SAMSUNG GEAR VRThe headset, created by Samsung and Oculus is a low-cost alternative to virtual reality headsets, and will be available for purchase this November.

the road travelled by California-based Palmer Freeman Luckey was as excit-ing as making the virtual a reality – after initially raising $2.5million through crowdfunding via the Kickstarter platform for Oculus VR, the company he had set up, Luckey sold the yet-to-be commercially launched product for a whopping $2 billion to Facebook. It will be launched in the first quarter of 2016.
The Oculus Rift is a head mounted display (HMD), looking somewhat like skiing or scuba diving goggles and consisting of a screen lit by LEDs, a camera, a computer and headphones. Once the HMD is put on, it transports the viewer into an amaz-ingly realistic virtual world – but what happens subsequently is strictly within the mind. Its genius lies in the fact that, while highly sophisticated equipment was known to create such effects, Luckey did so with far less money. The device is expected to sell for around $500.
The excitement does not stop there for geeks because Facebook is not alone in betting on the new wave of VR. Samsung, Sony and Google are now all eyeing a slice of the pie, not to forget Microsoft, which has thrown its hat in the ring with HoloLens that fo-cuses on augmented reality. And, all of them are planning for a 2015-end or 2016 launch.
Sony is working on Project Morpheus, a VR HMD for its PlaySta-tion 4. Samsung is developing a new HMD powered by Oculus VR, which will provide exclusive content, espe-cially movies and games. So is HTC,
whose Vive will be powered by an Oculus rival, SteamVR, and get con-t e n t f r o m H B O , L i o n s G a t e Entertainment and Cloudhead Games among others. Microsoft is develop-ing its own HMD for Hololens, a ho-lographic computer. Google has sto-len a march over them all by already releasing a VR platform called Cardboard, which one can assemble on their own, and a smartphone that takes the place of a computer. The Cardboard kit – available in India for less than `350 – comprises a piece of cardboard, lenses, magnets and near-field communication (NFC) tags, with complete instructions on how to as-semble it.
Some say Oculus is currently the industry leader and has set the bar very high, followed by Sony’s Morpheus and HTC Vive, and though it’s augmented reality, HoloLens will also be a big player. The race does not stop there either, as many start-up accelerators are expected to come up with their own versions.
Now, consulting firm KZero, which specialises in the virtual space, estimates the VR industry – hardware and software included – will be worth $5.2 billion by 2018. Research firm Digi Capital maintains that VR, along with its allied Augmented Reality industry, could be worth $150 billion by 2020.
The growing influence of VR can be seen from the fact that some com-panies are turning to VR product launches. “We originally planned a traditional launch (for OnePlus 2 smartphone) on a stage in San
WHAT ISVIRTUALREALITY?“The definition of VRcomes, naturally, fromthe definitions for both‘virtual’ and ‘reality’,”says the website vrs.org <http://vrs.org>. Itis basically a sight-and-sound experience muchcloser to everyday realityyou experience than thetraditional movie screenprovides. The VR environ-ment is created on a com-puter screen using specialstereoscopic displays. Ittracks your movements,those of your head andeye, and accordinglyadjusts the images on thedisplay. VR takes you intoa new 3D world which youbecome a part of.
"Everyone is going wild over Facebook buying Oculus. There are still many problems to be resolved before VR becomes a mainstream activity.” JON PEDDIE, President, Jon Peddie Research
PERSONAL TECH


Francisco,” says Vikas Agarwal, General Manager, India OnePlus. “But it felt a bit too formal and allowed us to reach a very small segment. We have users all over the world and VR offered us an affordable means to reach out to viewers in 35 countries.”
Future of Virtual RealityThe road to VR began as early as 1957 with the Sensorama in which the viewer entered a special booth where he could experience 3D images, along with accompanying sounds and smells and even the rush of wind. The first HMD with a head tracking system was developed by Philco Corporation in 1961. In the 1980s and 1990s there were major advances, as films like Tron and The Matrix show, but, thereafter, the genre had withered until the recent spate of activity.
The earlier phases focused entirely on entertainment and gaming. Now, the advent of smartphones is expected to drive its future. “The mobile market for HMDs can be divided into two categories, integrated displays and smartphones,” says Jon Peddie, President, Jon Peddie Research. “I
expect smartphone HMDs to outsell the integrated ones by 20 times, be-cause of the price difference and low risk.” Jonathan Tustain, co-founder of UK-based FreeFly VR, which makes VR headsets, agrees. “As mobile phone companies look for the next killer app, they will offer VR as one of their features,” he says.
To ride the wave, the entire tech-nology industry is investing in hard-ware and software, as well as in re-search for applications across various industries. Healthcare is a sector where VR’s potential is already being put to use in robotic surgery, skills training and therapies. The platform, HumanSim, for example, allows doc-tors, nurses and other medical per-sonnel to interact with one another for training scenarios. It is an immer-sive experience which measures the participant’s emotions via a series of sensors. Psious, on the other hand, is an online VR tool for therapists to treat phobia.
Education is yet another area, with EON Reality, for instance, offer-ing Virtual 3D learning solutions – instead of diagrams, for one, it pro-vides interactive videos which are easy to understand. The technology is be-ing used at Carnegie Mellon University (US), Imperial College (UK), Nanyang Technological University (Singapore) and elsewhere.
The possibilities are immense, even in the Indian context. “The inter-est in VR at the consumer education level is fairly recent,” says Neeraj Jewalkar, founder and CEO at Smartur.com. “Many experimental applications have been built to use VR in education. Most of them relate to visualising the human anatomy or exploring the mechanics of motors. The real penetration is going to hap-pen in a top down format with higher education institutions adopting it for
CROSSING OVER
First, you need a viewer. The most convenient is perhaps Google’s Cardboard, available at most online stores at affordable prices. Cardboard, lenses, magnets, etc, are provided in the pack-age, but you need to do the assembling yourself. Next, down-load the VR apps on your mobile and place the mobile on the convenient base Cardboard provides. Wear the viewer and you are ready to go.
PERSONAL TECH


208 BUSINESS TODAY November 8 2015
cost benefits and efficiency of learning. History will become easy to teach and learn with VR. Imagine being able to watch the Dandi March by Gandhiji in real time or see the Taj Mahal being constructed.”
Real estate companies are also us-ing VR to offer life-like property experi-ences to its customers. Earlier this year, CommonFloor introduced VR, allowing customers to view multiple properties while sitting at a single loca-tion. 36ty Solutions also offers a similar service. Poland-based Immersion is yet another firm which creates interactive presentations for VR headgear using computer graphic engines. The app is developed so much in detail that one can view what the landscape will be like from a particular window. Even Rewind has developed an in-house solution called Horoma, which allows people to tour real 3D scans of properties.
VR is also being used for design-ing products, marketing and public relations. SmartVizX, a start up in India, is using VR technology for de-signing products as well. “Virtual reality is the new wave,” says Shailesh Goswami, founder and CEO, Foyr, an automated interior design-ing solution which launched its VR enabled app in August this year. “We have adopted it as we are in a high-investment category and helps in experiential selling.”
Hospitality and tourism are also benefiting from VR. Qantas airline has launched an interactive VR technol-ogy for its first class customers show-casing in-flight movies and entertain-ment along with Qantas products and airline’s destinations’ network. It also offers a special 3D experience from Australia’s Kakadu National Park. Marriott Hotels has started a new VR headset trial by which guest can ‘see’ the local sights without leaving the hotel room. Even in India, The Thought Studio in Chandigarh is working towards a VR interpretive centre at the Amer Palace, Jaipur. It is also planning a VR interpretation centre, enabling a detailed virtual tour of the Taj Mahal.
Skeptical VoicesThere are, however, a few who are somewhat sceptical about its pros-pects. Says Jonathan Tustain, co-founder of UK based FreeFly VR, which is into VR headgears: “The growth of the virtual reality industry is based on speculation at the moment. There is very little data as to how con-sumers will respond to virtual reality beyond the early adaptors, and most importantly, the price they are willing to pay for the content in a world that is increasingly focussed around multi-tasking. Wearing a headset takes com-mitment and, so, for the industry to grow beyond the initial hype, it will be imperative for VR to deliver content that fits within people’s lives.”
Peddie agrees: “Everyone is going wild over Facebook buying Oculus. There are still many problems to be resolved before VR becomes a main-stream activity. It’s a novelty now and will remain so except for the traditional uses in science and indus-try. There are a lot of interesting ideas for VR, but very little actual imple-mentation,” adding: “Most impor-tantly, are people willing to wear the HMDs and remain cut off from the actual reality for long periods? I think the answer is no. And if you have, was it a pleasant experience and for how long did you try it?”
Be Informed:This raises other questions as well. Is VR harmful for our eyes and ears, or our senses? Why are companies sug-gesting only 10-minute sessions be-fore taking a break? Says Dr. Taru Dewan, Senior Eye Specialist at PGIMER and RML Hospital: “Using the VR headgear for long durations may cause strain and may create eye muscle fatigue and weakness. This is what is expected unless the VR sys-tems are developed to adapt accord-ing to ocular alignment of users. It is more of a concern in children. But these effects have to be actually docu-mented to say with certainty.” ~
@nidhisingal
CARDBOARDThis is the first app to download to start the VR experience. It provides basic demos on VR and access to VR videos on YouTube. It also takes you to other VR apps on the Android Play Store.
VR CINEMA FOR CARDBOARDIt provides a split-screen 3D view of any MP4 video stored in the mobile. The app is also optimised to use the phone’s camera.
DEBRISDEFRAGAn interactive VR game which takes you into outer space and re-quires you to shoot the asteroids that hurtle in your direction.
PERSONAL TECH


its Place isn t Such aBright IdeaBy Gillian Tett
PAGES: 290PRICE: 599 Hachette
It’s a thought provoking book because as [author Gillian]Tett points out, living in specialised silos might make life seem more effi cient in the short term
212 BUSINESS TODAY November 8 2015
If you talk to companies such as Philips, Accenture, Unilever that have re-cently redone their workplaces, there is a new focus on introducing archi-tectural designs that will break silos in the offi ce. So they have created areas where people from different departments will bump into each other and be forced to talk to each other. Collaboration is the new theme at most forward
looking workplaces.World over organisations are beginning to realise that working in silos can be
debilitating for business. Gillian Tett, the British fi nancial journalist who authored Fool’s Gold, a book on the great fi nancial crisis of 2008, is convinced that the reason for the disaster was because the modern fi nancial system operated in a very frag-mented set up. “Everywhere I looked in the fi nancial crisis, it seemed that tunnel vision and tribalism had contributed to the disaster,” she writes.
Tett, who interestingly has a PhD in cultural anthropology, an unusual back-ground for someone writing on the global economy and banking systems, leverages her training to make sense of the silos. The world may be one interconnected global village but people continue to live in silos, and this is what is trapping them in men-tal maps that inhibit innovation, feels Tett.
The book is replete with examples of companies that made the mistake of get-ting boxed into silos as well as companies that challenged them. Sony is a classic case of the former while Facebook is a heartwarming example of the latter. The irony is that the powers that be at Sony realised what ailed the company. In 2005, Howard Stringer, the CEO of Sony Corporation, tried attacking it much to the baf-fl ement of Japanese engineers for whom the term silo was an alien one. In fact, so alien was it that the translator was forced to describe silo as an octopus pot – a narrow container into which the octopus slides into but fi nds impossible to exit. Unfortunately while Stringer had astutely diagnosed Sony’s problems, he was un-able to implement the cure.
Tett juxtaposes Sony’s failed attempt with Facebook’s unique fl uid social code that kept silos at bay. Its work practices are unstructured and the organisation is less plagued by internal rivalries or rigidities, writes Tett, pointing out that very secret of its success was to marry quantitative computing skills with soft analysis about humans’ social ties. From shuffl ing teams constantly to organising hackathons that would throw engineers from different streams together at an overnight marathon session, Facebook did many social experiments to fi ght and break silos.
Tett is a great storyteller and she organises the book beautifully, moving from examples from anthropology – a rather quaint vignette from life in a village in south west France where social changes have created a bit of a tragedy for the menfolk – to examples of banks and corporations and even individuals. The detailed case studies of the organisations are particularly insightful.
And then fi nally, she weaves together all the narratives to present lessons and ideas on mastering silos. Be it rotating staff, devising collaborative pay systems that would force people to think as groups or opening up information fl ows, there is lots that can be done. Technology has, recently, proved to be a great aid in silo busting.
It’s a thought provoking book because as Tett points out, living in specialised silos might make life seem more effi cient in the short term. But it will also mean missed risks and opportunities. ~
Mastering SilosSilos are rife in organisations. This book gives lessons on breaking through the structural fog that clouds a company’s vision. By CHITRA NARAYANAN
EX-LIBRIS
The fect : WhyPutting Everything inits Place isn’t Such a

November 8 2015 BUSINESS TODAY 213
he timing of this book, Combating Hun-ger and Achieving Food Security, couldnot be better. India is facing its second
consecutive monsoon deficit year. The countrys in the midst of implementing a law on food
security, and the National Democratic AllianceNDA) government is making noises about the
need to change agricultural practices. Mastergeneticist M.S. Swaminathan the architect ofhe green revolution in the country in the midsixties beautifully sets the context in his newbook, and calls for according priority to com-bating hunger. He also outlines ways to do so.
Swaminathan starts off by highlighting thefactors that led to the success of the green revo-lution. He gives credit to the synergy betweentechnology, public policy and farmers’ efforts.At that time, incentives through subsidies andminimum support price (MSP) were absolutelyessential to make farmers produce more. How-ever, nearly five decades later, most states aredesperately trying to get out of the cycle set by
Swaminathan, even as the World Trade Organization (WTO) wants In-dia to end the MSP mechanism.
The book brings to life India’s journey from the Bengal Faminewhich killed roughly three million people between 1942 and 1943due to hunger to our present day struggle to become food sufficient.Swaminathan contends that only through homegrown food can thisbattle be won. For this, India needs to improve farm productivity. Atthe same time, effective social protection is needed to get small andmarginal farmers out of their poverty and hunger traps.
The book’s utility stems from the prescriptions that Swaminathanoffers to safeguard the stability of agriculture production in India:
~ Ensure the soil’s health is not only conserved, but improvedcontinuously.
~ Ensure irrigation, water security, by integrating resources suchas rainwater, rivers and other forms of surface water.
~ Technology and inputs need to be tailored according to the agro-ecological and socio-economic conditions.
~ Farmers must have access to appropriate credit and insurancesupport.
~ Assured and remunerative marketing. The MSP mechanismshould stay for the sake of improving the lives of smaller farmers.
~ Farmers must get power and economy of scale, and to do so mustexplore co-operative farming.
All in all, it’s a must read book for those who are keen to under-stand the missing links in India’s agriculture story. ~
BUSINESS BESTSELLERS*
Elon MuskBy Ashlee VanceVirgin BooksPrice: `699
Thinking, Fastand Slow
g,
By Daniel KahnemanPenguinPrice: `499
SByLiPr
LeadingBy Alex Ferguson withMichael MoritzHodder And StoughtonPrice: `799
Steve Jobsy Walter Isaacsonttle, Brown Book Grouprice: `550
Arise, AwakeBy Rashmi BansalWestland BooksPrice: `200
*Top books by sales for Sept 27-Oct 10, 2015; Includes only books released after October 1, 2014; Information provided by
Prescriptions for Food SecurityThe book offers timely advice for safeguardingthe future of agriculture. By ANILESH S. MAHAJAN
By Robert Steven KaplanHarvard BusinessPrice: `895
What you Really Need to Lead
The book talks about howleadership is accessible to allof us today, and it starts withan ownership mindset.
THE FORTNIGHTLY
PICK
Combating Hunger and Achieving Food Security By M.S. Swaminathan PAGES: 167 PRICE: N.A. Cambridge University Press
cis(ngts


Angus DNobel Priz
PEOPLEBUSINESS
Dilip Chenoy Former MD/CEO, National Skill Development Corp.
In the Spotlight Since the 2007/08 financial crisis, income inequality has becomeone of the hottest topics for debate globally. ANGUS DEATON’s work,primarily focusing on poverty and inequality, has recently beenrecognised by The Royal Swedish Academy of Sciences, bagging himthe prestigious Nobel Prize in Economics. The British-born PrincetonUniversity professor’s research has practical significance, and hiscontributions have influenced policymaking in developed and developing countries, including India. He also formulated the Deaton Paradox – it shows that sharp shocks in income don’t seem ttranslate into sharp shocks in consumption. Deaton, 70, holds bothAmerican and British citizenships.
Out of ActionIn a fresh twist to the fallout between National Skill Development Corporation (NSDC) and the Ministry of Skill Development, DILIP CHENOY, the NSDC MD and CEO, has now resigned from his post. The differences between the NSDC leadership and the ministry emerged shortly after Prime Minister Narendra Modi announced the National Skill Development Mission in July. Chenoy, who joined NSDC in 2010, was appointed by the earlier UPA government. NSDC was formed in 2009 on a public-private partnership model with an aim to skill 150 million people by 2022. Its key programmes, Udaan and STAR, help in developing skills based on the needs of various sectors. But despite its efforts to improve skill sets of the country’s youth, NSDC has made limited progress.
218 BUSINESS TODAY November 8 2015
Deatone winner
,
mn
to
YA
SH
BA
NT
NE
GI

New Beginnings The appointment of a new prime minister in Nepal K.P. SHARMA OLI might turn out to be an important step in addressing the concerns raised by India related to the new constitution of Nepal, which was unveiled last month after almost seven years of negotiations. It could also resolve the impasse over the blockade of a key border trade point between the two nations. The Madhesi people, who are Indian-origin inhabitants of Nepal’s Terai region, have opposed the new constitution, saying it has curtailed their rights. The Indian authorities hope that the new PM will act on the eight-point agreement that talks about amending the constitution to address the concerns of the Madhesi people.
COMPILED BY MANU KAUSHIK
Mr BankableThe alleged fraud and black money transactions at Bank of Baroda are estimated to beworth over `6,000 crore. The bank has now appointed P.S. JAYAKUMAR as its head.Jayakumar, an avid cyclist, has his work cut out for him. He will have to clean the mess and keepup the growth momentum. Jayakumar has spent his entire career in the private sector, workingwith Citibank in India and Singapore for some 23 years. Known for his deep understanding ofthe real estate market, he co-founded Bangalore-based Value and Budget Housing Corp (VBHC)with Jerry Rao in 2009. He also co-founded Home First Finance Company for those who do nothave access to mortgage loans from banks.
Intolerant TimesIt seems intolerance – both religious and cultural – is gaining ground in India. Its latest casualty is SUDHEENDRA KULKARNI, who heads the think tank Observer Research Foundation (ORF), Mumbai. ORF recently organised the launch of a book written by former Pakistan foreign minister Khurshid Kasuri. Hours before the event, a few Shiv Sena activists attacked Kulkarni and painted his face black. Kulkarni had served as a special aide to former prime minister Atal Bihari Vajpayee for almost six years. During that period, he was instrumental in driving several initiatives – a new telecom policy, national highway development project and also the Pradhan Mantri Gram Sadak Yojana.
P.S. JayakumarMD/CEO, Bank of Baroda
K.P. Sharma OIiPrime Minister, Nepal
Sudheendra Kulkarni Chairman, ORF Mumbai
November 8 2015 BUSINESS TODAY 219
VI
KR
AM
SH
AR
MA

Swedish retailer H&M that has bravely come in on the single brand FDI route waiting two years for approval, could not have askedfor a better opening in India. Chitra Narayanan catches up with its CEO Karl-Johan Persson
“Our goal is to offer great value every day”
LEADERSPEAK Karl-Johan Persson V
IV
AN
ME
HR
AFull interview with Karl-Johan Persson atbusinesstoday.in/h&m-persson
Why did you decide to come on your own here – and not through a JV or franchisee route?
It’s our preferred way to do business. It’s hard, it’s com-plex, but we have quite a lot of experience gained over 60 markets.
You have set off a discounting war on day one with Zara and Gap announcing huge sales to counter your opening? Do you see this becoming a discount-ing war game?
It is not about one day. Our goal is to offer great value every day. We offer value on four factors – fashion, sustainability, price and quality.
Zara set the pace in fast fashion. What is your
turnaround time?
Fast fashion is a bit of a misused term. We have 150 designers working with us at H&M and a lot of design is planned with a long lead time, some others have short lead times. Some of our designers are looking at autumn of 2016 or even further. We have designers of 25 na-tionalities designers and they also include Indians.
Would you fear online competition from local ecommerce fashion shops like Myntra?
Absolutely, they are competition. Right now in India, we don’t have an online store. But in future, we will have an online store and customers can buy online and exchange offline, etc. Online offline integration is the main challenge. ~
Vol. 24, No. 22, for the fortnight October 26 to November 8, 2015. Released on October 26. Total number of pages 222 (including cover) 220


RNI N
o. D
ELEN
G / 2
007
/ 215
44 *N
ot fo
r sale
. To
be ci
rcul
ated
free w
ith
Busin
ess T
oday
in M
umba
i, De
lhi &
NCR
, Che
nnai,
Ban
galo
re an
d Ko
lkata.
“S
uppl
emen
t to
Busin
ess T
oday
issu
e date
d No
vem
ber 8
, 201
5”.
NOVEMBER 2015
BECAUSE THERE’S MORE TO LIFE THAN WORK
HOW TO STAY CALM AND FOCUSED POWER OF YOGA
BACK TOTHE POWER OF AYURVEDA AND HOLISTIC BEAUTY
Samrath BediExecutive Director,
Forest Essentials


12 26VERDANT VENTUREThe man behind ForestEssentials, Samrath Bedi,on all things business,boardroom and beyond. Getthe scoop here.
PERFECT TIMINGKaronline Huber fromIWC Schaffhausen talkstimepieces and howcomplications can makeor break a watch.
ON THE COVER
COVER BYRAJWANT RAWAT
Volume 9 Number 7; November 2015Copyright Living Media India Ltd. All rights reserved throughout the
world. Reproduction in any manner is prohibited.
Printed and published by Ashish Bagga on behalf of Living Media India
Ltd. Printed at Thomson Press India Ltd., 18-35 Milestone, Delhi
Mathura Road, Faridabad-121007 (Haryana); A-9, Industrial Complex,
Maraimalai Nagar, District Kancheepuram-603209 (Tamil Nadu);
Published at K-9, Connaught Circus, New Delhi-110001.
India Today does not take responsibility for
returning unsolicited publication material.
MoreEDITOR-IN-CHIEF
AROON PURIE
GROUP EDITORIAL DIRECTORRAJ CHENGAPPA
EDITORPROSENJIT DATTA
DEPUTY EDITORPRACHI BHUCHAR
PRINCIPAL CORRESPONDENTSAURAV BHANOT
SENIOR CORRESPONDENTANINDITA SATPATHI
ART DIRECTOR RAJEEV BHARGAVA
ASSISTANT ART DIRECTORVIPIN GUPTA
SENIOR VISUALISER NAVEEN CHANDRA UPRETI
PHOTO EDITORVIVAN MEHRA
PRODUCTION HARISH AGGARWAL
(CHIEF OF PRODUCTION), NARENDRA SINGH, RAJESH VERMA
GROUP CHIEF EXECUTIVE OFFICER ASHISH BAGGA
GROUP BUSINESS HEAD MANOJ SHARMA
ASSOCIATE PUBLISHER (IMPACT) ANIL FERNANDES
SENIOR GENERAL MANAGER (IMPACT) JITENDRA LAD (WEST)
GENERAL MANAGERS UPENDRA SINGH ( BANGALORE)
VELU BALASUBRAMANIAM (CHENNAI)
DEPUTY MANAGER KAUSHIKY CHAKRABORTY ( EAST)
CONTENTS
ROUTE TO NIRVANAFrom physical fitness to mental stress, Arun Pandala from Sivananda Yoga Centre, Gurgaon, has all the solutions with him.20
02 GUIDE 06 FREQUENT FLIER 10 APPS 14 FASHION 16 NUTRITION 18 AFTER HOURS 24 BETTER LIVING 28 TOP SHOP 32 SPLURGE
November 2015 BT MORE 01

Experiment with Blazers
Who said that work blazers always have to be the same old, boring ones? From col-ours to fits, designs to lengths, there’s a whole gamut out there for you to choose from. A smart idea is to also go for formal-looking jackets that come in wonderful summer fabrics and can be taken from your boardroom straight to a trendy lounge bar.
Invest in Linen
Apart from looking great, linen as a fabric is very com-fortable too. Start with linen shirts that look great at work and then move onto linen pants. Extremely comfortable, the fabric allows you to breathe easy and yet look crisp. Go for the classic white linen shirt for sure. For col-our, soft yellow and powder blue are great options as well.
Wear Funky Socks
If your entire look is basic and simple, socks can be the much-needed fun addition. And since there is a wide va-riety in terms of colours, prints and patterns to choose from, you’ll never run short of options. However don’t go overboard and go for in-your-face ones; simple col-ours and small prints can be easily effective too.
Replace Trousers with Chinos
Lightweight and definitely more fashionable, chinos are the perfect re-placement when you’re bored of wearing the rather uninspiring trou-sers every day at work. They come in a large variety of colours, have more options in terms of the right fit and are supremely comfort-able making it eas-ier for you to shut-tle between multi-ple meetings, events and presen-tations without feeling a glitch.
THE GUIDE
HOW TO PULL OFF THE SEMI-FORMAL LOOK AT WORK
Sharnamli Mehra Adhar,
Co-Founder, The Pink Post-Inc
2
1 2 3 4
Get a Denim Shirt
Denim is the ‘it’ fabric this season and jeans certainly aren’t the only way to wear it. Denim shirts work well with chinos and trou-sers alike and can be layered with a jacket as well. If it is Friday, feel free to try the denim-on-denim look; the trick here is to keep the top and bottom in different shades of denim though.
5


NO LONGER FOR JUST METROSEXUALS,a pedicure is a necessity for every working man today who spends hours wearing the same shoes, exercises and sweats and basically uses his feet to walk, run and jump. And contrary to what you might think, a pedicure has more to it than cutting your toenails and keeping them clean. It also involves removing of dead skin cells from under the feet and providing some care to damaged heels and calluses. Not to forget, preventing fungal infections, nail dis-eases and getting rid of foot odour issues.
WHAT YOU NEED A basic pedicure at requires easy-to-find-at-home grooming tools; make sure they are clean and sterilised to prevent an infection. An ideal kit would include towel, foot soak, pumice stone, cuticle stick and nail-care things such as clippers and cutters. You’ll also need a bowl of warm water and foot lotion.FOOT SOAK AND EXFOLIATION Before you start your pedicure at home, make sure to wash your feet with soap and pat them dry. Add the foot soak to the warm water, then dip your feet in it for about 10 minutes. This will ensure that the epidermis of the skin is softened, while the fragrance will help you get rid of foot odour. Begin the skin exfoliation by rubbing the pumice stone against your skin. It will help you get rid of dead skin cells.NAIL CAREPush your cuticles back using the cuticle stick. This might hurt so be a bit slow and gentle.Make sure you don’t ever cut the cuticles as that can cause infections and bleeding. Use the nail clipper to trim your toenails. Cut the nails straight, just above the skin to prevent in-grown toenails. Shaping your nails is not a necessary step, but it makes the nails look well groomed. File the nails in a left to right motion instead of a back and forth motion to avoid cracking and splitting. Wash your feet again with fresh water and dry them with a towel.Massage and moisturise your feet to maintainthe results of the pedicure.
GIVE YOURSELF A PEDICURE
M
Keep your Wallet SafeLosing one’s wallet is perhaps one of the biggest fears among men today. After all, it is the one thing that contains cash, credit cards, business cards and other important stuff that’s way too essential to be managed without. But thanks to Grabado Tech + Wallet by Cross, the brand that’s single-handedly aimed at creating personal accessories with a touch of technology, you can now breathe easy and stress-free. Probably one of the first luxury smart wallets, this one has an integrated tracking system that works via Bluetooth and syncs with the free to download Cross Tracker App on your smartphone/tablet helping you find it if and when it goes lost. .
Price: Starting at `4,999 Availability: Major retail websites online
04 BT MORE November 2015
STAY CALM, STAY RICH
THE GUIDE


6 BT MORE November2015
LUFTHANSA HAS COME UP WITH the best way to deal with long transits, albeit for a lucky few. If you’re a privileged HON Circle member or are flying first class, forget spending those weary transit hours cooped up in the lounge. Available exclu-sively at the Frankfurt airport is a service to rent a Porsche and zip around the city for a few hours. Offered by Lufthansa’s cooperation partner Avis, opt for a Porsche 911 or the Porsche Panamera under the short-term rental offer. You can take the stunner for a spin even after reaching your destination so long as you
bring it back by the time of the rental agreement. Lufthansa lets you book this feature at any stage of the flight. The Avis staff help you plan your route around the top tourist attractions and smooth drives around the city. We suspect that there will be quite a few takers for Lufthansa First Class now that it comes with the option of zipping around in a Porsche.
3-hour rental including 150 km, fuel and
applies exclusively to HON Circle Members and First Class passengers
FLY THE PORSCHE INCENTIVE
WORTHY OF LOYALTY The Taj Inner Circle loyalty programme has undergone a user-friendly reboot. New tiers have been introduced, so you can find a fit anywhere between Copper and Platinum. Blackout dates have been done away with and the points are carried over to the next year just so long as you’ve visited a Taj property once in a year. Additional luxury experiences in case you get an upgrade or are in the holiday mood include wreck-diving in the Maldives and champagne afternoon tea with 24-carat gold flakes. Thanks to dynamic redemption rates, you get the best off-season tariffs. https://www.tajhotels.com
BEST OF BOTH WORLDS
IT’S A DATEEvents to attend this November
5 Experience the best of
both worlds at the Luxury
Travel Fair by Conde Nast
Traveller in Olympia.
www.luxurytravelfair.com
9 PURE Conference organised
by Australia Tourism is
the best place to connect
with industry experts and
high-profile players. Hob-
nob with the it crowd.
www.purelifeexperiences.com
18 The Big Boys Toys is
bigger than ever in Abu
Dhabi this year. Expect
yachts, private jets,
boutique properties and
home theater systems.
www.bigboystoysuae.com
FREQUENT FLIER


ONE YEAR OF BLISSIf you have a year or six months to spare along with a truckload of money, the Ultimate Luxury Around the World Wellness Trip can be yours. Crafted painstakingly by Health and Fitness Travel, the wellness-regime-cum-trip promises a soul overhaul. Starting from Spain and ending in Brazil, the excursion has multiple stops in 20 countries. As a long-term response to the idea of holistic wellness, it may just have hit the spot. Experiences range from Tai Chi classes on the summit of Vietnam’s Marble Mountains and hiking in Gros Piton Mountain, St Lucia to a South African Safari. Like-minded individuals will be accompanying you along with professional wellness consultants.
www.healthandfitnesstravel.comTaking a page out of Phileas Fogg’s book and dousing it in luxury, Robb Report is offer-ing a curated 23-day voyage around the world. Cherry-picked by fussy editors of the luxury lifestyle magazine, the trip involves a spin around the globe a la millionaire style. To be operated by private-jet tour company, TCS World Travel, it promises sensorial extravagance while touching down in the most luxurious resorts. Bask in bespoke insider
experiences across hospitality, wellness, gastronomy and automobile industries as youget lost in the sweeping narrative. The lucky 52 guests will be flying in a customised Boeing 757-200ER fitted with 180-degree flatbed seats. Being Robb Report, aboard the flight will be an executive chef and journey managers who will ensure a personalised experience for each guest. Scheduled from October 13 to November 4, 2016, the trip starts at Honolulu and weaves its way across the globe before culminating at Robb Report’s Car of the Year event. Prices yet to be released. Visit www.TCSWorldTravel.com
LUXURY VOYAGE BY ROBB REPORT
AROUND THE WORLD WITH ROBB REPORT: A GLOBAL JOURNEY BY PRIVATE JET
Hopper Free It claims to save a whopping 40% on
flights by predicting the optimal time slot to book tickets. By identifying cheap dates easily accessible on a colour-coded calendar, it takes the stress out of booking. Partly, of course, it’s applicable for fliers with flexible travel dates. No need to be on your toes, the ‘Watch a Flight’ feature sends a push notification when prices are at their lowest. Score a deal on your next flight.
itunes.apple.com
APP CORNER
M
8 BT MORE November 2015
FREQUENT FLIER
PRANAAM TO THIS SERVICEThe most luxurious corner in Chhatrapati Shivaji International Airport , T2, Mumbai, has upped the ante. Its newly launched Pranaam GVK Guest Services programme comes with a guest service officer. Sit back as they handle your check-in, arrange for international calling cards and whatever personalised services you may require. Additionally, its lounge is fitted with sleep pods. Don’t worry about missing your flight as they send boarding alerts. If feeling fidgety, stroll through Jaya He museum for a glimpse of the largest public artworks.


Gone are the days of pen-ning letters or cutting calls short because of sky-high costs. The inter-net has opened up a daring new universe of staying in touch – from any-where. Travel is more fun when you can share updates.
2
SKYPE (Android, iOS, Windows Phone, Blackberry) Free
When travel-ling abroad, Skype comes in handy to
stay in touch. Users can send instant messages, exchange files and im-ages, send video mes-sages and create confer-ence calls. Skype is avail-able for downloading onto computers running Microsoft Windows, Mac or Linux, as well as Android, Blackberry, iOS, and Windows Phone smartphones and tablets. Much of the service is free, but users require Skype Credit or a sub-scription to call landline or mobile numbers. Staying in touch is easy.
TECHNOLOGY
WHATSAPP (Android, iOS, Windows Phone, Blackberry) Free
Whatsapp is the latest entrant in VoIP calling apps. WhatsApp Calling
lets you call friends and family using the app for free, even if they’re in another country. Currently, WhatsApp Calling is available on Android, iP-hone and BlackBerry 10. The quality of calls seem alright, but not on the same level as dedicated calling apps like Viber and Skype.
GOOGLE HANGOUT (Android, iOS) FreeGoogle Hangouts link your ex-
isting Google ac-count letting you view all Gtalk and Google+ contacts
in one place. Start a hangout where you can message each other or use Google’s video and audio calling feature. Hangouts also integrates well with other Google apps for iOS. You can turn a Hangout into a live video call with up to 10 friends. Good for confer-ence-type interactions.
LINE (Android, iOS, Windows Phone, Blackberry) Free
With Line, ex-change free in-stant messages with friends either
one-on-one or on group chats. This one’s available for PCs as well if you don’t want to finish all your mobile data. Voice and video calls with friends are free with LINE. You can make unlimited free calls to other Line users and send and receive text mes-sages even when roaming.
10 BT MORE November 2015
VIBER (Android, iOS, Windows Phone, Blackberry) FreeThis one allows you to call or text national or international Viber users for free. Not eve-ryone in your group has Viber? ‘Viber Out’ is a new feature that lets you call landlines and non-Viber users at low rates, helping you connect across the globe. If you’d like to pay VoIP calls to landlines and other mobile users, this is your go-to feature. Viber Out
calls will cost you, but they start at 1.9 cents per minute and vary depending on the country you’re calling. Viber is also cross platform, with apps for Android, iOS and Blackberry.
STAY IN TOUCH WHEN GLOBE TROTTING


UNDERSTANDYOUR BRAND ANDSTAY TRUE TO IT”
“
Samrath Bedi, ExecutiveDirector, Forest Essen-tials India, on the brand’srise and his mantra forstaying stress-free.
TEXT BY SAURAV BHANOT
12 BT MORE November 2015
TRAILBLAZER
REAL BEAUTY MAY BE SKIN DEEP BUT there’s no denying the need for a little help. No one un-derstands this better than Samrath Bedi (41), Executive Director, Forest Essentials India who began his career with Standard Chartered Bank in New York in 1999. It was an unlikely transition to Forest Essentials, a luxury ayurveda brand conceived and launched by his mother in 2001. The brand is a pioneer in the luxury cosmetic space today, a fact further validated by its partnership with Estee Lauder in 2008, making it the first Indian brand in the global beauty brand’s roster. No one sells authentic ayurveda better than him. In an exclusive, he talks to BT More about the brand’s ethos, journey so far and what it takes to become an entrepre-neur in a crowded marketplace.
THE BRAND USPWe use rare and precious ayurvedic ingredients includ-ing the sanjeevni herb known for its incredibly rejuve-nating properties, aged cows’ ghee with potent herb and root infusions, pure gold bhasma made into pastes with detailed ayurvedic processes for its firming and toning properties and heightening the lustre of skin. This makes our products truly pure and unique.
THE JOURNEY SO FARAt the time I joined Forest Essentials, it was a venture that my mother had started from scratch. Today it is a pioneer in the luxury ayurvedic segment and has be-come the quintessential Indian beauty brand where secrets of ancient beauty rituals for skin and hair care

Phot
ogra
ph b
y R
AJW
ANT
RAW
AT
November 2015 BT MORE 13
have been brought to life. We are now present in 38 standalone stores across 12 cities all over the country, in the most premium locations, with 10 more in the pipeline this year.
COMPLETELY MADE IN INDIAWe are looking at international expansion in 2016 for which plans are now being worked out. What really works for us is that we are all about luxury and ingre-dients that are sourced with care and are of the highest grade and quality. We use traditional Indian formula-tions that are made entirely within the country.
HOW TO BE A SUCCESSFUL ENTREPRENEURThe best way to grow a brand is to ensure that you
stay true to it and know what it stands for. On my part I have made sure that the brand sticks to two primary fundamentals–quality products and responsible growth. Along with the brand’s growth, we have made sure that each stakeholder grows with us.
HANDLING STRESSSpend time with loved ones doing things you really en-joy. Get some exercise, a good night’s rest and make healthy food choices. Meditation is a great option to calm your mind as is aromatherapy. Every essentials oil has its own properties, so lighting a burner with a few drops of scented oil to relax our energies is some-thing that anyone can do. Yoga for an hour 3 times a week not only tones the body but also calms you.
We are truly a Made in India brand and
use traditional formulations to
produce top-notch products.

14 BT MORE November 2015
FASHION
* all prices on request
RULEOFTEN
Aneesa Dhody Mehta, Founder, Creative Co
When it comes to men, it doesn’t take much to come up with a wardrobe that’s comfortable,
classic and charismatic. Even if you aren’t really tuned into fashion, these simple hacks can take your look from good to great. We’ve got Aneesa Dhody Mehta, Founder of Creative Co to give you the ten evergreen style staples every man must have in his wardrobe. These will take you most places in style and yet keep you within your comfort zone. Read on and give your wardrobe that much-need style upgrade this season.
Formal JacketAn alternative to a black
jacket, this breaks themonotony in your closet.You can wear these pas-tel shade pieces to work
and informal events.Brand Corneliani
Availability DLF Emporio,Vasant Kunj, New Delhi
Wrist BandsNothing works better than these leather wrist bands if you want to add an ele-ment of cool to your look. Get these in a dark shade.Brand Bottega Veneta Availability DLF Emporio, Vasant Kunj, New Delhi
WatchNothing is better as a man’s accessory
than a good-looking timepiece. This watch goes easy from day to night.
Brand Rolex Cosmograph DaytoneAvailability kapoorwatch.com
SneakersProbably the god of
casual shoes, sneakers are your perfect day
wear. And white is your go-to-colour.
Brand GucciAvailability DLF Emporio,
Vasant Kunj, New Delhi

Blue DenimsWith jeans, the trend thisyear is to have them inblue and keep them fadedand slightly distressed.Brand DSquaredAvailability harrods.com
White ShirtAn absolute must-have, a crisp white shirt is as es-sential to a man’s ward-robe as perhaps his inner-wear. Or maybe more. Brand Armani CollezioniAvailability armani.com
Big BeltThe bigger the belt is, the
more stylish it looks. And one in solid black is
always prefered over other shades. Brand Hemes
Availability hermes.com
Boat ShoesFrom jeans to trousers and
chinos, these go with everything. Brand Tod’s
Availability DLF Emporio, Vasant Kunj, New Delhi
Sunglasses Aviators are classic frames and reflectors are big-time
trendy this year. Brand Ray Ban
Availability All leading eyewear stores
Polo T-ShirtThe most multi-purpose of all casual wear, polo t-shirts go with jeans, linen
pants and trousers with complete ease. Brand Ralph Lauren
Availability ralphlauren.com
November 2015 BT MORE 15

INCLUDE DIETARY FATSWithout some dietary fat,you can become deficientin essential fatty acids andhave trouble absorbing vi-
tamins that are fat-soluble. Also,certain kinds of fat — unsaturatedones — help protect your heart,reduce type 2 diabetes risks. Low-and no-fat foods aren’t alwayslower in calories.
RISKS NOT WORTH TAKINGDon’t fall for empty promiseswhile looking for a quick healthfix. High protein diets claim that
you’ll lose pounds and reduce yourrisk of heart disease but the truth isthat fat comes from too many calories,not too many carbohydrates. People instarved states experience problemswith brain function. A high-proteindiet also overworks the kidneys.
BOOST BRAINPOWERRely on foods rich in Omega-3fatty acids such as flaxseeds andwalnuts and those that are high
in magnesium. This includes bananas,lentils and figs to fuel up your braincells. Omega-3 helps in better objectrecognition memory, spatial and local-ised memory and adverse response re-tention. Foods rich in choline such aseggs, cauliflower and soybean mayalso support the brain during aging.
1
2
4
5
63
EAT WELL TO STAY IN TOP FORM
Know when to gorge and when to snack. More importantly, know the foods that do your body a world of good. Here’s how you can follow a
diet plan that’s simple and completely balanced.
BREAK THE FASTYour body responds to not eat-ing for hours by slowing down its metabolic rate. By having breakfast you wake up your metabolism and get your en-
gine humming, burning those calories to lose weight. Research suggests that people who eat breakfast are less likely to overeat later in the day. Skipping breakfast can increase sugar cravings as well. Your breakfast should be a combination of proteins and complex carbohydrates.
DON’T DRINK YOUR CALORIESIt’s very easy to drink a lot of calo-ries without realising it. Cutting liq-uid calories can be more effective for weight loss than cutting the
same number of calories from your solid food intake. Calories from solid foods don’t disrupt functioning of appe-tite-regulating hormones.
DON’T GO GLUTEN-FREE These claim to improve gut health, cure stomach problems and aid weight loss but be wary of its side-effects. Gluten may help fight heart disease by low-ering levels of triglycerides
and help reduce high blood pressure. As for weight loss, a gluten-free diet may backfire. Many foods without gluten are higher in calories, fat and sugar than the wheat-based versions.
NUTRITION
DR LOVNEET BATRA Clinical Nutritionist, Dietetics, Fortis La Femme
Your brain relies on glucose for energy. It’s im-
portant to evenly distribute your carbohydrates
through the day. To get a steady supply of glu-cose, include
complex carbo-hydrates such as
dalia, lentils, beans, oatmeal and amaranth.

GET ACTIVELaziness and inactivity kill justas many people as smokingdoes. Long hours of sitting canshorten your life span. Don’t betied down to your desk, stand
and stretch every 20-25 minutes. Get atleast 60 minutes of physical activity per day.You don’t have to rely on your gym mem-bership for that. Walk the dog, dance, workin the garden or ride your bike.
November 2015 BT MORE 17
7 9108 MAKE FIBRE A PRIORITY
Fibre, found in whole grain wheat, bar-ley, oats, as well as in fruits, vegetables and beans, helps keep things moving easily through the digestive tract.
Remember that grain fibre has different nutri-tional benefits than fruits and vegetables, so you need both. Fibre is also filling, providing volume with few calories because our bodies don’t have the enzymes to break it down.
LIMIT NIGHTTIME NOSHINGAfter dinner, teach yourself to think of the kitchen as being closed for the night, and brush your teeth — you’ll want to eat less with a newly cleaned mouth. If a craving hits, wait for 10 minutes. If you’re still truly hungry, reach for a cup of milk, yogurt or a piece of fruit. Sit down, formalise and eat from a plate (even if it’s a snack). You tend to eat more recklessly, when you eat in the kitchen, out of the fridge, or in front of the TV. Call a friend, take a walk or read a book but don’t binge out of stress.
EAT WHAT YOU LOVE Don’t ruin your favourite foods with guilt. Deprivation and shame are power-ful emotional triggers for overeating. Remind yourself that all foods can fit into a healthy diet when you balance eating for enjoyment with eating for nourish-
ment. It’s absolutely okay to give in to the occa-sional craving when you’re primarily eating home-cooked food and exercising.

AFTER ABOUT 25 YEARS OF WORKING WITHSingapore Airlines, David Lau (51) has incredible insights intothe state of mind of the discerning Indian traveller. Here, heexplains why India is on the map for global travellers.
#A New Class of Travel The business traveller inIndia has evolved into a seasoned consumer of services. Theyhave new demands and expectations that we have to keepupdating ourselves to. We are looking into personalisationof services pertinent to savvy and travel-oriented Indiancustomers. We are introducing our new premium economyin India (Delhi and Mumbai) later this month, based onfeedback received from our customers. It has been tailoredto provide passengers with an alternative to medium to longhaul travel by paying a little more. This means access topriority check-in, priority baggage and an increased baggageallowance. Other features to look forward to would be a widerange of in-flight offerings including a ‘Book the Cook’ ser-vice, champagne, curated wines and a specially-designedcollector’s edition amenity kit.
#India as a Popular Destination A market of1.25 billion people certainly holds a lot of potential for us. It’sjust the tip of the iceberg. We expect to see more traffic interms of business, meetings, incentives and vacations. Indiansare travelling a lot more, reading more andthere is increased awareness about what’savailable. From the inbound perspective, therehas been a growing interest in India becausePrime Minister Modi is travelling the worldpromoting the idea of Indianness and all itentails. The country has become the newdarling of Asia and has become significantlypopular with tourists and businessmen fromSingapore and China given the investmentclimate in the country.
#Prioritisin the BusinessTraveller We value and notice the chang-ing preferences of business travellers. Many
of them don’t fly Business or First class out of India if they are travelling within Asia. They may be reluctant to pay a premium for short-haul travel and that’s under-standable. For these business travellers, premium economy is a new standpoint, a new travel experience. Business class travellers seek reliable service and a solid on-board experience where they can work, rest and have all the on-ground comforts while flying.
#What’s Cookin We have the widest list of special meals and preferences and the ‘shahi thali’ is new on the menu. This is an Indian platter than features a range of Indian delicacies designed by chef Sanjeev Kapoor. We have also re-introduced South Indian meals on our flights on popular de-mand. The ‘Book the Cook’ service is available on all flights originating from Singapore and travellers will also be able to pair their choice of meal with a glass of Ernest Rapeneau Brut Prestige champagne, which will be available throughout the flight on all routes. We have an international culinary panel comprising chefs and food experts such as Alfred Portale and Suzanne Goin from the United States, Sanjeev Kapoor from India, Carlo Cracco from Italy, Georges Blanc from France, Matt Moran from Australia and Yoshihiro Murata from Japan, who helped design these new menus.
#Brand Value Our core strength lies in providing a top notch in-flight experience through our exceptional crew. We have become more ef-ficient and today cater to the business class traveller’s demands. We literally wrote the book on luxury travel. We believe in the con-sistency of service, irrespective of whether the crew on board is Indian or Singaporean. We offer passengers a sense of familiarity, security and the feeling of being at home as service is personalised. Profiling our customers with the help of a computer application assists in ser-vice innovation as well. The idea is to treat the customer as a person and not as a digit and that’s what we thrive on.
Consistencyestablishes a
benchmark forcustomers. That’show we literallywrote the book
on luxury.
“INDIA IS THE NEW DARLING OF ASIA’’David Lau, GM of Singapore Airlines, India, on luxury travel, the Indian business class traveller and why the world loves India.
TEXT BY SRISHTI JHA
18 BT MORE November 2015
BRAND SPEAK

General Manager of Singapore Airlines,
India, David Lau

WELLNESS
Yoga Asanas Photographs by RAJWANT RAWATCoordination by ANINDITA SATPATHI AND NAMITA CHOWDHARY
Modelled by ROHIT MALIK, PRAVEEN RANA, MANBEER RANA
IMAG
ES B
AZAA
R
BY ARUN PANDALA
The modern man needs all the help hecan get. Squeezing in multiple re-sponsibilities into a meagre 18 hourscan be draining. Each day is a chaotic
schedule of dropping the kids off at school,pulling off deadlines, driving through intermi-nable traffic snarls and dealing with a trickyboss and colleagues. Effectively, he isSuperman, but without any superpowers.
When and how does he take care of hishealth? How does he get rid of accumulatedmental and physical tension? How can hedevelop some peace of mind? Is it possible forhim to lend himself some focus, balance, har-mony, and happiness?
Yoga has helped mankind for over fivethousand years. Through generations, it has come to the rescue with its time-tested meth-ods. Yoga has offered solace and comfort, and a path to fitness and well-being. Here’s what you should know to reap its benefits.
YOGA SHOWS THE WAY
FROM MAN TO SUPERMAN
Arun Pandala is co-founder,
co-director and senior acharya
at Sivananda Yoga Centre
Gurgaon

DYNAMIC EXERCISE
A dynamic exercise is one that’s challenging, ups the
breath, induces sweating and builds muscle strength making you feel better mentally too. Suryanamaskar is an age-old
method of full-body workout. It improves blood circulation,
strengthen muscles, heightens flexibility, gives an excellent
workout to the heart, increases breathing capacity, induces
sweating and improves mobil-ity of all joints and body parts. It is a set of twelve asanas or postures strung together in a specific sequence. It brings
about fitness, agility and over-all well-being. Men enjoy the suryanamaskar because it is
active, increases the heart rate and needs exertion.
1 86
2 9
3 10
4 11
5 127
November 2015 BT MORE 21

22 BT MORE November 2015
BREATHING BETTERInstead of recouping after a hectic week by resting throughthe day, opt for pranayama. For boundless energy, try yogic breath, kapalabhati and alternate nostril breathing during dawn and dusk . A 15-minute practice is sufficient, but it needs to be learnt properly over a period of a few weeks from a trained yoga teacher to stretch it to 30 minutes.
TRAINING THE MINDMeditation, or dhyana, is a very beneficial practice. Traditionally, meditation has been an anchor to find peace, calm, balance and focus in a chaotic world. It helps balance the logical and intuitive side of a man’s brain, and reduces anger, annoyance, worry and fear. Meditation is an antidote for modern illnesses such as blood pressure and insomnia.
BUILDING THE CORE
The Sitting Forward Bend or Paschimottanasana gives a good stretch to the spine and helps to reduce tension in the back muscles built over prolonged hours of sitting. It also helps stimulate ab-dominal organs, which help in digestion.
The Bow, or Dhanurasana, gives a full workout to the back, from the neck to the tailbone, relieving and preempting back pain and. It also massages the abdominal or-gans and reduces belly fat.
The shoulder Stand or Sarvangasana is beneficial in re-ducing stress, improving heart func-tion and getting more blood circula-tion and oxygen to the brain. It also stimulates the thyroid gland.

November 2015 BT MORE 23
WELLNESS
YSTEMATIC RELAXATIONSavasana or yogic relaxation is an antidote tostress. When the body is relaxed and the mind isfree from tension, you take good decisions andhave a calmer approach to daily challenges. Deep,guided, systematic, step-by-step relaxation givescomplete rest to the heart, brain and the digestivesystem. This, in turn, induces better sleep andmakes you feel energetic. It’s a simple, uncompli-cated practice, which gives instant results andyou don’t need to spend a lot of time on it.
The Triangle or Trikonasana is a lateral bend, completing five different spinal movements, each of which provide in to-tality, a full and complete workout for the spine and all organs. It increases mental and physical equilibrium.
The Spinal Twist or Ardhmatsyendra asana helps to stimulate all abdominal organs, specifically the prostate gland in men. By giving a rare lateral twist to the spine, it tones the back muscles while keeping the spine steady.
This is modern man’s new frontier – the ancient practice of yoga. For someone who has very little time or space, any of the above techniques can be practiced independently, in combination or in totality. This is the way to great health and well-being. As Swami Sivananda, one of modern India’s leading spiritual masters said, yoga has the power to transform a man to a superman. His world-famous student, Swami Vishnudevananda declared “Health is wealth. Peace of mind is happiness. Yoga shows the way.”
MAN’S NEW FRONTIER

SINGLE TASKINGIrrespective of what is ex-pected of us, the mind isdirected towards perform-ing only a single task at
any given point of time, not multi-ple tasks. Multi-tasking causesfragmentation, stress and poorquality, while single tasking en-sures quality work, higher produc-tivity and a sense of calm and as-suredness. Focus on one thing at atime for reasonably large chunksof time. Top App 30/30
EAT HEALTHYSticking to a goal of eatinghealthy is easier when com-bined with physical exercise.
Millions of articles on this can be con-densed into three simple instructions.Eat 25 per cent less food/calories; re-place processed foods with whole, highfibre food and drink water/tea/coffeewithout milk and sugar.Top App MyFitnessPal
JOT DOWN REMINDERSAs we race through the day, in-numerable bits of information–tasks, recommendations, ideas,
notes–come to us from multiplesources. We cannot trust our brains toremember all of it. Unwittingly, seek-ing to remember also creates anxietyabout forgetting or straining yourmemory when you’re unable to recallsomething. The trick is to write every-thing down.Top App Wunderlist and Evernote
1
2
4
5
63
EMBRACE BOTH THE UPS AND DOWNS
Founder and CEO of Sulekha.com Satya Prabhakar shares ten ways to stay calm, focused and in control of your work and personal life.
DEVELOP ROUTINES Any task that requires you to decide between options draws on your limited reserves of will-power. If we can convert tasks that we want to cultivate into
habits within a scheme of an unthink-ing routine, (such as brushing teeth) the routine gets simpler. It shouldn’t be taken as a rule, but the Nike advertis-ing slogan “Just do it” makes a lot of sense because it exhorts us to perform rituals without taxing our prefrontal cortex. Top App Habit Master
EXERCISE IN SOME FORMPhysical exercise not only produces calm-inducing endorphins, it also leads to superior intellectual prow-ess. Accept it without questioning and make time for it no matter
what. If the President of United States has time for it, so do we.
OSCILLATE Avoid doing one thing for too long. Our tasks must oscillate from peri-ods of intense activity (increasingly more stren-uous) to a period of re-laxation and joyful activ-
ity. This has proven to improve pro-ductivity while reducing stress.
BETTER LIVING
As the fine line between work and play blurs,
find your balance in daily routines. The trick is to live
in the moment whether you’re
working or relaxing. Being
in control of your life and keeping
stressors at bay is just a matter of
discipline.
SATYA PRABHAKAR Founder and CEO of Sulekha.com

TIME FOR LEISURENo matter how busy you are,you have to take time out foractivities that make you happy.This is essential and critical forrejuvenation and for you to begood at your job. While activi-
ties that involve creating something or mas-tering a skill are most beneficial in the longrun, even vegetating in front of the TVcounts as a winding-down activity.
November 2015 BT MORE 25
7 9108 PLAN AND PONDER
Periodic planning (yearly, monthly, weekly, daily), even if we are unable to stick to the prescribed timeframe, will offer us control over what we’re doing.
Planning defines the target areas and qualifies priorities. The converse of planning—retrospec-tion—is also essential to figure out what we should be doing differently. Make it constructive and don’t blame yourself for past decisions.
FAMILY AND FRIENDSThe roller coaster of life requires a stabilising force that most often comes in the form of friends and family who are somewhat distanced from your professional life. These are often people who are equipped to offer support and counsel. However, these equations and relationships must continually be renewed to be meaningful. No one ever got anything meaningful out of a one-sided, convenience-based friendship.
SMILE AND MEDITATELife can be worse. Smile. Life can be bet-ter. Meditate. Both of these simple, yet very hard-to-pull-off activities are guar-anteed de-stressors. They say an entire month’s worth of stress can be unrav-elled by a solid session of meditation and
they aren’t wrong. Similarly, smiling can infuse your body with energy you didn’t know you had. And, it makes everyone’s day brighter.

Karoline Huber, Brand Director, IWC Schaffhausen (Middle East and India)
Photograph by M ZHAZO

November 2015 BT MORE 27
KAROLINE HUBER, BRAND DIRECTOR OF IWC(International Watch Company) navigates the world ofchronographs with ease. She rattles off the benefits of a per-petual calendar and minute repeater pausing for breath onlyto smile in recollection of her first ever IWC watch. In her lineof work, she has to wax eloquent about these creations, but theadmiration feels heartfelt. As a representative of one of theiconic faces of the famed Swiss watch industry, she reveals herfascination with the world of premium horology.
Startin Youn My first watch was an IWC timepiece–the Pilot Mark 8. Without completely grasping its value, I cher-ished it because it was a gift from my father on my 14th birthday.I came to appreciate the watch as I got older and became inter-ested in the art of watchmaking. Things don’t always pan outthe way we want it to and I wound up in an advertising agency.It was much later, eight years ago to be precise, that I met IWCCEO Georges Kern and worked with him on a project. The workwas utterly absorbing and when he offered me a permanentprofile with IWC, I jumped at the chance.
India Connect The Indian market is primed for theclassic Swiss watch brands. India is a very distinguished mar-ket when it comes to luxury products and it has strong rootslinking it to luxury within their culture, such as yellow gold.To take up these distinctive Indian codes and incorporate itwithin the narrative of luxury, for me, is the challenge. India has this exuberant, vibrant and opulent strain whereas IWC’s vibe is very classic and understated in design.
Herita e In the business of watchmak-ing, the Swiss label sets a benchmark of per-formance. IWC’s 147-year-old heritage is American with a heavy tilt towards German precision. Being located in the German-speaking part of Switzerland, the manufac-turing and assembling processes are heavily influenced by our legacy. What it means for the brand is minimal frills and very compli-
cated movements. As a purveyor of timeless classic designs, there’s no question of following trends for IWC. But, with smartwatches, we need to consider the inevitable transforma-tion of the watch industry.
Jewellery Watches I am not personally very keen on jewellery watches. Some bejewelled timepieces are breathtak-ing but often the aspect of smart functionality is missing. Seemingly devised for aesthetics and not for practical use, these often fall into the category of purely ornamental. I can, however, appreciate the remarkable craftsmanship that goes into the setting of stones. IWC has a clear brand identity - ‘Engineered for Men’ and, funnily the longer you tell a lady that she can’t have something, the more she wants it. Consequently, we have a very large and loyal female clientele, who love these big timepieces as well the more dainty ones.
Special Touch Chronographs are a little like windows into the soul. IWC’s product portfolio has a big range of com-plications–from tourbillons, perpetual calendar and retrograde date to hand-wound movements. The profile is made more exclusive with the production of in-house calibres. It’s remark-able how enduring watchmaking is. Minute repeaters, created well over a century ago to reflect the passage of time through quarter hours is a clever complication coveted even today.
Wrist Style Choose timepieces that suit your personality and your style preferences. Go classic or retro. A tourbillon
movement watch is immediately recognisable as an expensive timepiece, with a complicated construction. The assembly and manufactur-ing processes are equally difficult because of the tourbillon’s movement, which also lends a distinctive look to any wrist. For a gentle-man who feels that the watch is first and foremost for himself and that it should be complicated on second sight rather than first sight, I would recommend a perpetual calen-dar. To me, it’s a very refined watch that demonstrates class and style–a person who understands and loves his timepiece.
The Swiss watch heritage is what
makes it timeless but we can’t ignore
the trend of smartwatches either.
INTERVIEW
“THE LUXURY MARKET IN INDIA IS DISCERNING”Karoline Huber, brand director for Middle East and India, IWC Schaffhausen,
on her love for watches and how to choose them
TEXT BY ANINDITA SATPATHI

FASHION
Layers of PerfectionWith autumn-winter comes the time to layer
up. And nothing does that better than a smart trench in a soft colour. This one from Michael
Kors is not just easy on the eyes but will effectively go from formal to casual clothing
without any trouble whatsoever.
Availability Michael Kors stores across IndiaPrice On Request
TOP SHOP
28 BT MORE November 2015
FITNESS
Band BasicsNot only is the Fitbit
Surge a snazzy wearable and a power performer, it
has GPS connectivity. It is fully functional even
when your smartphone’s not in the vicinity. So, no
joggling pockets when you’re running.
Availability www.amazon.com Price On request
GADGET
Bark Redefined Jarre Technologies has come up with the coolest range for the wonky kid in every man. The AeroBull HD, replete with perky ears and glares, makes a state-ment in matte black. It’s play-ful vibe makes it a perfect fit for your man den. The dog produces 120 watts of HD sound through a 2.1 sys-tem.
Availability Jarre’s Singapore outlets Price `1.18 lakh
HEADPHONES
Play It By Ear The Soundlink Around-Ear Wireless Headphones II are a nifty buy. It’s great engineering combined with durability that delivers top-notch acoustics.
Availability Select Bose dealers Price `21,150
FROM FASHION TO GADGETS, THE BEST THINGS MONEY CAN BUY

November 2015 BT MORE 29
PEN
Star Legacy Celebrating the inimitable style of Kahlil Gibran, Montegrappa in association with the Gibran National Committee has crafted excellence. A mid-night hue of blue streaked with lighter shades, it has a palladium plated trim and delightful pocket clip.
Availability DLF Emporio, Vasant Kunj, New Delhi Price `1.16 lakh
TELEVISION
Vintage Wonder Gadgets that make you feel warm and fuzzy inside are rare because they cater to a higher spectrum of feeling but the Samsung Serif TV may change all that. For the artsy design and adorable spindly legs, thank Paris-based design firm by Ronan and Erwan Bouroullec. Available in white, blue and red.
Availability Yet to be released Price On request
SHOES
Happy Feet This pair is as happy as its eponymous designer. We ‘re talking about the Originals superstar super-shell low shoes inspired by Pharell Williams. There’s a toe cap littered with flowers that gets swallowed into a zany white silhouette. The rubber shell toe isn’t its only selling point–there’s a padded collar and herring-bone pattern rubber.
Availability Select Adidas outlets Price On request
BRIEFCASE
Knight in Gold Tom Ford’s pebbled leather brief-case with a single gusset is lush fashion personified. The gold hardware with embossed logo and top handle add to its under-stated vibe.
Availability www.bergdorfgoodman.com Price $2,950

TOP SHOP
30 BT MORE November 2015
FURNITURE
Study Style The Doc Pedestal table is pared down minimalism combined with a stunning silhouette. Arching into a column encasing a sleek slab of wood, it’s a study must-have. Designed by the artistic Fred Rieffel for Roche Bobois.
Availability Roche Bobois outlet at Indiabulls Finance Centre, Mumbai Price on request
ACCESSORIES
An Italian Job The Maserati Quattroporte Limited
Edition collection has the aesthetics of Ermenegildo Zegna woven into it.
Reminiscent of the car model’s platinum silk tone, each product has the soft look of
silk and the burnished feel of leather.
Availability Select Zegna stores Price On request
SHOES
Shoe Fetish The hipster look is incomplete with-out a good pair of moccasins and Louis Vuitton’s Monte Carlo collec-tion has just the thing. This suede pair is informal, classy and very easy on the eyes and feet.
Availability www.louisvuitton.com Price On request
SUNGLASSES
Super Vision The Ray Ban Clubmaster gets a makeover with cherry, maple and walnut accents in the brand’s Autumn/Winter collection. Gentler than the macho original, these are for the men who habitually vacation in the French Riviera. We’re crushing on the moody shade of green.
Availability Sunglass Hut outlets Price On request


32 BT MORE November 2015
PACKED WITH ENOUGH LUNAR ELEMENTS TO MAKE A PACK OF WOLVES DELIRIOUS, the Hublot Classic Fusion Aeromoon is a statement skeleton watch piece. The King Gold version is a lavish affair with a case that’s polished and satin-finished in the brand’s proprietary gold–mixed with a pinch of platinum. The sapphire
crystal dial and faceted indexes lends the regal piece a sharp feel, setting off a trend that’s sure to be a hit in Basel. Much of the restrained vibe of the piece is attributable to the open-worked triple calendar–its hefty case belies a slim
silhouette, very obvious when you slip it on. The moon phase at 6 o’clock gives a clear view of the lunar cycle despite a stylishly frosted glass. It pops a cheeky surprise in a dial that’s otherwise rigidly exquisite. It has a power reserve of
42 hours and a Self-Winding Moon Phase movement HUB1131. Black rubber and alligator straps complete the look. Price £11,300+taxes Availability www.thewatchgallery.com
TO THE MOON AND BACK
SPLURGE

