business & strategy update -...
TRANSCRIPT

© 2007 ASM
Q3 2007 Results
Proprietary Information
Business & Strategy Update

© 2007 ASM Q3 2007 ResultsProprietary Information 2
Safe Harbor Statements
All matters discussed in this business and strategy update, except for any historical data, are forward-looking statements. Forward-looking statements involve risks and uncertainties that could cause actual results to differ materially from those in the forward-looking statements. These include, but are not limited to, economic conditions and trends in the semiconductor industry generally and the timing of the industry cycles specifically, currency fluctuations, the timing of significant orders, market acceptance of new products, competitive factors, litigation involving intellectual property, shareholder and other issues, commercial and economic disruption due to natural disasters, terrorist activity, armed conflict or political instability, epidemics and other risks indicated in the Company's filings from time to time with the U.S. Securities and Exchange Commission. All statements are made as of the date provided and we assume no obligation nor intend to update or revise any forward-looking statements to reflect future developments or circumstances.

© 2007 ASM Q3 2007 ResultsProprietary Information 3
ASMI’s Organizational Structure
• ASMI has a dual listing on NASDAQ (1981) and AEX (1996)• Significant trading volumes on both exchanges
Total employment as of September 30, 2007
ASMEuropeASM
EuropeASM
AmericaASM
AmericaASM
JapanASM
Japan
100.0% 53.35%
MalaysiaMalaysia SingaporeSingapore ChinaChina Hong KongHong Kong
ASM PacificTechnologyASM PacificTechnology
HKSE
ASM Back End
ASM Back End
ASMFront End
ASMFront End
ASM InternationalASM International
2172
761 553 388 198 10046
618 887 7196 1043
12242
otherother
302
Front-endManufacturing
Singapore
Front-endManufacturing
Singapore272
ASMFar East
ASMFar East

© 2007 ASM Q3 2007 ResultsProprietary Information 4
• Front-end:- Front-end good progress on its road to profitability- Innovative technologies for established product
lines and product lines under development (incl. ALD)
- Increased focus on S.E. Asian market, incl. FEMS• Back-end:
- #1 worldwide and growing- Broadening field of applications
• Synergies between Front-end and Back-end:- Present operational synergies- Future technological synergies
Investment Highlights

© 2007 ASM Q3 2007 ResultsProprietary Information 5
Addressable Markets Estimate 2007
Assembly$ 3.8 B
Deposition$ 9.5 B
Test$ 12.3 B
Other wafer process$ 4.7 B
Etch & Clean
$ 7.9 B
Lithography$ 9.9 B
(Total $ 48.1 Billion)
Source: VLSI Research Inc., June 2007
Depositionin 2012$ 11.5 B Assembly
In 2012$ 4.3 B

© 2007 ASM Q3 2007 ResultsProprietary Information 6
ASMI’s Market Leadership in faster growing segments
2012E
3769
633
219
413
1490
1615
248
430334941Back End (overall)(equipment 80%, leadframes 20%)
Advanced Developments:
1105543emerging interest- RTP
521191strong position- Atomic Layer CVD
11703572of which Low-k films
223314363- Plasma Enhanced CVD
178014983- Vertical Furnace
5482261- Epitaxy (Si, SiGe)
2007E2006
Current Position
Market Segment
Front End
Market Estimate (US$ mill.)*
* VLSI Research Inc., June 2007

© 2007 ASM Q3 2007 ResultsProprietary Information 7
ASM: IP Powerhouse
• In 2007 a different approach by IEEE
• Ranking per sector• ASMI amongst the 4
strongest IP companies in the sector, which are all large companies
• All others behind
IEEE Spectrum, November 2006
13691941ElectronicsHitachi Ltd.Japan
10
1492109Semiconductor Equipment Manufacturing
ASM International NV.Netherlands
9
1603413Automotive and PartsDelphitechnologiesInc.United States
8
1699780Computer Systems and Software
Microsoft Corp.United States
7
1832371Semiconductor Equipment Manufacturing
Applied Materials Inc.United States
6
1856419SemiconductorManufacturing
Broadcom Corp.United States
5
23641553SemiconductorManufacturing
Intel Corp.United States
4
27561810Computer Systems and Software
Hewlett-Packard Co.United States
3
30842972Computer Systems and Software
IBM Corp.United States
2
33961569SemiconductorManufacturing
Micron Technology IncUnited States
1
PipelinePower
2005 U.SPatents
IndustryCompanyCountry
Rank
Top 10 Patent CompaniesIEEE Spectrum, November 2007

© 2007 ASM Q3 2007 ResultsProprietary Information 8
Further steps to profitability Front-end
To be achieved by:• Sales growth to outperform the industry over the cycle
• Market share gains in PECVD, VF and SiGe & Strained Si• Strengthened Asian network• ALD (TP / CP) to gain critical mass and well on its way in 2007
• Costs reduction• Improvement in gross margins due to Asian cost relocation and other programs• Lower relative R&D costs by scrutinizing R&D program
• Cash Flow improvements• Significant improvement in working capital• Reduction in capital expenditures as percentage of net sales
Targets:• 2007
• Positive net earnings and positive operating cashflow
• 2009 – Further• Operating margins in line with Front-end peer universe

© 2007 ASM Q3 2007 ResultsProprietary Information 9
The strong aspects of ASMI’s corporate structure
• Current and future operational synergies between ASMI and ASMPT• Front-end manufacturing in Singapore (FEMS)• IC wafer production shift to Asia accelerating• Decision makers in Asia (Samsung, TSMC, Hynix, etc.)
• Future convergence in technology between Front-end and Back-end• Industry dynamics will drive further improvements and more
efficient processes• These developments require integrated Front-end and Back-end
process and manufacturing technologies, as validated by the leading industry players
Great opportunities in Back-end and Front-end

© 2007 ASM Q3 2007 ResultsProprietary Information 10
Move to Asia facilitated by link to ASMPT
• Manufacturing generic subassemblies and components to replace outsourcing in US and Europe• Benefit from lower labour rates (60-70%)• Benefit from skilled labour in flexible market• Benefit from lower local prices for materials and components
• Gross Margin improvement by 1.5% in 2006 realised • Target GM improvement ~4% in 2007 and more to be expected

© 2007 ASM Q3 2007 ResultsProprietary Information 11
Trend towards new IC Packaging
• Fully integrated 3D die to die connected system• This shows an initial wafer with functional silicon• Two additional layers of functional silicon have been bonded to it
Specifics:
• Different functionality on top of each other• Direct die to die connection• High precision placement of die’s• Addressable market could be order of magnitude USD 200 – 300 million in five years time

© 2007 ASM
Q3 2007 Results
Proprietary Information
Wafer Processing
Front End
© 2007 ASM Q3 2007 ResultsProprietary Information 13
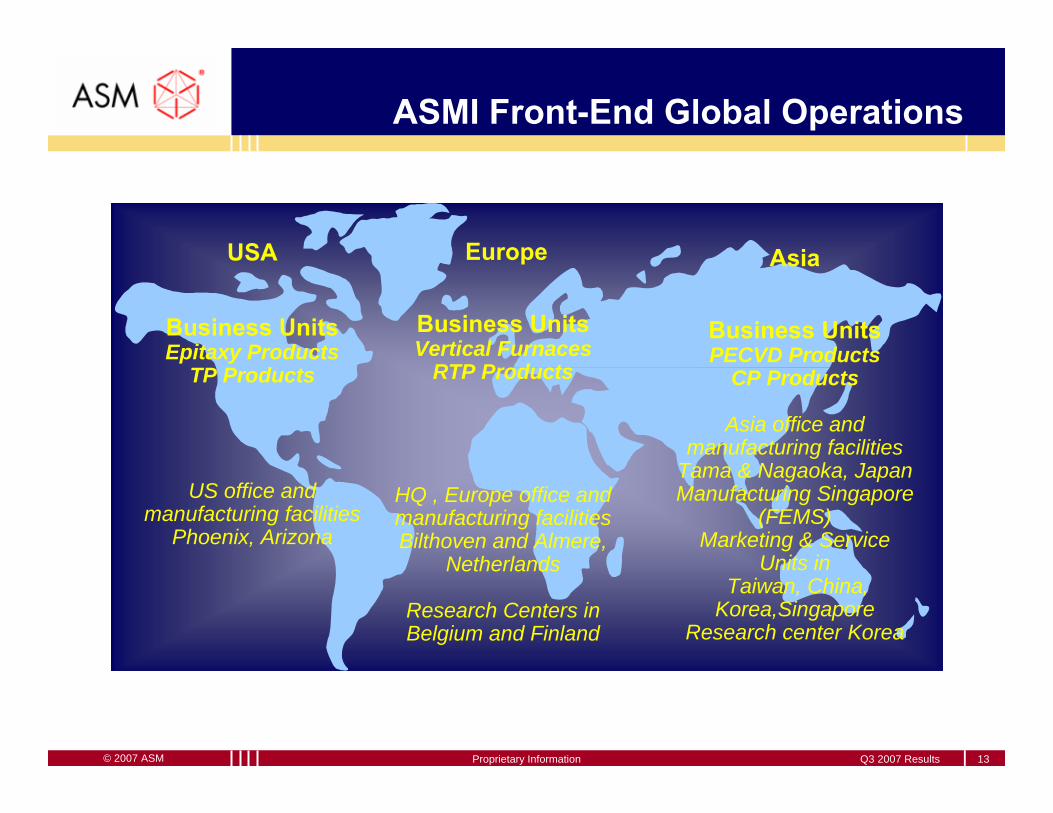
ASMI Front-End Global Operations
Asia
Business UnitsPECVD Products
CP Products
Asia office and manufacturing facilities
Tama & Nagaoka, JapanManufacturing Singapore
(FEMS)Marketing & Service
Units inTaiwan, China,
Korea,SingaporeResearch center Korea
Europe
Business UnitsVertical Furnaces
RTP Products
HQ , Europe office and manufacturing facilitiesBilthoven and Almere,
Netherlands
Research Centers in Belgium and Finland
USA
Business UnitsEpitaxy Products
TP Products
US office and manufacturing facilities
Phoenix, Arizona
© 2007 ASM Q3 2007 ResultsProprietary Information 14
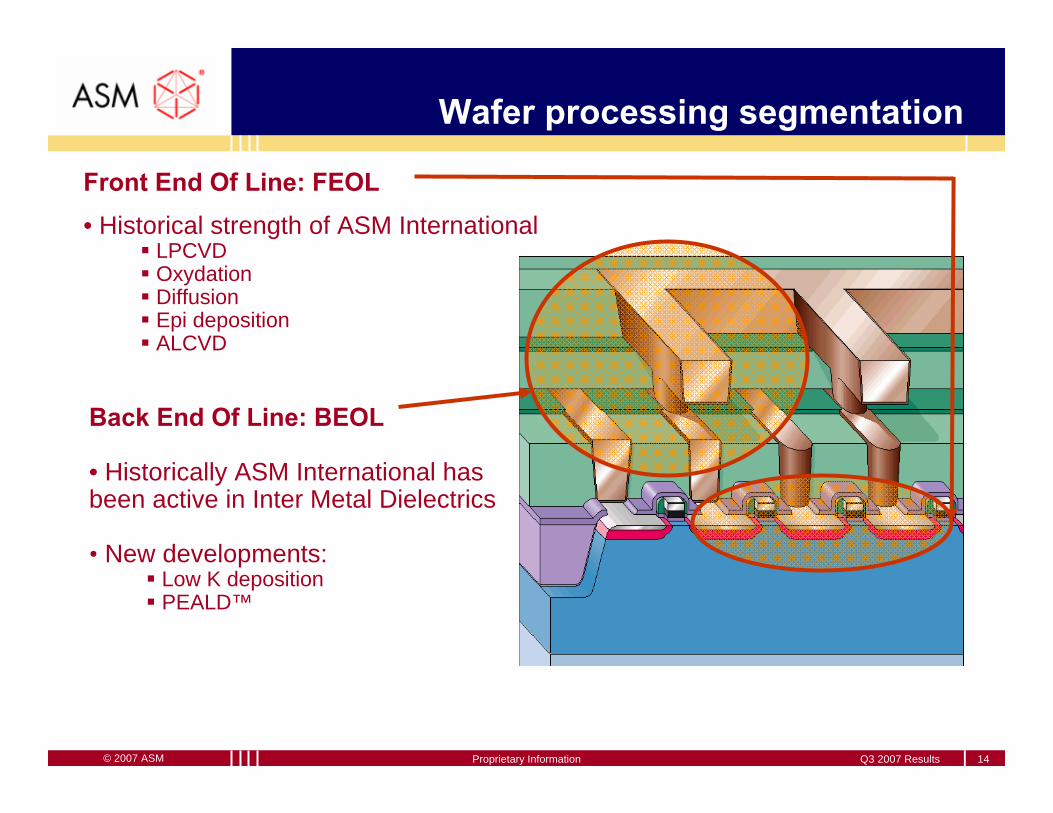
Wafer processing segmentation
Back End Of Line: BEOL
• Historically ASM International has been active in Inter Metal Dielectrics
• New developments:Low K depositionPEALD™
Front End Of Line: FEOL• Historical strength of ASM International
LPCVDOxydationDiffusionEpi depositionALCVD

© 2007 ASM Q3 2007 ResultsProprietary Information 15
Front End technology drivers
• ASMI’s solutions:- Established products
Vertical furnaceSilcore chemistryTiN depositionBatch ALCVD
EpitaxySiGe Epi DepositionStrained Silicon
PECVDSuperior Low-k chemistryNano Carbon Polymer
- New productsAtomic Layer Deposition
High-k Gate DielectricsHigh-k Capacitor Dielectrics
RTPNew Technical Approach:“ Levitor® ”
• Semiconductors becoming smaller, better performing,faster switching and lower power consumption:Line widths < 65 nm, Ultra thin films, New materials

© 2007 ASM Q3 2007 ResultsProprietary Information 16
Front-end’s strategy in S.E. Asia
Customer wins in TaiwanTSMC Nanya
Promos Winbond
Inotera Powerchip
Rexchip
Conclusion:
All major players are in the ASM customer base
Approach in KoreaSamsung Hynix
Magnachip Dongbu HiTek
LG Siltron
Unique enabling technology:
NCP hardmaskGapFill Low-k process
China is following
© 2007 ASM Q3 2007 ResultsProprietary Information 17
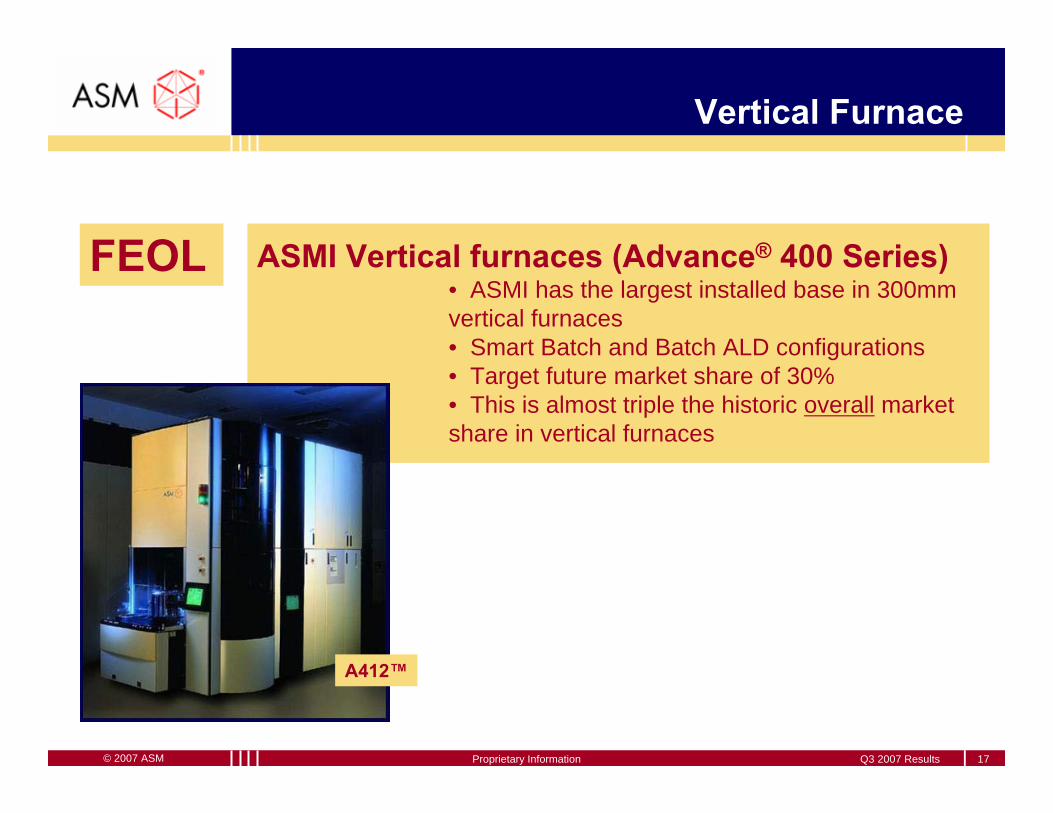
Vertical Furnace
ASMI Vertical furnaces (Advance® 400 Series)• ASMI has the largest installed base in 300mm vertical furnaces• Smart Batch and Batch ALD configurations• Target future market share of 30%• This is almost triple the historic overall market share in vertical furnaces
FEOL
A412™

© 2007 ASM Q3 2007 ResultsProprietary Information 18
Epitaxy
• Market leader in Silicon Germanium (and SiGeC)- New material in high
frequency transistors for broadband wireless communications
- ASMI is the market leader (70+%)
• New Activities- Strained Silicon- SOI applications
FEOL
Epsilon®

© 2007 ASM Q3 2007 ResultsProprietary Information 19
PECVD
ASMI Solutions- Low-K PECVD Aurora®
New application- NCP (Nano Carbon Polymer)
Back End of LineInterconnectMany layers of Metal and IMD
<100 nm generations:- Low-K for IMD
BEOL
Dragon®
Eagle®

© 2007 ASM Q3 2007 ResultsProprietary Information 20
Atomic Layer Deposition
• Thermal (ALD) and Plasma enhanced (PEALD) solutions
• Technology to control deposition one atomic layer by one atomic layer, resulting in ultra-thin films
• Response to Smaller Line Geometries and high Aspect Ratio’s
• Gate-stack, capacitor dielectrics, diffusion barriers, Cu seed layers
• Design-in with top IC manufacturers • Strong patent portfolio and technology lead over
competition
FEOL/BEOL
Transistor Gate Dielectrics DRAM High K capacitor dielectrics
Polygon®

© 2007 ASM Q3 2007 ResultsProprietary Information 21
RTP
• Paradigm Shift Rapid Thermal Processing (RTP) Concept- Conventional: Radiation- ASMI’s Levitor®: Conduction
• Emissivity Independent- Improved uniformity
• Cost reduction: min. 30 %- Ten times more energy efficient- Faster (75 wph)- Low cost
• Targeting ≤65 nm Technology
FEOL
Levitor®
Levitor®

© 2007 ASM Q3 2007 ResultsProprietary Information 22
The use of the 3rd Dimension will change the Industry
Improvements in speed, cost and
power consumption
3D Processor/Memory Stacking
Intel, ISS 2007; VLSI 2006(top), Samsung IEDM 2006 (Bottom)
3D in the Front-end of Line
Improvements in drive current and density
3D SystemIntegration
Improvements infunctionality
and formfactor
© 2007 ASM Q3 2007 ResultsProprietary Information 23
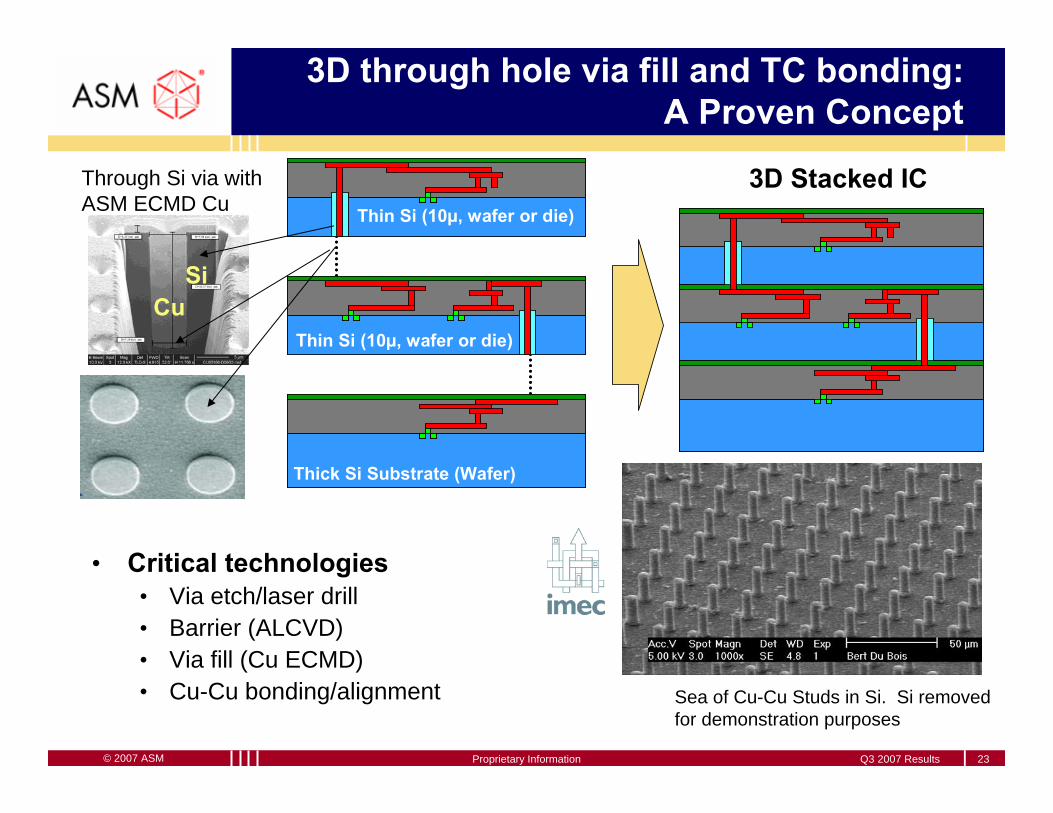
Thin Si (10µ, wafer or die)
Thin Si (10µ, wafer or die)
Thick Si Substrate (Wafer)
Thin Si (10µ, wafer or die)
Thin Si (10µ, wafer or die)
Thick Si Substrate (Wafer)
3D Stacked IC
3D through hole via fill and TC bonding:A Proven Concept
• Critical technologies• Via etch/laser drill• Barrier (ALCVD) • Via fill (Cu ECMD) • Cu-Cu bonding/alignment Sea of Cu-Cu Studs in Si. Si removed
for demonstration purposes
Through Si via with ASM ECMD Cu
CuSi

© 2007 ASM
Q3 2007 Results
Proprietary Information
Wafer Assembly & Encapsulation
Back End

© 2007 ASM Q3 2007 ResultsProprietary Information 25
ASMI Back End global operations
Asia
Business Unitsall Back End products
HQ, office and manufacturing facilities
Hong Kong
Manufacturingfacilities in
Singapore, Shenzhen (PRC),
and Malaysia
Europe
Sales and Service Unit
European officeBilthoven, Netherlands
USA
Sales and Service Unit
US officeSan Jose, California

© 2007 ASM Q3 2007 ResultsProprietary Information 26
Product strategy
• ASMI supplies equipment to the Back End of the semiconductor manufacturing industry
• ASMI’s tools are used to assemble chips into its final package
Back End processes
Wirebonder
Diebonder Flip Chip Trim & Form &
Test HandlerMoulding
ASMI’s tools
Wire bonding
Flip Chip,BGAbonding
Die Bonding Moulding Trim & Form

© 2007 ASM Q3 2007 ResultsProprietary Information 27
Business strategy:Broadening field of applications
• ASMI supplies equipment to the Back End of the semiconductor manufacturing industry
• ASMPT’s tools are used in an ever growing area of applications
• Not only IC assembly and packaging but also:• CMOS image sensors• Power LED• SD memory cards• Chip-on-glass (COG)• Package on Package (POP)• RFID applicationsMajor progress in 2006 and 2007

© 2007 ASM Q3 2007 ResultsProprietary Information 28
Business drivers
Technology Drivers:• Size of packages
• Finer pitch ball bonding capability• Advanced technologies
• Flip Chip, Chip Scale Packages, Ball Grid Array (BGA), Stacked Die, System in Package (SiP), Wafer Level Packaging (WLP)
Cost Driver:• Cost of Ownership
• Low cost solutions• Automation
• Integration of assembly and packaging steps

© 2007 ASM Q3 2007 ResultsProprietary Information 29
Gold Wire Bonder
Q2 2007 High speed 30 micron pad pitch capability• Eagle Xtreme™ for 30 micron, < 50 ms per wire
Q3 2004 dual bond head capability• Twin Eagle™ for 180% capacity
Eagle Xtreme™
TwinEagle™

© 2007 ASM Q3 2007 ResultsProprietary Information 30
Die Bonding
Introduced Q2 2007:MCM12
Multi Chip Module• Versatile & flexible bonding
processes in single machine• Achieving pro-long MTBA• High throughput• High placement accuracy
MCM12
Introduced Q3 2007: COG 900• Chip-On-Glass Die bonder for LCD application
COG 900

© 2007 ASM Q3 2007 ResultsProprietary Information 31
Flip Chip Bonding
Advantages:• Minimum footprint• Higher I/O connection flexibility• Improved electrical reliability• Improved thermal capabilities• Low cost assembly
Market still relatively small
AD 800/900 series
AD 819
AD 900

© 2007 ASM Q3 2007 ResultsProprietary Information 32
Operations
SINGAPORE
HONG KONG
PARTS &
SUBASSEMBLIES
PARTS &SUBASSEMBLIES
CHINA
MALAYSIA
PARTS &
SUBASSEMBLIES
CUSTOMERS

© 2007 ASM Q3 2007 ResultsProprietary Information 33
ASMPT: Nr. 1 worldwide+growing
Equipment revenue Benchmarking
0.60
0.911.160.95
1.30
0.49
0.96
1.46
3.35
1.221.44
2.12
3.193.52
0.56
0.86
1.50
0.420.720.55
0.42
0.85
0.59
1.200.77
0.520.50
0.750.84
1.26
0.54
0.960.72
0.57
1.15
0.62
1.76
0.30
0.920.64
0.92
0.770.60
1.35
0.39 0.560.340.31
0.0
0.5
1.0
1.5
2.0
2.5
3.0
3.5
4.0
1997 1998 1999 2000 2001 2002 2003 2004 2005 2006
ASMK&SBESITowaShinkawaESEC
H1 2007 Equipment Revenue
45.5
46.3
47.3
49.7
100
0 25 50 75 100
ASM
K&S +AlphsemBESI
Shinkawa
Towa
US$M245.5
121.9
116.2
113.6
111.8
%

© 2007 ASM
Q3 2007 Results
Proprietary Information
Financial Overview

© 2007 ASM Q3 2007 ResultsProprietary Information 35
Net Sales
155 164 153 133182
337267 287
356 358409
149 135 169155
233
224
252295
399 367
468
380
556
0
250
500
750
1000
1995
1996
1997
1998
1999
2000
2001
2002
2003
2004
2005
2006
Front End Back End
Euro millions
* *
* All figures continued operations
© 2007 ASM Q3 2007 ResultsProprietary Information 36
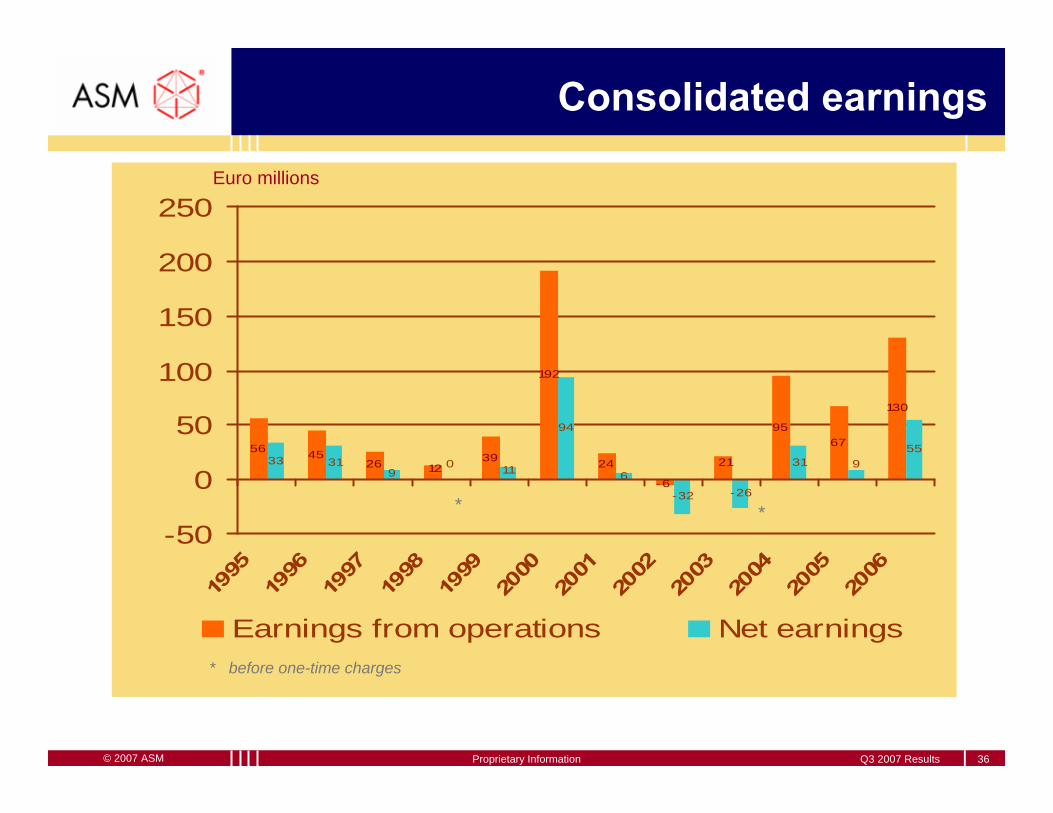
Consolidated earnings
5626 39
192
9567
130
33 31 0
94
-32 -26
31 955
21
-612 24
45119 6
-50
0
50
100
150
200
250
1995
1996
1997
1998
1999
2000
2001
2002
2003
2004
2005
2006
Earnings from operations Net earnings* before one-time charges
*
Euro millions
*

© 2007 ASM Q3 2007 ResultsProprietary Information 37
Consolidated Statement of Continuing Operationsper quarter
Euro millions
Net Sales 213.4 254.7 253.5
Gross Profit 83.0 96.9 97.2
SGA (29.2) (32.9) (33.3)R&D (21.9) (21.5) (21.2)other (0.1) (0.1) (0.1)
Earnings from Op. (EBIT) 31.7 42.4 42.6
Net Earnings (after minority interest) 13.9 20.8 20.0
Diluted Net Earnings per share 0.26 0.35 0.34
Q3 2006 Q3 2007**Q2 2007*
* Excluding € 5.9 million expense resulting from extinguishment of convertible debt** Excluding € 4.1 million expense resulting from extinguishment of convertible debt

© 2007 ASM Q3 2007 ResultsProprietary Information 38
Consolidated Cash Flow Statements
Euro millions FY 2005 FY 2006 3/4 2007
Net Cash from Operations 50.7 143.8 69.1
Net Cash from/for Investments (45.6) (30.1) (30.8)
Net Cash before Financing 5.1 113.7 38.3
Net Cash from/for Financing (109.7) (41.8) (85.9)
Net Change in Cash (83.6) 58.9 (52.0)
Ending Cash Balance 135.0 193.9 141.9
CAPEX ( net of Sale PPE ) 43.7 36.6 30.1
Ending Working Capital 236.0 227.1 278.0WC in days sales 119 94 108

© 2007 ASM Q3 2007 ResultsProprietary Information 39
Euro millions Dec 2005 Dec 2006 Sep 2007
Cash and Cash Equivalents 135 ¹ 194 ¹ 142 ¹Other Current Assets 426 423 493Property, Plant & Equipment 163 151 147Goodwill 73 54 51Other Assets 15 10 9 Total Assets 812 832 842
ST Debt ( incl. Current LT Debt ) 28 27 30Other Current Liabilities 195 208 234LT Bank Debt / Convertible Subord. Bonds 229 202 160Other Long Term Liabilities 2 4 4 Total Liabilities 454 441 428
Minority Interest in Subsidiary 120 115 108Shareholders’ Equity 238 276 306 Total Equity & Liabilities 812 832 842
¹) of which cash availability for Front-end 55 105 99
Consolidated Balance Sheet

© 2007 ASM Q3 2007 ResultsProprietary Information 40
Backlog
• Q3 2007 New orders : € 198 million, down 13% from last quarter. • 68% of Q3 equipment orders booked in FE were for 300mm • Q3 2007 Book-to-Bill : 0,78 (Book-to-Bill in Q2 2007 was 0,89) • Ending Backlog : € 187 million (with roughly 49% in Back-end and 51% in Front-end)
050
100150200250300350400450
Q11998
Q4 Q3 Q2 Q12001
Q4 Q3 Q2 Q12004
Q4 Q3 Q22006
Q12007
BEFETotal
Euro millions
© 2007 ASM Q3 2007 ResultsProprietary Information 41
Dividend Policy as of 2007
•ASMI intends to use dividends received from ASMPT during at least 2007-2009 for:
- Reduction of ASMI outstanding convertible debt- Repurchase of ASMI common shares- Purchase of ASMPT shares to maintain November 2006 ownership level- Payment of cash dividend to ASMI common shareholders
•ASMI paid a cash dividend in 2007 in the form of an interim dividend of € 0.10 per share, early September 2007
A cash dividend demonstrates ASMI’s commitment to build shareholder value. It underscores the progress in FE operations and the confidence in the company’s prospects for future growth and profitability.

© 2007 ASM Q3 2007 ResultsProprietary Information 42
Outlook as per October 29, 2007
• Front-end order intake in Q4 2007 expected to increase compared to Q3.
• Front-end revenue level in Q4 2007 expected to be slightly below Q3 level.
• We reiterate our expectation for FE net earnings in 2007 (excluding negative impact related to the buyback of convertiblebonds).
• Back-end operations is expected to deliver strong sales and profitability in Q4 2007.
• Back-end is expected to show record sales and profitability levels for 2007, measured in local currency.

© 2007 ASM
Q3 2007 Results
Proprietary Information