business scenarios for geographically distributed … report icar-cnr 2016-03, “business scenarios...
TRANSCRIPT

Consiglio Nazionale delle Ricerche Istituto di Calcolo e Reti ad Alte Prestazioni
Business Scenarios for Geographically Distributed Data Centers
Carmine De Napoli1, Agostino Forestiero 1,2, Demetrio Laganà1, Giovanni Lupi1, Carlo
Mastroianni1,2, Leonardo Spataro1
RT-ICAR-CS-16-03 May 2016 This project has received funding from the European Union’s Horizon 2020 research and innovation program under grant agreement No 712363
1) Eco4Cloud srl, Piazza Vermicelli, Rende (CS), email: {denapoli,lagana,spataro}@eco4cloud.com 2) ICAR-CNR, Via P. Bucci 7/11 C, Rende (CS), email: {forestiero,mastroianni}@icar.cnr.it
Consiglio Nazionale delle Ricerche, Istituto di Calcolo e Reti ad Alte Prestazioni (ICAR) – Sede di Cosenza, Via P. Bucci 7-11C, 87036 Rende, Italy, URL: www.icar.cnr.it – Sezione di Napoli, Via P. Castellino 111, 80131 Napoli, URL: www.icar.cnr.it – Sezione di Palermo, Via Ugo La Malfa, 153, 90146 Palermo, URL: www.icar.cnr.it

TECHNICAL REPORT ICAR-CNR 2016-03, “Business Scenarios for Geographically Distributed Data Centers”
Table of contents
INTRODUCTION ................................................................................................................................................................. 2
1. STATE OF THE ART .................................................................................................................................................... 3
1.1. GREEN CLOUD ............................................................................................................................................................... 3 1.2. COMPUTATIONAL EFFICIENCY AND WORKLOAD MANAGEMENT ................................................................................... 4 1.3. WORKLOAD ASSIGNMENT AND REDISTRIBUTION IN DISTRIBUTED DATA CENTERS ...................................................... 5 1.4. SOFTWARE DEFINED NETWORKING ............................................................................................................................... 6 1.5. REAL USE CASES ............................................................................................................................................................ 9
2. APPLICATION SCENARIOS FOR ECOMULTICLOUD ............................................................................................ 14
2.1. HYBRID CLOUD ............................................................................................................................................................ 14 2.2. GEOGRAPHICAL DATA CENTERS ................................................................................................................................... 14 2.3. SOFTWARE DEFINED DATACENTER .............................................................................................................................. 17
3. STAKEHOLDERS AND BUSINESS OBJECTIVES ..................................................................................................... 19
3.1. USERS AND STAKEHOLDERS ......................................................................................................................................... 19 3.2. BUSINESS OBJECTIVES .................................................................................................................................................. 22 3.3. COSTS AND ENERGY REDUCTION .................................................................................................................................. 23 3.4. REDUCTION OF CO2 EMISSIONS ................................................................................................................................... 24 3.5. REDUCTION OF WATER USAGE ..................................................................................................................................... 25 3.6. QOS ENHANCEMENT AND ADHERENCE TO SLAS ......................................................................................................... 26 3.7. PERFORMANCE ENHANCEMENT ................................................................................................................................... 27
4. ECOMULTICLOUD: A HIERARCHICAL SOLUTION FOR GEOGRAPHICAL DATA CENTERS ............................. 29
4.1. MAIN FEATURES OF ECOMULTICLOUD ........................................................................................................................ 30 4.2. ECOMULTICLOUD HIERARCHICAL ARCHITECTURE ........................................................................................................ 31
5. CONCLUSIONS ......................................................................................................................................................... 32
6. REFERENCES .............................................................................................................................................................. 32
1

TECHNICAL REPORT ICAR-CNR 2016-03, “Business Scenarios for Geographically Distributed Data Centers”
Introduction
This report provides an overview of the main business scenarios involved in the field of geographically distributed data centers. The content of this report derives from the activities of the EcoMultiCloud project, a project of the CNR spinoff Eco4Cloud srl. EcoMultiCloud is funded by the European Community under the “SME Instruments” tool of the Horizon 2020 program.
The efficient utilization of resources in the data centers is essential to reduce costs, energy consumption, carbon emissions and also to ensure that the quality of service experienced by users is adequate and adherent to the stipulated Service Level Agreements. Through the allocation of multiple Virtual Machines (VMs) on the same physical server, the virtualization technology helps to increase the efficiency of DCs. A good level of efficiency must be guaranteed also in geographically distributed DCs, whose adoption is rapidly increasing.
In this framework, as stated in the proposal, the goal of EcoMultiCloud project is to perform workload consolidation on distributed data centers (DCs), which are typically dislocated on a geographical scale and are remotely connected through a wide area network.
This report aims to show a set of possible business scenarios, analyze them and select the most promising ones.
Section 1 presents the state of the art in the field of energy-efficient data centers, with specific focus on geographically distributed data centers. Section 2 describes the main application scenarios that can benefit from the EcoMultiCloud solution: Hybrid Cloud, geographical data centers and software data centers. Section 3 illustrates the main stakeholders that are involved by the EcoMultiCloud solution, in particular the data center administrators and managers and the final users.
Section 3 also summarizes the main benefits of EcoMultiCloud, such as: maximize the utilization of available capacity, reduce energy and CO2 consumption, minimize costs, balance the load, etc. EcoMultiCloud takes advantage of the price and/or availability of electricity at different sites, and dynamically brokers the workload on multiple public-cloud providers as applications can also be shifted between sites at different times of the day or night (a process also known as “follow the moon”) based on related cost and/or convenience.
Section 4 presents the main characteristics of the hierarchical architecture defined by EcoMultiCloud, and the main features of the two involved layers, the upper layer, which is used by the data centers to communicate with each other, and the lower layer, which is used to manage the workload internally. Finally, Section 5 concludes the report.
2

TECHNICAL REPORT ICAR-CNR 2016-03, “Business Scenarios for Geographically Distributed Data Centers”
1. State of the art
This section provides an overview of the state-of-the-art related to the field of geographically distributed data centers, specifically regarding the energy-efficiency of data centers and Cloud infrastructures (Section 1.1), the computational efficiency of geographically distributed data centers (Section 1.2), the algorithms and procedures adopted for the assignment and redistribution of the workload (Section 1.3), and the Software Defined Networking (Section 1.4), a recently technology that allows the data center to be controlled and managed through software. In Section 1.5 we illustrate, as use cases, how some big players are tackling the main issues related to these new technologies.
1.1. Green Cloud
The ever-increasing demand for computing resources has led companies and resource providers to build private warehouse-sized data centers, or to offload applications to the data centers owned by a Cloud company. Overall, data centers require a significant amount of power to be operated. The total electricity demand of data centers increased by about 56% from 2005 to 2010, and the electricity usage accounted for about 1.5% of the worldwide electricity usage in 2010, which is comparable to the aviation industry. The financial impact for the datacenter management is also huge, since a datacenter spends between 30% to 50% of its operational expense toward electricity. The efficient utilization of resources in these data centers is therefore essential to reduce costs, energy consumption, carbon emissions and also to ensure a high quality of service to users.
Over the recent years, the ecological conscience of the European Union has led to a determination to restructure their Energy Policy. Energy represents one of the most significant operating costs in DCs. Moreover, based on current and foreseeable trends, the basic price of energy will continue to rise over time, and may become constrained as global demands rise, making energy use and efficiency a long term business priority. Carbon footprint and greenhouse gases are also becoming subject to governmental regulations and taxes. Companies are today strongly encouraged to reduce the amount of carbon emissions, not only to compel to laws and rules, but also to advertise their green effort and attract customers that are increasingly careful about sustainability issues.
In principle, Cloud computing has the environmentally important benefits of reduced hardware and carbon footprint in comparison with more traditional approaches:
• Hardware reduction: One of the Cloud’s green attributes take the form of “dematerializing” the economy which involves reducing the number of physical materials. Moreover, by reducing the need for hardware, companies can reduce costs and eliminate the need for maintenance and upgrades. It also encourages consumers to use virtual services such as video streaming to replace resource-heavy physical products.
• Carbon reduction: The Cloud reduces carbon emissions through minimized energy requirements. According to the CDP (Driving Sustainable Economies) report [1], offsite servers have the potential to prevent 85.7 million metric tons of annual carbon emissions by 2020. The environmental impact of these substantial reductions in energy are significant. One study surveying the clients of Salesforce [2], a fast-growing Cloud computing giant, suggested carbon reductions of 95 percent compared to companies with servers on their premises.
3

TECHNICAL REPORT ICAR-CNR 2016-03, “Business Scenarios for Geographically Distributed Data Centers”
• Reduction of energy costs (depending on DCs location): The cost of electricity is generally different from site to site and also varies with time, even on a hour-to-hour basis, therefore the overall cost may be reduced by shifting portions of the workload to more convenient sites.
As an example of green data center, Google is operating a datacenter in Belgium without chillers (which augment cool air to help keep the datacenter at the right temperature and use a lot of electricity). However, what’s most noteworthy about this is that Google appears to have the means to automatically shift its datacenter operations from the chiller-less datacenter if the temperatures get too high for the gear. The ability to automatically and seamlessly shift datacenter operations and tasks is a key element in building out data centers that can operate on renewable energy or merely more efficiently. This is the so called “follow-the-moon” strategy because a company with a larger number of data centers could shift computing around the globe so processes are completed at night when the temperature is lower and cooling costs are cheaper.
Some of Google’s criteria when selecting locations for data centers are:
• Large volumes of cheap electricity. • Green energy. Focuses on renewable power sources. • Proximity to rivers and lakes. They use a large amount of water for cooling purposes. • Large areas of land. Allows for more privacy and security. • The distance to other Google data centers (for fast connections between data centers). • …and obviously Tax incentives.
1.2. Computational Efficiency and Workload Management
While there is a vast literature on the efficient management of cloud platform at the virtualization level, there is still much room for improving the environmental impact through a better management at the application level. For example, the correlation between the characteristics of applications and the behavior of the VMs that host the applications should be better investigated and exploited.
This is the intent of the study presented in [3]: the authors propose an approach to control the applications during their life-cycle, from design to execution. At design time, the approach suggests the optimal set of VMs to be deployed according to the application profile; at run time, a set of adaptation strategies are enacted to reduce CO2 emissions. These strategies are based on the information available at the application level to reduce the environmental impact once the applications are deployed in a virtualized infrastructure. The potential for improvement, when using the presented approach, can lead to a 60% reduction of CO2 emissions, without degrading performance. Tracking energy consumption and CO2 footprint of cloud applications becomes even more difficult when applications are complex and span multiple cloud computing platforms.
The authors of [4] focus on the energy-efficient execution of scientific workflows that need to be deployed across multiple data centers due to their large-scale characteristics. The optimal allocation of virtual machines must consider that workflow tasks have dependencies and communication constraints which make them differ significantly from unrelated tasks. The solution presented in the paper, EnReal, addresses such challenges by leveraging the dynamic deployment of virtual machines: an energy consumption model is devised, and a corresponding energy-aware resource allocation algorithm is proposed for virtual machine scheduling. The
4

TECHNICAL REPORT ICAR-CNR 2016-03, “Business Scenarios for Geographically Distributed Data Centers”
approach has been evaluated through a wide set of simulation experiments executed over the CloudSim framework.
The energy-efficient management of geographically distributed data centers is also the subject of [5]. The authors focus on the significant impact of “geo-temporal inputs”, i.e., the time- and location-dependent factors that may impact energy consumption. Among such factors, they consider real time electricity pricing enabled by the deregulated electricity market, the cooling efforts needed at different sites and different times, and the availability of renewable energy. The difficult problem of scheduling the VMs in a geographical context is tackled through a two-stage approach, which combines best-effort global optimization, driven by genetic algorithms, with deterministic local optimization for constraint satisfaction. A reported simulation study based on real traces of temperatures and electricity prices shows that considerable energy cost savings, of up to 28.6%, are achievable compared to a baseline control method that applies VM consolidation without considering geo-temporal inputs.
In [6], the classical problem of VM consolidation, i.e., reduce the energy consumption of a datacenter by packing the running VM instances to as few physical machines as possible, is considered. Since VM consolidation is an applied form of the NP-hard bin packing problem, it cannot be solved in large data centers using classical centralized approaches. In [6], the problem is tackled using an original approach, partly inspired by the state-of-the-art in the peer-to-peer field. Specifically, the physical machines of the datacenter self-organize in a hypercube overlay network, and each host autonomously decides if some VMs should be offloaded to improve the consolidation ratio. In this case, hypercube connections are used to choose the target hosts and migrate the VMs. The benefits of the approach, in terms of energy-efficiency and scalability, derive from the properties of the overlay structure, i.e., low number of connections, reduced number of exchanged messages and strong resilience to high churn rates.
Dai and colleagues also investigate the problem of energy-aware placement of VMs onto a subset of (active) servers in [7]. They formulate the problem using integer programming, prove that it is NP-hard, and propose two greedy approximation algorithms to reduce the energy consumption while satisfying the tenants’ service level agreements (SLAs). Their results demonstrate that the algorithms efficiently produce placements that are close to optimal in terms of energy consumption, while satisfying all SLAs.
1.3. Workload Assignment and Redistribution in Distributed Data Centers
The problem of workload assignment and redistribution in geographically distributed data centers is a topical field today. Research efforts focus on two related but different aspects [8]: the routing of service requests to the most efficient datacenter, in the so-called assignment phase, and the live migration of portions of the workload when conditions change and some data centers become preferable in terms of electricity costs, emission factors, or more renewable power generation (redistribution and allocation). Several studies explore the opportunity of energy cost saving by routing jobs when/where the electricity prices are lower [9]. Some prior studies assume that the electricity price variations and/or job arrivals follow certain stationary (although possibly unknown) distributions [10] [11]. Rao et al. [12] tackle the problem taking into account the spatial and time diversity in dynamic electricity markets.
In this scenario, the scientific community has individuated the necessity of a framework/architecture for the efficient distribution of the workload on a multi-site scenario, i.e., among geographically distributed interconnected DCs). Specifically, a hierarchical approach would allow for an integrated and homogeneous management of heterogeneous platforms but at the same time would preserve the autonomy of single sites. The Virtual Machines
5

TECHNICAL REPORT ICAR-CNR 2016-03, “Business Scenarios for Geographically Distributed Data Centers”
migrations should be performed asynchronously, both location-wise and time-wise, and with a tunable rate managed by DCs administrators.
The workload assignment and migration decision processes are made particularly complex by the time-variability of electricity cost, and by the workload variability both within single sites and across interconnected sites. With a hierarchical infrastructure, single DCs can manage the local workload autonomously but can communicate with each other to route and migrate VMs among them. A self-organizing hierarchical architecture is proposed in literature [13] but so far it is limited to the management of a single DC. A recent study [14] proposes a hierarchical approach that combines inter-DC and intra-DC request routing. The VM scheduling problem is decomposed and solved at single DCs, and is able to combine different objectives, e.g., minimize electricity cost, carbon taxes and bandwidth cost. While the work certainly deserves attention, it only solves the routing problem and does not exploit the opportunity of dynamic workload migration, nor the approach seems to be easily extensible in that direction.
The dynamic redistribution and migration of workload among DCs has become also an opportunity to reduce costs, moving the workload where the energy is cheaper/cleaner and/or cooling costs are lower, according to what is called the “follow the moon” paradigm.
Inter-site migration is enabled by the availability of high network capacity achievable thanks to physical improvements and logical/functional enhancements (e.g., the adoption of Software Defined Networks).
While workload redistribution and allocation can be very effective for cost reduction, the associated decision processes are made particularly complex by the time-variability of electricity cost, and by the workload variability both within single sites and across the whole infrastructure.
The need for autonomous management is self-explanatory in multi-owned DCs, and is crucial even within a single-owner infrastructure, for example in the case that one or several sites are hosted by co-located multi-tenant facilities.
1.4. Software Defined Networking
Inter-site migration of applications and virtual machines is today possible due to physical improvements of the networks and logical/functional enhancements by the adoption of the Software Defined Networking paradigm.
Software-Defined Networking (SDN) [15] is an emerging architecture that is dynamic, manageable, cost-effective, and adaptable, making it ideal for the high-bandwidth, dynamic nature of today's applications. This architecture (Fig. 1) decouples the network control and forwarding functions enabling the network control to become directly programmable and the underlying infrastructure to be abstracted for applications and network services. The OpenFlow® protocol is a foundational element for building SDN solutions. The SDN architecture is:
• Directly programmable: Network control is directly programmable because it is decoupled from forwarding functions.
• Agile: Abstracting control from forwarding lets administrators dynamically adjust network-wide traffic flow to meet changing needs.
• Centrally managed: Network intelligence is (logically) centralized in software-based SDN controllers that maintain a global view of the network, which appears to applications and policy engines as a single, logical switch.
6

TECHNICAL REPORT ICAR-CNR 2016-03, “Business Scenarios for Geographically Distributed Data Centers”
• Programmatically configured: SDN lets network managers configure, manage, secure, and optimize network resources very quickly via dynamic, automated SDN programs, which they can write themselves because the programs do not depend on proprietary software.
• Open standards-based and vendor-neutral: When implemented through open standards, SDN simplifies network design and operation because instructions are provided by SDN controllers instead of multiple, vendor-specific devices and protocols.
Fig. 1 SDN Architecture
The key computing trends driving the need for a new network paradigm include:
• Changing traffic patterns: Applications that commonly access geographically distributed databases and servers through public and private clouds require extremely flexible traffic management and access to bandwidth on demand.
• The “consumerization of IT”: The Bring Your Own Device (BYOD) trend requires networks that are both flexible and secure.
• The rise of cloud services: Users expect on-demand access to applications, infrastructure, and other IT resources.
• “Big data” means more bandwidth: Handling today’s mega datasets requires massive parallel processing that is fueling a constant demand for additional capacity and any-to-any connectivity.
In trying to meet the networking requirements posed by evolving computing trends, network designers find themselves constrained by the limitations of current networks [16]:
7

TECHNICAL REPORT ICAR-CNR 2016-03, “Business Scenarios for Geographically Distributed Data Centers”
• Complexity that leads to stasis: Adding or moving devices and implementing network-wide policies are complex, time-consuming, and primarily manual endeavors that risk service disruption, discouraging network changes.
• Inability to scale: The time-honored approach of link oversubscription to provision scalability is not effective with the dynamic traffic patterns in virtualized networks—a problem that is even more pronounced in service provider networks with large-scale parallel processing algorithms and associated datasets across an entire computing pool.
• Vendor dependence: Lengthy vendor equipment product cycles and a lack of standard, open interfaces limit the ability of network operators to tailor the network to their individual environments.
The main advantage of cloud computing is on demand access to resources, and virtualization plays a key role in providing those resources. With hundreds or even thousands of virtualized applications supported across multiple, consolidated data centers, network resiliency and high availability take on a new, heightened level of importance.
The next-generation data center answers the need for a simpler, adaptive infrastructure, able to respond to disruptive change, melt technology silos and integrate legacy and new architectures in a single, manageable ecosystem. It is a software defined environment (SDE) in which server, storage, network and facilities resources are automatically provisioned and configured by software programmed to understand and adapt decisions to the requirements of each workload in real time.
Google has been deploying and enjoying the benefits of Software Defined Networking (SDN) at Google for a decade. A few years ago, we revealed how SDN has been powering Google’s datacenter WAN, one of the world’s biggest WANs. Last year, google showed the details of GCP’s SDN network virtualization stack, Andromeda. In fact, the architectural ideas for both of these systems come from our early work in datacenter networking. Taken together, the network control stack has more in common with Google’s distributed computing architectures than traditional router-centric Internet protocols. In a SDN environment the VM have a great mobility between data centers (Fig. 2)
8

TECHNICAL REPORT ICAR-CNR 2016-03, “Business Scenarios for Geographically Distributed Data Centers”
Fig. 2 VM and storage mobility across cloud data centers in a SDN networking environment
1.5. Real Use Cases
In the following, we provide some examples of how big ICT players are adopting one or more of the technologies described above and are tackling the main related issues.
Nobody knows how many data centers Google has, and the company is not saying [17]. The conventional wisdom is that Google has dozens of data centers. At least 12 significant Google datacenter installations in the United States, with another three under construction. In Europe, Google is known to have equipment in at least five locations, with new data centers being built in two other venues. Google has disclosed the sites of four new facilities announced in 2007, but many of its older datacenter locations remain under wraps. Much of Google datacenter equipment is housed in the company’s own facilities, but it also continues to lease space in a number of third-party facilities. Much of its third-party datacenter space is focused around peering centers in major connectivity hubs.
Google has long been a pioneer in distributed computing and data processing, from Google File System to MapReduce to Bigtable and to Borg. From the beginning, we’ve known that great computing infrastructure like this requires great datacenter networking technology. So, for the past decade, google has been building its own network hardware and software to connect all of the servers in their data centers together, powering our distributed computing and storage systems. Now, google has opened up this powerful and transformative infrastructure for use by external developers through Google Cloud Platform.
Google used three key principles in designing their datacenter networks:
• Arranged its network around a Clos topology, a network configuration where a collection of smaller (cheaper) switches are arranged to provide the properties of a much larger logical switch.
9

TECHNICAL REPORT ICAR-CNR 2016-03, “Business Scenarios for Geographically Distributed Data Centers”
• Used a centralized software control stack to manage thousands of switches within the datacenter, making them effectively act as one large fabric.
• Built its own software and hardware using silicon from vendors, relying less on standard Internet protocols and more on custom protocols tailored to the datacenter.
Facebook system was founded in 2004, with a mission to give people the power to share and make the world more open and still connecting them with friendship relationship. People from anywhere can use Facebook to stay connected with friends and family, they can share such contents of data and multimedia such as audios/videos. Facebook systems at the first are responsible for processing large quantities of data, named as “Big Data”, which is ranging from simple reporting and business intelligence to the huge measurements and reports executed from different perspectives, this numerous large of data located on different geographically distributed data [18]. Facebook, the online social network (OSN) system is relying on globally distributed data centers which are highly dependent on centralized U.S data centers, in which scalability, availability, openness, reliability and security are the major System requirements. Scalability and reliability are mandatory requirements according to the globalization of the system, Facebook is global OSN that serving billions of requests and being responsible for replying back to their requests in just few seconds, and not being too late, these requirements need scalability ability in size, geographically scalability and save the robustness of the system.
The locations of Facebook data centers are centralized in US California: Santa Clara, Palo Alto, Ashburn, the bandwidth and latency measured form outside the U.S users and these distributed data centers will be risky dangerous, and definitely encouraged the decision taker to think of multiple solutions to maintain the network reliability and system availability and protect the system from network bottleneck problems. The solution was to let Facebook servers Content Delivery Network CDN handling the objects and well co-located geographically illustrated in Fig. 3. CDN are spanning widely, and geographically distributed through Russia, Egypt, Sweden, and UK, etc .
Fig. 3 CDN support Facebook network
10

TECHNICAL REPORT ICAR-CNR 2016-03, “Business Scenarios for Geographically Distributed Data Centers”
Being geographically distributed by using centralized data centers located on US and being replicated by distributed CDN, is providing the system the level of acceptable scalability, with the CDN the system is still working in an acceptable levels.
IBM
IBM operates more than 41 cloud data centers in the Americas, Asia, Australia and Europe so that customers can provision cloud resources exactly where and when they need them. Users have granular visibility into datacenter locations—down the exact city —allowing them to deploy critical cloud workloads in targeted geographic locations in order to minimize network latency, improve application performance and comply with local data regulations. IBM has more than doubled Softlayer’s overall datacenter capacity since it invested $1.2 billion back in 2014 for a massive global datacenter expansion. Now, this globally integrated network of cloud data centers, on every major continent, provides enterprises with the ability to scale and build out their IT resources as needed while minimizing risk [19]. When coupled with Bluemix, IBM’s PaaS offering, developers can easily create and test new applications in full production environments from anywhere in the world while also having access to in-house resources like Watson for cognitive computing services as well as to dozens of third party services.
IBM will expand to 40 the number of data centers that run SoftLayer's cloud provisioning and management software [20]. IBM acquired SoftLayer in July for $2 billion and installed its 700 employees as its core cloud services unit. The 40 worldwide centers will also be linked by a private fiber optic network, giving multinational companies multiple options where they can run their applications. Some of the data centers will be SoftLayer's existing 13 centers in the US, Europe, and Asia. IBM is also likely to convert some (or all) of its 10 SmartCloud cloud data centers into SoftLayer-governed service provisioning centers. That leaves another 17 added or scheduled to be added to a network of data centers by year's end.
In addition to North America, Europe, and Asia, the data centers will be located in South America and Australia. Some of the newly launched data centers are in the US (Dallas and Washington, D.C.), Hong Kong, England, Canada, Japan, India, China, and Mexico. IBM has set a goal to have four or more data centers in each major geographic area around the world. It will reserve expansion into the Middle East and Africa until 2015.
Intune
Intune has created a system that virtualizes physical network connectivity across hundreds of kilometres [21]. Amongst other applications, it brings a step-change in efficiency when interconnecting remotely located data sites to create a single distributed data centre. The system is also uniquely able to extend Software Defined Networks (SDN) beyond the data centre over long distances.
The organization created a single Data Centre located across four different locations, positioned between 10km and 50km apart from one another, see Fig. 4. They required connectivity for 20Gbps of traffic from each site to any other, with no possibility of blocking or congestion between any ports. The organization had access to dark fiber between the locations.
The main benefits of this architecture are:
1. Virtualization of storage access between sites.
11

TECHNICAL REPORT ICAR-CNR 2016-03, “Business Scenarios for Geographically Distributed Data Centers”
It is desirable for applications to be able to write to, and read from, storage disc arrays that are physically located in a different site. This extends the benefits of virtualization through additional economies of scale, and enables application number two (see below). This application requires a full-mesh of unblocked connectivity between all ports on the system.
2. Virtual Machine Transfer between sites. Currently, VM transfer is taking place within pods in each isolated datacenter. New virtual switching technology within the datacenter is allowing this to extend across infrastructural sub-networks using a variety of tunneling approaches. This application requires a highly dynamic infrastructure to provide the connectivity and resource application response to this service as well as permitting up to 50km separation between pods or groups of pods.
Fig. 4 Single data center spread across four locations
3. Data replication distribution. To deliver cloud applications with good user experience, their dynamic response requires the movement of applications to distributed data sites with data shards appropriate to the application. Once operational, this data is modified by the application, rapidly replicated within the site, then at a second tier it is replicated within the distributed site group, before being cleared back to the core where the deeper management applications and, in the case of a public service, accessed by billing systems. This application requires a single, cost-effective infrastructure within the distributed datacenter group to dynamically facilitate this fully meshed data replication service between the sites and between pods.
4. Data centre cost reduction. The use of a distributed fabric to create a single datacenter from several smaller datacenter sites provides fundamentally higher resilience. Infrastructure is spread across the sites and the IT capital facilities are scaled such that the loss of a single site has minimal impact on peak load. This multisite arrangement reduces costs in two ways: firstly, by reducing the extra capacity required to maintain resilience and secondly, and most importantly, by the removal of the need to ensure fully independent resilience of every individual site with back-up to power, cooling, telecoms access routes, physical security and so on.
12
TECHNICAL REPORT ICAR-CNR 2016-03, “Business Scenarios for Geographically Distributed Data Centers”
Amazon
An example of the need to manage efficiently the resources is Amazon. It is estimated that Amazon’s EC2 operates around one and half million servers running millions of virtual machines distributed across the world in around 12 data centers [22]. Current trends in converging the telecom infrastructure with datacenter infrastructures, having micro-data centers deployed to heat homes [23], and similar wide scale distribution of data in need of processing present a major challenge for managing resources and application efficiently.
Amazon operates at least 30 data centers in its global network, with another 10 to 15 on the drawing board. Amazon doesn’t disclose the full scope of its infrastructure, but third-party estimates peg its U.S. datacenter network at about 600 megawatts of IT capacity.
The Amazon’s philosophy is based on redundancy and uptime. The company organizes its infrastructure into 11 regions, each containing a cluster of data centers. Each region contains multiple Availability Zones, providing customers with the option to mirror or back up key IT assets to avoid downtime. The “ripple effect” of outages whenever AWS experiences problems indicates that this feature remains underutilized.
Amazon bases high availability on Availability Zones: clusters of data centers within a region that allow customers to run instances in several isolated locations to avoid a single point of failure. If customers distribute instances and data across multiple Availability Zones (AZs) and one instance fails, the application can be designed so that an instance in another Availability Zone can handle requests. Each region has between two and six Availability Zones. The company has since clarified that each availability zone resides in a different building. To make this work, the Availability Zones need to be isolated from one another, but close enough for low-latency network connections. Amazon says its zones are typically 1 to 2 milliseconds apart, compared to the 70 milliseconds required to move traffic from New York to Los Angeles. Amazon decided to place AZs relatively close together but in a different flood zone and a different geographical area, connected to different power grids, to make sure they are truly isolated from one another.
13

TECHNICAL REPORT ICAR-CNR 2016-03, “Business Scenarios for Geographically Distributed Data Centers”
2. Application scenarios for EcoMultiCloud
The optimal distribution of applications and Virtual Machines to servers is still an open problem, especially in large and dynamic systems. The problem is even more complex in geographically distributed data centers, whose adoption is rapidly increasing. Geographical data centers are deployed by major cloud service providers, such as Amazon, Google, and Microsoft, to match the increasing demand for resilient and low-latency cloud services, or to interconnect heterogeneous data centers owned by different companies in so called “Inter-Cloud” scenarios. Geographical frameworks are being introduced by major vendors (e.g. Cisco’s Intercloud Fabric or VMware’s vCloud Air) to build highly secure hybrid clouds and extend private data centers to public clouds as needed. In such environments, data centers offer different and time-varying energy prices, and workload variability is experienced both within single sites and across the whole infrastructure. Applications and services are forwarded on demand to the best available location(s) and with consistent network and security policies.
2.1. Hybrid Cloud
The Inter-Cloud scenario includes the “hybrid Cloud” case, in which private and public are interconnected and integrated. The IDC (International Data Corporation) study predicted that in 2015 [24], chief information managers will move to hybrid Cloud and, as part of this migration, existing deficiencies in service management will become evident, forcing investment in automation and consumption of externally managed services as alternatives to on-premises deployment of Cloud. Key trends that will manifest themselves in the Cloud market include demand for integrated software development methods that stress communication, collaboration, integration, automation and measurement of cooperation between software developers and other IT professionals. There is also demand for higher adoption of virtualization solutions and increased emphasis on operational governance and security management.
On March 24th, 2014 Cisco announced plans to build the world’s largest global Intercloud together with a set of partners to create a network of clouds called “Intercloud Fabric” [25]. Cisco's Intercloud strategy will essentially facilitate the move toward hybrid cloud – where private and public clouds become more integrated – and potentially beyond. Cisco is planning to spend $1bn on Intercloud over the next couple of years, and has more than 3,700 people working on it. Their partners will be connecting more than 400 DCs to Intercloud collectively in 50 countries. To enable IT and facilities side convergence and flexibility, Cisco will need to partner with suppliers that are developing advanced versions of DC Infrastructure Management (DCIM), which we classify as DC services optimization (DCSO) in the Inter-Cloud scenario. Intercloud Fabric has in fact open APIs to allow integration of third party management tools. Cisco does not have its own DCIM or DCSO tools for workload consolidation in inter-cloud scenario, (its $107m acquisition of Atlanta based start-up JouleX in 2013 provided it with only IT power monitoring and control).
2.2. Geographical Data centers
Globalization, security and disaster recovery considerations are driving business to diversify locations across multiple regions. In addition, organizations are looking to distribute workloads between computers, share network resources effectively and increase the availability of applications. With the ultimate goal of eliminating downtime
14

TECHNICAL REPORT ICAR-CNR 2016-03, “Business Scenarios for Geographically Distributed Data Centers”
and sharing data across regions, enterprises are deploying geographically dispersed data centers to minimize planned or unplanned downtime. The size of these data centers vary depending on the organization's business needs. Some enterprises are building mega data centers that have upward of 450, 000 square feet of floor space that house thousands of servers, storage and networking equipment including switches, routers, firewalls, load balancers, tape backup libraries and disk arrays; banks of uninterrupted power supply batteries that ensure continuous running of a datacenter in case of power failure. These data centers run standard and mission critical applications and continuously process and store data. Previously, organizations deployed different servers running multiple operating systems and software applications. Maintaining servers of various hardware types and updating diverse OS's and software applications became very difficult. The solution was to consolidate servers, which allowed sharing of resources between applications, thus lowering cost of ownership and maintenance, and increasing efficiency. [26].
Some companies such as Intune Networks [27] have developed new networking technology, allowing telecoms operators to build networks that are far simpler to operate and with much greater connectivity than previously possible. Intune have created a new way of switching packets over long distances, creating an optical Ethernet switch fabric that can switch packets in real-time across hundreds of kilometers. Intune have changed the conventional way to interconnect remote locations is to use point-to-point transport links to interconnect local switches at each site.
Intune have built a distributed switch, that has the characteristics of a local Ethernet switch, but that has ports distributed over hundreds of kilometers. Because its ports are spread out, this system is performing both switching and transport functions simultaneously. Any port of the system can connect to any other, without blocking. This has many advantages when distributing data centers. Any number of remote data centers can be connected together with a full-mesh of connectivity, just as though they were connected to the same local switch. Unlike traditional architectures, this system does not suffer from the 'n-squared' problem of adding many more links for every additional nodes. Adding a new 'pod' to the distributed datacenter simply requires a new port. All the other ports are automatically connected to it.
With Intune's system, IT resources can be located anywhere and be made available in a single virtual pool, which is both highly efficient, highly resilient, and delivers optimum user-experience.
IBM [28] believes that multinational companies are looking for cloud providers that can support mobile applications from data centers around the world. Whether a traditional enterprise application or a mobile application, serving it to customers from a nearby cloud datacenter reduces response times and other latencies. The global network of data centers IBM, which is also part of the Italian center of excellence we know as the IBM Campus, is based on cutting-edge technology with which they are guaranteed scalability, rapid adaptive systems and continuous availability. Located in the Milan area, the campus has long been a "best practice" standards. A single logical datacenter, consisting of 4 physical data centers, connected to high speed with high levels of security, automation, energy efficiency, reliability and modularity. The Campus is interconnected through a private network to all other structures of the global network of data centers IBM. In particular, the center of Milan, the global connection is facilitated by the proximity to the Milan Internet eXchange (MIX) allows the interconnection between domestic and international access to the "Big" Internet. The new cloud datacenter is the highest level of resiliency, and is ranked Tier 4 "reliability level". And this is where, by the end of May, will integrate the new structure, representing the gateway to the Italian global network of SoftLayer cloud which, since its acquisition, increased by 100 percent.
15
TECHNICAL REPORT ICAR-CNR 2016-03, “Business Scenarios for Geographically Distributed Data Centers”
To maintain continuity of service and business continuity, network platforms and designs must be able to recover quickly from hardware and software faults. Cloud-based applications, server virtualization and on-demand services are pushing conventional hierarchical datacenter networks to their limits. Legacy networks designed to enable client-server communications (or ‘North-South’ traffic, in and out of the datacenter) cannot accommodate the bandwidth-intensive, latency-sensitive intra and inter-datacenter server-to-server flows (‘East-West’ traffic) imposed by inter-host, intra-VM, and synchronized inter-VM servers communicating with each other within the same network and also across geographically distributed networks. Beyond driving the need for better server-to-server connections, server virtualization provides customers flexible tools for migrating virtual machines within the datacenter to optimize operations and improve availability. The advantage of on-demand resources can be greatly magnified. An infrastructure with mobile, active virtual machines can respond to new requirements much more quickly and very cost-effectively. Cloud computing users can gain even greater advantages from mobile virtual machines when they can be moved not only within a cloud datacenter, but over greater distances to connect multiple cloud data centers.
Virtual machine movement between cloud data centers enables applications such as disaster recovery and data replication. Intra and inter-cloud datacenter migration of virtual machines dictate very specific network design requirements: networks must be ‘flat’– which means that they have to be designed to connect potentially thousands of physical servers hosting tens of thousands of virtual servers within a single Layer 2 network domain. Network platforms and architectures not built to scale to these levels can limit deployment flexibility and increase management complexity. Moving live virtual machines within (and across) data centers has traditionally been a complex task because of the requirements of storage accessibility and moving the network-level policies associated with each virtual machine to its new location. The data storage location including the boot device used by the virtual machine must be active and accessible by both the source and destination virtual servers at all times. In addition, virtual machine policies, such as performance, security and quality of service (QoS), differ with different users and applications, making the movement of such policies with the virtual machine critical.
Moreover, in cloud data centers supporting multi-tenancy environment, the dynamic policy provisioning becomes necessary for each tenant and its management becomes more complicated. Beyond virtual machine migration, with virtualization and cloudlike service delivery, business continuity confronts new elements of complexity. Data protection strategies for virtualized applications must be evaluated together with their specific content and associated storage, along with the network connectivity for local and remote storage locations. The same types of challenges apply when performing backup operations across the network to a disaster recovery site, or deploying stretched storage clusters across multiple sites.
The figure below shows that the global data center equipment market is forecast to reach USD 72.07 billion by 2020 and is forecast to grow at a CAGR of 12.9% from 2014 to 2020. While it is difficult to predict the fraction of data centers that will have more than one sites, the figure confirms that the worldwide market in which Eco4Cloud can operate is huge1.
1 Source: LockerDome, Company Annual Report, Industrial Journals, https://lockerdome.com/adamwalker7717/7880126687876884
16

TECHNICAL REPORT ICAR-CNR 2016-03, “Business Scenarios for Geographically Distributed Data Centers”
2.3. Software Defined Datacenter
Software-defined data centers (SDD or SDDC), or virtual data centers, are data centers where all the infrastructure is virtualized and delivered as a service. The control of the datacenter is fully automated by software, meaning hardware configuration is maintained through intelligent software systems. This is in contrast to traditional data centers where the infrastructure is typically defined by hardware and devices. Software-defined data centers are considered by many to be the next step in the evolution of virtualization and cloud computing as it provides a solution to support both legacy enterprise applications and new cloud computing services.
There are three core components of the software-defined datacenter: network virtualization, server virtualization and storage virtualization. A business logic layer is also required to translate application requirements, SLAs, policies and cost considerations [29].
A primary goal of the software-defined datacenter is to help IT organizations be more nimble and deliver rapid, cloud-like services to users. There is also the promise of saving money by delivering IT in a more coordinated, streamlined fashion. Infrastructure components and services are consolidated, fully automated, driven by business policies, and centrally managed for performance. A SDDC can monitor demand and respond automatically in seconds by spinning up appropriate resources.
A software-defined datacenter is not the same thing as a private cloud, since a private cloud only has to offer VM self-service, beneath which it could use traditional provisioning and management. Instead, it imagines the datacenter that can encompass private, public, and hybrid clouds. The potential of the software-defined datacenter is that companies will no longer need to rely on specialized hardware or hire consultants to install and program hardware in its specialized language. Rather, IT will define applications and all of the resources they require—including compute, storage, networking, security, and availability—and group all of the required components to create a “logical application.”
17

TECHNICAL REPORT ICAR-CNR 2016-03, “Business Scenarios for Geographically Distributed Data Centers”
Commonly cited benefits of software-defined data centers include improved efficiencies from extending virtualization throughout the datacenter; increased agility from provisioning applications quickly; improved control over application availability and security through policy-based governance; and the flexibility to run new and existing applications in multiple platforms and clouds.
In addition, a software-defined datacenter implementation could reduce a company’s energy usage by enabling servers and other datacenter hardware to run at decreased power levels or be turned off. Some believe that software-defined data centers improve security by giving organizations more control over their hosted data and security levels, compared to security provided by hosted-cloud providers.
The software-defined datacenter is likely to further drive down prices for datacenter hardware and challenge traditional hardware vendors to develop new ways to differentiate their products through software and services.
The figure below shows the expected market of SDN in the five most important regional areas2. This justifies the high interest of Eco4Cloud for this application domain.
2 Source: https://www.visiongain.com/Report/1457/Software-Defined-Data-Centre-(SDDC)-Market-Report-2015-2020.
18

TECHNICAL REPORT ICAR-CNR 2016-03, “Business Scenarios for Geographically Distributed Data Centers”
3. Stakeholders and Business objectives
The objective of the EcoMultiCloud project aligns with the EU 2020 targets with respect to climate change and energy: greenhouse gas emission 20% lower than 1990 levels; 20% of energy from renewable sources; 20% increase in energy efficiency.
The main objective of the enterprise is the abatement of the operative infrastructure expenses (Opex), while constantly guarantying an adequate Quality of Service (QoS) even during the peak loads. EcoMultiCloud performs pre-emptive VM migrations to prevent overload of hardware resources. The maximum utilization thresholds (of CPU, RAM etc.) can be tuned to optimize efficiency and maximize Quality of Service (QoS) at the same time. In particular, the EcoMultiCloud solution can offer the following unique features, in comparison with existing competitors: scalability, modularity and autonomy from a technology perspective; reduction of power consumption and carbon emissions (up to 60%), reduction of energy costs, SLA and Quality of Service Management, load balancing among different sites, inter-DC traffic reduction from a business perspective.
The following subsection individuates the main users and stakeholders that can benefit from the EcoMultiCloud solution. Then, the successive subsections discuss the business objectives that are addressed by EcoMultiCloud: costs reduction, reduction of energy costs, reduction of CO2 emissions, reduction of water usage, QoS enhancements and adherence to SLAs, performance enhancements.
3.1. Users and Stakeholders
The EcoMultiCloud proposal aims to address the emergent needs of two types of users of the Cloud computing technology:
• Public and private Cloud providers and administrators. They need new tools, guidelines and recipes for delivering the best possible Cloud services, given their resources and budget. For example, they need to manage the workload easily and effectively, both internally at the local computing center and in cooperation with remote computing centers.
• End users: organizations using Cloud services and organizations providing services to a wider community of users. This project gives specific attention to private end users, although scientific, educational, health institutions and governments may benefit from the EcoMultiCloud solution. Such end users and organizations are given the possibility of accessing computational resources, offered not only by local facilities, but also by remote computing centers and Cloud providers.
EcoMultiCloud focuses on the effectiveness of algorithms, procedures and protocols that help data center administrators to match user requirements. This can be measured through the QoS offered to the end-users, e.g. end-user QoS requirements can include processing time (especially in the case of long-running scientific experiments), downtime in cases of outages, latency, reliability, business continuity, and so on. The end-user QoS requirements vary considerably, depending on the characteristics of the applications. Accordingly, a profiling of use cases and applications is a necessary step when deciding upon the optimal allocation of resources to applications.
One of the objectives of EcoMultiCloud is to provide a thorough profiling of the applications associated with the different use cases, and of the computing centers and Cloud providers supporting the applications. This is necessary
19

TECHNICAL REPORT ICAR-CNR 2016-03, “Business Scenarios for Geographically Distributed Data Centers”
to offer the computing center administrators complete control of the system via the monitoring features of the EcoMultiCloud Web-based dashboard. The profiling is also essential to the efficient and effective design of high-level algorithms for workload management.
Strategies must be devised to properly match the features of applications and computing centers/Cloud providers, so as to optimize resource utilization, ensure resiliency and improve the QoS perceived by organizations and users. For example, an efficient strategy should allocate data-intensive applications to the most reliable computing centers, as the cost for offloading such applications – in terms of migration time, occupied bandwidth, downtime – is high. Conversely, CPU-intensive scientific applications that use a low amount of stored data and do not present hard requirements in terms of tolerated downtime, may be allocated on less reliable computing centers, because such applications can be migrated to a more reliable computing center when needed – e.g., in case of electrical outage – without remarkably affecting the business continuity.
EcoMultiCloud also gives the data center administrators the opportunity of specifying the business goals that are mostly relevant for the specific scenario – minimization of energy costs, load balancing, reduction of carbon emission, etc. The VM migrations, needed to achieve such goals, are performed with a rate that is also tunable by administrators.
The main target customers of the EcoMultiCloud solution are the administrators of Large and Medium sized DCs, which in most cases need to manage distributed DCs hybrid cloud infrastructures. They represent about the 50% of the global market and, thus, a potential market of 3.8 B$ worldwide.
As detailed in the Feasibility Analysis of Phase 1, the EcoMultiCloud solution is an Inter-DC Service Optimization (Inter-DCSO) tool. DCSO is a category of integrated software tools and systems that are used to proactively manage the supply and demand of physical and virtual resources within a datacentre, and beyond it into the digital infrastructure and power chain, both dynamically and throughout the lifecycle.
In the Feasibility Study we also mentioned the last report of 451 Research entitled “Datacentre management software: DCIM and DCSO”, which states that the global revenue for DMS (Datacenter Management Software) will reach more than $2bn by 2019 (see Fig. 5), and DCIM generates the largest portion of DMS revenue. DCSO is a niche and evolving market with a CAGR of 25% for the years 2014-2019.
The most interesting geographic areas for DMS market are North America and EMEA, with special focus to Western Europe counting for the 70% of the total EMEA market. The report analyzed includes 70 DMS vendors: 86% of these vendors compete in North America and 53% in Western Europe.
20

TECHNICAL REPORT ICAR-CNR 2016-03, “Business Scenarios for Geographically Distributed Data Centers”
Fig. 5. Expected global revenue for DMS
As Eco4Cloud we have contacted potential customers to get feedback regarding user preferences, willingness-to-pay, solution acceptance and market barriers. Companies owning distributed DCs represent our primary target customers. The business areas in which these company operate are mainly: Insurance companies (Assicurazioni Generali, Cattolica Assicurazioni), Financial institutions and banks (Intesa Sanpaolo, UBS-UK, Royal Bank of Scotland, BNP Paribas, Unicredit, Banca MPS, Banca Popolare di Milano, Unipol, UBI), Telco operators (Telecom Italia and TIM Brasil), Government agencies (Vaticano, Inail, CNIT), Multinational enterprises (ENI, Saipem, IBM), and DC solution providers (Digital Realty).
A recent study published by 451 Research indicates that the 90% of the identified target customers have concerns about projected savings, flexibility, compatibility with existing applications, lack of a migration path from existing applications to clouds, lack of SLAs for policy-based management, and interoperability. Their objective is to get the
21

TECHNICAL REPORT ICAR-CNR 2016-03, “Business Scenarios for Geographically Distributed Data Centers”
maximum benefit from the efficient use of their DCs infrastructure by maximizing the use of physical resources spread across multiple DC and managing risk levels dedicated to mitigate peak loads. It is evident that the energy savings cannot be the only driver in introducing our solution to customers.
We have understood the necessity to give more emphasis to the technical goals depending on the buyer profile. Specifically, as detailed in the Feasibility Study of Phase 1, we have individuated the following potential buyers:
Buyer Primary Concerns Role in DC technology purchasing
COO, CFO, CEO
− Profitability − Cost reduction and productivity increase − SLA compliance − Risk management − Corporate reputation (green, environment)
− Influence technology adoption strategy (CEO) and final brand selection (COO, CFO)
Head of IT
− Optimal occupancy of physical resources and adaptive optimization of inherently variable workloads
− Capacity planning − Integration of hybrid technologies − ROI of IT investments
− Drive/define technology adoption strategy
− Closely involved in purchasing process, esp. final brand selection
DC Manager
− Migration of VMs from servers before they get overloaded through the real-time monitoring analytics of critical system parameters (e.g. CPU load, memory usage, bandwidth saturation, temperature, storage occupancy)
− Infrastructure and application security − System-alerts that help mitigate risks and the overall DCs
reliability.
− Responsible for matching tech requirements to business needs
− Heavily involved in the purchase process
− Determine the scope of trial and deployment
Technical Manager
− Ease of deployment, management and support − Infrastructure stability, availability, scalability and
performance
− Primarily responsible for defining feature and capability needs, evaluating vendors, conducting pilots and deploying products
3.2. Business objectives
By using the EcoMultiCloud solution, it is possible to achieve: energy savings (power consumption reduced up to 60%); cost savings (thanks to reduced power consumption, reduced cooling requirements, lighter administration burden); reduced carbon footprint (reduction up to 60%, which helps to obtain Energy Savings Certificates); resources optimization.
22

TECHNICAL REPORT ICAR-CNR 2016-03, “Business Scenarios for Geographically Distributed Data Centers”
From a more quantitative point of view, as assessed in the Feasibility Study of Phase 1, the targets to be assessed in the project are:
• Reduction of datacenter energy bill and carbon footprint (up to 60%) – By dynamically consolidating the Virtual Machines (VMs) on the minimum number of physical servers, the unoccupied servers are set to hibernate, hence eliminating their energy consumption. By maximizing the utilization of active servers in the datacenter, CapEx gets immediately reduced, and OpEx (in the form of energy saving) as well. Furthermore, by having less energy consumed power, cooling and sizing gets reduced as well, contributing to indirect additional reductions of OpEx and CapEx, respectively. VMs migration between geographical distributed DCs allow to add an additional reduction of energy up to 21%.
• Consolidation and efficiency (up to 90%) - The solutions/techniques commonly available today are extremely complex, poorly adaptive and not scalable. The VM-consolidation problem requires exponential time if solved with a typical deterministic approach, which translates into sub-optimal consolidation and efficiency figures. Our innovative statistical algorithm and self-organizing/adaptive consolidation process help achieving efficiency figures in excess of 90%.
• Scalability - Thanks to its adaptive/self-organized distributed algorithm, the proposed solution is very efficient for such a complex (NP-hard, i.e. exponential) problem, and converges to the optimal state regardless of DC size in just a few hours. This is a great advantage as energy and cost savings are proportional to the datacenter size.
The following sections give details on some of the main business objectives that are addressed by EcoMultiCloud.
3.3. Costs and energy reduction
While workload assignment and migration can be very effective for cost reduction, the associated decision processes are made particularly complex by the time-variability of electricity cost, and by the workload variability both within single sites and across the whole infrastructure. The cost of electricity is generally different from site to site and also varies with time during the day, even on a hourly basis, therefore the overall cost may be reduced by shifting portions of the workload to more convenient or cheaper sites.
EcoMultiCloud can be used to shift workloads between facilities depending on the price of electricity at different sites. Workloads can also be shifted between sites to be executed at different times of the day or night. This process is also known as “following the moon”. The opportunity for cost savings comes from the possibility of routing jobs when/where the electricity prices are lower. EcoMultiCloud will consider electricity price variations and/or job arrival processes, and will tackle the problem taking into account the spatial and time diversity in dynamic electricity markets. The attempt is to minimize overall costs for multiple data centers located in different energy marketing regions.
The explosion of digital content, big data, e-commerce, and Internet traffic is making DCs one of the fastest-growing consumers of electricity in developed countries. DCs require a significant amount of power to be operated. A very large DC may consume 30GWh of power in a year, costing its operator around €2,778,000 for electricity alone
23

TECHNICAL REPORT ICAR-CNR 2016-03, “Business Scenarios for Geographically Distributed Data Centers”
(considering an average European price equal to 0,0926€ per kWh in 2014 [30]). Electricity bill accounts for 30-50% of the DC operating costs.
Nowadays, DCs around the world consume 30 billion watts of power annually (~1,2% of worldwide electricity consumption [31]), the equivalent annual output of 30 nuclear power plants and produce 200 million metric tons of carbon dioxide [32].
The 41% of the global amount of DCs are located in USA and the 36% in Europe [33].
• In 2013, U.S. DCs consumed an estimated 91 TWh of electricity. This figure is projected to increase to roughly 140 TWh annually by 2020, costing American businesses $13 billion annually in electricity bills and emitting nearly 100 million metric tons of carbon pollution per year [34].
• In 2013, the energy consumption of European DCs was 60 TWh per year and it will reach 104 TWh by 2020, costing European businesses €9,6 billion annually in electricity bill [35].
Savings on electricity bill can be estimated at 45% thanks to the unused servers that are turned off (without take advantage of the price and/or availability of electricity at different sites through the interaction with different energy providers).
3.4. Reduction of CO2 Emissions
Companies are today strongly encouraged to reduce the amount of carbon emissions, not only to compel to laws and rules, but also to advertise their green effort and attract customers that are increasingly careful about sustainability issues.
The Cloud reduces carbon emissions through minimized energy requirements. According to the CDP (Driving Sustainable Economies) report [36], offsite servers have the potential to prevent 85.7 million metric tons of annual carbon emissions by 2020. The environmental impact of these substantial reductions in energy are significant. One study surveying the clients of Salesforce , a fast-growing Cloud computing giant, suggested carbon reductions of 95 percent compared to companies with servers on their premises.
However, these benefits are not necessarily realized in practice when the risk of power and network outages is high. It may be necessary to restart a long-running computation many times, as the infrastructure may not remain stable for long enough to complete. Therefore, hardware saving and carbon footprint are also related to the stability of data centers and energy sources, which is one of the issues tackled by EcoMultiCloud.
The carbon emission problem can be tackled by addressing the temporal and spatial aspect of carbon emission. The reduction of carbon emissions comes only from a wider and more efficient use of renewable energy. EcoMultiCloud will include a global scheduler that could maximize the green energy consumption given dynamic electricity pricing. For example, EcoMultiCloud can foster load migration between data centers that are at remote locations and powered only by renewable energy. Electricity producing at different places contains different amount of carbon and, during peak hours, peak generators are turned on to meet the demand, thus increase carbon emission temporally. The objective is to maximize the percentage of renewable energy used to power a network of distributed data centers, subject to the desired cost budgets of Internet service operators.
24

TECHNICAL REPORT ICAR-CNR 2016-03, “Business Scenarios for Geographically Distributed Data Centers”
3.5. Reduction of water usage
With data centers accounting for a widely estimated 2% of US electrical consumption and a significant carbon footprint, environmental considerations remain an important aspect of operations. As the sustainability landscape evolves, such issues are influencing datacenter design, resiliency, operational standards and efficiency products.
Datacenter operators continue to run and evaluate their operations based on metrics. Power usage effectiveness (PUE) is the universally accepted standard, with The Green Grid's [37] more recently developed carbon usage effectiveness (CUE) and water usage effectiveness (WUE) metrics beginning to gain relevance. By combining all three into a comprehensive benchmark report, a facility manager is better positioned to evaluate overall datacenter sustainability and efficiency, making adjustments as necessary (although the metrics say nothing about the efficiency of the IT itself.
1. PUE is the measurement of total energy of the datacenter divided by the IT energy consumed. The IT energy should be measured at the output of the power distribution unit, and the total energy consumed should include all energy sources at the point of utility handoff to derive as accurate a measurement as possible.
2. CUE assesses the carbon footprint of a given datacenter, measuring the greenhouse gas emissions in relation to IT energy consumption. There are several factors that must be determined to accurately calculate CUE, yet in its simplest form, for data centers with electricity as the only energy source, CUE = PUE x CEF. CEF is the carbon dioxide emission factor, calculated and available from the EPA website.
3. The Green Grid defines WUE as a site-based metric that assesses the water used on-site for datacenter operations. Usage will include water used for humidification, on-site energy production and cooling of the datacenter, and related support systems. WUE = annual site water usage (measured in liters) divided by IT equipment energy (measured in kWh). IT energy includes all equipment, including compute, storage, network and associated tools to monitor or control the datacenter, including workstations, monitors and switches.
While advanced cooling systems (e.g., air economizer [38]) are good at water saving, most data centers are located in places where installation of such cooling systems is not feasible or economical [39]. It is common that data centers, such as AT&T and eBay [40], [41], rely on water-intensive methods for cooling (e.g., water-side economizer and water-cooled chillers) [42]. It was estimated that a 15MW datacenter could consume 360,000 gallons of cooling water each day [43], while another report [44] said that the U.S. National Security Datacenter in Utah would require up to 1.7 million gallons of water for cooling each day (enough to satiate 10,000 households’ daily needs). Even in regions with relatively abundant water, there are strong motivations for data centers to conserve water. Reducing water by 10-25% is a prerequisite for green certifications (e.g. LEED program [45]) which are being actively pursued by 77% of large data centers as shown in a recent survey [42]. Water compliance codes are tightening in many regions [46], and the U.S. government requires all federal facilities to reduce water usage by 2% each year through 2020 [47]. Last but not least, forward-looking companies have been taking active steps to conserve water for mitigating business risks, improving public image and fulfilling social responsibility (e.g., AT&T’s recent efforts [41]). Datacenter water consumption per unit IT energy [48] changes over location and also over time in its own way: the same amount of energy but consumed at different times/locations may result in different water footprints. The most recent efforts to reduce water consumption are focusing on facility or infrastructure upgrades, such as using recycled water or seawater instead of potable water, using chemicals to reduce water “blown down” in cooling
25

TECHNICAL REPORT ICAR-CNR 2016-03, “Business Scenarios for Geographically Distributed Data Centers”
towers, and directly using outside cold air [38], [41], [49], [50]. These techniques, however, often require high upfront costs and/or suitable locations/climate conditions (which may not be satisfied by drought areas).
Instead of tackling the problem using improved “engineering”, a software-based approach can be used to optimize workload management. The approach relies on the following two techniques.
1. Geographic load balancing (GLB): dynamically dispatching workloads to geo-distributed data centers.
2. Power proportionality: dynamically turning on/off servers in accordance with workloads.
Both GLB and power proportionality have been extensively studied in various contexts (e.g., electricity cost [51], [52], [53], [54], carbon emission [55]). Nonetheless, what makes our research unique is that we exploit the inherent spatial and temporal diversities of data centers’ water efficiencies and optimize GLB and power proportionality decisions for water conservation. It is a very challenging problem to minimize operational cost while capping water consumption using GLB and power proportionality. First, dispatching more workloads to water-efficient data centers may result in high electricity cost, and hence it is non-trivial to successfully cap water footprint while keeping the operational cost low. Second, when using power proportionality, incorrectly turning off too many servers may result in intolerable performance degradation, whereas turning off too few servers may unnecessarily increase operational cost and waste water. Last but not least, achieving water capping involves budgeting water consumption over a long term and hence optimally doing so requires the knowledge of far future information (e.g., outside temperature, which affects water efficiency), but such offline information is practically challenging to obtain accurately.
3.6. QoS enhancement and adherence to SLAs
The success of Cloud mainly depends on the Quality of Service (QoS) that can be offered to the end-users. Cloud providers have to pay particular attention to the effectiveness of the adopted algorithms, procedures and protocols. This can be measured through the QoS offered to the end-users, e.g. end-user QoS requirements can include processing time (especially in the case of long-running scientific experiments), downtime in cases of outages, latency, reliability, business continuity, and so on.
Organizations managing multiple DCs want to ensure workloads are proportionally balanced across sites in order to improve the responsiveness of specific sites and reduce the impact on physical infrastructure such as power and cooling systems. In fact the workload must be distributed without overloading any individual site. This may affect the Quality of the Service, which may still be improved by intelligently combining applications (i.e., VMs) having complementary characteristics (e.g., CPU-bound with RAM-bound applications). In an inter-site environment, EcoMultiCloud is able to properly balance the load distributed across different sites, as a better balance may help improve the responsiveness of the individual sites, decrease the impact on physical infrastructure, and help prevent overload conditions affecting the QoS. Thanks to the insights and real-time monitoring analytics of critical system parameters provided by EcoMultiCloud, DC Managers can proactively/predictively prevent SLA violations, mitigate risks and increase overall DC reliability positioning the enterprise with a strong Green/Environmental reputation.
26

TECHNICAL REPORT ICAR-CNR 2016-03, “Business Scenarios for Geographically Distributed Data Centers”
Eco4Cloud and HP – global leader in datacenter technologies, services and architectures – have jointly validated Eco4Cloud’s leading edge technology, carrying out extensive and rigorous tests at HP’s Innovation Center on their flagship Gen8 HP BladeSystem c7000 Enclosures. Results confirm that Eco4Cloud’s software platform can help customers significantly reduce energy consumption in virtualized Data centers (test results: 48,1%), with no impact on business services, while actually improving SLAs.
E4C describes its core technology as 'virtual infrastructure optimization' software. The software is capable of clustering the maximum number of VMson the minimum number of servers while proactively managing service-level agreements (SLAs).
3.7. Performance enhancement
In virtual environment the hypervisors such as VMware ESX enable impressive memory and CPU consolidation ratios [56]; ESX allows running VMs with total configured resources that exceed the amount available on the physical machine: this is called overcommitment.
Overcommitment raises the consolidation ratio, increases operational efficiency and lowers total cost of operating virtual machines; if out of control, overcommitment leads to Resource Contention, a typical situation where several VMs are competing over the same resources, waiting for the VMware scheduler to assign them.
This is the main reason for performance issues in virtualized environment and, as such, it is the very first key performance indicator to be monitored in a virtual farm. Contention is measured via CPU Ready Time and Memory Ballooning.
• CPU Ready Time: Is a metric showing how much time a virtual machine with work to do is waiting to be scheduled onto a physical (or HT) core by the CPU scheduler. It is a symptom of contention on CPU. In short, the more CPU Ready you see on your Virtual (Vmware) Infrastructure the worse off it is, leading to performance degradation on the virtual guests and bad end user experience.
• Memory Ballooning: VMware ballooning is a memory reclamation technique used when and ESXihost is running low on memory. This permits the physical host system to retrieve unused memory from certain guest virtual machines (VMs) and share it with others. It is a symptom of contention on Memory RAM. VM memory ballooning can create performance problems. When a balloon driver inflates to the point where the VM no longer has enough memory to run its processes within itself, it starts using another VM memory technique known as memory swapping. This will slow down the VM, depending upon the amount of memory to recoup and/or the quality of the storage IOPS delivered to it.
VM memory ballooning can create performance degradation because it is a CPU intensive process.
CPU Ready Time and Ballooned Memory are symptoms of contention on CPU and memory respectively.
These metrics represent the universally recognized in lT literature as the most significant indicators of the fact that the virtual machines are experiencing bad performances. The generally accepted industry best practice based on VMware’s guidelines is that CPU Ready Time values up to 5% (per vCPU of course!) falls within acceptable parameters. If host free memory drops towards the 4% threshold, the hypervisor starts to reclaim memory using
27

TECHNICAL REPORT ICAR-CNR 2016-03, “Business Scenarios for Geographically Distributed Data Centers”
ballooning. The Workload Consolidation Load Balancer intelligence is choosing the ideal placement of VMs on the cluster’s hosts in order to minimize the impact CPU Ready Time and smart ballooning high values. A field test [57] has been performed in a performance comparison between VMware® Distributed Resource Scheduler and Eco4Cloud Workload Consolidation platform the core component of EcoMulticloud.
• VMware® Distributed Resource Scheduler (DRS) aggregates computing capacity across a set of servers into logical resource pools and intelligently allocates available resources among the VMs, based on pre-defined rules.
• VMware Distributed Power Management (DPM), within VMware DRS, automates power management and minimizes power consumption across a given collection of servers in a VMware DRS cluster.
Fig. 6 shows the results of a test performed on a production Farm of Telecom Italia, in which 6 hosts running VMWare VSphere 5 have been monitored. These hosts are manufactured by HP, Each CPU has 4 physical cores, so the total number of physical cores for each host is 16. On these hosts 94 virtual machines were assigned a number of virtual CPU cores ranging from 1 to 8 (most of them with 2 and 4 virtual cores) and an amount of RAM varying from 1 to 16 GB (most of them with 2 and 4 GB of RAM).
Fig. 6 Performances Improvement on a TIM production farm
Just after the end of the test, it was clear that through Eco4Cloud Workload Consolidation usage, the overall cluster performance increased: on one hand, CPU Ready Time dropped by 23%; on the other hand, Ballooned Memory was completely removed, through the intelligent workload placement strategy brought by Eco4Cloud Workload Consolidation.
28

TECHNICAL REPORT ICAR-CNR 2016-03, “Business Scenarios for Geographically Distributed Data Centers”
4. EcoMultiCloud: a hierarchical solution for geographical data centers
EcoMultiCloud proposes a hierarchical framework/architecture for the efficient distribution of the workload on a multi-site scenario (among geographically distributed interconnected DCs). It allows for an integrated and homogeneous management of heterogeneous platforms but at the same time it preserves the autonomy of single sites. Through the self-organizing and adaptive nature of the approach, the Virtual Machines migrations are performed asynchronously, both location-wise and time-wise, and with a tunable rate managed by DCs administrators. The solution is covered by 3 international patents protecting the core principles of the architecture. This puts EcoMultiCloud in a strong competitive advantage in comparison to other solutions.
The workload assignment and migration decision processes are made particularly complex by the time-variability of electricity cost, and by the workload variability both within single sites and across interconnected sites. This naturally leads to a hierarchical infrastructure, in which single DCs manage the local workload autonomously but communicate with each other to route and migrate VMs among them.
The need for autonomous management is self-explanatory in multi-owned DCs, and is crucial even within a single-owner infrastructure, for example in the case that one or several sites are hosted by co-located multi-tenant facilities.
The dynamic migration of workload among data centers has become an opportunity to improve several aspects: better resiliency and failover management, improved load balancing, exploitation of the “follow the moon” paradigm (i.e., move the workload where the energy is cheaper/cleaner and/or cooling costs are lower), Host Thin Provisioning™ in managed services scenarios. Inter-site migration is enabled by the availability of a much higher network capacity and guaranteed latency, thanks to both physical improvements (e.g., through techniques such as wavelength division multiplexing) and logical/functional enhancements (e.g., the adoption of Software Defined Networks). Reliable and low-latency connections can be used to shift significant amount of workload from one site to another through dedicated networks or even via regular Internet connections.
The EcoMultiCloud hierarchical architecture is composed by two layers:
1. The lower layer is used to allocate the workload within single DCs: each site adopts its own strategy to assign VMs internally, with local consolidation algorithms (possibly different from site to site). The lower layer collects information about the state of the local DC, and passes it to the upper layer.
2. The upper layer is able to exchange information among homogeneous and interconnected sites and drive the distribution of VMs among the DCs
The rest of this section illustrated the main characteristics of EcoMultiCloud (Section 4.1), the hierarchical architecture of the EcoMultiCloud framework (Section 4.2) and a typical use case (Section 4.3).
29

TECHNICAL REPORT ICAR-CNR 2016-03, “Business Scenarios for Geographically Distributed Data Centers”
4.1. Main features of EcoMultiCloud
The EcoMultiCloud framework adds a higher level of inter-datacenter workload management to the tools Eco4Cloud has developed to consolidate virtual machines (VMs) onto the fewest number of servers. The focus on workload management is coherent with other efforts in this area, including a strong push from all the big players, as detailed in Section 1.5.
EcoMultiCloud aims to offer the following advantages with respect to current potential competitors:
• Inter-Cloud Management: tool for the efficient management of the workload in a multi-site scenario, i.e. a technique allowing to perform workload consolidation on distributed data centres, which are typically distant on a geographical scale and remotely connected through the network. E4C has patented an algorithm for the efficient management of workload in geographical data centres. The inter-cloud algorithm combines intra-cloud consolidation with optimal distribution of workload among remote data centres. Objectives will be specialized for specific deployments: inter-cloud load balancing, reduction of costs, consumed energy and carbon emissions, etc. This feature is particularly advantageous for the geographical data center scenario and the software defined network scenario, descripted in Section 2.2 and 2.3.
• Risk Mitigation: Threshold-triggered dynamic response via system alerts and automated tasks. EcoMultiCloud performs pre-emptive VM migrations to prevent overload of hardware resources. The maximum utilization thresholds (of CPU, RAM etc.) can be tuned to optimize efficiency and maximize Quality of Service (QoS) at the same time. Risk mitigation is essential in all the application scenarios descripted in Section 2, specifically in Hybrid Cloud, since on-premises resources are interconnected with resources held by third parties.
• Real-Time Adaptation: capacity of quickly adapting the assignment of VMs (e.g., through live migrations) to workload changes. EcoMultiCloud has the ability of quickly adapting the assignment of VMs to workload changes, e.g., through asynchronous live migrations and/or proper allocation of new applications. Real-time adaptation is a very important requirement in the geographical data center scenario and the software defined network scenario, descripted in Section 2.2 and 2.3, especially in the cases that client applications need to be moved from one site to another with minimum downtime.
• Scalability: efficient consolidation algorithm for problem with exponential computational complexity (the bin packing problem), which converges to optimal state regardless of the size and number of data centers. As a benefit deriving from its decentralized/self-organizing/probabilistic algorithms, EcoMultiCloud is highly scalable, and the main performance metrics (consolidation degree, frequency of migrations per server, etc.) are independent from the data center size. This feature is particularly advantageous in the geographical data center scenario, descripted in Section 2.2, especially when the number of interconnected data centers is large.
30
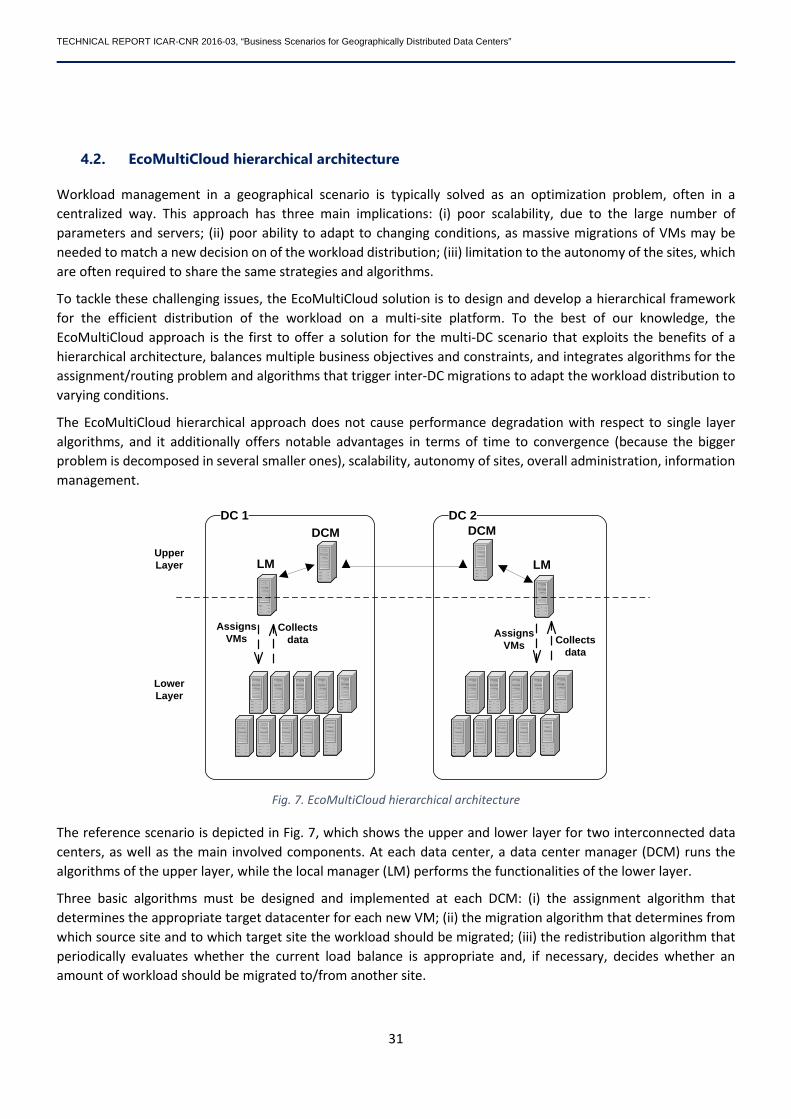
TECHNICAL REPORT ICAR-CNR 2016-03, “Business Scenarios for Geographically Distributed Data Centers”
4.2. EcoMultiCloud hierarchical architecture
Workload management in a geographical scenario is typically solved as an optimization problem, often in a centralized way. This approach has three main implications: (i) poor scalability, due to the large number of parameters and servers; (ii) poor ability to adapt to changing conditions, as massive migrations of VMs may be needed to match a new decision on of the workload distribution; (iii) limitation to the autonomy of the sites, which are often required to share the same strategies and algorithms.
To tackle these challenging issues, the EcoMultiCloud solution is to design and develop a hierarchical framework for the efficient distribution of the workload on a multi-site platform. To the best of our knowledge, the EcoMultiCloud approach is the first to offer a solution for the multi-DC scenario that exploits the benefits of a hierarchical architecture, balances multiple business objectives and constraints, and integrates algorithms for the assignment/routing problem and algorithms that trigger inter-DC migrations to adapt the workload distribution to varying conditions.
The EcoMultiCloud hierarchical approach does not cause performance degradation with respect to single layer algorithms, and it additionally offers notable advantages in terms of time to convergence (because the bigger problem is decomposed in several smaller ones), scalability, autonomy of sites, overall administration, information management.
DC 1DCM
Assigns VMs
LM
Collects data
DC 2
LM
Assigns VMs
DCM
Collects data
Upper Layer
Lower Layer
Fig. 7. EcoMultiCloud hierarchical architecture
The reference scenario is depicted in Fig. 7, which shows the upper and lower layer for two interconnected data centers, as well as the main involved components. At each data center, a data center manager (DCM) runs the algorithms of the upper layer, while the local manager (LM) performs the functionalities of the lower layer.
Three basic algorithms must be designed and implemented at each DCM: (i) the assignment algorithm that determines the appropriate target datacenter for each new VM; (ii) the migration algorithm that determines from which source site and to which target site the workload should be migrated; (iii) the redistribution algorithm that periodically evaluates whether the current load balance is appropriate and, if necessary, decides whether an amount of workload should be migrated to/from another site.
31

TECHNICAL REPORT ICAR-CNR 2016-03, “Business Scenarios for Geographically Distributed Data Centers”
The assignment algorithm is used to route a new VM to the best target datacenter. However, the workload distribution may become inefficient when the conditions change, e.g., the overall load or the price of energy may vary in one or more data centers. In such cases inter-DC VM migrations are performed to redistribute the workload considering the new conditions.
5. Conclusions
In this technical report, we have examined the problem of the computational efficiency and the dynamic and adaptive redistribution of the workload in multi-site data centers. In Section 1 we summarized the main features of the involved technologies, and outlined the solutions envisioned by the big players in this field.
In Section 2, we examined the main business scenarios that are involved, specifically Hybrid Cloud, geographical data centers and Software Defined Networking. EcoMultiCloud will offer an efficient and scalable solution to the problem of optimally assigning the VMs among multiple data centers and within each data center. The solution will include two sets of algorithms at two different layers, which will be integrated in a hierarchical framework.
Specifically, the EcoMultiCloud hierarchical architecture will be composed by two layers: (i) the lower layer is used to allocate the workload within single DCs: each site adopts its own strategy to assign VMs internally, with local consolidation algorithms (possibly different from site to site). The lower layer collects information about the state of the local DC, and passes it to the upper layer; (ii) the upper layer is able to exchange information among homogeneous and interconnected sites and drive the distribution of VMs among the DCs
Thanks to the use of a hierarchical approach, EcoMultiCloud guarantees: (i) high scalability, because the problem is decomposed in two layers and the size is thus notably reduces; (ii) modularity, since the algorithms of the lower layer can be designed independently from the upper layers, and vice versa; (ii) autonomy of data centers, since any data center can choose its own solution for the internal management of the workload.
6. References
[1] Driving Sustainable Economies, "New study: Cloud computing can dramatically reduce energy costs and carbon emissions," [Online]. Available: https://www.cdp.net/en-US/WhatWeDo/CDPNewsArticlePages/cloud-computing-can-dramatically-reduce-energy-costs-and-carbon-emissions.aspx.
[2] R. Baillie, "Big Data Goes Green," Renewable Energy Network for News - Information & Companies, 2012. [Online]. Available: http://www.renewableenergyworld.com/rea/news/article/2012/07/big-data-goes-green.
[3] C. Cappiello, N. Ho, B. Pernici, P. Plebani and M. Vitali, "CO2-aware adaptation strategies for cloud applications," Cloud Computing, IEEE Transactions on, vol. PP, no. 99, p. pp. 1–1, 2015.
32
TECHNICAL REPORT ICAR-CNR 2016-03, “Business Scenarios for Geographically Distributed Data Centers”
[4] X. Xu, W. Dou, X. Zhang and J. Chen, "EnReal: An energy-aware resource allocation method for scientific workflow executions in cloud environment," Cloud Computing, IEEE Transactions on, vol. PP, no. 99, p. pp. 1–1, 2015.
[5] D. Lucanin and I.Brandic, "Pervasive cloud controller for geotemporal inputs," Cloud Computing, IEEE Transactions on, vol. PP, no. 99, p. pp. 1–1, 2015.
[6] M. Pantazoglou, G. Tzortzakis and A. Delis, "Decentralized and energyefficient workload management in enterprise clouds," Cloud Computing, IEEE Transactions on, vol. PP, no. 99, JOURNAL OF LATEX CLASS FILES, VOL. X, NO. Y, JULY 2016 3, p. pp. 1–1, 2015.
[7] X. Dai, M. Wang and B. Benasou, "Energy-efficient virtual machines scheduling in multi-tenant data centers," Cloud Computing, IEEE Transactions on, vol. PP, no. 99,, p. pp. 1–1, 2015.
[8] F. Kong and X. Liu, "A survey on green-energy-aware power management for datacenters," ACM Comput. Surv, vol. 47, no. 2, p. 30:1–30:38, 2014.
[9] Z. Liu, M. Lin, A. Wierman, S. Low and L. Andrew, "Greening geographical load balancing," IEEE/ACM Transactions on Networking, vol. PP, no. 99, p. 1–1, 2014.
[10] Y. Yao, L. Huang, A. B. Sharma, L. Golubchik and M. J. Neely, "Power cost reduction in distributed data centers: A two-time-scale approach for delay tolerant workloads," IEEE Transactions on Parallel and Distributed Systems, vol. 25, no. 1, p. 200–211, 2014.
[11] Y. Guo, Z. Ding, Y. Fang and D. Wu, "Cutting down electricity cost in internet data centers by using energy storage," in IEEE Global Telecommunications Conference (GLOBECOM 2011). pp.1-5, 2011.
[12] L. Rao, X. Liu and W. Liu, "Minimizing electricity cost: Optimization of distributed internet data centers in a multi-electricity-market environment," in Proc. of INFOCOM, 2010.
[13] E. Feller, L. Rilling and C. Morin, "Snooze: A scalable and autonomic virtual machine management framework for private clouds".
[14] X. Xiang, C. Lin, F. Chen and X. Chen, "Greening geo-distributed data centers by joint optimization of request routing and virtual machine scheduling".
[15] OPF - Open Networking Foundation, "Software-Defined Networking (SDN) Definition," [Online]. Available: https://www.opennetworking.org/sdn-resources/sdn-definition.
[16] [Online]. Available: https://www.opennetworking.org/sdn-resources/sdn-definition.
[17] Google, "Google Cloud Platform Blog Wednesday," 17 06 2015. [Online]. Available: https://cloudplatform.googleblog.com/2015/06/A-Look-Inside-Googles-Data-Center-Networks.html.
[18] A. M. Salem, "Facebook Distributed System Case Study For Distributed System Inside Facebook Datacenters," INTERNATIONAL JOURNAL OF TECHNOLOGY ENHANCEMENTS AND EMERGING ENGINEERING RESEARCH, vol. 2.
33

TECHNICAL REPORT ICAR-CNR 2016-03, “Business Scenarios for Geographically Distributed Data Centers”
[19] IBM, "BM Opens Cloud Data Center in São Paulo, Brazil," 15 Sep 2015. [Online]. Available: http://www-03.ibm.com/press/us/en/pressrelease/47667.wss.
[20] C. Babcock, "IBM Bets Big On Global Datacenter Network," 17 1 2014. [Online]. Available: http://www.informationweek.com/cloud/platform-as-a-service/ibm-bets-big-on-global-datacenter-network/d/d-id/1113478.
[21] Intune networks, "Distributed Data Centres," [Online]. Available: http://www.intunenetworks.com/home/distributed_datacentres/.
[22] EnterpriseTech, "A Rare Peek Into The Massive Scale of AWS," [Online]. Available: http://www.enterprisetech.com/2014/11/14/rare-peek-massive-scale-aws/ .
[23] Liu, Jie, Michel Goraczko, Sean James and Christian B, "The data furnace: heating up with cloud computing.," InProceedings of the 3rd USENIX conference on Hot topics in cloud computing. HotCloud, vol. 11, pp. 15-15, 2011.
[24] IDC , "IDC Reveals Cloud Predictions for 2015," 12 2014. [Online]. Available: https://www.idc.com/getdoc.jsp?containerId=prUS25350114.
[25] Cisco, "Cisco and Partners to Build World's Largest Global Intercloud," 24 03 2014. [Online]. Available: http://newsroom.cisco.com/press-release-content?articleId=1373639.
[26] NetWorld, "Geographically dispersed data centers," 15 09 2009. [Online]. Available: http://www.networkworld.com/article/2237134/cisco-subnet/geographically-dispersed-data-centers.html.
[27] Intune Networks, "Distributed Switching Overview," [Online]. Available: http://www.intunenetworks.com/home/shape-up/shape-up_distributed-switch/.
[28] informationweek, "IBM Bets Big On Global Datacenter Network," 01 2014. [Online]. Available: http://www.informationweek.com/cloud/platform-as-a-service/ibm-bets-big-on-global-datacenter-network/d/d-id/1113478.
[29] [Online]. Available: http://www.webopedia.com/TERM/S/software_defined_data_center_SDDC.html.
[30] Eurostat, "Electricity prices by type of user," [Online]. Available: http://ec.europa.eu/eurostat/tgm/refreshTableAction.do?tab=table&plugin=1&pcode=ten00117&language=en.
[31] EnerData, "Electricity production," [Online]. Available: https://yearbook.enerdata.net/world-electricity-production-map-graph-and-data.html.
[32] I. Outlook, "Data Centre Energy Efficiency," 2014.
[33] c4lcolocation, [Online]. Available: http://www.datacentremap.com/.
34

TECHNICAL REPORT ICAR-CNR 2016-03, “Business Scenarios for Geographically Distributed Data Centers”
[34] Natural Resources Defense Council, "Environmental Issues," [Online]. Available: http://www.nrdc.org/energy/data-centre-efficiency-assessment.asp.
[35] JOINT RESEARCH CENTRE, "JRC Science Hub," [Online]. Available: http://ec.europa.eu/dgs/jrc/index.cfm?id=1410&dt_code=NWS&obj_id=15680&ori=RSS.
[36] CDP - Driving Sustainable Economies, "New study: Cloud computing can dramatically reduce energy costs and carbon emissions," 20 July 2011. [Online]. Available: https://www.cdp.net/en-US/WhatWeDo/CDPNewsArticlePages/cloud-compu.
[37] The Green Grid., "Water usage effectiveness (WUE): A green grid data center sustainability metric. Whitepaper," 2011. [Online]. Available: http://www.thegreengrid.org/.
[38] "Facebook data center dashboard," [Online]. Available: http://www.fbpuewue.com.
[39] Mohammad A. Islam, Shaolei Ren, Gang Quan and Muhamma, "Water-Constrained Geographic Load Balancing in Data Centers," IEEE Transactions on Cloud Computing, vol. PP, no. 99, p. 1, 2015.
[40] "eBay," [Online]. Available: http://dse.ebay.com..
[41] "AT&T Sustainability," [Online]. Available: http://www.att.com/gen/landing-pages?.
[42] "Data center industry survey,," Uptime Institute., 2013. [Online]. Available: http://uptimeinstitute.com/2013-survey-results.
[43] "Data centers move to cut water waste," [Online]. Available: http://www.datacenterknowledge.com/.
[44] "KSL. New Utah NSA center requires 1.7M gallons of water daily to operate," [Online]. Available: http://www.ksl.com/?sid=25978926.
[45] "Leadership in energy & environmental design," U.S. Green Building Council, [Online]. Available: http://www.usgbc.org/leed..
[46] "California drought," [Online]. Available: http://ca.gov/drought/.
[47] "Federal water efficiency requirements," [Online]. Available: http://www1.eere.energy.gov/femp/program/waterefficiency requirements.html..
[48] "Water usage effectiveness (WUE): A green griddata center sustainability metric,," in The Green Grid. Whitepaper, 2011.
[49] "How cooling towers work,," Environmental Defense Fund, [Online]. Available: http://business.edf.org/projects/attwater/how-cooling-towers-work..
[50] "Google’s Data Center Efficiency.," [Online]. Available: http://www.google.com/about/datacenters.
35

TECHNICAL REPORT ICAR-CNR 2016-03, “Business Scenarios for Geographically Distributed Data Centers”
[51] B. Guenter, N. Jain and C. Williams, "Managing cost, performance and reliability tradeoffs for energy-aware server provisioning," In IEEE Infocom, 2011.
[52] M. Lin, A. Wierman, L. L. H. Andrew and E. Ther, "Dynamic right-sizing for power-proportional data centers.," In IEEE Infocom, 2011.
[53] Z. Liu, M. Lin, A.Wierman, S. H. Low and L. L. An, "Greening geographical load balancing," SIGMETRICS, 2011.
[54] A. Qureshi, R. Weber, H. Balakrishnan and J. Guttag, "Cutting the electric bill for internet-scale systems," SIGCOMM, 2009.
[55] P. X. Gao, A. R. Curtis, B. Wong and S. Keshav, "It’s not easy being green," SIGCOMM Comput. Commun Rev., 42(4), p. 211–222, Aug. 2012.
[56] Carl A. Waldspurger, "Memory Resource Management in VMware ESX Server," in Proceeding of the fifth Symposium on Operating System Design and Implementation, Boston, Dec 2002.
[57] Eco4Cloud, Avoid Resource Contention with E4C_V4, 2016.
[58] VMware, "VMware vCloud Air," [Online]. Available: http://vcloud.vmware.com/.
[59] Eco4cloud srl, "Eco4cloud case study," 2015. [Online]. Available: http://www.eco4cloud.com/download/Telecom%20Italia%20Case%20Study.pdf.
36