business research methods 2
TRANSCRIPT

Chapter-7
Processing and Analysis of Data
Processing of Data
Processing: The Processing of data is an arrangement and management of data so that it is ready for analysis to fulfill the objectives of the research.
Processing Operations
There are four processing operations:(i) Editing: It is a process of examining the
collected raw data to detect errors and omissions and to correct these when possible.
(ii) Coding: It refers to the process of assigning numerical figures or other symbols to answer the responses of interviewee.

Processing Operations (cont.)
(iii) Classification: Most of the research studies result in a large volume of raw data. It must be reduced into homogeneous groups to get meaningful relationship. This fact necessitates of arranging data in groups of classes on the basis of common characteristics.
There are various classifications, such as:(a) One-way classification(b) Two-way classification(c) Three-way classification
and so on..
Processing Operations (cont.)
(iv) Tabulation: When a mass of data has been assembled, it becomes necessary for the researcher to arrange the same in some kind of concise and logical order. This procedure is referred to as tabulation. Thus, tabulation is the process of summarizing raw data and displaying the same in compact form for further analysis.
A table is complete one when the following information are available:(a) Title of the table(b) Sub-heading of the table(c) Entry in the table(d) Source of information
Statistical Analysis• Central Tendency & its Measures:
– Mean( AM, GM & HR)– Median – - Mode
• Dispersion and its Measures :– Range, – Mean deviation, – Standard Deviation,– Quartile deviation, – Coefficient of Variation.
• Skew ness and Kurtosis• Measures of Relationship
– Correlation– Simple Regression Analysis– Multiple Correlation and – Multiple Regression– Partial Correlation– Association in Case of Attributes

Statistical Analysis -cont• Probability :• Probability distribution
– Binomial distribution– Poisson distribution– Normal distribution
• Sampling Distribution– Z statistic– T statistic– X2 statistic– F statistic
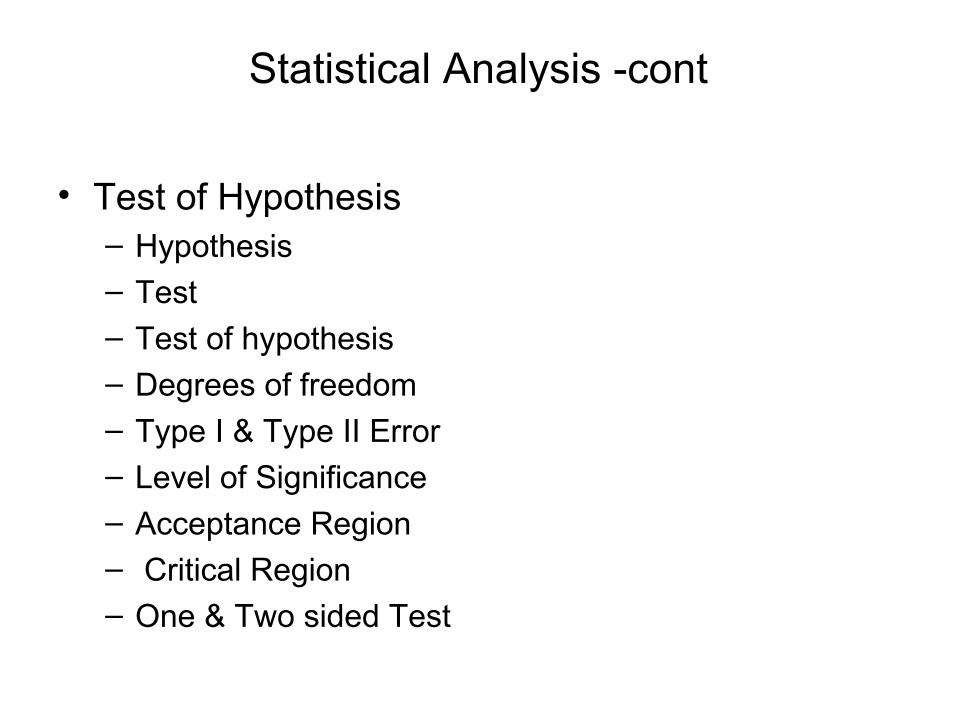
Statistical Analysis -cont
• Test of Hypothesis– Hypothesis– Test
– Test of hypothesis
– Degrees of freedom
– Type I & Type II Error– Level of Significance– Acceptance Region– Critical Region
– One & Two sided Test
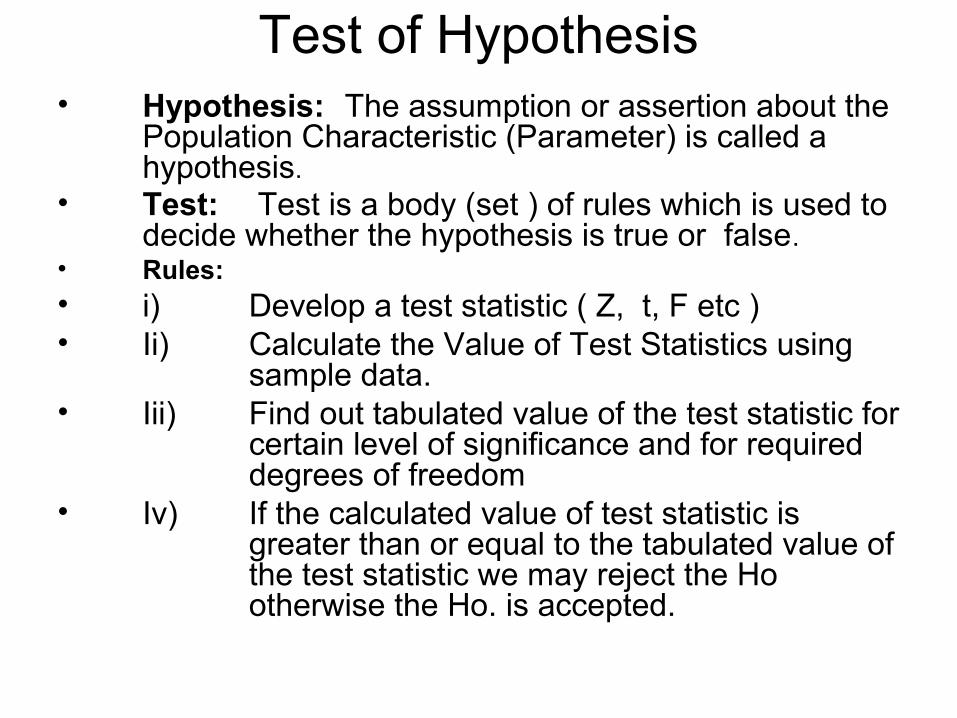
Test of Hypothesis• Hypothesis: The assumption or assertion about the
Population Characteristic (Parameter) is called a hypothesis.
• Test: Test is a body (set ) of rules which is used to decide whether the hypothesis is true or false.
• Rules: • i) Develop a test statistic ( Z, t, F etc )• Ii) Calculate the Value of Test Statistics using
sample data.• Iii) Find out tabulated value of the test statistic for
certain level of significance and for required degrees of freedom
• Iv) If the calculated value of test statistic is greater than or equal to the tabulated value of the test statistic we may reject the Ho otherwise the Ho. is accepted.

Level of Significance• Type-I error: Reject Ho: when it is true.• Type-II error: Accept Ho: when it is false.
• Level of significance : The probability of type- I error ie The probability of rejecting a Ho. when it is true
• Power of the Test: The probability of rejecting a Ho. when it is false.
• Degrees of freedom (df): It is the no. of independent variables involve in a relation ( test statistic).
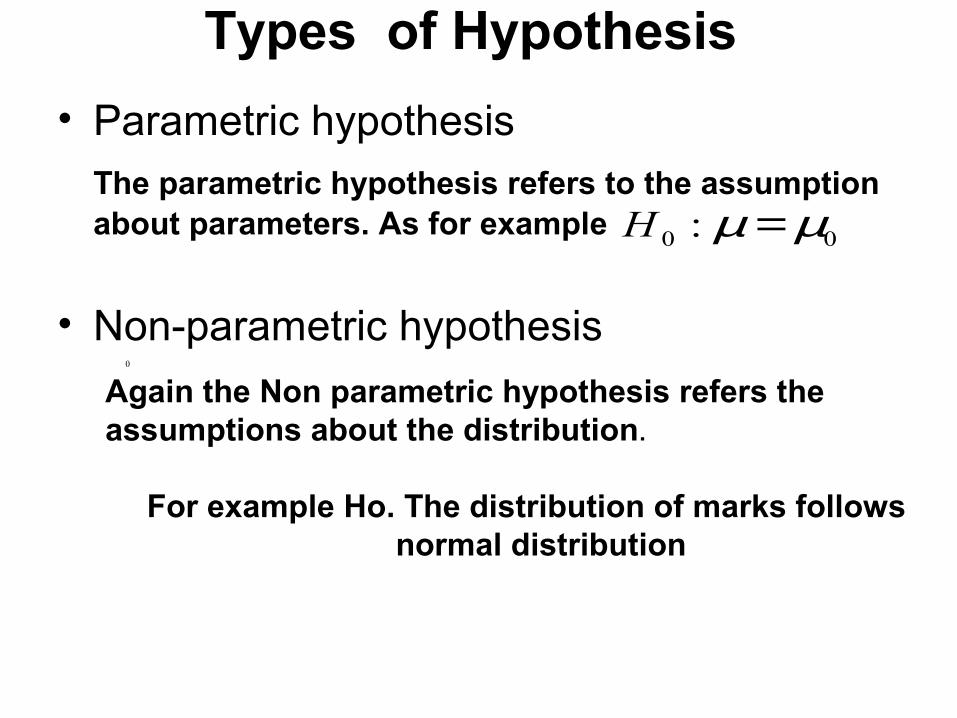
Types of Hypothesis
• Parametric hypothesis The parametric hypothesis refers to the assumption about parameters. As for example
• Non-parametric hypothesis
00 : µµ =H
Again the Non parametric hypothesis refers the assumptions about the distribution.
For example Ho. The distribution of marks follows normal distribution
0
2σ 2σ 2σ 2σ
2σ
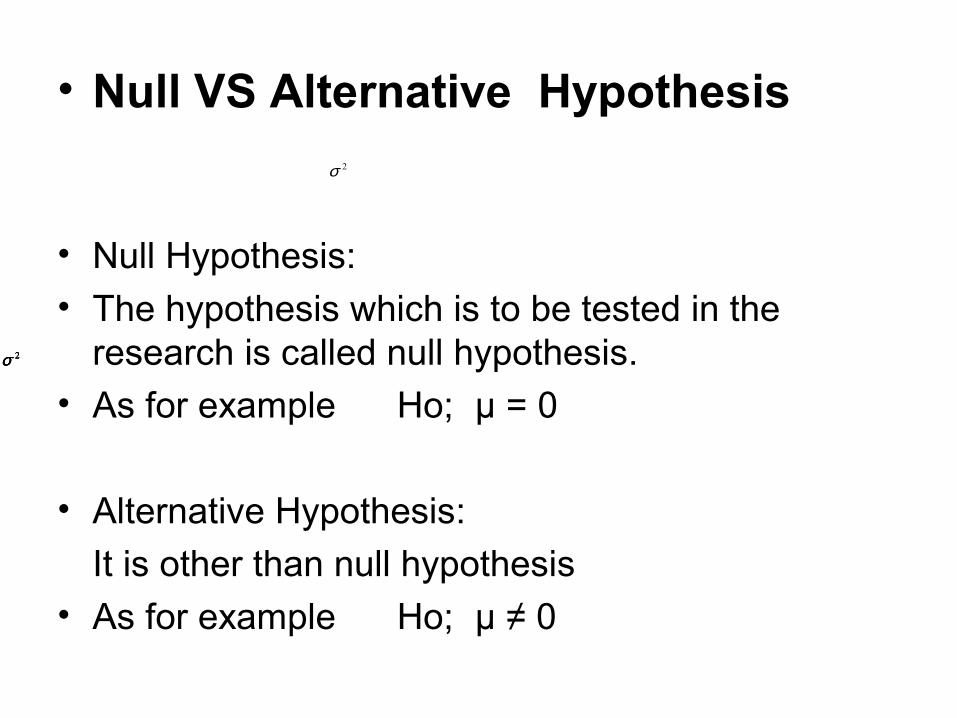
• Null VS Alternative Hypothesis
• Null Hypothesis:
• The hypothesis which is to be tested in the research is called null hypothesis.
• As for example Ho; µ = 0
• Alternative Hypothesis:
It is other than null hypothesis
• As for example Ho; µ ≠ 0
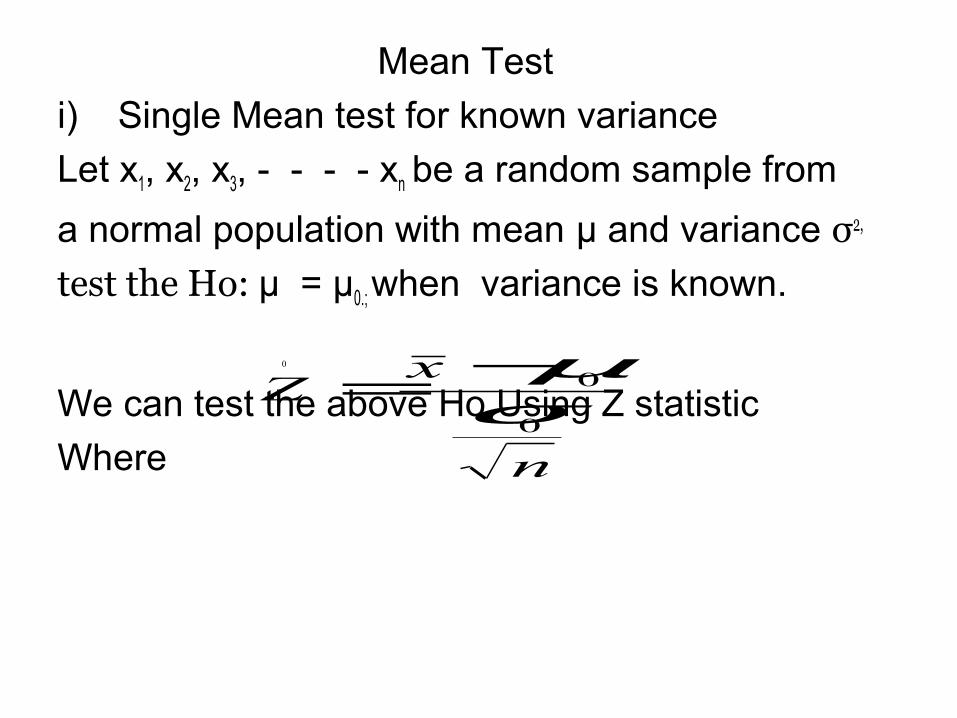
Mean Test
i) Single Mean test for known variance
Let x1, x2, x3, - - - - xn be a random sample from
a normal population with mean µ and variance σ2,
test the Ho: µ = µ0.; when variance is known.
We can test the above Ho Using Z statistic
Where
0
n
xZ
0
0σµ−
=
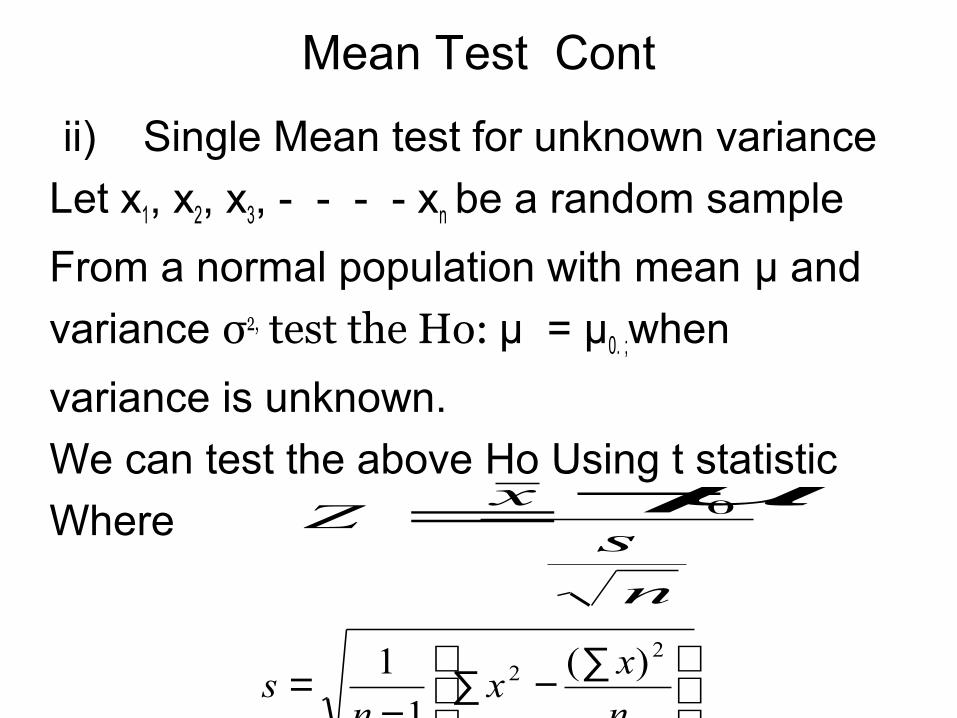
Mean Test Cont
ii) Single Mean test for unknown variance
Let x1, x2, x3, - - - - xn be a random sample
From a normal population with mean µ and
variance σ2, test the Ho: µ = µ0. ;when
variance is unknown.
We can test the above Ho Using t statistic
Where
n
sx
Z 0µ−=
∑−∑
−=
n
xx
ns
22 )(
1
1
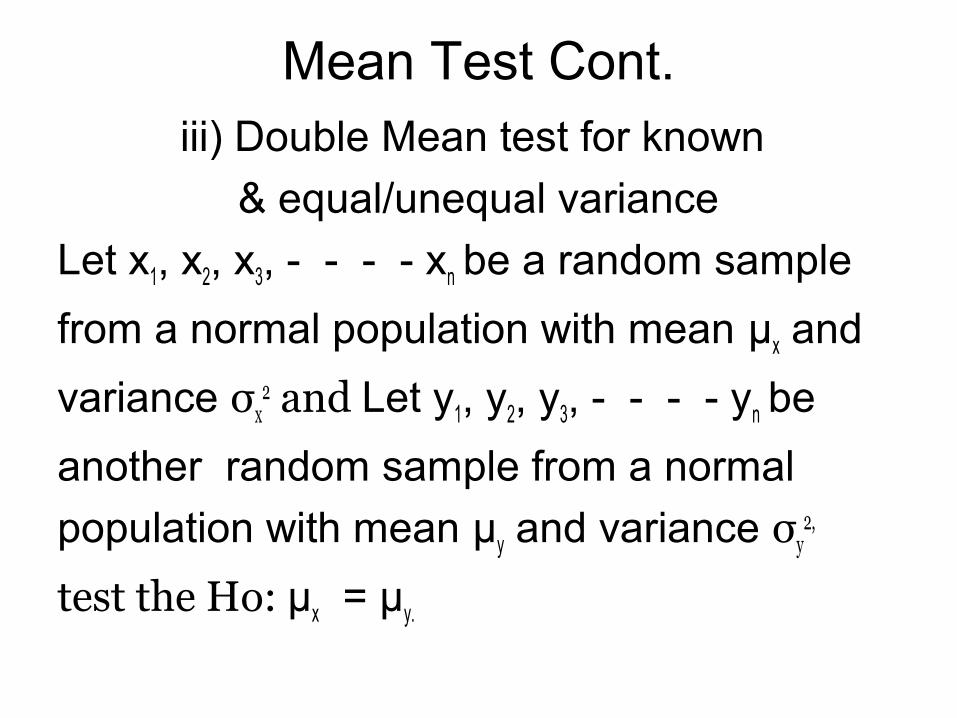
Mean Test Cont.iii) Double Mean test for known
& equal/unequal variance
Let x1, x2, x3, - - - - xn be a random sample
from a normal population with mean µx and
variance σx2 and Let y1, y2, y3, - - - - yn be
another random sample from a normal
population with mean µy and variance σy2,
test the Ho: µx = µy.
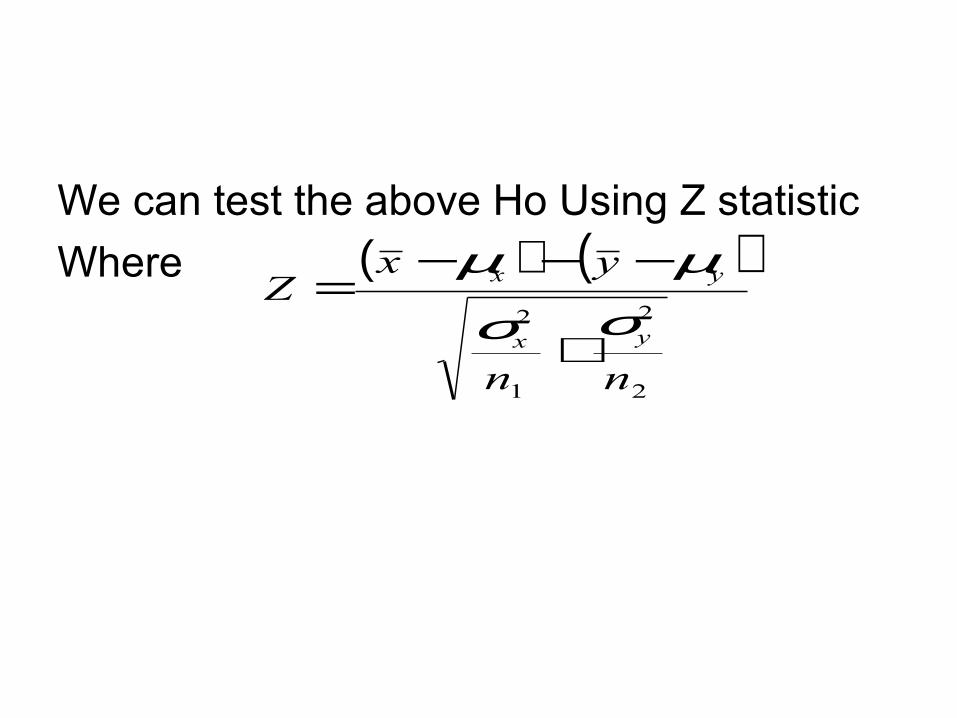
We can test the above Ho Using Z statistic
Where ( ) ( )
2
2
1
2
nn
yxZ
yx
yx
σσµµ
+
−−−=

Double Mean Test
iii) Double Mean test for unknown variance
Let x1, x2, x3, - - - - xn be a random sample
from a normal population with mean µx and
variance σx2 and Let y1, y2, y3, - - - - yn be
another random sample from a normal
population with mean µy and variance σy2,
test the Ho: µx = µy.

We can test the above Ho Using t- statistic
Where ( ) ( )
21
11.
nns
yxt yx
+
−−−=
µµ
∑−∑+
∑−∑
−+=
2
22
1
22
21
)()(
2
1
n
yy
n
xx
nns
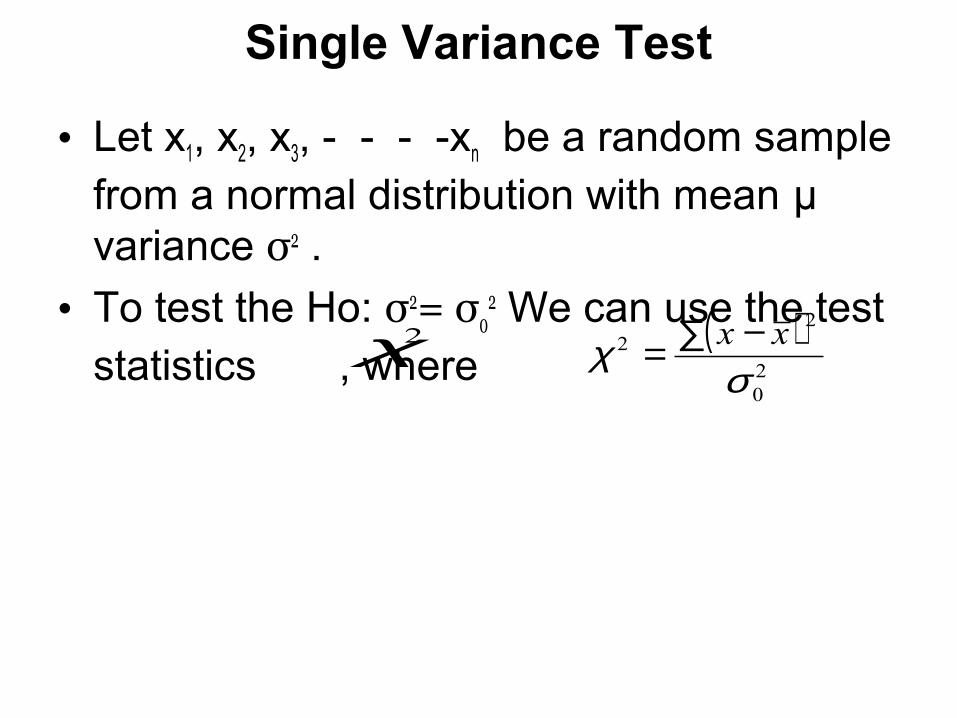
Single Variance Test
• Let x1, x2, x3, - - - -xn be a random sample from a normal distribution with mean µ variance σ2 .
• To test the Ho: σ2= σ02 We can use the test
statistics , where 2χ ( )
20
22
σχ xx −∑=
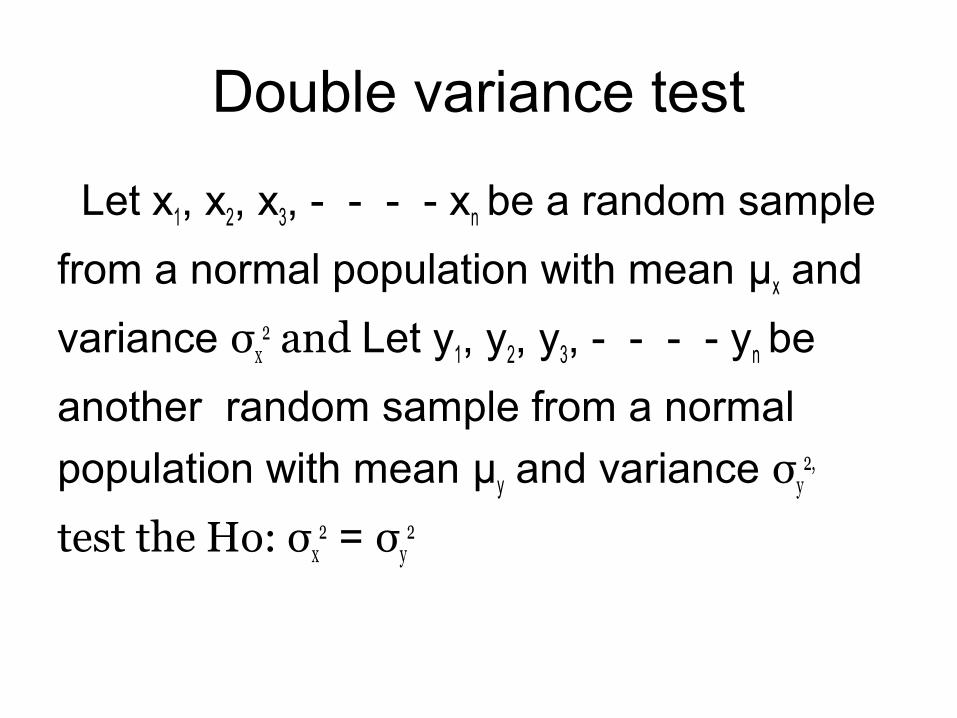
Double variance test
Let x1, x2, x3, - - - - xn be a random sample
from a normal population with mean µx and
variance σx2 and Let y1, y2, y3, - - - - yn be
another random sample from a normal
population with mean µy and variance σy2,
test the Ho: σx2 = σy
2

• We can test the above Ho; using F statistics, where
22
21
s
sF =
∑−∑
−=
∑−∑
−=
2
22
2
22
1
22
1
21
)(
1
1.
)(
1
1
n
yy
nsand
n
xx
ns

Test of Association
• Contingency Table: A two way classified data is called a contingency table if at least one of the variable is qualitative.
• The relation between two qualitative
variables( Attributes) is called association.
The association of attribute of a contingency table can be tested using χ2 statistics

• Where χ2 = ∑(O2/E) - N
• O: Observed frequency• E : Expected frequency• N : Total no. of observation.
• df of χ2 : (r-1)(c-1)
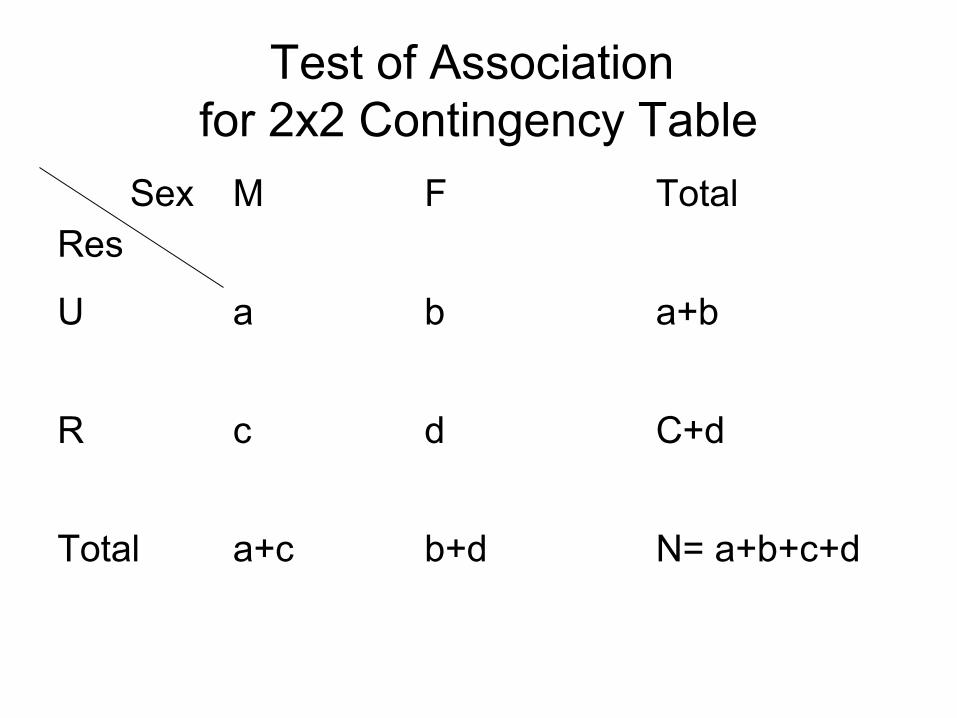
Test of Association for 2x2 Contingency Table
SexRes
M F Total
U a b a+b
R c d C+d
Total a+c b+d N= a+b+c+d
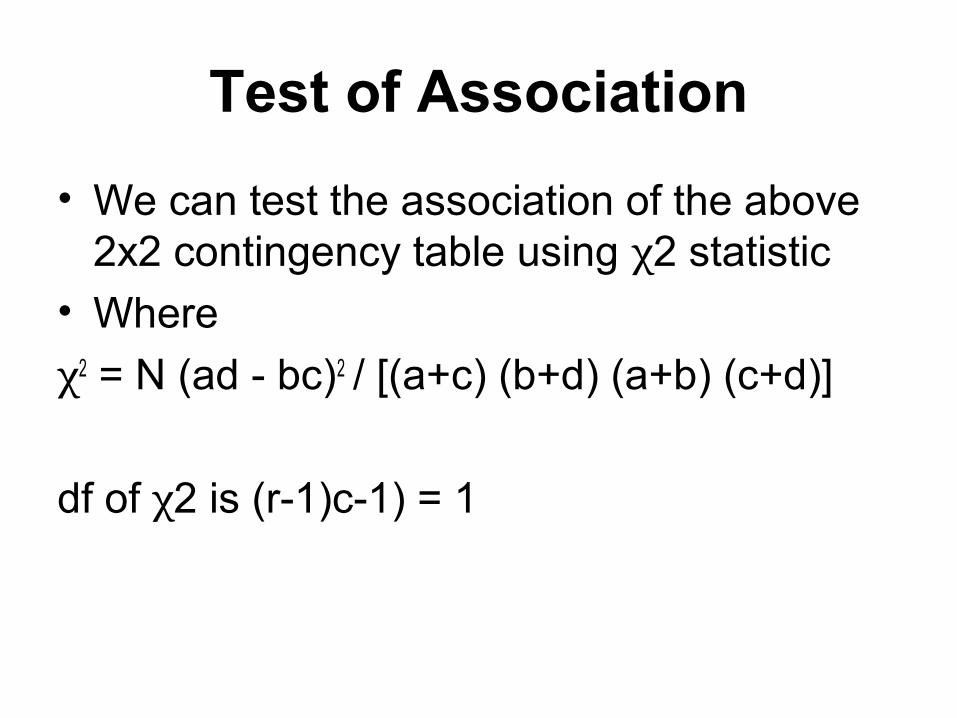
Test of Association
• We can test the association of the above 2x2 contingency table using χ2 statistic
• Where
χ2 = N (ad - bc)2 / [(a+c) (b+d) (a+b) (c+d)]
df of χ2 is (r-1)c-1) = 1